Embed Size (px)
Citation preview

THE UNIVERSITY OF HULL
Financial Development, Foreign Direct Investment and Economic Growth:
Challenges for Developing Countries
being a Dissertation submitted in partial fulfilment of the
requirements for the Degree of
Doctor of Philosophy
in the University of Hull
By
Babatunde, Abimbola Fatimah BSc(Ed) Economics, University of Ilorin, Nigeria
MSc Business Economics, Hull University, UK
December, 2011
i
ABSTRACT
Although the pattern of growth in developing countries is characterised by instability,
uncertainties and volatility, the experience of the five fast-growing developing
economies of Brazil, Russia, India, Mexico and China (BRIMCs) presents an
unprecedented challenge for other developing countries. Therefore, this thesis argues
that the emergence of the BRIMCs as the future growth engine of the world presents an
excellent backdrop to re-examine the importance of financial development and foreign
direct investment (FDI) in the Sub-Saharan African (SSA) context. It is important to
mention that for empirical studies, the methodologies used for estimations will differ for
different groups of countries. Hence, the study applies panel data techniques to take into
account the heterogeneity of these developing countries. It further uses dynamic panel
data framework and a panel co-integration analysis to capture the long-run relationships.
The measures employed assessed various aspects of financial development including;
private credit as a ratio of GDP, bank credit, liquid liabilities, stock market
capitalisation and value of stock traded, and a single measure of FDI being the annual
inflow of FDI as a ratio of GDP for 60 developing countries during 1980-2007. The
study also explores the interaction between economic openness and human capital
insofar as the attraction of FDI is concerned in the developing countries under
consideration.
The findings reveal that financial liberalisation and good institutions are important for
financial development. For the SSA countries, the results indicate that while financial
liberalisation promotes stock market development, the lack of good institutions, in
particular control of corruption, bureaucratic quality and rule of law are less favourable
to financial development. Furthermore, the study finds that economic openness and
human capital also play an important role in the attraction of FDI and the growth effect
of FDI in developing countries. The primary policy implication is that SSA countries
should make efforts towards initiating and implementing financial sector development
reforms and FDI incentives.

ii
DEDICATION
To God Almighty, who gave me the grace and mercy to embark upon and complete this
PhD.
To my dad, for financing and supporting me throughout my studies, my mum and
siblings, for their prayers and continuous support, and to A-Jay, without whom the last
few years of the research work would not have been easy.

iii
ACKNOWLEDGEMENTS
My utmost thanks go to the almighty God, for his promises in my life, continue to
unfold on a daily basis. Thank you for the grace, wisdom, strength and giving us the
means to undertake this project. When all hopes, strength and determination to carry on
with the research were drained and in troubled times, you carried me and gave me the
insight to realise your strength and presence in my life, when I needed you most.
I wish to extend my gratitude and thanks to Dr Raymond Swaray and Dr Steve Trotter
for their supervisory support, helpful comments and encouragement both during my
research and writing of this thesis. I am especially grateful to Dr Swaray for
encouraging me to send out my research work to conferences and possibly to journals
for publication. He believed that the feedback I would receive from reviewers would go
a long way to improving my research. I am grateful because I have been able to publish
my research results in two paper contributions to the proceedings of international
conferences. This is in addition to my being recognised and recommended for Best
Paper Award in the 21st annual Chinese Economic Association (CEA) conference, held
in July, 2010 at the University of Oxford, UK. I was overwhelmed with joy that the
results of my PhD thesis were recommended for such award. I owe this to God
Almighty.
I would also like to acknowledge Dr Jon Atkins and Professor Andrew Abbott for their
contributions to the initial stage of this research. I would like to thank Dr Keshab
Bhattarai for taking the time to help me with my econometric analysis problems.
I would like to thank and acknowledge the Postgraduate Secretary of the Business
School, Rebecca Conyers, for her ever ready, kind and positive attitude and for her help
in easing the already tough life of carrying out a Post Graduate research by providing
information and assistance, when needed. I wish to thank all my colleagues in the
Business and Graduate School, especially those who never ceased to listen to my rants
and complaints. Thank you for making this journey worthwhile.
I wish to extend my sincere thanks and appreciation to Nkem Airhihen, Pastor
Aleshinloye, the Mustaphas, Togbeolas and the Buttricks for their encouragement and
prayers, God bless you.

iv
I am forever indebted to my dad, Alhaji I. F. Babatunde, for giving me the opportunity
to progress to this stage. Without your patience, your love and, most of all, funding of
my studies, this would not have happened. I pray that God, in his infinite mercies, will
grant you a long life to reap the fruits of your labour.
A very deep, special thanks and appreciation must go to my mother Alhaja N. M.
Babatunde for her continuous support, encouragement and for her prayers which gave
me the strength and persistence to complete this study.
I am also indebted to my sisters; Ronnie, Bookie, Lola and PeeJay, and my brothers;
Ademola, Shola and Abiola, for their love, moral support, patience, encouragement and
concern for me, through all the years of the PhD. Thank you all for having faith in me
and I am glad we can all share in this success. I LOVE YOU ALL.
On a personal note, I would like to thank my husband, A-Jay, for his love, support,
understanding, patience and particularly for being ever ready to help arrange my data
for this study. I really appreciate your efforts and bless the Lord for giving you to me.
Finally, I would like to acknowledge the participants of the conferences I have attended,
for their contributions, as this has helped me accomplish this PhD, and also the authors
whose works formed the basis upon which I built my research ideas. God bless you all.

v
DECLARATION
Some parts of the work presented in this thesis have been published or submitted for
publication in the following articles:
Babatunde, A. (2010), Trade Openness, Infrastructure, FDI and Growth in Sub-Saharan
African countries. In: Proceedings of the 11th
Annual International Conference of
International Academy of African Business and Development (IAABD), May 18-23,
2010, University of Lagos, Nigeria.
Babatunde, A. and R. Swaray (2010), FDI and Economic Growth Redux: A comparison
of the effect of trade openness and human capital between BRIMCs and SSA countries.
In: Proceedings of the 21st Chinese Economic Association Conference, July 12-13,
2010, University of Oxford, UK.
Babatunde, A. (2011), “Trade Openness, Infrastructure, FDI and Growth in Sub-
Saharan African countries,” Journal of Management Policy and Practice, 12(7).
vi
TABLE OF CONTENTS
ABSTRACT i
DEDICATION ii
ACKNOWLEDGEMENTS iii
DECLARATION v
TABLE OF CONTENTS vi
LIST OF TABLES xi
LIST OF FIGURES xiii
ACRONYMS AND ABBREVIATIONS xv
1 Introduction and General Information 1
1.1 An ongoing debate about economic growth and development in developing
countries 1
1.2 Motivation of research: the experience of BRICs/BRIMCs countries 12
1.3 Objective of thesis 15
1.4 Research methodology 17
1.4.1 Panel Data Analysis 17
1.4.2 Data Quality and Characteristics 19
1.5 Contributions to the literature 20
1.6 Structure of the study 21
Appendix I 24
2 Can Sub-Saharan African Countries Learn from the BRIMCs Success? 26
2.1 Introduction and general background 27
2.2 The long-term economic growth experience in today’s largest developing
countries 37
2.2.1 Brazil 38
2.2.2 Russia 39
2.2.3 India 40
2.2.4 Mexico 41
2.2.5 China 42
2.3 Long-term economic growth experience in five of the fast growing SSA
countries 44
2.3.1 Seychelles 45
2.3.2 Gabon 46
2.3.3 South Africa 47

vii
2.3.4 Mauritius 48
2.3.5 Botswana 50
2.4 Sustainable economic growth scenarios in BRIMCs: implications for SSA
countries 51
2.4.1 The Millennium development goals and Economic growth in SSA
countries 54
2.4.2 Economic growth simulation 57
2.4.3 Simulating future growth paths of real GDP per capita 61
2.5 Conclusion 63
Appendix II 66
3 Financial Sector Development in Emerging and Frontier Markets: The Role of
Financial Liberalisation 69
3.1 Introduction 69
3.2 Financial sector development and liberalisation in emerging markets: An
overview 74
3.2.1 Financial sector development and liberalisation: Empirical analysis 77
3.2.2 The variation of financial sector development and liberalisation in
developing countries: Trends and pattern 79
3.3 Empirical framework and data 91
3.3.1 Data sources and issues 93
3.3.2 Economic Assumptions Underlying the Model and Testable
hypothesis 95
3.3.3 Measures of financial sector development 96
3.3.4 Measuring financial liberalisation 97
3.3.5 Other reforms, policies and control variables 100
3.3.6 Estimation techniques 100
3.4 Empirical results 102
3.4.1 Summary statistics 102
3.5 Banking development indicators 105
3.5.1 Liquid liabilities 105
3.5.2 Private credit 108
3.6 Stock market development indicators 108
3.6.1 Stock market capitalisation 108
3.6.2 Value of the stocks traded 109
3.7 Overall financial development indicators 111
3.7.1 Activity of the financial system 111
3.7.2 Size of the financial system 111
viii
3.8 Impact of financial liberalisation on financial development in sub-sample 111
3.8.1 Market classification sub-sample 112
3.8.2 Financial structure 119
3.9 Simultaneous opening of trade and financial sector 119
3.10 Robustness checks 123
3.10.1 Alternative measure 125
3.11 Conclusion and policy implications 128
Appendix III: Key liberalisation process of sample countries 130
Appendix III-I: Effects of financial liberalisation in emerging and frontier markets 135
4 Quality of institutions in Sub-Saharan African Countries: An Empirical
Examination of its Impact on Financial Development 138
4.1 Introduction 138
4.2 Explaining financial development 143
4.2.1 Financial development in Sub-Saharan Africa 147
4.2.2 Classifying the levels of financial development 156
4.3 Literature review 159
4.3.1 Theoretical framework 159
4.3.2 Empirical evidence on finance and growth in developing countries 166
4.4 Institutions and financial development in Sub-Saharan Africa 170
4.4.1 The role of institutional quality in financial development and
economic growth 185
4.4.2 Empirical evidence on institutions, financial development and growth 188
4.5 What drives financial development in Sub-Saharan Africa? 190
4.5.1 Econometric methodology, data and model specification 191
4.5.2 Data and preliminary testing 192
4.5.3 Control variables 198
4.5.4 Presentation of the model variables: Identification problems 199
4.5.5 Descriptive statistics and correlations: Preliminary findings 199
4.5.6 Economic Assumptions Underlying the Models and Testable
hypothesis 206
4.6 Regression analysis 207
4.6.1 Baseline regression 207
4.6.2 Effect of various dimensions of good governance on financial
development 209
4.6.3 Non-Linear effects of institutional quality on financial development 211
4.6.4 Finance-growth nexus: The role of institutions 213

ix
4.7 Sensitivity to alternative measures of financial development 214
4.8 Policy implication and conclusion 216
Appendix IV: Summary of countries used in regression 218
Appendix IV-I: Data Documentation, Definition and Sources 219
5 On the Determinant and impact of Foreign Direct Investment: Evidence from
Developing Countries 222
5.1 Introduction 222
5.2 Inflows of FDI to developing countries 228
5.3 Related literature on determinant of FDI 230
5.3.1 Determinants of FDI: Some Theoretical Considerations 230
5.3.2 Previous Empirical Studies on FDI Determinants 234
5.3.3 The Impact of FDI on Host Country’s Economy: The role of Trade
Openness and Human Capital 235
5.4 Model and data description 238
5.4.1 Data 242
5.4.2 Economic Assumptions Underlying the Models and Testable
hypothesis 244
5.4.3 Empirical Strategy 249
5.5 Empirical results and interpretation 250
5.5.1 Basic statistics 250
5.5.2 Determinants of FDI: empirical results 251
5.5.3 Impact of FDI on economic growth: empirical results 259
5.5.4 Sensitivity Analysis 267
5.6 Conclusions 269
Appendix V 272
Appendix V: IV 274
6 The link between Foreign Direct Investment, Financial Development and
Economic Growth: A Panel Co-Integration approach 276
6.1 Introduction 276
6.2 Stylised facts on FDI, financial development and economic growth: brief
descriptive analysis 279
6.3 Review of pertinent literature 287
6.3.1 Relationship between FDI and economic growth: Empirical literature 290
6.3.2 Previous empirical studies on FDI, financial development and
economic growth literature in developing countries 292
6.4 The Model, Data and econometric technique 294
6.4.1 Data 294

x
6.4.2 Econometric technique 295
6.5 Results and discussions 297
6.5.1 Panel unit root tests results 297
6.5.2 Panel co-integration tests results 301
6.6 Panel Causality test 304
6.7 Conclusion 307
Appendix VI: Countries used in sample 308
Appendix VI. I: Panel unit root and panel co-integration tests procedures 309
7 Conclusion and Policy Recommendations 317
7.1 General summary findings 318
7.2 Contributions to the literature 322
7.3 Policy implication 323
BIBLIOGRAPHY 325
xi
LIST OF TABLES
Table 1-1: Rich and poor country GDP per capita (PPP), 1980 ....................................................6
Table 1-2 : Average per capita income growth in sample countries, 1970-2007 ...........................6
Table 1-3: Average annual growth in GDP and GDP per capita by region and sub-period, 1980-
2007 ............................................................................................................................................ 10
Table 1-4: List of countries and data .......................................................................................... 24
Table 1-5: Low income countries ............................................................................................... 24
Table 1-6: Lower middle income countries ................................................................................ 25
Table 1-7: Upper middle income countries ................................................................................. 25
Table 2-1: Sector composition of GDP ....................................................................................... 28
Table 2-2: Evolution of FDI inflows to the BRIMCs, 1980-2007 (in billions of US $) ............. 30
Table 2-3: Evolution of FDI inflows to the SSA, 1980-2007 (in billions of US $) .................... 30
Table 2-4: Economic performance in developing regions, 1970-2007 ....................................... 31
Table 2-5: Economic growth in fast growing emerging economies of the BRIMCs and SSA ... 34
Table 2-6: Key economic indicators ........................................................................................... 35
Table 2-7: International trade and investment ............................................................................ 35
Table 2-8: Socio-economic indicators ........................................................................................ 37
Table 2-9: Comparison of real GDP per capita growth in SSA and BRIMCs, 1980-2007......... 58
Table 2-10: Comparison of real GDP for SSA and BRIMCs, 1980-2007 .................................. 59
Table 2-11: List of countries ....................................................................................................... 66
Table 2-12: Target to reach the Millennium Development Goals, average real GDP growth .... 66
Table 2-13: Economic performance in the world and other developing countries between 1980
and 2007 ...................................................................................................................................... 67
Table 3-1: Banks, Stock Markets and Capital accumulation pre- and post- financial reforms,
1980-2007 ................................................................................................................................... 80
Table 3-2: Summary of data set used ........................................................................................ 103
Table 3-3: Impact of financial liberalisation on financial development in developing countries
(Annual data 1980-2007) .......................................................................................................... 107
Table 3-4: Impact of financial liberalisation in emerging markets (Annual data 1980-2007) .. 113
Table 3-5: Impact of financial liberalisation in frontier markets (Annual data 1980-2007) ..... 117
Table 3-6: Does the simultaneous opening of trade and financial sector lead to financial
development? (Annual data 1980-2007) ................................................................................... 120
Table 3-7: Impact of financial liberalisation on financial development in developing countries:
Annual data 1980-2007 ............................................................................................................. 125
Table 3-8: Impact of financial liberalisation on financial development in developing countries:
Annual data 1980-2007, panel corrected standard error estimation.......................................... 127
Table 3-9: Stock market development as of 2007 ..................................................................... 135
Table 3-10: Official liberalisation dates .................................................................................... 135
Table 3-11: Start dates of moves towards the financial liberalisation process ......................... 136
Table 3-12: Description and data source ................................................................................... 137
Table 4-1: Developing regions: Comparison of private credit ratio to GDP, 2003-2007 ......... 140
Table 4-2: Level of financial development in SSA countries ................................................... 157
Table 4-3: Financial development: Country groupings ............................................................ 158
Table 4-4: Changes in level of financial development in SSA countries.................................. 159
Table 4-5: Average governance indicators in SSA region, 1996-2007..................................... 173
xii
Table 4-6: Changes in the level of institutional development in SSA, 1996 and 2007 ............ 175
Table 4-7: Changes in institutional development from 1996-2007........................................... 176
Table 4-8: Level of financial and institutional development: Country classification ............... 179
Table 4-9: Basic statistics (Annual data: 1980-2007) ............................................................... 194
Table 4-10: Basic statistics (Annual data: 1980-2007) ............................................................. 201
Table 4-11: Pair-wise correlation matrix .................................................................................. 205
Table 4-12: Impact of institutional development on financial development: Dependent variable:
Private credit ............................................................................................................................. 208
Table 4-13: Effect of various facets of institutions on financial development ......................... 210
Table 4-14: Non-linear relationship between institutional development and financial
development .............................................................................................................................. 212
Table 4-15: Finance-growth nexus role of institutions ............................................................. 214
Table 4-16: Robustness test using KKM as independent variable ............................................ 215
Table 4-17: Impact of institutional quality on financial development (four year average) ...... 216
Table 4-18: List of countries in dataset ..................................................................................... 218
Table 4-19: Income group dummy............................................................................................ 218
Table 5-5: Descriptive statistics and correlation matrix for the period 1980 - 2007................. 251
Table 5-6: Determinants of FDI in developing countries ......................................................... 252
Table 5-7: Determinants of FDI in developing countries ......................................................... 254
Table 5-8: Determinant of FDI by Region, 1980-2007............................................................. 255
Table 5-9: Determinant of FDI by income group, 1980-2007 .................................................. 258
Table 5-10: Impact of FDI on economic growth: Descriptive statistics ................................... 260
Table 5-11: Impact of FDI on economic growth ...................................................................... 261
Table 5-12: FDI’s impact on economic growth ........................................................................ 263
Table 5-13: FDI’s impact on regional economic growth .......................................................... 264
Table 5-14: FDI’s impact on different level of economic growth ............................................ 266
Table 5-15: Determinant of FDI, Sensitivity analysis .............................................................. 268
Table 5-16: Impact of FDI on Economic growth: Sensitivity analysis ..................................... 269
Table 5-1: Variables, definition and source .............................................................................. 272
Table 5-2: List of countries in sample ...................................................................................... 273
Table 5-3: Countries by geographic region ............................................................................... 273
Table 5-4: Countries by income group ..................................................................................... 273
Table 6-1: Global foreign direct investment inflows (in billions of US $) during 1980-2007 . 280
Table 6-2: Comparative inward FDI (percent of GDP) during 1980-2007 ............................... 280
Table 6-3: Trends in financial development in sample countries, 1980-2007 .......................... 285
Table 6-4: Trends in economic growth in developing countries, 1980-2007 ........................... 287
Table 6-7: Panel unit roots tests results by regions (levels) ...................................................... 299
Table 6-8: Panel unit roots tests results by regions (first difference)........................................ 300
Table 6-9: Panel Co-integration tests between FDI, BC and Real gPCAP ............................... 302
Table 6-10: Panel Co-integration tests between Real gPCAP, FDI and DMBAGDP .............. 303
Table 6-11: Panel Co-integration tests between Real gPCAP, FDI and PC ............................. 303
Table 6-10: List of countries in sample .................................................................................... 308
Table 6-11: Countries by geographical classification and economic group ............................. 308
xiii
LIST OF FIGURES
Figure 1-1: Developed versus developing countries real 2005 GDP per capita since 1980 ..........3
Figure 1-2: Global real GDP since 1970 ........................................................................................4
Figure 1-3: Global real GDP growth since 1970 ...........................................................................4
Figure 1-4: World GDP growth since 1970 ...................................................................................7
Figure 1-5: World GDP per capita growth since 1970 ..................................................................7
Figure 1-6: Real 2005 GDP growth rates since 1980 ....................................................................8
Figure 1-7: Real 2005 GDP growth rate by region since 1980 ......................................................8
Figure 1-8: SSA income group GDP per capita growth in 1980 ................................................ 11
Figure 2-1: Trend in FDI inflows to developing economies, 1980-2007.................................... 29
Figure 2-2: Divergence in performance between BRIMC and SSA, 1980-2007 ........................ 32
Figure 2-3: Economic performance, Brazil, Russia, India, Mexico and China, 1980-2007 (GDP
per capita, constant 2005 US $) .................................................................................................. 32
Figure 2-4: Economic performance, Brazil, Russia, India, Mexico and China, 1980-2007 (GDP
per capita, constant 2005 US $) .................................................................................................. 33
Figure 2-5: Average annual growth of real GDP in SSA countries, 2000-2007 ......................... 55
Figure 2-6: Average annual growth of real GDP per capita in SSA countries, 2000-2007 ........ 56
Figure 2-7: Growth pattern for GDP per capita, 2007-2050 ....................................................... 62
Figure 2-8: Growth pattern of GDP per capita, 2007-2050 ........................................................ 62
Figure 2-9: Growth patterns of GDP per capita, 2007 to 2050 ................................................... 63
Figure 3-1: Stock market development by market capitalisation ................................................ 83
Figure 3-2: Stock market development by income group ........................................................... 84
Figure 3-3: Banking sector development by market classification ............................................. 85
Figure 3-4: Banking sector development by income group classification .................................. 86
Figure 3-5: Development of Capital account openness, 1980-2007 ........................................... 87
Figure 3-6: Capital account openness in developing countries, full sample ............................... 87
Figure 3-7: Capital account openness by regional classification ................................................ 88
Figure 3-8: Capital account openness by market classification .................................................. 89
Figure 3-9: Overall financial development and trade for emerging countries ............................ 90
Figure 3-10: Overall financial development and trade for frontier countries ............................. 91
Figure 4-1: Sub-Saharan Africa and other developing regions: Evolution of private credit,
1980-07 ..................................................................................................................................... 149
Figure 4-2: Financial development in SSA and other developing countries: decadal analysis 150
Figure 4-3: Sub-Saharan Africa: Average liquid liabilities, private credit and bank deposits,
1980-07 ..................................................................................................................................... 153
Figure 4-4: Average financial development (ratio of private credit to GDP) in SSA region,
1980-07 ..................................................................................................................................... 154
Figure 4-5: Changes in governance indicators in SSA between 1996 and 2007 ...................... 174
Figure 4-6: Relationship between institutional development and financial development in SSA
region, 1996 .............................................................................................................................. 178
Figure 4-7: Relationship between institutional development and financial development in SSA
region, 2007 .............................................................................................................................. 178
Figure 4-8: Relationship between financial development and institutional development in SSA
region, 1980-07 ......................................................................................................................... 180
Figure 4-9: Financial development across legal origin in SSA countries, 1980-2007 .............. 182

xiv
Figure 5-1: Trends in FDI inflows to world and other developing region, 1980-2007 ............. 229
Figure 5-2: Regional Exports of goods and services as a percent of GDP, 1980-2007 ............ 230
Figure 6-1: Trend in FDI inflows, 1980-2007 .......................................................................... 281
Figure 6-2: FDI inflows by region, 1980-2007 ......................................................................... 282
Figure 6-3: Inflow of FDI in developing regions, 1980-2007 .................................................. 283
Figure 6-4: Regional distribution of FDI inflows to developing countries (1980-2007) .......... 284
Figure 6-5: Trends of private credit and annual growth of GDP in Latin America, (1980-2007)
.................................................................................................................................................. 285

xv
ACRONYMS AND ABBREVIATIONS
AC African countries
AREAER
Annual report on exchange arrangements and exchange
restrictions
ASEAN Association of southeast Asian nations
BHL Bakaert, Harvey and Lundjall
BSB Botswana savings bank
CEEC Central and Eastern Eurobarometer countries
CIS Commonwealth of Independent States
EAP East Asia and the Pacific
ECF External capital flow
ECOWAS Economic community of West African states
EPZs Export processing zones
EU European union
EU/RSA EU South Africa
FD Financial development
FDI Foreign direct investment
FE Fixed effects
FINDEX Financial index
FINDEX Financial index
FINLIB Financial liberalisation
FINLIB Financial liberalisation
FL Financial liberalisation
FTSE Financial times stock exchange
GATT General agreement on tariffs and trade
GCC Gulf co-operation council
GMM Generalised Methods of Moments
HDI Human development indicator
ICRG_QOG International country risk guide quality of government
IFC International financial corporation
IMF International monetary fund
INF Inflation
INS Institutions
IPSHIN Im, Pesaran and Shin
ISI Import substitution industrialisation
JSE Johannesburg Stock Exchange
KAOPEN Capital account openness
KKM Kauffman, Kraay and Mastruzzi
LAC Latin America and the Caribbean
LIBDATE Liberalisation date
M3 Liquid liabilities
MCAP Stock market capitalisation
MDG Millennium development goals
MENA Middle East and North Africa

xvi
MSCI Morgan Stanley Capital International
NBFI nonbank financial institutions
ODA Official development assistance
OECD Organisation for economic co-operation and development
OFDA Overall financial development activity
OFDS Overall financial development size
OLS Ordinary Least Squares
OPENK Openness in constant
PC Private credit
PPPs Purchasing power parity
R&D Research and Development
RE Random effects
RZ Ragan and Zingales
SACU Southern African customs union
SADC Southern African development community
SAP Structural adjustment programme
SIBA Seychelles international business authority
SITZ Seychelles international trade zone
SOB State owned banks
SSA Sub-Saharan Africa
TINDEX Trade index
TINDEX Trade index
TLIB Trade liberalisation
TNC Trans-national companies
TVALUE Value of traded stocks
UAE United Arab Emirate
UK United Kingdom
UNDP United nations development programme
US United States
USDA/ERS
United States Department of Agriculture, Economic Research
Service
WTO World trade organisation
ZPA Zambian privatisation agency
1
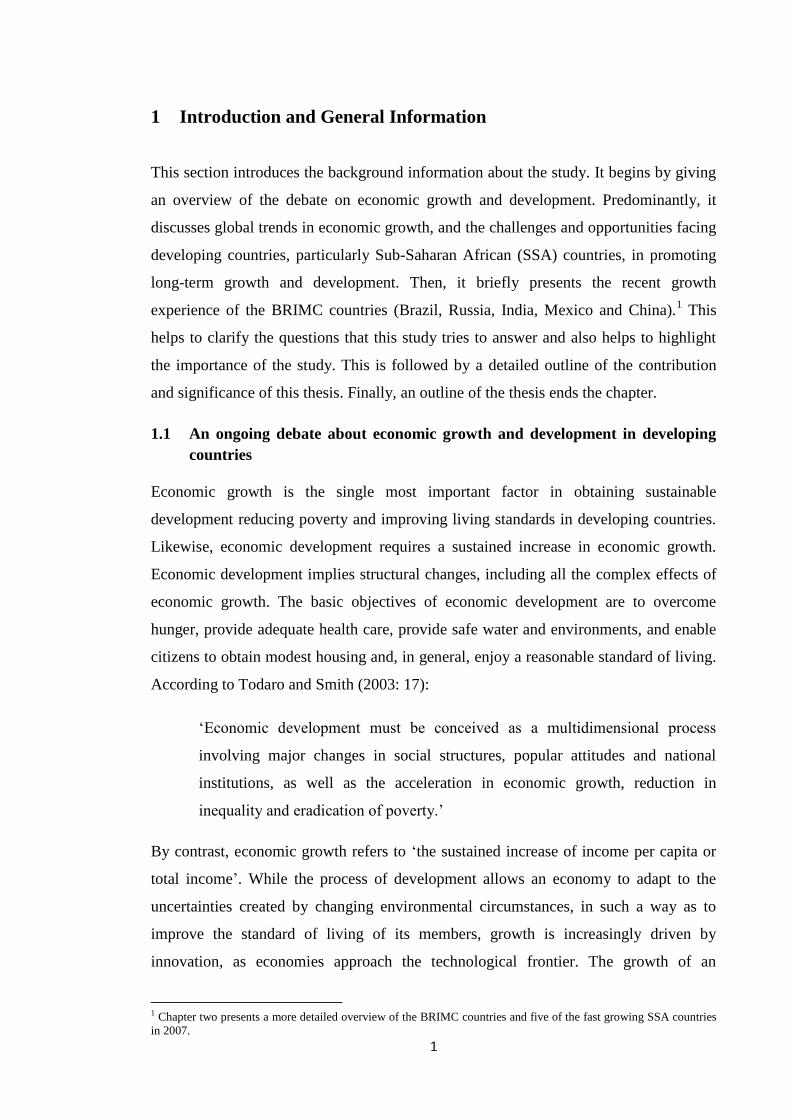
1 Introduction and General Information
This section introduces the background information about the study. It begins by giving
an overview of the debate on economic growth and development. Predominantly, it
discusses global trends in economic growth, and the challenges and opportunities facing
developing countries, particularly Sub-Saharan African (SSA) countries, in promoting
long-term growth and development. Then, it briefly presents the recent growth
experience of the BRIMC countries (Brazil, Russia, India, Mexico and China).1 This
helps to clarify the questions that this study tries to answer and also helps to highlight
the importance of the study. This is followed by a detailed outline of the contribution
and significance of this thesis. Finally, an outline of the thesis ends the chapter.
1.1 An ongoing debate about economic growth and development in developing
countries
Economic growth is the single most important factor in obtaining sustainable
development reducing poverty and improving living standards in developing countries.
Likewise, economic development requires a sustained increase in economic growth.
Economic development implies structural changes, including all the complex effects of
economic growth. The basic objectives of economic development are to overcome
hunger, provide adequate health care, provide safe water and environments, and enable
citizens to obtain modest housing and, in general, enjoy a reasonable standard of living.
According to Todaro and Smith (2003: 17):
‘Economic development must be conceived as a multidimensional process
involving major changes in social structures, popular attitudes and national
institutions, as well as the acceleration in economic growth, reduction in
inequality and eradication of poverty.’
By contrast, economic growth refers to ‘the sustained increase of income per capita or
total income’. While the process of development allows an economy to adapt to the
uncertainties created by changing environmental circumstances, in such a way as to
improve the standard of living of its members, growth is increasingly driven by
innovation, as economies approach the technological frontier. The growth of an
1 Chapter two presents a more detailed overview of the BRIMC countries and five of the fast growing SSA countries
in 2007.

2
economy can be followed by a period of long stagnation or even downturns. Hence,
sustainable development is not only a result of high or positive growth rates, but also of
the stability of that growth.
One of the main concerns in Economics is to answer questions about the sources of
differences in wealth across nations, starting from the classical growth period pioneered
by Adam Smith in his Wealth of Nations (1776). Smith (1776) proposed that the wealth
of a nation consisted of both farm output and manufactured goods along with the labour
it took to produce them. He argued that for an economy to increase its wealth there is a
need to expand its economic production. That is, to encourage the division of labour. He
further argued that laissez-faire (free market) was important to attain sustainable growth
in an economy. In such environment, it is assumed that all decisions about resource
allocation are made free of government intervention. However, Smith (1776) believed
that the state should enforce contracts and grant patents and copyrights to encourage
inventions and new ideas. He also recommended that the state provide public works
such as roads, bridges and defence—all things that, he assumed, would not be
worthwhile for individuals to provide. However, he wanted the users of such public
works to pay in proportion to their use (see The Wealth of Nations, Book V).
Although the free market theory has been challenged by many Marxists economists and
others, Smiths theory provided useful insights into the process of economic growth and
provided a framework for the study of economic growth. Despite the fact that
theoretical and empirical literature on economic growth has grown rapidly, there are
still a lot of concerns about the sources of differences in income levels across countries,
or over time within the same country.
After the beginning of the industrial revolution in England in the late 18th
and early 19th
centuries, there were a series of changes in agriculture, manufacturing and technology
that led to a shift from hand-made to machine-made products. This had a profound
effect on both the socio-economic and cultural conditions in the United Kingdom (UK).
This effect later spread to the Western European and New World economies, and
eventually the developing world, resulting in the widening of the global income
distribution for over two hundred years and as a result, at the end of the 20th
century,
huge gaps still exist between the income of the world’s rich and poor countries (Figure
1-1).

3
After the Second World War, some developing countries experienced unprecedented
rates of economic growth and succeeded in catching up with the already industrialised
countries. However, following a series of economic crises which led to the 1970s
recession (the 1973 oil crisis and the 1973-1974 stock market crash), many
industrialised countries, with the exception of Japan, witnessed poor economic growth
rates. Figure 1-2 and 1-3 shows how different groups of countries and regions have
contributed to the world’s economic growth since 1970. It shows that the United States
(US), European Union (EU), United Kingdom (UK), East Asia and Japan account for
over half of the worlds GDP, but this proportion has been declining as a result of
accelerated growth in the BRIMC countries, in particular, China.
Figure 1.1: Developed versus developing countries real 2005 GDP per capita since 1980
Source: USDA (2010), Economic Research Service, International Macroeconomic Data Set.
Developed
Developing
0
5000
10000
15000
20000
25000
30000
35000
40000
19801982198419861988199019921994199619982000200220042006
US$
bill
ion
s

4
Figure 1.2: Global real GDP since 1970
Figure 1.3: Global real GDP growth since 1970
Source: USDA (2010), Economic Research Service, International Macroeconomic Data Set.
Note: BRIMC refers to 5 largest developing economies and comprises Brazil, Russia, India, Mexico and China. The
EU 9 captures the member states of the European Union consisting of Germany, France, Italy, Netherlands, Belgium,
Luxembourg, Denmark, Ireland and the United Kingdom.
In terms of GDP growth (Figure 1-3), the period 1980-2007 was a time of uneven
development among countries of the world. A closer look at the top five world’s richest
and poorest countries in 1980 (see Table 1-1 below) indicates that the average persons
income level in Burundi (the poorest country in the world in 1980) was approximately
200 times lower than the average persons income level in the United Arab Emirates
(UAE), the richest country in the world. Although the level of income in Burundi and
UAE had declined drastically by 2007 (Table 1-1), the average income in Burundi was
still approximately 120 times less than UAE.
0.0
10.0
20.0
30.0
40.0
50.0
60.0
1970 1980 1990 2000 2007
Re
al G
DP
, U
S$ (
trill
ion
)
BRIMC China East Asia EU 9 Japan UK USA
-10.0
0.0
10.0
20.0
30.0
40.0
50.0
60.0
1970 1980 1990 2000 2007
Re
al G
DP
gro
wth
(p
erc
en
t)
BRIMC China East Asia EU9 Japan UK USA
5
Barro and Sala-i-Martin, (2004) suggests that this huge difference is a reflection that
some economies are growing rapidly and have managed to sustain high growth rates for
a long period of time, while others are not growing at all. If I look at how these
countries, on average, fared during these twenty-seven years, I observe that GDP per
capita for four out of the ten countries decreased, with negative growth rates (Table 1-
1). In fact, according to the table, many of these decreasing countries belonged to Panel
A, the rich countries. However, Kuwait and Switzerland maintained a moderate
economic growth.2 In Panel B, I find that China grew on an average of 8.9 percent per
year. This modest growth has brought China, and other East Asian countries, up more
than ten times in per capita income in a short time span, with significant improvements
in the health of the population and industrial sector (Sala-i-Martin, 2006). In order to
catch up with industrialised countries, some developing countries, such as China and
India, started to grow at higher rates. Indeed, small differences in a countries economic
growth (positive or negative) matter a great deal in the long-term, as it can yield a huge
difference in people’s standard of living.
To illustrate the importance of sustaining high economic growth and its role in
explaining the huge differences in income across countries, Barro and Sala-i-Martin
(2004) cite the increase in per capita GDP in the United States from $3340 in 1870 to
$33,330 in 2000, as an example. They note that the economy grew at an annual average
of 1.8 percent, representing a ten-fold increase in income. According to the authors, the
ability to sustain such a growth rate, over a long period of time, made the US the second
richest country in the world in 2000, after Luxemburg.
2 According to World Bank (2011), Kuwait and Burundi were the only countries, in our list, that still ranked among
the top five rich and poor countries in 2007.

6
Table 1-1: Rich and poor country GDP per capita (PPP), 1980
Panel A GDP per capita (PPP)
Top five rich countries 1980a 2007b % per annum (growth)
United Arab Emirates 95,337.64 42,742.05 -2.97
Brunei Darussalam 80,588.02 48,054.18 -1.90
Kuwaitc 39,982.68 49,541.51 0.80
Saudi Arabia 33,902.94 20,242.88 -1.89
Switzerland 28,536.11 37,854.35 1.05
Panel B: Top five poor countries
Burundic 430.48 354.65 -0.72
Mozambique 439.52 743.37 1.97
China 523.95 5,238.68 8.90
Nepal 566.52 980.30 2.05
Burkina Faso 622.48 1037.61 1.91
Note: a and b indicates that data available for 132 and 182 countries, respectively, out of the 216 listed. c indicates
countries ranked amongst top five rich and poor in 2007.
Source: World Bank (2011): World Development Indicators, (edn: September 2011). ESDS International, University
of Manchester.
In Table 1-2 below, I provide a summary statistics for the average annual rate of growth
of real per capita GDP in the 60 countries which constitute our basic sample, over the
period 1980-07. For comparison, summary statistics for 1970-80 are also shown. A
comparison of the two periods shows that world economic growth appears to have
slowed down. The mean rate of growth in per capita GDP was approximately 1.35
percent per annum during 1980-07, quite a bit lower than the mean rate of 2.15 percent
for 1970-80.
Table 1-2 : Average per capita income growth in sample countries, 1970-2007
1970-80 1980-07
Mean 2.15 1.35
St Dev 2.44 1.82
Min -3.40 -2.31
Max 10.73 8.72
N 60 60
Source: Author’s calculations from USDA (2010), Economic Research Service, International Macroeconomic
Data Set.
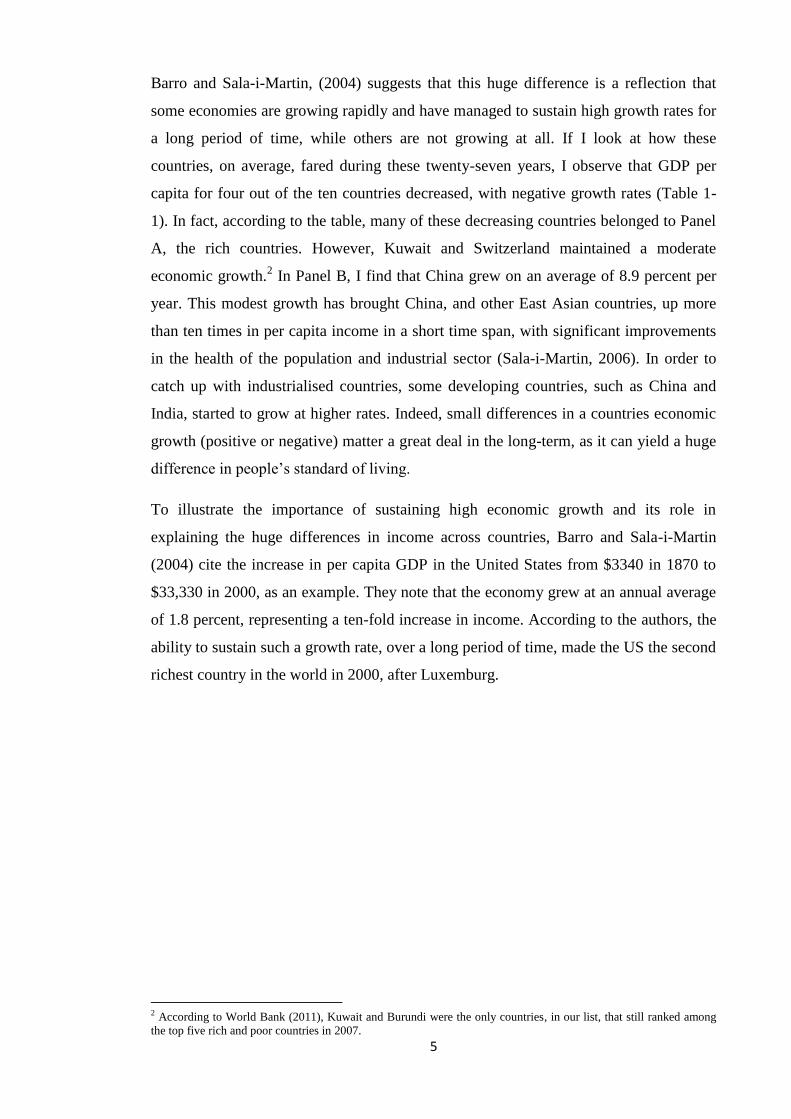
Nonetheless, in the beginning of the 21st century, the global economy showed strong
growth. Over 2001-07, real world gross domestic product (GDP) grew by more than 3
percent a year, exceeding the annual growth of 2.7 and 2.9 percent during the 1990s and
1980s (Figure 1-4 and 1-5). The BRIMC countries contributed to this growth as they
expanded at an especially high 6 percent a year, resulting from economic reforms
enacted over the past two decades (Figure 1-6).
7
Figure 1.4: World GDP growth since 1970
Source: USDA (2010), Economic Research Service, International Macroeconomic Data Set.
Figure 1.5: World GDP per capita growth since 1970
Source: USDA (2010), Economic Research Service, International Macroeconomic Data Set.
0
1
2
3
4
5
6
7
19
70
19
72
19
74
19
76
19
78
19
80
19
82
19
84
19
86
19
88
19
90
19
92
19
94
19
96
19
98
20
00
20
02
20
04
20
06
ann
ual
pe
rce
nt
chan
ge
real GDP growth
-2
-1
0
1
2
3
4
5
19
70
19
72
19
74
19
76
19
78
19
80
19
82
19
84
19
86
19
88
19
90
19
92
19
94
19
96
19
98
20
00
20
02
20
04
20
06an
nu
al p
erc
en
t ch
ange
real GDP per capita growth

8
Figure 1.6: Real 2005 GDP growth rates since 1980
Source: USDA (2010), Economic Research Service, International Macroeconomic Data Set.
It is observed that the slowdown in growth of the world’s economies from 3.8 percent
achieved in the 1970s to 2.9 percent in the 1980s was the net result of two divergent
patterns among the various developing regions. Figure 1-7 indicates that income
inequality among the regions of the developing countries is far greater, with the lowest
income found in the SSA region.
Figure 1.7: Real 2005 GDP growth rate by region since 1980
Source: USDA (2010), Economic Research Service, International Macroeconomic Data Set.

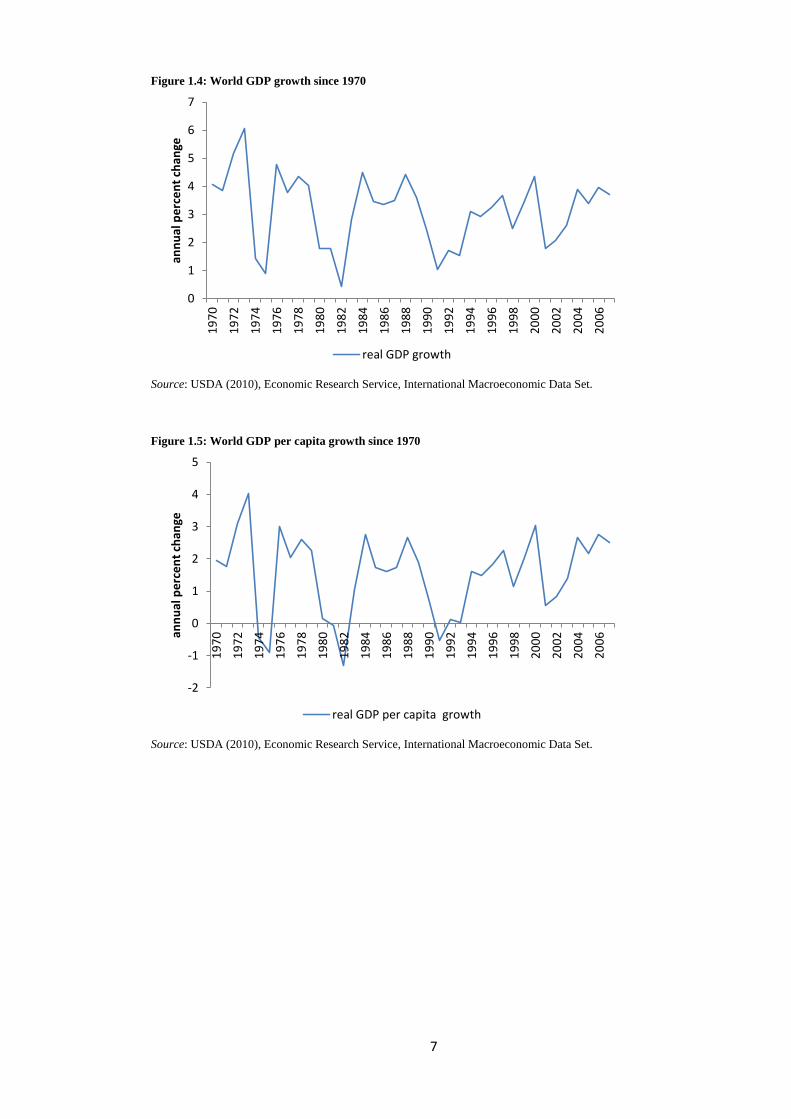
9
Not only is SSA the world’s poorest region, it was also the only developing region in
the world which had a negative growth in income per capita during 1980-2007 (Table 1-
3). Moreover, several factors, including economic policy errors and institutional and
structural constraints, have played important roles in the poor economic performance of
SSA. Comparing growth patterns in the 1970s with the 1980s, South Asia joined East
Asia as a high growth region and the other regions; Latin America and the Caribbean
(LAC), Middle East and North Africa (MENA) and SSA suffered a sharp decline in
their growth (Table 1-3). In the 1990s, there had been modest changes in most regions.
In particular, there was a moderate slowdown in East Asia (as a result of the slowdown
in the Japanese economy and the East Asian crisis which began in the mid-1990s), and
South Asia, a brisk growth in LAC and a moderate decline in SSA. The exception was
the MENA region which experienced growth accelerations as a result of development
policy choices. The net effect of this led to an increase in the developing world’s
economic growth to 4.5 percent (Table 1-3).
During the period between 2000 and 2007, economic growth in the regions became
more noticeable. While East Asia, South Asia, LAC and MENA all experienced a
marked acceleration in economic growth, SSA enjoyed a sharp increase in growth. On a
per capita basis, the SSA region’s 2.3 percent average growth over the last seven years
was the region’s strongest growth performance since the 1970s (Table 1-3).
10
Table 1-3: Average annual growth in GDP and GDP per capita by region and sub-period, 1980-2007
Region
Real GDP Real GDP per capita
1970-79 1980-89 1990-99 1980-07 2000-07 1970-79 1980-89 1990-99 1980-07 2000-07
EAST ASIA 5.72 4.82 3.45 4.2 4.37 3.75 3.34 2.44 3.17 3.86
SOUTH ASIA 2.99 5.69 5.36 5.85 6.65 0.72 3.47 3.33 3.82 4.88
LAC 5.68 2.2 2.75 2.76 3.46 3.3 0.16 1.03 1.02 2.08
MENA 5.99 2.65 3.66 3.56 4.57 3.18 -0.32 1.6 1.22 2.68
SSA 3.18 1.95 1.23 2.52 4.84 0.45 -0.89 -1.38 -0.16 2.27
Developing 5.81 3.74 4.55 4.57 5.62 3.46 1.62 2.76 2.74 4.13
World 3.84 2.97 2.55 2.89 3.23 1.94 1.22 1.08 1.39 1.99
Source: USDA (2010), Economic Research Service, International Macroeconomic Data Set.
The slowed growth in SSA during the 1980s and 1990s might be as a result of their
inability to recognise the importance of development of intangibles, such as technology,
ideas, creativity and innovation (a necessary condition for sustainable growth),
alongside the need for human capital to transform these intangibles into a final product,
so as to produce economic values. Since economies attain various stages of economic
growth at different times in their process of development (given the dynamic nature of
economic growth), government policies are important. This is because for growth to be
sustainable and to successfully integrate into the worlds’ international economy, Africa
needs to implement growth-promoting policies, institutions and trade enabling physical
infrastructure (World Bank, 2007). In addition, Wilson and Stupnytska, (2007) in a
recent report on ‘The N-11, More than an acronym’3 published by Goldman Sachs,
acknowledge that many developing countries are keen on changing their policies, in
order to engage in globalisation. This argument supports the impressive growth
recorded in the 2000s as it reflects the implementation of better economic policies and
structural reforms (Basu et al., 2000).
Recent empirical literature on developing countries provides strong evidence that rapid
and sustained growth is the most single important way to reduce poverty. By employing
various growth-promoting polices which encourage economic openness and domestic
and foreign direct investment (FDI), financial markets, a key indicator of development,
become more modern and developed, and in turn, promote economic growth (Collier
and Gunning, 1999; Agarwal, 2001; Ndikumana, 2001 and Kumo, 2008). Hence, a
3 An acronym coined by Goldman Sachs (2007), to refer to a group of the next 11 ‘emerging’ countries which could
have a BRIC-like impact in the world economy. They include: Bangladesh, Indonesia, Iran, Korea, Mexico,
Nigeria, Pakistan, Philippines, Turkey and Vietnam. Five of these countries (in bold) are included in this study.
11
successful strategy of reducing poverty in the region is to mirror similar policies
employed in other developing regions and in particular, the BRIMCs.
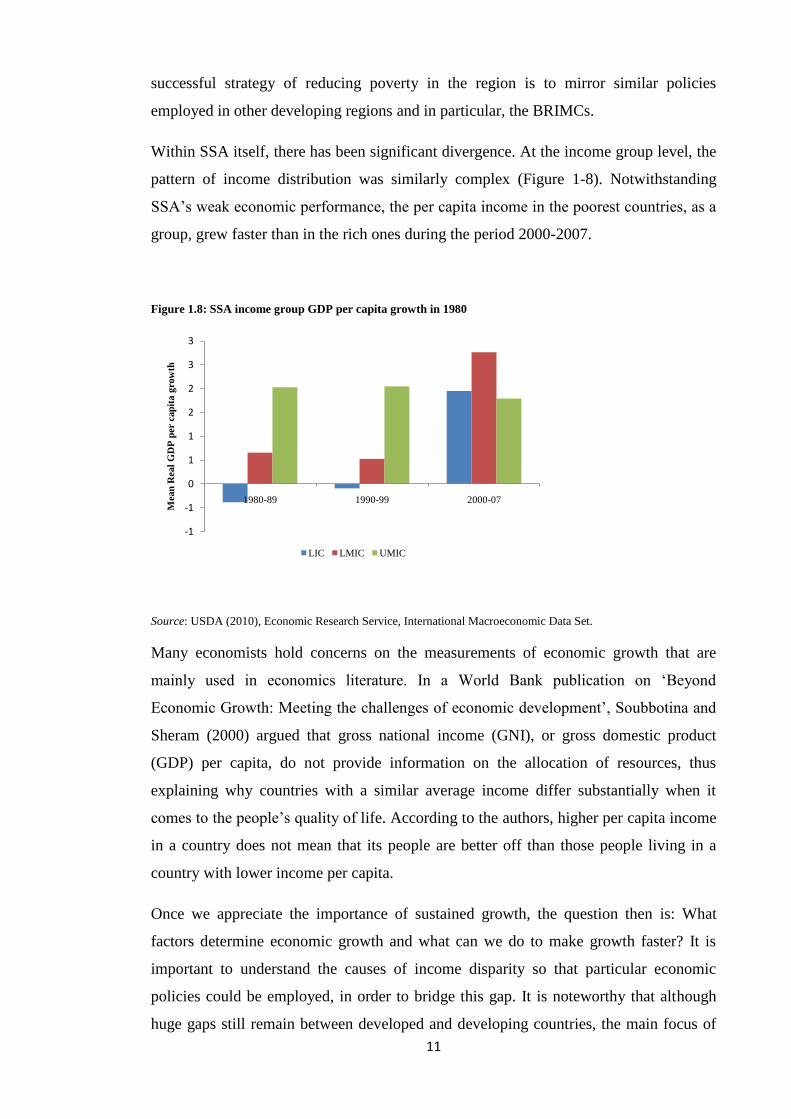
Within SSA itself, there has been significant divergence. At the income group level, the
pattern of income distribution was similarly complex (Figure 1-8). Notwithstanding
SSA’s weak economic performance, the per capita income in the poorest countries, as a
group, grew faster than in the rich ones during the period 2000-2007.
Figure 1.8: SSA income group GDP per capita growth in 1980
Source: USDA (2010), Economic Research Service, International Macroeconomic Data Set.
Many economists hold concerns on the measurements of economic growth that are
mainly used in economics literature. In a World Bank publication on ‘Beyond
Economic Growth: Meeting the challenges of economic development’, Soubbotina and
Sheram (2000) argued that gross national income (GNI), or gross domestic product
(GDP) per capita, do not provide information on the allocation of resources, thus
explaining why countries with a similar average income differ substantially when it
comes to the people’s quality of life. According to the authors, higher per capita income
in a country does not mean that its people are better off than those people living in a
country with lower income per capita.
Once we appreciate the importance of sustained growth, the question then is: What
factors determine economic growth and what can we do to make growth faster? It is
important to understand the causes of income disparity so that particular economic
policies could be employed, in order to bridge this gap. It is noteworthy that although
huge gaps still remain between developed and developing countries, the main focus of
-1
-1
0
1
1
2
2
3
3
1980-89 1990-99 2000-07
Mea
n R
eal
GD
P p
er c
ap
ita g
row
th
LIC LMIC UMIC

12
this thesis is to examine the factors that have contributed to the sustained growth
realised in the BRIMCs in the context of SSA countries.
1.2 Motivation of research: the experience of BRICs/BRIMCs countries
The experience of the fast-growing East Asian economies comprising the well known
‘gang of four’ or ASIAN TIGERS, (the term used in reference to the highly developed
economies of Hong Kong, Singapore, South Korea and Taiwan) and the BRICs (Brazil,
Russia, India and China) can both be considered when examining the factors
responsible for positive outcomes and sustainable economic growth in developing
countries. The dramatic economic growth in East Asia, during the past thirty years, can
be explained by their substantial potential for catching up (since they entered the 1960s
with relatively low incomes and relatively well-educated workers). Their geographical
and structural characteristics were by-and-large favourable, their demographical
changes, following the Second World War, worked in favour of more rapid growth, and
thus the economy transformed from one which was technologically backwards and
‘developing’ to one that is relatively modern and ‘developed’.
Their economic policies and strategies were also conducive for growth (Radelet et al.,
1997). Indeed, Barro (1991) highlights the unprecedented growth rate of the East Asian
economies as one of the most interesting facts of the post-war international growth
experience. In addition, Nelson and Pack (1999) point out that their remarkable growth
exceeded those countries with comparable productivity and income levels in 1960, as
their level of income per capita increased by approximately four-fold.
According to the literature, the most important factor that contributed to the high
performance of the East Asian countries was their ability to recognise the need to
integrate into the world economy, by opening to international competition through
export promotion strategies based on export incentives. East Asian countries promoted
exports through a combination of policies and innovative institutions, such as incentive
packages for FDI and export processing zones. The implementation of these policies
and institutions has indeed contributed to the rapid growth of the fast-growing countries
of East Asia.
By the beginning of the 21st century, many more developing countries had grown
rapidly than had been anticipated by economists. Attention shifted to the fast growing
emerging economies of Brazil, Russia, India and China, collectively referred to as ‘the

13
BRICs. This acronym was coined by Jim O’Neill in 2001, in a Goldman Sachs report on
‘Building better global economic BRICs’. The BRICs represent a shift in the global
economic power, away from the developed G7 economies, towards the developing
world. They are a set of large developing economies that are at a similar stage of
economic development. With a combined GDP in purchasing power parity (PPP) of
approximately US$18.8 trillion, the countries cover over 25 percent of the world’s land
area and 40 percent of the world’s total population. They are spread over two
continents, making them the largest entity on the global stage.
In a follow-up report,4 Wilson and Purushothaman (2003) note that the BRICs have
acquired a most important role in the world economy, as producers of goods and
services, receivers of capital and potential consumer markets, given their common
characteristics of having a significant part of their large populations still not integrated
in the market economy. To this end, the authors highlight trade liberalisation, financial
development, large population, improvement in the level of human development, labour
supply, information technology (IT: an essential strategy for attracting foreign
investment) and stimulating economic growth and development as key features that
have led to the exceptional performance of the BRIC economies. The authors also
focused on the BRICs current and future global importance, and suggested that by 2050,
the sum of the GDP of the four countries may surpass the sum of the G6 (G7, less
Canada)5 countries’ GDP.
The persistent growth in the BRICs is strengthened by the growth realised in China and
India. These two Asian giants are emerging as the most important economic driving
forces in the world, with a combined GDP of approximately 18 percent of the world’s
economy, in terms of PPP. The United Nations Economic Commission for Africa
(UNECA, 2010) notes that the emergence of China and India as an economic power has
contributed to a significant decline in poverty, implying that the standards of living of
people living in these countries have improved substantially.
Shortly after the BRICs thesis, research on these economies gained unprecedented
popularity and the results of the publication raised a number of questions. One of the
most important was why the BRICs? To justify the reasons for studying only the BRIC
economies, Goldman Sachs argued that ‘the BRICs have the economic potential to
4 Dreaming with the BRICs: The path to 2050. 5 Consisting of France, West Germany, Japan, United Kingdom, United States and Canada.

14
become important largely because of their size6 and the ability to challenge major
developed economies in terms of their weight’. Another important question raised is
why Mexico and South Africa were not included in the BRICs thesis? In their defence,
Goldman Sachs in a paper “How Solid are the BRICs?” published in 2005, Jim O’Neill
argued that though Mexico has the potential to rival the BRICs, it is considered a
developed market rather than an emerging market. However, according to the World
Bank Database, in 2004, Mexico was ranked the tenth largest country in the world in
terms of economic size and the eleventh by PPP, compared to Brazil, Russia, India and
China, that were 13th
, 16th
, 11th
, and 5th
, respectively, in terms of economic size.
When looking closer at Latin America and the Caribbean countries, the World Bank
(2008) indicates that in 2007, Mexico grew at an annual growth of 3.2 percent compared
to 5.4 percent in Brazil. Consequently, we find it interesting and useful to extend our
studies to include Mexico. Thus, this thesis focuses on a group of five countries, which
are becoming increasingly economical and politically influential, i.e. BRIC plus
Mexico. These five countries will, henceforth, be referred to as BRIMC, representing
countries from both Asia7 and the Latin American region, which is of economic
significance to the process of globalisation.
Overall, it is observed that the success of the BRIMCs was driven by a combination of
various policy reforms. While the financial sector grew following a series of financial
crises in the early and mid-1990s, the BRIMCs became top destinations for FDI because
of their large population. The Denmark National Bank (2004: 48) also notes that the
level of education and economic openness of these countries contributed to the
impressive growth realised in these economies.8 Other factors such as; accumulation of
production capital, higher rate of employment, expansion of capital input, labour
productivity, labour supply and improvement in technology also account for this
change. In addition, the quality of institutions has been found crucial for the duration
and sustainability of growth accelerations (Rodrik, 2003 and 2005).
Although many African countries record poor and sluggish economic growth, Radelet et
al. (1997) argue that faster growth is possible, and indeed likely, as these countries
adopt market-based strategies and increased openness to world markets. Nonetheless,
6 In terms of demographic (population) and economic size.
7 The World Bank regional classification, groups Russia under the Europe and Central Asian region. However, for
simplicity, all member countries under East Asia, South Asia and Europe and Central Asia are referred to as Asia in
the present study. 8 This growth is in terms of the relation between economic development and a country’s size.

15
achieving such good performance and sustained growth might pose a challenge for
many SSA countries because of the lack of investment in physical and human capital,
the perception of high risk for investing, trade, and political instability, and
inappropriate economic policies. The most important challenge is the inconsistency in
growth policies, quality of institutions and the neglect of the role of technological
innovation.
Technological innovation enables developing countries to catch up with developed
countries, in the process of international integration, through trade or FDI. This implies
that access to foreign investment would lead to technological change, which in turn
raises the relative marginal productivity of capital through education and training of the
labour force, and the creation of new managerial structures and work organisations. The
new endogenous growth models allow foreign investment to impact economic growth in
the long-term through knowledge transfers from multinational companies (MNCs) to
the host country. Therefore, to catch up with other developing economies, what is
needed is a sustained increase in real GDP per capita growth, coupled with significant
improvement in socio-economic development.
Given the experience of the BRIMC countries, the present study finds that the
emergence of the BRIMC countries presents a very good backdrop to re-examine the
role of financial development, FDI and economic growth, in the context of SSA. The
BRIMCs create a space for ‘vertical learning’, where policy makers in the SSA can
learn without having to go through the international institutions dominated by the US or
Europe.
1.3 Objective of thesis
After several years of economic stagnation, there has been a remarkable turnaround in
the economic performance of Sub-Saharan African countries. Though many empirical
literatures tend to highlight the challenges and long standing problems affecting the
region’s economic performance, they have failed to acknowledge the potential for
improving economic performance and hence, sustainable economic growth.
Nevertheless, in recent research conducted by the World Bank (2010) on ‘Yes Africa
Can: Successes from a dynamic continent’, Chuhan-Pole concludes that the economic
turnaround witnessed in many SSA countries, in the 21st century, is as a result of:
stronger leadership, better governance, improving business climate, innovation, market-

16
based solutions, listening to the people and involvement of the citizenry, and an
increasing reliance on home-grown solutions.
Having said that, to achieve the Millennium Development Goals (MDGs)9 and catch up
with Asia and other fast growing Latin American countries, there is a need to find a
reliable economic model which is suitable for the type of environment these countries
find themselves in. Consequently, the main objective of this thesis is to examine
whether, by following a similar model to that of the BRIMCs [in terms of developing
the financial sector and improving access to foreign direct investment], SSA countries
can reach high growth rates and sustain them for long-term development. To achieve the
aim, this thesis attempts to find an answer for one main research question, which is
whether and how financial development and foreign direct investment affect economic
growth in developing countries and how this effect is significant in the BRIMC and
SSA countries. The study draws data on financial development, foreign direct
investment and economic growth for 60 developing countries during the period 1980 to
2007, by drawing different econometric techniques into one single framework. The
objectives of the thesis, thus, are:
To examine the determinants of financial development and the role of financial
liberalisation in the emerging and frontier markets of the BRIMC and SSA
countries.
To identify the effects of institutional quality on financial development in SSA
countries.
To examine the determinant of FDI and its impact on economic growth in
developing countries, with particular interest in the BRIMC and SSA countries,
within the theoretical framework of an endogenous growth model. In particular,
it tries to capture whether FDI is a sufficient condition for countries to achieve
higher growth rates, or whether FDI, through its interactions with trade openness
and human capital, enables these countries to absorb and adopt new technologies
and knowledge from advanced countries, in order to catch up.
To investigate the long-term causal relationship between financial development,
FDI and economic growth in developing countries, focusing on the BRIMC and
SSA countries.
9 The MDG refers to a set of goals set to reduce poverty, by half, by the year 2015. See United Nations
<http://www.un.org/millenniumgoals/bkgd.shtml> for more details.

17
These objectives are further broken into different testable hypotheses in the empirical
chapters.
1.4 Research methodology
The methodological and analytical approaches used in this study are drawn from the
empirical literature focusing on financial development, FDI and growth, so as to
examine the objectives of the research. The research reviews extensive theoretical and
empirical literature that underpins the role of financial development and FDI in the
economic growth of the BRIMC and SSA economies. This research is partly qualitative
and makes use of some descriptive statistics to provide a clearer detail of the analysis.
The second part of the research is quantitative and involves econometric techniques
using secondary data published by various international and domestic financial
institutions. Different econometric models are constructed and form the basis of the test
of the hypothesis. These methods are highlighted in each of the chapters that they are
used along with the justifications and limitations for their use. Where necessary, visual
illustrations (graphs and tables) are used to support the results obtained in the study.
This thesis relies on a panel data technique and time series estimators (where
applicable) to study the impact of finance and FDI on growth. Specifically, it examines
the importance of institutional environment, openness to trade and human capital, and
their interactions, in the process of economic growth, in a sample of 60 developing
countries. In terms of location, 12 of these 60 developing countries are from Asia, 11
are from Latin America and the Caribbean, and 37 are from Sub-Saharan Africa,
including a group of fastest growing emerging economies from Brazil, Russia, India,
Mexico and China (which make up the BRIMC countries). In terms of income, 21 of
these 60 developing countries are low income countries, 21 are lower and middle
income countries and 18 are upper and middle income countries. All the regressions are
done using STATA 11 or EVIEWS software, version 6 and 7.
1.4.1 Panel Data Analysis
Panel data analysis is used to prevent some distortions, in terms of size, which might
occur with time series analysis due to a limited number of observations. This is because
it consists of both i cross-section dimension and t time series dimension. The use of
panel data method has a number of advantages and disadvantages. Hsiao (2003), Eller et
al. (2005) and Baltagi (2008) identified several benefits of panel data analysis,
including:

18
It provides a large number of observations.
It increases the degrees of freedom.
It reduces the co-linearity among explanatory variables.
It identifies and measures the effects that time series or cross-sectional methods
are unlikely to detect (e.g. country-specific or time specific effects). One of the
main uses of panel data analysis is to control for heterogeneity. Countries,
individuals and firms vary, and ignoring this effect can lead to heterogeneity in
model specification. Hence, the unobserved differences that are related across
countries and are constant overtime can be considered within the panel data
analysis by using a country-specific effect (Eller et al., 2005).
It improves the efficiency of Granger causality tests.
It is useful in studying the dynamics of adjustments, in that it is able to explain
the adjustments to economic policy changes, if the panels are long enough.
Hsiao (2003: 5) argued that this can be done ‘by using information on both the
inter-temporal dynamics and individuality of the entities being investigated’.
The use of the panel data method also poses some problems because it consists of both
cross-section and time series dimensions. The disadvantages of using panel data
include:
Having a time series dimension. Baltagi (2008) argues that most panel data
deals with annual data, which covers a short period of time as a consequence,
asymptotic arguments rely on the number of individuals tending to infinity
while the number of time periods remains constant.
The issue of cross-sectional dependence (CSD) also needs to be considered as it
may lead to misleading inference. CSD is the possibility that the individual
units in the panel are interdependent. Several tests have been developed to take
into account the cross-sectional side of the panel including: Pedroni (1999),
Levin and Lin (1992), Quah (1994), Levin et al. (2002) and Im et al. (2003) to
mention a few.
The present study, thus, relies on several panel data methods for analysis including:
pooled ordinary least squares (POLS) method, fixed effects (FE) and random effects
(RE) methods, panel corrected standard errors (PCSE) estimation, Generalised Methods
of Moments (GMM) as well as panel unit root, panel co-integration and panel causality

19
tests. The various panel data methodology is further described in the chapters where
they are utilised.
1.4.2 Data Quality and Characteristics
A common feature of many data sets used in empirical research on developing countries
is the limited availability of sufficiently long time series variables and that of missing
observations. In this thesis, the entire data set is an unbalanced and incomplete panel.
An observation is considered incomplete if a value is missing for one or more of the
variables. Missing observations are either random or non-random. An observation is
missing at random if the fact that they are missing is unrelated to the actual values of the
missing data while an observation is referred to as non-random missing if the fact that
they are missing is related to the actual missing data. In statistical analysis, the use of
missing observations is not without its risks. On one hand, if the missing variable is
considered to be an important part of a model, simply omitting the variables from the
analysis brings with it the possibility of substantial ‘omitted variable bias’. On the other
hand, if the variable is considered important and to be missing at random, then a simple
way to deal with the problem is to omit the observations and estimate the model using
observations with ‘complete data’ although based on a smaller sample size than the
original data set (Abrevaya and Donald, 2010).
Missing data were filled out using linear interpolation by country. However, after filling
in for missing observations with the linear interpolation method, there were still some
missing observations for some of the variables. To deal with this problem, the
remaining incomplete observations were purged.10
The original data set comprised 60 countries and includes annual observations between
1980 and 2007; however, each chapter uses data set based on the questions addressed.
The data was retrieved from various sources of information. World’s Bank World
Development Indicators (2009, 2010) and World Governance Indicators, (2010), Beck
et al.’s (2000, updated 2010) financial structure dataset, UNCTADs’ World Investment
Report (WIR), Penn World Table versions 6.3, International Monetary Statistics (2009),
International Financial Statistics and UNESCO UIS data, Heritage Index of Economic
Freedom database, (2010), Bekaert et al. (2002), Chinn and Ito’s index (2006, updated
2010) and Teorell et al.’s (2010, 2011) the quality of government dataset.
10 See more details in the empirical chapters.
20
The selection of the variables that are representative of each chapter was necessarily
affected by the option of using a sufficiently large sample of developing countries.
Thus, from theoretical standpoint, some important variables that were included in some
of the studies reviewed were left out. A list of the countries is presented in Appendix I.
The variables used in this study include liquid liabilities, private credit, bank credit,
stock market capitalisation, value of stocks traded, financial liberalisation dates,
financial freedom index, KAOPEN index, trade openness as a ratio of GDP (sum of
import plus exports of goods and services), trade freedom index, inflation, institutional
quality (average of bureaucratic quality, control of corruption and rule of law), World
governance Indicators (political stability, government effectiveness, control of
corruption, voice and accountability, regulatory quality and rule of law), external capital
in the form of FDI as a ratio to GDP, GDP per capita, annual growth of GDP per capita,
GDP and annual growth of GDP, adult literacy rate, government consumption as a ratio
of GDP and government fixed consumption formation as a ratio of GDP.
1.5 Contributions to the literature
The combined effect of financial development and FDI has been a contentious issue that
has resulted in several different views from scholars due to the methodological
approaches applied and the samples used in their studies (Carkovic et al., 2005; Alfaro
et al., 2006 and Eller et al., 2005). As a result, this thesis sets out to present a different
sample in the study of financial development, FDI and the effects of their interaction, on
economic performance, in response to a call by Eller et al. (2005) for a different sample
in the study of the impact of financial development and FDI in an economy.
To this end, this thesis contributes to the literature in four ways:
First, it contributes to the finance-growth literature by focusing on the effect of financial
liberalisation on financial development, using emerging and frontier markets as a case
study. The contribution here lies in the area of which aspect of the financial sector11
contributes to financial development in developing countries. The study extends the
existing literature on determinants of financial development and the impact of financial
liberalisation on financial development.12
Evidently, though, these studies focus mostly
on the experiences of developed and developing countries. Otherwise, the current
11 In this study, we focus on the banking sector and stock market. 12 See, for instance, the works of Baltagi et al., (2007), who show that economic institutions are more important than
openness for financial development, in 42 developing countries during 1980-2003, and more recently, Huang, (2010),
who examined the role of political institutions in financial development, in 90 developed and developing countries
between 1960-1999.
21
literature offers very limited empirical research on the impact of financial liberalisation
in frontier markets. In fact, the majority of the existing literature on frontier markets
tends to focus on the impact of financial liberalisation on savings, investment and
economic growth, whereas, this study concentrates on its indirect impact on financial
development. It is observed that low levels of institutions limits the impact of financial
liberalisation on financial development in frontier markets, hence in the fourth chapter,
the thesis examined the role of institutions in financial development in SSA countries,
taking into account the effect of individual institutions on financial development.
Furthermore, it examines whether financial development, through better institutions
affect economic growth in the region.
Second, the study investigates the determinants of FDI and aim to demonstrate the
importance of trade openness and human capital in the attraction of FDI to developing
countries.
Third, it assesses the growth effect of FDI through the financial sector in our sample.
Previous studies investigated the consequences of financial sector FDI for the host
country’s financial system13
and the role of financial system in the FDI-growth nexus.
However, they focus mainly on developed countries, transition economies in Central-
Eastern Europe or recent emerging economies, with very scant literature from
developing regions and, in particular, SSA.
Fourth, it employs both panel data and time series cross-section (TSCS) estimation
techniques to take advantage of the time varying financial measures and
macroeconomic policy shocks, as well as any available country-specific characteristics.
These country-specific characteristics are important from an investment and
competition point of view.
The use of the BRIMC countries as a learning strategy for the SSA countries, gives this
study its uniqueness.
1.6 Structure of the study
This study is organised into seven chapters. Chapter one and two set the tone of the
thesis. In the first chapter, an introduction and general information on global economic
growth and development is discussed, with reference to the experience of the ‘gang of
13 See for example Goldberg, (2004); Herrero et al. (2003); BIS, (2004)

22
four’ (South Korea, Singapore, Taiwan and Hong Kong) and the fastest growing
emerging economies, the BRIMC countries (Brazil, Russia, India, Mexico and China).
Chapter two presents an economic comparison of the BRIMC and SSA countries. The
purpose of this chapter is to show how these economies developed and how their paths
of development differ. It provides an overview with the aid of tables and figures. It
reviews the strategies of the BRIMC countries and traces the role of financial
development, FDI, trade openness and human capital in promoting sustainable
economic growth. It is believed that by systematically identifying and assessing positive
outcomes, it will be possible to draw out lessons regarding what has worked in practice
and why. In addition, it projects the performance of GDP growth, income per capita and
currency movements in the selected SSA countries in our sample until 2050, by
following a similar methodology to that presented by Garrido (2009) in a World Bank
publication ‘Income Benchmark’.
The next four chapters present the empirical analyses which form the core aspect of this
thesis. The first three empirical chapters focus on the interrelationship between financial
development and FDI. In particular, the first empirical chapter (Chapter three), entitled
financial development in emerging and frontier markets: The role of financial
liberalisation examines the role of financial liberalisation in determining financial
development, and investigates the importance of financial liberalisation for financial
development. The analysis in this chapter, and its evidence, will be used to build on the
argument of the second empirical chapter (Chapter four) which will investigate the
importance of institutions in financial development. In this chapter, Institutional quality
in Sub-Saharan Africa: An empirical examination of its impact on financial
development investigates whether financial development has a positive impact on
growth through improving institutional quality in developing economies of the SSA
region. In particular, this chapter seeks to establish the impact of economic, political and
legal institutions on financial development.
Chapter five, On the determinant and impact of Foreign Direct Investment: Evidence
from developing countries examines. Here, some propositions put forth by economists
to elucidate the concept of FDI are surveyed and a theoretical and empirical
underpinning of what drives FDI to developing countries is presented. It aims at testing
empirically some propositions advanced by economists to justify FDI. Economic
growth is mainly targeted. Economic growth, in the literature, turns to be a determinant

23
as well as an effect of FDI. Some researches have confirmed that a high rate of growth
encourages foreign investments. There are also investigations that examine the role of
economic openness and human capital in promoting FDI. Chapter six, Foreign Direct
Investment, financial development and economic growth: A panel co-integration
approach studies the long-term relationship between FDI, financial development and
economic growth. The chapter investigates the role played by financial development in
determining the contribution of FDI to growth. That is, it tests whether financial
development in host countries is a precondition for reaping the positive spillovers
(externalities) generated by FDI inflows.
Chapter seven is the concluding chapter. It highlights the main findings of the study and
their significance and policy implication.

24
Appendix I
Table 1-4: List of countries and data
Developing Countries (60)
Angola Colombia Mali Senegal
Argentina Congo, Rep. Mauritania Seychelles
Bangladesh Costa Rica Mauritius Sierra Leone
Benin Côte d'Ivoire Mexico South Africa
Bolivia Ethiopia Mozambique Sri Lanka
Botswana Gabon Nepal Sudan
Brazil Gambia Niger Swaziland
Burkina Faso Ghana Nigeria Tanzania
Burundi India Pakistan Thailand
Cameroon Indonesia Papua New Guinea Togo
Cape Verde Kenya Paraguay Uganda
Central African Republic Lesotho Peru Uruguay
Chad Madagascar Philippines Venezuela
Chile Malawi Russia Zambia
China Malaysia Rwanda Zimbabwe
Source: World Bank (World Development Indicators, 2011, September edn)
The World Bank classification of countries by income groups: economies are divided among income
groups according to 2008 gross national income (GNI) per capita, calculated using the World Bank Atlas
method. The groups in this classification are: (low income, $975 or less; lower middle income, $976–
3,855; upper middle income, $3,856–11,905).
Table 1-5: Low income countries
LIC (21)
Bangladesh Gambia Niger
Benin Kenya Rwanda
Burkina Faso Madagascar Sierra Leone
Burundi Malawi Tanzania
Central African Republic Mali Togo
Chad Mozambique Uganda
Ethiopia Nepal Zimbabwe
See Table 1-4

25
Table 1-6: Lower middle income countries
LMIC (21)
Angola India Paraguay
Bolivia Indonesia Philippines
Cameroon Lesotho Senegal
Cape Verde Mauritania Sri Lanka
Congo, Rep. Nigeria Sudan
Côte d'Ivoire Pakistan Swaziland
Ghana Papua New Guinea Zambia
See Table 1-4
Table 1-7: Upper middle income countries
UMIC (18)
Argentina Mauritius
Botswana Mexico
Brazil Peru
Chile Russia
China Seychelles
Colombia South Africa
Costa Rica Thailand
Gabon Uruguay
Malaysia Venezuela
See Table 1-4

26
2 Can Sub-Saharan African Countries Learn from the BRIMCs
Success?
In the last two decades, Brazil, Russia, India, Mexico and China (the BRIMC countries)
have become very important actors in the globalisation process. Which is why,
analysing the evolution of the drivers of the growth process and its impact on economic
performance is important to a better understanding of these countries’ economies, as
well as of the living standards in other developing countries. During this period, the East
Asian region experienced sustained economic growth, a period of growth so long and
exceptional for it to be referred to as the ‘East Asian Miracle’ (World Bank, 1993). In
the same years, SSA countries experienced a period characterised by a surprising
decline and stagnation of growth that induced several authors, including Easterly and
Levine (1997), to write of ‘Africa’s growth tragedy.’ Unlike many Asian countries
where growth has been sustained in order to catch up with developed economies, the
poor economic performance in the SSA has been attributed to a failure in establishing a
virtuous growth circle involving complementary increase in savings and exports
(Akuyz, 2001). In addition, low levels of investment, governance, political stability and
access to credit were other major development challenges facing the SSA region.
The period between 2000 and 2007 brought strong hopes to Africa, especially the SSA
countries, as an increasing number of countries are showing signs of economic progress,
reflecting the implementation of better economic policies and structural reforms (Basu
et al., 2000) such as the Millennium Development Goals (MDGs), a policy strategy that
aims to; among other things, end poverty and hunger and to develop global partnership
by 2015. Nonetheless, the success of the BRIMC countries delivers some important
lessons: the importance of trade openness, human capital, financial development and the
need for foreign direct investment. This chapter, therefore, examines the economic
performance of the BRIMC countries in the last two decades, in comparison to each
other and to some select SSA countries. In doing so, this thesis examines the BRIMC
model of economic development in light of the different approaches undertaken by the
different countries. It is hoped that SSA policymakers can draw from these experiences
by following some useful policy guidance for further economic development and
growth in the region.

27
The analysis in this chapter is similar to the work of Harrold et al. (1996), who
examined the experience of East Asian countries in terms of industrial development and
export growth and its implications for SSA countries. However, this study is unique in
that it focuses on the big emerging economies of Brazil, Russia, India, Mexico and
China, (BRIMC). The BRIMCs captures East, South, Europe and Central Asian and
Latin American regions as identified by the World Bank (2010). Based on the literature,
we highlight common factors that have contributed to the growth success of the
BRIMCs and derive practical lessons for the SSA region. I discuss various strategies for
economic development and, in particular, I examine the role of financial development,
FDI, trade openness and human capital development. I then present a simple economic
growth simulation for SSA countries following similar methodology presented by
Wilson and Purushothaman (2003). Identifying these factors is of particular importance
for SSA, because it is believed that sustainable economic growth-oriented policies could
be drawn from the successful experience of other developing countries.
2.1 Introduction and general background
The BRICs is an acronym created by Jim O’Neill from the Goldman Sachs Investment
Bank that stands for Brazil, Russia, India and China, the four largest emerging countries
most analysed and debated nowadays. With the outstanding growth obtained in these
countries in the current decade, they have been studied together because they represent a
significant change in the world, after implementing various economic reforms and
liberalisation in the 1990s. In this thesis however, I include Mexico and coin the
acronym BRIMC, hence, focusing on five of the fastest growing developing countries.
These countries have had distinguished level of development during the last few years,
however, their individual growth patterns does not seem to be similar. Individually, and
collectively, these are significant global actors to which other developing countries must
pay attention, especially the SSA region.
The BRIMC countries are a highly heterogeneous group, differing significantly in terms
of size, population and weight in the world economy. Around the middle of the 20th
century, China witnessed its communist revolution, India became independent, Mexico
recovered from depression, Brazil went into a period of twenty-one years of military
regime, and the former Soviet Union came out of the Second World War as a major
rival to the United States. Later on, in all these countries, inward orientated and more or
less centrally planned development strategies from the 1950s to the 1970s were replaced

28
by gradual integration in the global economy in the 1980s and 1990s. These countries
became quite significant in the world economy following major institutional transition
and changes in their economic structure during the 1990s.
According to data from the USDA/ERS International Macroeconomic Data Set (2010),
the combined GDP of the five BRIMC countries, in terms of constant 2005 US $,
reached a high of US $6,589 billion and approximately 30 percent of the world’s GDP
in 2007. Their share of GDP in the world fluctuated between 9 and 10 percent in the
1980s and 1990s respectively. These five countries combined, cover approximately 30
percent of the world’s land area over three continents. The relevance of these vast land
areas relates to the likelihood of the existence of mineral resources and fertile lands for
agriculture. All the countries have significant underground resources and their
extractions are reflected in the sector composition of their GDP (see Table 2-1).
Table 2-1: Sector composition of GDP
Countries
Agriculture Industry Services
1980 1980-99 2000-07 2007 1980 1980-99 2000-07 2007 1980 1980-99 2000-07 2007
Brazil 11.01 8.66 6.15 5.56 43.83 38.59 28.19 27.81 45.16 52.75 65.65 66.63
Russia N/A 9.43 5.64 4.41 N/A 42.43 35.88 36.44 N/A 48.13 58.48 59.15
India 35.70 29.81 20.35 18.26 24.69 26.19 27.27 29.04 39.61 44.00 52.38 52.70
Mexico 9.00 7.58 3.89 3.64 33.65 31.02 31.68 34.95 57.36 61.40 64.43 61.41
China 30.17 24.95 12.92 10.77 48.22 44.86 46.34 47.34 21.60 30.19 40.74 41.89
BRIMC 85.89 76.18 48.96 42.64 150.38 164.00 169.36 175.58 163.73 214.82 281.68 281.78
Source: World Banks World Development Indicator, (September edn, 2011)
In terms of land, agriculture remains an important sector of the BRIMC countries,
accounting for an average 43 percent of GDP in 2007. This is especially true in India
and China where agriculture is of particular importance and accounts for 18 and 11
percent of GDP in 2007, respectively. The share of the population of these countries
with regard to the total world population is quite significant because they accounted for
44 percent of the world’s population in 2007. China, the most populous country of the
group, has been trying to control population growth and as a result has managed to
decrease its share of the world’s population from approximately 22 percent in 1980, to
20 percent in 2007.
The BRIMC countries are also at different stages of development, but the variation in
their levels of GDP per capita is similar to that of the G7 countries overall. The BRIMC

29
countries also have different long-term growth prospects (OECD, 2010). GDP per
capita in the five countries increased from US $16,164 billion in 1980 to US $22,672
billion in 2007, growing at an annual rate of 1.3 percent. The rise in growth is supported
by the decline in population growth rate, rise in demand, total factor productivity and
investment in human capital. With these characteristics, the BRIMCs have become
increasingly noticeable in the global economy.
The process of globalisation has led to a rapid increase in the inflow of FDI in the last
few decades, especially in developing countries. Inward FDI flows to developing
countries rose from US $7.5 billion in 1980, reaching US $35.1 billion in 1990 to a peak
of US $256.6 in 2000 and jumped by 51 percent to reach US $499.7 billion in 2007 (see
Figure 2-1) (UNCTAD, 2008). Asian countries and, in particular, the BRIMCs have
been successful in attracting FDI compared to the SSA, where FDI inflow still lags
behind other developing regions. The magnitude of FDI destined to the BRIMCs
totalled US $218 billion in 2007, showing an increase of approximately 55 times that
which was obtained in 1980 (US $4 billion). The share of BRIMCs in total FDI inflow
to developing economies increased from 40 percent in the 1990s to 46 percent in 2007
(see Table 2-2). Similarly, the share of developing economies FDI to the SSA increased
from approximately 0.5 percent in the 1990s to approximately 1 percent in 2007 (see
Table 2-3).
Figure 2.1: Trend in FDI inflows to developing economies, 1980-2007
Source: UNCTAD, World Investment Report, (2008).
ASIA BRIMC
LAC
SSA
Developing economies
0
100
200
300
400
500
600
1980 1985 1990 1995 2000 2005 2006 2007
Bill
ion
s o
f U
S$

30
Table 2-2: Evolution of FDI inflows to the BRIMCs, 1980-2007 (in billions of US $)
Year Brazil Russia India Mexico China BRIMC
Developing
economies
Share in
percent
1980 1.9 N/A 0.1 2.1 0.1 4.2 7.5 56.2
1985 1.4 N/A 0.1 2.0 2.0 5.5 14.2 38.8
1990 1.0 N/A 0.2 2.6 3.5 7.4 35.1 21.1
1995 4.4 2.1 2.2 9.5 37.5 55.7 116.0 48.0
2000 32.8 2.7 3.6 18.1 40.7 97.9 256.6 38.2
2005 15.1 12.9 7.6 24.1 72.4 132.1 316.4 41.7
2006 18.8 29.7 20.3 20.1 72.7 161.6 413.0 39.1
2007 34.6 55.1 25.3 29.7 83.5 228.3 499.7 45.7
Source: UNCTAD World Investment Report, (2008). N/A implies not applicable
Table 2-3: Evolution of FDI inflows to the SSA, 1980-2007 (in billions of US $)
Year Botswana Gabon Mauritania Seychelles
South
Africa SSA
Developing
economies
Share in
percent
1980 0.1 0.0 0.0 0.0 0.0 0.2 7.5 -0.1
1985 0.1 0.0 0.0 0.0 -0.4 -0.4 14.2 -3.2
1990 0.1 0.1 0.0 0.0 -0.1 0.1 35.1 -0.2
1995 0.1 -0.3 0.0 0.0 1.2 1.0 116.0 1.1
2000 0.1 0.0 0.0 0.0 0.9 1.0 256.6 0.3
2005 0.3 0.1 0.8 0.1 6.6 7.9 316.4 2.1
2006 0.5 0.3 0.2 0.1 -0.5 0.5 413.0 -0.1
2007 0.5 0.3 0.2 0.2 5.7 6.9 499.7 1.1
Source: UNCTAD World Investment Report, (2008)
Financial globalisation has also caused significant transformation in the world economy.
According to Das (2006), financial globalisation refers to ‘the integration of domestic
financial system of a country with the global financial markets and institutions’. It
involves the liberalisation and deregulation of the domestic financial sector, as well as
the liberalisation of the capital account. The BRIMC countries differed in the speed,
pace and content of the reforms they implemented. Although all five countries
liberalised their financial markets in the late 1980s and early 1990s, as expected, it has
provided opportunities for foreign investors to actively participate in these markets,
which in turn, increased the level of liquidity, savings and growth of these economies.
In contrast, the macroeconomic performance in the Sub-Saharan African (SSA) region
seems to differ a lot from Asia and Latin America and the Caribbean. Even after the
implementation of several economic reforms, economic performance in SSA has been
weak. Many economists including Aryeetey et al. (2003) believe that the SSA countries
failed to take advantage of the opportunities provided by the increasing international
interactions. In the 1960s, for instance, both SSA and East Asian countries started at a
similar level of income per capita; however, there is an increasing gap in growth pattern

31
between them. East Asia emerged from stagnation in the early post-war period and
within several decades achieved a status of industrial competitiveness and an improved
standard of living. Although the pattern of growth varies across the region, their
economic and social achievement has been outstanding making them the only
developing region that succeeded in catching up with the industrialised regions (Ohno,
2006).14
Whilst several lessons were drawn from this for the SSA countries, they have
still not addressed the challenges facing the region, some of which include poor
governance, corruption, macroeconomic mismanagement and bad policies.
For the sake of clarity, Table 2-4 below directly compares the economic performance of
Asia, BRIMC, LAC and SSA countries.15
It can be seen that in the last three decades the
four groups grew following very different paths. Economic comparisons show
economic development in all these countries. The data presented in Table 2-4 indicates
that during the period 1970-2007 (Period A) and 1980-2007 (Period B), Asia and the
SSA countries started from quite a small difference in GDP per capita (Asia GDP per
capita was 0.9 times the SSA GDP per capita in 1970), but they ended with an amazing
difference: the mean Asian GDP per capita in 2007 was $2,047 billion, while the SSA’s
GDP per capita was only $1,398 billion (an increase of 1.5 compared to 2.6 percent in
Asia). This is also reflected in the annual difference of the rate of growth (1970-2007),
which was 1.5, in the case of the SSA countries, and 2.6, in the case of the Asian
countries. A similar observation is noted in the difference in growth pattern between the
BRIMCs and LAC countries. In both period A and B, I observe a similar development
path with increasing convergence in performance in both the BRIMCs and LAC
countries.
Table 2-4: Economic performance in developing regions, 1970-2007 Region
real GDP per capita (in billions of 2005 dollars)
Annual difference in
growth rate
1970 1980 2000 2005 2006 2007
1970-
2007
1980-
2007
ASIA 780 1036 1499 1823 1928 2047 2.6 2.5
BRIMC 2213 3233 3520 4088 4302 4534 1.9 1.3
LAC 2859 3566 4028 4337 4564 4804 1.4 1.1
SSA 806 1020 1221 1298 1342 1398 1.5 1.2
Source: USDA (2010), Economic Research Service, International Macroeconomic Data Set.
14 See Appendix II 15 The data used in this analysis refers to 12 Asia, 5 BRIMCs, 11 LAC and 37 SSA countries for period A, 1970-2007
and period B, 1980-2007.

32
The BRIMCs and SSA also show varying growth patterns in both periods. As one can
see in the figure below, the economic performance of both groups, in terms of GDP per
capita, is far from homogenous. In fact, there is an increasing divergence in economic
performance between both groups as a result of different policies and institutions, (Uy,
2010).
Figure 2.2: Divergence in performance between BRIMC and SSA, 1980-2007
Source: USDA (2010), Economic Research Service, International Macroeconomic Data Set.
Within the BRIMCs and SSA itself, there has been significant divergence (Figure 2-3
and 2-4). Real GDP per capita in Mexico is similar to that of Russia, but higher than
Brazil, China and India.
Figure 2.3: Economic performance, Brazil, Russia, India, Mexico and China, 1980-2007 (GDP per capita,
constant 2005 US $)
Source: USDA (2010), Economic Research Service, International Macroeconomic Data Set.
BRIMC
SSA
01
00
02
00
03
00
04
00
05
00
0
1970 1980 1985 1990 1995 2000 2005 2006 2007
GD
P p
er
cap
ita
(US
$)
Brazil
Russia
India
Mexico
China
02
00
04
00
06
00
08
00
01
00
00
1980 1985 1990 1995 2000 2005 2006 2007
GD
P p
er
cap
ita
(US$
)

33
Similarly, GDP per capita in the Seychelles is higher than the rest of the SSA countries
in our study. Further, South Africa, Botswana and Mauritius seem to have a similar
GDP per capita.
Figure 2.4: Economic performance, Brazil, Russia, India, Mexico and China, 1980-2007 (GDP per capita,
constant 2005 US $)
Source: USDA (2010), Economic Research Service, International Macroeconomic Data Set.
From the foregoing discussion, it is possible to identify the growth strategies
responsible for the current economic performance of the BRIMCs in comparison to each
other and to the top five fastest growing countries in the SSA region.16
Given the scope
and nature of this study, it will remain at a fairly general level of analysis and where
necessary, individual country case studies will be used to further elucidate the point. I
seek to benchmark the experience of the BRIMCs, because of their rapid growth,
against conditions in the SSA, so as to identify potential constraints to sustaining the
SSA’s growth take off. Though it could be argued that there is no basis for comparison
given that these economies differ in size, to address this issue and allow for fair
comparison, countries with a similar standard of living are used. Table 2-5 compares the
economies of the BRIMCs with five of the fastest growing economies in the SSA using
2007 as the base year. From the table, it is obvious that the stagnant growth of the SSA
16
GDP per capita is used to proxy the standard of living of a country. It is important to take into account the rate of
population growth, especially in countries with a high population growth, if not it may result in an overestimation of
the improvement in standards of living. GDP per capita is important, where growth rates decline to a level lower than
the population growth rate, because a declining standard of living will result. With this in mind, the top five richest
countries in SSA, based on the average GDP per capita between 2000 and 2007, are listed.
Botswana
Gabon
Mauritius
Seychelles
South Africa
02
00
04
00
06
00
08
00
01
00
00
1980 1985 1990 1995 2000 2005 2006 2007
GD
P p
er
cap
ita
(US$
)

34
countries, in the last twenty years or so, has led to a significant decline in GDP per
capita, which was obvious in Gabon.
Table 2-5: Economic growth in fast growing emerging economies of the BRIMCs and SSA
Countries
Real GDP
2007
Share in
developing
countries
GDP(percent)
1980-2007 2000-2007
Real GDP
1980
Real GDP
2000
Real GDP
growth
Real Per
capita
growth
Real GDP
growth
Real Per
capita
growth
China 2859.8 23.5 9.5 8.4 9.6 7.3 222.3 1456.1
Brazil 1071.5 8.8 2.4 0.7 3.2 2.0 568.8 856.2
Russia 921.9 7.6 1.1 1.0 6.4 1.4 686.6 589.6
India 906.4 7.4 5.9 4.1 7.1 3.2 183.5 550.0
Mexico 830.3 6.8 2.6 0.8 2.4 1.7 417.5 702.0
South Africa 245.2 2.0 2.2 0.4 3.9 0.5 134.5 187.2
Botswana 8.9 0.01 6.7 3.9 4.9 5.5 1.4 6.3
Gabon 8.7 0.01 2.1 -0.5 2.3 0.7 4.9 7.5
Mauritius 6.5 0.01 5.1 4.1 4.3 4.1 1.6 4.8
Seychelles 0.7 0.01 3.1 2.0 0.7 3.0 0.3 0.7
Source: USDA (2010), Economic Research Service, International Macroeconomic Data Set.
Tables 2-6 to 2-8 present other socio-economic indicators for each individual country.
Socio-economic indicators provide a background to the understanding of the health
scenario in a country. A look at these key economic indicators for each country reveals
similar stories. From Table 2-6, I notice that between 1980 and 2007, real GDP in
Botswana, China, India and Mauritius grew above 5 percent. The acceleration of the
growth in the 1980s is the result of macroeconomic reforms in response to various fiscal
and monetary troubles. As compared to the 1980s, these countries have performed
relatively well in stabilising inflation rates, particularly since the late 1990s. By 2007, I
find that inflation has dropped from two figures to one figure. Despite improvements in
overall macroeconomic management, as reflected in a significant decline in inflation
rates between the end of the last decade and the current decade, inflation remains one of
the major challenges to national efforts for economic recovery, and for integration and
poverty reduction in the SSA region.

35
Table 2-6: Key economic indicators
Country
Real GDP Real GDP per capita GDP
growth
GDP per
capita
growth
Inflation
1980 2007 1980 2007 1980 2007
Botswana 1.4 9.0 1600.9 4691.7 6.8 4.0 13.6 7.1
Brazil 568.8 1071.5 4624.0 5525.5 2.4 0.7 82.8 3.6
China 222.3 2859.8 225.7 2182.1 9.5 8.4 5.6 2.9
Gabon 4.9 8.7 6914.6 5991.5 2.1 -0.5 36.8 5.0
India 183.5 906.4 268.0 806.3 5.9 4.1 11.4 6.4
Mauritius 1.6 6.4 1693.7 5064.5 5.1 4.1 42.0 8.8
Mexico 417.5 830.3 6108.1 7637.9 2.6 0.8 26.3 4.0
Russia 686.6 921.9 4938.5 6520.6 1.1 1.0 2.4 8.8
Seychelles 0.3 0.7 4845.9 8014.9 3.0 1.9 13.6 5.3
South Africa 134.5 245.2 4599.1 5070.1 2.2 0.4 13.7 6.1
Source: USDA (2010), Economic Research Service, International Macroeconomic Data Set, UN database, (2010)
According to Table 2-7, the growth in exports in the Seychelles, Mauritius, China,
Russia, India and Brazil also supported economic growth in 2007. Furthermore, the
improvement in fixed capital formation indicates that investment in these economies has
improved. Investment (gross fixed capital formation) improved in China, India and
Mauritius during the period between 1980 and 2007, and this increase should help
sustain the high economic growth in these countries. Regarding the relationship between
FDI flow and GDP, in almost thirty years, 9 of the 10 countries have witnessed an
increase. Not only did these countries provide incentives for foreign investors, their
reform packages have helped in the various types of capital entering the countries.
Table 2-7: International trade and investment
Country Exports (%)
Investment
(gross fixed
capital
formation)
FDI as a
percent of GDP Exports (%)
Investment
(gross fixed
capital
formation)
FDI as a
percent of GDP
1980 2007
Botswana 53.1 34.5 10.5 47.5 23.9 5.2
Brazil 9.1 22.9 0.8 13.4 17.4 2.5
China 10.7 29.1 0.0 38.4 39.1 4.6
Gabon 64.7 26.7 0.7 62.3 25.9 2.3
India 6.2 18.4 0.0 20.4 32.7 2.1
Mauritius 51.0 23.2 0.1 56.8 24.3 4.4
Mexico 10.7 24.8 1.1 27.9 21.1 2.9
Russiaa 21.9 31.8 0.3 30.2 21.0 4.2
Seychelles 68.0 36.5 6.5 97.4 29.7 24.5
South Africa 35.4 25.9 -0.0 31.3 20.2 2.0
Source: World Bank, World Development Indicators, (September edn, 2011), UNCTAD, World Investment Report,
(2008).
Note: a implies data for Russia is for 1989.

36
Table 2-8 presents other socio-economic data on population, population growth,
mortality rate, life expectancy, literacy rate and labour force. These indicators for the
countries will help in identifying the linkages between socio-economic indicators and
achievement of health goals. In 1980, the average population in the BRIMC countries
was approximately 400 million, with the highest population recorded in China (687
million) and grew to 576 million in 2007, with an annual growth of approximately 1.4
percent. In the SSA countries, the population grew on average 2 percent a year from 30
million in 1980 to 53 million in 2007. The infant mortality rate per thousand live births
was 62 in the BRIMCs in 1980, and fell to 24 in 2007. Relative to the international goal
of reducing infant mortality to 22 per thousand live births by 2015, childhood mortality
seemed to have dropped in SSA. The level was estimated at an average of 52 per
thousand live births in 1980, while in 2007, it was estimated as 34 per thousand live
births. The implication of this is that many SSA countries seem to be working towards
reducing infant mortality by 2015. The average life expectancy at birth in 2007 was 70.5
years in the BRIMCs, while in SSA it was 62 years.
In 1980, there were, on average, 78.8 percent of the population in the BRIMCs that
were literate, compared to 66.8 in SSA. As per the latest information, the literacy rate
for BRIMC adults (15 years and older) increased from 78.8 percent in 1980, to 91.4
percent in 2007. A similar story was found in the SSA region, where adult literacy
increased from 66.8 percent in 1980 to 88.7 percent in 2007. The average labour force
total doubled in most of the BRIMC countries with the exception of Russia which
decreased from 76.7 million in 1980 to 76.1 million in 2007. Many factors including
labour force participation, aging and demographic change account for this decline. In
1980, the Russian total labour force participation rate, as a percentage of total
population aged 15 years and above, was 70 percent, while this had dropped to 63
percent in 2007 (World Bank, 2011). During the same period, the SSA countries also
witnessed an increase in total labour force, from 2 million in 1980 to approximately 4
million in 2007.
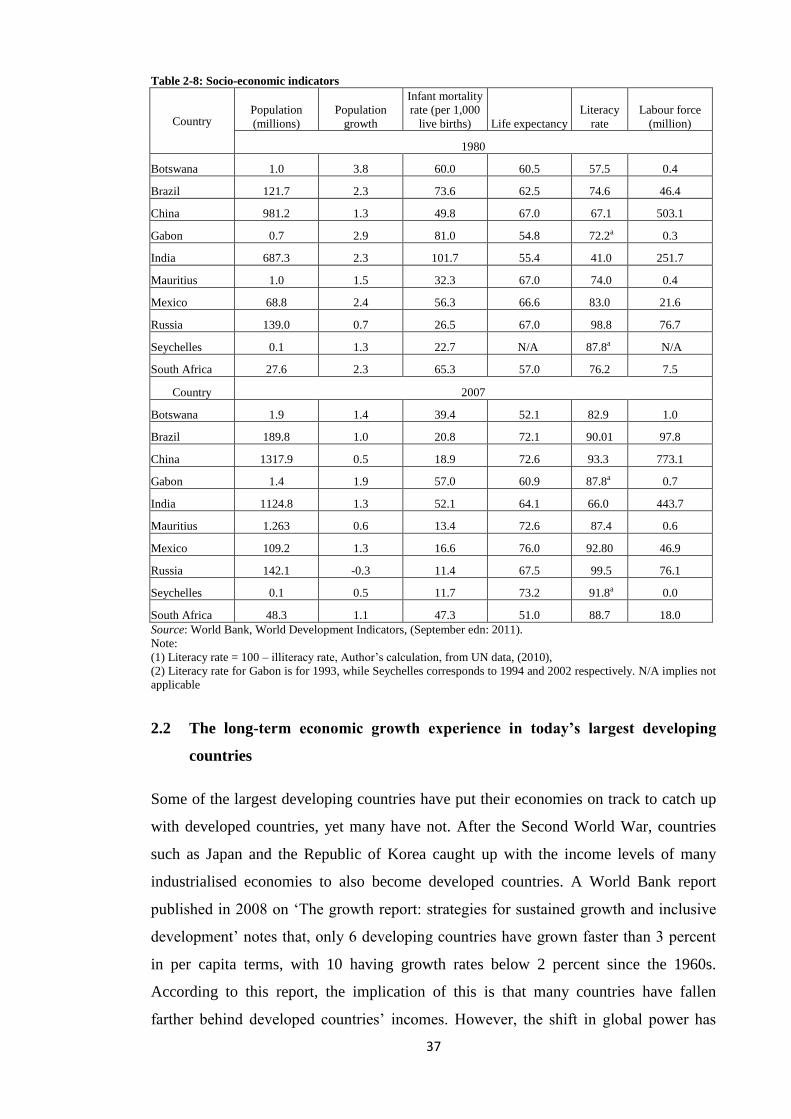
37
Table 2-8: Socio-economic indicators
Country Population
(millions)
Population
growth
Infant mortality
rate (per 1,000
live births) Life expectancy
Literacy
rate
Labour force
(million)
1980
Botswana 1.0 3.8 60.0 60.5 57.5 0.4
Brazil 121.7 2.3 73.6 62.5 74.6 46.4
China 981.2 1.3 49.8 67.0 67.1 503.1
Gabon 0.7 2.9 81.0 54.8 72.2a 0.3
India 687.3 2.3 101.7 55.4 41.0 251.7
Mauritius 1.0 1.5 32.3 67.0 74.0 0.4
Mexico 68.8 2.4 56.3 66.6 83.0 21.6
Russia 139.0 0.7 26.5 67.0 98.8 76.7
Seychelles 0.1 1.3 22.7 N/A 87.8a N/A
South Africa 27.6 2.3 65.3 57.0 76.2 7.5
Country 2007
Botswana 1.9 1.4 39.4 52.1 82.9 1.0
Brazil 189.8 1.0 20.8 72.1 90.01 97.8
China 1317.9 0.5 18.9 72.6 93.3 773.1
Gabon 1.4 1.9 57.0 60.9 87.8a 0.7
India 1124.8 1.3 52.1 64.1 66.0 443.7
Mauritius 1.263 0.6 13.4 72.6 87.4 0.6
Mexico 109.2 1.3 16.6 76.0 92.80 46.9
Russia 142.1 -0.3 11.4 67.5 99.5 76.1
Seychelles 0.1 0.5 11.7 73.2 91.8a 0.0
South Africa 48.3 1.1 47.3 51.0 88.7 18.0
Source: World Bank, World Development Indicators, (September edn: 2011).
Note:
(1) Literacy rate = 100 – illiteracy rate, Author’s calculation, from UN data, (2010),
(2) Literacy rate for Gabon is for 1993, while Seychelles corresponds to 1994 and 2002 respectively. N/A implies not
applicable
2.2 The long-term economic growth experience in today’s largest developing
countries
Some of the largest developing countries have put their economies on track to catch up
with developed countries, yet many have not. After the Second World War, countries
such as Japan and the Republic of Korea caught up with the income levels of many
industrialised economies to also become developed countries. A World Bank report
published in 2008 on ‘The growth report: strategies for sustained growth and inclusive
development’ notes that, only 6 developing countries have grown faster than 3 percent
in per capita terms, with 10 having growth rates below 2 percent since the 1960s.
According to this report, the implication of this is that many countries have fallen
farther behind developed countries’ incomes. However, the shift in global power has
38
moved to the emerging economies of the BRIMCs in the last two decades. These
countries account for approximately 54 percent of developing countries GDP. Although
the growth performance of these 5 countries has been uneven (as shown in Table 2-5
and 2-6), their contribution to the world economy has been driven by the growth in
China.
For economic growth to be sustainable and to catch up with the industrialised
economies, many developing countries needed to grow at a higher rate. Hence, in the
mid-1980s and early 1990s, several developing countries, including the BRIMCs and
five of the fastest growing SSA countries, embarked upon several different economic
and financial reforms which focused mainly on integration into the global economy.
The purpose of this chapter, thus, is to examine the growth experiences of these
countries and to examine whether the SSA countries can achieve some if not all the
MDGs by 2015. The analysis sheds light on the strengths and weaknesses of the growth
in these countries by identifying similarities and differences with other countries and
also assesses their economic performance on that comparative basis.
2.2.1 Brazil
The economic history of Brazil covers various events tracing changes in the economy.
Through the 1980s and 1990s, the Brazilian economy suffered low and volatile growth
where the economy suffered from rampant inflation, high real interest rates and balance
of payment problems. Between 1980 and 2007, the average growth of GDP was 2.7
percent compared to the 8.7 percent obtained between 1970 and 1979. During this
period, Brazil introduced a series of economic reforms including import substitution
industrialisation (ISI).
Between 1981 and 1992, Brazil’s GDP increased at an average annual rate of 1.9
percent and the per capita income declined 0.1 percent. Physical capital, that is gross
fixed capital formation as a ratio of GDP, fell from 22.1 to 18 percent, partly due to the
fiscal crisis and the loss of public sector investment capacity. According to economists,
the 1980s was referred to as the ‘lost decade’ for Latin American countries. In Brazil for
example, the 1980s was plagued by chronic inflation problems as a result of expansion
of the money supply which government used in financing investment. Inflation was as
high as 1430 percent in 1989 and remained a problem in the 1990s with the average rate
of 1667 percent between 1990 and 1994.In the beginning of the 1990s, the Washington
Consensus recommendations were spread out across all developing countries, including

39
Brazil. Following this, Brazil developed and implemented several different strategies
and economic policies, including trade and capital liberalisation, privatisation, flexible
exchange rates and the shock stabilisation programs referred to as the ‘Plano Real’ in
mid-1994. These plans aimed at removing restrictions on free enterprise, increasing
competition and privatising public enterprises. The plan brought stability and enabled
the country to sustain economic growth through the coming decade. In the present
decade, Brazil has steadily improved its macroeconomic stability, building up foreign
reserves and reducing its debt profile by shifting debt burden towards real dominated
and domestically held instruments.
2.2.2 Russia
Since the fall of the Union of Soviet Socialist Republics (USSR) in 1991, Russia has
gone through a series of economic reforms in order to promote economic development.
Russia’s long-term development prospects are characterised by their dependence on the
extraction of natural resources. Russia’s recent rapid expansion has contributed to
improved living standards and a narrowing of the income gap, in comparison to other
emerging markets and the Euro area (Beck et al., 2007).
Russia entered the 1990s with a huge production structure inherited from the Soviet
Union. After its collapse, the Russian economy underwent tremendous strain as it
liberalised both its trade and production systems in 1992. This was to accommodate
raising government revenues and the government’s dependence on short-term
borrowing to finance budget deficits. Although Russia reached a high level of economic
openness,17
the reforms did not produce the expected results and the economy witnessed
a negative growth in the first half of the 1990s (Aghion and Blanchard, 1998) leading to
a major financial crisis in 1998. During this period, the government devalued the Ruble
and inflation reached approximately 85 percent. But, following implementation of
several economic reforms and tight fiscal policy, both inflation and the exchange rate
stabilised. Household consumption and fixed capital investments both grew by
approximately 10 percent per year, replacing the role of exports as the main drivers of
demand. World oil prices rapidly rose during 1999 and 2000, further contributing to the
recovery of the Russian economy. In addition, during the period between 1998 and
2007, GDP grew at an average of approximately 6.7 percent.
17 According to the World Bank (2011), in 1992, trade as a percent of GDP reached 111 percent.

40
Investment also played an important role in Russia’s take off in growth. Foreign direct
investment (FDI) contributed approximately 4.2 percent to GDP in 2007, up from
approximately 0.3 percent in 1992. In absolute terms, it grew at an annual average of
25.7 percent over fifteen years, from US $1.2 billion in 1980 to over US $55 billion in
2007. Although international trade played a remarkable role in the growth of the
Russian economy during the 1990s, it has, however, suffered a reduction in the current
decade, reaching 52 percent in 2007.
In terms of population, the size, age and literacy rate seem to work as an advantage in
promoting sustained growth. However, the distribution of employment in the different
sectors of the economy seems to be typical of developing economies. For example, in
1990, the agriculture and industry sectors employed 54 percent of the work force and
the services sector employed 41 percent. By contrast, in a more industrialised county
like the United States, for example, 29.3 percent of the labour force is in the agriculture
and industry sectors, and 70.7 percent is in the services sector. However, in the present
day (2007), a series of changes have occurred in the composition of employment in the
various sectors of the economy, reflecting a configuration of modern industrialised
economies, partly due to the transition of the Russian economy as among one of the
fastest growth economies in the world. The service sector now employs approximately
62 percent of the labour force and the agriculture and industry sectors now employs
approximately 38 percent of the labour force.
2.2.3 India
The Indian economy has faced many different economic reform packages to become
one of the fastest growing economies in recent years. The process of economic growth
in India has been mainly caused by improvements in labour productivity (Alessandrini
and Buccellato, 2008). Following the implementation of an import substitution strategy,
which focused on the restriction of all goods and services coming into the country,
economic growth in India improved in the 1980s, after the liberalisation era. The
economy grew at an average annual rate of 4.6 percent in the period 1980 to 1989. Both
the agriculture and industry sectors contributed an average of 58 percent to GDP
compared with 42 percent in the services sector in these nine years.
The loss of India’s major trading partner (the USSR) in the 1990s, led to a series of
political and social instabilities, and India faced a severe balance of payments crisis.
Therefore, India turned to the International Monetary Fund IMF for assistance.

41
Following the recommendation from the Washington Consensus in 1994, India
embarked upon various economic reform programs including a plan to move the
economy to a more market-oriented one, through reducing the regulations and public
sector share in the economy. India’s growth rate averaged 7.5 percent during the period
1994 to 1996. Unfortunately, the high growth was short lived as a result of the 1997
East Asian financial crisis’ effect on India’s exchange rate.
In the second half of the 1990s, the services sector began to contribute more to GDP
resulting in the rise in telecommunication and information technology. Recent
liberalisation programs, in particular the import substitution policy, led to the
development of a broad industrial base with the state owned enterprises playing a major
role in heavy industry. Throughout the 1990s, the share of industry to India’s GDP
remained almost constant at 26 percent. By 2007, the share of services in GDP had risen
to 53 percent from an average of 46 percent in the 1990s. India benefits from its large
population, making it a potential consumer market and relevant players in the world
economy.
2.2.4 Mexico
The economic history of Mexico is quite similar to that of many developing Latin
American countries. In the early 20th
century, Mexico experienced macroeconomic
problems due to international price fluctuations of primary goods, and its main
economic and financial resources. In the 1930s, there was an intense process of
nationalisation of the most important natural resources, such as crude oil. During the
1940s, it was evident that the country required an industrialisation policy that could
reduce its dependency on agricultural produce. Although protectionist policies were
widespread in Latin America, the Mexican government considered that an Import
Substitution Industrialisation (ISI) policy would be the most viable strategy that could
lead to economic development. Thus, manufacturing produced Mexico’s main exports
contributing approximately 50 percent to GDP.
Mexico’s economic performance was quite impressive during the 1960s and some of the
1970s. After the discovery of oil in 1979, the government promoted industrial growth
by financing public expenditure with the money realised from exporting the oil. During
the 1980s, oil contributed approximately 75 percent to Mexico’s foreign exchange
earnings, but the oil glut in the mid-1980s deflated petroleum prices and led to Mexico’s
worst recession in decades. During this period, Mexico accumulated huge foreign debt,

42
large government deficit and inflation increased. By mid-1982, Mexico declared its
inability to service foreign debt and this sparked a global crisis leading to emerging
markets bring cut off from international capital. In order to stem capital flight and
correct the imbalance, President Lopez Portillo devalued the peso and nationalised
private banks. While ISI had produced an era of industrialisation in previous decades,
by the 1980s, it was evident that the extended protection had produced an uncompetitive
industrial sector with low productivity gains. Thus, in 1986, Mexico signed the General
Agreement on Tariffs and Trade (GATT) moving them towards openness and world
economic integration.
Soon after President Carlos Salinas de Gortari began his term in 1988, the government
took steps to restructure the failing economy by introducing monetary and fiscal
discipline, and a wage and price stabilisation program, in order to control the rising
inflation. The new policies seemed to work as inflation reduced from over 132 percent
in 1987 to 27 percent in 1991. In fact, the evidence from economic indicators show that
real GDP growth rate went from 1.9 percent in 1987 to 5.1 percent in 1990. In addition,
the country gradually decreased its dependence on petroleum exports that accounted for
34 percent of 1990s exports down from 75 percent in GDP in 1982. Whilst the policies
introduced by Salinas were able to bring inflation down, growth averaged only 2.8
percent a year. Moreover, by fixing the exchange rate, the peso became rapidly
overvalued while consumer spending increased, causing the current account deficit to
reach 7 percent of GDP in 1994. During the first quarter of 1996, the economy started to
emerge from its recession and contracted by a modest 1 percent. The Mexican
government recorded a strong growth of 7 percent for the second quarter of the same
year.
Mexico is considered one of the better managed emerging economies and has enjoyed
relatively stable economic growth during the current decade, with an average annual
growth rate of 2.4 percent between 2000 and 2007. Total employment in Mexico, in
2007, was 60 percent and unemployment rate dropped to 3.4 percent. Compared with
other BRIMC countries, Mexico has the lowest rate of employed individuals as a
percent of the population.
2.2.5 China
China has sustained an impressively high GDP per capita growth spanning more than
three decades, which is supported by a decline in population growth rate. The Chinese

43
economic take off started with economic reforms in the early 1980s. The first part of
these Chinese economic reforms involved implementing an export-led growth pattern
that involves labour shifts from agriculture to industry and services. As a result, the
share of agriculture in China’s GDP decreased from 28 percent in 1985 to 20 percent in
1995, while industry and services increased from 43 and 29 percent in 1985 to 47 and
33 percent in 1995, respectively.
China’s trade and investment reforms and incentives have led to a surge in FDI since
the beginning of the 1990s. The data obtained from the World Bank (2011), show that
both trade and FDI have contributed a lot to the development of the Chinese economy.
For example, China’s growth in foreign trade averaged 14 percent during the 1990s, and
by 2007, the country exported nearly US $1.2 trillion in goods, resulting in a trade
surplus of US $340 billion. In the same year, China recorded a surplus in current
account balance of US $354 billion, as opposed to the deficit of US $11 billion recorded
in 1993.
The Chinese government implemented several economic reforms in the 1990s, in order
to tackle inflation, reform the state owned enterprises and integrate with the
international economy. During this period, China went through a slow and progressive
internationalisation of the economy by selectively introducing elements of the market
economy. According to the World Bank (2011), China’s FDI in absolute terms
increased more than three-fold from US $42 billion in 1997 to US $143 billion in 2007,
making china one of the world’s largest destinations of FDI.
The large population in China makes it a consumer market for the global economy.
However, there are various problems associated with having such a large population
size. China suffered severe food supply problems and starvation in the late 19950s and
with the increasing decline in the contribution of the agricultural sector to GDP since
the mid-1990s, the government introduced the ‘one child policy’ so as to control
population growth. The implementation of this policy has led to the reduction of
population growth from 1.3 percent in 1980 to 0.5 percent in 2007 (World Bank, 2011).
The Chinese government has strongly promoted literacy and education of the whole
population because improving the education and skills levels of Chinese workers could
make the economy more productive (Banister et al., 2010). Focus on these basic goals
has resulted in an increase in the number of literate persons in China, from 66 percent in
1982 to approximately 93 percent in 2007.

44
2.3 Long-term economic growth experience in five of the fast growing SSA
countries
After Asia, Africa is the world’s second largest and most populous continent. It is home
to 54 countries and is divided into five regions (Northern, Western, Central (Middle),
Eastern and Southern Africa) by the United Nations (UN) or two regions (North and
Sub-Saharan Africa) geographically. Africa is also one of the poorest continents in the
world. The Sub-Saharan African (SSA) region alone comprises of 48 countries
including the recently formed South Sudan. The World Bank lists 34 of these countries
as the world’s poorest. SSA is the only part of the world experiencing absolute declines
in virtually all economic development indicators (Lubeck 1992: 520)18
.
Across the region, millions of people do not have access to food and safe drinking
water, 75 percent of the people lack access to proper sanitation, and every year,
approximately two million children die in the first twelve months of their lives (World
Bank, 2010). Moreover, Friedman (2006: 400) notes that as of 2001, approximately 313
million people, in the SSA, lived on less than US $1 per day. In fact, a study by the
United Nations Development Programme (UNDP 2006: 269) confirmed that almost half
of the population of the SSA region live on less than US $1 per day and this number is
expected to increase to at least 340 million people by 2015. Furthermore, the human
development indicator (HDI) reveals that, since the 1990s, the level of human
development have declined in many SSA countries, leaving the region the poorest in the
world.
With respect to economic performance, many SSA countries witnessed economic
stagnation and decline in the last two decades. Compared with growths recorded in the
1960s, the disappointing economic performance in the early 1980s was characterised by
a slowdown in GDP growth and decreasing investment (Yago and Morgan, 2008).
Many economists link the poor economic performance of the African continent as a
whole and, indeed, SSA countries to several factors. For example, while Easterly and
Levine (1997) claim that ethnic diversity and the geographical location of Africa are to
blame for its poor performance, others stress that the underdeveloped market
institutions, constraints on business environments and lack of good governance are what
make international trade and investment in Africa costly (Sachs and Warner, 1997;
Goldsmith, A. 1998 and Collier and Gunning, 1994).
18 See Appendix II table 2-13.
45
The region and continent as a whole has been the most economically underdeveloped
region of the world; however, some economies do seem to be improving. Data from the
United States Department of Agriculture (USDA, 2011), reveals that during 2000-2007,
the average growth of GDP per capita was an impressive 2.3 percent. The continent also
witnessed an increase in GDP per capita from US $872 to US $906 in 2006 and 2007
respectively. The following sub-section assesses the growth performance of five of the
fastest growing countries in the SSA region.
2.3.1 Seychelles
The mainstay of the Seychelles’ economy is tourism and tuna fishing, of which tourism
accounts for approximately 30 percent of the labour force. The available data indicates
that approximately 130,000 tourists visited the Seychelles in 2000. This number grew
by 3 percent annually and within seven years reached a total of 161,000. In 1991, tuna
fishing generated approximately US $12.3 million of total exports from the country.
In the 1980s, the government proposed various economic development plans focusing
on a successive five year plan. The 1985-1989 plan focused on tourism, agriculture and
fisheries. During this period, the service sector contributed approximately 78 percent to
GDP. At the same time, the performance of the agricultural sector has been intimately
tied to overall economic growth, in general, as GDP grew at an annual average of 5
percent.
The 1990-1994 plan emphasised the need to attract FDI in order to upgrade hotels and
promote other services, and the need for greater food self-sufficiency. Unfortunately,
the economy rebounded because the objectives of the plan were rendered ineffective
due to the Gulf war between 1991 and 1992. During this time, growth averaged
approximately 3.8 percent and the tourism sector witnessed a small decline. This
prompted the government to reassess their dependence on tourism by promoting the
development of farming, fishing and most recently, the offshore financial sector. They
did this through the establishment of the Seychelles International Business Authority
(SIBA) and the enactment of several important pieces of legislation, such as the
International Corporate Service Providers Act, the International Business Companies
Act, the Securities Act, and the Mutual Funds and Hedge Fund Act. In 1994, the
government introduced the Investment Promotion Act, this emphasised the importance
of promoting a good investment climate through the provision of tax concessions in the
most productive areas of the economy (tourism, agriculture and marine manufacturing).

46
The government also created the Seychelles International Trade Zone (SITZ), whereby
companies could benefit from tax concessions, as well as having recourse to foreign
labour (Seychelles-European community, 2007).
The Seychelles joined the World Trade Organisation (WTO) in 1995, in order to
integrate with the global economy and improve the role of trade in the country. In 2007,
trade contributed up to 226 percent to Seychelles’ GDP, reflecting an annual average of
144 percent between 1980 and 2007. Due to the limited contribution of agriculture, the
Seychelles had few goods to export, including canned tuna, frozen fish, cinnamon bark,
fuel and vanilla, and consequently, they imported approximately 90 percent of their
consumption. This is reflected in their various contributions to GDP, as exports
represented approximately 97 percent of the total Seychelles’ GDP in 2007, while
imports accounted for approximately 129 percent of GDP in the same year. In absolute
terms, Seychelles’ exports were worth roughly US $0.9 billion and its imports worth US
$1.1 billion. The majority of Seychelles’ exports are concentrated towards the European
Union (EU), while South Africa, Saudi Arabia and Singapore are the main import
partners.
In the current decade, inflation has become one of the main problems facing the
Seychelles government because the inflation rate has increased from 0.5 percent in
2002, to 5 percent in 2007. During the early 2000s, the Seychelles experienced a
negative growth rate due to internal and external forces. The economy contracted by
approximately 2 percent in 2001 and 2004, and by 6 percent in 2003, this is compared to
growth rates of 10 percent in 1985 and 12 percent in 1997.
2.3.2 Gabon
Gabon has consistently been one of the top five fastest growing African economies in
the last three decades. This strong economic performance is largely dominated by oil
dependence and the extraction industry, with revenues from oil reaching approximately
46 percent of the government’s budget and 43 percent of GDP. In the 1980s, the
economy grew by approximately 2 percent, while towards the end of the 1980s, GDP
contracted by 17 percent. This poor performance of the economy has been due to poor
fiscal management.
In order to transform the economy, in the 1990s, the government embarked upon
various economic reform programs, including the privatisation of its state owned
companies, and administrative reform programs, including reducing public sector
47
employment. By the mid-1990s, GDP had grown by approximately 5 percent reaching a
high of 7 percent in 1997. With Gabon’s dependence on the extractive industry and in
particular oil, total oil production reached approximately 370 thousand barrels per day
in 1997. In that same year, the industrial sector contributed approximately 54 percent to
the GDP, while the services and agriculture sectors contributed 9 and 7 percent,
respectively. Although the industrial sector seems to be the largest sector in the country,
employment in this sector is quite low.
Although the economic performance of Gabon seems to be weak, an average person in
Gabon earns a per capita income four times that of most other SSA countries. This is
mainly due to the fact that Gabon’s population is not as high, when compared to other
countries like Nigeria. However, as of 2005, approximately 33 percent of the population
still suffered from poverty (World Bank, 2011).
In the current decade, exports still seem to drive Gabon’s economy. While industry
contributed approximately 56 percent to GDP, exports generated approximately US $25
billion, and approximately 61 percent to GDP. As of 2007, Gabon enjoyed a trade
surplus of US $712 million.
2.3.3 South Africa
South Africa’s economy has been shaped by an abundance of natural resources. South
Africa is the world’s largest producer of platinum, gold, chromium and coal, and their
mineral wealth surpasses that of almost any other country in the world, except the
Soviet Union. The mining industry has, therefore, provided the foundation for the
growth of the economy. However, by the early 1980s, South Africa encountered a series
of negative economic annual growths (1982, 1983 and 1985) due to a distortion by
government policies, which excluded some selected South African’s from any
significant participation in the nation’s wealth. Inflation reached its highest at 18.7
percent in 1986, forcing the depreciation of the rand.
During the second half of the 1980s, South Africa’s GDP grew by 2 percent, while per
capita GDP increased by 0.5 percent from US $4100 in 1986, to US $4165 in 1989.
According to the University of Pretoria (1989: 1), the recent growth performance of the
economy has proven that even though South Africa has achieved a period of political
stability, it does not necessarily follow that the long-term growth rate will rise to a level
that will permit a steady improvement in per capita income. By the early 1990s, South
Africa experienced slow and constant growth, and despite the vast mineral wealth, the

48
weaknesses in the economy were becoming increasingly apparent. Some segments of
the population were poorer, with approximately 41 percent of the population living on
$2 a day. The recovery of the economy strengthened in 1994 when GDP grew by 2.2
percent to US $158 billion from US $151 billion in 1992. GDP per capita also increased
to US $3798, placing South Africa among the World Banks upper middle income
developing countries.
Unemployment contributed to the weak economic performance experienced in South
Africa. The level of unemployment was high and averaged 29 percent between 2000
and 2004, as industries concentrated on capital intensive investments to reduce labour
costs (EIU, 2005). Growth in GDP declined from 3.6 percent in 2002, to 2.8 percent in
2003, due to this high rate of unemployment. In 2004, the appreciation of the rand and
low inflation rate fostered high domestic demand and low interest rates, leading to a
GDP growth of approximately 3.8 percent (OECD, 2005). Between 2006 and 2007,
strong demand and favourable external environments increased the GDP growth to 4
percent. South Africa remains one of the strongest nations in Southern Africa despite its
slow economic growth in the past few years. Its largest trading partner is Europe and in
2004, trade with Europe accounted for 35 percent of total exports, China accounted for
only 2.5 percent and Africa, 13 percent. South Africa witnessed a trade deficit in 2004,
due to a slight increase in the demand for imported goods, even though there was also
an increase in exports (OECD, 2005).
While FDI inflow to South Africa is declining, the country is the main source of
outward FDI in Africa (OECD, 2005). The nations’ bilateral agreements are mostly
between the Southern African Customs Union (SACU) members, Southern African
Development Community (SADC) and the US. Studies suggest that in order to build a
competitive environment and reduce unemployment and poverty, South Africa needs to
promote the diversification of exports, and encourage domestic and foreign investments.
2.3.4 Mauritius
The history of the economy of Mauritius reflects various distinct stages of economic
development. From the time of independence until now, the Mauritian economy has
undergone remarkable transformations. The economy is based on the exportation of
sugar, textiles, tourism and financial services. Since the 1970s, Mauritius has recorded
very high growth rates and increased human development marked by the governments’
determination and commitment to diversifying the economy, in order to provide better

49
paying jobs for the population. These changes occurred following a combination of
good macroeconomic policies, a strong institutional framework and a favourable
regulatory environment. The promotion of tourism, the beginning of the sugar
preferences and the export preference zones (EPZs) in the 1970s and 1980s, helped the
government to succeed in transforming their economy and laying the foundation for
stable growth in the future.
Both economic and socio-economic indicators reveal that the economy had improved
during this time. Between 1970 and 1977, approximately 64,000 jobs were created; real
GDP growth averaged approximately 5.3 percent since 1970 and per capita GDP has
also been strong in the last thirty years. However, by the end of the 1970s, the economic
situation deteriorated with the rise in oil prices, the sugar boom ended and the balance
of payment deficits steadily increased. Imports grew faster than exports, and by 1979
the deficit amounted to over $110 million.
By the 1980s, several macroeconomic reforms were put in place in response to the
growing balance of payment deficit and the fiscal troubles. With this in place, the
economy experienced steady growth, low inflation, high employment and increased
domestic savings. The EPZ came into its own, surpassing sugar as the principal export-
earning sector and employing more workers than the sugar industry and government
combined. GDP, meanwhile, increased more than six-fold between 1970 and 2007,
from less than $1 million, to more than $6.4 billion in 2007, and even better, the
standard of living also improved. GDP per capita increased approximately five-fold
between 1981 and 2007 from less than $2000 to nearly $6000.
By the end of the 1980s and the beginning of the 1990s, the economy slowed down,
nevertheless, the government proposed various economic development plans in order to
diversify the economy and to promote long-term economic growth. Several
development goals were introduced including: modernising sugar, diversifying the
manufacturing infrastructure, and diversifying services, agriculture and tourism. In
addition, because of the threats to agriculture, as a result of Europe’s common
agricultural policy, and the potential effects on textiles of the General Agreement on
Tariffs and Trade (GATT), Mauritius also hopes to transform itself into a centre for
offshore banking and financial services.

50
The development plans seemed to be successful and allowed the country to move from
sugar to textiles, which is a broader service economy. During the late 1990s and 2000s,
imports and exports boomed, reaching an average of approximately 62 percent of GDP.
The dependence of the county on trade-led development helped to achieve a respectable
level of export performance. In the current decade, GDP grew by 4 percent from
approximately US $4 billion in 2000, to US $6 in 2007. GDP per capita averaged US
$4670 between the same period, and inflation decreased by approximately 2.5 percent,
from 13 percent in 1990, to approximately 8 percent in 2007. Also by 2007, agriculture
was now contributing less to GDP, when compared to the services sector.
Overall, the effects of these economic reforms have enabled Mauritius to become one of
the most competitive countries in SSA.
2.3.5 Botswana
Botswana is known as one of the best performing economies in Africa and one of the
most inspiring success stories on the continent (EIU, 2005). The experience of
Botswana provides a suitable and appropriate basis for an analysis of the recent
economic successes experienced in SSA, during the period 2000-2007. During the
1980s and the 1990s, annual growth in GDP per capita averaged approximately 7
percent in Botswana. However, by the 1990s, this declined to approximately 3 percent.
In the same vein, the country had periods of sustained high unemployment of
approximately 20 percent for most of the 1990s and early parts of the new millennium.
Unemployment has, however, now started to decline, being estimated at 17.6 percent in
2005-06 (CSO, 2006, Preliminary Results from the LFS). Between 2002 and 2003,
Botswana was one of the top performing economies in SSA with a GDP growth of 6.7
percent. The economy is mostly dependent on the mining and export of diamonds,
which contributed more than 30 percent to total GDP, 80 percent of the export and
approximately 50 percent to government revenue (EIU, 2005). Between 2003 and 2004,
GDP growth was 5.7 percent, coming mostly from strong growth in the non-mining
industry (8.5 percent).
In terms of international trade and external finance, Botswana is committed to trade
liberalisation, implying that it is looking to become more integrated with the global
economy. The country has an open market policy and it is currently an active member
of various multilateral, bilateral and regional trade arrangements including the
EU/Republic of South Africa Free Trade Agreement. The majority of Botswana’s

51
export is concentrated on a few commodities (minerals), which are mostly exported to
Europe. The nation’s major trading partners include the EU, South Africa and
Zimbabwe.
Another economic development strategy used by the government was to increase its
level of FDI inflow. In 2001, the majority of FDI went into the mining sector (77
percent). The economy has a trade policy of promoting a sustainable and diversified
economy beyond minerals and diamonds. Since 2002, Botswana officially became a
beneficiary of the Africa Growth and Opportunity Act. In 2007, trade contributed
approximately 31 percent to GDP, and during the same year, FDI also contributed 2
percent to GDP. It seems like exports drives Botswana’s economy, owing to the
contribution of FDI in the mining sector and the exports of minerals.
From the foregoing discussion, the main challenges posed by the prevailing economic
development framework, in the SSA integration agenda, is to overcome the
underdeveloped structure of the regional economy, improve macroeconomic
performance, eradication of poverty, and the establishment of a sustainable economic
development path. It is also important to improve political and corporate governance,
and thus, unlock the untapped potential that lies in both the region's human and natural
resources.
2.4 Sustainable economic growth scenarios in BRIMCs: implications for
SSA countries
In 2000, United Nations launched the Millennium Development Goals (MDGs) to be
achieved by 2015. To meet these goals, the target is to achieve an average real GDP
growth of 7 percent by 2015. Table 2-11 provides an assessment of how far countries in
the region are from the target. The top five performers of the region during 2000-2007
are Angola with an average real GDP growth of 11.5 percent, Chad (8.9 percent),
Mozambique (8 percent), Sudan (7.5 percent) and Mauritania (7.3 percent). Aside from
the top five performers, the table shows that the selected SSA countries are still far from
reaching the growth target of 7 percent; Seychelles have an average real GDP growth of
(1.3 percent), Gabon (2.3 percent), South Africa (4 percent), Mauritius (5 percent) and
Botswana (4.7 percent). Countries in the region are still facing the challenge of not
achieving the MDGs and need therefore to accelerate their growth. To achieve these
goals requires a sustainable rate of economic growth. In addition, to obtain the
developed country status, SSA needs to achieve rapid economic growth as this is

52
essential to catch up with industrial countries. As such, comparing SSA’s economic
performance against that of countries of similar or greater degree of development can
provide a baseline from which to identify the development gap that the country’s
authorities face in designing their policies.
This section examines the implication of the economic performance of the BRIMCs for
SSA countries and asks: to what extent can lessons from BRIMC countries
achievements be applied to other developing economies, particularly SSA countries?
Following series of policy reforms, the details from the five case studies in the SSA
region suggest that Africa’s economic performance has improved over the last decade.
But, can this growth be sustained? To this end, I examine what the SSA would look like
in 2050. To do this, I rely on different growth scenarios, where I posit a set of
assumptions about growth rate of GDP per capita and use benchmarking tools to relate
these growths to economic outcomes and produce projections that are presumed to be
part of a range of plausible outcomes.19
In projecting economic growth, previous studies20
mainly base their work on the Solow
(1956) growth model framework. The basis of the Solow model is a production function
that relates output to the input of capital and labour. The production function also
contains a productivity index referred to as “technical change” or “technological
growth”. An increase in technological growth implies a higher output even for an
unchanged input of capital and labour. In the model, it is assumed that the production
function is characterised by constant returns to scale. This implies that a doubling of
both capital and labour inputs will lead to no more or less than a doubling of output. The
Solow growth model is usually represented by a Cobb-Douglas production function
which takes the form:
1Y AK L (2.1)
where, Y is GDP (output), C is the input of capital, L is the total labour input (number
of workers) A is the technological change and α is positive and < 1.
According to Solow (1956), output per worker is one of the most important variables.
This is because output per worker and the share of workers in the population determines
GDP per capita.
19 This is used to help understand long term implication of a country’s or region’s hypothetic growth path from a
benchmark point of view. The methodology used in this analysis is similar to World Banks’ Income Benchmark tool,
<siteresources.worldbank.org/.../468980.../IncomeBenchmarkTool.xls> accessed [26th November, 2011]. 20
Wilson and Purushothaman (2003), ‘Dreaming with BRICs: The Path to 2050’, Hawksworth (2006), ‘The World
in 2050: How big will the major emerging market economies get and how can the OECD compete? and Hawksworth
and Cookson (2008), ‘The World in 2050: Beyond the BRICs: a broader look at emerging market growth prospects.’
53
This can be obtained by dividing equation (2.1) by L:
11Y AK L KA
L L L
(2.2)
Equation (2.2) helps us to explain output per worker and hence, GDP per capita income
can be increased.
The model assumes that sustained GDP growth is driven by the following:
1. Growth in the physical capital stock, which is determined by new capital
investment less depreciation of the existing one;
2. Growth in labour force, (based on the latest available UN projection of working
age population growth);
3. Growth in quality of labour ‘human capital’ which is assumed to be related to
current and projected average education levels in the workforce; and
4. Technological progress, which drives improvement in total factor productivity,
(TFP).
This analysis is different from previous studies (Wilson and Purushothaman, 2003;
Hawksworth, 2006; Hawksworth and Cookson, 2008 and Kharas, 2010) in that it tries
to examine the number of years it would take SSA countries to reach the status of China
(benchmark country) and the rest of the BRIMCs using specific growth rates in the
analysed country. Using three different options on periods of historical growth rates
(1980-2007, 2000-2007 and 2007) I try to predict economic growth in the short term
(2015), medium term (2025) and long term (2050); using 2007 as the benchmark year. It
is worth noting that the objective of this exercise is not to forecast SSA’s economic
growth over the next four decades, rather it is intended to construct a growth scenario
based on hypothetical growth scenarios which is assumed might be attainable and, at the
same time sustainable in the long run. In addition, it is important to note that the model
is only intended to make projections for long term or potential growth. It is made under
the assumptions that markets stay open and macroeconomic policies remain sound;
additionally, catastrophes-economic, natural, or geopolitical- are assumed not to occur.
For these reasons, the projections represent only an educated assessment of the present
direction of the international economy. In applying this approach, China is used as the
benchmark economy. In previous studies, the US is used as the benchmark economy

54
because it is assumed to be at the ‘global frontier’ in terms of technology and
productivity. However, the use of China as the benchmark economy is mainly driven by
the fact that the study is based on developing countries and China is assumed to be
‘developed’.
2.4.1 The Millennium development goals and Economic growth in SSA countries
I present below the difference in growth performance in the SSA countries during 2000-
2007 period. Figure 2-5 (below) plots the difference in growth performance in the SSA
region. The five top performers of the region for the period 2000-2007, are Angola with
an average real GDP growth of 11.53 percent, Chad (8.88 percent), Mozambique (7.98
percent), Sudan (7.51 percent) and Mauritania (7.25 percent) and the five bottom
performers of the region for the period are Togo (1.95 percent), Central African
Republic (1.49 percent), Seychelles (1.31 percent), Cote d’Ivoire (-0.44 percent) and
Zimbabwe (-6.18 percent).
Following the launch of the MGDs to achieve an average real GDP growth of 7 percent
by 2015, figure 2-6 (below) assesses how far countries in the region are from the target.
The figure plots the performance in terms of average growth rates. It exhibits the largest
and smallest SSA countries over the period 2000-2007. The top five performers of the
region during 2000-2007 are Angola with an average real GDP growth of 9.2 percent,
Mozambique (5.7 percent), Chad (5.5 percent), Sudan (4.9 percent) and Mauritania (4.6
percent); the bottom five performers are Zimbabwe with an average real GDP growth of
-5.9 percent, Cote d’Ivoire (-2.7 percent), Central African Republic (-1.1 percent), Togo
(-0.8 percent) and Niger (-0.4 percent). It comes out from the figure that apart from
Angola, the rest of the countries in the region are still far from reaching the growth
target of 7 percent.

55
Figure 2.5: Average annual growth of real GDP in SSA countries, 2000-2007
Source: ERS/USDA, (2010).
Note: * indicates countries in the sample
11.53
8.88
7.98
7.51
7.25
7.20
7.07
6.74
6.51
6.41
6.41
6.05
5.62
5.42
5.41
5.16
4.94
4.79
4.74
4.71
4.66
4.47
4.23
4.06
3.97
3.95
3.73
3.39
3.29
3.02
2.81
2.25
1.95
1.49
1.31
-0.44
-6.18
Angola
Chad
Mozambique
Sudan
Mauritania
Ethiopia
Burkina Faso
Sierra Leone
Tanzania
Kenya
Cape Verde Islands
Uganda
Nigeria
Mali
Rwanda
Ghana
Mauritius*
Zambia
Benin
Botswana*
Senegal
Gambia
Congo, Republic of (Brazzaville)
Malawi
South Africa*
Cameroon
Madagascar
Niger
Burundi
Lesotho
Swaziland
Gabon*
Togo
Central African Republic
Seychelles*
Cote D'Ivoire
Zimbabwe

56
Figure 2.6: Average annual growth of real GDP per capita in SSA countries, 2000-2007
Source: ERS/USDA, (2010).
Note: * indicates countries in the sample
9.17
5.70
5.52
4.87
4.57
4.43
4.11
3.91
3.80
3.60
3.44
3.28
3.28
3.14
2.98
2.91
2.90
2.70
2.67
2.45
2.07
1.97
1.56
1.43
1.36
1.15
1.07
0.68
0.64
-0.24
-0.36
-0.38
-0.40
-0.81
-1.08
-2.68
-5.89
Angola
Mozambique
Chad
Sudan
Mauritania
Cape Verde Islands
Tanzania
Ethiopia
Mauritius*
Kenya
Burkina Faso
Nigeria
Lesotho
Sierra Leone
Ghana
Botswana*
South Africa*
Rwanda
Uganda
Mali
Zambia
Senegal
Cameroon
Benin
Gambia
Malawi
Congo, Republic of (Brazzaville)
Swaziland
Madagascar
Gabon*
Burundi
Seychelles*
Niger
Togo
Central African Republic
Cote D'Ivoire
Zimbabwe

57
2.4.2 Economic growth simulation
To achieve the MDGs, catch up with developed countries and achieve the developed
country status, it is important for SSA countries to grow at a rapid and sustainable rate.
Thus, this section compares economic growth in the SSA countries with the BRIMCs
based on the assumption that, the BRIMCs are the industrialised countries SSA aims to
catch up with. The BRIMC countries is sub-divided into two, China and rest of
BRIMCs (RoB), where China is our benchmark economy (an economy in which the
SSA aims to be like with respect to their social indicators, quality of life and standard of
living) and the others (economies with a similar level of economic development).
The section starts by comparing economic growth cycle (or business cycle) in the
BRIMCs and SSA countries for the period 1980-2007. Economic cycles are a common
feature of industrialised countries because economic activity moves between periods of
expansion and recession, where expansion is defined as a sequence of years with
positive rates of real GDP growth or real GDP per capita growth, and a recession is a
sequence of years with negative real GDP growth or real GDP per capita growth. An
economic cycle differentiates developed countries from the developing ones (Cashin,
2004). In developed countries for instance, peaks and troughs are less pronounced when
compared to developing countries.

58
Table 2-9: Comparison of real GDP per capita growth in SSA and BRIMCs, 1980-2007
Country Average Growth Min Max Stdev
1980-2007
Botswana 4.21 -1.30 10.57 2.90
Gabon -0.22 -19.17 10.48 5.57
Mauritius 3.60 -11.65 8.92 3.68
Seychelles 1.74 -9.27 10.95 5.16
South Africa 0.52 -4.91 4.18 2.75
SSA 9.85 -2.24 31.86 8.68
Benchmark/RoB
China* 8.72 2.21 13.61 2.83
Brazil 0.92 -6.65 6.52 3.42
India 4.20 -0.93 8.04 2.09
Mexico 1.10 -7.78 6.80 3.56
Russia 1.28 -14.59 10.48 6.33
BRIMC 16.22 0.15 33.10 9.57
1990-2007
Botswana 2.78 -1.30 7.78 2.13
Gabon -0.05 -9.21 4.13 3.39
Mauritius 3.80 0.31 7.88 1.78
Seychelles 2.02 -7.36 10.95 4.65
South Africa 1.13 -4.07 4.18 2.44
SSA 9.68 -1.93 21.21 6.79
Benchmark/RoB
China* 9.06 2.21 12.85 2.50
Brazil 0.98 -5.67 4.29 2.61
India 4.44 -0.93 8.04 2.23
Mexico 1.68 -7.78 5.21 2.95
Russia 0.65 -14.59 10.48 7.90
BRIMC 16.80 0.15 33.10 10.76
2000-2007
Botswana 2.91 0.51 4.86 1.34
Gabon -0.24 -2.40 3.42 1.73
Mauritius 3.80 2.11 7.88 1.99
Seychelles -0.38 -7.36 4.17 4.17
South Africa 2.90 1.58 4.18 0.98
SSA 8.98 1.49 19.17 5.57
Benchmark/RoB
China* 9.33 7.70 11.04 1.28
Brazil 1.99 -0.25 4.29 1.72
India 5.29 2.18 8.04 2.34
Mexico 1.71 -1.47 5.21 2.21
Russia 7.58 5.34 10.48 1.65
BRIMC 25.90 15.13 33.10 6.76
Source: ERS/USDA, (2010). * refers to benchmark economy.

59
Table 2-10: Comparison of real GDP for SSA and BRIMCs, 1980-2007
Country Average Growth Min Max Stdev
1980-2007
Botswana 7.22 1.98 14.12 3.38
Gabon 2.30 -17.15 12.85 5.52
Mauritius 4.67 -10.06 9.74 3.59
Seychelles 2.85 -8.22 11.96 5.19
South Africa 2.43 -2.14 6.62 2.41
SSA 19.47 6.60 42.16 8.86
Benchmark/RoB
China* 9.88 3.80 15.20 2.82
Brazil 2.66 -4.39 9.11 3.44
India 6.13 0.91 9.86 2.05
Mexico 2.87 -6.22 9.23 3.56
Russia 1.36 -14.53 10.00 6.20
BRIMC 22.91 7.67 37.23 8.89
1990-2007
Botswana 5.35 1.98 11.08 2.16
Gabon 2.54 -6.20 6.96 3.31
Mauritius 4.86 1.38 9.06 1.82
Seychelles 3.17 -6.30 11.96 4.66
South Africa 2.54 -2.14 5.14 2.10
SSA 18.45 7.25 30.31 6.89
Benchmark/RoB
China* 9.96 3.80 14.20 2.49
Brazil 2.48 -4.07 5.85 2.60
India 6.27 0.91 9.69 2.19
Mexico 3.19 -6.22 6.77 2.99
Russia 0.40 -14.53 10.00 7.64
BRIMC 22.29 7.67 37.23 9.76
2000-2007
Botswana 4.88 2.76 6.72 1.27
Gabon 2.25 0.00 5.60 1.63
Mauritius 4.77 3.00 9.06 2.09
Seychelles 0.77 -6.30 5.30 4.21
South Africa 3.97 2.74 5.14 0.92
SSA 16.64 8.93 26.37 5.73
Benchmark/RoB
China* 9.91 8.30 11.60 1.25
Brazil 3.40 1.15 5.72 1.71
India 6.98 3.94 9.69 2.31
Mexico 2.96 -0.16 6.60 2.24
Russia 7.02 4.74 10.00 1.67
BRIMC 30.28 19.71 37.23 6.68
Source: ERS/USDA, (2010). * refers to benchmark economy.
Table 2-9 and Table 2-10 (above) shows a comparison of economic growth cycle
between the SSA countries and the benchmark and ‘other’ countries. Among the
countries sampled for the overall period (1980-2007), aside from China, Seychelles and

60
Botswana displayed one of the highest peaks in rates of economic growth (10.95 and
10.57 percent in 1997 and 1988 respectively). Gabon and Mauritius experienced a
sharper trough during the same period. Among the ‘RoB’, only Russia experienced a
sharper trough during same period. Gabon, Mauritius and Russia also experienced the
highest volatility in economic growth (as measured by the standard deviation) among
the countries sampled. The aggregate indicators of economic growth cycles for both the
SSA and the BRIMCs indicate that both regions displayed almost similar economic
growth in the sample period (31.86 and 33.1 in 1988 and 2007 respectively).
In the 1990s, average standard of living in Mauritius, Seychelles and South Africa had
improved considerably. The data shows that Russia experienced economic growth
contraction during the 1990s. In this period, many Asian countries were affected by the
1997 East Asian crisis, including Russia. The data shows that Russia had seven
consecutive years of negative per capita growth before the 1997 crisis, after which it
also witnessed a negative growth in 1998. In terms of output growth, the impact of the
East Asian crisis can be seen in China and Mexico. While Mexico witnessed two years
of negative growth during this period, Brazil had about seven years of negative growth
in the same period with a sequence of negative growth witnessed in the years
immediately after the 1997 crisis. In the Benchmark/RoB group, Russia displayed a
larger standard deviation of real GDP growth during the sample period.
When only the period 2000-2007 is considered, I observe that economic growth in two
of the five SSA countries had improved (Botswana and South Africa).21
In terms of
output growth, only South Africa seemed to have improved when compared to the
previous period. Economic growth in the benchmark/others group also improved in the
period, however, growth in Mexico contracted.
Where the SSA countries faced many years of economic growth contractions, it is
important to note that being able to maintain a stable economy with the absence of sharp
economic contraction during economic cycle has helped China and most of the RoBs to
grow substantially in the last decade. Hence, it is important for SSA countries to
develop policies that would be able to manage if not eradicate long period of sharp
troughs during economic cycle.
21 In absolute terms.
61
2.4.3 Simulating future growth paths of real GDP per capita
A simple simulation exercise is used to emphasise the importance of high, sustainable
economic growth if SSA’s GDP per capita is to converge significantly with that of the
benchmark and RoB countries. For the purpose of this study, economic growth is not
defined in such rigorous terms, but takes any measured increment in total output, over a
period of time, to be acceptable evidence of economic growth.
Four alternative growth scenarios are developed:
1. SSA countries maintain an average growth rate attained during 2000-2007
period (1.15 percent)
2. SSA countries grow at the average growth required to meet the MDGs in 2015
(7 percent)
3. SSA countries grow at the same rate as the benchmark country during 2000-
2007 (9.12 percent).
Figure 2-7 depicts a simple simulation of economic growth pattern in the SSA,
benchmark and the RoB countries. In this scenario, it is assumed that the benchmark
country (China) grows at an average annual rate of 9.12 percent (average growth rate of
China during the 2000-2007 period) ceteris paribus. It is also assumed that the RoBs
grew on an average of 3.14 per annum using the 2000-2007 period. According to the
figure, it will take about 17 years (2024) for the SSA countries to reach a similar level
of economic development with the rest of the BRIMC countries. Convergence would
occur by 2040, implying that SSA it would take at least 33 years for the SSA countries
to attain the size of China.

62
Figure 2.7: Growth pattern for GDP per capita, 2007-2050
Source: Authors’ calculations using data from ERS/USDA, (2010).
Note: It is assumed that exchange rate remains unchanged.
Figure 2-8 shows the second scenario. When SSA countries grow at an annual average
of 7 percent in order to meet the MDGs, the figure indicates that SSA have already
reached the status of the benchmark economy and would even perform better than the
rest of the BRIMCs.
Figure 2.8: Growth pattern of GDP per capita, 2007-2050
Source: Authors’ calculations using data from ERS/USDA, (2010).
Note: It is assumed that exchange rate remains unchanged.
SSA
RoB
Benchmark
-
20
40
60
80
100
120
2007 2015 2020 2025 2030 2035 2040 2045 2050
tho
usa
nd
s, U
S($
)
SSA
RoB Benchmark
0
100
200
300
400
500
600
700
2007 2015 2020 2025 2030 2035 2040 2045 2050
tho
usa
nd
s, U
S($
)

63
In the third scenario, I find that SSA countries seem to have the highest GDP per capita
when compared with benchmark (China) and the RoB countries. According to figure 2-
9, if the SSA’s grew by 9.33 percent per annum, China and the rest of the BRIMCs
would struggle to reach their level of development. Not that a growth of 9.3 percent is
not doable, but our analysis indicates that Angola is the only country in the SSA that
may be able to reach the benchmark status if it continues to grow at 9.2 percent.
Figure 2.9: Growth patterns of GDP per capita, 2007 to 2050
Source: Authors’ calculations using data from ERS/USDA, (2010).
Note: It is assumed that exchange rate remains unchanged.
2.5 Conclusion
The recent economic performance in the BRICs raises a number of questions, and
providing answers to these may promote better economic strategies for other developing
countries looking to also achieve higher economic growth, reduce poverty and obtain
the developed-country status. This chapter uses various socio-economic indicators to
explain the economic performance of five of the fastest growing developing countries
(referred to as BRIMCs), in comparison to one another and the SSA region.
Although the BRIMC countries show many similarities in their economic performance,
these countries follow very different models of economic development. These can be
analysed by considering the choices made by these countries, in terms of economic
reforms. Brazil, Russia, India, Mexico and China all seem to have implemented
different strategies in order to achieve long-term and sustainable growth and their
SSA
RoB Benchmark
0
200
400
600
800
1000
1200
1400
1600
2007 2015 2020 2025 2030 2035 2040 2045 2050
tho
usa
nd
s, U
S($
)

64
timing has played a determinant role in the transformation of their economies. Looking
at the recent policies in the BRIMCs and their development plans for the future, I find
that there are common factors and characteristics for high sustained economic growth.
These include: the size of the economies, diversity, economic openness, large sources of
labour, rising consumption, demographic factors, expenditures, good governance, and
macroeconomic stability.
On the other hand their differences are also reflected in the structure of their economies.
It is suggested that the services sector has played an important role in promoting growth
in Brazil, Russia, India and Mexico, while in China; the key role is played by the
industrial sector. Brazil has a domestically oriented service economy, Russian economy
is heavily dependent on energy and raw material resources, India’s economy is
essentially services-led supported by exports, the Mexican economy is dependent on oil
and foreign capital (remittance) and finally, China’s economic development is driven by
manufacturing exports and investment.
Although there are many challenges hindering the promotion of long-term economic
growth in the SSA region, sustainable economic growth is necessary in order to increase
income, and to also become a significant trade and investment partner in the world
economy. It is also important if the MDGs are to be achieved by 2015. The details from
the five case studies in the SSA region suggest that Africa’s economic performance has
improved over the last decade. According to the discussions above, SSA’s growth and
economic development, over the past decade, has been impressive. The period between
2000 and 2007 brought hope for the future because economic performance improved
substantially. More than 20 SSA countries grew at an annual average of 4 percent, with
an overall real GDP growth rate of 6.6 percent in 2007. For instance, a combination of
political stability, strong institutional frameworks, low levels of corruption, and
favourable regulatory environments has helped lay the foundation for economic growth
in Mauritius. However, its open trade policies have been important in sustaining growth.
However, to further promote development in South Africa, there is a need to improve
the institutional environment in other areas, such as reduced crime rates, more flexible
labour regulations, increased skilled labour, increased economic literacy, and finally, a
business climate conducive to customer satisfaction.
The BRIMC experience provides some lessons for SSA, despite their unique
characteristics. Firstly, SSA countries should increase their level of savings, in order to

65
promote investment. Secondly, SSA countries should attempt to attract FDI. For
instance, many African countries (for example Tanzania and Zambia) fail to attract FDI,
during the decades after independence, due to problems with governance and their
failure to open their doors to new foreign investment. Although Africa is regarded as
poor and potentially unstable, new investment has been concentrated in the natural
resources sector, in particular, the oil industry (Nigeria, Mauritania and Angola).
Thirdly, increasing trade by promoting exports can help improve economic growth.
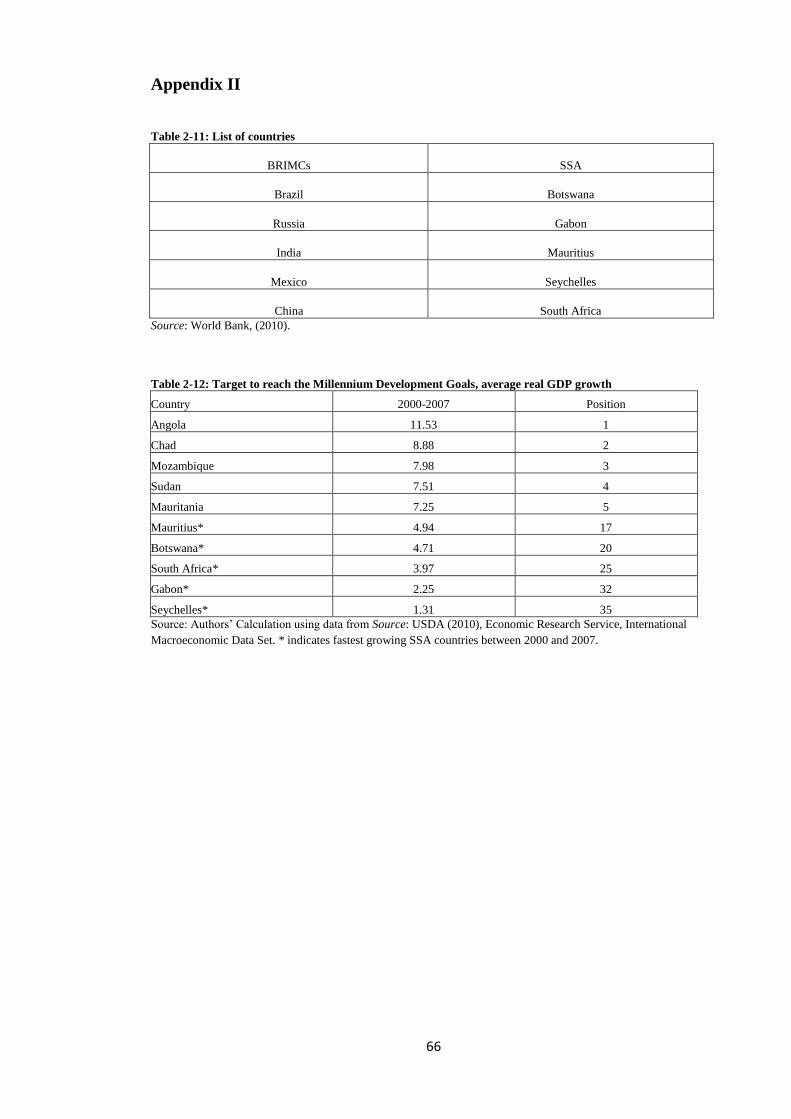
66
Appendix II
Table 2-11: List of countries
BRIMCs SSA
Brazil Botswana
Russia Gabon
India Mauritius
Mexico Seychelles
China South Africa
Source: World Bank, (2010).
Table 2-12: Target to reach the Millennium Development Goals, average real GDP growth
Country 2000-2007 Position
Angola 11.53 1
Chad 8.88 2
Mozambique 7.98 3
Sudan 7.51 4
Mauritania 7.25 5
Mauritius* 4.94 17
Botswana* 4.71 20
South Africa* 3.97 25
Gabon* 2.25 32
Seychelles* 1.31 35
Source: Authors’ Calculation using data from Source: USDA (2010), Economic Research Service, International
Macroeconomic Data Set. * indicates fastest growing SSA countries between 2000 and 2007.
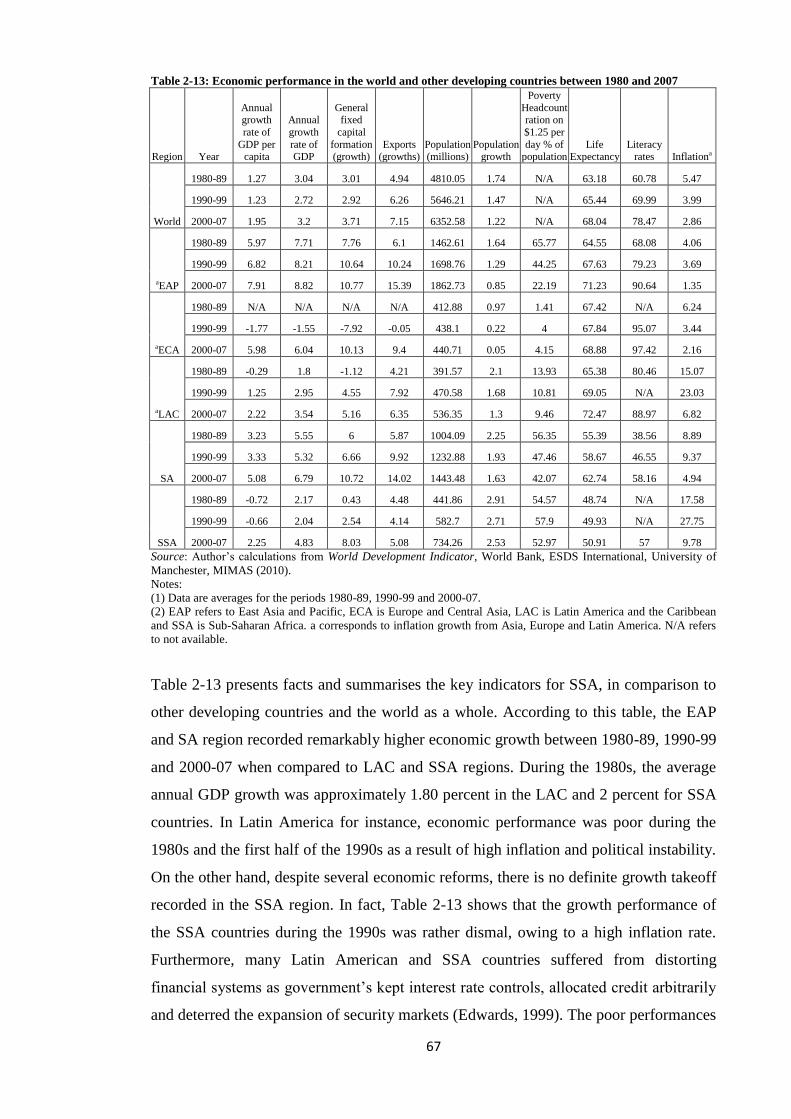
67
Table 2-13: Economic performance in the world and other developing countries between 1980 and 2007
Region Year
Annual growth
rate of
GDP per capita
Annual
growth
rate of GDP
General fixed
capital
formation (growth)
Exports (growths)
Population (millions)
Population growth
Poverty
Headcount ration on
$1.25 per
day % of population
Life Expectancy
Literacy rates Inflationa
World
1980-89 1.27 3.04 3.01 4.94 4810.05 1.74 N/A 63.18 60.78 5.47
1990-99 1.23 2.72 2.92 6.26 5646.21 1.47 N/A 65.44 69.99 3.99
2000-07 1.95 3.2 3.71 7.15 6352.58 1.22 N/A 68.04 78.47 2.86
aEAP
1980-89 5.97 7.71 7.76 6.1 1462.61 1.64 65.77 64.55 68.08 4.06
1990-99 6.82 8.21 10.64 10.24 1698.76 1.29 44.25 67.63 79.23 3.69
2000-07 7.91 8.82 10.77 15.39 1862.73 0.85 22.19 71.23 90.64 1.35
aECA
1980-89 N/A N/A N/A N/A 412.88 0.97 1.41 67.42 N/A 6.24
1990-99 -1.77 -1.55 -7.92 -0.05 438.1 0.22 4 67.84 95.07 3.44
2000-07 5.98 6.04 10.13 9.4 440.71 0.05 4.15 68.88 97.42 2.16
aLAC
1980-89 -0.29 1.8 -1.12 4.21 391.57 2.1 13.93 65.38 80.46 15.07
1990-99 1.25 2.95 4.55 7.92 470.58 1.68 10.81 69.05 N/A 23.03
2000-07 2.22 3.54 5.16 6.35 536.35 1.3 9.46 72.47 88.97 6.82
SA
1980-89 3.23 5.55 6 5.87 1004.09 2.25 56.35 55.39 38.56 8.89
1990-99 3.33 5.32 6.66 9.92 1232.88 1.93 47.46 58.67 46.55 9.37
2000-07 5.08 6.79 10.72 14.02 1443.48 1.63 42.07 62.74 58.16 4.94
SSA
1980-89 -0.72 2.17 0.43 4.48 441.86 2.91 54.57 48.74 N/A 17.58
1990-99 -0.66 2.04 2.54 4.14 582.7 2.71 57.9 49.93 N/A 27.75
2000-07 2.25 4.83 8.03 5.08 734.26 2.53 52.97 50.91 57 9.78
Source: Author’s calculations from World Development Indicator, World Bank, ESDS International, University of
Manchester, MIMAS (2010). Notes:
(1) Data are averages for the periods 1980-89, 1990-99 and 2000-07.
(2) EAP refers to East Asia and Pacific, ECA is Europe and Central Asia, LAC is Latin America and the Caribbean
and SSA is Sub-Saharan Africa. a corresponds to inflation growth from Asia, Europe and Latin America. N/A refers
to not available.
Table 2-13 presents facts and summarises the key indicators for SSA, in comparison to
other developing countries and the world as a whole. According to this table, the EAP
and SA region recorded remarkably higher economic growth between 1980-89, 1990-99
and 2000-07 when compared to LAC and SSA regions. During the 1980s, the average
annual GDP growth was approximately 1.80 percent in the LAC and 2 percent for SSA
countries. In Latin America for instance, economic performance was poor during the
1980s and the first half of the 1990s as a result of high inflation and political instability.
On the other hand, despite several economic reforms, there is no definite growth takeoff
recorded in the SSA region. In fact, Table 2-13 shows that the growth performance of
the SSA countries during the 1990s was rather dismal, owing to a high inflation rate.
Furthermore, many Latin American and SSA countries suffered from distorting
financial systems as government’s kept interest rate controls, allocated credit arbitrarily
and deterred the expansion of security markets (Edwards, 1999). The poor performances

68
of both regions have led many economists to refer to the 1980s as the ‘lost decade’.
Nevertheless, to achieve long-term and sustainable economic growth, it is important to
maintain the ‘right policies’, (World Bank, 2005).

69
3 Financial Sector Development in Emerging and Frontier Markets:
The Role of Financial Liberalisation
Abstract
This chapter empirically investigates the role of financial liberalisation in the form of
official liberalisation dates, capital account opening and financial freedom in the
development of the financial sector of 11 developing countries from Asia, Latin
America and Sub-Saharan Africa (SSA) for the period 1980-2007. The chapter
considers six various financial development indicators that various researchers use to
proxy for the degree of financial development in countries. Overall, the results provide
support for the positive impact of financial liberalisation on financial development. In
particular, the move to financial liberalisation has led to an increase in the credit
provided by the private sector and overall financial development.
The sample is further split into two sub groups: emerging and frontier markets. The
result indicates that the benefits of improving the financial sector is more pronounced in
emerging markets, however, financial liberalisation seems to favour the development of
the stock market in frontier markets. Using several robustness checks, I examine the
sensitivity of these results to alternative measures of trade liberalisation and economic
growth. The result is supportive of the earlier findings that financial liberalisation has
led to financial development in the countries studied. Finally, the chapter examines
whether the simultaneous openness hypothesis holds for the sample of countries.
Contrary to the Rajan and Zingales (RZ) hypothesis, our empirical result suggests that
both financial and trade openness might be substitutes rather than complements. The
main policy lesson that can be drawn from this chapter is that policy makers in both
emerging and frontier markets should focus on developing and implementing policies
that would accommodate a more open capital account.
3.1 Introduction
The relationship between globalisation and financial development remains a significant
interest of the growing empirical literature. The central aspect of globalisation, which
has received considerable attention in recent times, is the world’s trend towards a larger
financial openness. While globalisation refers to ‘the integration of the world through
trade, financial flows, exchange of technology and information, and the movement of
people’ Ouattara (1997:1) and occurs as a result of an increase, diversification and
70
deepening of trade and financial links between countries, financial openness is the
willingness of a country to adopt liberalised policies regarding removal of restrictions
on capital account movement or the presence of government intervention in the
financial sector. In some countries, it also involves the introduction of measures to
attract foreign capital and to reduce the discrimination against foreign financial
institutions operating in domestic markets. In today’s globalised environment,
developing countries are being encouraged to liberalise their financial systems under the
notion that this would lead to greater financial development (Greenidge, Moore and
Reed, 2004). This unprecedented change therefore reached developing countries as
early as the 1980s through the opening of their capital accounts, trade liberalisation,
penetration of foreign banks and the increase in cross border financial flow.
These changes in policy provide an opportunity to assess the issues involved in the
financial liberalisation debate. In the centre of this debate is the question whether
financial liberalisation is a benefit or curse to the development of the financial system.
Indeed globalisation and in particular financial liberalisation has several benefits to
countries as it can induce a more efficient allocation of resources, provide risk
diversification and ease transportation and communication. In turn; it will transform
both the financial and economic sectors by reducing transaction costs, transmitting
information and speeding up financial innovation (Mobolaji, 2008). Consequently, in
countries where access to external finance is limited or poor, it is argued that financial
liberalisation has played a major role in promoting financial development.
Although policy makers understand the importance of foreign participation in the
financial sector, it is widely believed that financial liberalisation (globalisation) may
result in loss of control over the economy and may not be economically beneficial.
Brownbridge and Kirkpatrick (1999) and Tokat (2005) observe that financial
globalisation carries some risks and has led to serious economic and financial crises in
developing countries, particularly in Asia, Russia and Latin America in the 1990s.
However, the proponents of financial liberalisation argue that the financial crisis of
1997-98 occurred as a result of lack of developed financial infrastructure22
and volatile
international capital movements brought about by the globalisation of financial markets
(Goldstein 1998). Furthermore, Stiglitz (2000) and Mishkin (2007) observe that
financial liberalisation promotes financial instability in countries where the financial
22 These include but are not restricted to legal and regulatory framework, supervision, accounting and auditing,
financial corporate governance rule and institution.

71
system is underdeveloped. The literature points out that non-diversified source of
income, weak institutions and pre-existing policies led to the misallocation of capital,
increasing the likelihood of financial crises in developing economies. Schmukler (2003)
however notes that financial globalisation only leads to financial crises in the short run.
This argument is strengthened by the fact that those countries with more open financial
and trade policies grow faster than those that are closed. Thus, the most important
benefit of financial globalisation for developing countries is the development of their
financial system, because it involves a deeper, more stable and better regulated financial
market.
In theory, financial liberalisation can lead to the development of the financial system
through the development of its structure, size and efficiency.23
Accordingly, financial
globalisation will improve a country’s financial system by increasing the availability of
funds and improving the financial infrastructure, which can reduce the problem of
asymmetric information (Schmukler, 2003).
This debate over what the policy of financial liberalisation has or has not done to the
developing countries financial systems raise some questions that need to be addressed if
we need to find out the experience amongst developing countries in particular those in
Asia, Latin America and SSA regarding the relevance of financial liberalisation. One,
has financial liberalisation worked in the way that its advocates or its critics claimed it
would? In developing countries and in particular SSA countries, the absence of strong
credit markets has been a barrier to sustained economic growth. Prior to financial
liberalisation, the financial sector was heavily controlled by the government and
because productive economic activity is limited by poor external finance, evidence
suggests that financial liberalisation can help improve financial development in
countries where access to financial services is quite poor. In theory, financial
liberalisation would allow for more efficient global allocation of capital from capital
rich developed countries to capital poor developing economies. However, Rajan and
Zingales (RZ, 2003) theory hypothesise that a country’s financial development
positively relates to the opening of both the trade and financial sector. Another
important question then is should financial liberalisation proceed cautiously and with
the appropriate sequencing in order to avoid financial crisis?
23 The main purpose of this research is to investigate the impact of financial liberalisation on the size and activity of the financial system (banking and stock market) in emerging and frontier countries.

72
Using the theory of demand and supply to explain the relationship between finance and
trade, Rajan and Zingales (2003) find that openness in the goods market can improve
the supply of external finance, because it aligns the interests of the economically
powerful more closely with financial development. According to the authors, openness
often leads to competition within incumbent firms; moreover incumbent firms, worried
by the threat of entry have strong incentives to resist financial development by shaping
policies and institutions to their own advantage when they are in power. However,
because potential competitors would need external finance for investment opportunities,
the authors argue that when a country becomes more open to trade and international
capital flows, they would be able to develop their financial sector which will lead to
competition between the incumbent and potential investors, because such globalisation
will force a country to do what is beneficial for their economic development, rather than
for the incumbent.
In contrast, Svaleryd and Vlachos (2001) note that openness to trade is associated with
risk diversification. The authors argued that countries are at the risk of being exposed to
external demand shocks from foreign competition, and as such it will create a new
demand for external finance. In this view, the effect of trade on finance is likely to work
through the demand side. Some economists argue that there is a need to first improve
the macroeconomic background and to follow the correct order of liberalisation before
partaking in the broad liberalisation process (i.e. banking system, foreign exchange,
capital inflows and trade regimes). Yet still, Anayiotos and Toroyan (2009), notes that
whilst it is important to carry out economic and financial reforms, it is also critical to set
priorities to developing the institutions that contribute to developing the financial sector
and to weigh the benefits of financial liberalisation against the increased potential
financial fragility it can cause (Demirguc-Kunt and Detragiache, 1999).
Whilst a number of research studies have investigate the effect of financial liberalisation
(openness) on financial development, these studies mainly focus on banking sector
development (Baltagi et al. 2007) and equity market development (Huang and Temple,
2005 and Chinn and Ito, 2006). Despite recent contributions, research on the effect of
financial liberalisation on the overall development of both banking and the stock market
in emerging countries is scant. This study differs from previous ones in that it analyses
the impact of financial liberalisation on financial development by considering the
structure and classification of the financial sector. The main idea is that financial

73
liberalisation has a differential impact on financial development in different regions,
depending on the stages of economic and institutional development in these economies.
Based on these arguments, this chapter seeks to ask the following questions:
1. Does financial liberalisation lead to financial development in emerging
countries? If so, what is the impact of financial liberalisation in the emerging
countries of the BRIMCs and frontier markets in the SSA region? It captures
the differences in economic development and institutional quality by
controlling for the effects of economic growth and institutional quality.
2. Does the simultaneous opening of both the financial and trade sector
improve financial development? This question is raised in order to examine
the impact of the openness hypothesis proposed by Rajan and Zingales
(2003) in the sample.
In this spirit, this chapter aims to contribute to the ongoing debate by exploring the
implications of financial liberalisation on financial development in developing
countries, because the existing literature is mostly driven by data from developed
countries. I classify these markets into two: emerging and frontier markets. The choice
of sample countries is determined by the Financial Times Stock Exchange (FTSE) and
the Morgan Stanley Capital International (MSCI Barra, 2009) classification of emerging
and frontier markets. I classify the sample into two sub groups: BRIMCs, which consist
of Brazil, Russia, India, Mexico and China, and selected SSA countries, which consist
of Botswana, Ghana, Kenya, Nigeria, South Africa, Zambia and Zimbabwe. According
to the FTSE, South Africa is an emerging market, however, for the purpose of this
analysis; I have included it in the SSA sample. This chapter will also contribute to the
empirical literature by analysing the effect of financial liberalisation on financial
structure. Following a similar formula used in Demirguc-Kunt and Levine (1999) in
their analysis of ‘Bank-based and Market-based financial systems: Cross-country
comparisons’,24
I construct the financial structure for six countries (Botswana, China,
Ghana, Nigeria, Russia and Zambia). The chapter also contributes to the debate on the
sequence of financial liberalisation by examining the RZ hypothesis in the BRIMC and
SSA context.
24 To construct the financial structure, I used the mean of the sample’s private credit and the total value of stock
traded.

74
The rest of the chapter is organised as follows: Section 3.2 provides a brief literature
review on the relationship between financial liberalisation and financial development. It
looks at the effect of financial liberalisation on financial development in the sample
countries and discusses related empirical literature. Section 3.3 describes the
specification of our model and other explanatory variables used in our analysis. Section
3.4 analyses the impact of financial liberalisation on financial development and provides
a discussion of the results. Finally, Section 3.5 concludes this chapter with a summary
and policy implications.
3.2 Financial sector development and liberalisation in emerging markets: An
overview
In the past three decades, economic reforms and most importantly, financial
liberalisation have been the main reform strategies used in both advanced and
developing countries to achieve the gains of globalisation. According to Tokat (2005),
advanced countries have always been the first to initiate and complete any reforms
through the liberalisation of their financial sector. Whereas, developing countries
impose restrictions on capital movement, making it difficult for foreign countries to
penetrate their financial system.
In pioneering work on financial repression, McKinnon (1973) and Shaw (1973) both
note that developing countries have a more closed financial sector as a result of
government intervention. They argued that governments impose a series of regulations
on domestic banks, such as interest rate regulation, directed credit schemes and high
reserve ratios, which make it impossible for firms to raise the finance needed for
productive investment. In addition, as McKinnon-Shaw hypothesised, repressing the
financial sector leads to a fragmentation of the domestic capital markets and resulting in
highly adverse consequences for the quality and quantity of real capital accumulation
(McKinnon, 1988, 1993). The authors suggest that freeing interest rates, reducing
reserve requirements and allowing foreign penetration in the financial sector, will
increase these developing countries access to finance, which in turn increases savings
and improves the financial sector.
These reform strategies, according to McKinnon (1973) and Shaw (1973), were
important in order to overcome financial repression, and in most cases, investment and
growth would pick up either by complementary effect or by credit availability effect
(Agenor and Montiel, 1996: 494). Consequently, the recommendation made by
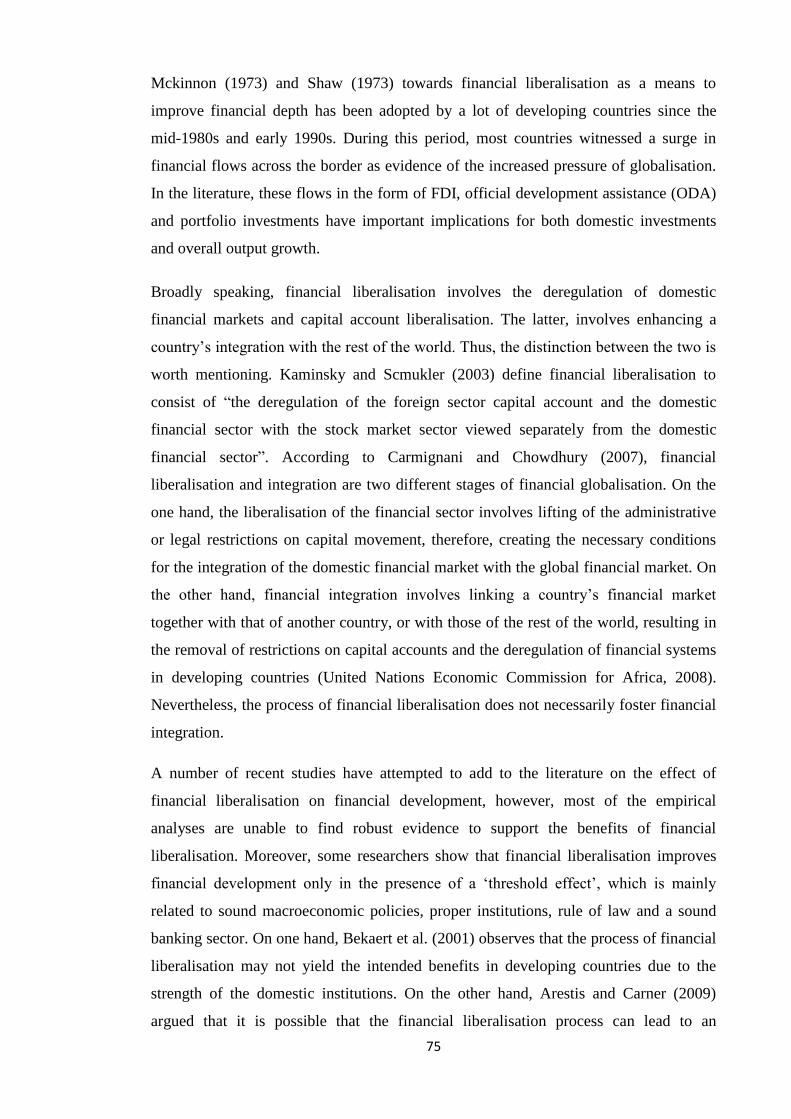
75
Mckinnon (1973) and Shaw (1973) towards financial liberalisation as a means to
improve financial depth has been adopted by a lot of developing countries since the
mid-1980s and early 1990s. During this period, most countries witnessed a surge in
financial flows across the border as evidence of the increased pressure of globalisation.
In the literature, these flows in the form of FDI, official development assistance (ODA)
and portfolio investments have important implications for both domestic investments
and overall output growth.
Broadly speaking, financial liberalisation involves the deregulation of domestic
financial markets and capital account liberalisation. The latter, involves enhancing a
country’s integration with the rest of the world. Thus, the distinction between the two is
worth mentioning. Kaminsky and Scmukler (2003) define financial liberalisation to
consist of “the deregulation of the foreign sector capital account and the domestic
financial sector with the stock market sector viewed separately from the domestic
financial sector”. According to Carmignani and Chowdhury (2007), financial
liberalisation and integration are two different stages of financial globalisation. On the
one hand, the liberalisation of the financial sector involves lifting of the administrative
or legal restrictions on capital movement, therefore, creating the necessary conditions
for the integration of the domestic financial market with the global financial market. On
the other hand, financial integration involves linking a country’s financial market
together with that of another country, or with those of the rest of the world, resulting in
the removal of restrictions on capital accounts and the deregulation of financial systems
in developing countries (United Nations Economic Commission for Africa, 2008).
Nevertheless, the process of financial liberalisation does not necessarily foster financial
integration.
A number of recent studies have attempted to add to the literature on the effect of
financial liberalisation on financial development, however, most of the empirical
analyses are unable to find robust evidence to support the benefits of financial
liberalisation. Moreover, some researchers show that financial liberalisation improves
financial development only in the presence of a ‘threshold effect’, which is mainly
related to sound macroeconomic policies, proper institutions, rule of law and a sound
banking sector. On one hand, Bekaert et al. (2001) observes that the process of financial
liberalisation may not yield the intended benefits in developing countries due to the
strength of the domestic institutions. On the other hand, Arestis and Carner (2009)
argued that it is possible that the financial liberalisation process can lead to an
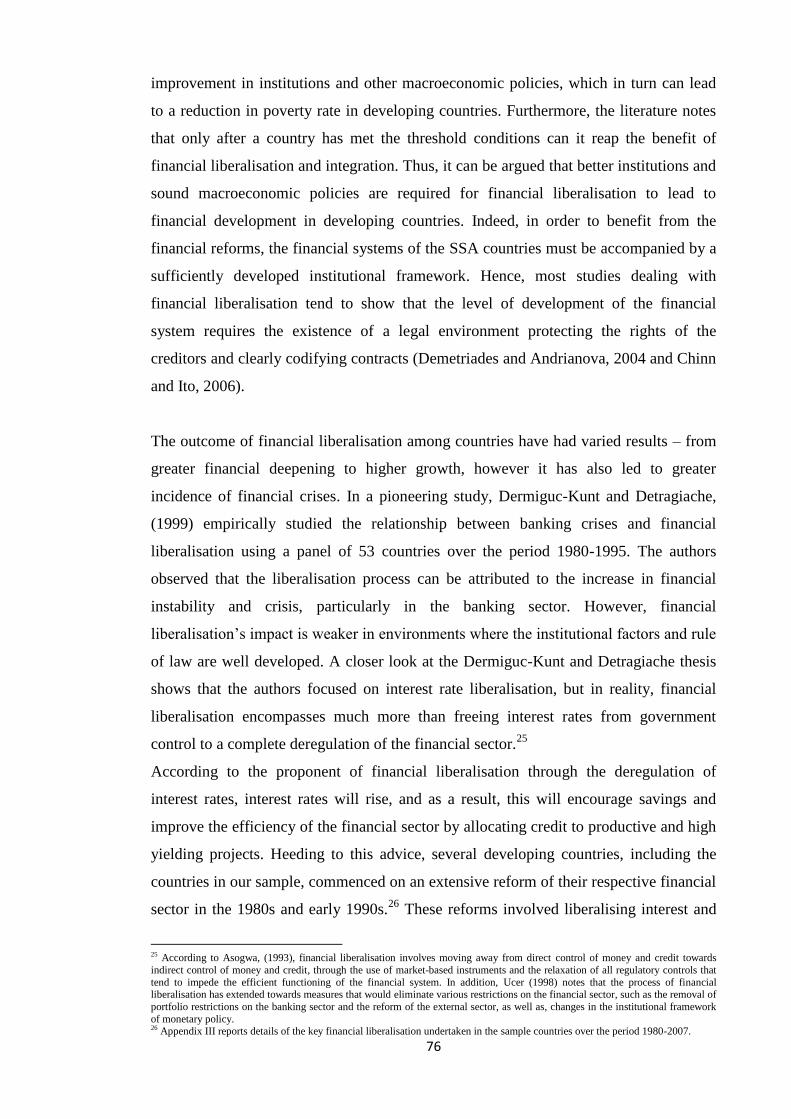
76
improvement in institutions and other macroeconomic policies, which in turn can lead
to a reduction in poverty rate in developing countries. Furthermore, the literature notes
that only after a country has met the threshold conditions can it reap the benefit of
financial liberalisation and integration. Thus, it can be argued that better institutions and
sound macroeconomic policies are required for financial liberalisation to lead to
financial development in developing countries. Indeed, in order to benefit from the
financial reforms, the financial systems of the SSA countries must be accompanied by a
sufficiently developed institutional framework. Hence, most studies dealing with
financial liberalisation tend to show that the level of development of the financial
system requires the existence of a legal environment protecting the rights of the
creditors and clearly codifying contracts (Demetriades and Andrianova, 2004 and Chinn
and Ito, 2006).
The outcome of financial liberalisation among countries have had varied results – from
greater financial deepening to higher growth, however it has also led to greater
incidence of financial crises. In a pioneering study, Dermiguc-Kunt and Detragiache,
(1999) empirically studied the relationship between banking crises and financial
liberalisation using a panel of 53 countries over the period 1980-1995. The authors
observed that the liberalisation process can be attributed to the increase in financial
instability and crisis, particularly in the banking sector. However, financial
liberalisation’s impact is weaker in environments where the institutional factors and rule
of law are well developed. A closer look at the Dermiguc-Kunt and Detragiache thesis
shows that the authors focused on interest rate liberalisation, but in reality, financial
liberalisation encompasses much more than freeing interest rates from government
control to a complete deregulation of the financial sector.25
According to the proponent of financial liberalisation through the deregulation of
interest rates, interest rates will rise, and as a result, this will encourage savings and
improve the efficiency of the financial sector by allocating credit to productive and high
yielding projects. Heeding to this advice, several developing countries, including the
countries in our sample, commenced on an extensive reform of their respective financial
sector in the 1980s and early 1990s.26
These reforms involved liberalising interest and
25 According to Asogwa, (1993), financial liberalisation involves moving away from direct control of money and credit towards
indirect control of money and credit, through the use of market-based instruments and the relaxation of all regulatory controls that
tend to impede the efficient functioning of the financial system. In addition, Ucer (1998) notes that the process of financial liberalisation has extended towards measures that would eliminate various restrictions on the financial sector, such as the removal of
portfolio restrictions on the banking sector and the reform of the external sector, as well as, changes in the institutional framework
of monetary policy. 26 Appendix III reports details of the key financial liberalisation undertaken in the sample countries over the period 1980-2007.

77
exchange rates, abolishing directed credit allocation, liberalising entry into the banking
sector, strengthening the regulatory and supervisory framework and promoting market-
based systems.
Sandoyan et al. (2007) note that financial liberalisation will benefit financially
underdeveloped countries because this will lead to financial integration and,
consequently, spur financial development. Under these circumstances, the argument
goes that by removing capital controls and allowing domestic and foreign investors to
engage in more portfolio diversification, would reduce the cost of capital and increase
the availability of funds, therefore, increasing the efficiency of the financial sector and
stimulating growth. In addition, Bencivenga and Smith (1991) notes that financial
liberalisation would benefit developing countries by moving them closer to the frontier
of technology. As such, many developing countries encouraged both trade and financial
sector reforms as part of their structural adjustment programs (SAP).
The literature suggests that the liberalisation of the financial sector not only increased
credit directly, but also indirectly, through their impact on capital flows. For example,
Wakeman-Lin et al. (2008) in a report published by the IMF note that private capital
flows to African countries increased almost five-fold from US $11 billion in 2000, to
US $53 billion in 2007. FDI inflows have also been reported to have increased
substantially, as did portfolio investment during the period 2002 to 2006. In the
countries under study, I note that the removal of capital controls during the late 1980s
and early 1990s allowed for foreign penetration, and as such, increased foreign capital
in the form of FDI and portfolio investment in the equity sector. Furthermore the
literature suggests that the liberalisation of the financial sector might encourage
technology transfer, due to the attraction of FDI inflows.
3.2.1 Financial sector development and liberalisation: Empirical analysis
Financial liberalisation has been intensively studied during the past, but there is still no
consensus on its effect on financial development. Pill and Pradhan (1995) and Gelbard
and Leite (1999), are one of the first studies to investigate the effect of financial
liberalisation on financial development. In examining the role of financial liberalisation
in financial sector development process, Pill and Pradhan (1995) identified three stages
of financial development: (i) the financial repressed economy, (ii) a domestically
liberalised economy and (iii) an internationally liberalised economy. The study found
that the outcomes of financial liberalisation in some African countries (i.e. Gambia,

78
Ghana, Kenya, Madagascar, Malawi and Zambia) were less than the results that were
obtained in the case of other Asian countries (i.e. Indonesia, Korea, Malaysia,
Philippine, Sri Lanka, and Thailand). According to the authors, financial development
in the African samples did not change in the post-liberalisation period because the
necessary and appropriate preconditions, such as a stable macroeconomic climate,
institutional and financial development, were not favourable in those African countries
for the success of financial liberalization as compared to the Asian countries.
Using a sample of 38 SSA countries over the period 1987 to 1997, Gelbard and Leite
(1999) considered; (i) the structure of the market, (ii) the availability of financial
product, (iii) financial liberalisation, (iv) the institutional environment, (v) the degree of
financial openness, and (vi) the sophistication of the available monetary policy
instrument. According to their findings, 14 of the countries improved their financial
sector through financial liberalisation and adoption of other monetary policies. The
implication of this result is that completing the financial liberalisation process would
lead to financial development (FD).
Huang .Y (2005) analysed the impact of political liberalisation on FD in 90 developed
and developing countries. The author first examined whether institutional improvement
promotes FD using a panel data method. The results showed that political liberalisation
has a positive effect on FD in the short-term in lower income countries, ethnically
divided countries and French legal origin countries. Using an events study method, the
author then examined the impact of democratic transitions on FD. The evidence showed
that democratic transitions are preceded by low FD and greater FD volatility. However,
an increase in FD volatility may be related to immediate consequences of democratic
transition and as a result this may lead to more openness to trade and competition, and
eventually to promoting economic growth. Chinn and Ito (2006) and Baltagi et al.
(2008) have also emphasised the role of openness and institutions on FD.
Law and Habibullah (2009) examined the determinant of FD in 27 economies, over the
period 1980-2001, using a dynamic panel data analysis method. They found that
institutional quality was statistically significant in determining both banking sector and
capital market development. In a more recent study, Cherif and Gazdar (2010) used
both panel data and instrumental variable methods to study the determinant of financial
development in 14 MENA countries over the period 1990 to 2007. According to their
findings, income level, savings rate, stock market liquidity, interest rate and stock

79
market development are all positively related. The authors also studied whether the
banking sector and stock markets are complements or substitutes. Their results showed
that both financial structures are complements. However, their result did not provide
support for the influence of institutional development on stock market development.
Various indicators of financial liberalisation have been used to examine whether
developing countries have moved from a repressed to an open financial economy. In a
recent publication, Abiad and Mody (2005) examine how a country’s’ structure can
influence the impact of financial liberalisation in 30 countries over twenty-four years.
Using an index of financial liberalisation which the authors developed, they found that
economies in Latin America and Sub-Saharan Africa had moved to partly liberalised,
while some countries in South Asia still remained partly repressed.
The evidence nevertheless has been unconvincing. While some studies emphasise
positive impacts (Fry, 1997; Quinn, 1997 and Henry, 2006), others indicate the potential
risks (Stiglitz, 2000 and Demetriades and Luintel, 2001). These conflicting results
confirm the need for more research in this area.
3.2.2 The variation of financial sector development and liberalisation in
developing countries: Trends and pattern
This section uses tables and figures to visually examine the effect of financial
liberalisation policies on select financial development indicators during the last twenty
years. The sample of countries are divided into two sub groups; emerging and frontier
markets.27
Following Beck et al. (2000), the study uses both banking and stock market
development indicators.28
For the banking sector, private credit (PC) and liquid
liabilities (M3) have been used. PC measures the activity of the banking sector while
M3 indicates the overall size of the banking sector. The indicators of stock market
development included here are: stock market capitalisation (MCAP) and value of stocks
traded (TVALUE). MCAP measures the size of the stock market while TVALUE
measures the activity of the stock market.
Using a simple arithmetic average, Tables 3-1 and 3-2 presents the effect of financial
liberalisation in emerging and frontier markets between 1980 and 2007. To capture the
effect of financial liberalisation, the table includes different sub-periods. From the table,
it is observed that in the 1980s, financial liberalisation had no significant impact on the
27 Emerging and frontier markets are used interchangeably with the BRIMCs and SSA countries respectively. 28 This study focuses on both the banking sector and stock markets, hence other aspects of the financial sector have been excluded from the empirical analysis.

80
level of financial development in the full sample. It should be pointed out that emerging
countries experienced rapid development in both the banking sector and the stock
market. However, frontier markets witnessed growth in both the banking sector and
stock market sector starting from the 1990s, which may be as a result of the effect of
financial liberalisation. Furthermore, the liberalisation of the financial sector has also
led to an increase in the level of capital accumulation, with the most significant increase
witnessed during the 2000s, in particular, 2007.
Table 3-1: Banks, Stock Markets and Capital accumulation pre- and post- financial reforms, 1980-2007
Year
Bank Stock Market Capital Accumulation
Private Credit
Liquid
Liabilities Traded Value
Market
Capitalisation Investment FDI
Full Sample
1980-89 1.26 1.31 0.72 0.73 15.89 1.10
1990-99 0.96 1.08 0.13 0.29 17.31 1.88
2000-04 0.88 1.07 0.13 0.27 16.71 2.32
2005 0.90 1.13 0.13 0.34 18.28 2.18
2006 0.91 1.15 0.21 0.45 19.21 3.06
2007 0.95 1.19 0.43 0.63 19.98 3.73
Emerging Markets
1980-89 2.13 2.00 1.07 1.02 19.74 0.60
1990-99 1.36 1.41 0.24 0.42 22.62 1.75
2000-04 1.13 1.30 0.26 0.32 21.25 2.43
2005 1.15 1.35 0.25 0.43 22.10 2.05
2006 1.18 1.37 0.43 0.62 22.76 2.33
2007 1.22 1.40 0.90 0.93 24.04 3.12
Frontier Markets
1980-89 0.62 0.77 0.00 0.06 13.32 1.43
1990-99 0.67 0.83 0.01 0.14 12.88 1.97
2000-04 0.68 0.88 0.02 0.23 12.93 2.23
2005 0.69 0.94 0.03 0.27 15.10 2.30
2006 0.69 0.97 0.02 0.32 16.25 3.68
2007 0.72 1.02 0.03 0.37 16.60 4.24
Notes: The data on private credit, liquid liabilities, trade value and markets capitalisation are obtained from the
updated version of Beck et al., (2000). Investment as a share of GDP per capita was obtained from Penn World, Table
6.3, and FDI as a percent of GDP (inflow) was extracted from World Development Indicators, World Bank, ESDS,
2009.
Table 3-2 examined two different types of capital flows in the emerging and frontier
markets. According to the table, foreign capital in the form of FDI and portfolio
investment, increased substantially in Nigeria and South Africa and the other countries
that embarked on financial sector reforms during the same period. The steady growth
realised during the 1990s to 2006 appears to decline in 2007 in some of the economies,

81
for instance in the SSA country, Nigeria. In absolute terms, FDI increased in 10 out of
the 12 countries. However, only 5 of these countries had a percentage change of over
fifty percent between 2006 and 2007.
When I consider the BRIMC countries, I notice that India and China, the two major
economies that drive the BRIMC, registered a contrasting percentage change in total
capital flows. While India recorded an increase of 98.34 percent between 2006 and
2007, China recorded a decrease of approximately 11 percent. According to a study on
private capital flows to SSA countries by Wakeman-Linn et al. (2008), the authors
observe that the performance of the SSA regions in 2007 compares favourably to the
Association of Southeast Asian Nations (ASEAN) countries in 1980s.29
One of the
reasons for this could be that by realising the potentials of a well-developed financial
sector,30
developing policies that would ensure such benefits, has become a major
priority for the governments of these countries, so as to build on improving economic
growth. While the reforms succeeded in improving financial development, the impact
on growth and investment has been inconsistent, whilst financial systems remain
shallow and relatively underdeveloped in most African countries (Batuo and Kupukile,
2009).
Portfolio investment did not seem to have improved after financial liberalisation; in fact,
it is observed that portfolio investment declined drastically in the 2000s in most of the
frontier markets while it increased considerably in Brazil, Russia and India. A closer
look at the table suggests that the inflow of capital to the countries under observation
considerably increased after financial sector liberalisation.
Figure 3-1 present a comparison of the various indicators of financial development in
the emerging and frontier markets and in various income groups during the period 1980-
2007. According to the figure, the level of market capitalisation (MCAP) has been on
the increase in the BRIMC and SSA countries since 1990; however both region
encountered a drop in 1992 and 1997 respectively. This decrease may be due to the
various financial and banking crisis experienced in many of these countries during the
1990s almost after many developing countries began to pursue capital control
deregulation policies.
29 Emerging and Frontier markets are used interchangeably with the BRIMCs and SSA countries respectively. 30 This study focuses on both the banking sector and stock markets, hence other aspects of the financial sector have
been excluded from the empirical analysis.

82
Table 3-2: Capital inflows to selected Sub-Saharan Africa and BRIMC countries
Year Capital inflows
1980-
89 1990-99 2000-04 2005 2006 2007
%Change
2006-07
Botswana
FDI 62.67 15.89 260.76 281.32 488.8 494.9 1.25
PI 0 2.34 3.6 61.6 35.9 9.4 -73.82
TCI 62.67 18.23 264.36 342.92 524.7 504.3 -3.89
Ghana
FDI 8.72 113.47 111.75 144.97 636 855.4 34.5
PI 0 0 0 0 0 0 N/A
TCI 8.72 113.47 111.75 144.97 636 855.4 34.5
Kenya
FDI 30.42 20.96 54.33 21.28 50.73 728.01 1335.17
PI 0.03 3.37 0.64 3.1 1.8 0.5 -72.22
TCI 30.45 24.33 54.97 24.38 52.53 728.51 1286.94
Nigeria
FDI 434 1494.06 1785.15 4978.26 13956.49 12453.74 -10.77
PI 0 0 0 0 0 4648 N/A
TCI 434 1494.06 1785.15 4978.26 13956.49 17101.74 22.54
South
Africa
FDI 14.16 850.32 2156.46 6643.77 -527.1 5692.06 -1179.87
PI -120.47 2807.63 2032.96 7230 14959 8669.9 -42.04
TCI -106.31 3657.95 4189.42 13873.77 14431.9 14361.96 -0.48
Zambia
FDI 51.65 139.16 241.56 356.9 615.8 983.9 59.78
PI 0 1.47 3 5.3 2 3.8 90
TCI 51.65 140.63 244.56 362.2 617.8 987.7 59.87
Zimbabwe
FDI 8.02 95 13.08 102.8 40 68.9 72.25
PI 0 5.69 0 0 0 0 N/A
TCI 8.02 100.69 13.08 102.8 40 68.9 72.25
BRIMC
Brazil
FDI 1721.42 9921.66 20023.24 15066.29 18822.21 34584.9 83.75
PI 20.4 3069.8 2518.26 6451.3 7715.8 26217.3 239.79
TCI 1741.82 12991.46 22541.5 21517.59 26538.01 60802.2 129.11
Russia
FDI 0 1864.2 6465.23 12885.81 32387.03 52475.41 62.03
PI 0 393.62 1061.14 -99.8 6479.7 18844.4 190.82
TCI 0 2257.82 7526.37 12786.01 38866.73 71319.81 83.5
India
FDI 104.75 1516.57 4955.6 7606 19662 22950 16.72
PI 0 1696.88 4694.74 12144.1 9548.8 34986 266.39
TCI 104.75 3213.45 9650.34 19750.1 29210.8 57936 98.34
Mexico
FDI 2388.25 8507.47 21997.21 20945.43 19290.64 24686.44 27.97
PI 49.4 3754.74 -430.28 3352.9 2805.2 -482.1 -117.19
TCI 2437.65 12262.21 21566.93 24298.33 22095.84 24204.34 9.54
China
FDI 1618.65 29042.7 50893.99 72406 72715 83521 14.86
PI 0 703.4 5732.44 20346 42861.2 18509.6 -56.82
TCI 1618.65 29746.1 56626.43 92752 115576.2 102030.6 -11.72
Notes: FDI = Foreign Direct Investment, PI = Portfolio Investment and TCI = Total Capital Inflows Total capital
inflow is the sum of portfolio investment and foreign direct investment in millions of US $. N/A – not available.

83
Figure 3.1: Stock market development by market capitalisation
Notes: Averaged stock market capitalisation as a % of GDP by market classification. The data was extracted from the updated version of Beck et al. (2009) financial structure database.
Figure 3-2 shows the evolution of market capitalisation in the different income groups.
According to the figure, the three income groups started from the same level of stock
market development, however, by 2005, there had been an increase in the level of
market capitalisation in the upper middle income countries.31
Lower income countries
also show a rise in market capitalisation from 1993, whereas in low income countries,
market capitalisation only began to increase in 2002, but declined again in 2006.
31 Botswana and Mexico belong to this group.
emerging
frontier
0.00
0.10
0.20
0.30
0.40
0.50
0.60
0.70
0.80
0.90
198
0
198
1
198
2
198
3
198
4
198
5
198
6
198
7
198
8
198
9
199
0
199
1
199
2
199
3
199
4
199
5
199
6
199
7
199
8
199
9
200
0
200
1
200
2
200
3
200
4
200
5
200
6
200
7
% G
DP

84
Figure 3.2: Stock market development by income group
Notes: Averaged stock market capitalisation as a % of GDP by income group classification. The data was extracted from the updated version of Beck et al. (2009) financial structure database.
In Figure 3-3 (below), using liquid liabilities as a ratio of GDP to capture the size of the
banking sector, I notice that the development of frontier markets’ banking sector has not
really improved since the 1980s. An exception, however, can be made during the period
1992-1993, where there was a slight increase. The implication of this is that the
financial intermediaries did not transfer funds within this period. On the other hand, the
BRIMC countries exhibited an increase in liquidity ratio since 1995 up until 2007. This
increase can be associated with their link with developed countries, and as a result of
their financial openness.
lic
lmic
umic
0.00
0.20
0.40
0.60
0.80
1.00
1.20
198
0
198
1
198
2
198
3
198
4
198
5
198
6
198
7
198
8
198
9
199
0
199
1
199
2
199
3
199
4
199
5
199
6
199
7
199
8
199
9
200
0
200
1
200
2
200
3
200
4
200
5
200
6
200
7
% G
DP
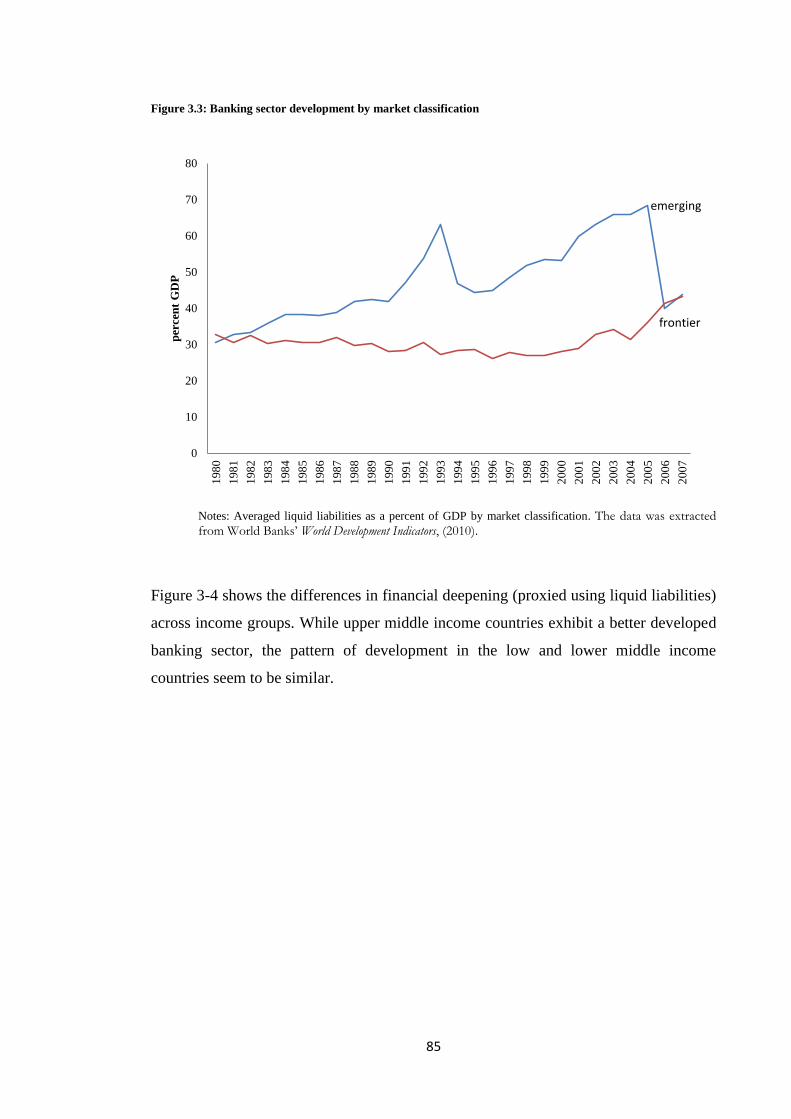
85
Figure 3.3: Banking sector development by market classification
Notes: Averaged liquid liabilities as a percent of GDP by market classification. The data was extracted from World Banks’ World Development Indicators, (2010).
Figure 3-4 shows the differences in financial deepening (proxied using liquid liabilities)
across income groups. While upper middle income countries exhibit a better developed
banking sector, the pattern of development in the low and lower middle income
countries seem to be similar.
emerging
frontier
0
10
20
30
40
50
60
70
80
198
0
198
1
198
2
198
3
198
4
198
5
198
6
198
7
198
8
198
9
199
0
199
1
199
2
199
3
199
4
199
5
199
6
199
7
199
8
199
9
200
0
200
1
200
2
200
3
200
4
200
5
200
6
200
7
per
cen
t G
DP

86
Figure 3.4: Banking sector development by income group classification
Notes: Averaged liquid liabilities as a percent of GDP by income group classification. The data was extracted from World Banks’ World Development Indicators, (2010).
The global trend towards capital account openness has been steady in the last three
decades. According to Chinn and Ito (2008), between 1980 and 2007, the degree of
financial openness increased about 40 percent worldwide, while for the developing
countries, the index more than doubled (see Figure 3-5 below). As indicated in the
figure, the mean of the Chinn-Ito index (0) was passed in 1993, as a result, from that
point, countries around the world became more open. However, openness to cross
border transaction became more pronounced in the early 2000s in developing countries.
Using a sample of 11 countries, Figure (3-6) shows that the move towards financial
openness started in the late 1990s. By mid 2000s, most of the countries in the sample
had moved from having a closed financial system to a more open one.
lic
lmic
umic
0
20
40
60
80
100
120
140
198
0
198
1
198
2
198
3
198
4
198
5
198
6
198
7
198
8
198
9
199
0
199
1
199
2
199
3
199
4
199
5
199
6
199
7
199
8
199
9
200
0
200
1
200
2
200
3
200
4
200
5
200
6
200
7
per
cen
t G
DP

87
Figure 3.5: Development of Capital account openness, 1980-2007
Note: KAOPEN is an index of capital account openness. The data was extracted from the updated version of the Chinn and Ito (2008) dataset. Sample includes 182 countries, 139 of which are developing.
Figure 3.6: Capital account openness in developing countries, full sample
Note: KAOPEN is an index of capital account openness. The data was extracted from the updated version of the Chinn and Ito (2008) dataset.
Despite the striking growth of capital account freedom in the developing world, notable
differences persist in terms of the level of openness and the pace and pattern of opening
between developing countries (see Figure 3-7 below).
All Countries
Developing Countries
-0.80
-0.60
-0.40
-0.20
0.00
0.20
0.40
0.60
19
80
19
81
19
82
19
83
19
84
19
85
19
86
19
87
19
88
19
89
19
90
19
91
19
92
19
93
19
94
19
95
19
96
19
97
19
98
19
99
20
00
20
01
20
02
20
03
20
04
20
05
20
06
20
07
KA
OP
EN
-1.40
-1.20
-1.00
-0.80
-0.60
-0.40
-0.20
0.00
0.20
0.40
19
80
19
81
19
82
19
83
19
84
19
85
19
86
19
87
19
88
19
89
19
90
19
91
19
92
19
93
19
94
19
95
19
96
19
97
19
98
19
99
20
00
20
01
20
02
20
03
20
04
20
05
20
06
20
07
KA
OP
EN

88
Figure 3.7: Capital account openness by regional classification
Note: KAOPEN is an index of capital account openness. The data was extracted from the updated version of the Chinn and Ito (2008) dataset. I have included Russia to the Asian group of countries.
The capital account indicator as reflected by KAOPEN index shows that the Asian
countries (China, India and Russia) were mostly closed to capital account transactions
during the period under study. Although many Asian countries liberalised their capital
account rapidly in the 1980s, but due to the Asian financial crisis, most countries
restricted their capital account including those in our sample. According to the figure,
Latin American countries and SSA countries seem to have relaxed the restrictions
placed on capital account transactions towards the late 1990s; however, investment did
not flow as freely to the developing countries as it did in the 1970s. In Latin American
countries for example, the new democratic governments were reluctant to relive the
crises and volatility of the period decade. Yet still, to gain access to international credit,
developing country governments had to prove their credibility by committing to stable
and sound economic policies. The liberalisation of the capital account provided
credibility to the international market, that the governments of these countries can
subject their economies to the discipline of international market forces and thus attract
much needed financing for development (Brooks, 2004).
I further compare how capital account freedom has fared in the different types of
financial market (see figure 3-8 below) and noticed that liberalisation in the form of
ASIA
LA
SSA
-2.00
-1.50
-1.00
-0.50
0.00
0.50
1.00
1.50
19
80
19
81
19
82
19
83
19
84
19
85
19
86
19
87
19
88
19
89
19
90
19
91
19
92
19
93
19
94
19
95
19
96
19
97
19
98
19
99
20
00
20
01
20
02
20
03
20
04
20
05
20
06
20
07
KA
OP
EN

89
degree of financial openness captured by KAOPEN index of Chinn and Ito (2006, 2008)
has not really made much impact in both the emerging and frontier markets as
demonstrated by figure 3-8. Here, the figure shows that emerging countries had a
restrictive control on capital accounts during the period 1980-2007. The controls on
capital account transactions were an attempt by these countries to shield themselves
from the risks associated with fluctuations in international capital flows. Unfortunately,
capital account liberalisation posed significant risks in the financial system due to
structural weaknesses in the banking sector, corporate sector, supervisory and regulatory
framework leaving all the countries in the emerging group affected by financial crisis
during the 1990s.
Similarly, for most part of the 1980s and early to mid 1990s, the intensity of the capital
control placed in the frontier markets was rather high as indicated by the lower value of
the KAOPEN index. Notice that towards the end of the 1990s, the frontier market as a
group moved from a period of full capital control to a more relaxed restrictions on the
capital account transactions.
Figure 3.8: Capital account openness by market classification
Note: KAOPEN is an index of capital account openness. The data was extracted from the updated version of the Chinn and Ito (2008) dataset. I have included Russia to the Asian group of countries.
emerging
frontier
-2.00
-1.50
-1.00
-0.50
0.00
0.50
1.00
198
0
198
1
198
2
198
3
198
4
198
5
198
6
198
7
198
8
198
9
199
0
199
1
199
2
199
3
199
4
199
5
199
6
199
7
199
8
199
9
200
0
200
1
200
2
200
3
200
4
200
5
200
6
200
7
KA
OP
EN

90
In Figures 3-9 and 3-10, I compare overall financial development32
(activity and size)
and trade in emerging and frontier countries. Figure 3-9 indicates that among the
emerging markets, China’s financial sector has improved considerably since 2000.
According to the figure, I observe that China’s financial sector has remained stable
since the early 2000s. The data indicates that overall development in the activity of both
the banking sector and stock market increased by 95.6 percent between 2006 and 2007.
The stability and performance of the financial sector has been linked to success of the
financial reforms and opening up of the economy to external finance. Furthermore,
according to a report on China’s financial stability by the People’s Bank of China (PBC,
2007), the overall strength and stability of China’s financial sector and its robustness to
external shocks has been enhanced by favourable macroeconomic environment.
Figure 3.9: Overall financial development and trade for emerging countries
In terms of overall development, I noticed that the banking sector performed better than
the stock market. This performance according to PBC (2007) is as a result of better
corporate governance, improved risk-resistance capabilities and strengthened capital
requirement. Major financial changes did not occur in Russia’s banking sector and stock
market in the 1980s. However, our figure shows that both the banking sector and stock
market development have taken place since then. In fact, a closer look shows that the
32 This refers to the aggregate of the measures of the size and activity of the Banking sector and the Stock market.
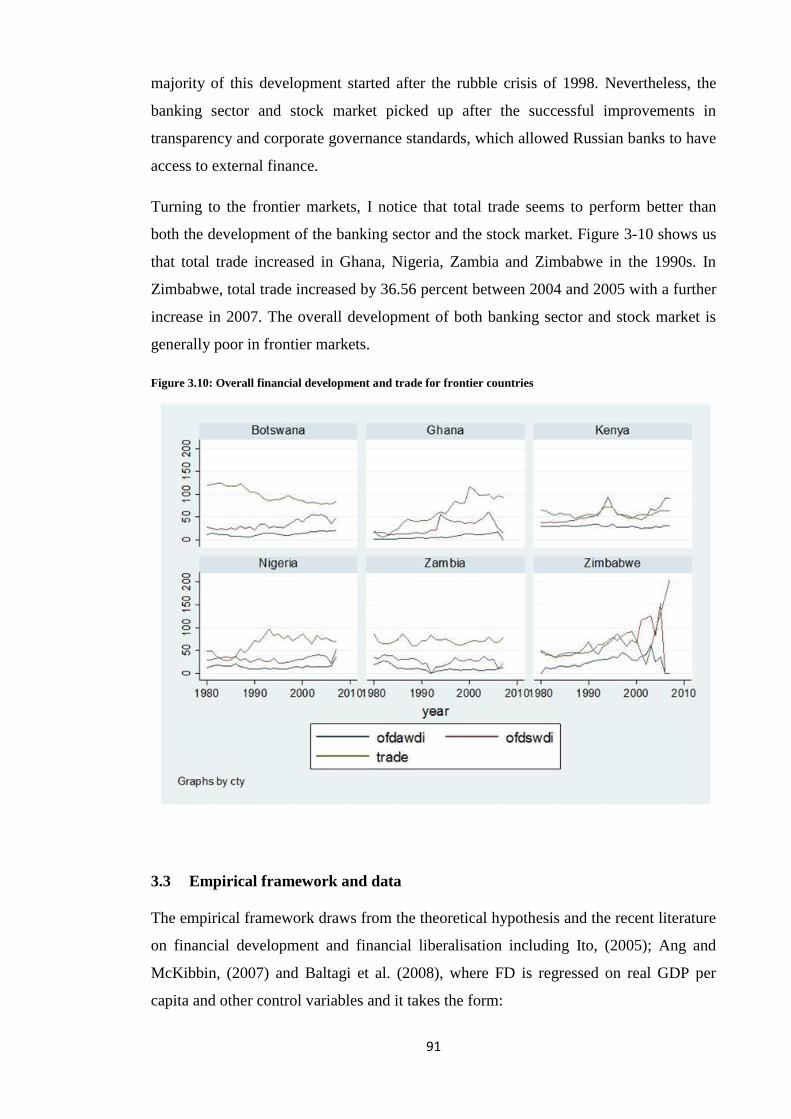
91
majority of this development started after the rubble crisis of 1998. Nevertheless, the
banking sector and stock market picked up after the successful improvements in
transparency and corporate governance standards, which allowed Russian banks to have
access to external finance.
Turning to the frontier markets, I notice that total trade seems to perform better than
both the development of the banking sector and the stock market. Figure 3-10 shows us
that total trade increased in Ghana, Nigeria, Zambia and Zimbabwe in the 1990s. In
Zimbabwe, total trade increased by 36.56 percent between 2004 and 2005 with a further
increase in 2007. The overall development of both banking sector and stock market is
generally poor in frontier markets.
Figure 3.10: Overall financial development and trade for frontier countries
3.3 Empirical framework and data
The empirical framework draws from the theoretical hypothesis and the recent literature
on financial development and financial liberalisation including Ito, (2005); Ang and
McKibbin, (2007) and Baltagi et al. (2008), where FD is regressed on real GDP per
capita and other control variables and it takes the form:

92
FD = f (FINLIB, Y) (3.1)
where FD refers to the financial development indicator, FINLIB is a measure of
financial liberalisation, Y measures the level of economic development.33
Recent studies have identified trade openness, institutional quality, financial openness
and geographical endowment as significant in determining FD. In addition,
macroeconomic factors such as inflation and savings rates are important in determining
the cross-country variation in financial development. The argument is that maintaining a
low rate of inflation is conducive for financial development. However, a high rate of
inflation may distort the decision rate and discourage financial intermediation. Thus,
following other literature such as Rajan and Zingales (2003), Huang. W. (2005), Baltagi
et al., (2008) and Law and Habibullah, (2009), I include economic and policy related
variables. In particular, the control variables are trade openness, capital flows,34
inflation and institutional quality. Based on these, I can re-write equation (3.1) as
follows:
FD = f (FINLIB, Y, TLIB, ECF, INF, INS) (3.2)
where TLIB is a measure of trade openness or globalisation; ECF is external capital
flows, INF is inflation and INS is institutional quality. Apart from measuring
macroeconomic stability, inflation is included because of its relationship to savings,
which financial development is based upon. I expect a negative impact on financial
development. Equation (3.2) provides the basis for the empirical model that is estimated
in this chapter.
In examining the cross-sectional variation and time series variations of the relationship
between financial liberalisation and financial development, I employ panel data
estimation techniques which capture both the cross-section and time series dimension of
our data. Thus, following recent research, such as Ito, (2005); Fowowe, (2008); Hermes
and Lensik (2005) and Baltagi et al., (2008) our estimation takes the form:
0 1 3 4it it it it itFD FINLIB Y X
(3.3)
where FD is a measure of financial development, and FINLIB is financial liberalisation
covering three measures, which will be included separately in the financial development
33 Y is measured by GDP per capita. To check the robustness of our data to changes in variables, we use the annual growth of GDP
per capita as a proxy of the level of economic development. 34 In the form of FDI net inflows, as a percent of GDP.
93
equations, to measure the impact of financial liberalisation on financial depth. These are
a dummy representing financial liberalisation dates (LIBDATE) and two financial
liberalisation indices (referred to as FINDEX and KAOPEN). From the financial
liberalisation theory, it is expected that these variables will exert a positive impact on
financial development. Yit measures the level of economic development and it is proxied
by real GDP per capita.
itX is the control variable and it includes; TO, our measure of trade liberalisation and it
is either of OPENK, TRADE or TINDEX.35
Our model extends the Baltagi et al. (2008)
model to include external finance and inflation. Thus, I will estimate a set of equations
to investigate the relationship between financial liberalisation and financial
development. The econometric specification I use in this thesis can be described as:
1 2 3 4 5 6 7it it it it it it it itFD BHL Y TO ECF INF INS (3.4)
1 2 3 4 5 6 7it it it it it it it itFD FINDEX Y TO ECF INF INS (3.5)
1 2 3 4 5 6 7it it it it it it it itFD KAOPEN Y TO ECF INF INS (3.6)
where FD is a measure of financial development, BHL is a dummy variable which
captures the starting date of financial liberalisation in the countries and takes the value
of 0 before liberalisation and 1 after liberalisation, Y is a measure of the level of
economic growth, INF is inflation, which measures macroeconomic uncertainty, TO is a
measure of trade liberalisation, (OPEN, TRADE, TINDEX), ECF36
is external capital
flows and INS is institutional quality. i refers to the group or unit (or in our case,
country) and t refers to the individual observation (year) within the group.
3.3.1 Data sources and issues
The objective of this chapter is to examine whether there is a change in the financial
development indicators in developing countries, following financial liberalisation.
Hence, this research uses an unbalanced panel of eleven countries for the period 1980-
2007. The dataset consists of eleven emerging markets, five of which are from around
the two main regions; Asia and Latin America and the Caribbean and six from SSA
regions to represent the three continents of the world, which are of economic
35 TINDEX is an index constructed by the Heritage Foundation Index of Economic Freedom and it is used to measure
how open or repressed a country is to the rest of the world. 36 ECF and FDI are used interchangeably in this chapter.
94
significance in globalisation. All of the selected countries completed the liberalisation of
their financial sector in the last two decades. Given the diverse nature of the sample
countries, I note that the level of financial development may differ across the countries
with varying levels of economic development, therefore, the sample countries are
further divided into two groups, namely emerging and frontier economies. I compile up-
to-date and consistent data using various sources of information such as (Beck et al.,
2000 (revised 2009); World Development Indicators, World Bank, 2009; Heritage
Foundation, 2009 and International Financial Statistics, IMF, 2009).
It has been argued that market-based financial systems are better than bank-based
financial systems because market-based systems respond faster to shocks, and are more
effective at identifying and isolating truly distressed firms, in order to mitigate their
negative impacts on the economy, than bank-based systems (Rajan and Zingales, 2001).
In the context of Africa where stock markets are underdeveloped, illiquid and inefficient
banks hold the vast majority of the financial systems assets, making them strongly
bank-based (an exception is South Africa, see Appendix III-I). Furthermore,
Gerschenkron (1962) notes that banks effectively promote finance development more
than capital markets in developing countries. In addition, Andrianova et al. (2008)
observed that state owned banks can effectively overcome market failures by allocating
savings in those countries in an early stage of economic development and those with
weak institutions, such as the majority of the countries in our frontier market group. For
this reason, both banking and stock market development indicators are used.
The sample countries are classified into two categories of financial structure (bank-
based and market-based economies)37
based on a similar methodology to Demirguc-
Kunt and Levine (1999) and Ndikumana (2003). A country is classified as bank-based if
its stock market size (measured by market capitalisation as a percentage of GDP) and its
market efficiency/liquidity (total value of stocks traded as a percent of GDP) are below
the sample averages and vice-versa. While this chapter concentrates on emerging and
frontier markets, the impact of financial liberalisation on financial structures are
noteworthy because the structure of the financial system change and financial systems
become more market-based as countries develop.38
The study finally examines the RZ
hypothesis in order to investigate whether trade openness is a precondition for financial
openness in the sample countries.
37 See Demirguc-Kunt and Levine (1999) for the full details on how financial structure classification is obtained. 38 Based on our analysis, we observe that those countries classified as emerging markets are also market-based and vice-versa. As
such we only report results for emerging and frontier markets.
95
3.3.2 Economic Assumptions Underlying the Model and Testable hypothesis
To achieve the objectives set out in section (3.1) and in order to draw valid conclusions
from the model, some assumptions need to be made. I initially examine the hypothesis
regarding the expected behaviour of the model’s independent variables. With regard to
financial liberalisation, it is widely acknowledged that financial freedom would
encourage the development of the financial sector. The aim of various deregulation and
liberalisation measures in the financial system is to enhance those competitive
mechanisms that would eventually make the economy more efficient; however, results
from developing countries have so far been less than encouraging. Many argue that the
major problem is with the structure of the financial system and the presence of sound
and stable macroeconomic policies and quality institutions (see for example Gelbard
and Leite,1999). It means that a country with sound macroeconomic policies and a
sound institutional capacity can benefit from opening their financial system to the rest
of the world. So, as in other studies, the correlation is expected to be positive. It is
reasonable to postulate the following hypothesis:
H1: Countries with stable macroeconomic policies and better institutional qualities
tend to have better financial system after financial liberalisation compared to others.
There is a strong empirical evidence of the positive relation between financial
development and the level of economic development, which is measured here by GDP
per capita. It is believed that a highly developed country tend to have a significantly
developed financial system. The level of trade openness must also be positively related
to financial development, since openness to trade is in itself a matter of policy choice
and its association with increasingly intense financial transactions also reflects other
policy choices. This implies that easier trade opportunities would have different
implication for different countries in terms of shaping financial development.
In terms of the RZ hypothesis, studies show that opening both the trade and financial
sector would lead to a more developed financial sector. This implies that a country that
opens the trade sector but restricts it financial sector is unlikely to be financially
developed. So, it is reasonable to postulate the following hypothesis:
H2: Countries that open both the trade and financial sector are more financially
developed compared to others.
96
3.3.3 Measures of financial sector development
The financial development report (2011:3) defines financial development as ‘the
policies, factors, and the institutions that lead to effective financial intermediation and
effective financial markets, as well as deep and broad access to capital and financial
services.’ Calderon and Liu (2003: 326) also define financial development as “the
improvement in quantity, quality and efficiency of financial intermediary service”. The
literature identified a number of factors which can be used to measure financial
development and they include; the depth, size, access, and soundness of financial
system. These factors are used to examine the performance and activities of the
financial markets, banks, bond markets and other financial institutions.
To assess the effect of the financial liberalisation process, it is important to address the
issue of how to measure financial development. In choosing an appropriate indicator of
financial development, Lawrence and Longjam (2003) note that, it is important to
choose measures that can be used for effective policy formulation, implementation and
evaluation. Consequently, many studies have chosen a number of proxies since financial
development is not easily measureable and subsequently have come up with different
results. Following Levine and Zervous (1998); Beck et al., (2001) and Beck and
Demirguc-Kunt (2009) this chapter will employ four proxies for financial development.
The first proxy is the ratios of liquid liabilities to GDP, private credit, stock market
capitalisation and the value of stocks traded. These indicators measure the size, activity
and efficiency of direct, as well as, indirect finance. To capture overall FD, I follow
Kemal et al. (2007) and combine the size and activity measures of FD indicators. These
measures are defined below:
Liquid liabilities: This measure represents the overall size of the financial
intermediary and is referred to as the financial deepening measure in the
literature. It is calculated as currency plus demand and interest bearing liabilities
of banks and other financial intermediaries, divided by GDP. According to Beck
et al. (2009), liquid liabilities are a traditional indicator of the depth of the
financial sector and it is the broadest available indicator of financial
intermediaries. LLY represents the overall size of the financial sector without
distinguishing between central bank, deposit money banks, and other financial
institutions. I denote it by M3.
97
Private credit: This measures the activity of the financial intermediaries and it
equals the value of domestic credit to private sector divided by GDP, it is
denoted by PC. This measure includes domestic credit provided by the banking
sector and other financial intermediaries and is a broader measure of financial
intermediation. It also measures the relative degree to which the financial system
allocates credit for productive activities. It isolates credit issued to the private
sector as opposed to credit issued to government, government agencies and
public enterprises (Ahmad and Malik, 2009). Pill and Pradhan (1995) note that
in countries where financial liberalisation has created a well behaved
commercial banking sector, private credit is the preferred measure of financial
development. In addition, Rajan and Zingales (2003) found private credit
provides an ease for entrepreneurs or companies to obtain finance to fund
productive projects, as such I cannot ignore its significance because it provides a
measure of the opportunities available for new firms to obtain finance.
Stock market capitalisation: This measures the size of the stock market and is
defined as the value of listed shares divided by GDP. This is denoted by MCAP.
Total value of stock traded: This measures the activity of the stock market and is
defined as the total value of the shares traded to GDP ratio. Baltagi et al. (2007)
notes that since the value of stocks traded varies with stock prices and the
number of shares traded, this may capture the willingness of an investor to
participate in the stock market. It is denoted by TVALUE.
Overall financial development: Following Kemal et al. (2007), the overall size
of the financial sector is measured by combining the size and activity of the
financial intermediaries.39
Combining the two size measures gives the overall
size of the financial sector, and is denoted by OFDS. Combining the two activity
measures gives the overall activity of the financial sector, and is denoted by
OFDA.
The sources are the ESDS, World Development Indicators (2010) and Beck et al. (2000)
financial structure database, updated in April 2010.
3.3.4 Measuring financial liberalisation
Broadly speaking, financial liberalisation involves the deregulation of domestic
financial markets and capital account liberalisation. By referring to this argument, I
focus on both the de jure measure and de facto measure of financial liberalisation. The
39 This is done by summing the measures of the size and activity of the financial sector.
98
de jure measure of financial liberalisation is based on regulation restrictions and control
over capital account ownership while the de facto measure of financial liberalisation is
based on the measurement of the intensity of capital flows and correlation. Thus, to
assess whether financial liberalisation promotes financial development or whether
financial liberalisation makes a country more financially open, I consider the use of
three de jure and de facto measures of financial liberalisation indicators.
First I use BHL; this is the official liberalisation date as indicated by Bekaert et al.
(2005). I include the dates of financial liberalisation as a measure of financial
liberalisation because it indicates the start of the liberalisation process. Several studies,
such as Bandiera et al. (2000) and Hermes and Lensik (2005), have criticised the use of
liberalisation dates arguing that financial liberalisation is a process rather than an event.
However, because financial liberalisation involves the change from a repressed financial
economy to a free one, this suggests that financial liberalisation is a modification factor
in the financial sector. In addition, I am concerned with the period of opening and
subsequent openness, thus, the use of liberalisation dates can be justified because it
captures this change.
I use official liberalisation dates from Bekaert et al. (2005).40
These dates generally
coincide with regulatory reform dates and liberalisation dates provided by the
international financial corporation (IFC). The data is available for 62 countries, with 52
of these countries liberalising their stock markets between 1980 and 1999. The authors
provide a detailed chronology of important financial, economic and political events in
emerging markets in the 1980s and early 2000s.41
Based on the chronologies presented
in Bekaert and Harvey (2000), Table 3-5 appendix III.I provides the official
liberalisation dates for the countries in the sample. According to the table, the countries
used in this study liberalised their financial sector between 1985 and 1995. Thus, to
capture the effect of liberalisation, I assigned a value of 1 for each year beginning from
the year in which financial liberalisation is said to have occurred and 0 in the years prior
to the liberalisation dates. I augment the BHL dates for Russia using available
information from Buiter and Taci (2003).
40 This coincides with the equity liberalisation date. Since it is difficult to establish the liberalisation dates in the
banking sector due to the fact that countries might choose to lift different regulations at different times, the official
liberalisation date provided by BHL therefore includes the dates of removal of credit controls, liberalisation of
interest rate, exchange rate, first American Depository Receipt (ADR) dates and liberalisation of FDI. 41 For more information, see <http://www.duke.edu/~charvey/chronology.htm>.

99
The second indicator is the KAOPEN index42
is a de facto measure of financial
liberalisation and it measures a country’s degree of capital account openness. This is
constructed by Chinn and Ito (2006) and was updated in 2009. The KAOPEN index is a
binary dummy variable and takes into account four different restrictions on cross border
financial transactions, reported in the IMF’s Annual Report on Exchange Arrangements
and Exchange Restrictions (AREAER) for a set of 182 countries during the period 1970-
2007. The variables considered include:
Variable indicating the presence of multiple exchange rates (k1),
Variable indicating restrictions on current account transactions (k2),
Variable indicating restrictions on capital account transactions (k3), and
Variable indicating the requirement of the surrender of export proceeds (k4).
The KAOPEN index has a mean of zero and ranges in value from -2.66 (full capital
controls) to 2.66 (complete liberalisation). The index has a wide coverage, as it is
available for more than 100 countries and for a long time period (1970 through 2005).
An advantage of using this index according to Ito (2005) is that ‘it attempts to measure
the intensity of capital controls, insofar as the intensity is correlated with the existence
of other restrictions on international transaction.’
Kaminsky and Scmukler (2003) define financial liberalisation to consist of “the
deregulation of the foreign sector capital account and the domestic financial sector with
the stock market sector viewed separately from the domestic financial sector”.
However, because the present chapter seeks to examine the role of financial
liberalisation on the development of the financial system, the third indicator is the
financial freedom index which is obtained from the Heritage Foundation Index of
Economic Freedom Database (2010).43
The index captures the direct effect of financial
liberalisation (i.e. openness of the banking and financial system) and the independence
42 More information on the index and how it is constructed can be found in Chinn and Ito, (2008), “A new measure of
financial openness”, Journal of comparative policy analysis, 10(3), p.309-322 or a later version in Chinn and Ito
(2009), “Notes on the Chinn and Ito Financial Openness Index updated 2009,,”
<http://web.pdx.edu/~ito/Readme_kaopen2009.pdf> 43 According to the Heritage Foundation, the financial freedom index measures the relative openness of each
country’s banking and financial system by determining: the extent of government regulation of financial services, the
extent of state intervention in banks and other financial services, the difficulty of opening and operating financial
services firms (for both domestic and foreign individuals), and government influence on the allocation of credit. The
country’s financial climate is measured as an overall score between 0 and 100, where 100 represent the maximum
degree of financial freedom. For more information, see < http://www.heritage.org/index/Financial-Freedom.aspx>.
100
of the financial sector from government control. According to the Heritage Foundation
Index of Economic Freedom, a country is classified as free or repressed using a scale of
0 to 100. For the purpose of this study and to ease interpretation, I rescaled the index
range from 1 to 5, with 5 representing the freest country and 1 reflecting financial
repression.
The indicators of financial liberalisation used in this study addresses issues relating to
the domestic financial market, stock market and capital account liberalisation. In theory,
I expect the financial liberalisation variable to positively impact financial development.
3.3.5 Other reforms, policies and control variables
For the analysis, I consider the role of other reforms, macroeconomic fundamentals and
additional variables correlated with both financial liberalisation and financial
development. This is because there may be other reforms that have a similar effect on
financial development. For example, Ucer (1998) notes that real interest rate
liberalisation is supposed to lead to financial development as demand for money and
term deposits, as well as checking accounts and currency, increases as a ratio of national
income, which in turn is thought to promote economic growth. Thus, to avoid
specification bias, I included control variables ( ) in the model. They include trade
liberalisation, external capital flows (ECF), inflation and institutional quality. The
description, sources of data and expected signs can be found in Table 3-6 (Following Ito
(2005), I exclude inflation rates in excess of 100 percent from the sample.
3.3.6 Estimation techniques
The study estimates equation (3.3) with panel data from 11 developing countries during
the period 1980-2007. It has been shown that pooled ordinary least squares (OLS)
methods can lead to biased results because it ignores unobserved cross-country
heterogeneity. For example, there are good reasons to believe that unobserved
individual factors such as differences in terms of financial institutions and legal and
colonial history are difficult to observe, and they most likely affect financial
development in the sample countries. However, using the panel data approach has a lot
of advantages over the conventional OLS method, because it is able to identify such
country-specific effects which time series or cross-section methods are unlikely to
detect.

101
Panel data techniques can be performed by both fixed and random effects models as
described by Baltagi (2007). Fixed effects (FE) models assume that the intercept is a
fixed parameter to estimate and that the intercept is cross-section specific (in this case it
differs from country to country), although it may not differ over time. The FE method is
appropriate in the presence of cross-country heterogeneity because it allows for
unobserved factors that explain financial development between two countries and,
therefore, leads to unbiased and efficient results. A short coming of the FE model,
however, is that it is unable to compute for the coefficient of time-invariant variables,
such as country dummy, because these variables are dropped within transformation.
Another short coming is that it may include too many dummy variables, therefore,
costing us a lot of degrees of freedom.
This is in contrast to the Random effects (RE) model which assumes that the intercept is
a random parameter to estimate. The RE model is similar to the FE model, in that it
postulates a different intercept for each individual, but it interprets these differing
intercepts in a new way (Kennedy, 2008). The RE model allows the parameters to vary
over the cross-section (i.e. country). This model is more suitable when I have the
individual (country) dimension N relative to the time dimension T, because the random
effects will be more efficient than fixed effects. However, Egger and Pfaffermayr
(2004) note that the RE estimates are inconsistent when the regressors are correlated
with the error term. Hsiao (2003) suggests that random effects (RE) models are
appropriate whenever I consider the differences I observe in a group of countries to be
representative of the total population dataset constituting all countries in the world.
To choose between the two methods I performed a Hausman test.44
The Hausman test
checks a more efficient model against a less efficient, but consistent model, to make
sure that the more efficient model also gives consistent results. The Hausman test, tests
the null hypothesis that the coefficients estimated by the RE estimator are the same as
the ones estimated using the FE estimator. If the null hypothesis is not rejected (i.e. the
p-value is insignificant), then the RE method is used. If the null hypothesis is rejected
(p-value is significant), the FE estimator is used (see Kennedy, 2008: 286 and Data and
Statistical Services, 2007).
44 We obtain a chi2(6) = 16.18 with a p-value of 0.0128. The significant p-value indicates the appropriate use of the FE estimator.

102
3.4 Empirical results
3.4.1 Summary statistics
The descriptive statistics are presented in Table 3-2a and b. Specific items in the table
and their interpretations are discussed. From Table 3-2a, I notice that there is substantial
variation in FD indicators across the sample. The ratio of liquid liability has a mean of
approximately 38.10 percent and a standard deviation of 25.08 percent, with a minimum
value of 11.04 percent (Mexico) and a maximum of 162.97 percent (China). I observe a
similar difference for private credit. Whilst Ghana has the minimum private credit ratio
(1.54 percent) amongst the countries during 1980-2007, Brazil has the highest (134.64
percent). Stock market capitalisation has a standard deviation of 0.19 percent and a
mean of approximately 0.20 percent. The within country variation adds another 0.18
percent standard deviation for market capitalisation and 0.12 percent for total value of
stocks traded. The total value of stocks traded has a mean of approximately 0.08
percent.
In terms of the total value of stocks traded, notice that there are substantial variation
across the countries in the sample, with a minimum of 0 (all the SSA countries and
Mexico, at one period or the other) and maximum of approximately 1.11 percent for
India. The overall size of the financial sector (measured by the sum of the liquid
liabilities ratio and stock market capitalisation) has a mean of 34.66 and approximately
26 percent standard deviation. The overall activity of the financial sector (measured by
the sum of private credit and the total value of stocks traded) has a mean of
approximately 27 percent and a standard deviation of approximately 27 percent.
As a measure of capital controls, the KAOPEN index has a mean of -0.68 and range in
value from -1.81 (Brazil, full capital control) to 2.54 (Mexico, complete liberalisation).
The lower score on the Chinn-Ito index does not indicate more complete closure on
cross border financial transactions since the index’s components are calculated from
dummy variables simply indicating the presence or absence of the four types of
restrictions outlined above.

103
Table 3-2: Summary of data set used
a. Descriptive statistics
Variable Mean Std. Dev. Min Max
Banking sector
M3 38.10 25.08 11.04 162.97
PC 28.33 26.48 1.54 134.64
Stock market
MCAP 0.20 0.19 0.00 1.41
TVALUE 0.08 0.16 0.00 1.11
Overall financial development
OFDSS 34.66 26.39 0.00 163.29
OFDA 26.55 26.59 0.00 134.77
Financial liberalisation indicator
BHL 0.56 0.50 0.00 1.00
FINDEX 2.05 1.11 1.00 4.00
KAOPEN -0.68 1.21 -1.81 2.54
Economic and policy related variables
Y 1410.06 1320.76 169.65 4530.81
TRADE 55.10 29.41 6.32 204.72
OPENK 51.54 32.09 10.32 153.97
TINDEX 2.27 1.04 1.00 5.00
FDI 1.83 2.07 -6.90 10.51
INF 15.21 16.57 -2.07 97.64
INS 0.49 0.13 0.14 0.81
Notes: Data for the banking sector is retrieved from World Bank’s World Development Indicator, (2010), Stock
market indicators are retrieved from Beck et al.’s financial structure (2010). Overall financial development indicator
(Size: refers to the aggregate of the measures of the size of both the bank and the stock market; Activity: refers to the
aggregate of the measures of the activity of the bank and stock market). OPENK is retrieved from Penn World Table,
Version 6.3, (2009).

104
b. Correlation matrix
Variable 1 2 3 4 5 6 7 8
1 liquid liabilities 1
2 private credit 0.8465* 1
3 stock market capitalisation 0.2681* 0.1944* 1
4 value of stocks traded 0.5168* 0.4019* 0.5883* 1
5 overall financial development (size) 0.8446* 1.0000* 0.2039* 0.4073* 1
6 overall financial development (activity) 1.0000* 0.7549* 0.2019* 0.4049* 0.7699* 1
7 official liberalisation date 0.2002* 0.1455* 0.4407* 0.2502* 0.1940* 0.1984* 1
8 financial freedom index -0.2935* -0.2799* -0.3365* -0.3967* -0.2622* -0.2315* -0.1481 1
9 capital account liberalisation -0.1356* -0.2086* 0.0819 -0.1198 -0.1855* -0.1499* 0.4151* 0.4542*
10 real GDP per capita -0.1428* 0.0382 0.1722* 0.016 0.0203 -0.1431* 0.2089* 0.2846*
11 trade -0.1756* -0.3139* 0.0174 -0.2664* -0.3092* -0.2339* 0.2188* 0.0995
12 openness (constant term) -0.108 -0.2543* 0.2666* -0.1614* -0.2425* -0.1375* 0.2531* -0.023
13 trade freedom index -0.2862* -0.2441* 0.0014 -0.3309* -0.2353* -0.2898* -0.0593 0.4031*
14 foreign direct investment (net inflow) 0.0581 0.0125 0.0507 0.038 0.0106 -0.0112 0.2243* 0.0557
15 inflation -0.2896* -0.3028* -0.0904 -0.2576* -0.2653* -0.2048* -0.0833 0.1086
16 institutional quality 0.1913* 0.2962* -0.1264 0.2039* 0.2860* 0.1882* 0.0349 0.2180*
Variable (contd) 9 10 11 12 13 14 15 16
9 capital account liberalisation 1
10 logarithm of GDP per capita 0.3233* 1
11 trade 0.1674* -0.0881 1
12 openness (constant term) 0.0367 -0.1125 0.6850* 1
13 trade freedom index 0.5933* 0.4180* 0.0986 0.0163 1
14 foreign direct investment (net inflow) 0.2725* 0.0361 0.3844* 0.108 0.1951* 1
15 inflation -0.2260* -0.2250* 0.1646* 0.0909 -0.1806* 0.0574 1
16 institutional quality -0.0338 0.2348* -0.1115 -0.0843 -0.0394 -0.1157 -0.2455* 1
Please see Table 3-2(a) for information.

105
Table 3-2b displays the correlation coefficient of the dependent and independent
variables in the regression. Here, the dependent variable is a measure of financial
development (either of banking, stock market or overall financial development).
According to the table, most of the financial development indicators are highly
correlated with each other. Furthermore, I notice that most of the financial development
indicators are negatively correlated with the financial liberalisation indicators, and most
of the coefficients are statistically significant at the 5 percent level. The low value of the
correlation coefficient is not sufficient to conclude about the lack of a strong
relationship between the variables under consideration. Therefore, I present some
regression specification to confirm the link between financial liberalisation and financial
development.
The empirical estimation is done following several additive steps: (1) the baseline
model is estimated with the FD indicators as the dependent variables and each of the
liberalisation indicators and real GDP per capita as independent variables45
and (2) I see
how macroeconomic policies affect FD by including related variables to the previous
step. I replicate the results using FINDEX and KAOPEN and this is discussed below.
The results for the banking sector and stock market development indicators are reported
in Tables 3-3 - 3-8.
3.5 Banking development indicators
I examine the effect of financial liberalisation on the financial development in eleven
emerging markets. I present the regression results from the FE method, reported in
Table 3-3a and b. I use four different financial indicators to capture development in both
the banking sector and the stock market. To measure the overall development of the
financial sector, I sum indicators of the size and activity of the financial sector.
3.5.1 Liquid liabilities
In Table 3-3a, liquid liabilities is used to proxy financial development.46
The results
from Table 3-3a show that in most regressions, the overall banking development
coefficient is positive as a country becomes more open. Here, the move to liberalisation
as indicated by BHL enters with a positive, but insignificant coefficient when banking
sector development is proxied by M3. The positive sign of the coefficient is consistent
45 To conserve space, we report only Step 2. 46 Models 1 and 2 represent banking sector development, Models 3 and 4 refer to stock market development and
Models 5 and 6 represent the overall development of the financial sector.

106
with our expectation, however, the non-significant coefficient might be that financial
liberalisation in the countries in our sample has not improved the efficiency of the
banking sector. In specification 1b and c, both the financial freedom index and the
capital account liberalisation index enter with a negative sign. The coefficient, however,
is statistically significant.
Economic growth is correctly signed in models 1a and c with a highly significant
coefficient. The positive sign of GDP per capita is consistent with the theory. Our result
is consistent with previous literature such as Baltagi et al. (2008), who found a positive
relationship between the logarithm of GDP per capita and financial development, and
Kiran et al. (2009), who also found a positive relationship for China’s provinces.
However, these findings are in contrary to DeGregorio and Guidotti (1995) who found a
negative impact of banking sector development on economic growth in Latin America
between the 1970s and 1980s.
Trade has a positive relationship with financial development across the model. Inflation
also enters with the right sign; however, the coefficient is only significant in Model 1b.
FDI enters with a mixed sign and the coefficient is statistically insignificant. Yartey and
Adjasi (2007) note that institutional quality is important for financial market
development, because efficient and accountable institutions tend to broaden the
confidence level of investors. In the analysis, I find institutional quality has a negative
effect on financial development with a statistically significant coefficient. I observe that
institutional quality, such as level of corruption, rule of law and bureaucratic quality, all
pertaining to the core areas of governance, are weak and as such do not promote
financial development in the countries in our sample. The result is contrary to Yartey
(2007a) who found that good quality institutions such as law and order, bureaucratic
quality and democratic accountability are important determinants of stock market
development, because they reduce political risk and enhance viability of external
finance. I note that overall, the performance of our model is satisfactory.

107
Table 3-3: Impact of financial liberalisation on financial development in developing countries (Annual data 1980-2007)
a. Financial development indicator
FD proxied by
Model 1 Model 2 Model 3
M3 PC MCAP
1a 1b 1c 2a 2b 2c 3a 3b 3c
BHL 0.2369 - - 2.1078 - - 0.1752 - -
(0.13)
(2.06)**
(5.02)***
FINDEX - -1.5912 - - -1.1603 -
-0.0382 -
(-1.78)*
(-1.96)*
(-2.93)***
KAOPEN - - -2.1924 - - -1.3467 - - 0.0048
(-2.64)***
(-3.15)***
(0.31)
Economic and Other policy Variables
Y 0.0155 0.0133 0.0174 0.0102 0.0099 0.0120 0.0002 0.0003 0.0003
(4.39)*** (5.19)*** (4.75)*** (6.98)*** (5.90)*** (8.43)*** (5.93)*** (5.43)*** (5.26)***
TO 0.3068 0.3280 0.3116 0.1177 0.0660 0.1385 0.0011 0.0004 0.0032
(4.22)*** (5.38)*** (4.78)*** (3.81)*** (1.40) (4.81)*** (1.12) (0.28) (3.61)***
ECF 0.2681 -1.4734 0.6180 0.1024 -0.1721 0.3746 0.0011 -0.0004 0.0004
(0.55) (-2.71)*** (1.13) (0.40) (-0.48) (1.33) (0.22) (-0.05) (0.08)
INF -0.1228 -0.1077 -0.1614 -0.0345 -0.0483 -0.0646 0.0008 0.0004 0.0009
(-2.77)*** (-1.71)* (-3.29)*** (-1.18) (-0.89) (-2.11)** (0.99) (0.41) (1.04)
INS -20.1728 -30.7496 -22.5607 -4.2113 -1.7219 -5.6235 -0.5864 -0.6462 -0.5993
(-2.98)*** (-2.95)*** (-3.27)*** (-0.93) (-0.23) (-1.20) (-2.71)*** (-2.71)*** (-2.30)**
Constant 12.2734 23.1539 9.4788 7.9793 13.7251 5.6244 -0.0711 0.2046 -0.0605
(1.68)* (2.64)*** (1.27) (2.16)** (2.44)** (1.47) (-0.51) (0.89) (-0.40)
R^2
within 0.2992 0.4733 0.3162 0.3487 0.3133 0.3576 0.4523 0.3743 0.3602
between 0.1399 0.1416 0.1161 0.0253 0.0071 0.0194 0.1753 0.0484 0.1221
overall 0.0509 0.0714 0.0408 0.0121 0.0024 0.0097 0.1032 0.0704 0.0617
Obs 222 128 222 233 139 233 195 136 195
Please see Table 3-3(a) for information.
Notes: M3 and PC are obtained from
World Development Indicators, World
Bank (2009). MCAP and TVALUE
are obtained from Beck et al. (2000)
financial structure database updated in
2010. BHL is obtained from Bekaert
et al. (2005), FINDEX is obtained
from Index of Economic Freedom,
Heritage Foundation (2010),
KAOPEN is obtained from Chinn and
Ito (2005), updated in 2009. Y is real
GDP per capita and INS (institutional
quality) and is obtained from Quality
of Government database (2010).
Unless otherwise stated, all other data
are obtained from ESDS, World
Development Indicators, World Bank
(2009). The estimation is done by
controlling for fixed effects. South
Africa has been excluded from the
results as it has been found to be an
outlier.
***, ** and * represents 1%, 5% and
10% significance level respectively.
The t statistics is in parenthesis.

108
3.5.2 Private credit
When financial development is proxied by private credit as in specification 2a-c, the
results indicate that while both liberalisation date and capital account liberalisation have
a positive effect on financial development, only liberalisation date is statistically
significant. The positive impact of capital account liberalisation on private credit
indicates that financial liberalisation improves the efficiency of the banking sector in
our sample. This result provides support for the McKinnon (1973) and Shaw (1973)
hypothesis.
Turning to the macroeconomic conditions and policies, the results show that the
coefficient of economic growth is positive and highly significant. The positive impact of
the economic growth variable provides support for the finance-growth thesis in
developing countries such as Brazil, China, Mexico, Ghana, Nigeria and Zimbabwe.
Though it has been suggested that liquid liability may not be a reliable indicator of
financial development, Kevin and Levine (1993) using a similar indicator for financial
development, find a positive relationship between economic growth and liquid liability.
Although trade enters with a mixed sign, the positive and significant coefficient
indicates that an open economy promotes development of the financial sector. The
result is similar to Do and Levchenko (2004) who examined the role of trade in the
financial development of 77 developed and developing countries. Although financial
development was reported to be slower when compared with developed countries, the
coefficient of trade was positive and statistically significantly in their analysis.
A surprising result from the estimation coefficient is the positive sign of inflation,
though this is insignificant. The coefficient of ECF is insignificant in specification 2.
Institutional quality is negative and significant when banking sector development was
proxied by private credit.
3.6 Stock market development indicators
3.6.1 Stock market capitalisation
The results for the estimation of equation (3.3) are reported in Table (3.3) when
financial development is proxied by stock market capitalisation. Overall, the results
from specifications 3a-c are mixed. While liberalisation date and capital account
openness have a positive impact on financial development, the coefficient of
liberalisation date is highly significant. The financial freedom index has a negative and

109
significant relationship with market capitalisation in the sample of countries. The
negative impact of financial freedom index suggests that the countries in our sample
were mostly repressed during the period of study, thus preventing development in the
stock market.
Economic growth enters with both a negative and positive coefficient that is statistically
significant. In an earlier research, Loayza & Rancière (2004) found evidence of a
negative relationship between short-term changes in bank credit and growth in those
countries that present high levels of financial fragility (proxied by credit volatility and
frequency of banking crises).The coefficient of trade is insignificant, while ECF enters
with a negative coefficient and this is significant in specifications 3a and 3c.
Institutional quality also enters with a negative coefficient and it is significant at 1
percent in Specification 3b.
3.6.2 Value of the stocks traded
Table 3-3b presents the results for the relationship between the value of stock traded and
financial liberalisation. The result indicates that there is a positive and significant
relationship between stocks traded and the date of liberalisation. Using financial
freedom to proxy liberalisation, notice that the coefficient is negative and statistically
significant. The negative relationship implies that financial liberalisation does not lead
to a development in the activity of the stock market; rather it distorts stock market
development in this sample.
Specification 4c shows that capital account openness is positive, however, the
coefficient is insignificant. Economic growth enters with a mixed sign and the
coefficients are statistically significant in all specifications. In this model, trade has an
insignificant relationship with financial development. Inflation is correctly signed and
the coefficient is significant in specification 4b. In this specification, the sign of the
coefficient of ECF is mixed. Specifications 4a and c suggests that ECF does not
promote financial development in this sample. Finally, institutional quality enters with a
positive sign; however, its coefficient is insignificant. For a significant contribution of
institutional quality, policy makers need to concentrate on improving the quality of the
institutional environment, in particular, economic institutions in the developing
countries in our sample.

110
b. Financial development contd
FD proxied by
Model 4 Model 5 Model 6
TVALUE OFDA OFDS
4a 4b 4c 5a 5b 5c 6a 6b 6c
BHL 0.1056 - - 2.8205 - - 4.2271 - -
(3.42)***
(1.11)
(0.74)
FINDEX - -0.0132 - - -1.4200 - - -1.6138 -
(-2.08)**
(-1.27)
(-1.52)
KAOPEN - - -0.0172 - - -1.1994 - - -0.9206
(-2.11)**
(-1.25)
(-0.52)
Economic and Other policy Variables
Y 0.0001 0.0001 0.0001 0.0105 0.0107 0.0126 0.0010 -0.0074 0.0033
(3.22)*** (2.38)** (3.81)*** (2.17)** (3.62)*** (2.54)*** (0.18) (-0.70) (0.69)
TO 0.0005 0.0002 0.0017 0.0478 -0.0519 0.0723 -0.0160 -0.2552 0.0227
(0.87) (0.27) (2.86)*** (0.56) (-0.58) (1.06) (-0.15) (-1.41) (0.29)
ECF 0.0009 0.0014 0.0014 0.0491 -0.4129 0.3094 0.1187 -1.5724 0.3719
(0.24) (0.35) (0.42) (0.17) (-0.72) (0.75) (0.10) (-1.28) (0.26)
INF -0.0010 -0.0008 -0.0011 -0.0256 -0.0386 -0.0545 -0.0428 -0.1861 -0.0707
(-2.70)*** (-2.11)** (-2.61)*** (-0.60) (-0.71) (-0.95) (-0.60) (-1.37) (-1.05)
INS 0.0313 -0.1040 -0.0001 0.7314 2.1189 -0.2553 -11.5089 -21.0816 -12.2192
(0.35) (-1.37) (-0.00) (0.11) (0.21) (-0.05) (-0.97) (-1.00) (-1.13)
Constant -0.1898 0.0315 -0.2141 8.4099 18.7544 5.9994 40.1885 85.9621 37.6271
(-2.38)** (0.36) (-2.36)** (1.13) (2.87)*** (0.78) (4.49)*** (2.67)*** (4.60)***
R^2
within 0.2039 0.1299 0.1519 0.2982 0.2767 0.2954 0.0189 0.0781 0.0125
between 0.001 0.0055 0.0005 0.0096 0.0000 0.0084 0.0153 0.1178 0.0445
overall 0.0064 0.0005 0.0000 0.0037 0.0009 0.0039 0.0000 0.1022 0.0177
Obs 192 133 192 235 141 235 235 141 235
Please see Table 3-3(a) for information.

111
3.7 Overall financial development indicators
3.7.1 Activity of the financial system
I use the sum of the activity indicators of both the banking sector and the stock market
to capture the activity of the overall development of the financial sector (OFDA).
According to this table 3-3b, none of the financial liberalisation indicators promote
financial development. Economic growth is positively related to financial development.
Trade and external capital flows both enter with a mixed sign and their coefficient is
insignificant across all specifications. Inflation has the right sign; but the coefficient is
insignificant in specifications 5a-c. The relationship between institutional quality and
the activity of overall financial development is positive in specifications 5a-b, however
the coefficient is insignificant.
3.7.2 Size of the financial system
To capture the size of the overall development of the financial sector, I sum the size
indicators of both the banking sector and the stock market. According to table 3-3b, all
the measures of financial liberalisation have no impact on financial development;
however, the date of liberalisation has a positive impact. Economic growth enters with
mixed signs, and where it is positive, the coefficient is insignificant, specifications 6a
and c. Trade and external capital flows also enter with mixed signs and their coefficients
are insignificant across all specifications. Inflation has the right sign; but the coefficient
is insignificant in specifications 6a-c. The relationship between institutional quality and
the size of overall financial development is positive in specifications 6a-b and the
coefficient is insignificant.
3.8 Impact of financial liberalisation on financial development in sub-sample
In order to have a better picture of the effect of FL on FD, I further split our sample of
countries into two sub-samples, following MSCI and FTSE market classification. I
created a sub-sample of countries for which I have firm knowledge of the date of the
establishment of stock markets. Therefore, I report the results of the regression of
equation (3) for this sub group of countries.

112
3.8.1 Market classification sub-sample47
This sub-sample consists of both emerging and frontier markets in accordance to MSCI
and FTSE market classification. The results of the estimation of equation (3) for market
classification are reported in Table 3-4 and Table 3-5. I only provide explanation for the
relationship between financial liberalisation and FD in the BRIMC and SSA countries.48
Table 3-4a and b show the results of the analysis of the impact of financial liberalisation
on financial development in the BRIMC (emerging) countries. According to
specification 1a and Table 3-4a, financial liberalisation has a positive impact on liquid
liabilities in the emerging countries in our study. The result indicates that the coefficient
is statistically significant. Turning to the economic and policy variables, I notice that all
the variables enter with the correct sign, however, only economic growth and quality of
government is statistically significant. This result indicates that the quality of the
government is poor in the BRIMC countries.
Specification 1b shows that our measure of financial liberalisation (FINDEX) has a
negative coefficient and an insignificant impact on liquid liabilities. While trade has a
positive and significant impact on financial development, FDI inflow has a negative
impact, however, the coefficient is significant. I find a similar result for KAOPEN in
specification 1c.
Turning to specification 2a, when private credit is used to proxy financial development;
the impact of financial liberalisation (BHL) on financial development is relatively
positive and the coefficient is statistically significant. This implies that the move
towards opening the banking sector has improved financial activities in the BRIMC
countries. However, using financial freedom and capital account openness to measure
financial liberalisation, specification 2b and c reports that the move towards financial
openness had reduced the activity of the banking sector in the BRIMC countries. The
coefficients in both models are statistically significant. The result obtained is similar to
that of Chinn and Ito (2005) who concludes that opening the capital account may be
helpful to the development of Asian equity market.
47 The frontier market consists of all SSA countries in our sample, excluding South Africa. 48 These are also referred to as emerging and frontier markets.

113
Table 3-4: Impact of financial liberalisation in emerging markets (Annual data 1980-2007)
a. Financial development indicator
FD proxied by
M3 PC MCAP
1a 1b 1c 2a 2b 2c 3a 3b 3c
BHL 17.0529*** - - 9.6802*** - - 0.1754*** - -
(3.04)
(2.95)
(2.91)
FINDEX - -1.3659 - - -2.4849** - - -0.0100 -
(-1.17)
(-2.32)
(-0.48)
KAOPEN - - -3.3909 - - -2.3239* - - 0.0110
(-1.38)
(-1.65)
(0.46)
Economic and other policy variables
Y 0.0185 *** 0.0137 *** 0.0206 *** 0.0150 *** 0.0117*** 0.0160*** 0.0002 *** 0.0003*** 0.0003 ***
(3.25) (4.26) (3.40) (4.53) (3.94) (4.59) (5.46) (5.36) (5.07)
TO 0.3225 0.7255 *** 0.7580 *** -0.0220 0.1068 0.1917* 0.0020 0.0065** 0.0049 ***
(1.49) (4.12) (3.77) (-0.17) (0.83) (1.78) (1.01) (2.30) (2.57)
ECF 1.4201 -3.6042 *** 2.0976 0.5584 -1.4055 1.0463 0.0090 0.0355* 0.0096
(0.94) (-3.16) (1.35) (0.63) (-1.38) (1.16) (0.54) (1.76)* (0.55)
INF -0.0654 -0.1415 -0.1783 0.0602 0.0447 -0.0092 -0.0014 -0.0003 -0.0017
(-0.40) (-1.46) (-1.05) (0.62) (0.49) (-0.09) (-0.87) (-0.17) (-1.03)
INS -103.7873 *** -56.3692 *** -63.3277 *** -42.8268 *** -13.3411 -19.8999 -0.2431 -0.1241 0.1435
(-3.60) (-2.71) (-2.37) (-2.51) (-0.71) (-1.26) (-0.87) (-0.33) (0.55)
Constant 40.4341** 31.7544* 10.2787 26.7452 *** 25.4753* 10.7885 -0.4622 *** -0.6784** -0.6128 ***
(2.31) (1.90) (0.58) (2.67) (1.93) (1.07) (-2.73) (-2.41) (-3.44)
R^2
Within 0.5539 0.7139 0.515 0.4893 0.4290 0.4550 0.5953 0.5766 0.5516
Between 0.4638 0.4301 0.4018 0.3116 0.3769 0.2699 0.1374 0.1152 0.0857
Overall 0.1374 0.2393 0.1163 0.1758 0.2587 0.1412 0.0767 0.0064 0.0573
Obs 93 128 93 97 64 97 87 62 87
Please see Table 3-3(a) for information.

114
b. Financial development contd
FD proxied by
TVALUE OFDA OFDS
4a 4b 4c 5a 5b 5c 6a 6b 6c
BHL 0.1537** - - 9.8417*** - - 32.5250*** - -
(2.06)
(2.98)
(3.46)
FINDEX - -0.0050 - - -2.4892** - - -5.4799 -
(-0.21)
(-2.30)
(-1.38)
KAOPEN - - -0.0577* - - -2.3601* - - 5.1365
(-1.98)
(-1.67)
(1.25)
Economic and other policy variables
Y 0.0001* 0.0002** 0.0002** 0.0151*** 0.0118*** 0.0161*** 0.0072 0.0036 0.0050
(1.93) (2.22) (2.38) (4.51) (3.92) (4.58) (0.76) (0.32) (0.48)
TO 0.0018 0.0025 0.0059*** -0.0195 0.1054 0.1956* -0.8271** -1.7098*** -0.3401
(0.73) (0.78) (2.61) (-0.11) (0.81) (1.81) (-2.47)
(-3.58)
(-1.08)
ECF 0.0098 0.0237 0.0126 0.5731 -1.3820 1.0692 3.4692 -5.4699 4.9754*
(0.49) (1.04) (0.64) (0.64) (-1.34) (1.17) (1.36) (-1.44) (1.87)
INF -0.0030 -0.0014 -0.0040* 0.0573 0.4320 -0.0133 -0.0444 -0.0433 -0.1203
(-1.52) (-0.68) (-2.05) (0.59) (0.47) (-0.13) (-0.16) (-0.13) (-0.41)
INS 0.1800 0.0804 0.5387* -42.6114* -13.4717 -19.3021 -133.0738*** -182.9587*** -58.3611
(0.51) (0.19) (1.75) (-2.48) (-0.71) (-1.21) (-2.72) (-2.62) (-1.26)
Constant -0.3829 -0.2977 -0.6993 *** 26.5385*** 25.6546* 10.3200 104.0456*** 234.5841*** 78.5105***
(-1.80)* (-0.93) (-3.27) (2.64) (1.92) (1.02) (3.63) (4.77) (2.65)
R^2
Within 0.3324 0.2234 0.3297 0.4918 0.4258 0.4569 0.2028 0.2664 0.1079
Between 0.9324 0.9341 0.9641 0.3131 0.3797 0.2708 0.2889 0.1673 0.2564
Overall 0.0210 0.3359 0.0312 0.1752 0.2608 0.1405 0.0473 0.0201 0.0473
Obs 86 60 86 97 64 97 97 64 97
Please see Table 3-3(a) for information.

115
In terms of the stock market, I find that in specification 3a and c, the impact of financial
liberalisation is positive, however, specification 3a has a statistically significant
coefficient. In specification 3b, FINDEX has a negative and insignificant impact on
market capitalisation. specification 3c indicates that the impact of capital account
openness index on emerging countries stock market, though positive, the coefficient is
insignificant. According to the results of specification 4a, FL has a positive and
significant impact on the volume of stocks traded, whereas, specification 4b and c report
a negative impact, but the coefficient in specification 4c is significant.
Turning to the overall development of the activity of the financial sector in specification
5a-c, I observe that financial liberalisation enters with both positive and negative signs
with a significant coefficient. Finally, specification 6a-c shows that financial
liberalisation has a positive and significant effect on overall development of the size of
the financial sector. In specification 6a and c, however, the impact is negative and
insignificant when FINDEX is used to proxy financial liberalisation. Overall, the move
towards financial openness has predominantly led to a positive and significant
improvement in BRIMC’s financial system.
The results for the impact of financial liberalisation on financial development in the
SSA (frontier) countries are presented in Table 3-5a and b. In terms of banking sector
development, as measured by the rate of liquidity, the coefficients on all financial
liberalisation proxies are significantly negative; indicating that openness in the financial
sector has led to a reduction in liquid liabilities in the SSA countries in the sample.
Specification 2a and b both enter with a positive sign; however, only specification 2b
has a significant coefficient. In the same vein, specification 2c enters with a negative
sign and the coefficient is insignificant. Using market capitalisation to proxy for
financial development, our indicators of financial liberalisation also enter with a mixed
sign in specification 3a-c. I observe that whilst specification 3a indicates a positive and
highly significant impact of BHL on market capitalisation, specification 3b-c show a
negative impact with FINDEX having a significant relationship on market capitalisation
in our SSA sample. The positive and significant impact of BHL on market capitalisation
indicates that SSA countries have been able to increase their market capitalisation share
by moving towards a more open financial sector.
In specification 4, I observe that the financial liberalisation indicators also enter with a
mixed sign. In specification 4a and c, the measures of financial liberalisation enter with

116
a positive sign, but Model 4a has a significant coefficient. Specification 4b shows that
FINDEX enters with a negative sign and the coefficient is statistically significant.
Our indicators of FL in specification 5a-b both have positive signs, but specification 5a
has a significant coefficient. In specification 5c, the sign of the coefficient of KAOPEN
is negative and statistically insignificant. Finally, I note that for the overall development
of the size of the financial sector, all our indicators of financial liberalisation are
statistically insignificant with a negative coefficient.
From Table 3-5a and b, I notice that of all the indicators of financial liberalisation, BHL
has a positive and statistically significant effect on stock market development than
banking sector. This suggests that financial openness has improved the stock markets in
the SSA countries in our sample.

117
Table 3-5: Impact of financial liberalisation in frontier markets (Annual data 1980-2007)
a. Financial development indicator
FD proxied by
M3 PC MCAP
1a 1b 1c 2a 2b 2c 3a 3b 3c
BHL
-2.2659 - - 1.4094 - - 0.1248 - -
(-1.68)*
(1.60)
(3.24)***
FINDEX
- -0.5220 - - 1.0908 - - -0.0455 -
(-4.05)***
(1.76)*
(-1.84)*
KAOPEN
- - -1.3748 - - -0.6012 - - -0.0025
(-2.23)**
(-1.47)
(-0.13)
Economic and other policy variables
Y
0.0033 0.0048 0.0034 0.0055 0.0057 0.0069 0.0001 0.0001 0.0001
(1.52) (1.26) (1.62) (4.56)*** (3.52)*** (5.59)*** (1.81)* (1.93)* (1.67)*
TO
0.1759 0.1617 0.1469 0.0706 -0.0029 0.0865 0.0005 -0.0008 0.0018
(4.68)*** (2.98)*** (4.38)*** (2.88)*** (-0.09) (3.90)*** (0.52) (-0.66) (2.19)**
ECF
-0.2801 -0.1717 -0.0347 -0.0516 0.3722 0.0889 0.0022 -0.0040 0.0010
(-0.85) (-0.32) (-0.10) (-0.25) (1.41) (0.40) (0.31) (-0.400 (0.14)
INF
-0.0521 -0.1570 -0.0728 -0.0180 -0.1465 -0.0381 0.0023 0.0011 0.0025
(-1.40) (-2.37)** (-1.88)* (-0.75) (-4.09)*** (-1.51) (2.49)** (0.75) (2.54)**
INS
-14.7159 -15.9851 -15.3221 -2.1968 1.6410 -3.4349 -0.7520 -0.6568 -0.8639
(-2.96)*** (-2.04)** (-3.10)*** (-0.67) (0.37) (-1.05) (-6.00)*** (-3.88)*** (-6.20)***
Constant
24.8056 24.9992 24.7987 7.1103 10.3611 6.0682 0.2491 0.5337 0.2878
(6.33)*** (3.87)*** (6.42)*** (2.87)*** (3.03)*** (2.44)** (2.70)*** (4.01)*** (2.97)***
R^2
Within 0.1906 0.3019 0.2049 0.2635 0.3927 0.2613 0.4302 0.3020 0.3.681
Between 0.1111 0.0307 0.0829 0.0219 0.0171 0.0243 0.0853 0.0527 0.0364
Overall 0.0080 0.0001 0.0020 0.0016 0.0006 0.0045 0.1258 0.1407 0.0775
Obs 129 68 129 136 75 136 108 74 108
Please see Table 3-3(a) for information.

118
b. Financial development contd
FD proxied by
TVALUE OFDA OFDS
4a 4b 4c 5a 5b 5c 6a 6b 6c
BHL
0.0285 - - 2.3514 - - -0.5117 - -
(4.76)***
(2.29)**
(-0.26)
FINDEX
- -0.0060 - - 0.8741 - - -0.3133 -
(-1.73)*
(1.02)
(-0.16)
KAOPEN
- - 0.0018 - - -0.4033 - - -1.2245
(0.61)
(-0.83)
(-1.37)
Economic and other policy variables
Y
0.0000 0.0107 0.0000 0.0050 0.0056 0.0064 -0.0042 -0.0079 -0.0031
(-1.33) (5.83)*** (-1.15) (3.41)*** (2.48)** (4.37)*** (-1.58) (-1.50) (-1.15)
TO
-0.0001 -0.0519 0.0001 -0.0089 -0.1212 0.0142 0.0087 -0.0950 0.0003
(-1.03) (-1.30) (1.12) (-0.35) (-3.62)*** (0.60) (0.18) (-1.21) (0.01)
ECF
0.0010 -0.4129 0.0006 -0.0932 0.0799 0.0208 -0.7582 -1.1127 -0.5379
(0.90) (-1.00) (0.53) (-0.39) (0.23) (0.08) (-1.68)* (-1.35) (-1.12)
INF
0.0003 -0.0386 0.0004 -0.0030 -0.1370 -0.0223 0.0440 -0.0252 0.0196
(2.53)*** (-0.78) (2.56)*** (-0.11) (-2.76)*** (-0.75) (0.83) (-0.22) (0.36)
INS
-0.1207 2.1189 -0.1352 3.0165 7.7561 1.8723 -6.7603 -6.6296 -7.7122
(-6.46)*** (0.30) (-6.29)*** (0.80) (1.29) (0.49) (-0.95) (-0.47) (-1.09)
Constant
0.5568 18.7543 0.0662 9.8642 17.6728 8.8131 35.6268 49.0662 34.7368
(3.96)*** (3.58)*** (4.24)*** (3.43)*** (3.91)*** (3.00)*** (6.57)*** (4.64)*** (6.42)***
R^2
Within 0.4747 0.4232 0.3507 0.1699 0.3495 0.1401 0.0668 0.1039 0.0800
Between 0.0524 0.0523 0.0291 0.0025 0.0001 0.0077 0.0425 0.0983 0.0471
Overall 0.0858 0.1447 0.0378 0.0015 0.0145 0.0006 0.0466 0.0801 0.0531
Obs 106 73 106 138 77 138 138 77 138
Please see Table 3-8(a) for information.
119
3.8.2 Financial structure
Following Demirguc-Kunt and Levine (1999) and Ndikumana (2003), countries are
classified into two categories of financial structure: bank-based and market-based
economies. This allows us to investigate whether the structure of the financial system is
important for financial liberalisation. The result suggests that 9 out of the 11 countries
are bank-based.
3.9 Simultaneous opening of trade and financial sector
In this section, I address the question: is trade liberalisation significant for financial
liberalisation in emerging countries? In particular, is trade liberalisation and financial
liberalisation complementary, or substitutes for each other? It is widely acknowledged
that financial liberalisation should be the last step of economic reform and should be
implemented only when trade openness has been achieved. As such, several empirical
analyses have been conducted and the resulting evidence is mixed. For example, Law
(2008) did not find any evidence for the influence of trade liberalisation on financial
liberalisation in Malaysia, whereas Tornell et al. (2004) showed that trade liberalisation
was a precondition for financial liberalisation. This result was also supported by Ito
(2005), who found evidence for the influence of trade openness on capital account
liberalisation in 87 developed countries over the period 1980 to 2000. Using our own
data, I test the RZ hypothesis and I estimate the following model:
1 2 3 4 5 6 7 8( * )it it it it it it it it
it
FD FINLIB Y TLIB ECF INF INS FINLIB TLIB
(3.7)
where FD is a measure of banking sector or stock market development, FINLIB is a
measure of financial liberalisation, Y is a measure of the level of economic
development, TLIB is a measure of trade openness, ECF is external capital flow, INF is
the measure of macroeconomic stability, and INS is a measure of institutional quality.
In testing the RZ openness hypothesis, I included the interaction term between financial
liberalisation and trade liberalisation in the equation. This is because, according to the
hypothesis, opening both the trade and capital market is important for successful FD.
Thus, by including the interaction between financial liberalisation and trade
liberalisation, I was able to test whether the beneficial effect of financial liberalisation
only occurs after a country reaches a certain level of trade liberalisation.

120
Table 3-6: Does the simultaneous opening of trade and financial sector lead to financial development? (Annual data 1980-2007)
a. Financial development indicator
FD proxied by Model 1 Model 2 Model 3
M3
PC
MCAP
1a 1b 1c 2a 2b 2c 3a 3b 3c
BHL 17.3732 - - 8.3618 - - 0.3655 - -
(3.76)***
(3.18)***
(5.57)***
FINDEX - -2.9612 - - -5.1511 - - -0.0186 -
(-0.81)
(-1.96)*
(-0.28)
KAOPEN - - 6.2437 - - 0.7419 - - 0.1109
(2.10)**
(0.44)
(2.86)***
Economic and Other policy variables
Y 0.0174 0.0131 0.0174 0.0108 0.0097 0.0121 0.0002 0.0003 0.0003
(6.33)*** (5.08)*** (6.43)*** (7.82)*** (5.90)*** (8.77)*** (6.61)*** (6.09)*** (6.51)***
TO 0.4871 0.2911 0.1151 0.1827 -0.0389 0.0900 0.0047 0.0009 0.0006
(6.63)*** (2.56)*** (1.35) (4.49)*** (-0.49) (1.89)* (3.43)*** (0.46) (0.52)
ECF -0.1307 -1.4629 0.8346 -0.0177 -0.1471 0.4288 -0.0016 -0.0004 0.0032
(-0.24) (-2.55)*** (1.49) (-0.06) (-0.39) (1.39) (-0.24) (-0.05) (0.43)
INF -0.1374 -0.1131 -0.1723 -0.0418 -0.0612 -0.0675 0.0006 0.0004 0.0008
(-2.36)** (-1.78)* (-2.83)*** (-1.28) (-1.36) (-1.99)* (0.70) (0.37) (0.93)
INS -27.0575 -30.6586 -20.1449 -6.7142 -1.4162 -4.9389 -0.7169 -0.6476 -0.5905
(-3.25)*** (-3.53)*** (-2.43)** (-1.42) (-0.22) (-1.05) (-5.99)*** (-4.08)*** (-4.63)***
TO*LIBDATE -0.3066 0.0235 -0.1369 -0.1116 0.0680 -0.0336 -0.0043 -0.0003 -0.0018
(-4.13)*** (0.39) (-3.00)*** (-2.65)*** (1.57) (-1.32) (-3.30)*** (-0.30) (-2.97)***
Constant 4.5975 25.3874 20.2566 5.2984 19.7141 8.1418 -0.1388 0.1747 0.0470
(0.72) (2.78)*** (2.82)*** (1.53) (3.22)*** (2.11)** (-1.68)* (1.10) (0.49)
R^2
within 0.3532 0.4740 0.3451 0.3692 0.3270 0.3628 0.4840 0.3748 0.3907
between 0.1226 0.1438 0.0935 0.0215 0.0111 0.0152 0.1756 0.0502 0.1786
overall 0.0421 0.0726 0.0278 0.0103 0.0046 0.0072 0.1110 0.0716 0.078
Obs 222 128 222 233 139 233 195 136 195
Please see Table 3-3(a) for
information.

121
b. Financial development indicator
FD proxied by Model 4 Model 5
TVALUE OFDA
OFDS
4a 4b 4c 5a 5b 5c 6a 6b 6c
BHL 0.3196 - - 11.6388 - - 25.3976 - -
(5.63)***
(4.36)***
(3.69)***
FINDEX - -0.0097 - - -8.8639 - - -15.2872 -
(-0.18)
(-3.33)***
(-1.71)*
- - 0.0357 - - -0.3213 - - 8.8427
KAOPEN
(1.04)
(-0.18)
(1.94)*
Economic and Other policy variables
Y 0.0001 0.0001 0.0002 0.0114 0.0102 0.0126 0.0029 -0.0082 0.0038
(3.24)*** (3.03)*** (4.22)*** (7.87)*** (5.72)*** (8.46)*** (0.79) (-1.37) (1.01)
TO 0.0047 0.0003 0.0004 0.1522 -0.2225 0.0510 0.2348 -0.5685 -0.2140
(3.91)*** (0.17) (0.44) (3.63)*** (-3.16)*** (1.01) (2.17)** (-2.41)** (-1.66)*
ECF -0.0023 0.0014 0.0025 -0.1219 -0.3738 0.3320 -0.2919 -1.5005 0.6232
(-0.39) (0.20) (0.40) (-0.40) (-0.93) (1.01) (-0.37) (-1.12) (0.75)
INF -0.0013 -0.0008 -0.0012 -0.0372 -0.0636 -0.0556 -0.0706 -0.2321 -0.0827
(-1.85)* (-0.93) (-1.57) (-1.09) (-1.30) (-1.53) (-0.80) (-1.42) (-0.89)
INS -0.1083 -0.1041 0.0083 -3.6319 1.9982 0.1021 -21.9841 -21.3033 -8.2453
(-1.04) (-0.86) (0.08) (-0.74) (0.29) (0.02) (-1.73)* (-0.93) (-0.65)
TO*LIBDATE -0.0049 -0.0001 -0.0009 -0.1592 0.1274 -0.0141 -0.3822 0.2340 -0.1568
(-4.32)*** (-0.07) (-1.67)* (-3.69)*** (2.90)*** (-0.52) (-3.44)*** (1.59) (-2.27)**
Constant -0.2667 0.0263 -0.1624 4.4984 28.8992 7.0639 30.7981 104.5970 49.4637
(-3.67)*** (0.21) (-1.93)* (1.24) (4.68)*** (1.70)* (3.30)*** (5.06)*** (4.68)***
R^2
within 0.2810 0.1299 0.1653 0.3396 0.3229 0.2963 0.0697 0.0967 0.0354
between 0.0000 0.0055 0.0010 0.0089 0.0029 0.0072 0.0219 0.0577 0.0003
overall 0.0101 0.0004 0.0006 0.0033 0.0002 0.0032 0.0000 0.066 0.041
Obs 192 133 192 235 141 235 235 141 235
Please see Table 3-3(a) for
information.

122
Table 3-6a and b provide the results for the simultaneous opening of trade and financial
markets in the sample of emerging countries. In specification 1a to c, all the financial
liberalisation indicators are positively related to liquid liabilities. The coefficients of
both financial freedom and capital account openness are statistically significant in the 5
percent and 1 percent level, respectively. Turning our attention to the stock market
development indicators, I notice that financial liberalisation has a negative and
insignificant relationship with FD. In specifications 5 and 6, I notice that all the
measures of financial liberalisation entered with mixed signs; however, they were not
statistically significant. From the table, I can conclude that financial liberalisation in the
form of capital account openness, promotes banking sector development in this sample.
In specification 1a and specification 6 a and c, I observe that the contribution of
financial policy is more than the trade policy to the development of the financial sector.
The implication of this is that financial liberalisation, in the form of liberalisation dates
and capital account openness, facilitates financial development. In addition, I notice that
where the coefficients of the financial liberalisation indicators and trade policy are
positive and significant at the 1 percent level, then the interaction between the two ( )
is negative, as can be seen in specification 1a. The negative sign of the coefficient, thus,
does not provide support for the RZ hypothesis. In addition, the evidence shows that
trade and financial sector openness might be substitutes for each other, and not
complementary to each other, as suggested by the openness hypothesis.
In specification 1 and 2, and Table 3-11, economic growth enters into the regression
with a positive sign, consistent with the literature. The coefficient of economic growth
is statistically significant at the 1 percent level in all the specifications except 1b. Using
the stock market indicators, the sign of the coefficient is mixed and statistically
significant. I observe the same effect when I use the overall FD indicator. All of the
coefficients are significant as well. The positive and significant coefficient of economic
growth is consistent with theory.
Trade appears with a mixed sign under the banking sector development. When liquid
liabilities is used to proxy financial development, trade has a positive impact on
financial development with an estimated coefficient of 0.4871. The coefficient for trade
is also positive and significant when I consider private credit. Table 3-11a and
specification 3 and 4 also indicate that trade openness has no significant relationship
with development of the stock market. In specifications 5 and 6, trade openness also
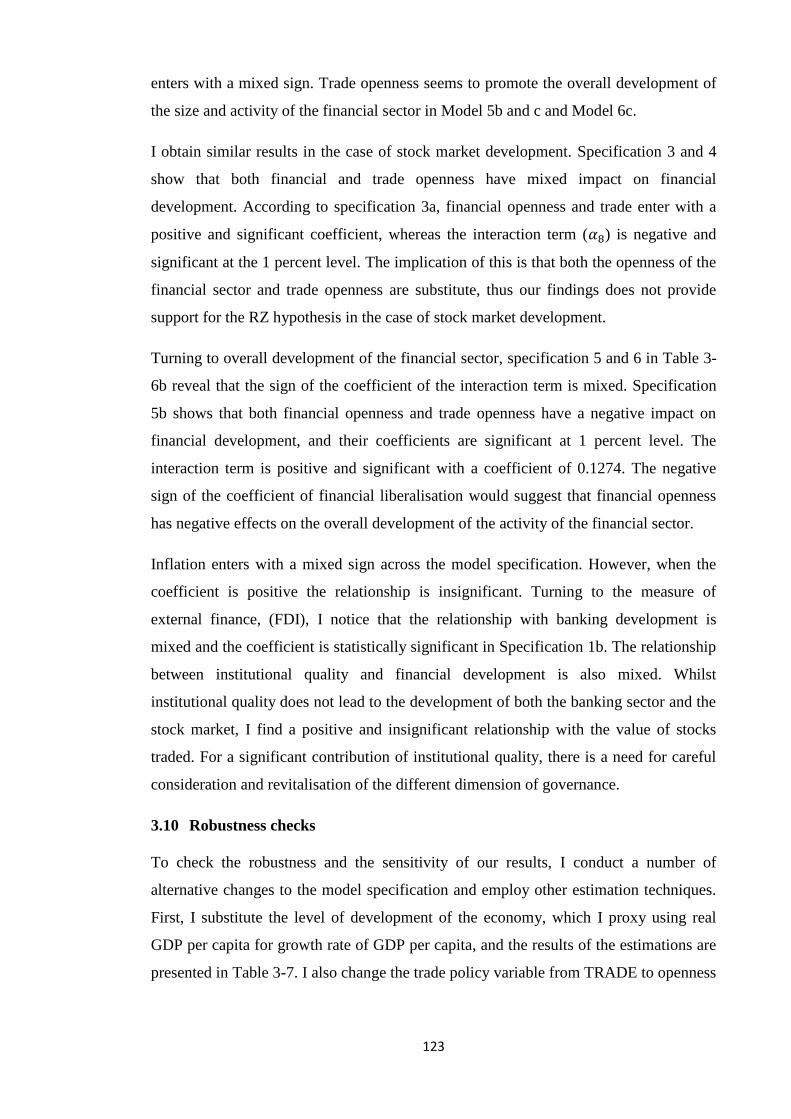
123
enters with a mixed sign. Trade openness seems to promote the overall development of
the size and activity of the financial sector in Model 5b and c and Model 6c.
I obtain similar results in the case of stock market development. Specification 3 and 4
show that both financial and trade openness have mixed impact on financial
development. According to specification 3a, financial openness and trade enter with a
positive and significant coefficient, whereas the interaction term ( ) is negative and
significant at the 1 percent level. The implication of this is that both the openness of the
financial sector and trade openness are substitute, thus our findings does not provide
support for the RZ hypothesis in the case of stock market development.
Turning to overall development of the financial sector, specification 5 and 6 in Table 3-
6b reveal that the sign of the coefficient of the interaction term is mixed. Specification
5b shows that both financial openness and trade openness have a negative impact on
financial development, and their coefficients are significant at 1 percent level. The
interaction term is positive and significant with a coefficient of 0.1274. The negative
sign of the coefficient of financial liberalisation would suggest that financial openness
has negative effects on the overall development of the activity of the financial sector.
Inflation enters with a mixed sign across the model specification. However, when the
coefficient is positive the relationship is insignificant. Turning to the measure of
external finance, (FDI), I notice that the relationship with banking development is
mixed and the coefficient is statistically significant in Specification 1b. The relationship
between institutional quality and financial development is also mixed. Whilst
institutional quality does not lead to the development of both the banking sector and the
stock market, I find a positive and insignificant relationship with the value of stocks
traded. For a significant contribution of institutional quality, there is a need for careful
consideration and revitalisation of the different dimension of governance.
3.10 Robustness checks
To check the robustness and the sensitivity of our results, I conduct a number of
alternative changes to the model specification and employ other estimation techniques.
First, I substitute the level of development of the economy, which I proxy using real
GDP per capita for growth rate of GDP per capita, and the results of the estimations are
presented in Table 3-7. I also change the trade policy variable from TRADE to openness

124
to trade in constant terms (OPENK) and trade freedom index (TINDEX).49
The trade
index policy is a score which is based on two inputs:
1. The trade-weighted average tariff rate, and
2. Non-tariff barriers (NTBs).
According to Ito (2005), the use of a de jure trade openness measure is more appropriate
than using a de facto measure (TRADE: the sum of exports and imports as a ratio of
GDP), for this reason, I check the robustness of our estimation results using TINDEX,
trade freedom index. TINDEX is obtained from Heritage foundation.50
In scoring the
freedom index, each of the variables are weighted equally and turned into an index
ranging from 0 to 100, where 100 is the maximum degree of trade freedom. The results
are supportive of our earlier findings that financial liberalisation has had a significant
positive effect on financial development.
A survey of the literature (such as Ozdemir and Erbil, 2008), reveals that de facto
measures of financial liberalisation for developing countries present more sensible
results, as the use of de jure measures may not effectively capture the effect of financial
liberalisation. Hence, to check the robustness of our result, I substitute the FINLIB
indicators using a de facto measure of liberalisation. This is measured as the sum of
total capital inflow and outflows as a percent of GDP.51
The result indicates that there is
a positive relationship between capital flows and financial liberalisation, and the
coefficient is significant.
49 Although TINDEX is a de jure measure of trade openness, it enters with a mixed sign and the coefficients are not significant in all
the different model specifications, therefore, we do not report these results. 50 According to the Heritage Foundation, the presence of NTBs in a country affects its trade freedom score by incurring a penalty of
up to 20 percent. The trade freedom ranges from 0-100, where 100 is the maximum degree of trade freedom. 51 Capital flows is the sum of FDI, portfolio investment and other investments. In this study, we restrict capital flows to be the natural logarithm of the sum of equity investment and FDI inflows.
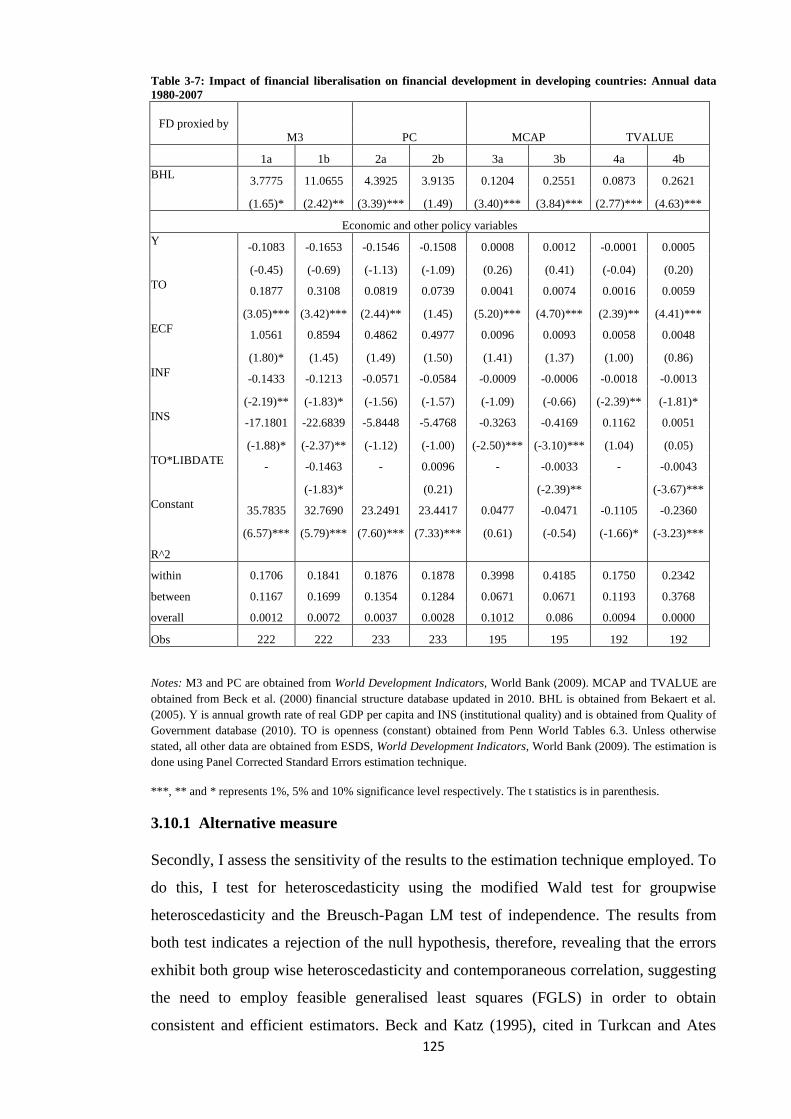
125
Table 3-7: Impact of financial liberalisation on financial development in developing countries: Annual data
1980-2007
FD proxied by
M3 PC MCAP TVALUE
1a 1b 2a 2b 3a 3b 4a 4b
BHL
3.7775 11.0655 4.3925 3.9135 0.1204 0.2551 0.0873 0.2621
(1.65)* (2.42)** (3.39)*** (1.49) (3.40)*** (3.84)*** (2.77)*** (4.63)***
Economic and other policy variables
Y
-0.1083 -0.1653 -0.1546 -0.1508 0.0008 0.0012 -0.0001 0.0005
(-0.45) (-0.69) (-1.13) (-1.09) (0.26) (0.41) (-0.04) (0.20)
TO
0.1877 0.3108 0.0819 0.0739 0.0041 0.0074 0.0016 0.0059
(3.05)*** (3.42)*** (2.44)** (1.45) (5.20)*** (4.70)*** (2.39)** (4.41)***
ECF
1.0561 0.8594 0.4862 0.4977 0.0096 0.0093 0.0058 0.0048
(1.80)* (1.45) (1.49) (1.50) (1.41) (1.37) (1.00) (0.86)
INF
-0.1433 -0.1213 -0.0571 -0.0584 -0.0009 -0.0006 -0.0018 -0.0013
(-2.19)** (-1.83)* (-1.56) (-1.57) (-1.09) (-0.66) (-2.39)** (-1.81)*
INS
-17.1801 -22.6839 -5.8448 -5.4768 -0.3263 -0.4169 0.1162 0.0051
(-1.88)* (-2.37)** (-1.12) (-1.00) (-2.50)*** (-3.10)*** (1.04) (0.05)
TO*LIBDATE
- -0.1463 - 0.0096 - -0.0033 - -0.0043
(-1.83)*
(0.21)
(-2.39)**
(-3.67)***
Constant
35.7835 32.7690 23.2491 23.4417 0.0477 -0.0471 -0.1105 -0.2360
(6.57)*** (5.79)*** (7.60)*** (7.33)*** (0.61) (-0.54) (-1.66)* (-3.23)***
R^2
within 0.1706 0.1841 0.1876 0.1878 0.3998 0.4185 0.1750 0.2342
between 0.1167 0.1699 0.1354 0.1284 0.0671 0.0671 0.1193 0.3768
overall 0.0012 0.0072 0.0037 0.0028 0.1012 0.086 0.0094 0.0000
Obs 222 222 233 233 195 195 192 192
Notes: M3 and PC are obtained from World Development Indicators, World Bank (2009). MCAP and TVALUE are
obtained from Beck et al. (2000) financial structure database updated in 2010. BHL is obtained from Bekaert et al.
(2005). Y is annual growth rate of real GDP per capita and INS (institutional quality) and is obtained from Quality of
Government database (2010). TO is openness (constant) obtained from Penn World Tables 6.3. Unless otherwise
stated, all other data are obtained from ESDS, World Development Indicators, World Bank (2009). The estimation is
done using Panel Corrected Standard Errors estimation technique.
***, ** and * represents 1%, 5% and 10% significance level respectively. The t statistics is in parenthesis.
3.10.1 Alternative measure
Secondly, I assess the sensitivity of the results to the estimation technique employed. To
do this, I test for heteroscedasticity using the modified Wald test for groupwise
heteroscedasticity and the Breusch-Pagan LM test of independence. The results from
both test indicates a rejection of the null hypothesis, therefore, revealing that the errors
exhibit both group wise heteroscedasticity and contemporaneous correlation, suggesting
the need to employ feasible generalised least squares (FGLS) in order to obtain
consistent and efficient estimators. Beck and Katz (1995), cited in Turkcan and Ates

126
(2010), reportedly found that the test statistics based on FGLS is optimal only when the
sample size is small and when there are substantially more time periods than cross-
sectional units. The authors show that OLS with panel corrected errors provides more
efficient estimation than FGLS (Greenberg, 2003 and Stata, 2003). Since our data
consists of time periods (TPs) which are greater than the number of cross-sections (CSs)
in our sample (with N = 11 and T = 28), I thus estimate equation (3.3) using panel
corrected standard error (PCSE) estimation, proposed by Beck and Katz (1995).
Briefly, the PCSE estimation method proceeds as follows:
1. Pool the data from different countries into one dataset and apply OLS.
2. Adjust for autocorrelation by adding a lagged dependent variable to the model.
3. Calculate PCSEs.
The use of the PCSE method also allows us to take into consideration the problem of
heteroscedasticity present in the sample, because the error variance differs across cross-
sectional units due to characteristics unique to the countries. It is important to note that
PCSEs are biased in the presence of autocorrelation, and since the direction of biasness
is unknown, Wilson, 2004 and Goodrich 2006 advocate adding a lagged dependent
variable to the model in order to adjust autocorrelation.
The regression results from the PCSE model are reported in Table 3-13 (below). The
results generally support our main findings that financial liberalisation in the form of
liberalisation dates has a positive and significant impact on the development of the
financial sector in the sample of countries studied. I find that trade appears with a
negative coefficient that is statistically significant in most of the specifications of the
model. The coefficient of institutional quality is positive and significant; however, it is
contrary to those reported in Table 3-8. Those results suggest that better institutional
quality (in the form of corruption, law and order and bureaucracy quality) leads to a
higher level of financial development in the countries studied.
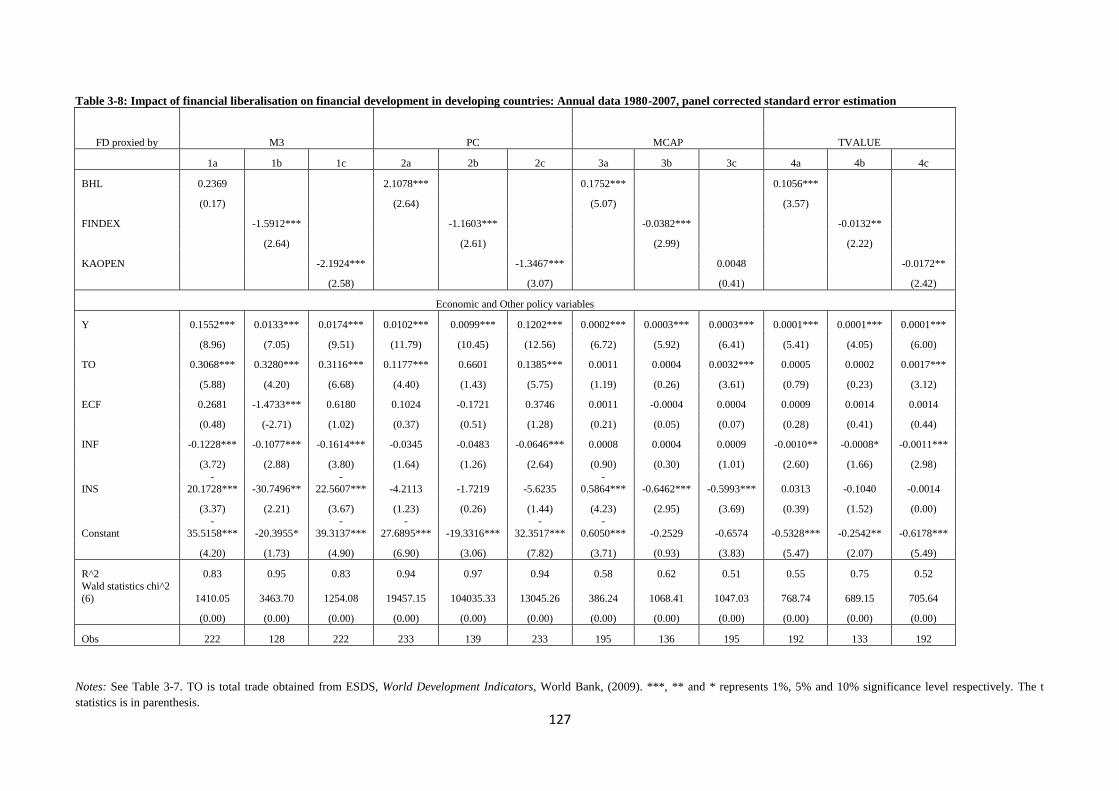
127
Table 3-8: Impact of financial liberalisation on financial development in developing countries: Annual data 1980-2007, panel corrected standard error estimation
FD proxied by
M3 PC MCAP TVALUE
1a 1b 1c 2a 2b 2c 3a 3b 3c 4a 4b 4c
BHL 0.2369 2.1078*** 0.1752*** 0.1056***
(0.17) (2.64) (5.07) (3.57)
FINDEX -1.5912*** -1.1603*** -0.0382*** -0.0132**
(2.64) (2.61) (2.99) (2.22)
KAOPEN -2.1924*** -1.3467*** 0.0048 -0.0172**
(2.58) (3.07) (0.41) (2.42)
Economic and Other policy variables
Y 0.1552*** 0.0133*** 0.0174*** 0.0102*** 0.0099*** 0.1202*** 0.0002*** 0.0003*** 0.0003*** 0.0001*** 0.0001*** 0.0001***
(8.96) (7.05) (9.51) (11.79) (10.45) (12.56) (6.72) (5.92) (6.41) (5.41) (4.05) (6.00)
TO 0.3068*** 0.3280*** 0.3116*** 0.1177*** 0.6601 0.1385*** 0.0011 0.0004 0.0032*** 0.0005 0.0002 0.0017***
(5.88) (4.20) (6.68) (4.40) (1.43) (5.75) (1.19) (0.26) (3.61) (0.79) (0.23) (3.12)
ECF 0.2681 -1.4733*** 0.6180 0.1024 -0.1721 0.3746 0.0011 -0.0004 0.0004 0.0009 0.0014 0.0014
(0.48) (-2.71) (1.02) (0.37) (0.51) (1.28) (0.21) (0.05) (0.07) (0.28) (0.41) (0.44)
INF -0.1228*** -0.1077*** -0.1614*** -0.0345 -0.0483 -0.0646*** 0.0008 0.0004 0.0009 -0.0010** -0.0008* -0.0011***
(3.72) (2.88) (3.80) (1.64) (1.26) (2.64) (0.90) (0.30) (1.01) (2.60) (1.66) (2.98)
INS
-
20.1728*** -30.7496**
-
22.5607*** -4.2113 -1.7219 -5.6235
-
0.5864*** -0.6462*** -0.5993*** 0.0313 -0.1040 -0.0014
(3.37) (2.21) (3.67) (1.23) (0.26) (1.44) (4.23) (2.95) (3.69) (0.39) (1.52) (0.00)
Constant
-
35.5158*** -20.3955*
-
39.3137***
-
27.6895*** -19.3316***
-
32.3517***
-
0.6050*** -0.2529 -0.6574 -0.5328*** -0.2542** -0.6178***
(4.20) (1.73) (4.90) (6.90) (3.06) (7.82) (3.71) (0.93) (3.83) (5.47) (2.07) (5.49)
R^2 0.83 0.95 0.83 0.94 0.97 0.94 0.58 0.62 0.51 0.55 0.75 0.52
Wald statistics chi^2
(6) 1410.05 3463.70 1254.08 19457.15 104035.33 13045.26 386.24 1068.41 1047.03 768.74 689.15 705.64
(0.00) (0.00) (0.00) (0.00) (0.00) (0.00) (0.00) (0.00) (0.00) (0.00) (0.00) (0.00)
Obs 222 128 222 233 139 233 195 136 195 192 133 192
Notes: See Table 3-7. TO is total trade obtained from ESDS, World Development Indicators, World Bank, (2009). ***, ** and * represents 1%, 5% and 10% significance level respectively. The t
statistics is in parenthesis.

128
3.11 Conclusion and policy implications
This chapter has examined the impact of financial liberalisation on financial
development using data from eleven emerging countries. Despite the theoretical
evidence suggesting the role of financial liberalisation in promoting financial
development, our findings and existing empirical evidence provide mixed results. Out
of the three measures of financial liberalisation used, I note that the move towards
financial integration (BHL) promotes development in the banking sector, stock market
and overall activity/size of the financial sector in the sample countries. However, when I
use the financial freedom index as a measure of financial liberalisation, I find a negative
and significant correlation with financial development in the countries in our analysis.
Our findings also show that the capital account index has a positive relationship with
market capitalisation and overall size of the financial sector, however, our coefficient is
insignificant.
To better understand the impact of financial liberalisation on financial development, our
sample is further split into two sub groups consisting of emerging and frontier markets.
I note that BHL has a significant and positive impact on all aspects of the financial
sector in the emerging markets. It is also positive and significant in the development of
the stock market and the overall development of the activity of the financial sector in
the frontier markets. The positive effect of liberalisation date on stock market
development in frontier markets may well be a plausible explanation for the
consideration of the Ghanaian stock exchange as the world’s best performing market in
2004.52
In addition, the positive effect of liberalisation date might be an indication that
financial markets in the SSA region have moved from being segmented markets to
being integrated with the rest of the world.
I note that FINDEX has a negative and insignificant impact on FD in emerging
countries and a positive impact on the development of private credit in frontier markets.
When I use KAOPEN to proxy financial liberalisation, I observe that there is a positive
relationship with stock market capitalisation and overall development of the size of the
financial sector in both the emerging and frontier markets, although the coefficient is
insignificant. I find that the intensity of capital controls affect the development of banks
52 According to Yartey and Adjasi, (2007), Egypt, Kenya, Mauritius, Nigeria and Ugandan stock markets were also recognised as the best performers in the same year.

129
in the full sample and frontier markets, while this affects stock market development in
emerging markets.
Two policy implications can be drawn from these empirical findings. Firstly, the direct
policy implication is that to ensure a positive benefit from financial liberalisation in
frontier markets, banking sector reforms are crucial. This is an important perspective for
making financial liberalisation policies because, according to the literature, banks are
more capable of financing economic growth than stock markets in developing countries,
particularly in the SSA countries. Besides, by developing the banking sector, this can
help promote stock market development, and in turn, economic growth. For instance,
the success of East Asian countries can be linked to the development of both the
banking sector and the stock market.
Secondly, the result also reveals some key priorities of financial reforms. The priority of
reforms comes down to policy makers in the emerging and frontier markets being faced
with tackling the challenges of developing and implementing policies towards a more
open capital account.
In addition, I examine the simultaneous openness hypothesis proposed by Rajan and
Zingales (2003). The empirical analysis suggests that financial sector liberalisation is
not important for trade openness to facilitate financial development in emerging and
frontier markets, regardless of the stages of financial development. In particular, the
result suggests that trade and financial openness, in the banking sector, might be
substitutes for each other, rather than complementary, as suggested by Rajan and
Zingales (2003). From the policy perspective, the empirical results obtained in this
study have very important implications for developing countries, especially for the
emerging and frontier economies. Therefore, countries in this region should re-consider
the sequence of their trade and financial liberalisation policies. For example, these
countries should formulate policies to strengthen the financial sector, such as
maintaining good corporate governance.

130
Appendix III: Key liberalisation process of sample countries
Financial liberalisation is a gradual process encompassing the elimination of financial
repression by introducing financial liberalisation policies, these include: (i) interest rate
liberalisation, (ii) abolition of directed credit schemes, (iii) bank denationalisation, (iv)
liberalising entry into the banking sector, and (v) strengthening of prudential
regulations.
Although, financial liberalisation does not only involve the domestic financial sector,
but also includes insurance markets, securities market, capital account, and exchange
rate, in this chapter, I focus on the bank and stock market only. Here, I list the financial
liberalisation process which took place over the period 1980-2007 in the countries in
this study.
Botswana
Bekaert et al. (2005) notes that financial liberalisation in Botswana began in 1990,
however, in 1986, controls on maximum interest on lending and on deposits were
removed and the commercial banks were allowed to set interest rates freely.
1. 1987: further reduction in lending rates,
2. 1989: announcement of various financial reform measures,
3. 1990: granting of bank license (Zimbank),
4. 1991: new bank opens, issuing of Bank of Botswana certificates,
5. 1992: two more banks opened,
6. 1994: reforming of Botswana savings bank (BSB),
7. 1995: new banking law, nonbank financial institutions (NBFIs)/bank supervision
started.
Brazil
Financial sector reforms began in Brazil in 1991 and the process involved:
1. 1991: foreign investment law changes,
2. 2003: all sectors of the economy are opened to foreign investment.
China
Major financial sector reforms began in China in 1990 and the process involved:
1. 1990: development of bonds and two stock markets were established,

131
2. 1993: austerity plan measures allowed for interest rate adjustment, it also
emphasised the importance of investments in infrastructure,
3. 1994: formation of three policy banks, whose purpose was to allow the rest of
the state owned banks (SOBs) to concentrate on more commercial lending,
4. 1995: new commercial bank law, emphasis was placed on the need for financial
institutions to incorporate commercial criteria into lending purpose.
Ghana
Major financial sector reforms began in Ghana in 1987 with the partial liberalisation of
the interest rates, but the process started in:
1. 1986: introduction of weekly foreign exchange auction,
2. 1987: liberalisation of maximum and minimum deposit rates, decontrolled all
interest rates, and introduced weekly auctions of T-Bills,
3. 1988: removal of sectoral credit controls, except for agriculture and decontrol of
minimum bank savings rate,
4. 1989: bank restructuring and revision of the banking law,
5. 1990: abolition of the requirement for lending to agricultural sector and
replacement of non-performing bank claims on both public and private
enterprises,
6. 1991: replacement of non-performing claims on the private sector.
India
Major financial liberalisation in India began after 1990, and it involved:
1. 1991: granting of bank licenses, regulations on FDI were liberalised
significantly, and non bank financial institutions interest rates deregulated,
2. 1992: decontrol of interest rates, substantial liberalisation of bank branch
licensing, and capital market restrictions removed on pricing and issues of
capital
3. 1993: further interest rate liberalisation, and entry restrictions for banks eased,
4. 1994: new banking legislation to increase prudential regulation,
5. 1995: bank closures,
6. 1996-7: selective credit controls on essential commodities lifted,
7. 1998-9: greater flexibility for banks in lending and deposit rates, banks can
engage in interest rate swaps for own balance sheet management, and stock
exchanges allowed to extend trading terminals,
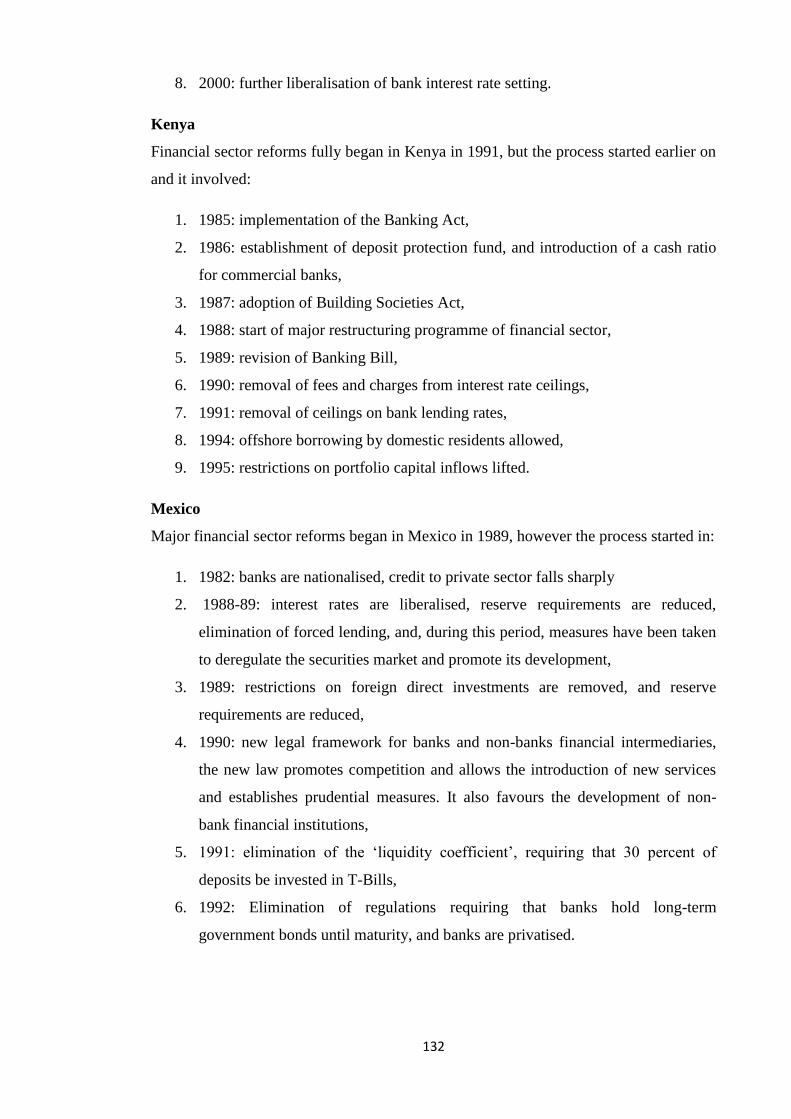
132
8. 2000: further liberalisation of bank interest rate setting.
Kenya
Financial sector reforms fully began in Kenya in 1991, but the process started earlier on
and it involved:
1. 1985: implementation of the Banking Act,
2. 1986: establishment of deposit protection fund, and introduction of a cash ratio
for commercial banks,
3. 1987: adoption of Building Societies Act,
4. 1988: start of major restructuring programme of financial sector,
5. 1989: revision of Banking Bill,
6. 1990: removal of fees and charges from interest rate ceilings,
7. 1991: removal of ceilings on bank lending rates,
8. 1994: offshore borrowing by domestic residents allowed,
9. 1995: restrictions on portfolio capital inflows lifted.
Mexico
Major financial sector reforms began in Mexico in 1989, however the process started in:
1. 1982: banks are nationalised, credit to private sector falls sharply
2. 1988-89: interest rates are liberalised, reserve requirements are reduced,
elimination of forced lending, and, during this period, measures have been taken
to deregulate the securities market and promote its development,
3. 1989: restrictions on foreign direct investments are removed, and reserve
requirements are reduced,
4. 1990: new legal framework for banks and non-banks financial intermediaries,
the new law promotes competition and allows the introduction of new services
and establishes prudential measures. It also favours the development of non-
bank financial institutions,
5. 1991: elimination of the ‘liquidity coefficient’, requiring that 30 percent of
deposits be invested in T-Bills,
6. 1992: Elimination of regulations requiring that banks hold long-term
government bonds until maturity, and banks are privatised.

133
Nigeria
Major financial sector reforms began in Nigeria in 1987 and it has focused mainly on
institutional deregulation and interest rate deregulations:
1. 1985: elimination of minimum credit allocation requirement to indigenous
borrowers, and the implementation of third phase of rural banking programmes,
2. 1986: modification of credit ceilings for merchant banks, gradual abolition of
selective credit allocations, reform of foreign exchange market started with the
dismantling of exchange controls, and the establishment of market-based
autonomous foreign exchange market,
3. 1987: removal of controls on minimum and maximum interest rates,
4. 1988: adoption of new Securities and Exchange Commission decree,
establishment of National Deposit and Insurance Corporation, and the
introduction of significant institutional changes at the Central Bank,
5. 1989: adoption of privatisation and commercialisation programme, and the
signing of accord between banks and the Central Bank to limit spreads between
interest rates,
6. 1990: introduction of cash requirement for merchant banks, all banks to report
on activities of their subsidiaries offering financial services, introduction of
minimum capital requirement, and the introduction of new accounting guidelines
for all financial institutions,
7. 1991: re-administration of interest rates, and no new bank license.
Russia
Buiter and Taci (2003) note that capital account liberalisation in Russia started with FDI
being under strict rules that were gradually eased. They also note that restrictions on
non-resident portfolio investments started to ease in 1994 and after the country achieved
current account convertibility in 1996, these restrictions were further relaxed and
gradually phased out by early 1998. However, in August 1998, during the period of
financial crisis, Russia reintroduced some capital controls. Other financial reforms
include:
1. 1998: federal law ‘On Mortgages’,
2. 2003: ‘fit and proper’ standards for bank owners, and greater scrutiny of sources
of bank capital, improved enforcement of banks’ rights over pledged collateral,
and limited reporting requirements based on international standards,

134
3. 2004: introduction of the deposit insurance system (admission of individual
banks conditional on compliance with a set of 12 prudential standards), and
minimum capital requirements for newly created banks (waived for existing
banks until 2010),
4. 2005: law ‘On Credit Histories’, introduction of credit bureaux, and mortgage
legislation, including on securitisation,
5. 2006: complete elimination of capital account controls.
Zambia
According to Fowowe, (2008) financial reform began in 1991 when the government
allowed free bank entry, other reform policies include;
1. 1991: granting of bank licenses,
2. 1992: decontrol of interest rates, further granting of bank licenses, and the
government passed the privatisation acts which established the Zambian
Privatisation Agency (ZPA),
3. 1993: further interest rate liberalisation,
4. 1994: new banking legislation to increase prudential regulation,
5. 1995: bank closures.
Zimbabwe
The official date of financial liberalisation, as recorded in Bekaert et al. (2005), is 1990,
other reform strategy includes:
1. 1991: restrictions on interest rates are eliminated, and reserve requirements are
reduced,
2. 1993: the stock market is opened to foreign investors,
3. 1994: the current account and the foreign exchange are liberalised, although this
started in 1991 with measures to reduce budget deficit, however, this was
unsuccessful,
4. 1996: bank restructuring, strengthening of Central Bank, and further entry into
financial sector.
Sources: Li (1995); Bandiera et al. (2000); Buiter and Taci (2003); Bekaert et al. (2005)
Fowowe (2008) and Berglof and Lehmann (2009).

135
Appendix III-I: Effects of financial liberalisation in emerging and frontier
markets
Table 3-9: Stock market development as of 2007
Country
Year of
establishment
Listed
companies
Market
capitalisation Traded Value Turnover Value
Frontier
Botswana 1989 18 47.7 0.89 2.2
Ghana 1989 32 15.93 0.73 3.9
Kenya 1954 51 49.35 4.86 10.6
Nigeria 1960 212 52.04 10.11 28.2
Zambia 1994 15 20.56 0.63 4.1
Zimbabwe 1986 82 N/A N/A 5.1
Emerging
Brazil 1890 442 102.78 43.87 56.2
China 1891 1530 184.09 230.37 180.1
India 1875 4887 154.57 94.11 84
Mexico 1886 125 38.89 11.3 31
Russia 1995 328 116.07 58.27 58.9
Note: World Bank’s World Development Indicators, (2009), Bekaert, Harvey and Lundblad, (2005), Fowowe,
(2008).
Table 3-10: Official liberalisation dates
Country Financial liberalisation dates in the BRIMCs and SSA countries
BRIMCs Stock market liberalisation date Banking sector liberalisation date
Brazil 1991 1997
Russia 1998 NA
India 1992 NA
Mexico 1989 1993
China 1990 1997
SSA
Botswana 1990 NA
Ghana 1993 NA
Nigeria 1995 1990
Kenya 1995 1991
South Africa 1996 1980
Zambia 1994 1995
Zimbabwe 1993 1993
Notes: The official liberalisation dates corresponds to equity market liberalisation dates by Bekaert, Harvey and
Lundblad (2005). Capital account liberalisation in Russia started in 1994-1998 it started with the liberalisation of
FDI. NA implies data unavailability.
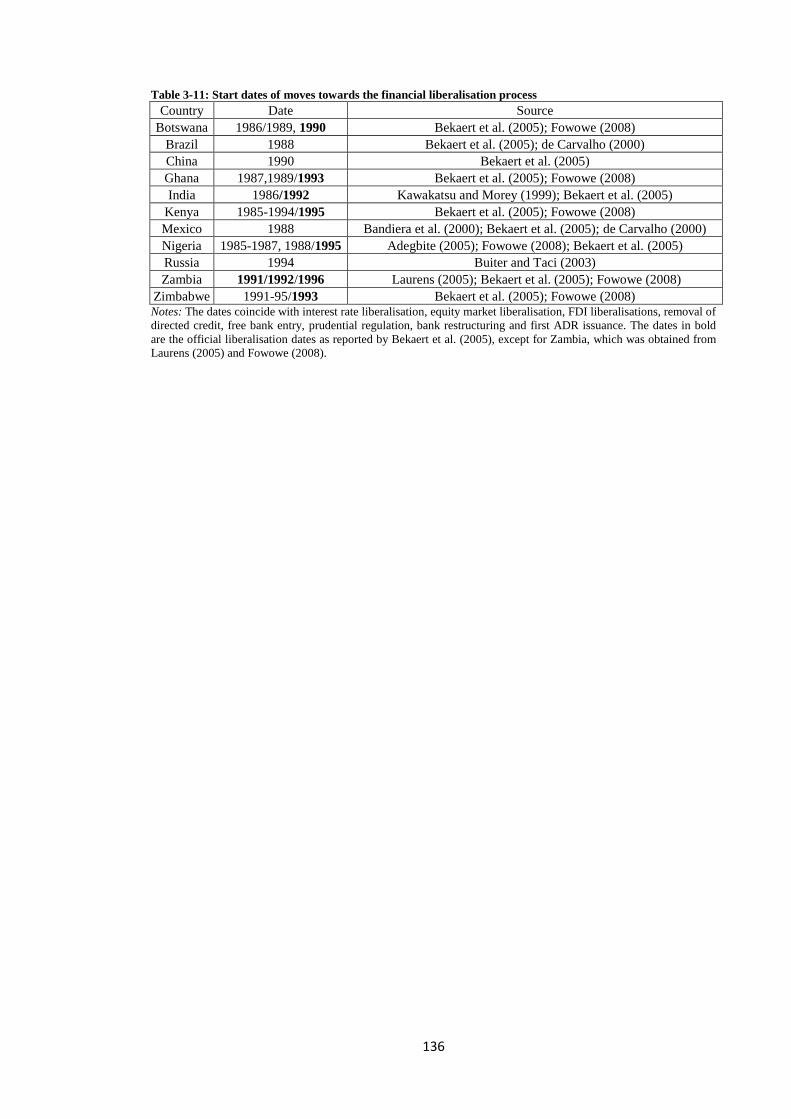
136
Table 3-11: Start dates of moves towards the financial liberalisation process
Country Date Source
Botswana 1986/1989, 1990 Bekaert et al. (2005); Fowowe (2008)
Brazil 1988 Bekaert et al. (2005); de Carvalho (2000)
China 1990 Bekaert et al. (2005)
Ghana 1987,1989/1993 Bekaert et al. (2005); Fowowe (2008)
India 1986/1992 Kawakatsu and Morey (1999); Bekaert et al. (2005)
Kenya 1985-1994/1995 Bekaert et al. (2005); Fowowe (2008)
Mexico 1988 Bandiera et al. (2000); Bekaert et al. (2005); de Carvalho (2000)
Nigeria 1985-1987, 1988/1995 Adegbite (2005); Fowowe (2008); Bekaert et al. (2005)
Russia 1994 Buiter and Taci (2003)
Zambia 1991/1992/1996 Laurens (2005); Bekaert et al. (2005); Fowowe (2008)
Zimbabwe 1991-95/1993 Bekaert et al. (2005); Fowowe (2008) Notes: The dates coincide with interest rate liberalisation, equity market liberalisation, FDI liberalisations, removal of
directed credit, free bank entry, prudential regulation, bank restructuring and first ADR issuance. The dates in bold
are the official liberalisation dates as reported by Bekaert et al. (2005), except for Zambia, which was obtained from
Laurens (2005) and Fowowe (2008).

137
Table 3-12: Description and data source
Variable
Predict
ed
signs
Definition
Sources
M3 N/A Ratio of liquid liability to GDP
Beck et al. (2009); WDI
(2010)
PC N/A Private credit to GDP
Beck et al. (2009); WDI
(2010)
MCAP N/A Value of listed shares to GDP
Beck et al. (2009); WDI
(2010)
TVALUE N/A
Total shares traded on the stock market
exchange to GDP
Beck et al. (2009); WDI
(2010)
OFDS N/A
Overall financial development (size) (the sum of
M3 and MCAP) Author’s calculation
OFDA N/A
Overall financial development (activity) (the
sum of PC and TVALUE) Author’s calculation
Y +
Real GDP per capita, annual growth rate of real
GDP per capita
Quality of government
database, quality of
government institute
(2010); WDI (2010)
TRADE + Total trade to GDP WDI (2010)
INF -
Consumer price index, to measure
macroeconomic stability
WDI (2010); International
Financial Statistics, IMF,
(2008)
ECF +
External capital flows: Foreign direct
investment inflow measured in millions of US $
UNCTAD (2009)
INS
+/-
ICRG quality of government: This is the mean
of the value of ICRG variables ‘corruption’, law
and order’ and ‘bureaucracy quality’, scaled 0-
1. Higher value indicate higher quality of
government
Quality of government
database, quality of
government institute
(2010)
TINDEX +
Trade freedom index, takes the value of 1 if
repressed and 5 if open
Heritage freedom index
(2010)
BHL
+/-
Official liberalisation date of equity, bank and
FDI. Equals 1 ever since the date of
liberalisation, 0 prior to liberalisation
Bekaert et al. (2005);
Fowowe (2008); Adegbite
(2005)
FINDEX
+/-
Financial freedom index, takes the value of 0 if
repressed and 100 if open. Higher values
indicate better openness (data has been rescaled
0-5 for ease of interpretation)
Heritage freedom index
(2010)
KAOPEN +/- Capital account liberalisation index
Chinn and Ito (2005);
updated (2009)
LIBOPEN +/-
Interaction between openness and liberalisation
date Author’s calculation
FOPEN +/-
Interaction between openness and financial
freedom index
Author’s calculation
KAOPEN +/-
Interaction between openness and financial
capital account liberalisation
Author’s calculation
BHLTRADE +/- Interaction between trade and liberalisation date Author’s calculation
FTRADE +/-
Interaction between trade and financial freedom
index Author’s calculation
KTRADE +/-
Interaction between trade and capital account
liberalisation
Author’s calculation
OPENK
+
Exports plus import divided by real GDP
(constant price)
Penn World Tables 6.3
(2009)
Note: N/A refers to not applicable. + and – refers to results that are expected to be positively or negatively
statistically significant, respectively.

138
4 Quality of institutions in Sub-Saharan African Countries: An
Empirical Examination of its Impact on Financial Development
Abstract
Sub-Saharan Africa has been characterised by low levels of financial development for
decades. In this contribution, I argue that institutions play an important role in building
effective financial systems and, in turn, promoting economic growth. This chapter
considers several alternative measures for financial development because financial
institutions perform various functions and the use of a single measure maybe
uninformative. I also use an alternative measure of institutional quality and highlight the
importance of various facets of institutions in the process of financial development in
Sub-Saharan African countries. The empirical results based on a sample of 37 countries
over the 1980-2007 period, indicate that, whilst the quality of the institutions is
important for the overall development of financial institutions in the region, voice and
accountability is equally as important.
Furthermore, I examine whether the impact of institution on financial development
varies across different levels of economic growth, and as such, the countries are
subdivided according to their level of development into three groups: low income, lower
middle income and upper middle income countries. I find that institutions in the form of
control of corruption, government effectiveness, and voice and accountability tend to
promote financial development in low income countries, whereas regulatory quality
seems to be more important in lower middle income countries. In the upper middle
income countries, institutional quality does not appear to be important for financial
development, rather I find that the level of economic growth coupled with low inflation
is important. This chapter concludes that policy reforms should aim to improve the
quality of institutions in order for it to be beneficial in the region.
4.1 Introduction
The main goal of economics is to understand why some countries perform better than
others. Research shows that the development of the financial market is a key factor in
the development process. Despite the growing body of theoretical arguments and
empirical evidence, the importance of financial development and the channel through
which financial systems affect economic growth were not clear until recently. In an

139
earlier study, Schumpeter (1911) argued that financial intermediation, through the
banking channels, played an important role in economic activity, accelerating savings
and improving productivity.
More recently, emphasis has been placed on the important role of the financial sector in
mobilising savings, corporate governance, allocating capital and easing risk
management (Levine, 1997). What is more, it is accepted in the literature that a well-
functioning and highly developed financial market promotes efficiency, and in turn,
increases economic growth. In fact, the recent turmoil in the international financial
market is evidence of the strong link between finance and growth. Moreover, it is this
connection that has forced governments in developed countries (for instance, the US
and UK) to provide bailouts worth several billions, in order to avoid further damage to
the real sector. The persistence of the recent ‘credit crunch’ has generated increased
academic interest in the finance-growth nexus and spurred a new debate on the need to
understand to what extent the limit of financial liberalisation and uncontrolled financial
sector development affects economic growth.
Prior to the ‘credit crunch’, the major concern in the recent literature on financial sector
development was the determinants of financial sector development, and the direction of
the relationship between financial sector development and economic growth. The
importance of this lies in its implication for policy development, especially in
developing countries. The debate centres on the crucial questions: what determines the
persistent differences in financial market development and economic performance?
What sector, financial or real, leads in the dynamic process of economic development?
Patrick (1966) argues that the relationship between finance and growth, changes over
the course of development. He emphasises the view that financial development can lead
to real innovation type investments before sustained economic growth takes place. This
argument has encouraged many developing countries to establish and promote financial
institutions. Indeed the literature also finds that financial development should be
encouraged in poor countries such as those in my sample, because financial
development reduces income inequality by raising the income of the poor and, in turn,
reducing poverty (Beck et al. 2004). As a result, it is important to understand the
determinants of financial development, in order to design policies that would encourage
financial development.

140
In the last two decades, many developing countries in particular, SSA countries have
experienced stagnation and/or slowdown in their economic growth, with noticeable
declines in the main measures of economic performance. According to Beuno (2008),
GDP per capita declined an annual average of approximately 1 percent between 1980
and 1997 in SSA countries. Accompanying this poor record is the underdeveloped
financial system. In 2007, the aggregate average level of private credit represented
approximately 17 percent of total GDP, whereas the averages for Latin America and
Caribbean (LAC) and East Asia and the Pacific (EAP) ranged between 40 and 43
percent, respectively.
Table 4-1: Developing regions: Comparison of private credit ratio to GDP, 2003-2007
Year EAP ECA LAC MENA
SOUTH
ASIA SSA
2003 0.33 0.18 0.38 0.32 0.24 0.15
2004 0.34 0.21 0.36 0.32 0.26 0.15
2005 0.36 0.25 0.36 0.33 0.29 0.15
2006 0.40 0.30 0.37 0.34 0.31 0.16
2007 0.43 0.36 0.40 0.43 0.34 0.17
Source: Author’s calculations from Beck et al.’s financial structure database, (2001 updated November, 2010).
The poor performance according to the financial repression hypothesis pioneered by
McKinnon (1973) and Shaw (1973) result from government dominance in financial
service provision, through imposing several restrictions, such as interest rate ceilings
and credit allocation which restrained the growth of the sector (Gelbard and Leite,
1999).
Yet, despite the poor performance, empirical findings confirm that financial
development underpins economic prosperity. Consequently, many SSA countries,
persuaded by both theoretical argument and experience of other rapidly developing
countries (such as Asian countries), adopted various structural and financial reform
strategies as proposed by McKinnon (1973) and Shaw (1973). The authors argued that
financial liberalisation, particularly the integration of the domestic markets with foreign
ones, help to reduce the costs of capital and improve the efficiency of financial
intermediaries. The reforms include a variety of measures for banking and stock market
development as a dominant strategy to improve financial development.
While significant progress has been made, the gains from adopting these policies have
had little or no benefit. What is more, the outcome of financial liberalisation appears to

141
be different in Asia and Africa.53
A closer look at the literature suggests that late timing
and unstable macroeconomic conditions are responsible for the inefficiency of financial
liberalisation. In addition, the lack of good governance and information sharing
contributed to the poor financial liberalisation process. Many African countries face the
challenges of improving resource allocation by reducing corruption and strengthening
governance. However, most of these challenges remain difficult to meet because of the
weakness in the institutional framework which can lead to inefficiency of the financial
sector, and if unchecked, can contribute to the low level of financial development.
According to theory, strong institutional environment54
exists to alleviate information
and transaction costs. In developing countries, particularly African countries, where
legal and regulatory structures are outdated or not properly defined, enforcing contract
laws becomes costly and problematic (Wright et al. 2005), hence, institutions are
required to prevent such costs (North, 1995). Furthermore, the previous failures of the
legal environment has convinced many, of the importance of establishing a favourable
institutional environment, which is capable of boosting investors’ confidence and
contributing to the deepening of the financial sector.
Much of the evidence corroborating theoretical findings suggest that reliable polices and
functioning institutional environments are essential for developing an efficient financial
system.55
Equally, these studies pointed out the importance of quality institutions (such
as legal, economic and political institutions) for financial development. Accordingly,
Popiel (1994) suggests that African countries should focus on legal, regulatory and
prudential frameworks, because it encourages the correct functioning of the financial
system. The results obtained in the previous chapter seem to agree with the view that
SSA countries should maintain good corporate governance, and formulate other policies
required to strengthen the financial sector.
Several empirical studies have demonstrated that financial development has a positive
relationship with economic performance.56
Equally, many previous studies have
recognised the importance of country-specific characteristics, such as their institutional
53 See Pill and Pradhan (1997) for comprehensive discussion. In this study, Africa is used interchangeably with Sub-
Saharan Africa for convenience. 54 Institutional environment is a broad concept which encompasses the laws, regulations and procedures that are used
to govern and shape the activities of the financial system and the economy as a whole. For the rest of the chapter, we
will use interchangeably ‘good governance’ and ‘quality of institutions’ to qualify the institutional environment. 55 See, for example, Acemoglu et al. (2004); La Porta et al. (1997, 1998) and KariKari, (2010). 56 Beck et al. (2000) and Levine, (2005) show that banking sector development indicators such as private credit and
liquid liabilities have a positive impact on economic growth.

142
environment in explaining growth.57
These studies show that political and legal
institutions are important in explaining cross-country differences in economic growth.
While political institutions are often identified by democracy, legal institutions are the
rule of laws that governs human interactions. According to the politics and finance
literature, the effectiveness of institutions on financial development varies on the type of
political support received. Consequently, higher degrees of democracy are typically
followed by increase in financial development and vice versa. In the same way, the law
and finance literature points out that the effectiveness of legal institutions, especially the
protection of property rights and contract enforcement, are particularly important for
transactions which are beyond ‘face-to-face’, because the enforcement helps reduce
opportunistic risks. Although there are cross-country differences in institutions, the
World Bank (2003) suggests that the effectiveness of these policies depends wholly on
the effectiveness of the institutions which implement them.
While several studies have examined different issues relating to financial development
in developing countries, surprisingly, very few focus on the SSA58
given the challenges
facing them. What is more, many studies do not necessarily consider the heterogeneity
of the African economies. Indeed, the weakness in the quality of institutions in the SSA
is emphasized by the significant but negative sign of the coefficient of ICRG_QOG
indicator on financial development in the previous chapter. Therefore, it might be
informative to explore the role of institutions in determining financial development in
the SSA region. I consider the heterogeneity of African countries by isolating the
sample countries into three groups based on the level of economic development. Hence,
the main objective of this chapter is to examine the role of the institutional environment
in promoting financial development among countries in the SSA region. It attempts to
provide answers to the following questions: Does institutional environment facilitate
deepening of the financial sector? If so, which dimensions of the institutional
environment (economic, legal and political institutions) are powerful for financial
development?
I revisit the previous chapter by examining which aspect of institutional environment is
important for the link between financial liberalisation and financial development in the
57 Among them, see Claessens and Laeven (2002); Acemoglu et al. (2001); Knack and Keefer, (1995); Beck and
Laeven, (2005, 2006) and Ndulu and O’Connell, (1999). 58
See, for example, McDonald and Schumacher (2007), and Singh et al. (2009). Arestis and Demetriades, (1997)
and Chinn and Ito, (2006 and 2008) included SSA countries in their samples, but did not particularly focus on them.

143
SSA. Here, I assess the independent role of financial liberalisation and institutions on
financial development, as well as their potential interactions. Finally, I revisit the
finance-growth nexus using data on SSA countries and ask what factors explain the
significant differences in economic growth across SSA countries? Here, I empirically
consider the impact of each factor, as well as their potential interactions. It is hoped that
the answers to these questions will generate conclusions that may be relevant to
policymakers.
The chapter proceeds as follows. Section 4.2 explains the process of financial
development and provides the trends of financial development in Africa. A brief review
of the literature on financial development, institutions and its effect on growth is
provided in Section 4.3. In particular, this section discusses the theoretical and empirical
links on finance and growth and identifies the main institutional factors that limit the
development of financial markets, and highlights the importance of addressing these in
SSA. It also discusses some studies in this area, undertaken for other developing
regions. Section 4.4 examines the role of institution and financial development and
section 4.5 looks at the factors that promote financial development in SSA countries.
This section also provides a brief summary of the econometric technique used and
provides details on the variables used in the study, before discussing the results in
Section 4.6. Details of the sensitivity analysis are provided in section 4.7. Finally,
policy implications and conclusions follow in Section 4.8.
4.2 Explaining financial development
Goldsmith (1969) defines financial development as a change in the structure of a
country’s financial system during development. Financial systems can be classified as
either bank-based or market-based. A well-functioning financial system provides better
financial services and is crucial to maximizing sustainable economic growth, because it
channels funds to people with the most productive investment opportunities, and
encourages savings and capital accumulations. While a well-developed financial system
indicates a strong economic environment, an underdeveloped one can lead to a slow
growth rate in the economy. Hence the literature emphasises that every economy
requires a well-functioning, efficient and sophisticated financial system to grow
(Schumpeter, 1911; McKinnon, (1973), Shaw, 1973; Levine, 1997 and more recently,
Ang, 2007).

144
The role of finance in the economy can be traced back to the work of Bagehot (1853),
who notes that finance facilitate capital accumulation and manage risks inherent in
particular investment projects during the industrialisation in England. It was not until
Schumpeter (1911) explained that financial intermediaries facilitate innovations through
savings, evaluate investment project and facilitate transactions, that the services
provided by financial intermediaries became more apparent.
Previous studies did not distinguish between the role of the bank and/or stock market in
the growth literature. It is believed that both banks and stock market exert different
impacts on the economy, as the services they both provide are distinct. Hence, to
distinguish between the role of the bank and the stock markets, most studies focus on
their functions. These functions, as described by Levine (1999), provide us with a better
understanding of the significant role of the financial markets, which was not present in
earlier studies. These functions are summarised below:
a. Producing information and allocating capital:
The cost of obtaining and processing information on projects, firms and markets
are often high, and individual savers may not have the ability to collect such
information. This high cost may also prevent capital to flow to its highest value
of use. As a result, financial intermediaries undertake the costly process of
researching investment possibilities by lowering the costs of gathering and
processing information, and thereby, improving the allocation of resources
(Boyd and Prescott, 1986).
b. Trading, diversification and risk management:
Demirguc-Kunt and Levine (2008) point out that both financial intermediaries
and security markets provide channels for trading, pooling and diversifying risk.
The authors note that high return projects tend to be more risky than low
projects. However, because savers do not like risk, the financial systems provide
an avenue where agents are allowed to hold a diversified portfolio of risky
projects. These induce society to shift towards projects with higher expected
returns with a positive incidence on economic growth (Greenwood and
Javanovic, 1990 and Gurley and Shaw, 1955). This process of risk
diversification, according to Levine (2004), can lead to long run economic
growth by altering savings rates and resource allocations.

145
c. Mobilising and pooling of savings:
Levine (2004) and Demirguc-Kunt and Levine (2008) describe the mobilisation
of savings to involve (i) overcoming the transaction costs of collecting savings
from numerous individuals, and (ii) overcoming information asymmetries
associated with making savers feel comfortable in relinquishing control of their
savings. Thus, most savers tend to entrust their monies in banks that invest in
firms who use these finances to fund long-term projects. In this context,
Bencivenga and Smith (1991) explained that banks play an important role in
making credit available for investments through facilitating and channelling
savings from individual savers to productive investments. This process leads to
capital accumulation, productivity and eventually, economic growth.
d. Facilitates exchange:
Another function of the financial system is that it provides instruments to make
and receive payments, in addition to reducing transaction and information costs.
Financial intermediaries allow for easy access to funds by facilitating exchange
and transaction within the economy and also with other economies.
e. Monitoring firms and exerting corporate governance:
Corporate governance problems relate to a situation where equity holders
influence firm managers to act in the interest of shareholders, so as to enhance
profitable investment. In a situation where financial intermediaries do not exert
corporate governance, this leads to capital not flowing to profitable investments.
Therefore, the degree to which the providers of capital to firms (i.e.
shareholders) monitor the activities of the firms and the investment process is
important in order to protect shareholders interests. To protect shareholder
interests, financial intermediaries help monitor the way in which firms uses the
capital provided to them. This is done through lowering monitoring costs, which
will reduce credit rationing, and in turn, promote economic growth, (Bencivenga
and Smith, 1993).
The proponents of bank-based market economies tend to suggest that banks are
important because they tend to ease information frictions and improve resource
allocation. In fact, banks are more efficient than equity markets in improving resource
allocation and corporate governance in the early stages of economic development,
146
(Stiglitz, 1985 and Bhide, 1993). However, the proponents of market-based systems
suggest that stock markets provide risk management, reduce the counterproductive
monopoly power of banks (i.e. mitigate the problems associated with excessively
powerful banks) and stress that the competitive nature of markets encourages innovation
through growth enhancing projects (Allen and Gale, 2000 and Levine, 2001). Although
the roles of both banks and stock markets have been clearly emphasised, Demirguc-
Kunt and Maksimovic (1996) and Beck and Levine, (2004) point out that both banks
and stock markets promote economic growth by improving information dissemination
and reducing transaction costs.
The empirical literature on this issue (Hoshi et al. 1991 and Arestis et al. 2001),
examines which financial structure better explains economic growth and tends to show
that financial structure is important. Although, there is no clear indication about which
financial system is better (bank-based or market-based), financial systems tend to
become more market-based as countries develop (Demirguc-Kunt and Levine, 1999).
Besides, in most developing countries, and in particular, African countries, commercial
banking is the principal industry because it has the potential to contribute to the
development of a country, this is because they tend to be setup before stock markets. In
essence, banks contribute more to economic growth in developing countries because
they tend to be better developed than stock markets.
Despite the foregoing argument, the literature suggests that having a stock market is an
indicator of the health of the financial system. Moreover, stock market development is
an important key for economic growth, because there is a long run positive relationship
between the stock market and economic growth (Shahbaz et al., 2008). Nevertheless,
Adjasi and Biekpe (2006) note that in developing countries, and indeed the SSA region,
the lack of liquid stock markets has been a significant factor in impeding stock market
development. Levine (1991) provides some explanation that stock market liquidity is
more important for growth because a liquid market reduces information asymmetry as
argued by Holmstrom and Tirole (1993). This means that investors can easily withdraw
their stake in a project and sell it quickly if they need their savings before the maturity
of the project (Levine and Zervos, 1998). This claim has been supported by vast
empirical evidence, because many empirical studies have found a positive relationship
between liquidity and long-term growth. Despite the empirical evidence, the small size
of the SSA economies, and the relatively poor financial development, indicates that
these countries do not have the financial stock markets culture yet; as banks are the

147
main financial service providers, with bank loans obtained as and when money is
needed.
A report by the United Kingdom’s Department for International Development (DFID,
2008) indicated that (i) improving efficiency and competitiveness, (ii) increasing the
range of financial services, (iii) diversifying institutions of operation, (iv) increasing the
amount of money and capital allocation, (v) better regulation and (vi) more stability are
key elements to financial development. This is particularly important for developing
countries because both the banking sector and stock markets have been constrained by a
lack of relatively good policies and institutional environments, which are important in
promoting financial deepening (Standley, 2010).
As a result, many of these countries implemented various financial sector liberalisation
strategies as part of the recommendation strategies provided by the McKinnon and
Shaw (1973) hypothesis, in an aim to develop the financial sector. Many developing
countries witnessed development and improved economic growth, in addition to
developing an efficient financial system which was capable of providing good quality
financial services. Consequently, developing an efficient capital market will not only
provide resources to investors, they will also facilitate the inflow of foreign financial
resources into the domestic economy (Ngugi et al., 2009).
4.2.1 Financial development in Sub-Saharan Africa
A developed financial system plays an important role in the economy. According to
Levine (1997: 691) its primary function is to ‘facilitate the allocation of resources,
across space and time, in an uncertain environment’. The financial sector is the main
link between a country’s macroeconomic policies and the economy in general. Hence,
the level of its development is important in the economy. Many African countries have
bank-based financial system because the banks are the main source of the financial
system that provides various forms of financial services. However, many of them are
characterised by very limited outreach, with less than one in five households having
access to a formal banking service, be it savings, payments or credit services, leading to
the high level of disparity in the growth of the sector, across countries and income
groups in the region. In addition, they were limited to investors due to their short-term
financing nature.

148
Constant government intervention such as interest rate control was introduced in order
to foster financial development and in turn promote economic growth. Nonetheless, the
World Bank (1989) notes that these controls undermined the financial sector and did not
lead to economic growth. Moreover, Green et al. (2000) writes that many African
economies suffered low investment in productivity due to a lack of access to funds,
because of the rigid collateral conditions and information asymmetry characteristics.
Further, Gulde et al., (2006) note that the financial systems in Africa are among the least
developed in the world. The authors note, particularly, that low income SSA countries
have smaller financial systems, when compared to the middle income countries.59
To
improve the level of financial development in the region, many SSA countries, during
1980s and early 1990s, introduced several financial liberalisation measures (such as
restructuring banks and improving banking supervision) to try to develop a deep and
efficient financial system. However, these reforms remain ineffective, because the
financial systems in the SSA region remain one of the shallowest in the world.
Financial development in SSA and other developing regions
The level of financial development in a country is determined by the access that
individuals have to credit and financial services. In the SSA region, the level of
financial development remains low, when compared to other regions (Figure 4-1
below). According to the figure, the average level of credit available to the private
sector in SSA was only 13 percent of GDP. The low level of private credit demonstrates
the underdevelopment in the financial sector in this region when compared to the other
region (71 percent in Asia and 32 percent in Latin America and the Caribbean
respectively). Despite several implementations of different banking sector reform
policies, the performance of private credit remains somewhat mediocre. Although banks
remain the main access to finance for most firms, the poor performance of private credit
in the SSA region could probably be related to the wide spread banking crises
experienced in many of these transition economies and the SSA countries during the
1980s and 1990s.
59 Out of the 37 countries, 22 are low income countries (LIC), 10 are lower middle income countries (LMIC), and 5
are upper middle income countries (UMIC). The average financial development, measured using private sector credit
as a ratio to GDP, in LIC countries for the sample period 1980-07 was 13.71 percent. LMIC and UMIC countries had
approximately16.96 and 38.21 percent, respectively.

149
Figure 4.1: Sub-Saharan Africa and other developing regions: Evolution of private credit, 1980-07
Note: Private credit to GDP across developing regions for each year.
Source: Author’s Calculation from Beck et al.’s financial structure, (2001: updated November, 2010).
Gelbard and Leite (1999) observe some noticeable progress in the level of financial
development in SSA countries (Figure 4-2 below). However, despite various financial
liberalisation reforms, the challenges posed by financial repression in the region have
not helped in the development of the financial market in the past two decades. Hence,
Gelbard and Leite (1999) in Kablan (2010:10) note that ‘much remained to be done’.
ASIA
LAC
SSA
0.00
0.20
0.40
0.60
0.80
1.00
1.20
198
0
198
1
198
2
198
3
198
4
198
5
198
6
198
7
198
8
198
9
199
0
199
1
199
2
199
3
199
4
199
5
199
6
199
7
199
8
199
9
200
0
200
1
200
2
200
3
200
4
200
5
200
6
200
7
per
cen
t
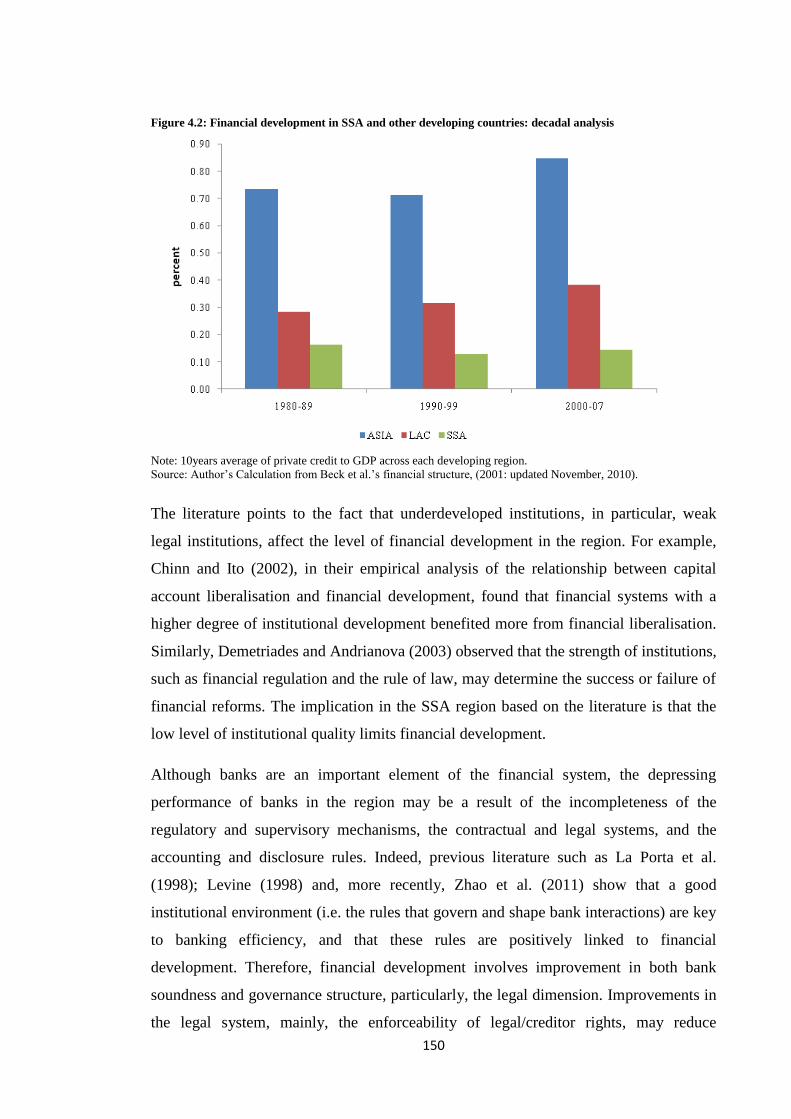
150
Figure 4.2: Financial development in SSA and other developing countries: decadal analysis
Note: 10years average of private credit to GDP across each developing region.
Source: Author’s Calculation from Beck et al.’s financial structure, (2001: updated November, 2010).
The literature points to the fact that underdeveloped institutions, in particular, weak
legal institutions, affect the level of financial development in the region. For example,
Chinn and Ito (2002), in their empirical analysis of the relationship between capital
account liberalisation and financial development, found that financial systems with a
higher degree of institutional development benefited more from financial liberalisation.
Similarly, Demetriades and Andrianova (2003) observed that the strength of institutions,
such as financial regulation and the rule of law, may determine the success or failure of
financial reforms. The implication in the SSA region based on the literature is that the
low level of institutional quality limits financial development.
Although banks are an important element of the financial system, the depressing
performance of banks in the region may be a result of the incompleteness of the
regulatory and supervisory mechanisms, the contractual and legal systems, and the
accounting and disclosure rules. Indeed, previous literature such as La Porta et al.
(1998); Levine (1998) and, more recently, Zhao et al. (2011) show that a good
institutional environment (i.e. the rules that govern and shape bank interactions) are key
to banking efficiency, and that these rules are positively linked to financial
development. Therefore, financial development involves improvement in both bank
soundness and governance structure, particularly, the legal dimension. Improvements in
the legal system, mainly, the enforceability of legal/creditor rights, may reduce
151
information asymmetry, increase investors’ confidence and improve access to credit,
because creditors would then be able to obtain information about potential lenders.
Evolution of financial development in SSA
A standard approach in the literature is to measure financial intermediation using
various financial indicators such as liquid liabilities, private credit and bank deposits
(Beck et al., 2004; Campos and Coricelli, 2009; Kasekendi, 2007 and Levine et al.,
2000). The first indicator, liquid liabilities as a percentage of GDP (M3), is a typical
measure of financial depth and has the advantage of measuring, accurately, the role of
financial intermediaries in channelling funds to productive agents (Jeaneney and
Kpodar, 2005). It is defined as ‘currency plus demand and interest bearing liabilities of
banks and nonbank financial intermediaries divided by GDP’. This measure is said to
capture the overall size of financial intermediation and has been used traditionally by
different scholars, such as Demirguc-Kunt and Levine (1999), King and Levine (1993a;
b), Rioja and Velv (2002) and more recently, Kiran et al. (2009). The second indicator,
private credit, is defined as ‘credit to the private sector by banks and other financial
intermediaries as a percentage of GDP’. It is a common indicator for financial depth
used in the literature. Levine et al. (2000) emphasised the importance of private credit
and also observed a positive relationship with economic growth. According to the
authors, a high level of private credit indicates low transaction costs and a high level of
financial services, which, therefore, indicates a high level of financial development.
The ratio of liquid liabilities to GDP provides an illustration of the level of liquidity
provided to the economy. It is usually defined as broad money, comprising:
currency and deposits in the central bank (M0), plus transferable deposits and
electronic currency (M1), plus time and savings deposits, foreign currency
transferable deposits, certificates of deposit, and securities repurchase
agreements (M2), plus travellers cheques, foreign currency time deposits,
commercial paper, and shares of mutual funds or market funds held by
residents. (World Bank, 2010)
The ratio tends to measure the relative size of the financial sector and reflects the level
of liquidity provided to the economy. However, it does not distinguish between the
allocation of capital to the private sector and the public sector. Furthermore, liquid
liabilities can also be taken as a measure of inefficiency and it indicates the amount of

152
money needed to support a given level of income. According to Hassan and Suk-Yu,
(2007), a higher liquidity ratio implies a higher intensity of the banking sector. Figure 4-
3 (below) provides an evolution of indicators of financial development in SSA
countries. According to the figure, the ratio of liquid liabilities was volatile in the SSA
countries and averages 26 percent during the period 1980-2007. During the post-reform
period, the ratio of liquid liabilities to GDP increased for the first few years and,
thereafter, decreased, owing to the restructuring of most of the biggest banks in the
region. From 1999, the ratio began to increase steadily until 2007; this could partly be
due to the increase of financial services.
The ratio of private credit to GDP measures the claims on the private sector by deposit
money banks and other financial institutions, divided by GDP. It refers to the financial
resources provided to the private sector through loans, purchases of non-equity
securities, trade credits and other accounts receivable, all of which establish a claim for
repayment. During 1980 and 1989, the ratio of private credit to GDP was quite volatile
in SSA countries, declining to approximately 15 percent of GDP in 1985 and then
dropping slightly to 14 percent in 1989. From 1990-99, the private credit ratio averaged
13 percent.
Bank deposit is the total deposit in deposit money banks as a share of GDP. The ratio of
bank deposits to GDP illustrates the extent to which local savings are effectively
mobilised. According to the figure, from 1980-83, bank deposits in SSA countries
averaged 18 percent of GDP. During the period 1984-91, the ratio of bank deposits to
GDP generally decreased. The fall in bank deposits was partly due to the banking crisis
that affected many SSA countries from late 1985 to 1995.60
Although, bank deposits
tend to be low in developing countries, when compared to other developing regions,
Applegarth et al. (2004) note that, it is lowest in SSA countries. Indeed, I find that in
2003, bank deposits only account for 22 percent of SSA’s GDP when compared to 40
percent in both South Asia and Latin America and the Caribbean. However, a slight
improvement was recorded between 2000 and 2007 (averaging 23 percent of GDP).
Overall, the three measures of financial development reveal an upward trend since 2000
after a series of slow growth.
60 For a comprehensive study on the banking crisis in the SSA region, see Daumont, Le Gall and Leroux, (2004).
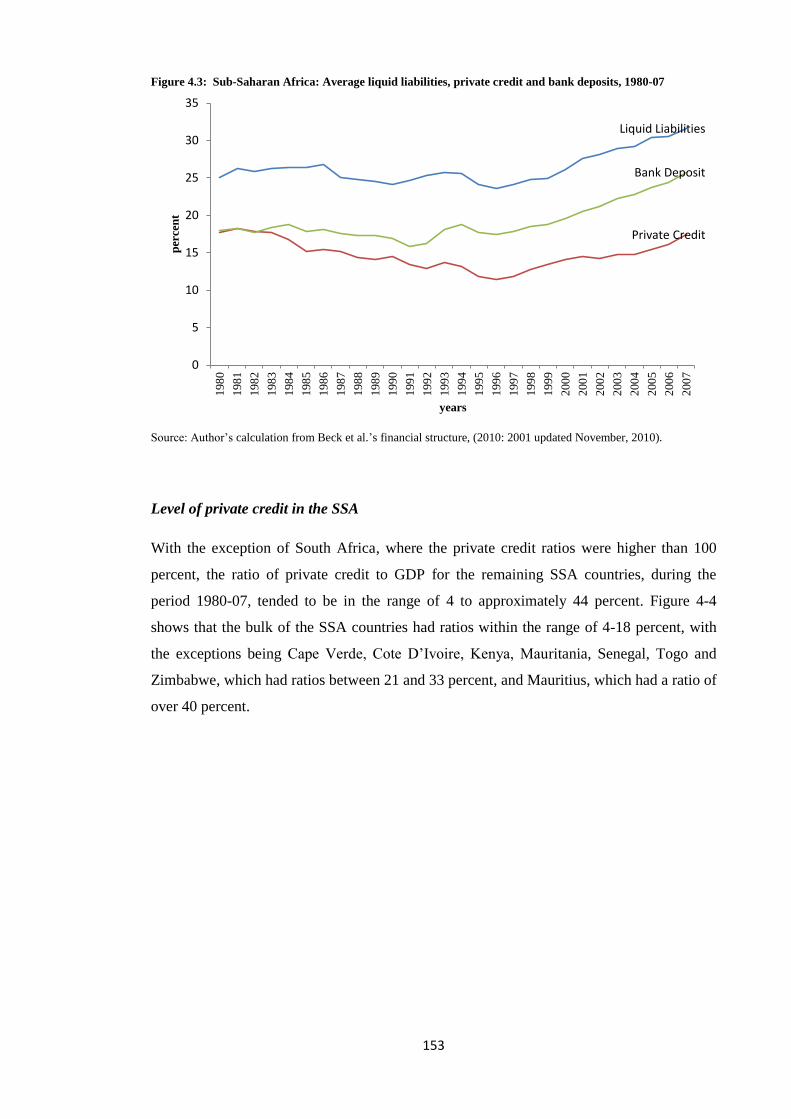
153
Figure 4.3: Sub-Saharan Africa: Average liquid liabilities, private credit and bank deposits, 1980-07
Source: Author’s calculation from Beck et al.’s financial structure, (2010: 2001 updated November, 2010).
Level of private credit in the SSA
With the exception of South Africa, where the private credit ratios were higher than 100
percent, the ratio of private credit to GDP for the remaining SSA countries, during the
period 1980-07, tended to be in the range of 4 to approximately 44 percent. Figure 4-4
shows that the bulk of the SSA countries had ratios within the range of 4-18 percent, with
the exceptions being Cape Verde, Cote D’Ivoire, Kenya, Mauritania, Senegal, Togo and
Zimbabwe, which had ratios between 21 and 33 percent, and Mauritius, which had a ratio of
over 40 percent.
Liquid Liabilities
Private Credit
Bank Deposit
0
5
10
15
20
25
30
35
198
0
198
1
198
2
198
3
198
4
198
5
198
6
198
7
198
8
198
9
199
0
199
1
199
2
199
3
199
4
199
5
199
6
199
7
199
8
199
9
200
0
200
1
200
2
200
3
200
4
200
5
200
6
200
7
per
cen
t
years

154
Figure 4.4: Average financial development (ratio of private credit to GDP) in SSA region, 1980-07
Source: World Banks, World Development Indicators, (2010), Author’s calculation.
These low levels of private credit suggest limited access of finance to rural households and
small and medium scale enterprises (SMEs) in these economies (Gries and Meierrieks,
2010). In addition, non-performing loans, deteriorating macroeconomic environments
and a lack of well-developed legal environments undermined the efficiency of the
banking system. In fact, these factors undermine the potential of the financial sector to
effectively allocate capital to support innovative projects. Kablan (2010) confirms that
non-performing loans were responsible for bank inefficiency in SSA countries and
concludes that there is a need to improve the regulatory and credit environment.
Fast growing economies and financial development
The economies of the fastest growing SSA nations experienced growth in the ratio of
private credit to GDP during the period 1980-07, making most stride in the mid to late
1990s.61
Figure 4-5 (below) shows the ratio of private credit to GDP for Botswana,
Cape Verde and Mauritius. As shown in the figure, the private credit ratio for Botswana
was low towards the end of the 1980s, but rose through to 1992, partly due to the effect
of financial liberalisation reforms and a surge in the demand for credit. By 1997, the
ratio to the private sector had declined once more, reaching 9 percent; its lowest during
61 The countries are Botswana, Cape Verde and Mauritius. They had the fastest rate of real GDP per capita growth
over the period 1980-2007. Real GDP per capita is obtained from Penn World Table 6.3 version.
0
20
40
60
80
100
120
An
go
la
Ben
in
Bo
tsw
ana
Bu
rkin
a F
aso
Bu
run
di
Cam
eroo
n
Cap
e V
erd
e
Cen
tral
Afr
ican
Rep
ubli
c
Ch
ad
Co
ng
o,
Rep
.
Cô
te d
'Iv
oir
e
Eth
iopia
Gab
on
Gam
bia
, T
he
Gh
ana
Ken
ya
Les
oth
o
Mad
agas
car
Mal
awi
Mal
i
Mau
rita
nia
Mau
riti
us
Moza
mb
ique
Nig
er
Nig
eria
Rw
and
a
Sen
egal
Sey
chel
les
Sie
rra
Leo
ne
Sou
th A
fric
a
Sud
an
Sw
azil
and
Tan
zan
ia
Tog
o
Ug
and
a
Zam
bia
Zim
bab
we

155
the 1990s. However, between 1998 and 2007, the ratio of private sector credit to GDP
grew at an annual average of approximately 6.6 percent, with the highest reaching
approximately 20 percent of GDP in 2007.
Several factors explain this significant upward trend. First, the Botswana government
developed several economic development strategies focusing on developing an efficient
financial system that was capable of promoting financial intermediation. Second, in a
bid to promote economic diversification, the government initiated a number of financial
assistance programs, by providing credit to the private sector through organisations such
as Botswana Development Corporation. Government intervention in the financial sector
was also reduced, so as to remove the non-market allocation of capital.
In the case of Cape Verdes’ financial sector, I observe that there is a significant level of
expansion in the ratio of private sector credit to GDP between 1998 and 2007. Efforts
made by the government to promote financial development, by stabilising the exchange
rate and relaxing exchange controls, account for this development. On an annual
average of four years, GDP grew by approximately 5.85 percent during the period 1984-
87 to approximately 5.87 percent in the period 2004-07.
The ratio of private credit to GDP in Mauritius was volatile throughout the period 1980-
2007, following an upward trend with an average annual growth of approximately 4
percent. This period represents the most developed period of Mauritius’ banking
system. In fact, McPherson and Rakovski (1999) note that the development of the
banking system is consistent with the McKinnon-Shaw (1973) hypothesis, which
stresses the reduction in government intervention and the removal of distortions from
the capital markets, in order to promote financial sector development. Moreover,
developed financial infrastructures, such as institutions and good governance, have been
linked with the persistent growth (Figure 4-5, below).

156
Figure 4-5: Financial sector development in the top 3 fastest growing SSA countries
Botswana Cape Verde
Mauritius
Notes: four years annual average of private credit to GDP ratio covering the period from 1980 to 2007.
Source: World Bank’s World Development Indicator, (2010).
4.2.2 Classifying the levels of financial development
To classify Sub-Saharan African countries according to their levels of financial
development, I averaged private credit over three decades (1980-89, 1990-99) with the
exception of (2000-07).62
62 Data are available for the more recent year 2009, however, due to the sample period, we have opted to focus on
2007; hence, we do not have a complete decade. Nevertheless, the results obtained are no different from when using
data from 2000-2009.
0
5
10
15
20
25
1980 1984 1988 1992 1996 2000 2004
per
cen
t
0
10
20
30
40
50
60
1980 1984 1988 1992 1996 2000 2004
per
cen
t
0
10
20
30
40
50
60
70
80
1980 1984 1988 1992 1996 2000 2004
per
cen
t
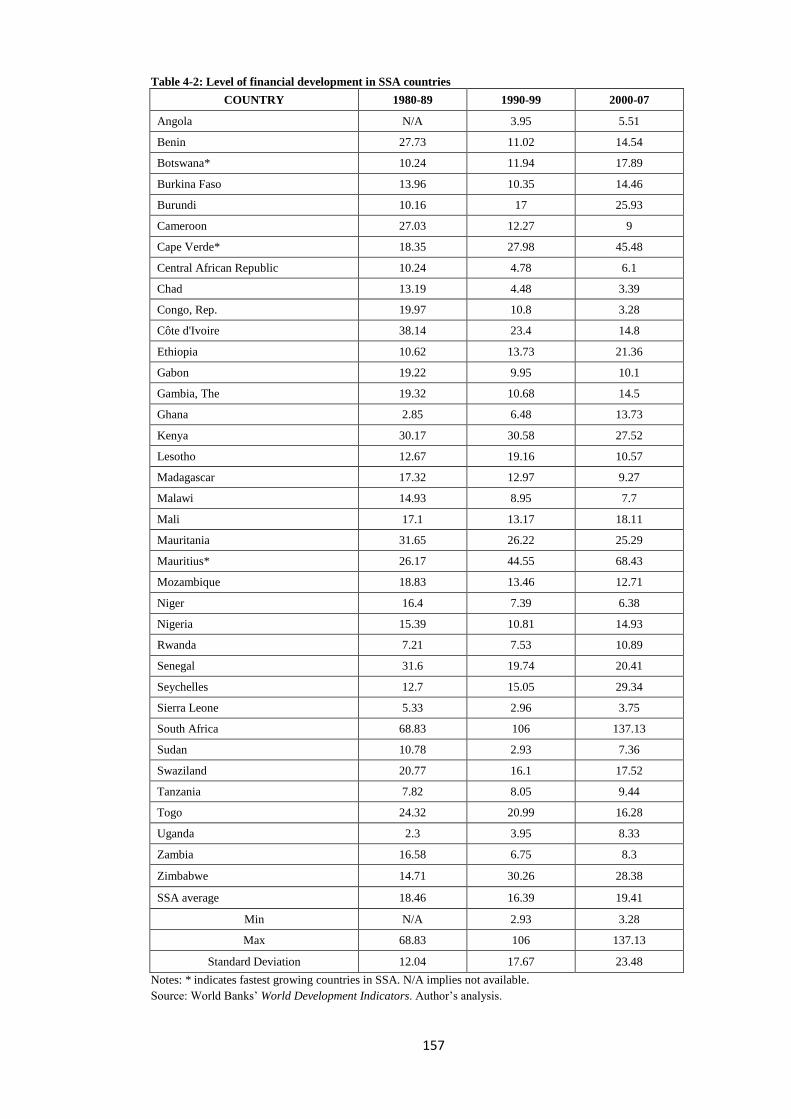
157
Table 4-2: Level of financial development in SSA countries
COUNTRY 1980-89 1990-99 2000-07
Angola N/A 3.95 5.51
Benin 27.73 11.02 14.54
Botswana* 10.24 11.94 17.89
Burkina Faso 13.96 10.35 14.46
Burundi 10.16 17 25.93
Cameroon 27.03 12.27 9
Cape Verde* 18.35 27.98 45.48
Central African Republic 10.24 4.78 6.1
Chad 13.19 4.48 3.39
Congo, Rep. 19.97 10.8 3.28
Côte d'Ivoire 38.14 23.4 14.8
Ethiopia 10.62 13.73 21.36
Gabon 19.22 9.95 10.1
Gambia, The 19.32 10.68 14.5
Ghana 2.85 6.48 13.73
Kenya 30.17 30.58 27.52
Lesotho 12.67 19.16 10.57
Madagascar 17.32 12.97 9.27
Malawi 14.93 8.95 7.7
Mali 17.1 13.17 18.11
Mauritania 31.65 26.22 25.29
Mauritius* 26.17 44.55 68.43
Mozambique 18.83 13.46 12.71
Niger 16.4 7.39 6.38
Nigeria 15.39 10.81 14.93
Rwanda 7.21 7.53 10.89
Senegal 31.6 19.74 20.41
Seychelles 12.7 15.05 29.34
Sierra Leone 5.33 2.96 3.75
South Africa 68.83 106 137.13
Sudan 10.78 2.93 7.36
Swaziland 20.77 16.1 17.52
Tanzania 7.82 8.05 9.44
Togo 24.32 20.99 16.28
Uganda 2.3 3.95 8.33
Zambia 16.58 6.75 8.3
Zimbabwe 14.71 30.26 28.38
SSA average 18.46 16.39 19.41
Min N/A 2.93 3.28
Max 68.83 106 137.13
Standard Deviation 12.04 17.67 23.48
Notes: * indicates fastest growing countries in SSA. N/A implies not available.
Source: World Banks’ World Development Indicators. Author’s analysis.
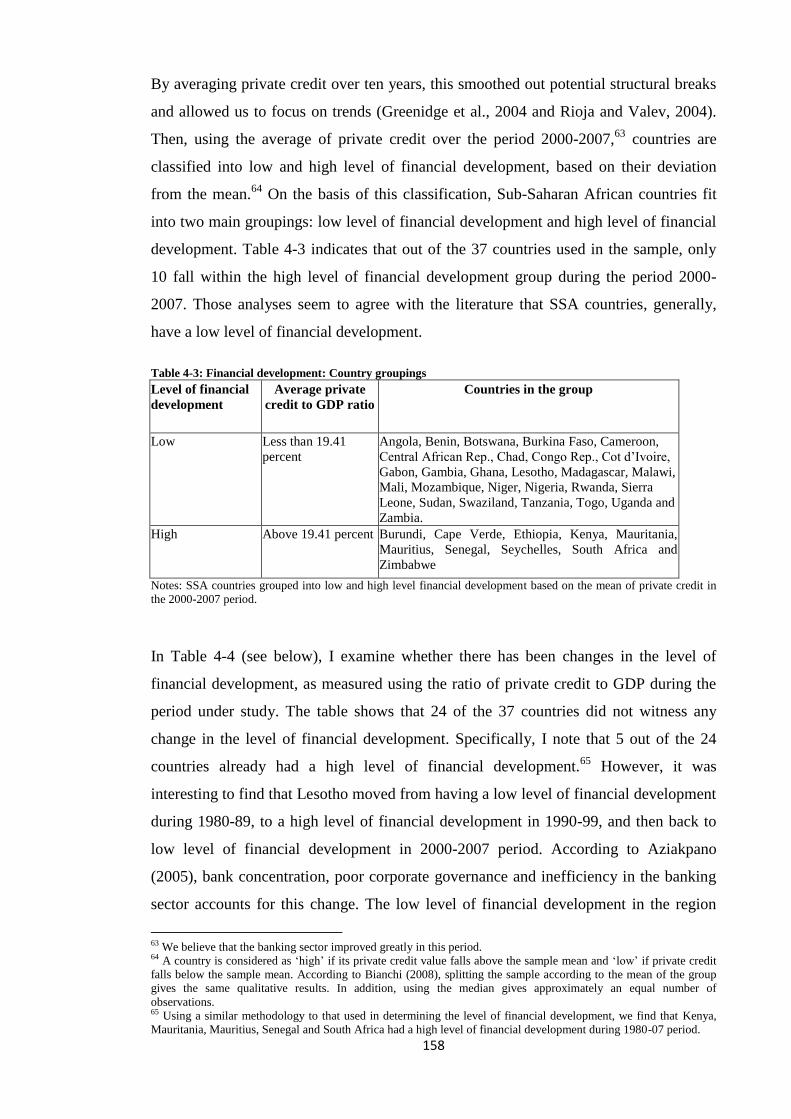
158
By averaging private credit over ten years, this smoothed out potential structural breaks
and allowed us to focus on trends (Greenidge et al., 2004 and Rioja and Valev, 2004).
Then, using the average of private credit over the period 2000-2007,63
countries are
classified into low and high level of financial development, based on their deviation
from the mean.64
On the basis of this classification, Sub-Saharan African countries fit
into two main groupings: low level of financial development and high level of financial
development. Table 4-3 indicates that out of the 37 countries used in the sample, only
10 fall within the high level of financial development group during the period 2000-
2007. Those analyses seem to agree with the literature that SSA countries, generally,
have a low level of financial development.
Table 4-3: Financial development: Country groupings
Level of financial
development
Average private
credit to GDP ratio
Countries in the group
Low Less than 19.41
percent
Angola, Benin, Botswana, Burkina Faso, Cameroon,
Central African Rep., Chad, Congo Rep., Cot d’Ivoire,
Gabon, Gambia, Ghana, Lesotho, Madagascar, Malawi,
Mali, Mozambique, Niger, Nigeria, Rwanda, Sierra
Leone, Sudan, Swaziland, Tanzania, Togo, Uganda and
Zambia.
High Above 19.41 percent Burundi, Cape Verde, Ethiopia, Kenya, Mauritania,
Mauritius, Senegal, Seychelles, South Africa and
Zimbabwe
Notes: SSA countries grouped into low and high level financial development based on the mean of private credit in
the 2000-2007 period.
In Table 4-4 (see below), I examine whether there has been changes in the level of
financial development, as measured using the ratio of private credit to GDP during the
period under study. The table shows that 24 of the 37 countries did not witness any
change in the level of financial development. Specifically, I note that 5 out of the 24
countries already had a high level of financial development.65
However, it was
interesting to find that Lesotho moved from having a low level of financial development
during 1980-89, to a high level of financial development in 1990-99, and then back to
low level of financial development in 2000-2007 period. According to Aziakpano
(2005), bank concentration, poor corporate governance and inefficiency in the banking
sector accounts for this change. The low level of financial development in the region
63 We believe that the banking sector improved greatly in this period. 64 A country is considered as ‘high’ if its private credit value falls above the sample mean and ‘low’ if private credit
falls below the sample mean. According to Bianchi (2008), splitting the sample according to the mean of the group
gives the same qualitative results. In addition, using the median gives approximately an equal number of
observations. 65 Using a similar methodology to that used in determining the level of financial development, we find that Kenya,
Mauritania, Mauritius, Senegal and South Africa had a high level of financial development during 1980-07 period.

159
has been confirmed in recent studies, including Beck et al. (2003) and Kablan (2010).
These studies conclude that improvement in institutions (such as legal institutions) is
required, in order to promote banking efficiency and encourage the investment needed
to boost economic growth.
Table 4-4: Changes in level of financial development in SSA countries
FINANCIAL DEVELOPMENT IN SSA, 1980-07
IMPROVED
Cape Verde, Lesotho*, Seychelles and Zimbabwe
DETERIORATED
Benin, Cameroon, Congo Republic, Cote d’Ivoire, Gabon, Gambia, Lesotho*, Mozambique, Swaziland
and Togo
NO CHANGE
Angola, Botswana, Burkina Faso, Burundi, Central African Republic, Chad, Ethiopia, Ghana, Kenya,
Madagascar, Malawi, Mali, Mauritania, Mauritius, Niger, Nigeria, Rwanda, Senegal, Sierra Leone,
South Africa, Sudan, Tanzania, Uganda and Zambia Notes: * indicates two different changes. First, during the period 1990-99, Lesotho encountered an improvement in
the level of financial development, however, the level of financial development deteriorated in 2000-07 period.
4.3 Literature review
4.3.1 Theoretical framework
The existence of a relationship between finance and growth is widely recognised in the
literature.66
There are two distinct views in the finance-growth nexus. The first one
considers finance as important to growth (Goldsmith, 1969; Fry, 1995 and Schumpeter,
1911) and the second considers finance as an unimportant aspect of growth (Robinson,
1954 and Singh, 1997).
The view that finance is important for growth was first proposed by Schumpeter (1911),
who argues that financial intermediaries, through the provision of financial services and
resources to investors who are ready to finance new projects, are important drivers of
economic growth. The argument here is that the financial system plays a critical role in
reallocating resources to the most productive projects, which that will in turn lead to
higher economic growth. In addition, a well-functioning financial system encourages
technological innovation and, in turn, improves economic growth. The implication of
this is that countries with well-developed financial systems (usually measured by the
size of the financial system) tend to grow faster than those with underdeveloped
financial systems. Consequently, this type of relationship is referred to as ‘supply-
leading’. The above view was later formalised by Goldsmith (1969); Fry (1995);
66 The foundation of the importance of financial systems in the economy can be traced to Bagehot, (1973). He argued
that financial systems were responsible for igniting industrialisation in England.

160
McKinnon (1973) and Shaw (1973), who all believed that financial development
facilitates economic growth.
The second view postulated by Robinson (1954), suggests that financial development is
a result of economic growth, and that the increase in the demand for financial services is
actually caused by economic growth. According to Robinson, as the real sector grows,
the demand for financial services induces growth. That is to say, as an economy grows,
the financial institutions, financial products and financial services emerge in response to
the increased demand for financial services, hence, the author concludes that ‘where
enterprise leads, finance follows’. This argument suggests that financial and monetary
systems do not have a long-run relationship with economic growth. Thus, this type of
relationship is referred to as ‘demand following finance’. This view is supported by
Ireland (1994) and Singh (1997), who find that financial development may actually
impede economic growth in the short-run.
The two views detailed above are contradictory and create significant debate. Patrick
(1966) tries to reconcile both views by pointing out that finance was required for growth
in the early stages of economic development, this is the case of the ‘supply-leading’
finance. Nevertheless, finance also responds to the changes in the economy in the later
stages of development. Thus, this also implies that, economic growth creates a demand
for developed financial institutions and services, hence, ‘demand-following’ finance.
Despite this explanation, Lucas (1988) refutes these findings and concludes that
‘financial sector development is not related to economic growth’ and that the role of
finance in growth has been ‘badly overstressed’.
As explained above, the debate has remained unresolved. Thus, to understand the role of
finance in growth, I revisit the early theory of economic growth, because it will help us
understand the sources and/or factors that cause economic growth. In the early growth
theories, the role of finance in promoting economic growth was not mentioned; rather, it
was believed that the efficient utilisation of the factors of production (labour and
capital) led to economic growth. Chandavarka (1992) explains that development
economists are always sceptical of the role of finance in the growth process, and as
such, it is often ignored. Accordingly, the literature on growth notes several other
factors that cause economic growth including; investment ratio (Harrod-Domar model,
Pagano, 1993), trade openness and research and development (R&D), (Rodrik, 1999),
human capital and technological progress (Barro and Lee, 1994 and 1997 and Romer,
1986). The literature on growth is very large, but to understand the factors that drive

161
economic growth, I examine the exogenous and endogenous growth theories. It should
be noted that the purpose of this chapter is not to provide an in-depth review of the
theoretical literature, but to examine the role of institutions on financial development
and to examine its role as a channel through which finance affects growth in Africa.
Hence, the exogenous and endogenous theories are used to guide our theoretical
underpinning.
Robert Solow (1956) developed one of the first models used in explaining the processes
and causes of economic growth. By extending the Harrod-Domar model, the Solow
model, as it is known, proposed that economic growth occurs through exogenous
changes in factor accumulation. That is to say, a change in the factors of production
(capital and labour) will lead to changes in output over time. In explaining the process
of economic growth, Solow considers a production function with four main variables;
output (Y), capital (K), labour (L) and knowledge (A). Using the supply side of the
economy as the main focus, the model assumes that savings, investments, factor
accumulation and technological progress, or knowledge (A), are exogenous in
determining economic growth. It also assumes that both capital and labour exhibit
constant returns to scale. From this assumption, it follows that an increase in labour
would lead to a decrease in output, given that capital remains the same. Eventually, an
increase in capital will produce no output, therefore causing growth to cease.
In this model, an increase in technology or knowledge (A), will lead to an increase in
output. This implies that if new technologies improve the productivity of labour and
capital, and prevents a decrease in the rate of return, the labour force will grow at an
exogenous rate. In addition, growth in the labour force is dependent on changes in
population growth. Thus, a change in capital depends on net investment, and capital will
only grow if investment is positive. The Solow model assumes a closed economy with
no government and in the long-run, supply and demand are equalised. Therefore, in the
short-run, capital grows faster than labour, causing output and capital per worker to
grow temporally, while in the long-run, the output and capital growth rate is equal to
zero, and savings rate is just enough to provide for labour (Al-Tamman, 2005).
Consequently, the theory of exogenous growth argues that sustained economic growth is
dependent only on exogenous technological change.
In the endogenous growth theory, on the other hand, investing in human capital and
research and development (R&D), and the introduction of institutions which are capable
of providing funding for people to be innovative, are important in explaining long-run

162
economic growth. This model highlights the failures of the Solow model by arguing that
technological progress is not given, rather that investment in human capital and R&D
leads to the discoveries of new technologies. Accordingly, the new found technology or
knowledge leads to innovation and further investment in human capital, because it is an
important aspect of economic growth. The main argument the endogenous model puts
forward is the importance of government intervention. According to the theory,
appropriate government policies can raise a country’s growth rate, particularly if they
lead to a higher level of competition in markets and a higher rate of innovation.
The endogenous growth theory argues that the former growth theory did not allow for
government intervention or policies, and that the role of savings and technological
progress was not clearly justified, hence, the need to revisit the theory. The theory also
emphasised the role of private institutions. Endogenous growth theory notes that the
introduction of private institutions that provide incentives for people to be inventive and
promote innovation is essential for economic growth. The implication of this is that
financial intermediaries that promote and allocate resources to the development of new
innovations may have a positive role in promoting long-run economic growth. The
endogenous theory best captures the role of financial intermediaries, as described by
Schumpeter (1911).
From the discussion above, I observe that both theories believe investment is important
for economic growth, but the main difference between the two is that the endogenous
growth model introduces the importance of government intervention and private
institutions. Consequently, it might imply that financial intermediaries that promote and
allocate resources to the development of new innovations may have a positive role in
promoting long-run economic growth.67
This explanation seems to be in line with
earlier studies of Schumpeter (1911).
67 Greenwood and Javanovic (1990), using an endogenous growth model framework, conclude that financial
intermediaries have a positive effect on the steady state growth.

163
Explaining the role of finance in growth
The increasing role of finance in the growth process of developing countries,
particularly the SSA region, has been recognised. For example, following several
economic and financial reforms in the 1990s, South Africa’s stock market and banking
system has now been recognised by the World Economic Forum’s first financial
development index in 2008 as ranking 25th
largest financial system in the world, (WEF,
2008: 12).68
In fact, the International Monetary Fund (IMF, 2008:1) observed that South
Africa’s financial system is “fundamentally sound, has a sound financial infrastructure
and a good legal framework supported by prudent macroeconomic management”.
According to the World Bank (2007), the improvement has earned the Johannesburg
Stock Exchange (JSE) the ranking of the fourth largest among emerging economies and
the eighteenth largest in the world by market capitalisation. Although, South Africa’s
financial system is the largest in Africa and the SSA region, other countries in the
region still face the challenges of illiquidity, improving their financial infrastructure and
transparent and corporate governance. Despite the JSE being recognised as well-
functioning and matured, the majority of SSA countries still rely on their banking
system to promote economic growth. Consequently, the argument on which financial
structure is important for growth, in the SSA region, still remains unresolved.
To illustrate the distinction of the role of bank-based or market-based systems in
economic growth, the literature focuses on the functions provided by both financial
structures in a microeconomic and macroeconomic context. Herein, the bank-based
theory highlights the importance of banks in the economic development process, while
noting the deficiency of the stock markets. This theory suggests that banks can promote
economic growth more efficiently, when compared to stock markets in developing
countries. Here, they noted that many developing countries, particularly the SSA
countries, tend to have better developed banking systems, hence, banks promote more
growth. However, the proponents of the market-based theory highlight the fact that
well-functioning markets promote more economic growth than underdeveloped ones
(for instance, Schumpeter, 1911).
68 The report measures and analyses factors that enable the development of financial systems in a number of
economies around the world based on efficiency and size of banking and other financial services, overall business
environment, financial stability and the extent of financial disclosure and market liberalisation. It grades countries on
these criteria out of a maximum of 7 points and generates an overall financial development index which is used in
ranking these economies.

164
The role of banks
According to Boyd and Prescott (1986), financial intermediaries (banks) may lower the
costs of gathering and processing information, through the improvement of collecting
information on all economic agents, and in doing so improve the allocation of resources
to boost economic growth. Here, the authors emphasise the fundamental role of banks in
producing information and reducing the misallocation of resources. This view is also
supported by Bencivenga and Smith (1993), who argued that banks can alleviate the
corporate governance problem by lowering the monitoring costs, reducing credit
rationing and, thereby, spurring growth. Meanwhile, Stiglitz (1985) examined the
activities of stock markets and banks by evaluating the behaviour of managers in
relation to shareholders funds, and argued that stock market liquidity will not enhance
incentives for acquiring information about firms or exerting corporate governance.
According to the author, stock markets will not enhance resource allocation and
corporate government as banks do. Moreover, as is the case of many developing
countries where financial liberalisation has led to the rapid expansion in stock markets,
Singh (1997) argued that these markets alone cannot promote economic growth. The
literature suggests that one of the main reasons for this is that the interaction between
stock markets and credit markets in the wake of unfavourable economic shocks may
exacerbate macroeconomic instability and reduce long-term growth, hence favouring
bank-based systems.
The role of stock markets
By contrast, market-based theory highlights the importance of well-functioning stock
markets, whilst simultaneously noting the problems that plague bank-based economies.
Two of the studies that explain the role of stock markets in the economy is that of
Diamond (1984) and Greenwood and Javanovic (1990). They suggest that the stock
market promotes the acquisition, as well as dissemination, of information, and may
actually reduce the cost of mobilising savings, thereby, facilitating investment and,
ultimately, increasing economic growth. From this perspective, the financial systems
that encourage the mobilization of savings, by providing attractive instruments and
saving vehicles, can profoundly affect economic development. Nonetheless, Levine
(1991) argued that stock market liquidity is crucial for growth because a liquid stock
market enhances an economy’s ability to mobilise savings, diversify risk and improve
165
the allocation of capital. Holmstrom and Tirole (1993) also note that liquid stock
markets can increase incentives for investors to get information about firms and
improve corporate governance. In addition, Greenwood and Smith (1997) argued that
large stock markets can decrease the cost of mobilising savings, therefore, facilitating
investment in the most productive technologies. According to the authors, stock markets
affect growth in the long-run however, economic growth, in turn, encourages the
formation of markets, hence, providing support for Patrick (1966).
Other studies (such as Diamond and Verrecchia, 1982 and Jensen and Murphy, 1990)
examined the activities of stock markets by evaluating the behaviour of managers
(agents) and owners (principals) at the firm level. They argue that a well developed
stock market may enhance corporate control by mitigating the principal-agent problem
by aligning the interests of managers and owners, in which case managers could strive
to maximise firm value. Using overlapping generation models, Bencivenga, Smith and
Starr (1996) show that stock market development facilitates a reduction in transaction
costs, this helps in promoting economic growth, therefore, making it easy for investors
and savers to frequently sell and buy their assets.
Allen and Gale (2000) suggests that stock markets are potentially important
mechanisms for promoting economic growth, because they reduce market inefficiencies
due to the monopoly power of banks and, therefore, encourage growth enhancing
activities. In fact, Arestis and Demetriades (1999) and Arestis (2003) observe that these
markets assume an important role because; (i) the higher interest rates which usually
follow banking liberalisation encourage firms to issue equity, (ii) it provides a channel
through which international investors gain access to developing countries, thus
providing access to the foreign capital required for economic growth, and (iii) they are
often a compulsory part of the financial liberalization packages. According to the above
explanation, openness in the financial market would lead to an increase of the inflows of
domestic and foreign capital, which in turn increases the resources available for
investment whilst also leading to an increase in stock market capitalisation.
Consequently, a deep and liquid stock market is important to promote economic growth.
When compared to other developing countries in Asia and Latin America, stock markets
in Sub-Saharan Africa show some distinctive features. African stock markets tend to be
small, illiquid, shallow and narrow. The fragile nature of the stock markets makes it
difficult for them to attract the volume of participation needed to deepen them

166
(Standley, 2010). The current state of the stock markets in the region has been linked to
the small size of the economies. Nevertheless, it is also recognised that there are other
international explanations for this, such as the poor state of the institutional
environment, excessive volatility, insider trading and lack of financial infrastructure
(Singh, 1998). As a result, stock markets limit economic development in Africa.
According to Arestis (2003), the impact of stock market on growth depends on the type
of institutional environment in which they operate. The implication of this in the
African context, is that the weak and generally inefficient institutional framework would
not be capable of effectively, and efficiently, enforcing laws and regulations in order to
monitor and safeguard investor interest. As a result it is difficult for the stock market to
promote economic growth.
The complementary role
In one of the influential study on finance-growth relationship, King and Levine (1993a)
argued that other than stock markets, banks may also spur the rate of technological
innovation, by selecting those entrepreneurs with the greatest chances of launching
successful ventures. From this point of view, both banks and stock markets complement
each other. Gurley and Shaw (1955) and Greenwood and Javonovic (1990) equally
present a framework in which financial intermediaries and security markets provide
vehicles for trading, pooling and diversifying risk. Thus, financial systems allow agents
to hold a diversified portfolio of risky projects, which will induce society to shift
towards projects with higher expected returns with a positive incidence on economic
growth. Despite the general lack of consensus on the role of finance on growth in the
theoretical discussions, Levine, (1997) concludes that ‘the development of financial
markets and institutions is an important part of the growth processes’, thus implying,
that financial markets may cause economic growth.
4.3.2 Empirical evidence on finance and growth in developing countries
The positive role of finance on growth has been well established in the field of
economics (for example Levine, 1997; Arestis et al., 2001 and Demirguc-Kunt and
Levine, 2008). One of the earliest contributions to the literature is the seminal paper by
Goldsmith (1969), who provided empirical evidence to show the relationship between
finance and economic growth. The work of King and Levine (1993b) clarified this
relationship using an endogenous growth model featuring financial entrepreneurship
and economic growth. They stressed the importance of finance for growth by explaining
167
that access to better financial services expands the scope and improves the efficiency of
innovative activity and, in turn, promotes economic growth.
To confirm this in an empirical setting, the authors used four different measures; (i) real
per capita GDP growth, (ii) growth in the capital stock per person, (iii) total factor
productivity growth also known as ‘Solow residual’ and, (iv) investment to proxy
economic growth. They then construct three measures of financial sector development
to use in their model. These include; (i) Depth, which is the ratio of the liquid liabilities
of the financial system to GDP, (ii) Bank, which is the domestic money in banks
divided by the domestic assets of deposit money banks and central banks, (iii)
PRIVATE, which relates to the ratio of claims on the non-financial sector to the total
domestic credit (excluding credit to money bank) and, (iv) Privy, which relates to the
ratio of claims on the non-financial sector to GDP. This is interpreted in such a way that
a higher value indicates an increase in credit to the private sector.
The authors examined the relationship between these new measures using 77 countries,
over the period 1960 to 1989. According to their result, there exists a strong positive
correlation between all measures of financial development and economic growth, even
after controlling for other factors affecting economic growth such as trade, education
and political stability. The authors found that the degree of financial development
explains economic growth, and as such, they concluded that financial development is
strongly linked to economic growth. Moreover, their results show that well developed
financial systems promote economic growth, and this is done is by funding productive
investment.
Although the above study provides evidence of a positive relationship between finance
and growth, one main shortcoming is that it focused on one aspect of the financial
system (i.e. banks). Furthermore, the model does not consider other factors that might
affect finance and growth in the context of developing countries. For example, in most
SSA countries, credit allocation is often subject to government intervention, thus, it is
unlikely that finance, or better still, a well-developed financial market would promote
economic growth by channelling funds into productive investment. This is because of
the differences that exist between the economies in this region and the institutional
framework in which they operate.
While some studies (such as Arestis and Demetriades, 1997; Beck et al., 2000; Levine
and Zervos, 1998 and Odedokun, 1996) found that banks promote economic growth in

168
developing countries, others (such as Atje and Jovanovic, 1993; Chritodoulos and
Tsinas, 2004; Kenny and Moss, 2001; Levine and Zervos, 1995, 1998; Mohtadi and
Agarwal, 2004) suggest that stock market development has a positive effect on
economic growth, although the majority of these studies focus mainly on developed and
transition countries. Nonetheless, several studies (Allen and Ndikumana, 2000;
Guillaumont et al., 2006 and Shahbaz et al., 2008) find indicators of financial
development do indeed have a significant positive effect on economic growth. Gelbard
and Leite (1999) also empirically demonstrated that there is a strong positive
relationship between financial depth and growth in SSA.
A number of empirical literatures confirm the positive role of finance on growth;
however, counter evidence also exists. Akinboade (2000) examined the relationship
between financial deepening and economic growth in Tanzania using measures of
banking sector development. The results suggest that financial deepening has a negative
and significant effect on growth during the financial liberalisation period. Similarly,
Beck and Levine, (2004), Favara (2003), and Ghimire and Giorgioni, (2009), used
other measures such as private credit to proxy banking development, demonstrate that
there is a negative effect of private credit on economic growth in the short-run which
turns positive and significant in the long-run. Following a similar line of argument is
Zhang (2003), who shows that banking sector development in Asia had a significant
negative effect on economic growth during the 1960 to 1999 period. Andersen and Tarp
(2003) also report a similar finding for a sample of African and Latin American
countries. Levine (2002), however, notes that the negative effect may be a result of the
banks being involved with intermediaries that have a huge influence over firms.
The empirical findings remain contradictory, thus leaving many economists puzzled.
While studies such as Allen and Gale (2000), Atje and Jovanovic (1993), Capasso
(2008), Greenwood and Jovanovic (1990), Greenwood and Smith (1997) and Morck
and Nakuruma (1999), and, all argue that the stock market has a positive effect on
economic growth, others like Stiglitz (1985) and Singh (1997), tend to favour the banks’
role in the growth process. Meanwhile, Boyd and Prescott (1986), Boyd and Smith
(1998) and Blackburn et al. (2005), have all shown that both stock markets and banks
are necessary in promoting economic growth, therefore, suggesting a complementary
relationship between them. Both banks and stock markets promote economic growth by
improving information dissemination and reducing transaction costs (Beck and Levine,
2004).
169
To show that financial structure is important in the finance-growth literature, empirical
literature focuses on four developed countries (Germany-Japan and U.K-U.S).
Germany-Japan is classified as bank-based and U.K-U.S, market-based. On the one
hand, Demirguc-Kunt and Levine, (1999) and more recently, Arestis et al. (2005) point
out that the fact that these countries historically share similar growth patterns, as a result
of financial structure, does not matter. However, on the other hand, Gerschenkron,
(1962) in seminal paper on ‘Economic Backwardness in Historical Perspective’
detailing the industrialisation process of Britain, Germany and Russia, found that the
developmental role of banks cannot be ignored. The author notes that ‘banks are more
capable of financing economic growth than the weak stock markets.’69
The author
linked Germany’s rapid development to its banking system (which he saw as the
primary source of capital and entrepreneurship) and concluded that:
It is ‘largely by the application of the most modern and efficient techniques that
backward countries could hope to achieve success, particularly if their
industrialization proceeded in the face of competition from the advanced
country’, (p. 9);
To succeed in catching-up, countries had to build up new ‘institutional
instruments for which there was little or no counterpart in the established
industrial country’, (p. 7);
The more backward the country, the greater the need for banking to supply both
capital and entrepreneurship.
Andrianova et al. (2008) and Mobolaji (2008) generally share similar views to
Gerschenkron, (1962). They note that state owned banks can effectively overcome
market failures by allocating savings in countries with weak institutions at an early
stage of economic development. This implies that in regions characterised with
underdeveloped financial system, banks tend to perform better than stock markets
(Tadesse, 2001).
69 Although there has been rapid expansion of stock markets in many developing countries, these markets are small
and underdeveloped. Moreover, Singh (1997) argues that stock markets alone cannot promote long-term growth in
these countries. Besides, banks play a major role in the financial system of developing countries, especially African
countries.

170
The lack of general consensus on the finance-growth relationship has been linked to
several factors. For instance, Jappelli and Pagano (1992) stress the importance of
specifying the type of financial structure (banking sector or stock market), in order to
distinguish its impact on economic growth. Ang and McKibbin (2008) argued that the
positive or negative effect of financial development on economic growth depends on the
type of financial indicator used, and Gregorio and Guidotti (1995) argue that the impact
of finance on growth depends on the region, time periods and levels of income.
Moreover, the use of a combination of countries, with varying levels of economic
development, often leads to the distortion of results. In addition, the use of cross-
country analysis makes it difficult to interpret results, because it deals with average
effects (Favara, 2003).
4.4 Institutions and financial development in Sub-Saharan Africa
The proposition that institutions are important for financial development has been a
subject of recent debate, with the main emphasis on; (i) law and regulations and (ii)
political economy. The literature relates to a combination of developed and developing
countries. Interestingly, the results have been very persuasive, but not conclusive,
characterising the issue as one of continuous research importance, especially in
developing countries where there are concerns over how rules governing the activities
of the countries are not well defined or practiced in totality.
North (1991: 97) defines institutions as ‘humanly devised constraints that structure
political, economic and social interactions’. In other words, institutions are rules that are
set to regulate or constrain the interactions of a member of society. These rules must be
shared by the members of the society and remain anchored in their minds. Institutions
define what people are ‘prohibited from doing and the conditions under which
individuals are permitted to undertake certain activities’ (de Soysa and Jutting, 2006: 3).
Based on the degree of formality, institutions are either formal (e.g. laws, property
rights and constitutions) or informal (e.g. customs, traditions, taboos and codes of
conduct).
On the one hand, formal institutions are written rules that are devised to constrain human
interaction and exchange. On the other hand, informal institutions are unwritten codes of
conduct that govern human interaction, or they are human constraints, derived from
shared norms of behaviour. They arise due to the demand for protection in societies,
where free riding is increasing and the cost of punishing the defectors is too high,

171
because of their increasing number. Although both operate under different principles,
they are created from the necessity of reducing uncertainty in human exchange. While
formal institutions are enforced by courts, judges or the states, informal institutions rely
on self-enforcing mechanisms to ensure that contract terms are adhered to. The present
study is most interested in the formal type of institutions. These can be classified into:
economic and political. Economic institutions, such as property rights and its
enforcement, tend to shape the rules of economic game and political institutions;
mainly, the political system (either democracy or autocracy) shapes the rules of the
political game.
The existing research that explored the relationship between institutions and financial
development show that financial development relies on good governance to transfer
savings into productive areas effectively. It has been documented that the role of the
financial system is to transfer funds from savers, to borrowers who have productive
investment opportunities. However, in the real world, the functioning of the financial
markets is sometimes distorted by imperfect information, which often leads to market
imperfection. This type of information asymmetry can be in the form of; (i) adverse
selection and (ii) moral hazard. In adverse selection, information asymmetry arises
when lenders do not have the full information about the borrowers prior to signing a
contract (whether they tend to engage in risky projects or not) or when borrowers fail to
provide the correct information to lenders, in order to obtain funds with low cost and
without risk premiums.
Moral hazards occur after the contract is signed. When lenders tend to lack information
as to whether the borrower will enter into risky project, or when lenders cannot monitor
and control risk-taking by borrowers, as a result, some borrowers take on more risk than
they agree to in financial contracts. In this context, it is important that financial systems
are regulated and supervised to ensure that the confidence of the savers is not
undermined by bank failures, and that savings are being channelled to the most
productive investments rather than into high-risk projects (Hellman et al., 2000). Hence,
having an effective, efficient and functioning institution which is capable of managing
the risks associated with financial markets is important (Law and Azman-Saini, 2008).
In this regard, formal institutions are set up to reduce uncertainty and risks, by clearly
specifying the terms and agreements of a contract, and the consequences of breach.
Hadfield (2004) notes that it backs up the transaction with the third party’s power to
extract penalties.

172
Evolution of institutions in Sub-Saharan Africa
There is no doubt regarding the importance of financial development, however,
developing the right institutions is also essential. In the Governance Matters publication
by the World Bank, Kauffman et al. (2008), observe that some developing economies,
such as Botswana and Mauritius, have better governance scores than those of developed
economies like Greece. These scores are calculated from the six globally accepted
standards of good governance; (i) voice and accountability, (ii) political stability and
absence of violence, (iii) government effectiveness, (iv) regulatory control, (v) rule of
law, and (vi) control of corruption. They can be grouped under three dimensions:
political, economic and institutional (legal). Firstly, the political cluster deals with the
process in which those in authority are selected. They include voice and accountability,
and political stability. Secondly, economic institutions deal with the capacity of the
government to implement policies and provide public services. They include
government effectiveness and regulatory control. Finally, the legal cluster deals with the
respect for institutions that govern interactions among citizens and the state. They
include rule of law and control of corruption.
Using the average of the six dimensions of governance to measure overall institutional
development, which I refer to as KKM (Kaufmann, Kraay and Mastruzzi, 2008) I
examine the level of institutional development across the countries in our sample. Out
of the 37 countries studies, the quality of institutions found in Botswana seem to be
better compared to the other countries during the period under consideration.

173
Table 4-5: Average governance indicators in SSA region, 1996-2007
COUNTRY CCE GEE PSE RLE RQE VAE KKM
Angola -1.25 -1.18 -1.32 -1.43 -1.37 -1.28 -1.30
Benin -0.66 -0.40 0.49 -0.43 -0.33 0.27 -0.16
Botswana 0.82 0.62 0.91 0.61 0.66 0.70 0.72
Burkina Faso -0.16 -0.71 -0.13 -0.54 -0.27 -0.39 -0.37
Burundi -1.06 -1.36 -1.95 -1.27 -1.30 -1.24 -1.37
Cameroon -1.07 -0.91 -0.69 -1.13 -0.68 -1.08 -0.93
Cape Verde 0.32 0.09 0.94 0.51 -0.24 0.63 0.37
Central African
Republic -1.14 -1.43 -1.31 -1.37 -1.07 -0.98 -1.20
Chad -1.12 -0.96 -1.38 -1.10 -0.94 -1.16 -1.10
Congo, Rep. -1.02 -1.37 -1.55 -1.33 -1.12 -1.06 -1.24
Côte d'Ivoire -0.80 -0.95 -1.54 -1.28 -0.63 -1.18 -1.06
Ethiopia -0.69 -0.84 -1.31 -0.73 -1.13 -1.09 -0.96
Gabon -0.75 -0.60 0.04 -0.59 -0.22 -0.63 -0.46
Gambia -0.46 -0.59 0.29 -0.09 -0.56 -0.88 -0.38
Ghana -0.25 -0.24 0.00 -0.17 -0.13 0.07 -0.12
Kenya -0.98 -0.68 -1.03 -0.97 -0.30 -0.47 -0.74
Lesotho -0.21 -0.24 0.16 -0.15 -0.52 -0.15 -0.18
Madagascar -0.05 -0.48 0.05 -0.39 -0.40 0.00 -0.21
Malawi -0.68 -0.58 -0.15 -0.52 -0.39 -0.33 -0.44
Mali -0.45 -0.65 0.11 -0.36 -0.32 0.28 -0.23
Mauritania -0.15 -0.25 -0.02 -0.54 -0.28 -0.86 -0.35
Mauritius 0.42 0.44 0.64 0.83 0.46 0.86 0.61
Mozambique -0.65 -0.38 0.06 -0.80 -0.45 -0.08 -0.39
Niger -0.89 -0.93 -0.35 -0.81 -0.67 -0.53 -0.70
Nigeria -1.26 -1.03 -1.73 -1.34 -1.03 -0.85 -1.21
Rwanda -0.53 -0.83 -1.21 -1.01 -0.88 -1.34 -0.99
Senegal -0.31 -0.13 -0.36 -0.28 -0.24 0.05 -0.21
Seychelles 0.28 -0.04 0.94 0.31 -0.66 0.05 0.13
Sierra Leone -1.04 -1.23 -1.09 -1.23 -1.14 -0.81 -1.09
South Africa 0.46 0.75 -0.36 0.13 0.43 0.78 0.36
Sudan -1.17 -1.22 -2.16 -1.49 -1.30 -1.69 -1.51
Swaziland -0.38 -0.68 0.00 -0.56 -0.44 -1.27 -0.55
Tanzania -0.83 -0.51 -0.32 -0.40 -0.34 -0.38 -0.46
Togo -0.84 -1.24 -0.56 -0.94 -0.63 -1.29 -0.92
Uganda -0.83 -0.52 -1.37 -0.71 -0.03 -0.70 -0.69
Zambia -0.86 -0.83 -0.22 -0.58 -0.37 -0.39 -0.54
Zimbabwe -1.06 -0.97 -1.33 -1.36 -1.78 -1.29 -1.30
Note: The range of governance indicators are between -2.5 and +2.5. Where +2.5 indicates best governance and -2.5
indicates worst governance. CCE refers to control of corruption, GEE refers to government efficiency, PSE is
political stability, RLE is rule of law, RQE is regulatory quality, VAE refers to voice and accountability and KKM is
the average of the six measures of governance.
Source: World Banks, World Governance Indicators, (2010).

174
Changes in institutional development during the period 1996 and 2007
Using the average of the various aspects of governance as an indicator of overall
institutional development, I show the changes in institutional development in the sample
of SSA countries between 1996 and 2007 in Figure 4-5. The governance indicator, by
Kaufmann et al. (2009) is measured on a scale ranging from -2.5 to 2.5, where 2.5 refers
to a high level of institutional development and -2.5 refers to low level of institutional
development. According to the figure, five countries had positive and high levels of
institutional development in 1996. The figure also shows that the level of institutional
development improved in 21 of the 37 countries, while the remaining 16 deteriorated
significantly. During this period, the figure shows that institutional development in
Chad, Cote D’Ivoire and Zimbabwe showed the largest levels of deterioration.
Figure 4.5: Changes in governance indicators in SSA between 1996 and 2007
Note: Data are averages of institutional attributes for 1996 and 2007.
Source: Kaufmann et al. (2009).
Using the data for 1996 and 1997, I try to examine whether there has been any change
in the various aspects of institutions in SSA countries during this period (see tables 4-6
and 4-7). According to the data, in 1996, Sierra Leone had the worst level of control of
corruption amongst the sample of countries, compared to Sudan which witnessed a
significant improvement. In the same year, rule of law, government effectiveness,
regulatory quality, voice and accountability and political stability was relatively poor in
Sudan. Out of the six aspects of governance, I observed that in 2007, Zimbabwe
witnessed a significant deterioration in rule of law, corruption and regulatory quality.
-2.00
-1.50
-1.00
-0.50
0.00
0.50
1.00
An
go
la
Ben
in
Bo
tsw
ana
Bu
rkin
a F
aso
Bu
run
di
Cam
eroo
n
Cap
e V
erd
e
Cen
tral
Afr
ican
…
Ch
ad
Co
ng
o,
Rep
.
Cô
te d
'Iv
oir
e
Eth
iopia
Gab
on
Gam
bia
, T
he
Gh
ana
Ken
ya
Les
oth
o
Mad
agas
car
Mal
awi
Mal
i
Mau
rita
nia
Mau
riti
us
Moza
mb
ique
Nig
er
Nig
eria
Rw
and
a
Sen
egal
Sey
chel
les
Sie
rra
Leo
ne
Sou
th A
fric
a
Sud
an
Sw
azil
and
Tan
zan
ia
Tog
o
Ug
and
a
Zam
bia
Zim
bab
we
1996 2007
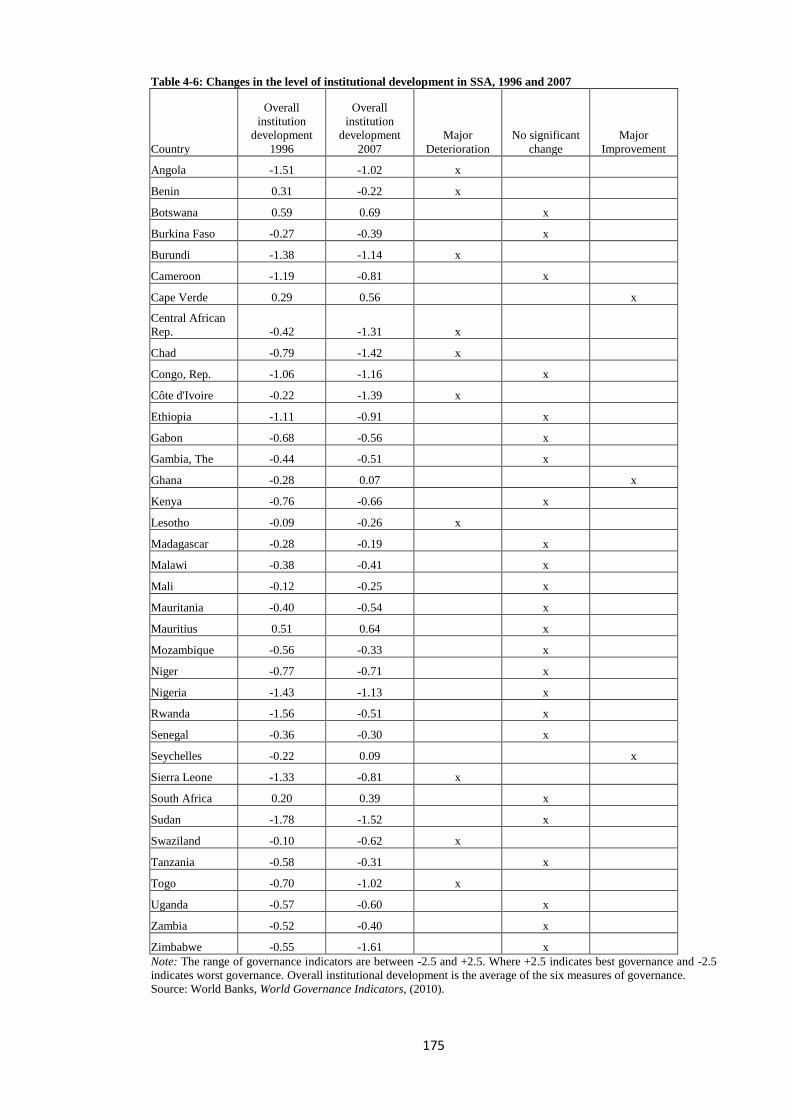
175
Table 4-6: Changes in the level of institutional development in SSA, 1996 and 2007
Country
Overall
institution
development
1996
Overall
institution
development
2007
Major
Deterioration
No significant
change
Major
Improvement
Angola -1.51 -1.02 x
Benin 0.31 -0.22 x
Botswana 0.59 0.69 x
Burkina Faso -0.27 -0.39 x
Burundi -1.38 -1.14 x
Cameroon -1.19 -0.81 x
Cape Verde 0.29 0.56 x
Central African
Rep. -0.42 -1.31 x
Chad -0.79 -1.42 x
Congo, Rep. -1.06 -1.16 x
Côte d'Ivoire -0.22 -1.39 x
Ethiopia -1.11 -0.91 x
Gabon -0.68 -0.56 x
Gambia, The -0.44 -0.51 x
Ghana -0.28 0.07 x
Kenya -0.76 -0.66 x
Lesotho -0.09 -0.26 x
Madagascar -0.28 -0.19 x
Malawi -0.38 -0.41 x
Mali -0.12 -0.25 x
Mauritania -0.40 -0.54 x
Mauritius 0.51 0.64 x
Mozambique -0.56 -0.33 x
Niger -0.77 -0.71 x
Nigeria -1.43 -1.13 x
Rwanda -1.56 -0.51 x
Senegal -0.36 -0.30 x
Seychelles -0.22 0.09 x
Sierra Leone -1.33 -0.81 x
South Africa 0.20 0.39 x
Sudan -1.78 -1.52 x
Swaziland -0.10 -0.62 x
Tanzania -0.58 -0.31 x
Togo -0.70 -1.02 x
Uganda -0.57 -0.60 x
Zambia -0.52 -0.40 x
Zimbabwe -0.55 -1.61 x
Note: The range of governance indicators are between -2.5 and +2.5. Where +2.5 indicates best governance and -2.5
indicates worst governance. Overall institutional development is the average of the six measures of governance.
Source: World Banks, World Governance Indicators, (2010).
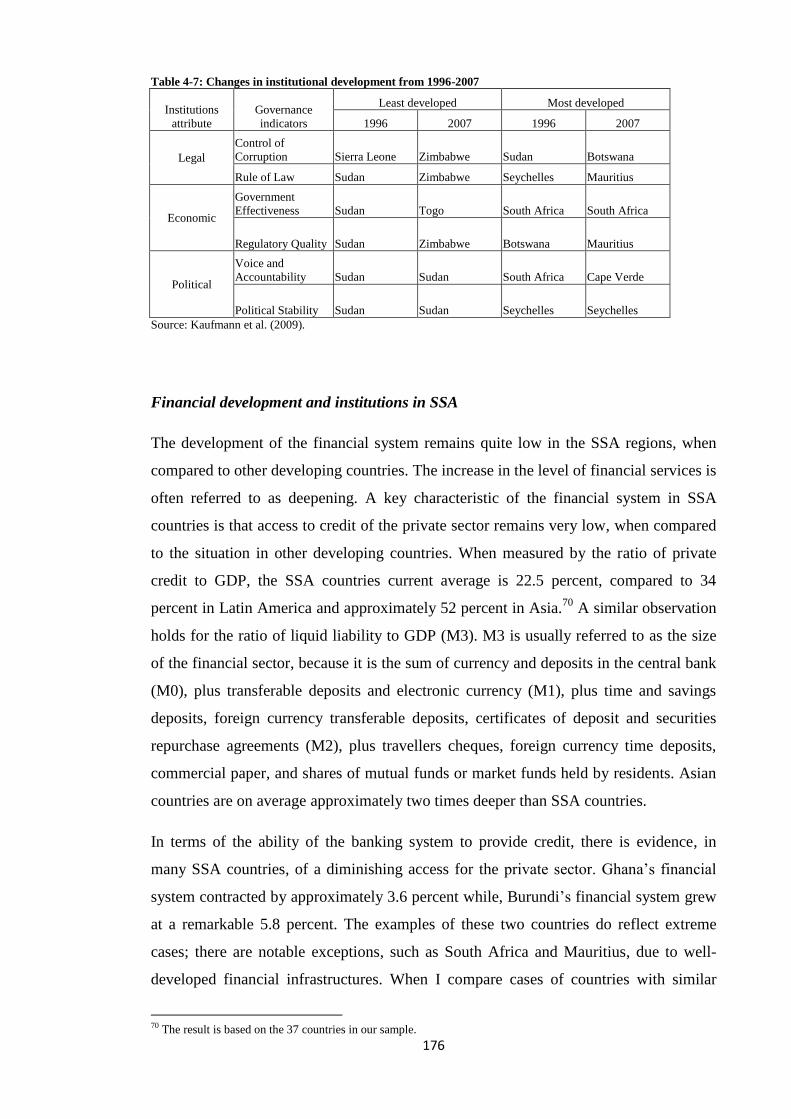
176
Table 4-7: Changes in institutional development from 1996-2007
Institutions
attribute
Governance
indicators
Least developed Most developed
1996 2007 1996 2007
Legal
Control of
Corruption Sierra Leone Zimbabwe Sudan Botswana
Rule of Law Sudan Zimbabwe Seychelles Mauritius
Economic
Government
Effectiveness Sudan Togo South Africa South Africa
Regulatory Quality Sudan Zimbabwe Botswana Mauritius
Political
Voice and
Accountability Sudan Sudan South Africa Cape Verde
Political Stability Sudan Sudan Seychelles Seychelles
Source: Kaufmann et al. (2009).
Financial development and institutions in SSA
The development of the financial system remains quite low in the SSA regions, when
compared to other developing countries. The increase in the level of financial services is
often referred to as deepening. A key characteristic of the financial system in SSA
countries is that access to credit of the private sector remains very low, when compared
to the situation in other developing countries. When measured by the ratio of private
credit to GDP, the SSA countries current average is 22.5 percent, compared to 34
percent in Latin America and approximately 52 percent in Asia.70
A similar observation
holds for the ratio of liquid liability to GDP (M3). M3 is usually referred to as the size
of the financial sector, because it is the sum of currency and deposits in the central bank
(M0), plus transferable deposits and electronic currency (M1), plus time and savings
deposits, foreign currency transferable deposits, certificates of deposit and securities
repurchase agreements (M2), plus travellers cheques, foreign currency time deposits,
commercial paper, and shares of mutual funds or market funds held by residents. Asian
countries are on average approximately two times deeper than SSA countries.
In terms of the ability of the banking system to provide credit, there is evidence, in
many SSA countries, of a diminishing access for the private sector. Ghana’s financial
system contracted by approximately 3.6 percent while, Burundi’s financial system grew
at a remarkable 5.8 percent. The examples of these two countries do reflect extreme
cases; there are notable exceptions, such as South Africa and Mauritius, due to well-
developed financial infrastructures. When I compare cases of countries with similar
70 The result is based on the 37 countries in our sample.

177
levels of development (i.e. either belonging to low income, middle income or upper
middle income); I observe that the level of financial development differs across the
board. A possible explanation for the variation of the level of financial development
across countries may be because of the outcomes of policies which are specific to these
countries. Many authors attribute the low levels of financial intermediation in SSA
countries to institutional issues and poor financial reform policies. Moreover, according
to the World Bank (2003), the effectiveness of these policies depends on the
effectiveness of the institutions which implement them. Therefore, it is noteworthy to
examine the relationship between financial development and institutional development
in the SSA region.
Figures 4-6 and 4-7 illustrate the relationship between institutional development and the
level of financial development in SSA countries in the sample. In this study, the level of
institutional development is measured by the International Country Risk Guide, ICRG-
QOG index. It is measured on a scale of 0-1, with 1 implying a higher quality of
government. An alternative measure, the average of all the governance indicators,
provided by the World Bank Governance Indicator, (Kaufmann et al, 2008) and referred
to as the KKM index is also used. This index is measured from -2.5 to 2.5, with 2.5
representing good governance.71
Figure 4-6 suggests a positive relationship between institutional development and
financial development (private credit) in 1996. This implies that good quality
institutions lead to improvements in financial development. For example, moving from
Sudan, a country with a low level of institutional development, to Botswana, I note that
there has been an increase in financial development from 2 to 11 percent. Figure 4-7
also indicates that there is a positive relationship between institutions and financial
growth in 2007. The improvement in the level of institutions increased private credit to
about 40 percent in 2007. The positive relationship provides support to the literature,
however there is a need for further empirical analysis to be able to provide policy
implications.
71 Appendix IV.II provides full details on data documentation, definition and source.
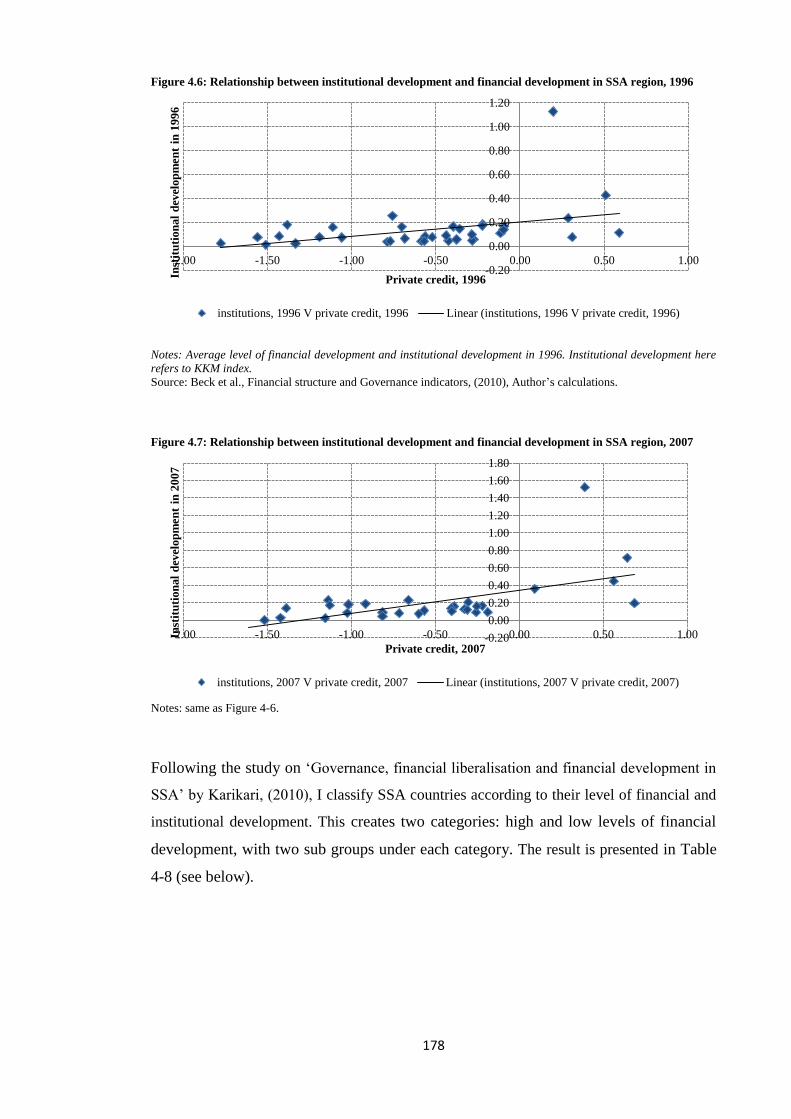
178
Figure 4.6: Relationship between institutional development and financial development in SSA region, 1996
Notes: Average level of financial development and institutional development in 1996. Institutional development here
refers to KKM index.
Source: Beck et al., Financial structure and Governance indicators, (2010), Author’s calculations.
Figure 4.7: Relationship between institutional development and financial development in SSA region, 2007
Notes: same as Figure 4-6.
Following the study on ‘Governance, financial liberalisation and financial development in
SSA’ by Karikari, (2010), I classify SSA countries according to their level of financial and
institutional development. This creates two categories: high and low levels of financial
development, with two sub groups under each category. The result is presented in Table
4-8 (see below).
-0.20
0.00
0.20
0.40
0.60
0.80
1.00
1.20
-2.00 -1.50 -1.00 -0.50 0.00 0.50 1.00
Inst
itu
tion
al
dev
elop
men
t in
19
96
Private credit, 1996
institutions, 1996 V private credit, 1996 Linear (institutions, 1996 V private credit, 1996)
-0.20
0.00
0.20
0.40
0.60
0.80
1.00
1.20
1.40
1.60
1.80
-2.00 -1.50 -1.00 -0.50 0.00 0.50 1.00Inst
itu
tion
al
dev
elop
men
t in
20
07
Private credit, 2007
institutions, 2007 V private credit, 2007 Linear (institutions, 2007 V private credit, 2007)

179
Table 4-8: Level of financial and institutional development: Country classification
Country Indicators
Low level of financial development FD: Mean 0.22 ID: Mean -0.55
GROUP 1
Low High
Benin Mozambique
Burkina Faso Niger
Ghana Senegal
Lesotho Tanzania
Madagascar Togo
Malawi Zambia
Mali
GROUP 2
Low Low
Angola Mauritania
Burundi Nigeria
Cameroon Rwanda
Central African Republic Sierra Leone
Chad Sudan
Congo Swaziland
Cote d'Ivoire Uganda
Gabon
High level of financial development
GROUP 1
High High
Cape Verde
Kenya
Mauritius
Seychelles
South Africa
GROUP 2
High Low Ethiopia
Gambia
No change in level of financial development
Botswana No Change High Source: Author’s calculations using data from World Banks’ World Development Indicators, (2010).
The groups are created depending on whether the countries were above or below the
average level of overall financial development (average of liquid liabilities and private
credit divided by 2) in the sample period. I find only 7 countries have a high level of
financial development compared to 28 countries low levels. Furthermore, Botswana has
an average level of financial development. Despite having an average level of financial
development, I find that there is a high level of institutional development. All the
countries with low levels of financial development also exhibit low levels of
institutional development. While the table is instructive, it is better to conduct a more
rigorous analysis, in order to establish any possible relationship.
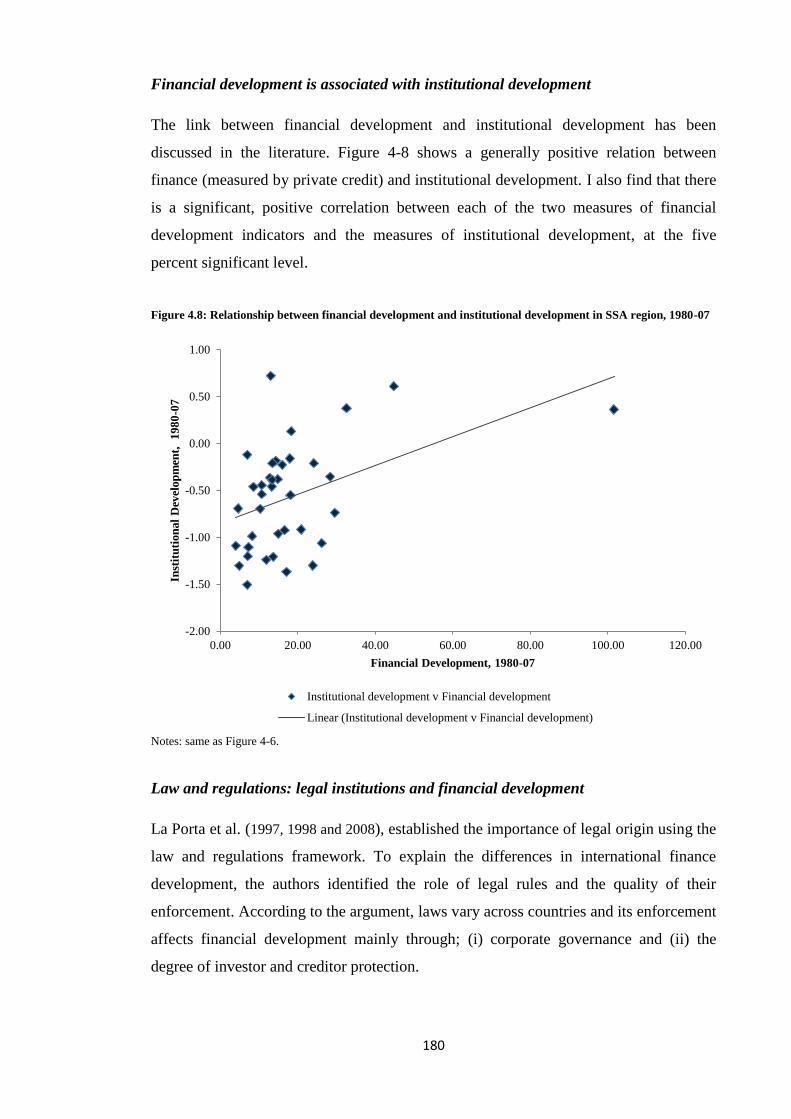
180
Financial development is associated with institutional development
The link between financial development and institutional development has been
discussed in the literature. Figure 4-8 shows a generally positive relation between
finance (measured by private credit) and institutional development. I also find that there
is a significant, positive correlation between each of the two measures of financial
development indicators and the measures of institutional development, at the five
percent significant level.
Figure 4.8: Relationship between financial development and institutional development in SSA region, 1980-07
Notes: same as Figure 4-6.
Law and regulations: legal institutions and financial development
La Porta et al. (1997, 1998 and 2008), established the importance of legal origin using the
law and regulations framework. To explain the differences in international finance
development, the authors identified the role of legal rules and the quality of their
enforcement. According to the argument, laws vary across countries and its enforcement
affects financial development mainly through; (i) corporate governance and (ii) the
degree of investor and creditor protection.
-2.00
-1.50
-1.00
-0.50
0.00
0.50
1.00
0.00 20.00 40.00 60.00 80.00 100.00 120.00
Inst
itu
tion
al
Dev
elop
men
t,
19
80
-07
Financial Development, 1980-07
Institutional development v Financial development
Linear (Institutional development v Financial development)
181
In their analysis, the authors classified legal systems into four different origins: British,
French, German and Scandinavian, and emphasised the role of enforcing property
rights. Property rights are the rights of a firm or an individual to assets, to the income
gained from the use of these assets and to any contractual obligations due to the firm or
individual (North, 1990). According to La Porta et al, (1997, 1998), legal traditions
differ in terms of their treatments of creditors and shareholders, and the efficiency of
contract enforcement, which are both essential for financial development. Thus, the
argument goes that in countries where legal systems enforce private property rights and
protect the legal rights of investors, savers would be more willing to finance long-term
projects, whereas, countries that do not support the enforcement of property rights
witness poor financial development. In other words, the degree of enforcement
influences the degree of expropriation, and hence, the confidence with which people
purchase securities and participate in financial markets. The authors note that British
common law tends to provide external investors with stronger protections for property
and contractual rights, while countries with French legal origin tend to give investors
the worst; countries of German and Scandinavian legal origin are somewhere in
between. Consequently, countries that adopt its legal traditions from British common
laws often tend to have a higher level of financial development, when compared to other
legal origins.
Beck et al. (2002) provide support for the claim that financial development is higher in
countries with British legal origin, by examining data for two different samples of 70
former colonies and 115 former colonies and non-colonies. In their small sample of 70
colonies, they include 45 French and 25 British legal origin countries. Using graphical
representations, they clearly show that British legal origin countries tend to have a
higher level of financial development, compared to those with French legal origins.
They further buttress their results by examining the correlation between French legal
origin colonies and financial development indicators, and performing a regression of
financial development indicators on a French legal origin dummy. Their results show
that countries with French legal origin tend to have lower financial development, when
compared to those with British legal origin. Djankov et al. (2007) also examined the
determinants of private credit in 129 countries during the period between 1978 and
2003. Their results show that the level of private credit is higher in countries practicing
common law, than the civil law practising countries.

182
Following Beck et al. (2002) and La Porta et al. (1998), I also find support for the view
that legal origin is important for financial development. Figure 4-9 shows that countries
with British legal origin have higher levels of financial development, than those of
French legal origin. The sample consists of 25 French and 15 British legal origin
countries.
Figure 4.9: Financial development across legal origin in SSA countries, 1980-2007
Note: The graph shows the mean of private credit and liquid liabilities for countries grouped as either having a British
legal origin or French legal origin.
Source: Author’s calculation, World Bank, World Development Indicators, (2010).
The literature provides support for the importance of legal traditions in explaining cross-
country differences in financial development. Previous studies such as Demirgüc-Kunt
and Maksimovic, (2002) and La Porta et al. (1997 and 1998) find that weak legal
systems and poor institutional infrastructure impede market development, especially in
developing countries. In fact, the literature point out that financial development has not
achieved its main function of promoting economic performance, because of lack of
well-developed institutions. In the SSA region for example, Ajakaiye et al. (2007) found
that legal systems are weak and, thus, threaten property rights by making financial
development difficult. It is also observed that due to the high degree of asymmetric
information that arise in many African financial systems, it is important to have a legal
system that will ensure that contracts and property rights are clear, and in the case of
default, that when judgement is passed, it is quickly enforced. This is because for a
market to function well, firms must be able to rely on the enforceability of contracts.
Hence, it is important to establish legal and regulatory structures to promote the
development of a healthy and well-functioning financial system, because an efficient
legal system plays an important role in the financial sector and the development process.

183
Creane et al. (2003) notes that the institutional environment, which financial systems
operate in many developing countries, is an important determinant of the quality of
services provided by these financial institutions. However, they suggest that to achieve a
well-functioning financial system, there is a need to develop a sound institutional
environment, because poor institutions allow and encourage unproductive activities,
slowing the economy and hindering financial development. On this backdrop, the law
and finance literature tries to judge which institutional quality indicator is more
important for financial development. Accordingly, the literature points out that if one
can get a rule of law that protects property rights, investors would be willing to invest,
and in turn, promote financial development. However, the capacity to effectively
enforce contracts and deal with the changing financial situations impedes financial
development, especially in developing countries. Consequently, Ncube (2007) suggests
the need for legal systems to be adaptable and to evolve to meet the fast-changing
innovation in the financial world, in order to handle contracts based on complex
financial instruments. Although the above literature suggests that weak institutions, in
particular, legal traditions, hinder financial development, the question arises as to what
other reasons account for the cross-country differences in financial development.
In an alternative view, the endowment theory established that a country’s geographical
location and colonial history may indirectly affect financial development through its
effect on institutional quality (Beck et al., 2003 and Herger et al., 2007). According to
this theory, geography plays an important role in shaping the type of institutions
bestowed upon a colony (for example, Acemoglu et al., 2001). The authors observed
that the geographical location of a country (e.g. temperate, tropic and sub-tropic) tends
to shape the development of the type of institutions available. According to the authors,
the weak institutions observed in countries such as the ones in our sample may actually
be as a result of their geographical locations. For example, it is argued that countries
located in tropical and subtropical areas tend to lack supportive institutions because of
the high rate of diseases and the lack of support for agriculture. Thus, colonisers in this
area are unwilling to develop an institutional environment that would promote long-run
growth or financial development, because the area is not hospitable to European settlers.
However, in areas that are more conducive, colonial powers develop institutions that
will encourage economic prosperity. In essence, institutions found in tropic and
subtropical regions such as those countries in our sample, hinder financial development.

184
Accordingly, the geographical endowment of a country determined whether European
settlers formed a colony or an extractive state.
As Detragiache et al. (2005) argue that colonial history affects financial development
via its impact on institutions. It is suggested that where European settlers are after
extractive natural resources, they tend to form institutions that suit that purpose.
Furthermore, Acemoglu et al. (2001) note that institutions in extractive countries tend to
survive post-independence, due to the fact the type of institutional environment tends to
favour the settlers because the geographic conditions discouraged them from settling in
these countries. Hence, it is suggested that extractive colonisation tends to hinder
financial development. The empirical work in this area shows a negative relationship
between settlers’ mortality and financial development (Beck et al., 2002). Therefore, it
is important to examine the effects of different types of institutions on financial
development in SSA region.
Political institutions and financial development
Not only do property rights and the legal system shape the financial system and
constitute the main cause of global differences in financial development, the literature
points out that the differences in political institutions is also important. According to
this view, the type of political economy (democratic or autocratic) is important for
financial development. It is suggested that financial development is an outcome of
specific laws and regulations and it depends on how a government enforces these laws.
Here, countries that are democratic in nature tend to have better financial development,
compared to autocratic regimes. Clague et al. (1996) argue that democracy enhances
fundamental civil liberties and promotes property rights protection. In addition, a
democratic economy tends to curb the influence of specific interest groups through
various checks and balances which are intended to reduce corruption (Rajan and
Zingales, 2003). As a result, savings and investments become more attractive and this
often leads to the demand for liquidity and other financial services, which in turn,
promotes financial development (KariKari, 2010). On the contrary, Rajan and Zingales,
(2003) using the interest group theory, argue that where a country’s political decisions
are being controlled by a small number of elites, the development of the financial sector
may be obstructed by denying finance access to potential competitors. This is because
the government in this kind of environment tends to deliberately omit the creation of

185
institutions that would nurture successful financial development (Rajan and Zingales,
2003).
4.4.1 The role of institutional quality in financial development and economic
growth
The Heritage Foundation Index of Economic Freedom (2010) describes economic
freedom as ‘the fundamental right of every human to control his or her own labour and
property’. In an economically free society, individuals are free to work, produce,
consume, and invest in any way they please, with that freedom both protected by the
state and unconstrained by the state. In economically free societies, ‘governments allow
labour, capital and goods to move freely, and refrain from coercion or constraint of
liberty beyond the extent necessary to protect and maintain liberty itself.’ This index
classifies the majority of Sub-Saharan African countries as either ‘mostly repressed’ or
‘repressed’.
The importance of institutions in financial development and economic growth has been
widely discussed in the literature. The idea that institutions are important for growth
dates back to Adam Smith (1776) in his prominent book ‘The Wealth of Nations.’
Adam Smith stressed the importance of property rights, monetary exchange systems and
stable legal systems for economic growth. However, it was not until historical
economists, North and Thomas (1973), provided a detailed critical account of the
evolution of property rights, that its role became prominent. North (1990) defines
property rights as ‘the rights of a firm or individual to assets, to the income gained from
the use of these assets and to any contractual obligations due to the firm or individual.’
De Soto (1989 and 2000) explains that property rights are important for economic
growth. He identified the availability of credit to the private sector (financial
development) as a channel through which property rights affect economic growth, thus
pointing out the role of institutions in the finance-growth literature. According to De
Soto, poorly defined property rights weakens the incentives for ‘owners’ to make long-
term capital investment, which may also limit the ability of ‘owners’ to use their
property as collateral to secure the loans needed to finance capital investment. Thus,
where credit is inaccessible, future investment and economic growth would decline.
From the aforementioned, I note that although political instability can deter economic
growth, Campos et al. (2008) note that both financial development and political
instability may have a positive impact on growth in the long-run.

186
In theory, financial systems through the provision of information and legal and
regulatory frameworks enhance the allocation of capital and, in turn, promote economic
development. For instance, Diamond and Verrecchia (1982) and Jensen and Murphy
(1990), suggest that a well-developed financial system may enhance corporate control
by mitigating the principal-agent problem through aligning the interests of managers
and owners. In addition, the disclosure of information that would not necessarily be
provided, but required by regulations to disclose, would be evaluated before being
conveyed to investors. From this point of view, good corporate governance tends to
reduce the conflict of interest between managers and owners (shareholders). In this
context, institutional environment is important for finance-growth relationship, because
they set up the legal system and regulatory environment, which have an impact on the
quality of information received by shareholders.
Jones (2002) recognised the importance of institutional environment in explaining
economic growth by arguing that politics is important for economic growth because
factors determining the profitability of investment, which positively influence economic
growth, are mostly related to political institutions. This view is supported by Rodrik et
al. (2002), who used Kauffman et al’s (2002) index of ‘rule of law’ to proxy institutions,
and found significant evidence that institutions are important in determining the income
levels of countries.
The literature studying the determinants of financial development and finance-growth
nexus, especially in developing countries, has provided substantial evidence to show
that improvements in institutional quality are important for financial development.72
The role of institutions in the finance-growth nexus can be schematically described as
follows:
Institutional development financial development economic growth
It is argued that growth rates in countries with good institutions and financial policies
perform better than those with restrictive policies and underdeveloped institutions. For
instance, the poor economic performance in Ghana during the 1960s and 1970s is linked
to political instability, high levels of corruption and a general lack of direction
(Aryeetey and Tarp, 2000). Similarly, problems in the Niger-Delta area of Nigeria have
been linked to persistence violence, government oppression, bad governance and
corruption on the part of the government, both at the state and local government levels.
72 See, for example; Huang, (2009 and 2010), Girma and Shortland, (2008), Gries and Meierrieks, (2010) and
Demetriades and Rousseau, (2010).
187
As a consequence of the underlining problems facing the Niger-Delta, Nigeria remains
mainly underdeveloped. Although African countries differ in terms of size, the
problems confronting them are quite similar. Barro and Lee (1993) observe that
economic instability is often the result of political instability, and vice versa. Thus, the
argument implies that the problems facing many African countries can be linked to their
political environment. In this context, bad leadership, the main determining factor of
political instability, has resulted in stagnant economic performance in many African
countries. More recently, Roe and Siegel (2011) found evidence that political instability
hinders financial development and widens income inequality.
Further, the existing institutions in many African countries are weakened by political
instability, as a result of bad governance. In this context, political instability hinders
financial development, and as a result, impedes growth. To explain the role of bad
institutions on financial development and long-run growth, the political economic
literature focuses on the role of incumbents. According to Rajan and Zingales (2003),
interest groups tend to oppose financial development policies because they believe that
their benefits would be eroded. This is because financial development fosters
competition by enabling potential entrants to gain free entry into the sector. The
implication of this is that in democratic economies, where openness is central, financial
development policies are important because the incumbents may need new areas of
financing.
On the contrary, in an autocratic economy, where incumbents have access to
government powers, financial development is restrictive in order to prevent new
entrants into the market. Consequently, promoting financial reforms is crucial for
financial development. The idea is that financial liberalisation can help improve
economic prospects through the establishment of the necessary institutional framework
(Beck et al., 2008). Not only is a well-developed institutional framework important, but
Ong’ayo (2008) suggests that to strengthen Africa’s institutions, ‘there is a need to
promote democracy and accountability with an input from local perspectives’.
Accordingly, the general observation in the institutional development literature suggests
that the effectiveness of financial reforms depends on the effectiveness of the
institutions which implement them (World Bank, 2003).
The role of institutions on financial development in SSA countries should be
instrumental in explaining the channels of linkages between finance and growth. For
instance, Collier (2004) notes the importance of institutional environment in promoting

188
financial development and growth. In other words, the role of institutions is to provide
incentive structure and shape the direction of the economic change towards growth,
stagnation or decline (North, 1991: 97). Recent empirical findings identified political
institutions as the most important factor that determines financial development (North
and Shirley, 2008).
Although there is a relative consensus on the positive role of finance on growth, and that
institutional quality is a key channel to the finance-growth nexus, in order to achieve
sustainable growth, the establishment of well-developed institutions should be a policy
priority for governments in developing countries and, in particular, Sub-Saharan Africa.
Indeed, the literature points out those countries that inherited their legal traditions
during the colonial era have enjoyed improved economic growth. In particular,
countries with the common law legal traditions tend to have higher economic growth,
than countries with civil laws, because they better protect property and, in turn,
investors. However, Roe and Siegel (2011) observe that some African countries with
common law legal traditions did not perform as well as those with civil law traditions.
Therefore, providing support to the findings that legal origin alone does not explain the
cross-country variation in financial development.
4.4.2 Empirical evidence on institutions, financial development and growth
Although there is overwhelming empirical evidence in the literature on the effect of
institutional environment on financial development and economic growth, there is no
general consensus. For example, Arestis and Demetriades (1996 and 1997), using time
series analysis, examined the impact of institutional environment on the finance-growth
nexus in twelve developing and developed countries during the period 1949 to 1992.
They note that countries with similar financial systems and policies may differ in
relation to the effectiveness of their government. According to the authors, it is possible
that the same financial policies may work differently in different countries, depending
on how the policies are implemented and the effectiveness of the institutions. Their
results confirm their claim that institutions and policy differences are important when
considering the effect of finance on growth. The results corroborate the World Bank’s
(1993) statement that ‘economic policies are country-specific and the effectiveness
depends on the effectiveness of the institutions which implement them’. Bordo and
Rousseau (2006) provide support for this claim by investigating the role of institutions
and how they affect the finance-growth nexus, using historical cross-section data for 17
189
developed countries for the period 1880-1997. Their findings show that although both
political and legal factors are important for financial development, its growth enhancing
role remains unexplained by other institutional fundamentals. Thus, Badjun (2009)
reached the conclusion that every country is specific as there are different views on the
role of financial development on economic growth.
Levine (1998), in one of the most influential empirical law-finance literatures, analyzed
the relationship and link between a country’s legal system and banking development,
and their long-run impact on economic growth, capital stock and productivity growth.
The author found a strong relationship between banking development and the legal
system. Specifically, he found that countries that emphasise the ‘creditor’s right’ have a
more developed banking system. He also found that countries with legal systems that
enforce laws and contracts have more developed banking systems than countries that do
not. Thus, the author argued that legal framework is crucial in the establishment of a
developed financial system. This claim has been supported by the work of work of La
Porta et al. (1998) and Pistor et al. (2000), who highlight that not only the quality of
legal frameworks, but also the effectiveness of legal institutions, are crucial for financial
development. In a similar way, Beck et al. (2003) ascertained the importance of strong
legal frameworks and conclude that this leads to a higher level of financial
development. Acemoglu and Johnson (2005) examined the role of institutions and in
particular, property rights institutions. Their findings suggest that property rights have a
positive effect on long-run economic growth, investment and financial development.
In a recent study, Nabi and Suliman (2008) note that legal framework is particularly
important for banking development, in that when there is a default on a loan, banks
often have the right to seize a collateral. However, the implementation of these rights
often depends on the costs of the judicial procedure and the rule of law. Examining the
causal link between institutions and banking and economic growth, the authors use data
consisting of 22 MENA countries over the period 1984-2004. Their results are two-fold:
first, they find bi-directional causality that runs from banking development to economic
growth, with the relationship being more pronounced in countries with a more
developed institutional environment, and second, causality runs from economic growth
to banking, suggesting that a more developed country has a more developed banking
system. The authors concluded that in many developing countries, most banks are
190
public and are constrained to finance the government and to rationalise private firms
which may undermine economic growth.
Campos et al. (2008) examined the role of financial development and political
instability on economic growth in Argentina during the period 1896 to 2000 using a
power-ARCH (PARCH) framework. In order to understand the effect of political
instability, the authors further split this factor into two: formal/unanticipated and
informal/anticipated political instability. They found that both formal and informal
political instability have an indirect impact on economic growth, and the effect of
informal political instability is more pronounced in the short-run than in the long-run
4.5 What drives financial development in Sub-Saharan Africa?
This section presents the methodology, data and multivariate analysis. Empirical
findings on the institutional and macroeconomic determinants of financial development
in SSA are also presented. The main objective is to determine the impact of a better
quality institution on financial development. In addition, I examine whether the long-
run relationship between finance and growth is led by institutional conditions. Using a
sample of 37 SSA countries, I seek to find answers to the following questions:
1. Does a good quality institution lead to financial development in the SSA region?
In particular, are corruption, law and order and bureaucratic quality important
for financial development?
2. Does institution affect the finance-growth relationship in SSA? Particularly,
what role does institution play in the finance-growth nexus.
In the previous chapter, I used the ICRG-quality of governance (ICRG-QOG) indicator
to analyse the effect of financial liberalisation on financial development in emerging
and frontier markets. The ICRG-QOG is an indicator of the quality of governance and it
is a composite index, which is the mean of three sub-indices (corruption, law and order
and bureaucratic quality) measured on a scale of 0-1, where the higher values indicate a
higher quality of government. The use of this measure makes it difficult to interpret
which aspect of institutional quality was responsible for financial development after
financial liberalisation in the SSA region. Consequently, I decompose the ICRG-QOG
indicator and include corruption, law and order and bureaucracy quality in the empirical
analysis in order to know which aspect of governance is important for financial
development in the SSA region.

191
4.5.1 Econometric methodology, data and model specification
Since the purpose of this chapter is to analyse the role of institutional environment in
determining financial development in the SSA region and given that the results obtained
using various estimation techniques, financial development indicators, data frequency
and regions studies have been inconclusive, this study hence follows theoretical
literature which predicts financial development to be a function of institutions and other
factors, which can be written as:
FD = f (institutions, level of economic development and control variables).
This can be empirically written as:
itititit CVINSTFD 10 (4.1)
where FD is the dependent variable in our regression is a financial development
indicator. I employ two main indicators that are used in the literature and are of
particular importance to SSA countries, to take into account banking development: log
of private credit expressed as a percentage of GDP and log of liquid liabilities expressed
as a percentage of GDP.
INST, the independent variable is an indicator of quality of governance. In this study, I
use ICRG quality of government (ICRG-QOG) to proxy government quality.73
The data
is obtained from The QoG Social Policy Dataset (Teorell et al., 2010), which collects
data from several freely available data sources into a unique dataset. In addition, I
include the different dimensions of governance in our regression to understand what
aspect of governance is important for financial development in the region. Law and
Azman-Saini (2008) argue that including the various dimensions of governance into the
regression by themselves might lead to the problem of omitted variable bias, hence, I
also examine whether the various aspects of governance simultaneously lead to the
development of the banking sector. As a robustness check, I use the KKM index from
Kaufmann et al. (2009) to measure institutional quality.
CV is the conditioning set which captures other macroeconomic determinants of
financial development. They include; level of economic development (GDPC) and
73 The ICRG-QOG is the mean value of the ICRG variables ‘Corruption’, ‘Law and Order’ and ‘Bureaucracy
Quality’, scaled 0-1. Higher values indicate a higher quality of government. The KKM index consists of the average
of all measures of government quality: voice and accountability, political stability, government effectiveness,
regulatory quality, rule of law, and control of corruption.

192
economic stability (INF).74
This is the list of control variables commonly used in the
literature (Beck et al., 2000 and Boyd et al., 2000). It also includes regional and year
dummies.
4.5.2 Data and preliminary testing
To explore the relationship between institutional environment and financial
development in the SSA region, I use panel datasets covering the periods 1980 to 2007
and 1996 to 2007 (with some gaps)75
, and 37 countries.76
The main specification uses
annual data; however, I also test the robustness of the results using four year averages.
To estimate whether institutional environment leads to financial development, I use a
similar model to Law, and Azman-Saini, (2008):
0 1 2ln ln lnit it it i t itFD INST RGDPC u v
(4.2)
where itFD is the level of financial development in country i over years t, and INST is
institutional quality. RGDPC is real GDP per capita. The subscripts i and t index
countries and time, respectively. In addition, the specification also contains an
unobserved country dummy iu and year dummy variable tv . The motive behind
including country fixed effects is to control for time invariant country-specific fixed
factors, such as legal origin. The year dummy is used to control for time varying
common shocks. it is the error term.
Other variables that may influence the development of the financial sector are included
in our regression. In particular, I examine economic stability, and note that due to
uncertainty, changes in monetary policies might have a negative or positive effect on
financial development. Thus, the basic financial development equation is extended as
follows:
0 1 2 3ln ln ln lnit it it it i t itFD INST RGDPc CPI u v
(4.3)
74 The rationale for including these control variables is as follows. We control for per capita GDP firstly, to account
for the huge cross-country differences in the level of economic development. Secondly, richer countries enjoy better
quality institutions, as such, it is important that the quality of institutions variable does not proxy for the level of
economic development (Feldman, 2005). We also control for inflation rate, to account for the effect of change in
monetary policies on financial development. High inflation is presumed to affect financial development adversely. A
change in monetary policy can lead to a shock in the system, which can then trigger financial instability and
compromise the effectiveness of such policies. As such, the development of a stable, well functioning financial
system capable of withstanding financial pressures cannot be overemphasised. 75 The sample period is from 1996, then 1998, 2000, 2002 and then annually. 76 Due to data limitations, not all specifications cover exactly 37 countries; hence in most cases the panel is
unbalanced. The list of countries in the sample is presented in Appendix IV.

193
where CPI is inflation.
The relationship between finance and institutional development might be nonlinear.
Although institutional development has a positive relationship with financial
development, the extent to which it affects financial development might vary with
respect to the level of development in a country. As such, the predicted sign is
ambiguous in the lower levels of development, and as the level of development
improves, the sign is positive. Thus, to examine the nonlinearity between finance and
growth, the squared term of institutional quality variable is added and included into
equation 3. The regression can be re-written as:
2
0 1 2 3 4ln ln ln ln lnit it it it it i t itFD INST INST RGDPc CPI u v
(4.4)
The measures of financial development
To measure the level of financial development in the SSA, I use the log of private credit
to GDP ratio (PC) and the log of liquid liabilities to GDP ratio (M3). Private credit is a
measure of the assessment of credit availability in a country relative to the size of its
economy. It captures the activity of the financial intermediary through channelling
savings to investors, and isolates credit issued to the private sector, (Levine et al., 2000).
A higher level of PC indicates higher level of financial services for the private sector and
a better access to credit and vice versa. It also indicates that a country is financially
developed or underdeveloped. M3 captures financial ‘depth’ as it does not distinguish
between the financial sectors. Hence, it is referred to as the size of the financial sector. For
this analysis, PC is our preferred measure of financial development as it is widely used in
the literature as a proxy. To test the robustness of our results, I use M3 to proxy financial
development.
The basic summary statistics shows that the level of financial development within Sub-
Saharan Africa is very poor. Private credit over the sample period (1980-2007) varies
between 5.62 in Ghana (1983) to 162.46 in South Africa (2007), with an average of 18.28
and a standard deviation of 18.66.

194
Table 4-9: Basic statistics (Annual data: 1980-2007)
a. Full sample
Variable Mean Std. Dev. Min Max
Financial development indicators
Private credit 18.28 18.66 1.54 162.46
Liquid liabilities 31.90 19.87 0 143.02
Institutional development indicators
ICRG_QOG 0.43 0.14 0.10 0.83
KKM -0.56 0.59 -1.78 0.84
Components of institutions (KKM)
CCE -0.58 0.57 -1.76 1.07
GEE -0.62 0.57 -1.74 0.95
PSE -0.50 0.92 -2.55 1.14
RLE -0.63 0.63 -1.72 0.94
RQE -0.55 0.56 -2.37 0.84
VAE -0.51 0.71 -1.95 1.01
Other institutional development indicators
P_POLITY2 -1.48 6.10 -10 10
AVGPRCL 4.79 1.78 0 7
Control variables
Real PCAP 2986.17 3378.47 578.30 20006.49
CPIIMF 21.54 159.41 -20.81 4145.22
Instruments
FRENCHL 0.59 0.49 0 1
AL_ETHNIC 0.75 0.43 0 1
Notes: Private credit is the total credit available to the private sector as a ratio of GDP. Liquid liabilities are used to
measure the overall size of financial intermediaries, hence, the ability to provide financial services. It is the ratio of
liquid liabilities to GDP. ICRG_QOG is our measure of institutional quality and it is the mean of law and order,
corruption and bureaucracy. KKM is the average of the six components of good governance and is also a measure of
institutional quality. CCE is control of corruption, GEE is government effectiveness, PSE is political stability and no
violence, RLE measures the rule of law, RQE measures regulatory quality and VAE is voice and accountability.
P_POLITY2 is a measure of democracy and AVGPRCL indicates the average of property rights and civil liberties.
The level of development is indicated by real GDP per capita, economic stability is measured by annual rate of
inflation (CPI obtained from IMF). French legal origin is a dummy which takes the value of 1 for countries with
French legal tradition and zero otherwise. Ethnic fractionalisation is the probability that two randomly selected
individuals in a country will not speak the same language.

195
b. Low income countries
Variable Mean Std. Dev. Min Max
Financial development indicators
Private credit 13.86 8.49 1.54 44.16
Liquid liabilities 25.49 12.56 0 82.3
Institutional development indicators
ICRG_QOG 0.42 0.13 0.1 0.69
KKM -0.66 0.41 -1.66 0.31
Components of institutions (KKM)
CCE -0.71 0.38 -1.76 0.37
GEE -0.75 0.39 -1.74 0.18
PSE -0.57 0.77 -2.41 1.02
RLE -0.73 0.41 -1.72 0.41
RQE -0.61 0.49 -2.37 0.58
VAE -0.59 0.56 -1.64 0.69
Other institutional development indicators
P_POLITY2 -1.83 5.57 -9 9
AVGPRCL 5.02 1.68 0 7
Control variables
RPCAP 1371.72 799.06 578.3 5267.7
CPIIMF 14.62 22.53 -13.06 183.31
Instruments
FRENCHL 0.59 0.49 0 1
AL_ETHNIC 0.86 0.34 0 1
Notes: same as Table 4-9a.
The measures of institutional environment
The review of literature in the previous section confirms that a country’s economic,
political and legal institutions affect its financial development. However, it is difficult to
determine which particular one is important for financial development. For example, in
the previous chapter, I use the mean of corruption, law and order and bureaucracy
quality to measure the quality of government, which I referred to as INS. The results
from our findings provided us with a mixed result, in addition to difficulty in
interpreting which independent indicator of institution was relevant to financial
development after financial liberalisation. Thus, the question arises that what aspect of
institution is relevant to financial development?
In this context, the objective is to examine the effect of institutions on financial
development. Here, I incorporate all aspects of institutions - economic, political and
legal institutions, to assess their independent effects and identify which institution is

196
relevant to financial development. I then examine the effect of the interaction of the
particular institutional variable with our financial liberalisation variable to assess to
what extent it affects financial development. Hence, I estimate the following regression:
0 1 2 3 4ln ln ln( * ) ln lnit it it it it i t itFD INST INST FINLIB RGDPc CPI u v
(4.5)
1. The economic institutions variable
Economic institutions refer to the capacity in which government are able to implement
policies and provide public services. They include: government effectiveness and
regulatory quality, corruption levels, protection of property rights and rule of law. Gries
and Meierrieks, (2010) recognise that; (i) strong protection of property rights, (ii) robust
legal framework, and (iii) low levels of corruption are associated with a high quality of
economic institutions, which can influence financial development. Following Van de
Walle, (2005) we use government effectiveness to proxy economic institutions.
Government effectiveness measures the quality of public services, the quality of the
civil service and the degree of its independence from political pressures, the quality of
policy formulation and implementation, and the credibility of the government to such
policies. In other words, government effectiveness measures the competence of the
bureaucracy and the quality of public service delivery.
2. The political institutions variable
Political institutions refer to the process by which those in authority are selected and
replaced. It includes voice and accountability and political stability and absence from
violence (Kauffman et al., 2008). The use of polity2 as a proxy for political institutions
is common in the literature (for example, Huang, 2010). This variable is used to proxy
the degree of democracy and seeks to measure institutional quality based on the
freedom of suffrage, operational constraints, balances on executives, and respect for
other basic political rights and civil liberties. It is usually referred to as a ‘revised
combined polity score’77
which is obtained by ‘subtracting autocracy score from the
democracy score’ to obtain an aggregate democracy variable which is measured on a
scale of -10 to 10; a higher level indicates a higher level of democracy.
77 According to Teorell et al. (2010), ‘the revised combined polity score is designed to facilitate the use of the polity
regime measure in time series analysis.’
197
Plumper and Neumayer, (2010) have criticised the reliability and validity of using
polity2. A measure is considered reliable if it would give us the same results over and
over again (Trochim, 2007), while valid empirical measures accurately reflect the
analytical concepts to which they relate (Norris, 2008). Plumper and Neumayer, (2010:
209) argues that polity2 lacks ‘face validity’ because ‘on closer inspection the rules for
the coding of polity2 for interregnum and affected transition years give values that are
implausible and likely to be misleading regarding the political regime in many of the
affected country years’. Although Norris (2008) seems to agree that the issue of coding
in the Polity IV database may result in certain important aspects of the obtained measure
being excluded from consideration, she, however, argues that econometric research is
often concerned with being able to replicate results, and as such, the issue of validity
may not be of major concern.
Following Huang (2010), therefore, I use ‘polity2’ to proxy democracy. It is obtained
from the Polity IV database by Marshall and Jaggers (2009), courtesy of Teorell et al.
(2010). Hadenius and Teorell (2005) suggest the average of political rights and civil
liberties and an alternative. According to the authors, this variable performs better than
polity2, in terms of validity and reliability. Political rights are defined as ‘rights to
enable people to participate freely in the political processes’, whereas civil liberties are
‘the freedoms to develop views, institutions and personal autonomy apart from the
state’. Hence, following Huang .Y (2005) and Kalyvitis and Vlachaki (2008), I include
the average of political rights and civil liberties, which I refer to as STATUS to proxy
democracy. A higher level indicates better political rights and civil liberties. These are
obtained from data compiled by Teorell et al. (2010) from the University of
Gothenburg, The quality of government institute (QOG) and obtained freely from
Freedom House.78
To test the robustness of our empirical analysis, I use either political
rights or civil liberties to proxy political institutions.
3. The legal institutions variable
The respect for the institutions that govern interaction among citizens and the state is
referred to as legal institutions. Beck (2010) defines legal institutions as ‘rules that
govern commercial relationships between different agents of the society, i.e. firms,
households and government and it include the control of corruption and the rule of law.
For the purpose of this study, I focus on the quality and efficiency of legal institutions. I
78 Gastil et al. (1989).
198
use the Heritage Foundation’s property rights to proxy legal institutions. This measures
the degree to which a country’s laws protect private property rights and the degree to
which the government enforces those laws. It also accounts for the possibility that
private property will be expropriated. For a robustness test, I use the rule of law to
proxy legal institutions. A full documentation of the above institutional quality
indicators are provided in Appendix IV.II. As a robustness test, I use security of
property rights and legal structure to measure the quality of a country’s legal
institutions, following Miletkov and Wintoki (2008).
According to the aforementioned, it is worthy to note that the main institutions
important to financial development are legal and political, thus the focus is mainly on
political and legal institution variables.
4.5.3 Control variables
As is standard practice in the law-finance (Beck and Levine, 2003) and finance-growth
literature (Levine, 2005 and Beck et al., 2008), I control for the effect of other variables,
which can potentially determine financial development. Here, I include macroeconomic
conditions such as country income level denoted by real GDP per capita and inflation
(changes in CPI). The level of development measured by real GDP per capita is
supposed to positively influence financial development (Levine, 1997). As mentioned
earlier, financial development requires a stable macroeconomic environment, thus, to
examine whether a macroeconomic policy variable can explain the persistent cross-
country differences in financial development over a period; the inflation rate (measured
using changes in price level, CPI) from the IMF is used.
I consider the heterogeneity of the SSA group by subdividing these countries according
to their level of development, using the World Bank classifications for income group.
Thus, the other variables included in the model are income level dummies. The dummy
takes the value of 1 if a country belongs to low income level (LIC) and 0, otherwise.
Similar definition is used to depict lower middle income countries (LMIC) and upper
middle income countries (UMIC). To show the origin of a country’s legal system I
include two indicators: BritishL and FrenchL. The data is obtained from La Porta et al.
(1998).
199
4.5.4 Presentation of the model variables: Identification problems
Equations (4-3) and (4-5) provide the basis for the estimation in this study. I note that
there are issues that can arise from the inclusion of indices (given that the measurements
for institutional quality are indexes) as they may induce a bias in the regression results.
According to Rathinam and Raja (2010) institutions that cause economic growth evolve
very slowly over a period. Hence, due to the difficulty in obtaining a ready-made time
series of an institutional indicator, Boji (2007) notes that the introduction of these
factors, as independent variables of time, might not pose problems.
Furthermore, previous studies on financial development have emphasised the problem
of endogeneity, which can arise due to measurement error, reverse causation or omitted
variables. However, Baltagi (2001) suggests using a suitable estimation technique,
which will provide consistent and efficient estimates, in order to avoid such problems.
Beck et al. (2000) applied dynamic panel regressions to deal with endogeneity concerns.
Here, lagged values of the explanatory endogenous variables are used as instruments, as
it is believed that the past values of the explanatory variables are likely to suffer the
same problem as its present values. An advantage of using dynamic panel data methods
over the cross-sectional instrumental variable regression is that it controls for
endogeneity and measurement error for the explanatory variables.
Hence, to avoid the problems discussed above, I follow the methodological approach of
earlier studies such as Rathinam and Raja (2010) and conduct a panel data estimation
based on four year averages of financial development indicators (and other variables). I,
therefore, generate series for financial and institutional development variables which are
measured in 1980-83, 1984-87, 1988-91, 1992-95, 1996-99, 2000-03 and 2004-07, so
that there is seven non-overlapping, four year periods. This gives us seven observations
for each country. An advantage of averaging the time periods is to enable for the control
of problems which may arise due to business cycle effect. Thus, the new equation
estimated is specified as follows:
4 0 1 4 2 4 3 4ln ln ln lnit i it i it i it i t itFD INST RGDPc CPI u v (4.6)
4.5.5 Descriptive statistics and correlations: Preliminary findings
The preliminary statistical interpretation of the data is presented in Tables 4-10a-d and
Table 4-11. They show simple statistical summaries and correlations between the
financial development and governance indicators. Table 4-10a shows a disparity in

200
financial development in the sample of countries (when focusing on the full sample).
Taking into account that our sample is heterogeneous, I split the sample countries into
various income groups (low, lower middle and upper middle income groups). Table 4-
10b shows that the mean values for financial indicators are uniformly lower in low
income SSA countries than the other groups, as measured in terms of private credit and
liquid liabilities. I also observe that there are differences in the explanatory variables
between low income SSA countries and the rest of the group, particularly with respect
to overall institutional development (ICRG_QOG and KKM). A closer look at the table
reveals that the difference between financial development in low income and lower
middle income SSA countries is very small.
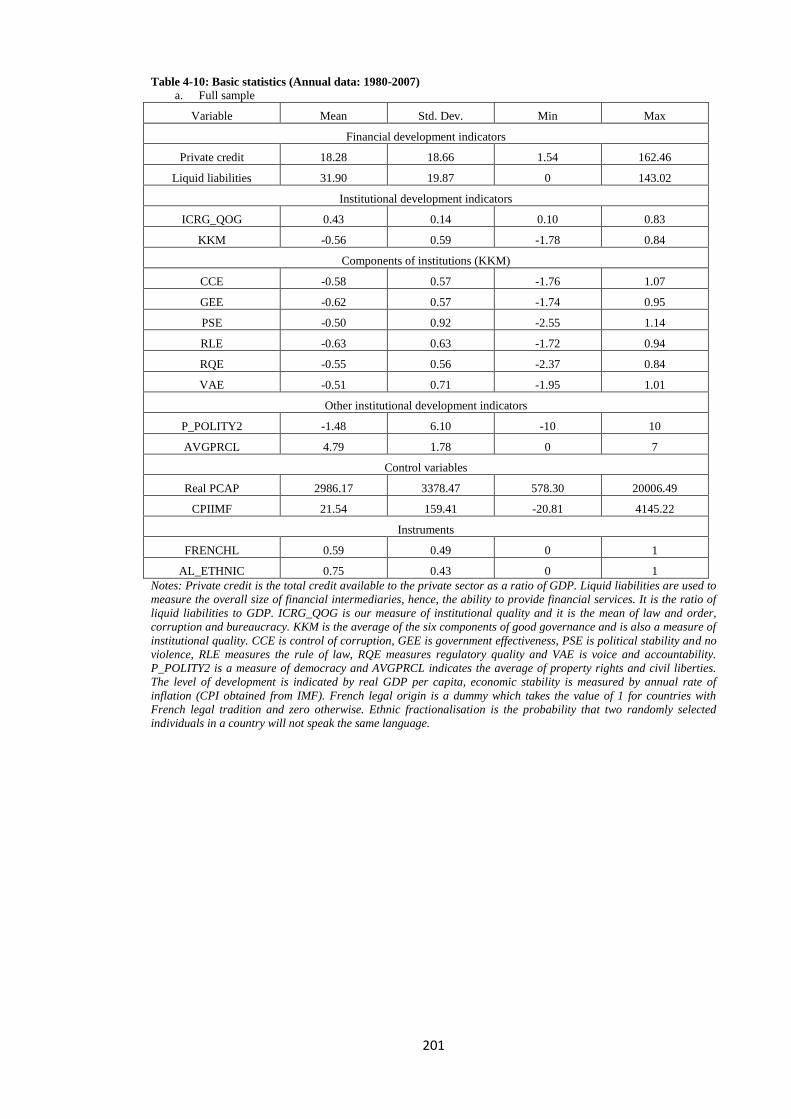
201
Table 4-10: Basic statistics (Annual data: 1980-2007)
a. Full sample
Variable Mean Std. Dev. Min Max
Financial development indicators
Private credit 18.28 18.66 1.54 162.46
Liquid liabilities 31.90 19.87 0 143.02
Institutional development indicators
ICRG_QOG 0.43 0.14 0.10 0.83
KKM -0.56 0.59 -1.78 0.84
Components of institutions (KKM)
CCE -0.58 0.57 -1.76 1.07
GEE -0.62 0.57 -1.74 0.95
PSE -0.50 0.92 -2.55 1.14
RLE -0.63 0.63 -1.72 0.94
RQE -0.55 0.56 -2.37 0.84
VAE -0.51 0.71 -1.95 1.01
Other institutional development indicators
P_POLITY2 -1.48 6.10 -10 10
AVGPRCL 4.79 1.78 0 7
Control variables
Real PCAP 2986.17 3378.47 578.30 20006.49
CPIIMF 21.54 159.41 -20.81 4145.22
Instruments
FRENCHL 0.59 0.49 0 1
AL_ETHNIC 0.75 0.43 0 1
Notes: Private credit is the total credit available to the private sector as a ratio of GDP. Liquid liabilities are used to
measure the overall size of financial intermediaries, hence, the ability to provide financial services. It is the ratio of
liquid liabilities to GDP. ICRG_QOG is our measure of institutional quality and it is the mean of law and order,
corruption and bureaucracy. KKM is the average of the six components of good governance and is also a measure of
institutional quality. CCE is control of corruption, GEE is government effectiveness, PSE is political stability and no
violence, RLE measures the rule of law, RQE measures regulatory quality and VAE is voice and accountability.
P_POLITY2 is a measure of democracy and AVGPRCL indicates the average of property rights and civil liberties.
The level of development is indicated by real GDP per capita, economic stability is measured by annual rate of
inflation (CPI obtained from IMF). French legal origin is a dummy which takes the value of 1 for countries with
French legal tradition and zero otherwise. Ethnic fractionalisation is the probability that two randomly selected
individuals in a country will not speak the same language.

202
b. Low income countries
Variable Mean Std. Dev. Min Max
Financial development indicators
Private credit 13.86 8.49 1.54 44.16
Liquid liabilities 25.49 12.56 0 82.3
Institutional development indicators
ICRG_QOG 0.42 0.13 0.1 0.69
KKM -0.66 0.41 -1.66 0.31
Components of institutions (KKM)
CCE -0.71 0.38 -1.76 0.37
GEE -0.75 0.39 -1.74 0.18
PSE -0.57 0.77 -2.41 1.02
RLE -0.73 0.41 -1.72 0.41
RQE -0.61 0.49 -2.37 0.58
VAE -0.59 0.56 -1.64 0.69
Other institutional development indicators
P_POLITY2 -1.83 5.57 -9 9
AVGPRCL 5.02 1.68 0 7
Control variables
RPCAP 1371.72 799.06 578.3 5267.7
CPIIMF 14.62 22.53 -13.06 183.31
Instruments
FRENCHL 0.59 0.49 0 1
AL_ETHNIC 0.86 0.34 0 1
Notes: same as Table 4-10a.

203
c. Lower middle income countries
Variable Mean Std. Dev. Min Max
Financial development indicators
Private credit 17.29 10.53 1.62 51.8
Liquid liabilities 24.94 7.86 0 35.88
Institutional development indicators
ICRG_QOG 0.38 0.12 0.15 0.64
KKM -0.78 0.61 -1.78 0.56
Components of institutions (KKM)
CCE -0.74 0.55 -1.55 0.75
GEE -0.76 0.52 -1.54 0.36
PSE -0.83 1.04 -2.55 1.1
RLE -0.85 0.69 -1.64 0.83
RQE -0.76 0.45 -1.88 0.14
VAE -0.79 0.73 -1.95 0.9
Other institutional development indicators
P_POLITY2 -3.46 5.48 -10 8
AVGPRCL 5.03 1.68 0 7
Control variables
RPCAP 2853.41 1626.05 836.15 7748.74
CPIIMF 43.92 306.52 -9.62 4145.22
Instruments
FRENCHL 0.57 0.50 0 1
AL_ETHNIC 0.70 0.46 0 1
Notes: same as Table 4-10a.
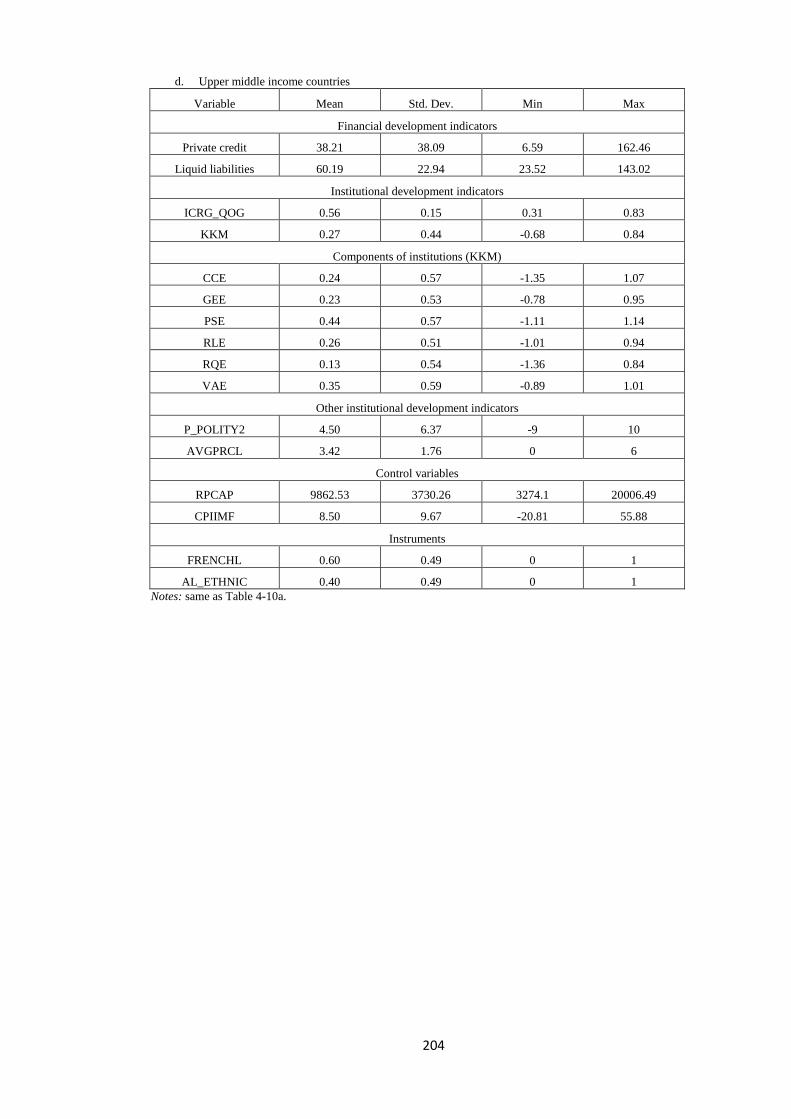
204
d. Upper middle income countries
Variable Mean Std. Dev. Min Max
Financial development indicators
Private credit 38.21 38.09 6.59 162.46
Liquid liabilities 60.19 22.94 23.52 143.02
Institutional development indicators
ICRG_QOG 0.56 0.15 0.31 0.83
KKM 0.27 0.44 -0.68 0.84
Components of institutions (KKM)
CCE 0.24 0.57 -1.35 1.07
GEE 0.23 0.53 -0.78 0.95
PSE 0.44 0.57 -1.11 1.14
RLE 0.26 0.51 -1.01 0.94
RQE 0.13 0.54 -1.36 0.84
VAE 0.35 0.59 -0.89 1.01
Other institutional development indicators
P_POLITY2 4.50 6.37 -9 10
AVGPRCL 3.42 1.76 0 6
Control variables
RPCAP 9862.53 3730.26 3274.1 20006.49
CPIIMF 8.50 9.67 -20.81 55.88
Instruments
FRENCHL 0.60 0.49 0 1
AL_ETHNIC 0.40 0.49 0 1
Notes: same as Table 4-10a.

205
Table 4-11: Pair-wise correlation matrix
Variables 1 2 3 4 5 6 7 8
1 PC 1
2 M3 0.4535* 1
3 ICRG_QOG 0.3016* 0.3175* 1
4 KKM 0.4727* 0.4447* 0.5322* 1
5 P_POLITY2 0.2287* 0.3348* 0.0546 0.5520* 1
6 AVGPRCL -0.2378* -0.2714* -0.1661* -0.8026* -0.6621* 1
7 CCE 0.5196* 0.5072* 0.5316* 0.8921* 0.4236* -0.6647* 1
8 GEE 0.5903* 0.4823* 0.5452* 0.9124* 0.4693* -0.6835* 0.8453* 1
9 PSE 0.2092* 0.3704* 0.3762* 0.8789* 0.3765* -0.6587* 0.7168* 0.6874*
10 RLE 0.4478* 0.5585* 0.6013* 0.9465* 0.4660* -0.7305* 0.8681* 0.8642*
11 RQE 0.4087* 0.0900 0.4675* 0.8390* 0.4177* -0.6164* 0.6889* 0.7775*
12 VAE 0.4816* 0.3710* 0.3617* 0.8942* 0.7930* -0.9281* 0.7354* 0.7998*
13 FRENCHL -0.0449 -0.0979* -0.1692* -0.0456 -0.0618 0.0632* 0.0009 -0.1417*
14 AL_ETHNIC -0.0837* -0.5793* -0.2632* -0.3101* -0.0869* 0.1692* -0.4450* -0.3189*
15 RPCAP 0.4524* 0.8192* 0.3086* 0.5421* 0.2299* -0.2867* 0.5702* 0.5575*
16 CPIIMF -0.0545 -0.0567 0.0098 -0.1100* -0.0141 0.0433 -0.0623 -0.0817
Variables (contd) 9 10 11 12 13 14 15 16
9 PSE 1
10 RLE 0.8173* 1
11 RQE 0.6373* 0.7540* 1
12 VAE 0.7259* 0.7974* 0.7288* 1
13 FRENCHL 0.0485 -0.0679 -0.1279* -0.0136 1
14 AL_ETHNIC -0.2729* -0.3944* -0.0727 -0.1901* 0.0497 1
15 RPCAP 0.4464* 0.5700* 0.3709* 0.4324* 0.0689* -0.4585* 1
16 CPIIMF -0.1277* -0.0967 -0.1102* -0.0939 -0.0051 0.044 -0.0221 1 Note: * denotes significance level, p at 5% level. N=37. Other details same as Table 4-10a.

206
The correlations in Table 4-11 are informative. All the financial development indicators
are correlated with all the various variables in our sample. The result also indicates that
financial development is positively related to institutional quality. For example,
government effectiveness is significantly and highly correlated with private credit, and
has a correlation coefficient of 0.59. A similar situation holds for control of corruption.
The institutional quality variables and the components of institutional quality are also
positively correlated with each other, where the correlation coefficient ranges between
0.71 and 0.86.
The macroeconomic and structural variables are strongly correlated with the measures
of financial development and with the expected sign. In particular, there is a positive
relationship between real growth and the financial development indicators, and inflation
has a negative relationship with the indicators of financial development. The
relationship between real GDP per capita and our indicators of financial development is
positive and significant, suggesting that there is a long-run relationship between finance
and growth.
4.5.6 Economic Assumptions Underlying the Models and Testable hypothesis
Several studies have tried to examine the determinant and impact of financial
development in developing countries. Although these studies have found financial
development positively affects economic growth, there is no general consensus on the
determinants of financial development amongst academics. As a result, empirical
analysis may be found to be misleading at times. The level of income, geography,
resource endowment, macroeconomic policies, openness, culture and institutional
environments such as corruption, legal origin, bureaucratic quality and democracy
significantly determines the level of financial development or has a mixed influence on
financial development in a country. For example, Bertola and Lo Prete (2011) found
that trade openness is insignificant in determining financial development, while Rajan
and Zingales (2003) and Huang and Temple (2005), on the other hand, found it
significantly determines financial development. These inconclusive results might be
related to the difficulties encountered when choosing reliable proxies for institutional
environment. Thus, it is logical to postulate the following hypothesis:
H1: Countries with better governance are more likely to have a well-developed
financial sector.

207
The first hypothesis requires that countries with well-developed institutions have a
positive relationship with financial development.
It is widely acknowledged that finance is important for growth. Yet, the literature still
seeks to answer whether finance is important for growth and if so, what the likely
transmission channels are. It is argued that better institutions promote financial
development and, in turn, economic growth, however, lack of institutions sometimes
leads to growth decline (for example, Posner, 1998). In addition, as countries become
richer, they have access to finance that aids in promoting the development of better
quality institutions. Thus, to empirically assess the role institutions play in the finance-
growth relationship, it is logical to postulate the following hypothesis:
H2: Financial development positively affects economic growth in countries with
better governance.
I examine how the quality of institutions, across countries, modifies the influence of
financial development on economic growth. Here, financial development needs to be
statistically significant in the growth equation before concluding that financial
development has any impact on economic growth. It also requires that the interactions
between financial development and institutions are positive in order to conclude that
institutional environment is a likely channel through which finance affects growth.
Alternatively, following Tressel and Detragiache (2008), I run separate regressions for
countries belonging to different institutions (for example, British law and French law),
such that the interpretation of the result will be that institutions help shape the financial
systems response to financial liberalisation.
4.6 Regression analysis
This section attempts to empirically verify the hypothesis in the previous section. Here,
I control for the level of economic development, inflation and other country-specific
factors included in the country dummy variables.
4.6.1 Baseline regression
This estimation is done following several steps: (1) the baseline model is estimated with
private credit (unless otherwise stated) as the dependent variable and ICRG_QOG, real
GDP per capita and CPIIMF as independent variables, and (2) in this step I see how
individual components of institutions affect FD by including related variables to the

208
previous step. The report of the estimated regression for several subsamples is reported
and discussed below.
Table 4-12: Impact of institutional development on financial development: Dependent variable: Private credit
Variables FE IV GMM
ICRG_QOG 0.446*** -2.154 -0.310
(2.61) (-0.41) (-0.28)
RPCAP(log) 0.763*** 0.794** 0.405***
(7.27) (2.35) (4.35)
CPIIMF(log) -0.031** -0.016 -0.14***
(-1.87) (-0.32) (-6.04)
Constant -3.352*** -2.554*** -0.379
(-4.24) (-2.92) (-0.99)
Sargan Test of over
identifying restrictions -0.191 -1.513
(-0.66) (-0.22)
Durbin-Wu-Hausman (test
for endogeneity) -1.091
(-0.30)
Test for strength of
instruments (first stage) 11.52
(0.00)
Obs 521 521 521
Notes: p-values are in brackets. *, ** and *** indicate p values significant at 10%, 5% and 1% level of significance.
ICRG-QOG indicates institutional quality. The model is well specified as the diagnostic test is satisfactory. The
Sargan and Hensen J test does not reject the over identification restrictions. I do not reject the Durbin-Wu-Hausman
test and, likewise, the test for the joint significance of our instruments show that the instruments are sufficiently
strong. Private credit is in logarithm form.
The estimation results are presented in Table 4-12. First, I estimate a one-way fixed
effects and random effects model. Then employ the Hausman specification tests79
to
determine which estimation technique is suitable for the regression. The Hausman test
result indicates that fixed effects is the preferred method of estimation; therefore, results
for fixed effects are reported. Noting that there may be one or more endogenous
variables in the analysis, instrumental variables (IV) and generalised methods of
moment’s technique are applied to remove this bias.
Table 4-12 also presents the results of estimating equation (4-3) using fixed effects
(FE); two stage least square and GMM approach. Here, the dependent variable is private
credit. ICRG_QOG is used as a measure of institutional quality. The table indicates that
all the determinants of financial development have the correct sign. In fact, I note that
the coefficient of ICRG_QOG is statistically significant and positively related to
financial development. This result suggests that good institutions in the form of law and
79
We obtain a chi2(3) = 53.07 with a p-value of 0.0000. The significant P-value indicates the use of FE estimator.

209
order, bureaucratic quality and rule of law promotes financial development in SSA
provides support to the view of Gries and Meierrieks (2010). However our result is
contrary to the findings of Mobolaji (2008), who used corruption to measure
institutional quality and found that this hinders financial development in the region.
The control variables; real GDP per capita and inflation, generally carry their expected
signs. The coefficient of real GDP per capita is positive and significant in determining
financial development. In contrast, the coefficient of inflation is negative and significant
suggesting that an unstable economic environment hinders the development of the
financial sector.
Turning to the IV and GMM approach, it is observed that the coefficient of institutional
quality measured by ICRG-QOG is negative and insignificant in promoting financial
development.
4.6.2 Effect of various dimensions of good governance on financial development
This section examines which aspect of institutions affects financial development in SSA
the most, by disaggregating the ICRG_QOG and KKM variables. Table 4-13 reveals
that the various institution variables are positively correlated with financial
development. It also reports the estimated results of equation (3) using disaggregate
institutional quality variables. All the diagnostics tests performed indicate that the
model is correctly specified.
The full sample results show that all our measures of institutional quality are positively
related to financial development, with the exception of the rule of law. The results
indicate that only control of corruption and voice and accountability have a coefficient
that is statistically significant, at the 10 and 5 percent significant level, respectively.
Further, all the control variables have the correct sign and are statistically significant in
determining financial development in the SSA region.
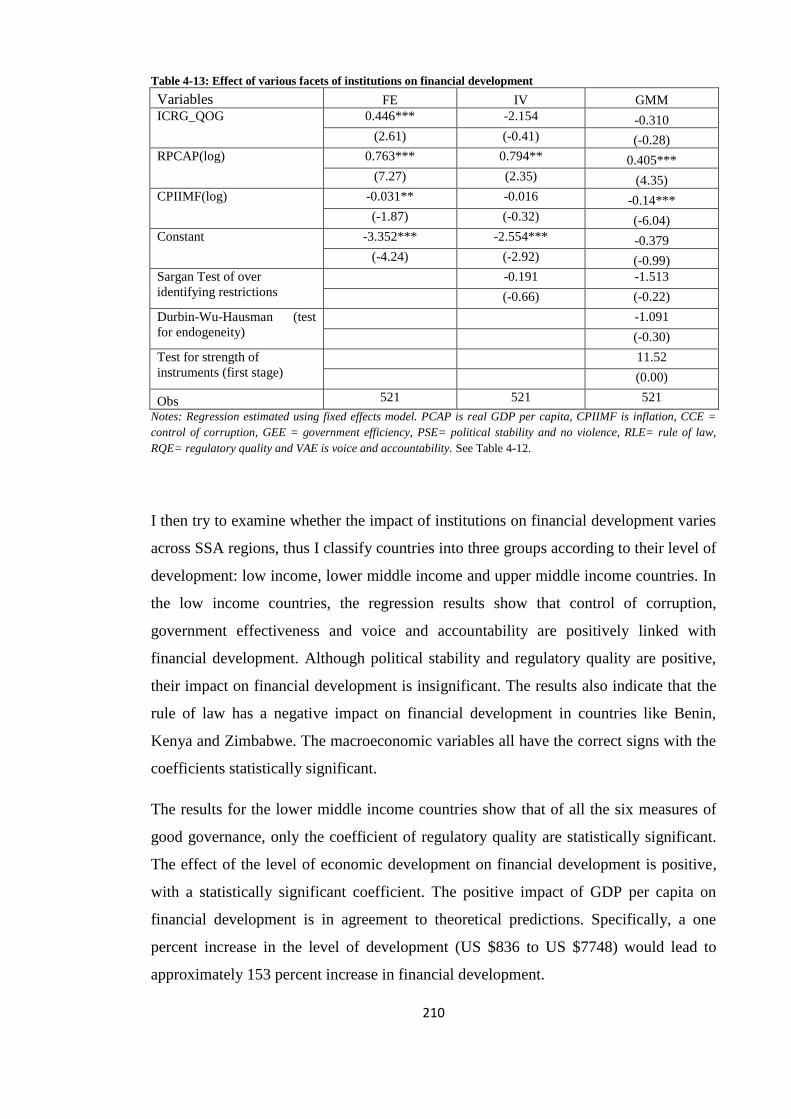
210
Table 4-13: Effect of various facets of institutions on financial development
Variables FE IV GMM
ICRG_QOG 0.446*** -2.154 -0.310
(2.61) (-0.41) (-0.28)
RPCAP(log) 0.763*** 0.794** 0.405***
(7.27) (2.35) (4.35)
CPIIMF(log) -0.031** -0.016 -0.14***
(-1.87) (-0.32) (-6.04)
Constant -3.352*** -2.554*** -0.379
(-4.24) (-2.92) (-0.99)
Sargan Test of over
identifying restrictions -0.191 -1.513
(-0.66) (-0.22)
Durbin-Wu-Hausman (test
for endogeneity) -1.091
(-0.30)
Test for strength of
instruments (first stage) 11.52
(0.00)
Obs 521 521 521
Notes: Regression estimated using fixed effects model. PCAP is real GDP per capita, CPIIMF is inflation, CCE =
control of corruption, GEE = government efficiency, PSE= political stability and no violence, RLE= rule of law,
RQE= regulatory quality and VAE is voice and accountability. See Table 4-12.
I then try to examine whether the impact of institutions on financial development varies
across SSA regions, thus I classify countries into three groups according to their level of
development: low income, lower middle income and upper middle income countries. In
the low income countries, the regression results show that control of corruption,
government effectiveness and voice and accountability are positively linked with
financial development. Although political stability and regulatory quality are positive,
their impact on financial development is insignificant. The results also indicate that the
rule of law has a negative impact on financial development in countries like Benin,
Kenya and Zimbabwe. The macroeconomic variables all have the correct signs with the
coefficients statistically significant.
The results for the lower middle income countries show that of all the six measures of
good governance, only the coefficient of regulatory quality are statistically significant.
The effect of the level of economic development on financial development is positive,
with a statistically significant coefficient. The positive impact of GDP per capita on
financial development is in agreement to theoretical predictions. Specifically, a one
percent increase in the level of development (US $836 to US $7748) would lead to
approximately 153 percent increase in financial development.

211
In the upper middle income countries, our estimation results show that none of the
various indicators of good governance are significant in determining financial
development. However, the level of development seems to positively promote financial
development in these countries. Inflation seems to have the correct sign, although the
coefficients in all the estimations are not statistically significant. One reason for this
might be that inflation is generally low and stable in these economies, such that its
impact is insignificant. For instance, in Botswana, the rate of inflation has been kept low
and stable over the years, partly, as a result of the monetary framework policy put in
place to promote banking sector development and avoid exchange rate appreciation.
4.6.3 Non-Linear effects of institutional quality on financial development
Table 4-14 reports the estimated regression of equation (4.4). In this analysis, an extra
squared term of the institutional quality indicator is included in the table to allow for the
formation of the U-shape movement. Using ICRG_QOG to measure institutional
quality, the results of the estimation using FE, suggests that institutional quality has a
negative and significant effect on financial development. The squared term also has a
negative result, suggesting the relationship between institution and financial
development is linear.
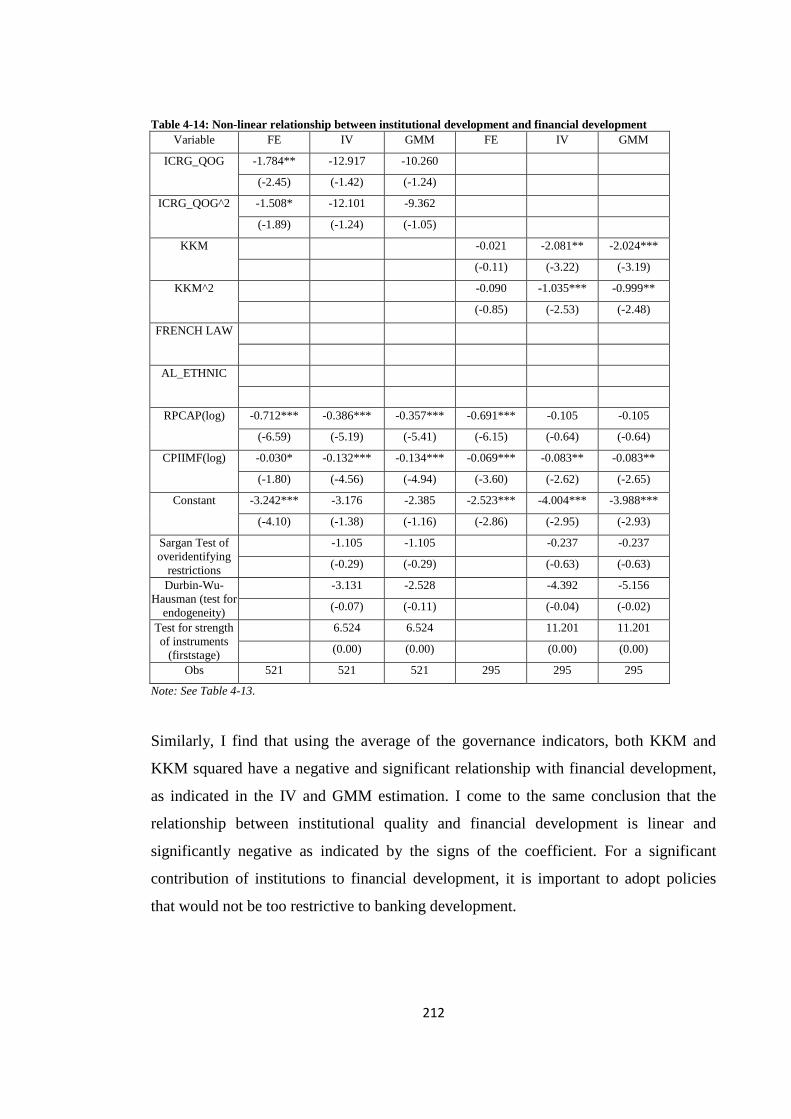
212
Table 4-14: Non-linear relationship between institutional development and financial development
Variable FE IV GMM FE IV GMM
ICRG_QOG -1.784** -12.917 -10.260
(-2.45) (-1.42) (-1.24)
ICRG_QOG^2 -1.508* -12.101 -9.362
(-1.89) (-1.24) (-1.05)
KKM -0.021 -2.081** -2.024***
(-0.11) (-3.22) (-3.19)
KKM^2 -0.090 -1.035*** -0.999**
(-0.85) (-2.53) (-2.48)
FRENCH LAW
AL_ETHNIC
RPCAP(log) -0.712*** -0.386*** -0.357*** -0.691*** -0.105 -0.105
(-6.59) (-5.19) (-5.41) (-6.15) (-0.64) (-0.64)
CPIIMF(log) -0.030* -0.132*** -0.134*** -0.069*** -0.083** -0.083**
(-1.80) (-4.56) (-4.94) (-3.60) (-2.62) (-2.65)
Constant -3.242*** -3.176 -2.385 -2.523*** -4.004*** -3.988***
(-4.10) (-1.38) (-1.16) (-2.86) (-2.95) (-2.93)
Sargan Test of
overidentifying
restrictions
-1.105 -1.105 -0.237 -0.237
(-0.29) (-0.29) (-0.63) (-0.63)
Durbin-Wu-
Hausman (test for
endogeneity)
-3.131 -2.528 -4.392 -5.156
(-0.07) (-0.11) (-0.04) (-0.02)
Test for strength
of instruments
(firststage)
6.524 6.524 11.201 11.201
(0.00) (0.00) (0.00) (0.00)
Obs 521 521 521 295 295 295
Note: See Table 4-13.
Similarly, I find that using the average of the governance indicators, both KKM and
KKM squared have a negative and significant relationship with financial development,
as indicated in the IV and GMM estimation. I come to the same conclusion that the
relationship between institutional quality and financial development is linear and
significantly negative as indicated by the signs of the coefficient. For a significant
contribution of institutions to financial development, it is important to adopt policies
that would not be too restrictive to banking development.
213
4.6.4 Finance-growth nexus: The role of institutions
I examine whether institutions are a channel through which finance affects economic
growth in the SSA region. Thus, I estimate the following equation:
0 1 2 3 4ln ln ln ln( * ) lnit it it it it itrPCAP FD INST FD INST CPI (4.7)
The above equation tests the marginal effects of financial development and institutions
on economic growth.
1 3
lnln
lnit
itit
rPCAPINST
FD
(4.8)
1 3
lnln
lnit
itit
rPCAPFD
INST
(4.9)
In order to conclude that institutions affect the finance-growth nexus, the derivatives
need to be positive. This implies that as financial sectors become more developed, the
better the institutions within which they operate.
To analyse the importance of institutions for finance-growth nexus, I calculated the
marginal effects of both financial development and institutions for the interaction term
and the results are presented in. The results from Table 4-15 indicate that the coefficient
of financial development is statistically significant at a 1 percent significance level, and
is positively signed. The results also indicate that both institutions and the interaction
term are positively signed and statistically significant at the 1 percent level of
significance. This implies that financial development is positively related to economic
growth; however good level of institutions help boost the extent to which finance
promotes economic growth.

214
Table 4-15: Finance-growth nexus role of institutions
Variable FE FE IV GMM
Constant 7.22*** 7.321*** 11.841*** 11.406***
(143.28) (128.24) (8.72) (9.28)
lnPC 0.133*** 0.131*** -0.222 -0.19
(8.30) (7.49) (-1.33) (-1.25)
lnICRG 0.076*** 0.103*** 4.172*** 3.775***
(3.00) (3.68) (3.99) (4.00)
lnPC*lnICRG 0.197*** 0.247*** 2.737*** 2.696***
(3.01) (3.43) (3.02) (3.37)
lnCPIIMF -0.026*** -0.02 -0.016
(-3.90) (-0.50) (-0.43)
Sargan Test of
overidentifying
restrictions
Arellano-Bond test
for AR(1)
Arellano-Bond test
for AR(2)
Obs 586 521 521 521
Notes: See Table 4-13.ICRG_QOG indicates good governance. lnPC*lnICRG indicates the interaction between good
governance and finance. Dependent variable is economic growth.
4.7 Sensitivity to alternative measures of financial development
I try to examine whether the result is sensitive to changes in independent variables,
hence, I use the KKM index to measure institutional quality. The results, reported in
Table 4-16, indicate that institutions are positively related to financial development in
the SSA countries in all of the regressions; however, the coefficient is statistically
significant only when using FE and GMM estimation techniques. The level of economic
development and inflation also has the correct signs, with their respective coefficients
statistically significant at the 1 and 5 percent level of significance, respectively.

215
Table 4-16: Robustness test using KKM as independent variable
Variable FE IV GMM
KKM 0.254* 2.062 1.343**
(1.85) (0.45) (2.14)
RPCAP(log) 0.422*** -0.035 0.038
(3.57) (-0.02) (0.19)
CPIIMF(log) -0.089** -0.068* -0.01
(-1.87) (-1.81) (-0.16)
Constant -0.391 -4.107 3.026*
(-0.41) (-0.30) (1.73)
Sargan Test of over
identifying
restrictions
-0.007 -2.16
(-0.93) (-0.14)
Durbin-Wu-Hausman
(test for endogeneity)
-3.229
(-0.07)
Test for strength of
instruments
(firststage)
3.01
(0.05)
Obs 295 295 295 Notes: See Table 4-13. KKM indicates good governance.
In the IV regression, only the inflation variable is significant with the coefficient having
the correct signs. Turning to the GMM regression, the result indicates that institutional
quality is statistically significant and positively related to the level of financial
development in the SSA region.
Table 4-17 presents the analysis using GMM on data for four year averages and
produces significant findings of a positive relationship between financial development
and the KKM index.

216
Table 4-17: Impact of institutional quality on financial development (four year average)
Variables ICRG_QOG KKM
lnPC -1.182 1.253**
(-0.56) (2.03)
RPCAP(log) -0.349** -0.089
(-2.38 ) (-0.47)
CPIIMF(log) -0.159*** 0.047
(-3.82) (0.40)
Constant -0.246 2.454
(-0.36) (1.48)
Sargan Test of over identifying restrictions -0.67 -1.668
(-0.41) (-0.20)
Durbin-Wu-Hausman (test for endogeneity) -0.079 1.593
(-0.78) (0.21)
Obs 150 110
Notes: See Table 4-13. .Dependent variable is private credit in logarithm. The regression uses generalised methods
of moments estimation technique and data is four year average. The model is well specified as the diagnostic test is
satisfactory. The Sargan and Hensen J test does not reject the over identification restrictions. We do not reject the
Durbin-Wu-Hausman test.
4.8 Policy implication and conclusion
This chapter has analysed the role of institutional environments in promoting financial
development and, in turn, economic growth in 37 Sub-Saharan African countries using
fixed effects, instrumental variables (IV) and generalised methods of moments (GMM)
techniques, over the 1980-2007 period. The empirical analysis suggests that good
institutional environment is required for the development of the financial sector,
especially banking sector development, using private sector credit as an indicator. The
study provides support for previous literature (Law et al., 2008) who reports a similar
finding for a sample of 63 countries over the period 1996-2004. By disaggregating the
institutional quality data, the results indicate that not all components of institutions are
important when financial development is concerned. In the SSA region, the result
indicate that voice and accountability is the most important for financial development,
however, freedom from corruption is equally important, although only significant at 10
percent level. Besides the level of institutions, I find real GDP per capita is also
statistically significant in promoting financial development, while inflation hinders it.
By splitting the sample into three according to their level of economic development, I
was able to examine which aspect of institution is important to financial development in
SSA region. Specifically, voice and accountability control of corruption and
government effectiveness is important for significant development of the banking sector

217
in low income countries. I find that regulatory quality is important for banking sector
development in low and lower middle income countries. However, in the upper middle
income countries, while control of corruption, bureaucracy, political stability and rule of
law all have a positive sign, their coefficient is insignificant. In terms of policy
implication, the findings suggest that enhancing the quality of institutions and
identifying the beneficial aspect of a particular facet of institution is important to
encourage banking sector development.

218
Appendix IV: Summary of countries used in regression
Table 4-18: List of countries in dataset
Angola Côte d'Ivoire Mauritania Sudan
Benin Ethiopia Mauritius Swaziland
Botswana Gabon Mozambique Tanzania
Burkina Faso Gambia Niger Togo
Burundi Ghana Nigeria Uganda
Cameroon Kenya Rwanda Zambia
Cape Verde Lesotho Senegal Zimbabwe
Central African Republic Madagascar Seychelles
Chad Malawi Sierra Leone
Congo, Rep. (Brazzaville) Mali South Africa
Table 4-19: Income group dummy
Takes the value of one for the following income groups
LIC ($995 or less) LMIC ($996-$3945) UMIC ($3946-12195)
Benin Mauritania Angola Nigeria Botswana Seychelles
Burkina Faso Mozambique Cameroon Senegal Gabon South Africa
Burundi Niger Cape Verde Sudan Mauritius
Central African Republic Rwanda Congo Rep Swaziland
Chad Sierra Leone Cote d'Ivoire
Ethiopia Tanzania Lesotho
Gambia Togo
Ghana Uganda
Kenya Zambia
Madagascar Zimbabwe
Malawi
Mali
Note: Countries are divided according to 2009 GNI per capita. The groups are: low income, $995 or less; lower
middle income, $996 - $3,945; upper middle income, $3,946 - $12,195; and high income, $12,196 or more.
Source: World Bank, (2010).

219
Appendix IV-I: Data Documentation, Definition and Sources
Measures of Financial Development: I used two measures of financial sector
development, but restrict it to banking sector development due to the fact that in the
SSA region, banks are the most important element of the financial system. The first one
is private credit as a ratio of GDP. Source: World Bank, World Development Indicators
(2010) compiled by ESDS international and Beck et al. (2010). The second measure of
banking sector development used is liquid liabilities as a ratio of GDP. Source: World
Bank, World Development Indicators (2010) compiled by ESDS international and Beck
et al. (2010). I also use the Beck et al. (2010) financial structure database.
Measures of Institutional Environment: Various measures of institutional environment
have been used in this analysis. Two main measures that I use in the analysis are: the
ICRG-QOG and the KKM index. The ICRG-OG is obtained from Teorell et al. (2010).
The ICRG-QOG is the mean of the ICRG variables ‘corruption’, ‘law and order’ and
‘bureaucracy quality’. It is scaled 0-1; higher values imply a higher quality of
government.
a) Corruption:
b) Law and Order:
c) Bureaucracy quality:
To test the robustness of our estimation, I use the KKM index to proxy institutional
development. The KKM index, which is obtained by averaging the six measures of
government quality. Source: World Bank’s World Governance Indicators (WGI) based
on Kaufmann et al. (2009).
To enable us understand which facet of institutions are important to financial
development, I decompose both the ‘ICRG-QOG’ and the KKM index. Thus, I include:
(a) control of corruption, rule of law and bureaucratic quality and (b) voice and
accountability, political stability, government effectiveness, regulatory quality, rule of
law, and control of corruption. Source: World Bank’s World Governance Indicators
(WGI) based on Kaufmann et al. (2009).
Other institutional quality indicators are derived from World Bank Governance
Indicators (Kaufmann et al., 2007 and 2008, and Gwartney et al., 2010). These

220
indicators are based on several hundred individual variables measuring perceptions of
governance. These measures of governance are assigned to categories capturing key
dimensions of governance and then aggregated into six governance indicators. The
governance indicators are normally distributed, with a mean of zero, and a standard
deviation of one in each period. Thus, scores are virtually between -2.5 and 2.5, with
higher scores corresponding to better governance.
a) Control of Corruption: measures perceptions of corruption, conventionally
defined as the exercise of public power for private gain. The presence of
corruption is often a manifestation of a lack of respect of both the corrupter
(typically a private citizen or firm) and the corrupted (typically a public official
or politician) for the rules which govern their interactions and hence represents a
failure of governance according to our definition.
b) Government Effectiveness: measures the quality of public services, the quality of
the civil service and the degree of its independence from political pressures, the
quality of policy formulation and implementation, and the credibility of the
government's commitment to such policies.
c) Political Stability and Absence of Violence: measures perceptions of the
likelihood that the Government will be destabilised or overthrown by
unconstitutional or violent means, including domestic violence and terrorism.
d) Rule of Law Index: is a measure of the extent to which agents have confidence in
and abide by the rules of society. The degree to which a society’s atmosphere is
conducive to regular, orderly social and economic activity and the protection of
private property is an important measure of government effectiveness.
e) Regulatory Quality: includes measures of the incidence of market-unfriendly
policies such as price controls or inadequate bank supervision, as well as
perceptions of the burdens imposed by excessive regulation in areas such as
foreign trade and business development.
f) Voice and Accountability: measures the extent to which a country's citizens are
able to participate in selecting their government, as well as freedom of
expression, freedom of association, and a free media.
g) Security of Property Rights and Legal Structure: consists of judicial
independence, impartial courts, the protection of intellectual property, military
interference on the rule of law and political process and integrity of the legal
system. The index ranges from 0-10, where 0 indicates ‘no judicial
independence, trusted legal framework, no protection of intellectual property,
military interference in rule of law and no integrity in the legal system’, and 10
indicates that ‘there is high judicial independence, trusted legal framework,
protection of intellectual property, no military interference in rule of law and
integrity of the legal system’. Source: Teorell et al. (2010). Missing data is
updated using Gwartney et al. (2010), EFW database.
221
h) Heritage Foundation’s Property Rights: This measures the degree to which a
country’s laws protect private property rights and the degree to which the
government enforces those laws. It also accounts for the possibility that private
property will be expropriated. In addition, it analyzes the independence of the
judiciary, the existence of corruption within the judiciary, and the ability of
individuals and businesses to enforce contracts. The less certain the legal
protection of property is and the greater the chances of government
expropriation of property are, the higher a country’s score is. The country’s
property rights score ranges from 0 and 100, where 100 represent the maximum
degree of protection of property rights. Source: Toerell et al. (2010).
Control Variable: To conform with previous studies (Beck et al., 2004 and Law and
Azman-Saini, 2008), this study uses factors such as level of economic development and
macroeconomic stability to control for other factors that may affect financial
development. I also control for time by including a time dummy variable, other country-
specific factors, and time invariant variables.

222
5 On the Determinant and impact of Foreign Direct Investment:
Evidence from Developing Countries80
Abstract
During the last years, the determinant of FDI and its influence on economic growth has
been discussed extensively in the economic literature. However, the results have been
far from unanimous. The purpose of this chapter is thus to empirically accesses this
relation using a sample of 30 developing countries from Asia, Latin America and the
Caribbean and Sub-Saharan Africa over the period 1980 to 2007. In particular, the study
examines the effect of the interaction of economic openness and human capital insofar
as attracting FDI is concerned. The findings suggest that FDI is mainly determined by
human capital and economic openness and a good level of infrastructural development.
In addition the results indicate a strong evidence of threshold effects with respect to the
level of human development. In testing the FDI-growth hypothesis, the results indicate
that FDI is positively related to growth and this effect is stronger for host countries with
a higher level of economic openness and level of human capital development as
measured by trade volume and adult literacy in the host country. The findings also
indicate the importance of human capital is highlighted as complementary to FDI
inflows, underlying the importance of technology adoption.
5.1 Introduction
In recent times, economic and financial globalisation has played a large role in
accessing capital, technology and goods and services from a wide range of markets. On
one hand, many governments view globalisation as a threat to independence, because of
the growing influence of financial and multinational corporations (hereafter, MNCs).
On the other hand, its benefits in terms of technology transfer, managerial skills,
research and development (hereafter, R&D) and openness of the domestic markets to
the global economy cannot be ignored, especially in developing countries, as it is
suggested to be a lasting solution in ‘kick starting’ the sluggish growth observed in
these economies. Also, as opposed to other sources of capital flows that are volatile and
reversible, FDI is more stable and it provides the much needed capital for investment. It
increases competition in host countries by aiding local firms in the industry to become
80 A paper based on this chapter has been accepted for publication in the special edition of Journal of Management
and Practice.

223
more efficient, by adopting new technologies and investing in human and physical
capital. This all suggests that FDI, which is a key driver in globalisation, plays an
important role in promoting economic growth and development in developing countries,
by modernising their domestic economy.
The potential role of FDI in promoting economic growth is being accepted as the
majority of economies ease up the entry of foreign capital inflows and set up an
advanced system to increase their prospective of attracting FDI inflows. For instance,
many developing countries tend to develop different promotional policies such as
liberalisation of capital flows, establishing special economic zones, geographical
location and developing sound business environments to enable them to attract FDI to
sectors where it is badly needed (Ajayi, 2006). Nevertheless, these policies have not
effectively promoted economic growth and development processes in most developing
countries, particularly in the Sub-Saharan Africa (hereafter, SSA) region where the flow
of FDI is low relative to other developing countries. In the 1990s for instance, average
FDI inflows to SSA countries was 1.43 percent, compared to 2.1 percent in Asia and 2
percent in Latin America and the Caribbean. According to Onyeiwu (2003), regional
discrimination exists in terms of FDI distribution in developing countries. To explain
these differences, some analysts point to the characteristics of the host country. For
instance, the role of governance, democracy, need for stable and sound macroeconomic
environment and the capacity of economic management (World Bank, 1997, IMF, 2001:
49-50). In addition, foreign investors are attracted to countries with a large market size
and potential, friendly business environment with skilled or semi-skilled labour
(depending on the motive of the FDI) and areas with sound macroeconomic policy and
institutional quality. Hence, countries found in regions such as Asia, Latin America and
transitional countries in Europe attract more FDI than those in SSA because of their
larger potential consumer market having the common characteristics of a large
population (Vijayakumar and Sridharan, 2010).
The importance attached to FDI in the development process, coupled with the difference
in economic growth across countries, has led to a resurgence of research interest in the
determinants of FDI and its impact on economic growth. Much of the literature contains
competing explanations and the notable ones include, for example; Caves, 1982;
Borensztein et al., 1995 and 1998; De Mello, 1997 and 1999; and Campos and
224
Kinoshita, 2002. A general characteristic of the literature is that they relate to a
combination of developing and developed countries, or a comparison between regions
where inflow of FDI is rather attractive. Fuelling this debate is the mixed empirical
evidence on whether FDI contributes to economic growth.81
A closer look at the
evidence, however, indicates that the econometric techniques used, and the
measurement of FDI and its direct linkages to economic growth, are complicated.82
For
example, Mottaleb (2007) studied the determinants of FDI and its impact on 60 low
income and lower middle income countries using panel data analysis. The results of the
analysis showed that top FDI recipient countries have a larger domestic market size,
high market potential and friendly business environments. Although, the research shows
that FDI significantly affects economic growth, the sample was restricted to a
combination of top and low FDI recipient countries and does not cover countries that
consistently attract FDI. In contrast to this paper, Asiedu (2002) found that the impact of
the determinants of FDI in developing countries is different across regions. As for
estimation techniques, Asiedu (2002) employed an Ordinary Least Square (OLS)
method. The author analysed the determinants of FDI in 70 developing countries for the
period 1988-1997. Thirty one of the countries are in SSA. The results show that
infrastructure development and a higher return on investment are important factors that
drive the attraction of FDI in the sample. It also shows that economic openness is an
important determinant of FDI; however, SSA will receive less FDI inflow due to its
geographical location. One of the problems associated with the technique used by
Asiedu (2002) is that OLS assumes that each country’s intercept value is identical, and
it does not control for country-specific characteristics, resulting in the conclusion of the
existence of a ‘regional effect’ for SSA.
In an attempt to analyse the impact of FDI on economic growth, Carkovic and Levine
(2006) used both the pure cross-sectional OLS analysis and dynamic panel data
procedure for the period 1960 to 1995. After controlling for government size and
macroeconomic policies, FDI was found to have a positive impact on economic growth.
However, a negative relationship was obtained after controlling for trade and financial
81
In a survey of the literature, Carkovic and Levine (2002) conclude that the empirical research does not find a robust
significant effect of FDI on economic growth. 82
Using FDI net inflow to measure FDI activities, Alfaro et al. (2003) suggested that FDI would impact positively on
economic growth in countries with well functioning financial markets. Likewise, in studying the link between FDI
and economic growth, Carkovic and Levine (2002) used FDI gross inflow. The authors found that FDI does not have
a robust impact on economic growth.

225
development. Given the difficulty in demonstrating the relationship, several recent
papers study the different channels through which FDI inflow can lead to faster
economic growth.83
According to Borensztein et al. (1998), the inflows of FDI to developing countries may
increase economic growth through technology transfer. Technology diffusion can take
place in different forms; for example, the transmission of ideas or knowledge expertise
and the importing of high technology products from MNCs. MNCs are perceived as the
most technologically advanced firms and an important channel for access of advanced
technologies by developing countries (Borensztein et al., 1998). According to the
authors, the positive effect of FDI on economic growth depends on whether the
educated workforce in the country can take advantage of the technological spillovers
associated with FDI. Therefore, to benefit from the spillover effects of FDI, it is
assumed that liberalising trade will enhance a country’s opportunity to have access to a
free flow of goods and services resulting from lowering trade barriers; which is an effect
of globalisation. Further, it is argued that by improving access to foreign technological
advances, through the transmission of ideas (i.e. FDI and trade) in the intermediate and
capital goods that embody technology (i.e. knowledge spillovers), this can enhance the
efficiency of these countries beyond the effect of increased investment which is a key
requirement for sustained economic growth. In addition, to bridge the resource gap,
meet the Millennium Development Goals (MDGs) and strengthen the economies of
developing countries, a lot of premium has been put on FDI, because it is expected to
enhance productivity and create jobs, (Ajayi, 2006).
Using panel data from 30 developing countries, this chapter tries to investigate the
underlying factors that affect inflow of FDI in the developing countries. In particular,
the chapter tries to establish that the level of openness and human capital and the
interaction between them significantly affects the inflow of FDI, and that FDI positively
and significantly affects the market size (measured by GDP per capita growth) of a
country. This chapter takes into account factors that influence FDI, while focusing on
the indirect transmission of ideas and technological advancement through FDI inflow, in
the context of the level of openness of a country to the global economy. Specifically, the
chapter aims to examine the link between the level of openness and the differing levels
83 See Blomstrom and Kokko (2003) for an overview of the literature.

226
of human capital in attracting FDI in our sample of developing countries.84
In the
backdrop of the literature, this research seeks to firstly, examine the determinants of
FDI and secondly, study the impact of FDI on economic growth. The primary research
question, therefore, is: What factors account for the inflow of FDI to developing
countries and does FDI lead to economic growth through technological knowledge
spillovers? The research sub questions are:
What factors determine the inflow of FDI to developing countries? Specifically,
what is the effect of the degree of economic openness modified by the level of
human capital? Are there similarities or differences in the factors that determine
the inflow of FDI to the different regions, income groups and the fastest growing
emerging economies?85
What is the impact of the interaction between the level of openness and human
capital on the attraction of FDI in the select developing countries? Are there
similarities or differences in the effect of this factor on the attraction of FDI to
the different regions, income groups and the fastest growing emerging
economies?
What is the impact of FDI on economic growth in the developing countries?
Specifically, does the interaction between FDI, openness and human capital
promote economic growth in the select developing countries? Are there
similarities or differences in the impact of FDI on economic growth in the
different regions and the fastest growing emerging economies?
Finding answers to these questions is important for several reasons. Although there is an
extensive literature on the determinants of FDI, only a few SSA countries are included
in the samples.86
In this analysis, about half of the countries are found in the SSA
region. An advantage of using a dataset that includes different regions, income groups
and economic bloc is that it allows us to test the extent to which the FDI determinants,
identified in previous literature, help explain the variation in FDI and its impact on
economic growth in the sample. With regards to the questions above, specifically on the
84 The assumption in this chapter is that economic openness leads to higher FDI inflows by improving the level of
human capital development. 85
The regions include; Asia, Latin America and Sub-Saharan Africa, Income group include: Upper Middle Income,
Low and middle Income and Low Income countries and the fastest growing economies include: Brazil, Russia, India,
Mexico and China, which is referred to as the BRIMCs. 86
For example, Schneider and Fry (1985) consider 51 countries, of which 13 are SSA. An exception is Ng’ang’a
(2005), where 41 out of 94 countries are in the SSA region.

227
comparison of factors that determine FDI in the fastest growing emerging economies
(BRIMCs), these issues are yet to be addressed in the literature. Thus, this study aims to
contribute to the debate by providing further empirical evidence and building on the
strengths of previous literature. Specifically, following recent development in the
literature on the contribution of China and India to the global economic development, I
examine the determinants of FDI in the BRIMCs, and examine how inward FDI is
linked to development process in these economies and other emerging economies in our
sample.
Using a panel data covering 30 developing countries between 1980 and 2007, the results
show that the main determinants of FDI inflows to these countries are a highly literate
workforce, economic openness and infrastructural development. The empirical analysis
also investigates whether the set of determinants varies across region and income group.
The findings indicate that for the Asian countries, a large market size with a highly
literate workforce and a high degree of economic openness are the main determinants,
while for BRIMC countries a large market size are the main drivers of FDI inflows. In
the LAC countries, infrastructural development is more important whereas, in SSA
region, the level of human capital and openness are the main drivers of FDI inflows. In
terms of income groups, economic openness seem to be important for FDI inflows in
low income countries, however market size, the level of human capital, economic
openness and a stable economy promotes FDI inflows to lower and middle income
countries. The result also indicates that FDI inflows to upper and middle income
countries are driven by economic openness and infrastructural development. With
respect to the impact of FDI on economic growth, the findings show a strong evidence
of a positive relationship.
The rest of the chapter is structured as follows. Section 5.2 discusses trends of FDI
flows in developing countries. Section 5.3 looks at previous literature on FDI flows. It
reviews the relationship between FDI, trade, human capital and economic growth and
then provides evidence linking FDI, trade, human capital and economic growth
together. Section 5.4 briefly describes the model and data, provides the economic
assumptions underlying the model and empirical strategy used. Section 5.5 reports the
empirical results. The conclusions are in section 5.6.

228
5.2 Inflows of FDI to developing countries
The past two decades have witnessed a remarkable increase in foreign capital flow,
especially to developing countries, of which FDI has played a significant role. In 1980,
world FDI outflow represented approximately 5 percent of world gross domestic
product. The percentage almost tripled to 14 percent by the end of the 1990s
(UNCTAD, 2000). The inflows of FDI to developing and developed countries
amounted to US $334 billion and US $542 billion, an increase of 37 percent and 22
percent over 2004, respectively (World Investment Report (2006: 4). The five largest
developing countries- Brazil, Russia, India, Mexico and Russia accounted for 43 percent
of total FDI inflow to developing countries. Despite the increase in FDI flows to
developing countries, Asia received 60 percent of this amount, inflows to LAC was 33
percent and 6 percent was reported for SSA (UNCTAD, 2006). These inequities in the
distribution of FDI flows are partly due to the fact that both Asia and the Latin America
and Caribbean regions have larger economies than other developing regions. In
addition, lack of economic openness and poor institutions account for the low level of
FDI inflows to the SSA region.
The rapid increase in FDI, particularly to developing countries, can be associated to an
increase in cross border mergers and acquisitions (M&As), which was made possible
through the liberalised restrictions on FDI and the provision of incentives to attract FDI
(Gholami et al., 2006). Privatisation has been another leading source of the explosion of
FDI into developing countries, particularly LAC regions. Out of the $62 billion FDI
inflow to LAC in 1997, $11.4 billion were related to privatisation (Rivera-Batiz, 2000).
FDI inflows to developing countries have been shown to have a positive impact on
economic growth. For example, Romer (1993, cited in Moran, 2002 and UNCTAD,
2006) asserts that FDI has the potential to generate employment, raise productivity,
managerial knowledge and skills, improve marketing strategy, improve production
procedures, enhance exports, transfer foreign skills and technology, and contribute to
the long-term economic development of the world’s developing countries.
Figure 5-1 presents the trends of the inflow of FDI in the world, as well as across
regions of developing countries. The trends reflect that FDI mostly flows towards Asia
and Latin America and the Caribbean. FDI inflow towards Asia, Latin America and the
Caribbean and the world exhibit a similar pattern. For example, FDI inflow in Asia,

229
LAC and the world spiked in 2000 and then started to decline in a similar pattern,
reaching its lowest point in 2003. FDI inflow started to increase, but more sharply for
countries in Asia and LAC. On the other hand, an annual FDI flow into SSA is so small.
Starting from similar levels in the mid-1980s, annual FDI flows into SSA stagnated for
a long time at around $1 billion, while the amounts received in LAC and Asia expanded
impressively from the 1980s onwards. However, FDI inflow to SSA has been on an
increase since 2004. In 2007, total inflow of FDI to Asia was more than US $319 billion
compared to Latin America which was more than US $120 billion, whereas in the same
year in SSA, total FDI inflow was approximately US $41 billion respectively,
(UNCTAD, 2008).
Figure 5.1: Trends in FDI inflows to world and other developing region, 1980-2007
Source: UNCTAD FDI database (2008).
FDI plays an important role in the economic development of any developing countries.
Firstly, FDI has provided an additional source of capital and expanded the country’s
production activities. The use of FDI, in addition to domestic investment, has increased
the capacity of the host country’s production beyond what could have been achieved
using only domestic investment. Secondly, FDI has promoted international trade,
especially in countries that are open. FDI has encouraged exports, in particular, in
developing countries. As shown in Figure 5-2, export as a percentage of GDP has more
than doubled, especially for the countries in Asia between 1991 and 2006. It also shows
that the introduction of the World Trade Organisation (WTO) in 1995 has helped SSA
increase its share of export. It is argued that there is a strong correlation between export
World
ASIA
SSA LAC
05
00
10
00
15
00
20
00
25
00
Bill
ion
s o
f U
S $

230
growth and FDI inflows. Hence, without FDI, most developing countries might not have
experienced a rapid increase in their exports. Finally, FDI has helped in the transfer of
new technology and management skills to the host country. According to UNCTAD
(2000), FDI provides a rapid and more effective way to deploy new technologies in host
countries.
Figure 5.2: Regional Exports of goods and services as a percent of GDP, 1980-2007
Source: World Banks’ World Development Indicator (2010).
Note: Data for Asia is the aggregate of East Asia and Pacific and South Asia.
5.3 Related literature on determinant of FDI
In this section, I provide a theoretical underpinning of the factors that determine the
attraction of FDI and the location determinants of FDI. This section also uses economic
growth theories to explain the role of FDI in the economic growth process. The role of
FDI as a channel through which new technology is deployed from advanced countries to
developing ones will also be a focus in this section.
5.3.1 Determinants of FDI: Some Theoretical Considerations
The theoretical analysis of international trade and the determinant of FDI can be traced
back to the 18th
century with the work of Adam Smith. Using the theory of absolute
advantage, Adam Smith postulates that if two countries are endowed with different
natural resources, then it is useful for each to undertake specialisation, after which they
engage in trade so as to meet their needs and requirements. In his argument, he notes
that if international trade always results into a deficit for one of the party engaged in it,
ASIA
LAC
SSA
0.0
10.0
20.0
30.0
40.0
50.0
60.0
70.0
80.0
19801982198419861988199019921994199619982000200220042006
pe
rce
nt
of
GD
P

231
it will not last for long. According to him, trade relations must generate mutual benefits
for all parties involved. Adam Smiths’ theory became the foundation for further theories
on international trade and by 1933; Ohlin presented motives for international trade.
According to the author, trade was motivated mainly by the possibility of high
profitability in growing markets, along with the possibility of servicing these
investments at a low cost in the host country. In addition, the access to other factors
such as natural resources and the ability to overcome trade barriers are also considered.
This implies that international trade tend to occur between advanced and developing
countries because of their different endowment.
Early literature suggests that international trade and FDI are two alternative strategies
for certain products. For instance, it is noted that firms (multinational corporations,
MNCs) could either produce at home, or export to foreign destination or produce abroad
and substitute home country exports with foreign affiliate local sales. In order for this to
occur, several decision making processes are considered; including trade costs and
economies of scale. To explain the decision making process of MNCs, the theoretical
literature focused on two main approaches: location and internalisation.
The first, the location theory, considered the reasons why multinational corporations
(MNCs) locate their firms outside the home country. According to Hymer (1976),
MNCs internationalise their production processes by taking advantage of the
monopolistic nature of the local firm, and are, therefore, able to compete with local
firms who have the knowledge of the domestic markets. However, MNCs have more
advantages over the local firms, because they bring with them management skills,
economies of scale and access to proprietary knowledge. According to this theory, the
behaviour of the MNCs determines the structure of the market. In contrast to this line of
reasoning, Caves (1971) argued that the market structure determines the location of an
MNC. The argument here is that, FDIs will be made in a market where similar or
comparable goods are produced. This form of investment is known as horizontal
investment (market-oriented) and it is often undertaken to make substantial use of
monopolistic and oligopolistic advantages, especially in countries with less strict trade
restrictions. Further, if there is no product differentiation, then vertical investments
(export-oriented) will occur. The idea behind this type of investment is to make the
production process more cost efficient, by reallocating some stages of production to low
232
cost locations. According to Brakman et al. (2006), establishing their own network in a
host country makes it easier for MNCs to market their own products.
The second line of discussion, which is the internalisation theory, was first developed
by Buckley and Casson (1976 and 1981). In explaining the reasons for FDI and the
growth of MNCs, the authors developed a hypothesis where they considered an
imperfect market with high transaction costs, managed by a group of different firms.
This imperfection in the market may arise due to externalities (e.g. government
regulations and controls, such as tariffs or lack of knowledge). Therefore, in an attempt
to overcome these externalities, the theory suggests that MNCs will develop their own
capability (internalisation) i.e. taking control over their operations rather than offering a
license to foreign agents. Thus, when production and control are located in the home
country, the MNCs will export, but when production and control are located abroad or
in the host country, then FDI is made.
Both theories were further modified by Dunning (1980, 1993 and 1998). His analysis
begins by stating that the location of MNCs is motivated by various factors, which he
referred to as ownership, location and internalisation advantage (OLI theory). He
suggested that when firms possess greater ownership and internalisation advantage, and
the location advantage favours the host country (i.e. creating and exploiting these
advantages in a location outside the home country), more FDI will be undertaken.
Following this, Dunning (1993) outlines four reasons why foreign investors locate
abroad; factor/resource/labour-seeking, efficiency-seeking, market-seeking and strategic
asset motivation.87
Firstly, the availability of resources, unskilled or semi-skilled labour,
or cheaper labour costs drives the factor/resource/labour seeking activities of MNCs.
This form of investment usually takes place in the manufacturing industries, where
MNCs directly invest, in order to exports. This implies that MNCs locate industries or
set up firms in areas with surplus natural resources such as countries with raw materials,
crude oil and agricultural product solely on exportation basis. An example of resource-
seeking FDI is ExxonMobil, investing in oil production in the North Sea. Nevertheless,
to have access to such factors of production, host countries have set up free trade zones
(see Dunning, 1993).
87
See Dunning (1993) and DeMello (1997) for extensive details on the determinants and motivation of FDI.
233
Secondly, market-seeking investment involves foreign firms or MNCs opening new
markets in host countries, in order to boost their sales (Kandiero and Chitiga, 2003).
The argument here is that, as firms seek to access markets (through trade restrictions),
FDI activity increases with the size of the host country and the level of human
development. For example, the General Motors’ investment in China can be termed as
market-seeking because the cars produced in China are sold in China. The efficiency-
seeking FDI occurs when firms gain from the common governance of geographically
dispersed activities in the presence of economies of scale and scope. Finally, MNCs also
seek to pursue the strategic operations of other firms through the purchase of the
existing firm, so as to increase their competitive advantage in the global market.
Vernon (1966) presents another line of reasoning. This theory provides a framework for
explaining the export oriented production by MNCs. According to this theory, there are
four stages in a products life cycle: introduction, growth, maturity and decline. Each
stage of production affects the location of the product. Initially, new products are
introduced in order to meet national needs and then these products are exported to
countries with similar preferences and income groups. Due to growth in demand,
production is shifted to other industrial countries for servicing home countries, usually
on the basis of production costs. Eventually, production is moved to developing
countries that may offer competitive advantage as a production location. This point of
production is where the export oriented production takes place. In addition, MNCs
move productions abroad in order to allow them use their knowledge and innovating
potential in another environment aside from the home country. This is because; MNCs
spend a large share of their capital on R&D, because this is not common in developing
countries, by moving production abroad, therefore, they are able to increase their
specific advantage.
In sum, UNCTAD (2000: 19-20) classifies the determinants of FDI under three main
categories, namely: economic factors, government policies and trans-national
companies (TNC) strategies. Surrounding these categories is a range of factors that has
been discussed previously in the theoretical literature, for instance; market, resources,
FDI policies, location, integration and risk perception.

234
5.3.2 Previous Empirical Studies on FDI Determinants
To identify the determinants of FDI, different empirical studies have concentrated on
different factors suggested by the theoretical literature. Most of these studies have
concentrated more on the economic factors. The main variables normally used include,
market size (measured by GDP or per capita GDP), market potential (measured by the
annual growth rate of GDP or per capita GDP), the availability of natural resources
(measured by the share of fuel and minerals in total exports, see Asiedu, 2003),
economic openness (measured by trade volume and import as a percent of GDP), human
capital (measured using markers such as; average years of schooling, adult literacy rates
and school enrolment (Noorbakhsh et al., 2001 and Ng’ang’a, 2005), and institutions
(measured by corruption, weak enforcement of contracts (Gastanaga et al., 1998). The
following studies sought to study the determinants of FDI.
Woodward and Rolfe (1993) examined the determinants of the location of export
oriented manufacturing FDI in the Caribbean Basin. Their results show that transport
costs, quality of infrastructure and size of export processing zones are factors which
determine FDI in the countries studied. Cheng et al. (2000) found that FDI is
determined by relative profitability. According to the authors, if an investor chooses a
certain location as the destination of FDI, then from the investors’ point of view, that
location must be more profitable than others.
Asiedu (2002) studied the determinants of FDI in 24 countries in Sub-Saharan Africa
over the period 1984-2000, and concluded that large markets, natural resources and
good infrastructure are significant in promoting FDI in the SSA region. The author also
found that regional economic cooperation may promote FDI in SSA.
Campos and Kinoshita (2004) use panel data to estimate the determinants of FDI in 25
transition economies from the Central and Eastern Eurobarometer countries (CEEB) and
the Commonwealth of Independent States (CIS) between 1990 and 1998. They found
that the determinants of FDI vary across the choice of sample countries. They also
found that FDI in these countries are a mixture of resource, efficiency and market-
seeking. Whilst they found the abundance of natural resources and low level of human
capital was the main determinants of FDI in the CEEBs, external liberalisation was
important for attracting FDI in CIS.

235
Ng’ang’a (2005) considered the interaction of infrastructural development and degree of
openness on FDI inflow in 95 developing countries over the period 1980 to 2002. Both
fixed effects estimator (FEE) and pooled ordinary least squares (POLS) was employed.
The results show that FDI is greatly influenced by the quality of infrastructure and
openness of the economy to trade. However, these two determinants vary across the
sample countries studied.
5.3.3 The Impact of FDI on Host Country’s Economy: The role of Trade Openness and Human
Capital
An important aspect of globalisation during the last two decades has been the
impressive surge of foreign direct investment (FDI) into developing countries. FDI is
believed to play an important role in economic development because it may lead to
increased employment opportunities, bridge technological gap between developing and
developed countries through technology transfer and improve management skills
through learning by doing. It may also introduce competition between, and among,
domestic and foreign companies, and it may open access to global markets.
In theory, FDI contributes to capital accumulation and technological progress and is an
important catalyst for industrial development. Its attractiveness and efficiency in
promoting economic growth, however, depend on the degree of spillovers to domestic
firms, that is, the extent to which the technology transfers embodied in the FDI are
absorbed and diffused, and the value added content of FDI-related production. Some
researchers (such as Borensztein et al, 1998) postulate that FDI will interact with the
stock of human capital already available in the host country to affect economic growth,
and that there is a threshold level of human capital below which FDI contributes little or
may even adversely impact economic growth.
The role of technological advancement in promoting sustainable economic growth in
developing countries has continued to attract great interest from policy makers and
academics. While both domestic and international diffusion of technological knowledge
has been recognised as a crucial factor for long-run economic growth, there are still
concerns as to which of these methods of technological diffusion (described below) is
the most important. In the neoclassical growth theory, long-run economic growth occurs

236
from technological progress and labour force growth, all of which is assumed to be
exogenous. This implies that technology obtained from attracting FDI can only have a
short-run effect on output growth.
The technological gap theory proposed by Gerschenkron (1962) suggests otherwise.
This theory, which is concerned with the difference between technologically advanced
and technologically backward countries, proposes that developing countries can bridge
the technological gap between them and the advanced countries by imitating technology
brought in by MNCs. The theory assumes that there is a level of absorptive capacity (for
example, human capital, i.e. labour that are able to understand and assimilate the foreign
knowledge acquired from advance countries) needed for developing countries to be able
to fill the technological gap. According to this theory, there is a huge cost attached to
obtaining international knowledge, furthermore, the level of human capital
accumulation varies from country to country in the developing world. Therefore, it is
obvious from this line of reasoning, that if a country lacks the sufficient funds to be able
to invest in such domestic capabilities, then they stand a risk of not being able to catch
up with the advanced countries, (Verspagen, 1991).
More recently, the endogenous growth theory argues that, investment in physical and
human capital is crucial for economic growth and increasing returns to these forms of
investment (Lucas, 1988; Romer, 1986, 1993 and Mankiw et al., 1992). In addition,
investment in human capital will lead to increased innovations, which are known to
promote long-run economic growth. This theory pays particular attention to the labour
input of the factors of production, especially when households invest their savings in
both physical and human capital. The new growth theory emphasises the importance of
knowledge in economic growth, and according to Jones (2002), knowledge
accumulation and its progress has been recognised as the engine of economic growth. In
addition, Becker (1993) pointed out that productivity of people in an economy is
changed by investments in education, skills and technology, and this development in the
endogenous growth theory has encouraged researchers to examine the channels through
which FDI promotes economic growth in the long-run (Grossman and Helpman, 1991).
Prominent among the empirical literature on the relationship between FDI and
economic growth are the works of Balasubramanyam et al. (1996) and Borensztein et al.
(1998). According to Balasubramanyam et al. (1996), the factors noted by the new

237
growth theory as growth enhancing can be obtained through FDI if the investment
climate and trade policies found in the host country support the creation of human
capital, therefore, increasing returns to scale and spillover effects, which are crucial
factors in promoting economic growth.
The majority of the empirical analysis on the impact of FDI on economic growth
presents controversial evidence. Many of these studies argue that the degree of
technology transfer or spillovers generating from FDI inflows to the host country
depends on the host country’s absorptive capacity. The term ‘absorptive capacity’ takes
into account the level of economic openness, human development, infrastructural
development, institutions, technology and financial development. These studies show
that host country’s do indeed pass a certain level of ‘threshold’ to be able to benefit
from FDI.
Economic literature recognises economic openness and the availability of human capital
as key determinants of economic growth and that they are an important factor in host
country’s absorptive capacity. In an earlier research, Grossman and Helpman (1990)
argue that an open trade regime is significantly related to good investment climates,
technological spillovers and learning effects. The authors argue that trade contributes to
knowledge largely through the process of imitation of the knowledge capital embedded
in the product. Hence, FDI and trade motivate developed countries to be more
innovative and allow developing countries to draw upon the stock of knowledge of
more developed countries. In a later research Grossman and Helpman (1991) stressed
the role of trade liberalisation as a channel through which output growth can be
promoted. They argue that trade liberalisation leads to an increase in market size when
countries have access to advance technologies and investment, which tends to enhance
the productivity of the country’s resources. According to this line of reasoning, both
trade and FDI can be included in the production function, besides labour and domestic
capital. As a result, a significant empirical literature has evolved on the growth effect of
FDI.
Makki and Somwaru (2004) investigate the effect of FDI inflow on economic growth
through trade openness by interacting FDI with trade openness in 63 developing
countries from 1970-2000. The results indicate both FDI and trade openness are crucial
for enhancing economic growth. Olofsdotter (1998) investigate the growth effect of
238
trade and human capital in a cross-section of 50 developed and developing countries
over the period 1980 to 1990. The results of the analysis suggests that the growth effect
of FDI on economic growth is not dependent on human capital or trade openness as
indicated by the insignificant sign of the coefficient of the interaction terms.
Li and Liu (2005) in a panel data analysis for 84 countries over the period 1970-1999
found that FDI affects growth directly and also indirectly through its interaction with
human capital. They also found a negative coefficient for FDI when it is interacted with
the technology between home and host economies. This implies that a wide technology
gap between the home and host country tends to slow economic growth of the host
countries
While focusing on the effect of spillover in host countries, the literature has been
inconsistent. Most of the literature which focuses on knowledge spillover has excluded
the interaction between openness (trade volume, export or import) and human capital in
host countries as a resulting effect of, and a determinant of, FDI. For example, Lipsey
(1999) found that there is a positive relationship between FDI inflow and per capita
income; however, Jaspersen et al. (2000) found the effect to be negative and Wei (2000)
found the effect to be statistically insignificant. Despite these differences, the literature
on FDI and economic growth has continued to grow. Overall, the general consensus is
that human capital is more significant in promoting the effect of FDI in developing
countries and FDI influences growth in developed countries. However, the evidence
supporting the hypothesis that the efficiency of FDI depends on a minimum level of
human capital is scarce; therefore, the aim of this study is to identify the determinant of
FDI focusing on the interaction between human capital and level of openness, and to
determine the impact of FDI on economic growth in a sample of 30 developing
countries.
5.4 Empirical Model and Data
The general objective of this chapter is to examine the determinant of FDI and its
impact on growth in developing countries, with particular interest in the BRIMC and
SSA countries, within the theoretical framework of an endogenous growth model.
Therefore, this section specifies the model and proposes the hypotheses concerning
239
recipient countries. It also provides a simple description of the data set used in the
empirical investigation.
Following the general objectives outlines in section (5.1), the specific objectives are:
1. To identify the determinants of FDI in the selected developing countries,
2. To examine if the degree of openness and the level of human capital in a country
interact, insofar as the attraction of inward FDI is concerned,
3. To examine the impact of FDI on economic growth, and
4. To examine if the interaction between FDI, openness and human capital promote
economic growth among the selected developing countries.
The study could be divided into two parts. The first part will try and investigate the
determinant of FDI in developing countries while the second part analyzes the impact of
FDI on economic growth in developing countries. The study will carry out quantitative
analysis with the use of econometric tool. In this thesis, I rely on previous studies, in
particular, Borensztein et al., (1995 and 1998); Asiedu, (2002 and 2003) and Campos
and Kinoshita, (2004) to build the relevant variables. Borensztein et al. (1995 and 1998)
argued that the following factors are likely to have important effects on the attraction of
FDI and its impact on economic growth: (i) the interaction between FDI and human
capital; (ii) the annual growth rate of per capita GDP, (iii) the institutional quality, and
(iv) the schooling levels, measured by the average years of male secondary schooling.
Asiedu (2002) used OLS to examine a range of determinants of FDI and found that the
most robust is openness to trade. Higher return on capital and the quality of
infrastructure are also determinants of FDI in the non SSA countries in her sample.
Lastly, Campos and Kinoshita, (2004) found that lagged FDI (persistence, or the length
of time it takes FDI to reach its optimal level), lower cost sites and large GDP accounts
for the determinant of FDI. Following this discussion, I adopt an empirical model
similar to that used by Asiedu (2002) to explore the determinants of FDI and its impact
on economic growth with a specific emphasis on the BRIMC and SSA countries. The
model takes the form:
( , , , , )it it it it it itFDI f SIZE TO HC TELM CPI (5.1)

240
Specifically, the regression estimated is:
1 2 3 4 5it i it it it it it itfdi gdpc to hc telm cpi (5.2)88
To examine whether the interaction between economic openness and human capital
account for the inflow of FDI to developing countries, equation (5.2) is re-written as:
1 2 3 4 5 6( * )it i it it it it itfdi gdpc to hc to hc telm cpi (5.3)
where FDI, GDPC, TO, HC, TELM, CPI and ε stand respectively for the inflow of FDI,
market size, the degree of economic openness, human capital, the level of infrastructure
development, inflation and the error term. The subscripts i = 1, 2...... N, indexes country
and t = 1, 2.... T indexes time. They help distinguish recipient countries and time
periods in the panel. All the explanatory variables in this model are in line with previous
studies such as Noorbakhsh et al. (2001), Edwards, (1990), Borensztein et al. (1998),
Asiedu, (2002), Carkovic and Levine, (2005) and Ng’ang’a, (2005).
From equation (5.3), there are two possible results that can assess the role played by the
interactive term in determining FDI inflow in developing countries.
1. If 2 and
4 have a positive sign in equation (5.3), then openness have an
unambiguously positive effect on FDI, and vice versa. Similarly, If3 and
4
have a positive sign in equation (5.3), then human capital have an
unambiguously positive effect on FDI, and vice versa.
2. If 2 is positive and 4 is negative, then openness has a positive effect on FDI
and this effect diminishes with the improvements in the level of human capital
and vice versa. Similarly, if 3 is positive and
4 is negative, then human
capital has a positive effect on FDI and this effect diminishes with increasing
level of economic openness and vice versa.
The partial effect of openness on FDI is as follows:
2 4 0itit
it
fdihc
to
(5.4)
88 The lower case variables denote the natural log of the respective uppercase variable in the econometric version.

241
Similarly, the partial effect of human capital on FDI is calculated as follows:
3 4 0itit
it
fdito
hc
(5.5)
In relation to equation (5.3), all the explanatory variables are not exogenous. Not only is
market size a determinant of FDI, it is also an endogenous variable which can be
explained by FDI inflows and other variables such as technological change, government
consumption, gross fixed capital formation etc. If the feedback between FDI and market
size is not taken into account, this might result in a bias and inconsistent estimate (see
for instance, Ramanathan, 2002: 544-6). Hence, the following model is estimated:
1 2 3 4 5 6it i it it it it it it itgdpc fdi to hc gc gfcf cpi (5.6)
To test whether the interaction between FDI, openness and human capital promotes
economic growth in the sample countries, the following equation is estimated:
1 2 3 4 5 6 7( * )it i it it it it it it it itgdpc fdi to hc fdi abc gc gfcf cpi (5.7)
where itGDPC is economic growth,89
FDI is the net inflow of foreign direct investment
as a percent of GDP; TO, refers to the degree of economic openness to the world market
(it is measured using trade volume, the total of export and import as a percent of
GDP).90
HC is the stock of human capital, which is measured using adult literacy rate.91
To control for other factors that determine economic growth other than FDI, TO and
HC, I include inflation, physical capital and government consumption. I also account
for the interaction between FDI, human capital and economic openness, (FDI*ABC).92
The above model can be considered as an extension of the Borensztein et al. (1998)
89
GDP has been used as an alternative measure for economic growth. I take the natural log of 1 plus GDP (US $), in
order to avoid taking the natural log of zero. 90
We include the interaction between FDI and Open, so as to test the influence of both variables on economic
growth. As a robustness check, two measures of economic openness are used in our regression: trade volume and
import as a percent of GDP, and both are included in our empirical investigation simultaneously. The most significant
variables will be reported in the final estimation. 91 Adult literacy rate is the percentage of people ages 15 and above who can, with understanding read and write a
short, simple statement on their everyday life. 92 ABC refers to absorptive capacity and includes OPEN and HC. The analysis includes FDI*OPEN and FDI*HC to
measure whether the growth effect of FDI is dependent on economic openness or human capital. FDI*OPEN is the
interaction term meant to capture the effect an open economy is likely to have on the absorptive capacity of FDI
inflows. FDI*HC is the interaction term meant to capture the effect a highly literate workforce is likely to have on the
absorptive capacity of the inflow of FDI.

242
model specification. In the empirical analysis, FDI, economic openness and human
capital are included separately as well as the interaction between them. The natural
logarithm of equations (5.3) and (5.7) has been used in the econometric analysis for ease
of interpretation.
From the model specification, there are three possible results that can assess the role
played by the interactive terms in determining the contribution of FDI in economic
growth.
1. If1 and
4 have a positive sign in the growth equation, then FDI inflows have
an unambiguously positive effect on economic growth and vice versa.
2. If 2 is positive, but
4 is negative, then FDI inflows have a positive effect on
growth, and this effect diminishes with improvements in either trade or the level
of human capital.
3. If 2 is negative and
4 is positive, then this means that the host country has to
achieve a certain threshold level (in terms of either the level of economic
openness or human capital development) for FDI inflows to have a positive
impact on economic growth.
The threshold of the host country’s absorptive capacity is calculated by finding the
partial impact of FDI on Growth as follows:
2 4 0itit
it
gdpcabc
fdi
(5.8)
then the threshold of host country’s absorptive capacity = 2
5
it
it
Equation (5.7) can also be written as:
1 2 3 4 5 6 7 8( * ) ( * )it i it it it it it it it it
it
gdpc fdi to hc fdi open fdi hc gc gfcf cpi
(5.9)
5.4.1 Data
The empirical test is based on 30 developing country recipients of FDI inflows selected
from three regions; Asia, Latin America and Sub-Saharan Africa and a sample of five
fastest growing economies referred to as the BRIMCs over the period from 1980 to

243
2007. The choice of countries and the time period is determined by the availability of
data. In addition, many of the countries implemented various economic reforms
enabling them to manage their economic growth and developmental process during this
period. Due to lack of available and accurate statistical data after 2007, the analysis
ends in 2007. Three criteria have been considered in the selection process of these
countries:
1. Per capita income is within the range described by the World Bank as low
income, low and middle income and upper middle income countries for the
period of study.
2. For comparison, the selected countries from Asia and Latin America achieved
somewhat higher growth performances, compared to the countries in Sub-
Saharan Africa.
3. The BRICs economies, alongside Mexico, have also been included in the sample
of developing countries.93
This is because, these economies, in recent times,
have emerged as an important economic power, as well as FDI recipient.
The data consist of real GDP per capita income, (which is used to proxy market size),
openness measured using trade flows (imports and exports of goods and services) as a
ratio of GDP,94
and finally, human capital (HC, adult literacy rate). I account for
differences in macroeconomic policies and the size of government in the host countries
by including inflation rate (CPI) and government consumption (GC) as control
variables. I also include physical capital, measured using gross fixed capital formation
(GFCF), as a control variable. The rationale is that, FDI is determined by sound and
stable macroeconomic environments and its impact on economic growth is influenced
by sound macroeconomic policies and institutional quality. As is standard in the
literature, the ratio of FDI to GDP (net FDI inflows) is used as the dependent variable.
The data used in the regressions have been retrieved from (World Bank’s World
Development Indicators (WDI) online database, UNCTADs’ World Investment Report
(WIR), Penn World Table versions 6.3, International Monetary Statistics, International
Financial Statistics and UNESCO UIS data). In addition to being authoritative sources,
these data sets are readily accessible. A list of the economies integrated in the sample,
93 The BRIMCs are the fastest growing economies and they include Brazil, Russia, India, Mexico and China. 94 As an alternative measure of openness, I include export as a ratio of GDP.

244
the variables used in the empirical test and the data sources themselves are presented in
Appendix V.
5.4.2 Economic Assumptions Underlying the Models and Testable hypothesis
Market Size: The size of a host market, which also represents the host country’s
economic conditions and the potential demand for their output as well, is an important
element in FDI decision-makings. In market-seeking FDI, the primary objective of
MNCs is to serve the domestic market. Therefore, market demand in a host country
plays an important in attracting this sort of FDI. According to the literature, this sort of
FDI usually flows to host countries with high incomes and large markets such as
countries with a 2007 GNI between US $2,936 – US $9,075 which the World Bank
refers to as Upper middle countries.95
The importance of market size has been
confirmed in many previous empirical studies (Schneider and Frey, 1985; Wheeler and
Mody, 1992; Tsai, 1994; Wei, 2000). Although there is no precise measure of
economic size, economists tend to use GDP to proxy it (see Johanson and Wiedersheim-
Paul, 1975 and Lipsey, 2000). According to Root and Ahmed (1979), the use of total
GDP as an indicator of a host country’s market size and potential is relatively poor
because this measure reflects the size of the population and not the income level.
Moreover, Chakrabarti (2001) found evidence to show that GDP per capita is a more
robust measure than total GDP. Therefore, this study uses real GDP per capita.96
The
coefficient of market size is expected to be either positive or negative depending on
whether FDI is market-seeking or non market-seeking.
Openness: Globalisation has increased the access to goods and services and has led to
most developing countries generating policies that are conducive to foreign trade and
investments which are favourable to foreign investors. The parameter α2 captures the
influence of the degree of openness of the host country on the flows of FDI it receives.
In the literature, the ratio of trade to GDP (exports plus imports over GDP) is often used
to proxy the degree of openness (see Asiedu, 2002).This ratio suggests how a country is
being integrated into the new economic order and it is also important for foreign direct
95 As shown in Appendix V, the countries included in the sample are mostly low and lower middle income countries
with a 2007 GNI of US $735 and US $2,935, respectively. These incomes are not particularly high, suggesting that
FDI is less likely to be market-seeking in these countries. 96 As a measure of robustness, this study uses GDP growth to measure market size (GGDP)

245
investors who are motivated by the export market. Empirical evidences (Edwards, 1990
and Gastanaga et al., 1998) found that economic openness positively affects FDI inflow.
This study therefore includes the ratio of trade to GDP as a measure of openness. A
priori, the coefficient α2 is expected to be positive.
Human Capital: Foreign investors are concerned with the quality of the labour force in
addition to its costs. In fact, the cost advantages accrued by lower wages in developing
countries can well be mitigated by low skilled workers. The abundance of an educated
labour force is important to be able to absorb foreign technologies and educated labour
force increases productivity and therefore stimulates FDI.97
A high level of human
capital indicates the availability of skilled labour force and vice versa, which, along
with cheap labour can significantly promote the location advantage98
of a host country.
Root and Ahmed (1979), Schneider and Frey (1985), Borensztein et al, (1998),
Noorbakhsh et al. (2001) and Asiedu (2002) found that the level of human capital is a
significant determinant of the location advantage of a host country and plays a key role
in attracting FDI. Following the literature, this study uses adult literacy rate99
as a proxy
for the level of human capital. I expect the sign of the coefficient to be positive.
Infrastructure100
: Good infrastructure provides the potential for investors to access
distant location and to exploit scope economies. According to Morisset (2000), good
infrastructure increases the productivity of investments and, therefore, stimulates the
inflow of FDI. The quality of infrastructure, however, is an important determinant of
FDI in developing countries (Asiedu, 2002). Availability of infrastructures such as
roads, communication facilities and electricity should increase productivity and also
increase the attraction of FDI inflow. This study uses the natural log of the number of
telephone and mobiles available per 1,000 people (TELM) as a proxy for the quality of
97 Asiedu (2003) found a positive relationship between human capital and FDI in SSA. 98 See Dunning (1997). 99
Although most previous studies used secondary school enrolment and average years of schooling as a measure of
human capital, the unavailability or limited data for SSA countries makes it difficult for meaningful econometrics
exercise. Hence, this thesis uses adult literacy rate. According to Miyamoto (2003), Adult literacy is a good indicator
to capture some extent of human capital for least developed countries where a large number of the population lacks
basic education. Following UNESCO (2008), Adult literacy rate equals 100 minus illiteracy rate. 100 I take the natural log of 1 plus telephone subscribers, in order to avoid taking the natural log of zero. Widely used
in the literature to proxy the quality of infrastructure is telephone mainlines (per 1000 people), however, this measure
of infrastructure only accounts for the total number of fixed lines available, whereas, telephone subscribers account
for a total of both fixed lines and mobiles available. Another alternative measure for quality of infrastructure is the
percentage paved roads in a country. This variable can be misleading for developing countries, that is, if there is one
main road in the country and it is paved, then the value for this will be 100. Thus, only large values may not
necessarily indicate better infrastructure.
246
infrastructure.101
The motivation underlying this proxy is that countries with ‘large
number of telephone lines are more likely to have better roads, modern airport/seaports,
internet access, and water/electricity supply’ (Onyeiwu, 2003: 6). It is worthy to note
that, as well as the availability of the infrastructure, the reliability102
of the infrastructure
(for instance, the frequency of power or telephone outages) is also a key indicator of the
overall quality of infrastructure. Unfortunately, qualitative data is not readily available,
for most developing countries, to assess this infrastructure reliability. TELM is expected
to be positively correlated with FDI, as good infrastructure augments the efficiency of
investment, and therefore attracts FDI, especially efficiency-seeking FDI.
The interaction between Openness and Human Capital103
: There is a strong empirical
evidence of a positive relationship between openness and the level of educational
attainment of the labour force. It is argued that to be able to absorb the new technology
and skills that come along with locating an MNC in a developing country, there is a
need for a significant level of human capital. This is because, the availability of skilled
workers is important for attracting FDI because it can boost the international
competitiveness of a host country. Therefore, the interaction between economic
openness and human capital is derived by multiplying trade as a ratio of GDP with
average literacy rate. There is no a priori to make about the sign of the coefficient of the
interaction term in the FDI equation. Meanwhile, the interaction term is expected to be
positive in terms of the impact of FDI on economic growth.
Inflation: One indicator of a stable macroeconomic environment is the record of price
stability. During the 1980s and 1990s, many developing countries exhibited high
inflation rates and excessive budget deficits. High inflation rates reduce the level of
uncertainty encountered by investors and increases the level of confidence in the
economy, which encourages FDI. However, the literature suggests that economies with
low inflation histories signal to investors how committed and credible the government
is. The implication here is that high inflation rates will be a deterrent to would be
investors. Thus, countries have embarked on stabilisation programs in order to bring
101 The number of telephones available per thousand people can also be used to proxy the quality of infrastructure.
This study uses the number of telephones available per thousand people as an alternative. 102
According to Adenikinju (2003), poor services from government owned Power Holding Company of Nigeria
(PHCN) causes severe problems for manufacturing companies in Nigeria. 103 TO*HC is an interaction term meant to capture the effect a highly literate work force is likely to have on
economic openness. It is also used to capture the effect a highly skilled workforce is likely to have on the absorptive
capacity of economic openness (technology, knowledge, etc.).

247
inflation rapidly under control. According to the literature, on average, the lower the
average inflation rate is in a host country, the more successful the stabilisation program
and the faster GDP growth returned to positive levels. Several empirical studies have
supported the view that macroeconomic instability is unfavourable to FDI attraction (for
instance, Asiedu, 2003). Following the literature, I use the annual change in the
consumer price index (CPI) to proxy inflation and the expected sign of the coefficient is
negative, ceteris paribus.
The dependent variable, FDI, is measured as the net inflow of FDI104
expressed as a
percent of GDP, The dependent variable, FDI, is measured as the net foreign direct
investment inflow as a percentage of GDP and is a widely used measure (see Asiedu,
2002; Goodspeed et al, 2006).
In terms of the relationship between FDI and growth, theoretical literature shows that
FDI has a positive impact on economic growth because it serves as a channel through
which technological knowledge is transferred from one country to another, thus, it
increases output growth and GDP in the host country. Previous empirical studies have
also found a positive relationship between economic growth and FDI in developing
countries (see Blomstrom et al., 1994); therefore, I expect a positive relationship
between economic growth and FDI. Openness to international trade allows developing
countries to benefit from technology spillovers, such as through the stock of knowledge
embedded in trade or FDI and this is likely to increase the number of specialised input,
thereby increasing output growth in the long-run. Previous studies have debated that the
degree of openness positively affects economic growth. However, there is a priori, the
sign of the coefficient of β2 is depends on whether the host country is open to trade or
not.
The stock of human capital in a host country is critical for absorbing foreign knowledge
and an important determinant of whether potential spillovers will be realised. Previous
empirical studies suggest that the impact of human capital on growth is positive
therefore, the coefficient β3 is expected to be positive in advancing growth. I also
104 According to Borensztein et al. (1998), the choice of FDI variable depends on the type of FDI effect a researcher
is trying to uncover. Thus, when trying to analyse the impact of technology transfer and knowledge spillover, it is
assumed that the use of FDI net inflow will provide a more detailed analysis, as opposed to net FDI outflow. For this
reason, FDI net inflow has been used in the regression.

248
account for the interaction of FDI with trade and human capital. Past evidence show that
FDI, trade and human capital have a positive impact on economic growth in developing
countries. Maki and Somwaru (2004) suggest that the flow of technology brought in by
FDI can lead to a positive growth in a country if FDI interacts with the country’s trade.
Accordingly, the positive impact of the interaction of FDI and trade on economic
growth may result from FDI being attracted to countries that are expected to growth
faster and that also follow open trade policies. Therefore, studying the interaction
between FDI and openness is important especially in developing countries. The
expected sign of the coefficient of β4 is positive. I also expect the sign of the coefficient
of β5 to be positive.
I account for the type of institution available in the host country by using government
consumption. It includes: spending on defence, administration and goods and services
provided from outside suppliers. (Sala-i-Martin, 1995) note that the spending on goods
such as housing and the salaries of public employees may directly, or indirectly, crowd
out private consumption and thus, have a negative impact on output growth. However, if
the spending is on education, this may in the long-run lead to a positive spillover into
domestic investment, in the form of a better educated workforce which is required to
absorb the benefits of FDI, and, thus, positively affect growth. Hence, the sign of the
coefficient of β6 depends on whether government consumption crowds out or crowds in
foreign investment. The coefficient of β7 is expected to be positive. According to the
literature, investment plays an important role in the impact of FDI on economic growth.
As a result, studies try to answer whether FDI crowds in or crowds out domestic
investment. In this study, gross fixed capital formation is used to proxy domestic
investment. The expected sign of the coefficient of β7 depends on whether FDI is a
complement or supplement of domestic investment.
According to the literature, the rate of inflation is a key indicator of monetary policies in
a country. A lower inflation rate implies a good investment climate while a higher
inflation rate suggests poor investment climate. The sign of β8 is expected to be
negative.
249
5.4.3 Empirical Strategy
The methodology used in this chapter is based on the panel data techniques. The use of
panel data techniques allows us to determine the temporal evolution of groups of
countries rather than analyzing the temporal behaviour of each of them. Panel data takes
into account the individual/country heterogeneity, allows a larger number of data points
and improves the efficiency of the estimates. Panel data may have group effects, time
effects, or both. These effects are either fixed effect (FE) or random effect (RE). A fixed
effect model assumes differences in intercepts across groups or time periods, whereas a
random effect model explores differences in error variances. In panel data analysis, if
the unobserved country-level effects are correlated with the vector of explanatory
variables, the fixed effects is the appropriate estimation technique. Otherwise random
effects will suffice.
In equation (5.2 and 5.3), α1 is included to control for unobserved (country level) effects
across countries i.e. to account for country heterogeneity in the sample. In estimating
the equation, there is a need to take into account that some of the explicative variables
might be correlated with country-specific or region-specific effects. This might imply
the presence of endogeneity. If endogeneity is found, the FE estimation will give a
consistent estimate and the RE estimation will not. This can be accessed through the
Hausman test of no-correlation between the vector of explanatory variables and α1. The
Hausman specification test compares the fixed versus random effects under the null
hypothesis that the individual effects are uncorrelated with the other regressors in the
model (Hausman 1978). If the null hypothesis is rejected (H0 is correlated), the
Hausman test would show that some of the explicative variables in equation (5.3) are
correlated with the error term it . That is to say, a random effect model produces biased
estimators, violating one of the Gauss-Markov assumptions; so a fixed effect model is
preferred. However, non-rejection of random effects implies that both approximate each
other and either can be used (Wooldridge, 2006). The results of the Hausman test105
recommend the use of fixed effects model.
105
The Hausman specification test compares the fixed versus the random effects under the null hypothesis that the
coefficient estimated by the efficient random effects estimators are the same as the ones estimated by the consistent
fixed effects estimators. More clearly, H0: difference in coefficients not systematic. Chi2(6) = (b-B)’[(V_b-V_B^(-
1)](b-B) = 23.06 and Prob>chi2 = 0.0008. Thus, the significant p-value suggests using the fixed effect estimator.

250
5.5 Empirical results and interpretation
To empirically assess the determinant of FDI and its impact on economic growth,
equations (5.3) and (5.7) will be estimated using the appropriate econometric technique.
The empirical investigation will first cover the determinants of FDI, and then the impact
of FDI on economic growth will be considered.
5.5.1 Basic statistics
Table 5-5, panel A-C gives summary statistics of the variables included in the
regression and panel D shows the correlation matrix for all the explanatory variables
and net inflow of FDI, the dependent variable. The correlation matrix in Table 5-5d
gives a first but crude approximation of the relationship between FDI and its
determinants. The essence is to identify potential sources of multicollinearity in the
estimation model. The Table shows that FDI is positively correlated with indicators of
market size (LNGDPC), the ratio of trade to GDP, human capital, the interaction term,
infrastructure quality and inflation. In addition, the Table also shows that the
relationship between FDI and indicators of interaction is particularly strong. It indicates
that the correlation between FDI and market size (LNGDPC) is fairly strong. The same
applies to trade and human capital. The correlation between infrastructure quality and
inflation is not that strong, as shown by the size of the coefficient. The correlations
between FDI and the variables included in equation (5.3) are further illustrated in Figure
5-3. The low value of the correlation coefficient is not sufficient to conclude about the
lack of a strong relationship between two variables under consideration. Therefore, I
present some regression specifications to confirm that there is a link between FDI,
openness and human capital, specifically, when human capital interacts with openness
and likewise the link between economic growth and FDI.
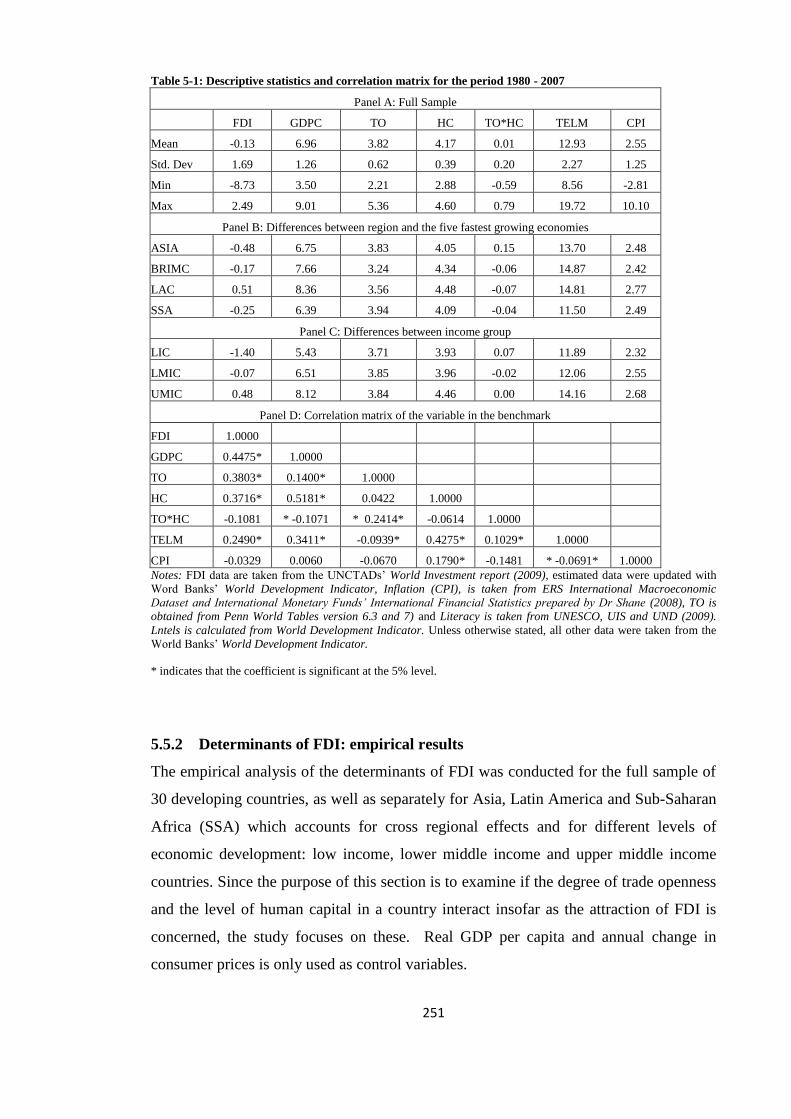
251
Table 5-1: Descriptive statistics and correlation matrix for the period 1980 - 2007
Panel A: Full Sample
FDI GDPC TO HC TO*HC TELM CPI
Mean -0.13 6.96 3.82 4.17 0.01 12.93 2.55
Std. Dev 1.69 1.26 0.62 0.39 0.20 2.27 1.25
Min -8.73 3.50 2.21 2.88 -0.59 8.56 -2.81
Max 2.49 9.01 5.36 4.60 0.79 19.72 10.10
Panel B: Differences between region and the five fastest growing economies
ASIA -0.48 6.75 3.83 4.05 0.15 13.70 2.48
BRIMC -0.17 7.66 3.24 4.34 -0.06 14.87 2.42
LAC 0.51 8.36 3.56 4.48 -0.07 14.81 2.77
SSA -0.25 6.39 3.94 4.09 -0.04 11.50 2.49
Panel C: Differences between income group
LIC -1.40 5.43 3.71 3.93 0.07 11.89 2.32
LMIC -0.07 6.51 3.85 3.96 -0.02 12.06 2.55
UMIC 0.48 8.12 3.84 4.46 0.00 14.16 2.68
Panel D: Correlation matrix of the variable in the benchmark
FDI 1.0000
GDPC 0.4475* 1.0000
TO 0.3803* 0.1400* 1.0000
HC 0.3716* 0.5181* 0.0422 1.0000
TO*HC -0.1081 * -0.1071 * 0.2414* -0.0614 1.0000
TELM 0.2490* 0.3411* -0.0939* 0.4275* 0.1029* 1.0000
CPI -0.0329 0.0060 -0.0670 0.1790* -0.1481 * -0.0691* 1.0000
Notes: FDI data are taken from the UNCTADs’ World Investment report (2009), estimated data were updated with
Word Banks’ World Development Indicator, Inflation (CPI), is taken from ERS International Macroeconomic
Dataset and International Monetary Funds’ International Financial Statistics prepared by Dr Shane (2008), TO is
obtained from Penn World Tables version 6.3 and 7) and Literacy is taken from UNESCO, UIS and UND (2009).
Lntels is calculated from World Development Indicator. Unless otherwise stated, all other data were taken from the
World Banks’ World Development Indicator.
* indicates that the coefficient is significant at the 5% level.
5.5.2 Determinants of FDI: empirical results
The empirical analysis of the determinants of FDI was conducted for the full sample of
30 developing countries, as well as separately for Asia, Latin America and Sub-Saharan
Africa (SSA) which accounts for cross regional effects and for different levels of
economic development: low income, lower middle income and upper middle income
countries. Since the purpose of this section is to examine if the degree of trade openness
and the level of human capital in a country interact insofar as the attraction of FDI is
concerned, the study focuses on these. Real GDP per capita and annual change in
consumer prices is only used as control variables.

252
Table 5-6 reports the pooled cross-section (POLS), fixed (FE) and random effects (RE)
models results. Across the three estimation methods only four variables are consistently
significant determinants of FDI – TO, HC, TO*HC and TELM – and all have the
expected sign. The implication of this is that, countries with higher trade volumes, high
level of human capital and better infrastructure are likely to attract more FDI. The result
of the interaction term suggests that increase in openness and human capital leads to
smaller increase in FDI inflows. The significant but negative sign of the coefficient of
the interaction term suggests that both trade openness and human capital are substitutes.
GDPC also appears significant and the correct positive sign as expected (POLS and RE
estimates). The evidence provided in Table 5-6 suggests that trade openness is the major
determinant factor.
Table 5-2: Determinants of FDI in developing countries
Dependent variable: FDI/GDP
Notes: P-values are in parenthesis. *, **, *** indicate 10%, 5% and 1% significance level, respectively. Pooled OLS
estimates are based on robust standard error. All specifications include a constant term. All variables are in logarithm
form
Variables POLS FE RE
GDPC 0.364*** 0.406 0.235**
(0.00) (0.19) (0.06)
TO 1.135*** 1.441*** 1.475***
(0.00) (0.00) (0.00)
HC 0.567*** 1.767*** 1.242***
(0.01) (0.00) (0.00)
TO*HC -1.979*** -2.079*** -2.077***
(0.00) (0.00) (0.00)
TELM 0.119*** 0.286*** 0.252***
(0.00) (0.01) (0.00)
CPI -0.057 -0.038 -0.066
(0.14) (0.44) (0.16)
F 72.520
No of Countries 30 30 30
Observation 677 677 677
R-sq 0.384
within 0.315 0.312
between 0.501 0.503
overall 0.352 0.361
253
Table 5-7 reports the result of the FE model since the Hausman (1978) test suggests
using fixed-effects instead of a random-effects model. To identify the determinants of
FDI, variables are included in the model using a stepwise approach. In Specification 1, I
estimate only three variables: GDP per capita, openness and human capital. The
estimated model shows that the coefficients of all the three variables are as expected,
positive and significant.106
In specification 1, a 1 percent increase in per capita GDP in
the developing countries leads to about 0.76 percent increase in FDI. This is an
indication that FDIs flowing to the countries in our sample are indeed market-seeking.
The finding is in line with the postulation by Chakrabarti (2001), Al Nasser and Gomez
(2009) and also confirms the earlier findings by Schneider and Frey (1985). Similarly, a
1 percent increase in the level of trade openness increases FDI by about 1.56 percent.
This supports the hypothesis that trade openness has a significantly positive impact on
the flow of FDI. The result is consistent with the earlier findings of Asiedu (2002),
Onyeiwu (2003) and Anyawu (2011) who all demonstrate that countries that are highly
open are more likely to attract greater proportion of FDI. The findings also indicate that
a 1 percent increase in human capital leads to a 2.70 percent increase in FDI. This
supports the hypothesis that literacy rate has a significantly positive impact on the flow
of FDI. This is an indication that countries with an educated labour force that is skilled
in the operation of recent production technologies tend to attract larger share of FDI.
The finding is in line with the postulation by Miyamoto (2003) that the level of human
capital is a crucial factor for MNCs when making location decisions as it reduces the
costs of training employees. Noorbakhsh et al. (2001) and Nunnenkamp (2002) find
human capital to be a significant determinant of FDI inflows confirming previous study
by Schneider and Frey (1985) and Root and Ahmed (1979). By implication, countries
with a familiar environment and a high human capital, which is also open to economic
integration, are more likely to be successful in attracting FDI.
Specification 2 includes the interaction between openness and human capital. The result
indicates that the coefficient of the interaction term is negative but statistically
significant. The negative sign of the coefficient indicates that openness and human
capital are substitute rather than complements. Specification 3 includes the measures for
infrastructure development (TELM) and macroeconomic stability (CPI). Here, the result
suggests that the effect of infrastructural development is statistically significant and the
106
A similar result was obtained when GDP was used in the regression.

254
coefficient is positive and confirms previous findings.107
The coefficient of inflation is
negative, however it is statistically insignificant. The result in specification 4 indicates
that all variables with the exception of GDP per capita are consistently significant in
determining FDI. In Specification 5, all the variables have the correct sign. The main
implication from the results obtained in Table 5-7 is that, countries with high level of
human capital that are open to the world and with a better infrastructure attract more
FDI. The interaction between openness and human capital suggests lower level of FDI
in developing countries.
Table 5-3: Determinants of FDI in developing countries
Dependent variable: FDI/GDP
Notes: P-values are in parentheses. *, **, *** indicate 10%, 5% and 1% significance level, respectively. All results
derived using fixed effects model estimation. All variables are in logarithm form.
107 See Asiedu (2002) and Ng’ang’a (2005).
Variables Spec (1) Spec(2) Spec (3) Spec (4) Spec (5)
GDPC 0.755*** 0.871*** 0.324 0.401 0.406
(0.00) (0.00) (0.30) (0.20) (0.19)
TO 1.559*** 1.703*** 1.326*** 1.474*** 1.441***
(0.00) (0.00) (0.00) (0.00) (0.00)
HC 2.703*** 2.686*** 1.850*** 1.804*** 1.767***
(0.00) (0.00) (0.00) (0.00) (0.00)
TO*HC
-1.952***
-2.011*** -2.079***
(0.00) (0.00) (0.00)
TELM
0.272*** 0.296*** 0.286***
(0.02) (0.01) (0.01)
CPI -0.002
-0.038
(0.97) (0.44)
Constant -22.666*** -23.916*** -18.761*** -19.955*** -19.471***
(0.00) (0.00) (0.00) (0.00) (0.00)
No. of Countries 30 30 30 30 30
Observation 684 684 677 683 677
R-sq
within 0.284 0.308 0.288 0.314 0.315
between 0.517 0.556 0.430 0.513 0.501
overall 0.328 0.349 0.310 0.353 0.352
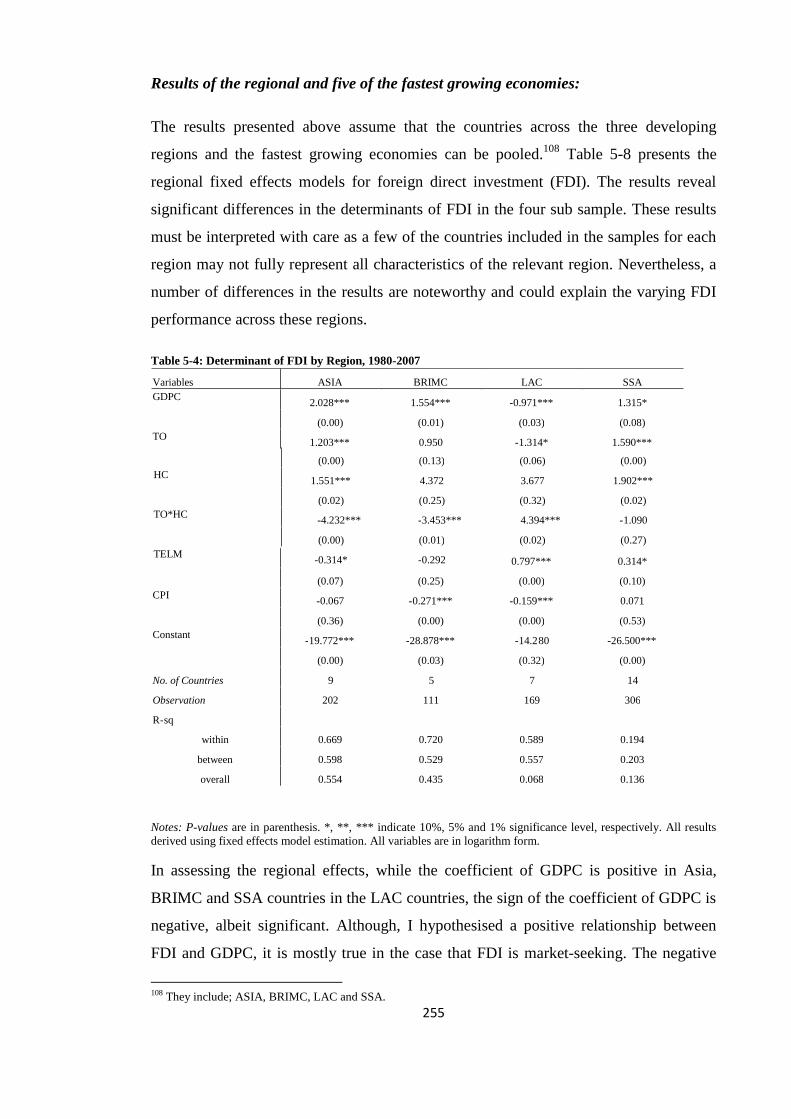
255
Results of the regional and five of the fastest growing economies:
The results presented above assume that the countries across the three developing
regions and the fastest growing economies can be pooled.108
Table 5-8 presents the
regional fixed effects models for foreign direct investment (FDI). The results reveal
significant differences in the determinants of FDI in the four sub sample. These results
must be interpreted with care as a few of the countries included in the samples for each
region may not fully represent all characteristics of the relevant region. Nevertheless, a
number of differences in the results are noteworthy and could explain the varying FDI
performance across these regions.
Table 5-4: Determinant of FDI by Region, 1980-2007
Notes: P-values are in parenthesis. *, **, *** indicate 10%, 5% and 1% significance level, respectively. All results
derived using fixed effects model estimation. All variables are in logarithm form.
In assessing the regional effects, while the coefficient of GDPC is positive in Asia,
BRIMC and SSA countries in the LAC countries, the sign of the coefficient of GDPC is
negative, albeit significant. Although, I hypothesised a positive relationship between
FDI and GDPC, it is mostly true in the case that FDI is market-seeking. The negative
108 They include; ASIA, BRIMC, LAC and SSA.
Variables ASIA BRIMC LAC SSA GDPC 2.028*** 1.554*** - 0.971*** 1.315*
(0.00) (0.01) (0.03) (0.08) TO 1.203*** 0.950 - 1.314* 1.590***
(0.00) (0.13) (0.06) (0.00) HC 1.551*** 4.372 3.677 1.902***
(0.02) ( 0.25) (0.32) (0.02) TO*HC - 4.232*** - 3.453*** 4.394*** - 1.090
(0.00) (0.01) (0.02) (0.27) TELM - 0.314* - 0.292
0.797*** 0.314* (0.07) (0.25) (0.00) (0.10)
CPI - 0.067 - 0.271*** - 0.159*** 0.071 (0.36) (0.00) (0.00) (0.53)
Constant - 19.772*** - 28.878*** - 14.2 80 - 26.500*** (0.00) (0.03) (0.32) (0.00)
No. of Countries 9 5 7 14 Observation 202 111 169 306 R - sq
within 0.669 0.720 0.589 0.194 between 0.598 0.529 0.557 0.203 overall 0.554 0.435 0.068 0.136
256
effect of GDPC in the LAC could imply that the flow of FDI towards this region is non-
market-seeking and more likely to be resource or efficiency-seeking. The ECLAC 2003
report gives a thorough explanation of the current trends and investment environment in
Latin America, and explains the reason as to why current corporate strategies and
national policies used are hindering growth and development in the region.
Farrel (2004) makes the argument that both, incentives used to attract foreign direct
investment and the restrictions placed on it, are largely ineffective. This particular
research demonstrates that regardless of policy regime or the industry, FDI can benefit
developing countries greatly. To make the most of it, however, these countries must
strengthen the foundation of their economies, including infrastructure, their legal and
regulatory environments, and the level of competition in their local markets. On the
contrary, Amal et al., (2010) found a a positive and significant relationship between
GDP per capita and FDI inflows to Latin American countries.
The results indicating the effect of openness on FDI have also been found to be mixed.
While the relationship shows that FDI and openness are complementary in Asia and
SSA, they are substitutes in the LAC countries. The coefficients are statistically
significant in the three regions. The effects of human capital, as measured by adult
literacy rates, is positive across the region, however it is only significant in Asia and
SSA. The result of the positive and significant effect of human capital on FDI in Asia
and SSA countries is similar to that of Ghura and Goodwin (2000), who also reports a
positive and significant effect, however the result obtained for the LAC contradicts
Ghura and Goodwin (2000), who finds a negative and statistically significant effect.
The interaction between openness and human capital is positive and statistically
significant in LAC. In the LAC countries, the estimated parameter of openness is
negative, whereas the interaction term of openness with human capital is significant and
positively related to FDI. These facts suggest that a minimum level of human capital is
required for openness to contribute positively to FDI inflows. From the table, the human
capital threshold required equals 1.35.109
This suggests that all economies with adult
literacy above 1.35 will benefit positively from trade openness. The estimated parameter
109 By taking the derivative of the FDI equation with respect to trade openness (TO), setting them equal zero. By
solving it for the level of human capital (LNHC) required, the total effect of TO on FDI is positive. This is yielding
the human capital threshold, equal to 0.30. By taking the exponential of this value, the certain level of human capital
will equal 1.35.

257
in Table 5-8 suggests that increase in openness and human capital leads to a decrease in
FDI inflows in Asia. This column shows that the human capital variable appears to have
a significant positive impact on FDI. This implies that a high level of human capital
tend to be important determinant of FDI in Asia as suggested by a number of empirical
studies.
Although trade openness and human capital have a positive impact on FDI in BRIMCs,
the coefficient is statistically insignificant. With regards to the effect of the interaction
term, the coefficient is negative and significant, all else being equal. The relationship
between infrastructure development and FDI varies across the regions. The results
indicate the effect of telephone and mobile subscribers is positive and significant in
determining FDI inflows to LAC and SSA countries. This finding is supported by
Kolstad and Villanger (2008), who use mobile phones to measure infrastructure and
find a positive influence on FDI in the Caribbean. In Asia however, the relationship is
negative and its effect, is significant. A positive effect was expected; therefore, this
negative relationship cannot be explained. Regarding the macroeconomic stability
variable, inflation was significant (at 1 percent in BRIMC and LAC countries) and
registered its expected sign, which is negative. For the case of BRIMC and LAC
countries, increases in inflation results in decreases in the attraction of FDI. This result
is as expected because some of the countries in this region have been characterised by
high inflation. The results also show that inflation has a statistically significant effect on
the attraction of FDI in both regions. The result indicates that the impact of inflation on
FDI is positive, but insignificant in SSA. The positive sign of the coefficient is contrary
to the expectation. Although a positive sign of inflation is quite surprising, the result
provides support to theoretical vagueness regarding the impact of inflation on FDI.
According to the literature, countries with low inflation rates are expected to attract
more FDI because macroeconomic risks are much lower in these countries.
Comparing the estimated parameters of the interaction terms as among Asia, BRIMCs,
Latin America and SSA countries, one can see that in most cases the results provide
support for the economic theory. The reported results indicate that the slope coefficients
of the interaction of trade openness and human capital in Asian countries, which is
negatively signed and significantly different from zero at the 1 percent significant level,
have lower value (negative value) than those of BRIMC and SSA countries which are

258
all negatively signed. Considering LAC countries, the interaction term is positive and
highly significant and has a higher value than in Asia, BRIMC and SSA countries.
I can therefore conclude that the marginal gain of FDI from increased economic
openness and a high level of human capital are higher in LAC countries than in Asia,
BRIMC and SSA countries. The lowest gain of all is in Asian countries. The
magnitudes of the respective slope coefficients are reasonably robust to various
specifications. The specific magnitude of the value obtained on the coefficient indicates
that the effect obtained from the interaction term is higher in LAC countries than other
regions.110
Income groups results
The results in table 5-9 presents the parameter estimates for 7 low income countries, 10
low and middle income countries and 13 upper middle income countries.
Table 5-5: Determinant of FDI by income group, 1980-2007
Notes: P-values are in parenthesis.*, **, *** indicate 10%, 5% and 1% significance level, respectively. All variables
are in logarithm form.
110
This conclusion is based on the selected sample of developing countries in this analysis.
Variables LIC LMIC UMIC
GDPC 1.919 2.475*** 0.188
(0.34) (0.00) (0.53)
TO 2.072*** 1.025*** 1.582***
(0.01) (0.00) (0.00)
HC 1.304 2.042*** -4.604***
(0.43) (0.00) (0.01)
TO*HC 0.007 -2.028*** -3.210***
(1.00) (0.00) (0.00)
TELM 0.404 0.113 0.550***
(0.34) (0.47) (0.00)
CPI -0.175 0.236*** -0.106***
(0.40) (0.02) (0.02)
Constant -29.119*** -30.182*** 5.863
(0.01) (0.00) (0.41)
No. of Countries 7 10 13
Observation 154 227 296
R-sq
within 0.305 0.445 0.388
between 0.049 0.636 0.217
overall 0.120 0.462 0.211

259
The table indicates that GDPC, TO, HC and TO*HC have a positive coefficient,
however only trade openness is statistically significant. In this survey, trade openness
seems to be the most important determinant of all in low income countries. The results
of the determinant of FDI for the low and middle income countries indicate that market
size, human capital and economic openness are important for the attraction of FDI
whereas the interaction between open and human capital discourages FDI. The result
also indicates that a stable macroeconomic environment encourages the inflow of FDI.
In upper middle income countries, openness is more important in determining FDI
inflow as compared to infrastructural development. The level of human capital, its
interaction with openness and macroeconomic stability (high inflation) discourages FDI.
The results obtained in the table shows that trade openness is significantly and
positively related to economic growth, confirming empirical studies such as
Balasubramanyam et al. (1996) and Makki and Somwaru (2004). The degree of
openness is an indicator that reflects how open the local market is, so that a higher level
of openness is often associated with greater market discipline and additional outlets for
goods and services produced by domestic firms (Elboiashi, 2011:147). The results show
that, in upper middle income countries, trade openness and human capital are substitutes
where the attraction of FDI is concerned.
5.5.3 Impact of FDI on economic growth: empirical results
I note that the FDI equation might suffer from the simultaneity bias problem, probably
because a large size of GDP per capita not only attracts FDI, but FDI inflow also affects
the size and growth of GDP as well as trade openness. Thus, it is necessary to estimate
the economic growth equation. Table 5-10a-d provides a summary statistic of the
variables used in the growth equation. Table 5-10d presents the correlation matrix for all
the explanatory variables and growth as dependent variable. The correlation matrix
provides a first crude expectation of the relationship between these variables. The table
indicates that growth has a weak linear relationship between real GDP per capita and
each explicative variable. The low value of the correlation is not sufficient to conclude
about the lack of a strong relationship between two variables under consideration, as
such, I provide some regression specification to confirm that there is a link between real
GDP per capita and FDI.

260
Table 5-6: Impact of FDI on economic growth: Descriptive statistics
Table 5-11 report the results for estimating equation (5.7) using POLS, FE and RE
estimation method. The result in the POLS estimates indicate that FDI is positive and
statistically significant in promoting economic growth in the sample of countries. The
positive relationship is consistent with the literature (see De Gregorio, 1992;
Borensztein et al., 1995 and 1998). From these results, trade has a negative and
insignificant relationship with economic growth. This is contrary to previous research
such as Li and Liu (2004) who report a positive influence of trade on economic growth
in 84 developed and developing countries. Further, the result indicates that the
coefficient of the interaction terms (FDI*TO and FDI*HC) are positive and statistically
significant. In theory, trade openness and the quality of human capital are important for
host country in absorbing the spillovers from FDI. According to table 5-11, the positive
effect of FDI on economic growth in our sample is motivated by an open economy. The
interaction between FDI and human capital indicate a positive and significant
Panel A: Full Sample
GDPC FDI OPEN HC FDI*HC FDI*TO GC GFCF CPI
Mean 6.96 -0.13 3.82 4.17 0.24 0.40 2.54 3.03 2.55
Std. Dev 1.26 1.69 0.62 0.39 0.83 1.04 0.39 0.33 1.25
Min 3.50 -8.73 2.21 2.88 -3.10 -2.56 1.09 0.93 -2.81
Max 9.01 2.49 5.36 4.60 7.90 5.92 3.46 3.85 10.10
Panel B: Differences between region and the five fastest growing economies
ASIA 6.75 -0.48 3.83 4.05 0.57 0.82 2.31 3.09 2.48
BRIMC 7.66 -0.17 3.24 4.34 0.22 0.40 2.65 3.27 2.42
LAC 8.36 0.51 3.56 4.48 0.20 0.12 2.60 3.02 2.77
SSA 6.39 -0.25 3.94 4.09 0.05 0.28 2.68 2.98 2.49
Panel C: Differences between income group
LIC 5.43 -1.40 3.71 3.93 0.49 0.48 2.44 2.99 2.32
LMIC 6.51 -0.07 3.85 3.96 0.17 0.38 2.54 2.90 2.55
UMIC 8.12 0.48 3.84 4.46 0.17 0.37 2.61 3.13 2.68
Panel D: Correlation matrix of the variable in the benchmark
GDPC 1.00
FDI 0.4475* 1.00
OPEN 0.1400* 0.3803* 1.00
HC 0.5181* 0.3716* 0.0422 1.00
FDI*HC -0.0881* -0.2891* -0.0578 -0.3983* 1.00
FDI*TO -0.0493 -0.3077* 0.1513* -0.1058* 0.2536* 1.00
GC 0.0999* 0.1488* 0.0513 0.2362* -0.2301* -0.1888* 1.00
GFCF 0.1743* 0.1335* 0.0018 0.2866* -0.1387* 0.1462* 0.1120* 1.00
CPI 0.0060 -0.0329 -0.0670 0.1790* -0.1509* -0.0177 -0.0068 -0.1891* 1.00
Notes: GPCAP, TO, GFCF and GC are taken from World Banks’ World Development Indicator, (2010) and Penn
World Tables Version 6.3 and 7.0. FDI is taken from UNCTAD website (2009). Human capital is obtained from
UNESCO UIS website (2008); CPI is taken from ERS International Macroeconomic Dataset, (2008) compiled by
Matthew Shane. The data are in logarithm form.

261
coefficient, while the variable for FDI has a positive and significant sign. The result
suggests that FDI has an unambiguously positive effect on economic growth in the
sample of countries. This result is similar across various estimation methods.
Government consumption and investment are correctly signed; however they are both
statistically insignificant. In the POLS estimates, inflation has a positive but
insignificant impact on growth in our sample.
Table 5-7: Impact of FDI on economic growth
Dependent variable: GDPC
Notes: P-values are in parenthesis. *, **, *** indicate 10%, 5% and 1% significance level, respectively. Pooled OLS
estimates are based on robust standard error. All specifications include a constant term. All variables are in logarithm
form.
The FE and RE estimates show that FDI, trade openness, human capital and investment
have a positive and significant impact on economic growth. The result highlights the
importance of FDI, trade openness and investment in the growth process of these
Variables POLS FE RE
FDI 0.296*** 0.019*** 0.019***
(0.00) (0.01) (0.01)
TO -0.086 0.282*** 0.278***
(0.24) (0.00) (0.00)
HC 1.400*** 0.362*** 0.388***
(0.00) (0.00) (0.00)
FDI*TO 0.073* 0.000 0.001
(0.06) (0.97) (0.95)
FDI*HC 0.250*** 0.020* 0.021*
(0.00) (0.08) (0.06)
GC -0.149 -0.031 -0.027
(0.16) (0.37) (0.44)
GFCF 0.158 0.088*** 0.087***
(0.22) (0.00) (0.00)
CPI 0.005 -0.028*** -0.027***
(0.91) (0.00) (0.00)
F 73.480
No. of Countries 29 29 29
Observation 638 638 638
R-sq 0.38
within 0.357 0.357
between 0.221 0.233
overall 0.186 0.196
262
economies.111
In addition, government consumption has a negative but insignificant
impact on economic growth. Inflation has the correct sign and it is statistically
significant. The implication of this finding is that trade openness has a positive overall
effect on economic growth. The proxy for inflation is also negatively and significantly
related to economic growth, where high level of inflation leads to lower economic
growth. It can therefore be concluded from Table 5-11 that FDI not only directly
promotes economic growth by itself, but also indirectly does so via its interaction terms.
I further present the impact of FDI on growth using our preferred method of analysis.
Specification 1 of Table 5-12 shows that all the variables are correctly signed, however
government consumption is insignificant. Specifically, the coefficient of FDI suggests
that a one percent change in FDI, leads to an increase in economic growth by
approximately 2 percent. Specification 2 tested the growth effect of FDI through the
effect of the level of economic openness by including the interaction between FDI and
economic openness proxy (FDI*TO) in the growth equation. While FDI and trade by
themselves positively and significantly affect economic growth, the interaction term is
positive but insignificant. The implication of this is that the positive impact of FDI on
economic growth in developing countries does not depend on openness to trade.
Specification 3 shows that the impact of FDI on economic growth is dependent on the
level of human capital development in the host country. According to the results, the
growth effect of FDI depends on the level of human capital, confirming the results of
Borensztein et al. (1998). The implication of this is that FDI has an unambiguously
positive impact on growth.
111 The same results are obtained for Borensztein et al. (1998) for developing countries, and Li and Liu (2005) for
developed and developing countries.

263
Table 5-8: FDI’s impact on economic growth
Notes: P-values are in parenthesis. *, **, *** indicate 10%, 5% and 1% significance level, respectively. All results
derived using fixed effects model estimation. All variables are in logarithm form.
The variables in Specification 4 all have the expected signs, but the most significant
variable in this regression is openness, followed by human capital and investment. The
regression results also indicate that the interaction between FDI, trade openness and
human capital is positive with the coefficient of the interaction between FDI and human
capital statistically significant at the 10 percent level.
Overall investment, human capital, openness, the interaction between FDI and human
capital and FDI are the most important variables in promoting economic growth in this
sample.
Variables Spec (1) Spec(2) Spec (3) Spec (4)
FDI 0.016*** 0.017*** 0.018*** 0.019***
(0.01) (0.01) (0.00) (0.01)
TO 0.289*** 0.290*** 0.282*** 0.282***
(0.00) (0.00) (0.00) (0.00)
HC 0.325*** 0.326*** 0.362*** 0.362***
(0.00) (0.00) (0.00) (0.00)
GC -0.031 -0.031 -0.031 -0.031
(0.37) (0.37) (0.37) (0.37)
GFCF 0.084*** 0.082*** 0.088*** 0.088***
(0.00) (0.00) (0.00) (0.00)
CPI -0.030*** -0.030*** -0.028*** -0.028***
(0.00) (0.00) (0.00) (0.00)
FDI*TO 0.003 0.000
(0.78) (0.97)
FDI*HC 0.020*** 0.020***
(0.07) (0.08)
Constant 4.379*** 4.377*** 4.228*** 4.229***
(0.00) (0.00) (0.00) (0.00)
No. of Countries 29 29 29 29
R-sq
within 0.353 0.354 0.357 0.357
between 0.198 0.198 0.221 0.221
overall 0.168 0.168 0.186 0.186

264
Cross regional results:
Table 5-13 presents regression results for comparative analyses between the three
regions and the BRIMCs. In Asia, FDI, economic openness and human capital are
important determinants of economic growth. While the interaction between FDI and
human capital is positively related to economic growth, its coefficient is statistically
significant at the 1 percent level. The positive impact of FDI and the proxy for human
capital, and the positive impact of the interactions between FDI and human capital
imply that both FDI and human capital are complements. The result also indicates that
the sign of the coefficient of inflation is positive although insignificant. The positive
sign of the proxy for inflation is unexpected; but might be an indication of the low level
of inflation rate in this region. The significant and positive sign of the coefficient also
indicate that a stable environment is important to promote economic growth.
Table 5-9: FDI’s impact on regional economic growth
Notes: See Table 5-12.
Variables ASIA BRIMC LAC SSA
FDI 0.065*** 0.253*** -0.301*** 0.008
(0.00) (0.00) (0.00) (0.16)
TO 0.718*** -0.380*** 0.169*** -0.052
(0.00) (0.00) (0.00) (0.12)
HC 0.768*** 3.750*** -0.576 0.118*
(0.00) (0.00) (0.17) (0.07)
GC -0.04 0.076 -0.001 0.018
(0.52) (0.46) (0.98) (0.67)
GFCF -0.029 0.338*** 0.139*** 0.067***
(0.57) (0.00) (0.00) (0.02)
CPI 0.011 -0.012 -0.013 -0.030***
(0.44) (0.51) (0.11) (0.01)
FDI*TO -0.003 0.223*** 0.045*** -0.026***
(0.87) (0.00) (0.02) (0.03)
FDI*HC 0.162*** 0.161*** 1.232*** 0.010
(0.00) (0.02) (0.00) (0.36)
Constant 0.925* -8.788*** 9.814*** 5.831***
(0.07) (0.00) (0.00) (0.00)
No. of Countries 9 5 7 13
R-sq
within 0.732 0.743 0.711 0.116
between 0.020 0.525 0.011 0.006
overall 0.033 0.529 0.118 0.014

265
Turning to the countries under the BRIMC sample, the results indicate that the level of
human capital, investments, FDI, the interaction between FDI and trade and FDI and
human capital are important for economic growth. The sign of the coefficient of
government consumption is positive, however it is statistically insignificant. In the
BRIMCs, the result indicates that FDI and trade are substitutes, while FDI and human
capital are complements.
In Latin American countries, FDI has a negative and significant impact on economic
growth. This implies that Latin American countries tend, ceteris paribus, to grow more
slowly than the other regions by approximately 30 percent. Government consumption,
investment and inflation all have the expected sign, although only investment is
significant at the 1 percent level.
Finally, in the SSA countries, the results indicate that investment and human capital
variable is significantly and positively related to economic growth. The interaction
between FDI and trade is significantly and negatively related to economic growth, while
FDI has a positive impact on growth. This suggests that SSA countries must pass a
minimum threshold of trade openness to gain the most from attracting FDI.112
This
suggests that in a scenario where trade openness is lower than or equal to the threshold
value, FDI will exert a negative effect on economic growth. In addition, the result
shows that inflation has the expected negative sign and the coefficient is significant at 1
percent.
Income group results:
Table 5-14 presents the comparative results for 7 low income countries; 9 lower and
middle income countries and 13 upper middle income countries respectively. According
to the table, economic growth in low income countries is determined by human capital,
trade openness and investment. I find that the interaction between FDI and trade
openness is negative and statistically significant, while the indicator of economic
openness by itself is positive and statistically significant at 10 percent, FDI has a
negative and insignificant impact on growth. The positive impact of the interaction term
suggests that FDI and trade are substitutes in low income countries. The proxy for
inflation has the correct sign and the coefficient is statistically significant.
112 By taking the derivative of the growth equation with respect to LFDI, setting them equal to zero. By solving it for
the level of trade openness (LTO) required, the total effect of FDI on growth is positive. Similar calculation is applied
where it applies.

266
Table 5-10: FDI’s impact on different level of economic growth
Notes: See Table 5-12.
Turning to lower and middle income countries, the table reports that FDI is positively
linked with economic growth. The level of economic openness and human capital
development seem to be important for economic growth in this region. The result also
shows that the interaction between FDI and human capital is negative and the
coefficient is statistically significant. The implication of this is that there is a certain
level of threshold of human capital for the positive impact of FDI on economic growth.
It appears that investment has a negative sign, however the coefficient is insignificant.
In the upper middle income countries, the level of human capital, investment and the
level of economic openness seem to be the major determinants of economic growth.
Government consumption has a negative impact on growth, and the coefficient is
statistically significant. The interaction between FDI and openness also has a positive
and significant impact on growth in this region. The implication of this is that FDI and
openness are complements in the sample of upper middle income countries in our
Variables LIC LMIC UMIC
FDI -0.003 0.040*** 0.049*
(0.48) (0.00) (0.08)
TO 0.080* 0.101*** 0.209***
(0.07) (0.030 (0.00)
HC 0.144*** 0.137* 3.038***
(0.03) (0.08) (0.00)
GC 0.006 0.023 -0.125***
(0.91) (0.60) (0.01)
GFCF 0.063* -0.009 0.267***
(0.08) (0.79) (0.00)
CPI -0.056*** -0.029* -0.023**
(0.00) (0.06) (0.05)
FDI*TO -0.031*** -0.017 0.038*
(0.02) (0.21) (0.06)
FDI*HC -0.011 -0.121*** -0.067
(0.15) (0.00) (0.50)
Constant 4.461*** 5.619*** -6.761***
(0.00) (0.00) (0.00)
No. of Countries 7 9 13
R-sq
within 0.481 0.453 0.637
between 0.000 0.604 0.012
overall 0.003 0.406 0.063

267
sample. The interaction between FDI and human capital does not affect economic
growth, given the insignificant coefficient.
From the table, I can conclude that FDI plays a more important role on economic
growth in upper middle income countries and low and middle income countries than in
low income countries.
5.5.4 Sensitivity Analysis
The study undertook two robustness checks. First, the analysis checks whether the
results obtained is sensitive to changes in the period of estimation by accounting for the
effect of business cycle. Hence, equation (5.3) and (5.7) is re-estimated using four year
period averages, meaning that I have seven observations per country (1980-1983, 1984-
1987, 1988-1991, 1992-1995, 1996-1999, 2000-2003 and 2004-2007). The results are
quite close to the baseline, with the exception that the sign of the coefficient of human
capital in Asia is negative and significant; in the BRIMCs it is positive and significant
while in the SSA it is negative and has lost it statistical significance. Second, the
equations are re-estimated to examine whether the results is sensitive to changes in
variables. To this end, the analysis uses FDI in millions, GDP, exports, total labour
force and number of telephone subscribers per thousand people.113
Overall the results
are robust.
113 All the variables are in natural logarithm form.

268
Table 5-11: Determinant of FDI, Sensitivity analysis
Notes: See Table 5-12.
Variables Full Sample ASIA BRIMC LAC SSA GDP 0.888 *** 1.573 *** 0.966 ** 0.498 1.116 ***
( 0.00 ) ( 0.00 ) ( 0.05 ) ( 0.18 ) ( 0.03 ) XGDP 0.760 *** 0.388 * 0.626 *** - 0.066 1.246 ***
( 0.00 ) ( 0.08 ) ( 0.03 ) ( 0.87 ) ( 0.00 ) HC - 0.306 - 2.309 *** 4.556 ** 1.335 - 0.201
( 0.48 ) ( 0.00 ) ( 0.06 ) ( 0.53 ) ( 0.76 ) X*HC - 0.018 *** - 0.059 *** - 0.024 *** - 0.004 0.022**
( 0.00 ) ( 0.00 ) ( 0.02 ) ( 0.81 ) ( 0.05 ) TELS 0.191 *** - 0.009 - 0.084 0.327 *** 0.106
( 0.00 ) ( 0.94 ) ( 0.66 ) ( 0.03 ) ( 0.30 ) CPI - 0.047 0.063 - 0.238 *** - 0.168 *** 0.055
( 0.23 ) ( 0.37 ) ( 0.00 ) ( 0.00 ) ( 0.53 ) Constant - 18.831 *** - 20.071 *** - 39.136 *** - 18.985 *** - 22.569 ***
( 0.00 ) ( 0.00 ) ( 0.00 ) 0.10 ( 0.00 ) No. Of Countries 30 9 5 7 14 R - sq
within 0.360 0.620 0.718 0.549 0.274 between 0.046 0.126 0.899 0.479 0.000 overall 0.092 0.136 0.708 0.018 0.049

269
Table 5-12: Impact of FDI on Economic growth: Sensitivity analysis
Notes: See Table 5-12.
5.6 Conclusions
The objective of this chapter has been to find out the determinant and impact of FDI
inflows in developing countries. Specifically, the chapter focused on the interaction
between economic openness and human capital in determining FDI, and the interaction
between FDI, human capital and openness in promoting economic growth. For this
purpose, the study used a sample of panel observations for 30 countries over the period
1980 to 2007. The data are obtained from the World Development Indicators (WDI,
2008), UNCTAD FDI database, (2008 and 2009), Penn World Tables, Version 6.3 and
7.0 (2009 and 2011), ERS International Macroeconomic Dataset, (2010) and UNESCO
UIS, (2008). The main estimation technique is the fixed effects method. A number of
conclusion can be drawn which are summarised as follows.
Variables Full Sample ASIA BRIMC LAC SSA FDI 0.148 *** 0.254 *** 0.130 * 0.193 *** 0.106 ***
( 0.00 ) ( 0.00 ) ( 0.10 ) ( 0.00 ) ( 0.00 ) X 0.137 ** 0.275 0.276 0.092 0.037
( 0.05 ) ( 0.12 ) ( 0.28 ) ( 0.56 ) ( 0.73 ) LF - 0.065 *** - 0.041 0.118 - 0.050 - 0.117 ***
( 0.01 ) ( 0.38 ) ( 0.27 ) ( 0.35 ) ( 0.02 ) GC - 0.268 *** - 0.233 0.203 0.039 - 0.253 *
( 0.00 ) ( 0.26 ) ( 0.47 ) ( 0.72 ) ( 0.10 ) GFCF 0.065 0.012 0.498 0.322 *** 0.052
( 0.45 ) ( 0.95 ) ( 0.15 ) ( 0.02 ) ( 0.65 ) CPI 0.022 0.115 *** 0.002 0.030 0.029
( 0.12 ) ( 0.00 ) ( 0.95 ) ( 0.41 ) ( 0.41 ) FDI*X - 0.019 *** 0.004 - 0.072 * 0.004 - 0.017
( 0.02 ) ( 0.85 ) ( 0.09 ) ( 0.76 ) ( 0.33 ) FDI*LF - 0.066 *** - 0.075 0.039 0.012 - 0.094 ***
( 0.00 ) ( 0.10 ) ( 0.37 ) ( 0.69 ) ( 0.02 ) Constant 16.708 *** 16.597 *** 15.626 *** 15.944 *** 16.158 *** ( 0.00 ) ( 0.00 ) ( 0.00 ) ( 0.00 ) ( 0.00 ) No. of Countries 30 9 5 7 13 R - sq
within 0.67 5 0.86 1 0.89 2 0.860 0.55 9 between 0.753 0.754 0.386 0.560 0.60 6 overall 0.575 0.646 0.629 0.456 0.378
270
The study finds that a host country with a highly literate workforce, an open
economy with better availability of infrastructure attracts the inflows of FDI.
In line with the literature, this study finds that large market size with a well skill
labour force and greater trade openness boost the inflow of FDI to Asian
countries.
The findings indicate that FDI to the BRIMC countries is mainly as a result of
the large market size,
Highly skilled workers and better infrastructure attracts FDI to Latin American
countries and in SSA,
The result suggests that the level of human capital and economic openness seem
to be the main determinants of FDI inflows.
For the income groups, the flow of FDI seem to favour lower and middle income
countries in that a large market size, with the abundance of literate workforce
and an open economy which is stable boost foreign investors’ confidence in the
economy.
The positive and significant coefficient of FDI and its interaction with trade
openness and human capital in the BRIMC, suggests that FDI has a positive
impact on economic growth, however the magnitude of its impact depends on its
interactions with economic openness and the level of human capital.
The analysis also examined the impact of FDI on economic growth, taking into account
whether the growth effect of FDI is dependent on economic openness and human
capital. The empirical research examined the direct and indirect effect of FDI in
different regions and income groups. In particular, the effect of FDI in the BRIMCs and
SSA was focused on. The findings indicate that FDI is a strong contributor to economic
growth and that this relationship is not dependent on its interactions with economic
openness or human capital. In Latin American countries, the result suggest that FDI has
a negative impact on growth in the short run, however, the effect of FDI on growth
becomes positive with improvement in both the level of economic openness and human
capital. This result is similar to that of Borensztein et al. (1998), who find that there is a
negative, and sometimes insignificant, effect of FDI on economic growth in developing
countries with low levels of human capital.

271
In the SSA region, the inference to be drawn is that, while growth effects of FDI may be
augmented by human capital and economic openness, they are not prerequisites as
current thinking suggests. However, the absence of evidence in support of conditional
effects may also suggest that the countries in our sample have not attained the threshold
level of human capital below which interaction effects do not affect growth.
The policy implications that are offered are:
It is critical and important to maintain a sustainable and high level of economic
growth and development as evidence shows that sustainable level of economic
growth attracts FDI.
It is also important to invest in human capital in order to benefit from the
externalities of FDI.

272
Appendix V
Table 5-13: Variables, definition and source
Variable Description Source
FDI Foreign direct investment as a percent of
GDP. It is a composite bundle of capital
stock and technology.
UNCTAD, (2009)
GDPC Market Size: real GDP per capita World Bank’s World Development Indicators
(2008), PWT version 6.3 and USDA/ERS (2010)
TO Economic openness: Sum of imports plus
exports as a percent of GDP
World Bank’s World Development Indicators
(2008), PWT version 6.3 and USDA/ERS (2010)
HC Human capital: Adult literacy, percent of
adult age 15 and over who can read and
write, with understanding , a short simple
statement on his or her everyday life.
UNESCO UIS database and calculated using 100
minus illiteracy rate
TELM Infrastructure: Number of telephone and
mobile subscribers
World Bank’s World Development Indicators
(2008), PWT version 6.3 and USDA/ERS (2010)
CPI Consumer price index, inflation World Bank’s World Development Indicators
(2008)
GC Government consumption World Bank’s World Development Indicators
(2008)
GFCF Gross fixed capital formation as a percent of
GDP
World Bank’s World Development Indicators
(2008)
Interaction Terms
TO*HC Interaction between economic openness and
human capital
Authors' Calculation
FDI*TO Interaction between FDI and economic
openness
Authors' Calculation
FDI*HC Interaction between FDI and human capital Authors' Calculation
Alternative Measures
gGDP/gGDPC/
GDP
growth rate of GDP, growth of real GDP per
capita and GDP in millions of US$
World Bank’s World Development Indicators
(2008), PWT version 6.3 and USDA/ERS (2010)
X Export as a percent of GDP World Bank’s World Development Indicators
(2008), PWT version 6.3 and USDA/ERS (2010)
M Import as a percent of GDP World Bank’s World Development Indicators
(2008), PWT version 6.3 and USDA/ERS (2010)
TELMPC Number of telephone subscribers per
thousands
World Bank’s World Development Indicators
(2008), PWT version 6.3 and USDA/ERS (2010)
LFG growth rate of people age 15 and over who
are economically active population
including employed and unemployed. It is
obtained using [Ypresent-
Ypast]/Ypresent*100
World Bank’s World Development Indicators
(2008), PWT version 6.3 and USDA/ERS (2010)
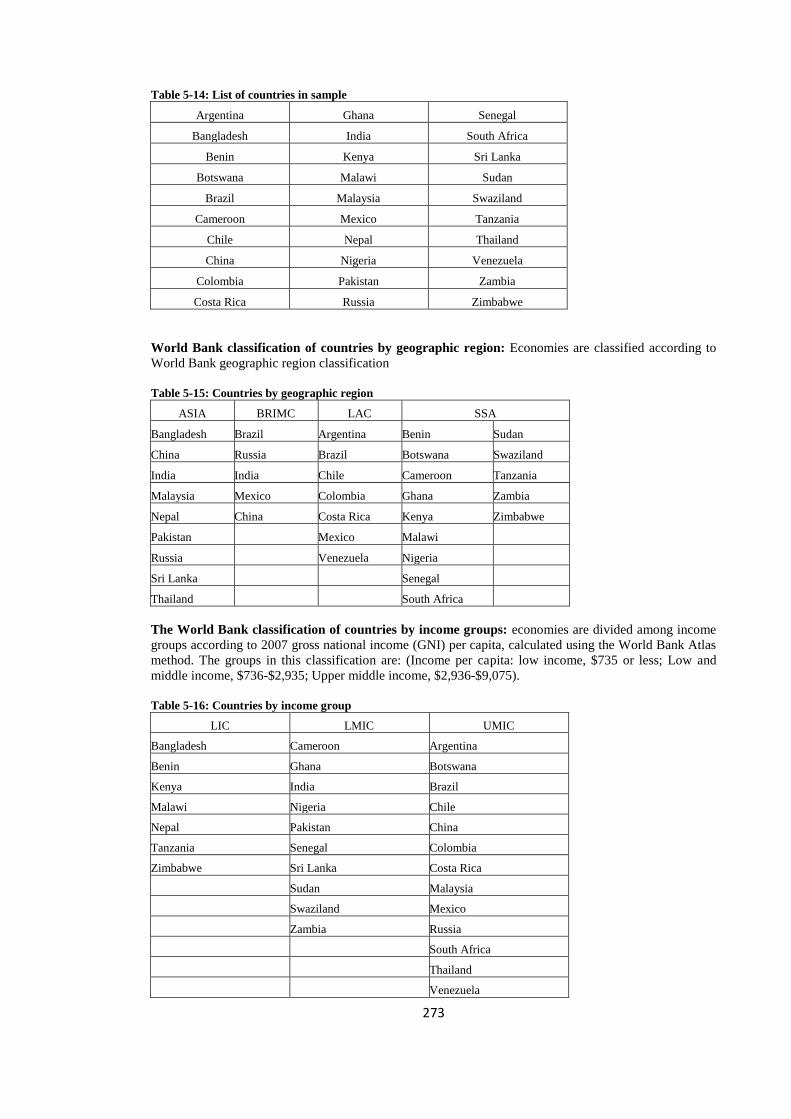
273
Table 5-14: List of countries in sample
Argentina Ghana Senegal
Bangladesh India South Africa
Benin Kenya Sri Lanka
Botswana Malawi Sudan
Brazil Malaysia Swaziland
Cameroon Mexico Tanzania
Chile Nepal Thailand
China Nigeria Venezuela
Colombia Pakistan Zambia
Costa Rica Russia Zimbabwe
World Bank classification of countries by geographic region: Economies are classified according to
World Bank geographic region classification
Table 5-15: Countries by geographic region
ASIA BRIMC LAC SSA
Bangladesh Brazil Argentina Benin Sudan
China Russia Brazil Botswana Swaziland
India India Chile Cameroon Tanzania
Malaysia Mexico Colombia Ghana Zambia
Nepal China Costa Rica Kenya Zimbabwe
Pakistan Mexico Malawi
Russia Venezuela Nigeria
Sri Lanka Senegal
Thailand South Africa
The World Bank classification of countries by income groups: economies are divided among income
groups according to 2007 gross national income (GNI) per capita, calculated using the World Bank Atlas
method. The groups in this classification are: (Income per capita: low income, $735 or less; Low and
middle income, $736-$2,935; Upper middle income, $2,936-$9,075).
Table 5-16: Countries by income group
LIC LMIC UMIC
Bangladesh Cameroon Argentina
Benin Ghana Botswana
Kenya India Brazil
Malawi Nigeria Chile
Nepal Pakistan China
Tanzania Senegal Colombia
Zimbabwe Sri Lanka Costa Rica
Sudan Malaysia
Swaziland Mexico
Zambia Russia
South Africa
Thailand
Venezuela

274
Appendix V: IV
The results of multicollinearity test among explanatory variables
Det(correlation matrix) 0.0388 Eigenvalues & Cond Index computed from deviation sscp (no intercept) Condition Number 4.1224 --------------------------------- 9 0.1828 4.1224 8 0.2039 3.9031 7 0.4342 2.6748 6 0.5669 2.3411 5 0.7197 2.0777 4 0.9275 1.8302 3 1.3821 1.4993 2 1.4761 1.4508 1 3.1067 1.0000--------------------------------- Eigenval Index Cond
Mean VIF 2.07---------------------------------------------------- ssa 2.83 1.68 0.3538 0.6462 lac 2.93 1.71 0.3413 0.6587 brimc 1.79 1.34 0.5581 0.4419 lncpi 1.17 1.08 0.8562 0.1438 lntelm 2.36 1.54 0.4239 0.5761 interact2 1.54 1.24 0.6500 0.3500 lnhc 1.91 1.38 0.5230 0.4770 lnopen 1.70 1.31 0.5868 0.4132 lngdpc 2.40 1.55 0.4164 0.5836---------------------------------------------------- Variable VIF VIF Tolerance Squared SQRT R-
Collinearity Diagnostics
. collin lngdpc lnopen lnhc interact2 lntelm lncpi brimc lac ssa, corr
Det(correlation matrix) 0.0580 Eigenvalues & Cond Index computed from deviation sscp (no intercept) Condition Number 3.6144 --------------------------------- 11 0.1760 3.6144 10 0.3201 2.6800 9 0.3577 2.5356 8 0.5501 2.0445 7 0.6741 1.8469 6 0.7771 1.7201 5 1.2248 1.3702 4 1.3234 1.3181 3 1.4522 1.2583 2 1.8450 1.1164 1 2.2994 1.0000--------------------------------- Eigenval Index Cond
Mean VIF 1.77---------------------------------------------------- ssa 2.16 1.47 0.4623 0.5377 lac 2.48 1.57 0.4036 0.5964 brimc 1.84 1.36 0.5431 0.4569 lngc 1.41 1.19 0.7113 0.2887 lngfcf 1.40 1.18 0.7162 0.2838 lncpi 1.17 1.08 0.8561 0.1439 fdiopen 1.44 1.20 0.6961 0.3039 interact5 1.43 1.20 0.6973 0.3027 lnhc 2.22 1.49 0.4501 0.5499 lnopen 2.07 1.44 0.4829 0.5171 lnfdi 1.81 1.35 0.5521 0.4479---------------------------------------------------- Variable VIF VIF Tolerance Squared SQRT R-
Collinearity Diagnostics
. collin lnfdi lnopen lnhc interact5 fdiopen lncpi lngfcf lngc brimc lac ssa, corr
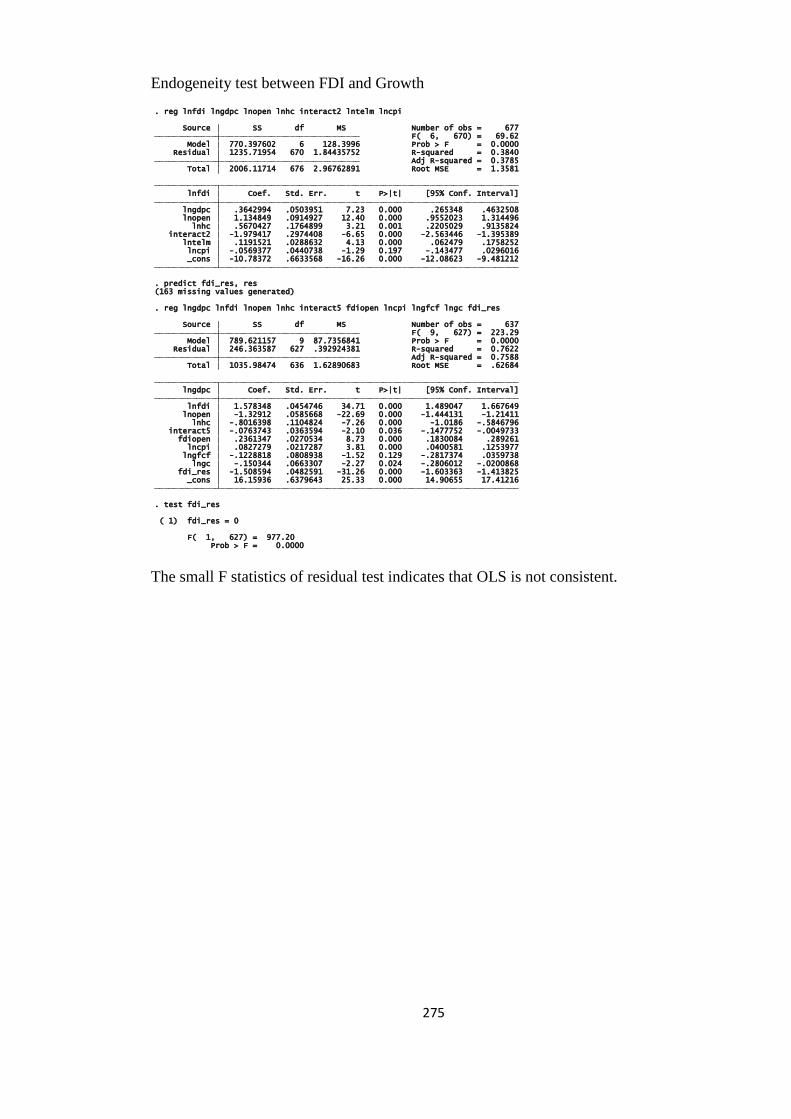
275
Endogeneity test between FDI and Growth
The small F statistics of residual test indicates that OLS is not consistent.
Prob > F = 0.0000 F( 1, 627) = 977.20
( 1) fdi_res = 0
. test fdi_res
_cons 16.15936 .6379643 25.33 0.000 14.90655 17.41216 fdi_res -1.508594 .0482591 -31.26 0.000 -1.603363 -1.413825 lngc -.150344 .0663307 -2.27 0.024 -.2806012 -.0200868 lngfcf -.1228818 .0808938 -1.52 0.129 -.2817374 .0359738 lncpi .0827279 .0217287 3.81 0.000 .0400581 .1253977 fdiopen .2361347 .0270534 8.73 0.000 .1830084 .289261 interact5 -.0763743 .0363594 -2.10 0.036 -.1477752 -.0049733 lnhc -.8016398 .1104824 -7.26 0.000 -1.0186 -.5846796 lnopen -1.32912 .0585668 -22.69 0.000 -1.444131 -1.21411 lnfdi 1.578348 .0454746 34.71 0.000 1.489047 1.667649 lngdpc Coef. Std. Err. t P>|t| [95% Conf. Interval]
Total 1035.98474 636 1.62890683 Root MSE = .62684 Adj R-squared = 0.7588 Residual 246.363587 627 .392924381 R-squared = 0.7622 Model 789.621157 9 87.7356841 Prob > F = 0.0000 F( 9, 627) = 223.29 Source SS df MS Number of obs = 637
. reg lngdpc lnfdi lnopen lnhc interact5 fdiopen lncpi lngfcf lngc fdi_res
(163 missing values generated). predict fdi_res, res
_cons -10.78372 .6633568 -16.26 0.000 -12.08623 -9.481212 lncpi -.0569377 .0440738 -1.29 0.197 -.143477 .0296016 lntelm .1191521 .0288632 4.13 0.000 .062479 .1758252 interact2 -1.979417 .2974408 -6.65 0.000 -2.563446 -1.395389 lnhc .5670427 .1764899 3.21 0.001 .2205029 .9135824 lnopen 1.134849 .0914927 12.40 0.000 .9552023 1.314496 lngdpc .3642994 .0503951 7.23 0.000 .265348 .4632508 lnfdi Coef. Std. Err. t P>|t| [95% Conf. Interval]
Total 2006.11714 676 2.96762891 Root MSE = 1.3581 Adj R-squared = 0.3785 Residual 1235.71954 670 1.84435752 R-squared = 0.3840 Model 770.397602 6 128.3996 Prob > F = 0.0000 F( 6, 670) = 69.62 Source SS df MS Number of obs = 677
. reg lnfdi lngdpc lnopen lnhc interact2 lntelm lncpi

276
6 The link between Foreign Direct Investment, Financial
Development and Economic Growth: A Panel Co-Integration
approach
Abstract
The purpose of this chapter is to investigate whether foreign direct investment (FDI) can
stimulate financial development or not. Despite the positive impact of finance on
growth, many developing countries still have poor developed financial sector. Although
the role of FDI and financial development on economic growth has been studied
extensively, no research has examined the combined effect of foreign investment on
financial development up to now. Therefore, this chapter investigates the causal
relationship between FDI and financial development using annual data for a panel of
sixty developing countries consisting of twelve from Asia, eleven from Latin America
and Caribbean and thirty-seven from the SSA region during the period of 1980 to 2007.
The empirical estimations also include the fastest growing emerging economies,
denoted as BRIMCs. Using panel co-integration approach, the chapter finds that foreign
direct investment; financial development and economic growth are co-integrated,
indicating the continuation of long run equilibrium relationship between them. The
findings clearly indicate that there is strong evidence of a long-run relationship for all
regions as a group, and in each of the four regions individually. The findings from
causality tests provide little support for the hypothesis that the inflows of FDI can
contribute to the development of the domestic banking sector in developing countries.
6.1 Introduction
The increasing role of foreign direct investment (hereafter, FDI) to economic growth
has created much research interest among the development economists. Many authors
argue that FDI plays a very important role in supplying investment resources in modern
conditions of the global economy (Abrazi, Zarei and Esfahni, 2011). FDI is usually
recognised as a growth enhancing factor in the host country and it is especially
noticeable in developing countries. FDI is very useful for developing countries because
it could fill the technological gap, savings-investment gap and tax-revenue gap (for
277
example, Mankiw et al., 1992; Feenstra and Hanson, 1997 and Zhang, 2001a and b).
Furthermore, the literature has advanced on the explanation of the links between FDI
and financial development, in developing and developed countries. Whilst empirical
studies suggests that FDI can positively affect economic growth indirectly via
technology transfer and spillover efficiency (Blomstrom et al., 1994; Kokko, 1994;
Kokko and Blomstrom, 1995, Johnson, 2005 and Hussein, 2009) on the one hand, other
studies show that the consequence of FDI on economic growth depends on the
absorptive capability of the host country, which includes initial development, openness,
level of human capital development and financial development (Blomstrom et al., 1992;
Balasubramanyam et al., 1996; Borensztein et al., 1998; Hermes and Lensink, 2003;
Alfaro et al., 2004 and Adeniyi, 2008). The most important is financial development. It
is generally believed that the development of the financial system of the recipient
country is an important pre-condition for FDI to have a positive impact on economic
growth. For instance, Hermes and Lensink, (2003) suggests that well developed
financial systems are important in influencing the positive impact of FDI on economic
growth. According to the authors, well-functioning financial markets are important
because they promote capital formation, technological innovation and economic
development. Alfaro et al. (2004) also come to a similar conclusion that countries with
well-developed financial markets tend to be more developed in terms of their growth
rate. Specifically, the authors note that a one percent increase in FDI leads to four times
more growth. Moreover, the financial system enhances the efficient allocation of
resources and improves the absorptive capacity of a country with respect to FDI
inflows. In particular, a more developed system may contribute to the process of
technological diffusion associated with FDI (Levine, 1997; Levine, 1991; Greenwood
and Jovanovic, 1990).
While the literature amply covers the linkage between FDI and economic growth in
both developed and developing countries, the specific strand that demonstrates a role for
financial development in the FDI-growth nexus is at best rudimentary. Furthermore,
most of these typically scant empirical literature attempts were conducted either purely
for developed countries or with samples of countries that include a few from Africa.
Although a lot of attention has been devoted to the impact of FDI on a host country’s
economic growth, the role of financial markets in the FDI-growth nexus and their long-
relationship, as well as causality, has received little or no attention, especially in

278
developing countries, and in particular, those in Sub-Saharan Africa (SSA). The studies
by Adeniyi (2008) and Lee and Chang (2009) are an exception. Adeniyi (2008)
examined the relationship among FDI, economic growth and financial development in
five small open developing countries from the SSA region, during the 1970-2005
period, using a vector error correction framework. The author reports that the
development of domestic financial markets is a prerequisite for a positive impact of FDI
on growth. Lee and Chang (2009) analysed the complementary impact for 37 developed
and developing countries using a multivariate framework in a panel co-integration and
panel error correction test. The study reports a long-run relationship and bi-directional
causal linkage among FDI, financial development and economic growth. Hence, this
chapter hopes to add to the literature by examining the long-run and causality between
FDI, financial development and economic growth in the developing ASIA, LAC, and
SSA regions. I also include the fastest growing emerging economies of the BRIMCs, a
group of countries that have seen some of most rapid economic growth over the last
decade.
The objective of this chapter is to examine the long-run between economic growth, FDI
and financial development. The empirical analysis based on a sample of 60 developing
countries for a twenty-eight year period (1980 to 2007), reports the following results: a
panel data co-integration analysis confirms a long-term relationship between FDI,
economic growth and financial development for the whole sample; ASIA, LAC, and
SSA countries.
The remainder of this chapter is organised as follows: the next section begins with the
trends of FDI flows, financial development, and recent economic growth in developing
countries in the past two decades, as well as comparing the individual circumstances in
the three main geographical regions (ASIA, LAC and SSA). Section 6.3 briefly
discusses the relevant empirical literature. Section 6.4 discusses the data used and
econometric technique employed in the study. In Section 6.5, the results and discussions
from estimating the relationship between FDI, financial development and economic
growth are presented. Section 6.6 presents results on the sub-sample and 6.7 conclude
the chapter.

279
6.2 Stylised facts on FDI, financial development and economic growth: brief
descriptive analysis
The past two decades have witnessed a remarkable increase in foreign capital flow
especially to developing countries, of which FDI has played a significant role. In 1980,
the world FDI outflow represented approximately 5 percent of the world gross domestic
product. The percentage almost tripled to 14 percent by the end of the 1990s
(UNCTAD, 2000). By 2000, the absolute amount of FDI was to the tune of over US
$1.3 trillion.114
In 2005, total FDI inflows to both developed and developing countries
amounted to US $619 billion and US $332 billion, respectively. Total FDI flow in the
whole world reached a record US $1970 billion in 2007, of which only 29.07 percent
went to developing countries and the rest went to the developed countries (UNCTAD,
2010). It was noted that developing countries’ share in FDI has been declining since
1990-94. The last column in Table 6-1 highlights that during 1990-94, the overall share
of developing countries FDI was approximately 30 percent, which has reduced to 29
percent in 2007. In absolute terms, however, FDI inflows to developing countries have
witnessed a significant increase.
114 UNCTAD, World Investment Report 2006.

280
Table 6-1: Global foreign direct investment inflows (in billions of US $) during 1980-2007
Years World
Developed
countries
Developed
countries’
share of FDI to
the world in %
Developing
countries
Developing
countries’ share
FDI to the world
in %
1980-84 57.76 39.14 67.76 18.62 32.23
1985-89 128.04 105.45 82.36 22.58 17.64
1990-94 201.35 138.34 68.71 61.58 30.58
1995-99 602.90 420.96 69.82 174.54 28.95
2000-04 834.18 593.56 71.15 224.97 26.97
2005 982.59 619.17 63.01 332.31 33.82
2006 1461.86 977.89 66.89 429.46 29.38
2007 1970.94 1306.82 66.30 573.03 29.07
Source: Author’s calculations from UNCTADstat online database (2010).
Table 6-2 below shows that the share of FDI inflow, as a percentage of GDP, in
developed countries is insignificant compared to developing countries, which is
significant, but not visible in levels. The low level of FDI, in absolute terms, received in
developing countries might be reflective of the small size of many of the countries.
Table 6-2: Comparative inward FDI (percent of GDP) during 1980-2007
Year World Developed countries Developing countries
1980-84 0.52 0.47 0.71
1985-89 0.76 0.77 0.76
1990-94 0.82 0.72 1.33
1995-99 1.97 1.77 2.73
2000-04 2.42 2.26 2.97
2005 2.15 1.83 3.08
2006 2.95 2.75 3.42
2007 3.54 3.35 3.85
Source: Author’s calculations from UNCTADstat online database (2010).

281
Regional inflow of FDI
Although, FDI flows into various regions have grown significantly in the past two
decades, there are regional disparities (see Figure 6-1). On a regional scale, the share of
FDI inflow to African countries, particularly those in the SSA region, is less compared
to other regions.115
Despite the increase in FDI flow to SSA, this is still less than 7
percent of the FDI flow to developing countries and 2 percent of global FDI inflows.
Udo and Obiora (2006) note that the SSA countries seem to be unattractive to foreign
investors because they consider the potential cost of investing before making an
investment decision. Foreign investors find that overdependence of many countries on
primary commodities, macroeconomic and political instability116
and most importantly,
the lack of a well-functioning financial system, make Africa a ‘high risk investment’
destination (Morrisey, 2003; Alfaro et al., 2004 and 2006; Dupasquier and Osakwe,
2005 and Udo and Obiora, 2006).
Figure 6.1: Trend in FDI inflows, 1980-2007
Source: UNCTADstat online database (2010).
115 As of 2007, the total FDI inflow to developing economies reached $499 billion, of which the share to Asia and
Latin America was $361 and $103 billion dollars, respectively, and SSA received approximately $33 billion. See the
United Nations Conference on Trade and Development <www.unctad.org/fdistatistics> for more information. 116 According to Rodrik (1998), this discouraged FDI flow and, hence, led to the slow growth and the poor standard
of living observed in the region.
DC
ASIA
LAC
SSA 0
100
200
300
400
500
600
700
198
0
198
1
198
2
198
3
198
4
198
5
198
6
198
7
198
8
198
9
199
0
199
1
199
2
199
3
199
4
199
5
199
6
199
7
199
8
199
9
200
0
200
1
200
2
200
3
200
4
200
5
200
6
200
7
US
$B
illi
on
s

282
Unlike the SSA region, Asian and Latin American countries received fairly the same
amount of FDI between 1980 and 2007 (Figure 6-2 and 6-3). This share has been
roughly constant until the early 2000s when Asian countries became the preferred
destination for FDI flows. As of 2005, it became clear that foreign investors favoured
Asian countries, with China becoming the favourite destination for FDI. The figure
suggests that African countries, and in particular the SSA region, have been less
favoured by foreign investors. In fact, during the entire sample period, FDI captures the
smallest share in SSA, compared to Asian and Latin American countries.
Figure 6.2: FDI inflows by region, 1980-2007
Source: UNCTADstat online database (2010)
Surprisingly, the inflow of FDI as a share of regional GDP depicts a different picture
(Figure 6-3, below). I noticed that the average volume of FDI inflow to all the
developing regions exhibit a similar pattern during the sample period. In the period
2001-2007, FDI flow to Latin American countries grew an average of approximately 3
percent, in comparison to other developing regions. While FDI inflow increased rapidly
in Asia and Latin American countries between 1980 and 2000, SSA’s share of FDI was
rather small (Figure 6-3). Nevertheless, between 2001 and 2007, the average share of
FDI in GDP grew dramatically in SSA countries, reaching approximately 3 percent of
the total GDP. Jenkins and Thomas (2002) attribute these inflows to a small number of
large transactions, which tends to occur in countries where natural resources are
unexploited.

283
According to the World Bank (1999), Asia experienced the fastest rate of growth in FDI
inflows, but also the greatest volatility. The continued increase in FDI to Asia and other
developing regions, aside from SSA, largely reflects on their strong economic prospects,
openness and their high volume of human capital accumulation (which was confirmed
in the previous chapter), as a result of improvements in policies and regulatory
environment, which is attractive to foreign investors.
Figure 6.3: Inflow of FDI in developing regions, 1980-2007
Source: UNCTADstat online database (2010).
Figure 6-4 depicts the fact that the SSA countries are lagging behind in attracting FDI
compared to other developing countries. It indicates that during the entire sample
period, only approximately 24 percent of the total inflow of FDI to developing countries
reached the SSA countries. Since the beginning of 2000, Nigeria remains the top
destination of FDI to SSA, accounting for 16 percent of the region’s stock (Adams,
2009 and World Investment Report, 2009).

284
Figure 6.4: Regional distribution of FDI inflows to developing countries (1980-2007)
Source: UNCTADstat online database (2010).
Trends in financial development in developing countries
According to the literature, the development of the financial sector of the host country is
important for the absorptive capacity of the country in its ability to benefit from FDI
spillovers. Therefore, I examine the extent to which the financial system is developed in
our sample. Table 6-3 illustrates the key indicators of the banks in the sample countries,
measured by credit to the private sector and credit provided by the banking sector. A
trend analysis of financial development reveals that the performance of banking sectors
in developing countries has been impressive in the recent past. Table 6-3 indicates that
the experiences of developing countries, with regard to financial development, are
varied. It can be observed that credit to the private sector as a percentage of GDP, over
the period 1980-84, ranged from 33.8 to 66.1 in LAC and Asia, respectively. While total
domestic credit, provided by the banking sector, for Asia significantly increased from a
five year average of 90.2 percent in 1980-84 to 174.3 percent in 2007, the same
indicator grew only marginally in LAC from 48.6 in 1980-84 to 58.4 percent in 2007.
Following multitudes of banking crises in Latin American countries in the 1990s,
private credit and bank credit declined considerably. During this period (1990-2000),
the annual percent growth rate of private credit, as a share of GDP, was negative (-0.01
percent). The sharp decline in credit or the scarcity of private credit seems to account
for the decline in the level of GDP during the same period (Figure 6-5). For instance,
ASIA 45%
LAC 31%
SSA 24%

285
after the 1994 crisis, bank credit to the private sector in Mexico halved, from over 30
percent of GDP to less than 15 percent in the three subsequent years.
In the SSA region, private credit and bank credit shows a significant increase during the
period under study. Misati and Nyamongo (2011) attributed the increase to reforms in
the financial sector. Contrary to the observations in Table 6-3, financial development in
SSA varies considerably between the economies. For example, the financial systems in
the larger economies tend to register impressive growths, while those in struggling
countries, for example, Zimbabwe, register poor performance after financial
development.
Table 6-3: Trends in financial development in sample countries, 1980-2007
Region/group
Credit to private sector
1980 1985 1990 1995 2000 2005 2006 2007
ASIA 66.09 87.13 101.71 120.21 133.31 137.76 138.00 139.35
LAC 34.52 42.03 41.34 31.48 25.01 25.67 30.71 35.72
SSA 33.84 39.66 44.19 59.65 56.79 62.39 65.06 67.22
Credit provided by banking sector
ASIA 90.18 116.70 128.91 147.47 175.43 176.31 176.04 174.32
LAC 48.66 72.47 62.23 47.06 47.85 48.35 54.00 58.39
SSA 50.97 56.72 57.45 72.80 74.68 79.40 77.17 77.90
Source: World Banks, World Development Indicators, (2010).
Figure 6.5: Trends of private credit and annual growth of GDP in Latin America, (1980-2007)
Source: World Banks, World Development Indicators, (2010).
PC
gGDP
0
1
2
3
4
5
6
7
0
5
10
15
20
25
30
35
40
45
1980 1985 1990 1995 2000 2005 2006 2007
pe
rce
nt
286
Trends in economic growth in developing countries
The African region, as well as the Sub-Saharan sub-region, has been one of the least
developed regions of the world, with most SSA countries still heavily dependent on
primary commodities. Nevertheless, relative to the 1980s and 1990s, there has been an
improvement in economic growth in the region. For example, over the twenty year
period 1980-99, the average real per capita GDP growth was negative (-0.7 percent).
The growth performance indicators also reveal that, during the period 1990-94, the
region was as poor as it was in the 1980s. Since 2000, the region has had positive real
per capita GDP growth, reaching a peak of 3.7 percent in 2007. The poor economic
performance of SSA countries, in the 1980s, was attributed to failure in domestic
policies, such as constraints on business environment, and lack of openness to trade and
good governance, which makes international trade and investment very costly (Collier
and Gunning, 1999). Similarly, Latin America, in the 1980s, was also characterised by a
negative per capita growth, with an annual average growth of approximately -0.2
percent during the period 1980-1989. The most remarkable success stories are in
developing Asia, where real per capita GDP growth doubled between 1980 and 2007.
Investment is an essential element of economic growth in developing countries. The
share of investment in GDP was highest in Asian developing countries and lowest in
LAC and SSA developing countries (Table 6-4). In 1980-84, the average ratio of gross
fixed capital formation to GDP in Asia was 47.01 percent, compared to 20 and 22
percent in LAC and SSA, respectively. In the six months after the beginning of the new
millennium, the ratio of investment to GDP in the LAC and SSA countries deteriorated
significantly, reaching a record low of 17.65 and 16.79 percent, respectively. While
investment deteriorated in the LAC and SSA countries, it soared in Asia from 47 to 56
percent.
Asian growth performance has been encouraging. The World Bank (2010) indicates that
Asian countries had registered a six-fold increase in their GDP, from an average of $666
billion in 1980-84 to over $4200 billion in 2007. There are signs that openness to trade
welcomed private investment and macroeconomic stability (IMF, 1997). Compared to
Asia, SSA’s growth performance in the mid-1990s was particularly encouraging
because real GDP increased by approximately 5 percent, despite the poor growth in the
1970s. The literature points to the implementation of stronger macroeconomic and

287
structural policies and improvements in governance as factors that have contributed to
this growth. In the case of developing Latin American countries, real GDP increased by
approximately 0.02 percent during the sample period. Despite this slow growth rate, real
GDP in LAC seems to be significantly higher than SSA.
Table 6-4: Trends in economic growth in developing countries, 1980-2007
Region Investment
1980-84 1985-89 1990-94 1995-99 2000-04 2005 2006 2007
ASIA 47.01 48.78 52.99 54.48 55.93 63.64 65.02 65.04
LAC 20.64 19.79 19.04 18.78 17.65 18.63 19.55 20.42
SSA 22.16 18.10 16.97 17.17 16.79 18.13 18.82 20.24
GDP (constant US $, billions)
ASIA 666.59 940.14 1337.88 1964.60 2685.65 3414.27 3768.54 4202.48
LAC 1320.00 1448.47 1619.97 1891.41 2097.58 2334.60 2468.87 2615.04
SSA 232.62 253.78 274.82 312.16 369.42 426.87 453.84 482.50
GDP growth
ASIA 12.86 13.67 14.15 12.91 13.64 18.51 19.58 21.31
LAC 1.45 2.25 3.23 2.46 2.43 4.95 5.75 5.92
SSA 1.67 2.64 0.65 3.42 4.12 5.69 6.32 6.32
Source: World Bank’s World Development Indicator, (2010).
6.3 Review of pertinent literature
There have been considerable studies on the effect of either FDI or financial
development on economic growth in developing countries. Many argue that FDI has
played an increasingly important role in the overall capital flow to developing countries.
This is partly due to the fact that portfolio investment and cross border bank lending,
which were both important sources of capital, declined significantly in the 1990s
(Hirano, 2003). Due to the fact that many developing countries do not have sufficient
resources to finance their investment needs, the majority of them depend on foreign
capital from either official or private capital sources. Developing countries, especially in
the SSA region, depend on official development assistance (ODA) and foreign aids, in
order to finance their investments. For most of these countries, investment declined
systematically (Oshikoya, 1994) and in general, growth rates of real GDP per capita
also declined. However, the increasing importance of FDI is notable in Asian countries,
and in particular, India and China (Vadlamannati et al., 2009; Wang, 2009; Pradhan,
2006). Compared to the different forms of foreign capital flows, FDI provides a
relatively less volatile, and potentially plentiful, source of capital (Bandyopadhyay,
288
2006), because the other types of foreign capital flows are susceptible to reversals
(Becker and Noone, 2008). In the mid-1990s, portfolio investment in emerging
countries reached its peak, but declined sharply after a series of crises in Korea, Brazil
Argentina, Mexico and Russia. The enthusiasm for this form of investment did not last
because these crises prompted investors to re-evaluate the risk involved in investing in
emerging markets, and as such, this led to a quick reversal of these inflows. According
to Noorbakhsh et al. (2001), cited in Bandyopadhyay (2004 and 2006), FDI serves to
balance loan and equity capital in private investment, without the heavy drag of debt
service. Hence, Bandyopadhyay (2004 and 2006) concludes that FDI seems to perform
better following a debt crisis.
Many developing countries have viewed foreign direct investment (FDI) as a potential
source of capital.117
It benefits recipient countries by improving financial deficit,
providing technological knowledge, creating jobs and developing managerial skills (de
Mello, 1997; Romer, 1993 and Balasubramanyam, 2001 and Campos and Kinoshita,
2002). In addition, FDI has the potential to transfer foreign skills and technology and
contribute to long-term economic development. Thus, many developing countries have
written policies and relaxed trade restrictions to favour the inflow of FDI, since the
early 1980s. Many of these countries were successful in attracting a considerable
amount of FDI (as shown above). Unfortunately, not all developing countries have been
able to attract a significant amount of FDI, or reap from the benefits. For instance,
Africa, and in particular, the SSA countries, still lag behind other developing regions, in
terms of reaping the benefits of FDI. Unsurprisingly, the reasons for these uneven flows
of FDI to developing regions include the prevalence of weak policies (repressive tax
regimes, foreign exchange controls, etc) that exist in many of these countries.
The different channels through which FDI promote the economic host country’s
economic growth have been discussed, (Borensztein et al., 1998; Bosworth and Collins,
1999 and Dhakal et al., 2007). However, the major concern is that there is a need to
better understand the channels through which FDI promotes economic growth positively
(Lemi and Asefa, 2003). Grima (2003) argues that FDI positively promotes economic
growth based on the existence of an adequate absorptive capacity in the host country.
117 Capital is scarce in many developing countries because of the low levels of domestic savings, and as such, FDI is a
vital source of capital. For an overview of the literature, see Smith (1997) and Pradhan (2008).

289
The absorptive capacity of an economy includes; the stock of human capital, financial
development and the extent of the technology gap between foreign and local firms. The
literature highlighted financial development as the single most important factor between
these capacities.
The pioneering work of Bagehot (1873) and Schumpeter (1911) emphasised the role of
the financial market in the economy. Schumpeter (1911) argued that financial
intermediaries are important in economic growth, in that well-functioning banks spur
technological innovation. Shaw (1973) presented a similar idea, emphasising the role of
financial intermediation in enhancing investment, and consequently, boosting economic
growth rates. In this line of thinking, later studies acknowledged that financial
development stimulates economic growth by improving resource allocation (King and
Levine, 1993a and Rousseau and Wachtel, 2000). This implies that a good financial
system allocates capital to projects that yield high returns by lowering transaction costs.
The intuition, which appears fairly clear, is that the efficiency of the financial system in
reallocating resources to the most productive areas of the economy (industries, firms
and projects) is often considered an important driving force to technological change,
innovation and growth (Loof, 2004). Therefore, an economy with a more developed
financial system may contribute to the process of technological diffusion associated
with FDI, by collecting and analysing information from firms and markets. Using the
cost of innovation as a function of FDI, Hermes and Lensink (2003) argued that a fall in
costs leads to an increase in FDI inflows. According to this study, financial
development increases the speed of innovation and technology spillovers from FDI. The
study concludes that financial development is a precondition for FDI to have a positive
impact on growth. Alfaro et al. (2004) and Shahbaz and Rahman (2010) have provided
empirical evidence to support this proposition.
Finally, there is substantial research efforts geared towards investigating the role of
financial development in FDI-economic growth nexus. Hermes and Lensink (2003)
seem to have pioneered the notion that well developed financial systems are important
for the positive impact of FDI to register on growth. In a study of 67 developing
countries, the authors argued that the financial system efficiently allocates resources and
this improves the absorptive capacity of a host economy, with respect to inflows of FDI.

290
Omran and Bolbol (2003) empirically examine the complementary impact by focusing
on Arab countries. Saibu (2011) examined the complementary effect between FDI and
stock market development on growth in Nigeria. Their results showed that the effect
was negative and significant.
6.3.1 Relationship between FDI and economic growth: Empirical literature
Several empirical studies tried to confirm the relationship between FDI and its impact
on economic growth in developing countries (Balasubramanyam et al., 1996; Ayanwale,
2007; Adams, 2009 and Zhang, 2009). Most of these studies suggest a positive and
significant relationship between FDI and growth (see for instance Balasubramanyam et
al., 1996 and Borensztein et al., 1995 and 1998), while several others found no
significant impact (Akinlo, 2004). Until recently, this has been a subject of
disagreement among economists. Recently, however, research has questioned the
empirical results, pointing to the type of econometric method used and the countries
considered.
Using a cross-sectional Ordinary Least Squares (OLS) analysis and dynamic panel data
procedure, Carkovic and Levine (2002) estimate the effect of FDI on economic growth
in 72 countries during the period 1960 to 1995. Their results were two-fold: (1)
controlling for inflation and government size, they found FDI had a positive impact on
economic growth, and (2) controlling for trade and financial development, they also
found that FDI had a negative impact on growth. According to their findings, the
authors concluded that local conditions limit a country’s capacity to benefit from FDI.
They also found that, in the long-term, there was no robust link between FDI and
economic growth. Sharma and Abekah (2008) found that FDI had a positive impact on
economic growth in Africa using the OLS method. However, one of the problems
associated with the technique used by Carkovic and Levine (2002) and Sharma and
Abekah (2008) is that OLS assumes that each country’s intercept value is identical, and
it does not control for country-specific characteristics. Therefore, one needs to be
cautious when interpreting these results.
There are several papers undertaken on individual country study to establish the
direction of causality from FDI to economic growth. The result of these studies have
shown varied conclusions, some indicating that FDI causes economic growth, others
showing the reverse relationship, and in some cases, no relationship at all was found.

291
Zhang (1999) found evidence of a two-way Granger causality in the relationship
between FDI and China’s economic growth.
Chakraborty and Nunnenkamp (2008) examined the impact of FDI and economic
growth in India. They tested for the long-run and short-run relationship between FDI
and growth using a panel co-integration framework. They found that FDI stock and
output are co-integrated in the long-run for the overall sector of the Indian economy.
They also tested for Granger causality in the long-run using an error correction model.
Their results show that there is a strong bi-directional causality between FDI stock and
output in the short- run. However, they did not find a causal link between FDI stock and
output in the long-run. Anwar and Nguyen (2010) found a bi-directional link between
FDI and economic growth in a panel of 61 provinces in Vietnam during the period
1996-2005. According to the authors, investment in education and financial
development increased the impact of FDI on economic growth.
For studies of a group of countries or regions, Zhang (2001) using an error correction
model for 11 countries from South East Asia and Latin America found evidence of a
strong long-run relationship and causal linkage between FDI and growth. In this study,
the author found no co-integration between FDI and growth in six countries and found
that only one country exhibited Granger causality, which runs from FDI to growth.
Zhang (2001) found that the Granger causality test showed that there is a strong causal
relationship between FDI and economic growth using data from 11 countries from Latin
America and Asia. In an endogenous growth framework, Al-Iriani and Al-Shami (2007)
examined the relationship between FDI and growth in the six countries comprising the
Gulf Cooperation Council (GCC) using both heterogeneous panel analysis and GMM
estimation technique. Their results indicate a bi-directional causality from FDI to
economic growth, and vice-versa. Samad (2009), taking a slightly different route, used
co-integration technique, Granger causality test and error correction model (ECM) to
examine the direction of causality between FDI and economic growth in 19 developing
countries from South East Asia and Latin America. Their results show that six countries
(five from Latin America and one from South East Asia) have unidirectional causality
running from GDP to FDI. Seven of the countries, five of which are from South East
Asia exhibit a bi-directional short-run causal link between GDP and FDI. Their results

292
also show that only Sri-Lanka exhibits a long-run causal relationship with causality
running from GDP to FDI.
In sum, the main conclusion from the above literature survey is that there seems to be a
strong relationship between FDI and economic growth. Although the relationship is
highly heterogeneous across countries, there is a consensus that FDI on average has an
impact on growth, in the Granger causal sense.
6.3.2 Previous empirical studies on FDI, financial development and economic
growth literature in developing countries
Hermes and Lensink (2003) proposed the notion that countries with well-developed
financial systems tend to promote the growth enhancing attributes of FDI. This study
demonstrates that the benefits of FDI are strongly dependent on how well developed a
host country’s financial system is. Alfaro et al. (2004) tests the validity of this claim in
an endogenous growth framework, using both banking and stock market indicators. The
authors conclude that countries with well-developed financial systems tend to gain
significantly from FDI.
To capture the complementary link between FDI and financial development on
economic growth, Alfaro et al. (2006) proposed a theoretical model where financial
development promotes the growth enhancing attributes of FDI in host economies via
backward linkages. The authors note three main ways in which domestic financial
development enhances an economy’s capacity to gain from FDI. Specifically, a
developed domestic financial system; (1) eases credit constraints allowing entrepreneurs
to start their own firms, thus, (2) increasing positive spillovers to the final goods sector,
and (3) facilitating FDI in creating backward linkages.
In a more recent study, Azman-Saini et al. (2010), using 91 countries, examined
whether financial development is a precondition for FDI to positively impact on
economic growth, using a threshold regression model on data from the period 1975-
2005. The results suggested that there is a minimum threshold level of financial
development required for the positive effect of FDI on growth. The authors conclude
that policy framework that includes financial development and attracting FDI should go
hand in hand.
293
Although the above literature suggests the relationship between financial development
and FDI is complementary, several others posit that no such linkage exists. For
example, Carkovic and Levine (2002 and 2005) found that financial development was
not significant in promoting the growth enhancing effect of FDI.
The literature shows that the positive impact of FDI on economic growth also depends
on the type of financial indicator used. Using Johansen maximum likelihood approach
and vector error correction model (VECM), Adeniyi (2008) analysed the
complementary impact of FDI and financial development on economic growth in five
ECOWAS countries (Cote d’Ivoire, Gambia, Ghana, Nigeria and Sierra Leone). The
study showed that FDI would only have a positive effect on economic growth
depending on the financial indicator used, and the extent of development of the financial
system. Saibu et al. (2011) also report a similar finding for Nigeria. In particular, the
authors find that FDI was significant using stock market indicators. They also found that
liquidity in the financial market is important in the economic growth process in Nigeria.
Considering the importance of financial development and FDI for economic growth,
and its implication for policy formulation, several empirical studies have attempted to
examine the existence and direction of causality between FDI, financial development
and economic growth. For example, Kholdy and Sohrabian (2005) used panel data
consisting of 25 countries, over the period 1975 to 2002, to study the link between
financial markets, FDI and economic growth. They used a Granger causality model and
found that there is a bi-directional causality between financial markets and economic
growth. They also found that countries with low GDP per capita stimulate financial
development. However, the direction of causality reverses in countries with higher GDP
per capita. Their result also shows that countries with more developed financial markets
exhibit a bi-directional causality between the financial market and FDI.
In sum, the review of the selected literature shows that finance, through its interaction
with FDI in the long-run promotes economic growth, although the mixed results suggest
the need for further research. This study, therefore, will re-examine the relationship
between economic growth, FDI and financial development in sixty developing
countries, in the three main geographical regions (ASIA, LAC and SSA) and a group of
fast growing emerging countries referred to as BRIMCs.

294
6.4 Empirical Model, Data and econometric technique
In this section, I discuss the measures adopted for FDI, financial development and
economic growth. I also provide details of the econometric technique employed in the
econometric analysis.
6.4.1 Data
In this chapter, I use a panel of sixty developing countries,118
from 1980 to 2007, to
analyse the dynamic relationship between FDI, financial development and economic
growth. In keeping with standard practice, I use growth of real GDP per capita to proxy
economic growth while the share of FDI in GDP is used as a proxy for FDI inflows.
Measures of financial development
In the case of financial development, this is conventionally viewed as a process of
improvement in the quality, quantity and efficiency of financial services (Calderon and
Liu, 2002 and Adeniyi, 2008). As such, it is often difficult to choose an appropriate
measure of financial development, because of the various services provided by financial
systems. Thus, the standard practice in the literature is to use a number of variables as
proxies for financial development. Due to underdeveloped financial markets in many of
the developing countries in this study, particularly in countries belonging to the SSA
region, and the lack of consistent and up-to-date stock market data, this chapter employs
measures only relating to the banking sector.
To capture the variety of channels through which finance can affect growth, I use three
variables to proxy financial development. Following other studies, (King and Levine,
(1993a; b); Adeniyi, 2008 and Bangake and Eggoh, 2011), the financial development
indicators include; domestic credit provided by the banking sector as a ratio of GDP, the
ratio of deposit money bank assets to GDP and domestic credit to the private sector
credit as a ratio of GDP. The ratio of bank credit to GDP includes all credit to various
sectors on a gross basis, with the exception of credit to the central government, which is
net. Deposit money bank assets to GDP refer to the claims on domestic real non-
financial sector by deposit money banks as a share of GDP. It indicates the general size
of the bank sector with respect to the economy of the country (Lakstutiene, 2008).
118 These countries are classified under Asia, LAC and SSA according to the World Bank geographical region
classification and a list of countries is provided in the Appendix. We also include a group of countries referred to as
BRIMCs, to represent the fastest growing emerging economies as indicated by Jim O’Neil, (2003).

295
Private sector credit to GDP ratio assesses the extent of the involvement of the deposit
money banks in extending credit to the private sector. It excludes the public sector and,
therefore, reflects more efficient resource allocation in the economy because the private
sector is able to utilise funds in a more efficient and productive manner, as compared to
the public sector.
The data were converted into natural logarithms for statistical purposes.119
All data were
sourced from the financial structure database provided by Beck et al. (2010), the World
Bank’s World Development Indicators (2010) compiled by Economic and Social Data
Services, (2010) and Penn World Table, PWT version 6.3 and 7.0 provided by the QoG
database (2010) and Hestons, Summers and Aten, (2011). Country list is presented in
the appendix.
The aim of this chapter is to investigate empirically the relationships between FDI,
financial development and economic growth in the short and long run and to examine
whether the development of the financial sector is a precondition for FDI to benefit
economic growth. To gain the aim of this chapter, a dynamic model is used which
consist of three equations using three endogenous variables FDI, FD and GDP. In this
chapter, I employ the Panel data co-integration techniques using data from Asia, Africa
and Latin American countries for the period 1980 to 2007. The rational for using panel
data co-integration technique is that it can reflect the lagged changes, first difference
and the differences in the level of variables which enables the short-run and long-run
effects and the feedback that might exists between the variables that have been ignored
in previous empirical studies.
This chapter attempts to find an answer to the question: how does foreign direct
investment affect economic growth in the host country via financial development.
6.4.2 Econometric technique
Using an aggregate production framework in which the level of financial development
enters as an ‘input’ in the production function, Odedokun (1996) examined the link
between financial development and economic growth. This relationship can be depicted
as follows:
119 Following Lee and Chang (2009) FDI is not transformed into logarithm, because FDI is minor in some sample
countries and taking the natural logarithm would obtain a negative value.

296
Growth=f (financial development) (6.1)
Following Lee and Chang (2009), this study examines the relationship between FDI,
financial development and economic growth based on the modified version of the
Odedokun’s (1996) theoretical framework. This takes the following form:
Growth=f (FDI, financial development) (6.2)
The regression model for this study takes the following form:
ititiitii FDFDIgPCAP lnln (6.3)
Since the focus of this chapter is to establish the relationship between FDI, financial
development and economic growth, an appropriate technique is to adopt co-integration
analysis. In theory, two or more variables are considered to be co-integrated if they
share a common trend. If co-integration exists, this implies that causality runs in at least
one direction (Granger, 1988). Following the lead of Christopoulos and Tsionas (2004),
Apergis et al. (2007), Alper (2008), Adeniyi (2008), Lee and Chang, (2009) and
Fowowe (2010), it is possible to analyse the relationship between FDI, financial
development and economic growth in 60 developing countries, by appealing to the
panel co-integration approach.
Prior to testing for co-integration relationship, it is important to test for the stationarity
of the variable, in order to avoid spurious regression. This is done using unit root tests
developed for panel data. Testing for panel unit root has become conventional in panel
co-integration analysis. In principle, each variable need to be integrated in the same
order 1 before I can proceed to test for co-integration. Recent literature suggests that
panel unit root tests have a higher power than unit root test based on time series data
and have proposed several methods for testing the presence of a unit root under panel
data setting. Therefore, to check the stationarity of our data, I consider the appropriate
unit root tests for panel data, which is designed to control for cross-sectional
dependencies120
and to improve on the power of the estimation by exploiting the
commonalities of the countries under investigation.121
Since panel data unit root tests
may yield different testing results, I use three types of panel unit root tests which
consider two different null hypotheses, the Levine, Lin and Chu (LLC hereafter, 2002),
120 Cross-sectional dependence implies that the time series in the panel are contemporaneously correlated. 121 See Bai and Ng, (2010) and Oteng-Abayie (2011).

297
Im, Pesaran and Shin (IPSHIN hereafter, 1995, 2002 and 2003) and Fisher type (Choi
2001) test to perform the panel data unit root test and compare their results
(Christopoulos and Tsionas, 2003).122
The LLC test is based on the assumption that each
individual unit in a panel share a common unit root, which is to say that the persistent
parameters are common across cross-sections. The IPSHIN and Fisher type tests are
based on the assumption that each individual unit in a panel have individual unit root
processes.123
Due to the unbalanced nature of our dataset, I employ the Maddala and Wu
(1999) and Choi (2001) fisher-type unit root test because it does not require a balanced
panel and it also allows for gaps in individual time series.
Provided that the variables are integrated in the same order, the next step is to proceed
to test for co-integration. In this study, I use three types of panel co-integration test.
Pedroni (1999) introduced the first test, the second type of test is by Kao (1999) and the
third test is the Johansen Fisher type test (Choi 2001).124
If co-integration does exist, I
can then proceed to examine the direction of causality by using a panel-based vector
error correction model.
6.5 Results and discussions
6.5.1 Panel unit root tests results
As a preliminary test, I ascertain whether mean reversion is a characteristic of each
variable using a panel unit root. The test is conducted with intercept and trend on the
levels, and first difference on the variables. The estimation deals with the presence of
unit roots in the full sample and sub-sample (Asia, BRIMC, LAC and SSA countries)
and the result is reported in Tables 6-7 and 6-8. As can be seen in the table 6-7, the
LLC, IPSHIN and Fisher test fail to reject the null hypothesis of the presence of unit
root in level of the series; BC, DMBAGDP and PC are hence non-stationary variables.
However, the same LLC, IPSHN and fisher tests strongly reject the null hypothesis of
unit root at 1 percent for both gPCAP and FDI. In addition, when the variables are
transformed in first difference (Table 6-8); the tests reject the null hypothesis of the
presence of a unit root in all variables. Thus, it can concluded that the variables are
stationary, and are thus integrated of order one, I (1).
122 Since each test has its own weaknesses, it is now a standard practice to use a combination of test statistics for the
unit root tests. 123 Appendix VI.I contains a full description of the process. 124 See Appendix VI.I for description of test.

298
Tables 6-7 and 6-8 also report the panel unit root tests result in the sub-sample. The
results clearly show that the results for Asia, BRIMC, LAC and SSA of the panel unit
root in the level of the series cannot be rejected. Therefore, the results indicate that FDI,
financial development and economic growth variables are non-stationary at levels by
applying the LLC, IPSHIN, ADF-Fisher and PP-Fisher tests. Table 6-8 presents the
results of the tests at the first difference. It can be seen that for all series the null
hypothesis of unit root test is rejected at 1 percent significant level. This indicates that
the panel unit root tests provide strong evidence that all the series are in fact integrated
of order 1 (I(1) in all variables across regions.

299
Table 6-5: Panel unit roots tests results by regions (levels)
Area/All Region LLC IPSHIN
FISHER
Decision ADF PP
gPCAP -11.973*** -3.038*** 250.247*** 283.018*** I(1)
FDI -1.969*** -4.259*** 274.343*** 359.301*** I(1)
BC 1.846 0.334* 139.385 117.495 inconclusive
DMBAGDP -0.331 -1.761*** 162.738*** 92.813 inconclusive
PC -0.436 -2.220*** 172.603*** 97.289 inconclusive
ASIA
gPCAP -6.441*** -3.592*** 74.887*** 89.678*** I(1)
FDI -1.348* -1.984*** 53.032*** 50.072*** I(1)
BC -0.951 -0.676 26.017 15.470 inconclusive
DMBAGDP 0.192 0.139 26.023 12.073 inconclusive
PC 0.048 -1.053 30.915 13.729 inconclusive
BRIMC
gPCAP -5.581*** -2.201*** 29.449*** 35.320*** I(1)
FDI 0.280 0.445 6.986 6.898 inconclusive
BC -0.606 -0.407 9.902 11.500 inconclusive
DMBAGDP 0.692 -0.400 11.294 11.476 inconclusive
PC 0.019 0.103 13.487 5.814 inconclusive
LAC
gPCAP -4.519*** -1.013 38.802*** 38.228*** I(1)
FDI -1.667** -1.920** 41.879*** 37.494** I(1)
BC 1.654 -0.754 22.026 19.484 inconclusive
DMBAGDP -0.247 0.371 29.606 16.183 inconclusive
PC 0.133 -0.755 25.424 12.779 inconclusive
SSA
gPCAP -9.426*** -1.675** 136.558*** 155.112*** I(1)
FDI -1.186 -3.306*** 179.432*** 271.735*** I(1)
BC 1.697 1.181 91.343** 82.541 inconclusive
DMBAGDP -0.256 -2.580*** 107.110*** 64.557 inconclusive
PC -1.043 -1.822** 116.264*** 70.781 inconclusive
M3 15.533 -0.249 47.848 38.915 inconclusive
Notes: ***, **,* indicates that the results are significant at the 1, 5 and 10 percent significance level. In the analysis,
Akaike Information criteria’s automatic selection of lags is used. Null hypothesis: LLC: assumes common unit root
process. IPSHIN and Fisher ADF and PP: assumes individual unit root process. All the variables are in natural log
with the exception of FDI. The models have been specified with intercept and trend. gPCAP represents growth of real
GDP per capita, FDI is the share of FDI in GDP, BC is ratio of Bank credit to GDP, DMBAGDP is the ratio of
deposit money bank assets to GDP and PC represents ratio of private credit to GDP.

300
Table 6-6: Panel unit roots tests results by regions (first difference)
Area/All Region LLC IPSHIN
FISHER
Decision ADF PP
gPCAP -108.528*** -13.735*** 366.292*** 1283.320*** I(1)
FDI -19.862*** -26.582*** 956.165*** 4824.370*** I(1)
BC -18.536 -16.868*** 541.359*** 840.307*** I(1)
DMBAGDP -13.60*** -11.233*** 355.932*** 390.429*** I(1)
PC -16.784*** -18.508*** 543.229*** 1282.710*** I(1)
ASIA
gPCAP -11.453*** -6.523*** 132.382*** 658.796*** I(1)
FDI -8.198*** -9.419*** 127.770*** 758.673*** I(1)
BC -8.056*** -8.125*** 105.297*** 126.211*** I(1)
DMBAGDP -6.202*** -4.053*** 68.708*** 59.321*** I(1)
PC -6.014*** -5.522*** 71.815*** 88.016*** I(1)
BRIMC
gPCAP -7.751*** -3.015*** 52.142*** 559.078*** I(1)
FDI -5.121*** -6.883*** 57.059*** 95.612*** I(1)
BC -5.039*** -3.681*** 34.485*** 66.906*** I(1)
DMBAGDP -5.382*** -3.026*** 23.907*** 29.066*** I(1)
PC -3.133*** -2.890*** 27.906*** 47.813*** I(1)
LAC
gPCAP -15.575*** -4.113*** 82.093*** 125.667*** I(1)
FDI -11.361*** -12.721*** 162.127*** 607.540*** I(1)
BC -8.373*** -7.899*** 99.508*** 182.117*** I(1)
DMBAGDP -4.995*** -4.564*** 58.433*** 77.514*** I(1)
PC -7.584*** -7.187*** 93.899*** 110.776*** I(1)
SSA
gPCAP -114.347*** -11.738*** 151.817*** 498.855*** I(1)
FDI -15.271*** -21.528*** 666.268*** 3458.160*** I(1)
BC -15.155*** -12.675*** 336.554*** 531.980*** I(1)
DMBAGDP -11.167*** -9.622*** 228.790*** 253.594*** I(1)
PC -13.632*** -16.475*** 377.515*** 1083.920*** I(1)
Notes: See table 6.7
Following on from the results of the panel unit root tests, which indicate that the
variables are integrated in the region of the same order, it is possible to continue with
co-integration tests. Hence, to test for the relationship between FDI, financial
development and economic growth, the study uses panel co-integration technique, as
discussed in the previous section. Therefore, I can proceed to test for the long-run
relationship.

301
6.5.2 Panel co-integration tests results
Given that the results from the unit root test suggests that all of the variables are of the I
(1) process, that is, integrated of order one, then I proceed to test for co-integration to
determine if there is a long-run relationship between the variables in the sample.
To test the co-integration relationship, I apply panel co-integration tests by Pedroni
(1999, 2004) and Kao (1999) which extend the Engle-Granger framework to tests
involving panel data that allow for heterogeneous intercepts and trend coefficients
across cross-sections. I also use the Johansen Fisher (2001) test which is a combined
Johansen test that uses the results of the individual independent tests for each country in
the panel.
Pedroni (1999, 2004) constructs seven statistics for testing unit roots in the residuals of
the postulated long-run relationship. Of these seven statistics, the first four are referred
to as panel co-integration statistics, the last three are known as group mean co-
integration statistics. In the presence of a co-integrating relation, the residuals are
expected to be stationary. According to the author, the null hypothesis of no co-
integration is rejected if the first statistics has a large positive value and the remaining
six statistics have large negative value.
The panel statistic by Pedroni (1999, 2004), Kao (1999) and Johansen Fisher (2001) are
presented in Table 6-9 - 6-11, where the null hypothesis is that there is no co-integration
between FDI, financial development and economic growth, while the alternative
hypothesis is that FDI, financial development and economic growth are co-integrated.
The tests are done for the full sample and the sub-sample (Asia, BRIMC, LAC and SSA
countries) to investigate the appropriateness of the models for different types of
countries.
For the full sample, the results show that all the test statistics but panel ADF and group
rho-statistics, strongly reject the null hypothesis of no co-integration at 1 percent.
Results from the Kao co-integration tests provide support for the result of no co-
integration as indicated by the strong rejection of the null hypothesis at the 1 percent
significance level. Similarly, results of the Johansen fisher panel co-integration tests
indicate that the variables have a long-run relationship and this is supported by the
highly significant p-value. In the individual countries, the Johansen test shows that
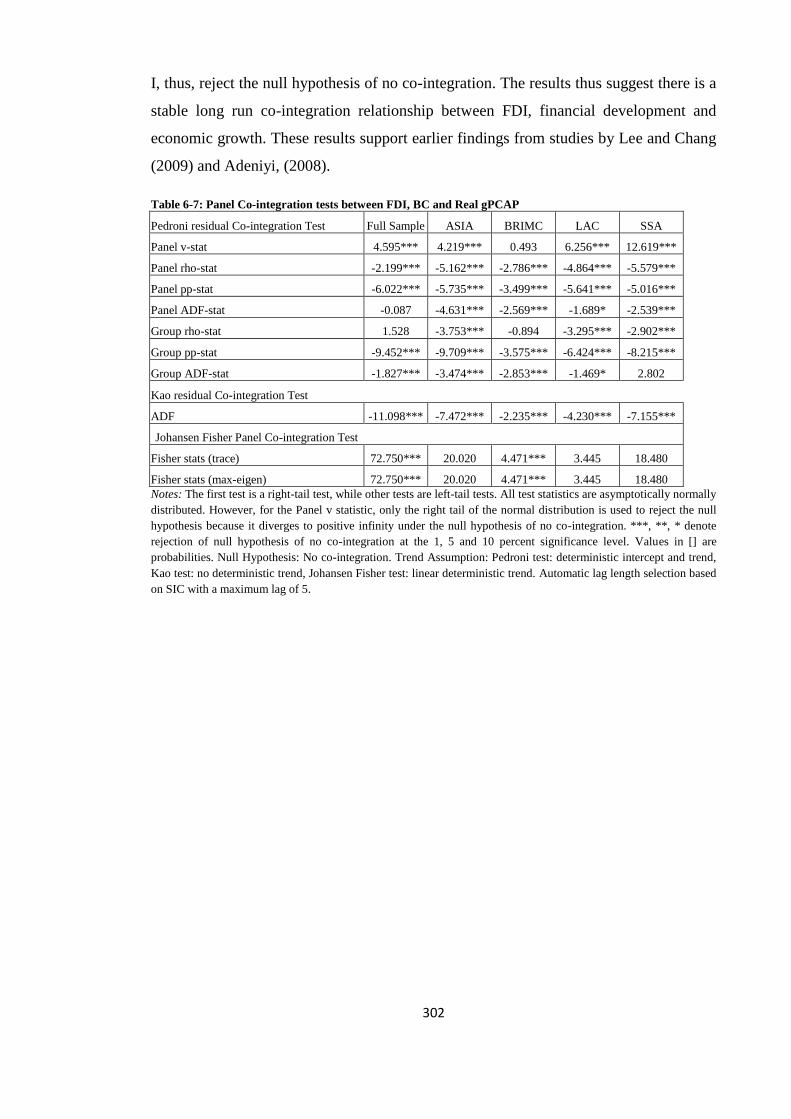
302
I, thus, reject the null hypothesis of no co-integration. The results thus suggest there is a
stable long run co-integration relationship between FDI, financial development and
economic growth. These results support earlier findings from studies by Lee and Chang
(2009) and Adeniyi, (2008).
Table 6-7: Panel Co-integration tests between FDI, BC and Real gPCAP
Pedroni residual Co-integration Test Full Sample ASIA BRIMC LAC SSA
Panel v-stat 4.595*** 4.219*** 0.493 6.256*** 12.619***
Panel rho-stat -2.199*** -5.162*** -2.786*** -4.864*** -5.579***
Panel pp-stat -6.022*** -5.735*** -3.499*** -5.641*** -5.016***
Panel ADF-stat -0.087 -4.631*** -2.569*** -1.689* -2.539***
Group rho-stat 1.528 -3.753*** -0.894 -3.295*** -2.902***
Group pp-stat -9.452*** -9.709*** -3.575*** -6.424*** -8.215***
Group ADF-stat -1.827*** -3.474*** -2.853*** -1.469* 2.802
Kao residual Co-integration Test
ADF -11.098*** -7.472*** -2.235*** -4.230*** -7.155***
Johansen Fisher Panel Co-integration Test
Fisher stats (trace) 72.750*** 20.020 4.471*** 3.445 18.480
Fisher stats (max-eigen) 72.750*** 20.020 4.471*** 3.445 18.480
Notes: The first test is a right-tail test, while other tests are left-tail tests. All test statistics are asymptotically normally
distributed. However, for the Panel v statistic, only the right tail of the normal distribution is used to reject the null
hypothesis because it diverges to positive infinity under the null hypothesis of no co-integration. ***, **, * denote
rejection of null hypothesis of no co-integration at the 1, 5 and 10 percent significance level. Values in [] are
probabilities. Null Hypothesis: No co-integration. Trend Assumption: Pedroni test: deterministic intercept and trend,
Kao test: no deterministic trend, Johansen Fisher test: linear deterministic trend. Automatic lag length selection based
on SIC with a maximum lag of 5.

303
Table 6-8: Panel Co-integration tests between Real gPCAP, FDI and DMBAGDP
Pedroni residual Co-integration Test Full Sample ASIA BRIMC LAC SSA
Panel v-stat 3.563*** 2.500*** 0.642 6.540*** 10.469***
Panel rho-stat -1.366*** -2.765*** -1.547** -4.450*** -5.194***
Panel pp-stat -5.771*** -3.360*** -1.966*** -5.429*** -4.586***
Panel ADF-stat -4.357*** -1.176 -1.869*** -1.978*** -1.759***
Group rho-stat 2.070*** -1.898*** 0.146 -2.560*** -2.737***
Group pp-stat -11.534*** -7.090*** -1.211 -6.194*** -9.917***
Group ADF-stat -6.023*** -3.078*** -1.604** -1.572* 4.206
Kao residual Co-integration Test
ADF -11.197*** -5.783*** -0.361 -5.397*** -7.676***
Johansen Fisher Panel Co-integration Test
Fisher stats (trace) 89.330*** 11.250 - 3.390 26.230
Fisher stats (max-eigen) 89.330*** 11.250 - 3.390 26.230
Notes: See Table 6-9. The Pedroni (2004) statistics are one sided tests with a critical value of -1.64 (statistic < -1.64
implies rejection of the null), except the v-statistic that has a critical value of 1.64 (statistics > 1.64 suggests rejection
of the null).
Table 6-9: Panel Co-integration tests between Real gPCAP, FDI and PC
Pedroni residual Co-integration Test Full Sample ASIA BRIMC LAC SSA
Panel v-stat 3.163*** 3.013*** 0.010 6.452*** 11.889***
Panel rho-stat -2.337*** -5.131*** -2.782*** -4.723*** -5.864***
Panel pp-stat -6.124*** -5.577*** -3.424*** -5.468*** -5.424***
Panel ADF-stat -0.737*** -5.222*** -2.878*** -1.734*** -3.607***
Group rho-stat 1.092*** -3.668*** -0.940 -3.110*** -3.185***
Group pp-stat -10.416*** -9.884*** -3.981*** -6.115*** -8.240***
Group ADF-stat -3.339*** -7.896*** -2.995*** -1.505* 0.617
Kao residual Co-integration Test
ADF -11.821*** -7.516*** -2.713*** -4.258*** -8.260***
Johansen Fisher Panel Co-integration Test
Fisher stats (trace) 72.590*** 18.890 5.500*** 7.890 19.350
Fisher stats (max-eigen) 72.590*** 18.890 5.500*** 7.890 19.350
Notes: See Table 6-9.
There is a need to apply caution when using Pedroni (1999 and 2004) tests for sub-
samples. This is because, according to Pedroni (1999 and 2004), the tests statistics are
less reliable in small samples like this one, where T=28, but the panel ADF and group-
ADF based tests perform best. Hyun (2006) also find that the group ADF test statistics
is the most powerful in small samples, followed by the panel variance v statistics, and
Rachdi and Mbarek, (2011) provide a similar submission that ADF-statistic estimated
by the between model is the most robust for a small sample. For this reason, I, therefore,
consider mainly the Panel ADF-statistic and Group ADF-statistic tests in the Pedroni

304
(2004) panel co-integration analysis. I, thus, report results for both panel ADF and
group ADF statistics with no deterministic intercept or trend. The results presented in
the table indicate that a stationary long-run relationship exists between economic
growth, FDI and our measures of financial development in all the sub-groups. Since the
result indicates that co-integration exists between these variables, I can then proceed to
a Granger causality test.
6.6 Panel Causality test
In order to know the nature and the direction of causality between the variables,
Granger causality tests are used. The main idea of Granger causality test (Granger,
1969) is that a cause cannot come after its effect. A variable X is said to Granger cause
another variable Y, if the current value of Y is conditional on the past values of X, that
is, if the history of Y is likely to help predict Y better than the history of Y only (Konya,
2004). Thus, in Granger sense, causality analysis implies finding what is the cause and
what is the effect between two variables.
Prior to testing for causality between FDI, financial development and economic growth,
I first test for panel unit root so as to establish the order of integration of series and
panel co-integration to check if there is any stable long-run relationship between the
variables. Once these variables are co-integrated, the next step is to implement the
causality tests. Here, panel Granger causality tests are conducted by taking into account
the heterogeneity dimension which might be present between the cross section units.
This is because, failure to analyse the presence of that heterogeneity in panel Granger
causality could easily lead to faulty conclusions, inferring a casual relationship in all the
cross-section units yet it is only present in a subset of cross-section units or rejecting the
presence of a causal relationship for all the cross-section units yet it is present at least in
a subset of the cross-section units (Kidd et al., 2006). I therefore use a method which
takes into account the heterogeneity dimension of the cross-sections; as such I follow
Pesaran, Shin and Smith (1999) and use the “Pooled Mean Group (PMG)” estimator. A
recent paper by Asteriou (2009) used a panel dataset for five South Asian countries to
investigate the aid-growth relationship. Using both panel Mean Group (MG) and Pooled
Mean Group (PMG) approaches, Asteriou found a positive aid-growth relationship in
this region.
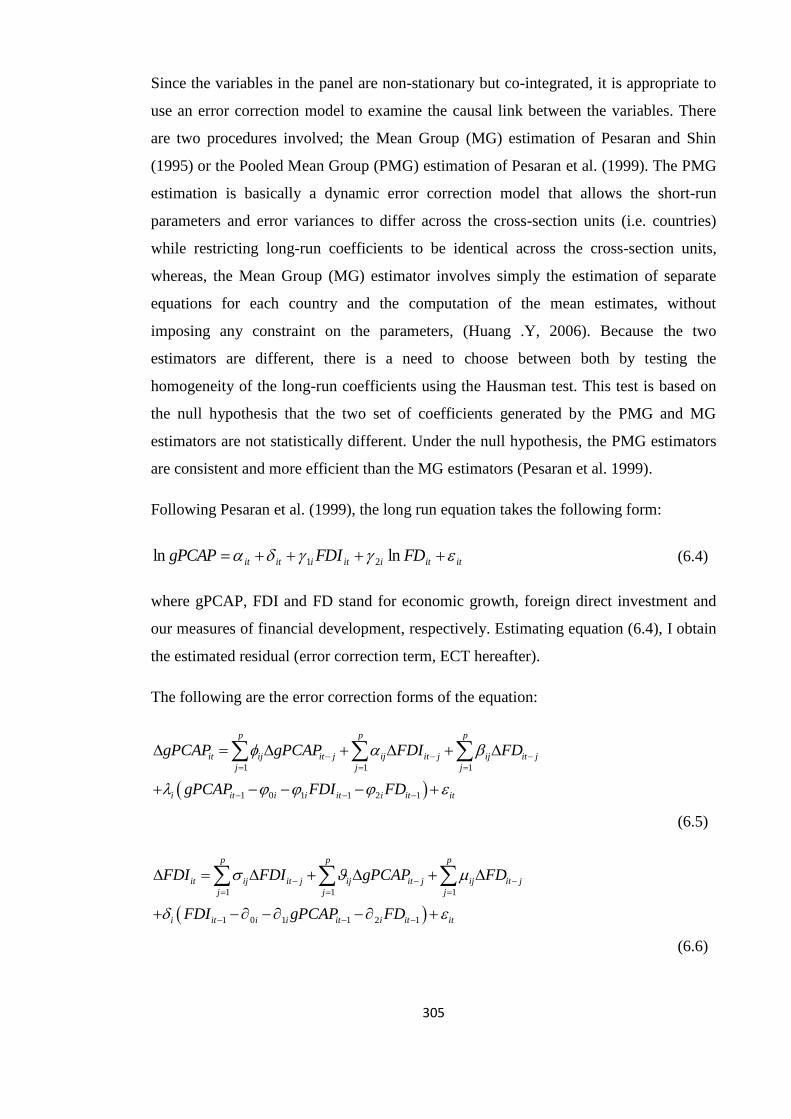
305
Since the variables in the panel are non-stationary but co-integrated, it is appropriate to
use an error correction model to examine the causal link between the variables. There
are two procedures involved; the Mean Group (MG) estimation of Pesaran and Shin
(1995) or the Pooled Mean Group (PMG) estimation of Pesaran et al. (1999). The PMG
estimation is basically a dynamic error correction model that allows the short-run
parameters and error variances to differ across the cross-section units (i.e. countries)
while restricting long-run coefficients to be identical across the cross-section units,
whereas, the Mean Group (MG) estimator involves simply the estimation of separate
equations for each country and the computation of the mean estimates, without
imposing any constraint on the parameters, (Huang .Y, 2006). Because the two
estimators are different, there is a need to choose between both by testing the
homogeneity of the long-run coefficients using the Hausman test. This test is based on
the null hypothesis that the two set of coefficients generated by the PMG and MG
estimators are not statistically different. Under the null hypothesis, the PMG estimators
are consistent and more efficient than the MG estimators (Pesaran et al. 1999).
Following Pesaran et al. (1999), the long run equation takes the following form:
ititiitiitit FDFDIgPCAP lnln 21 (6.4)
where gPCAP, FDI and FD stand for economic growth, foreign direct investment and
our measures of financial development, respectively. Estimating equation (6.4), I obtain
the estimated residual (error correction term, ECT hereafter).
The following are the error correction forms of the equation:
1 1 1
1 0 1 1 2 1
p p p
it ij it j ij it j ij it j
j j j
i it i i it i it it
gPCAP gPCAP FDI FD
gPCAP FDI FD
(6.5)
1 1 1
1 0 1 1 2 1
p p p
it ij it j ij it j ij it j
j j j
i it i i it i it it
FDI FDI gPCAP FD
FDI gPCAP FD
(6.6)

306
1 1 1
1 0 1 1 2 1
p p p
it ij it j ij it j ij it j
j j j
i it i i it i it it
FD FD FDI gPCAP
FD FDI gPCAP
(6.7)
where denotes first difference and k is the lag length. gPCAP is real GDP per capita
growth, FDI the indicator of foreign direct investment and FD, the measures of financial
development, ,i i and i are the error correction terms, showing the speed of
adjustment towards the long-run equilibrium. In equations (6.5 – 6.7), the part in the
parenthesis represents the long-run equations, and the other part represents the short-
run.
For the case of PMG, the long run coefficients are constrained to be homogeneous
across the cross-sections while the short-run coefficients and the speeds of adjustment (
,i i and i ) are left to vary across the cross-sections. For the MG however, no
constraints are put on coefficients whether in short or long run.
The result of the PMG estimator (using the three variables) show that causality running
from gPCAP to financial development (lnPC) was found only in the short run for
Argentina; it was found only in long-run in Burkina Faso, Botswana, Central African
Republic, Cape Verde, Chile, Colombia, Congo, Gabon, Ghana, India, Madagascar and
Mauritius. It was found to be both short and long run in Lesotho, Pakistan, Russia,
Sierra Leone, Tanzania, Thailand, Uruguay and Zimbabwe only. In addition, causality
running from economic growth to financial development was found to be strong in
Burkina Faso, Cape Verde, Chile, Colombia, Congo, Costa Rica, Gabon, Ghana, India,
Lesotho, Mauritius, Pakistan, Rwanda, Russia, Sierra Leone and Zimbabwe.
The tests also indicate causality running from economic growth to FDI was found only
in short run for Pakistan and Philippines; it was found only in long-run in Benin,
Cameroon, Colombia, Costa Rica, Ghana, India, Mauritania and Mauritius, it was found
to be both short and long run in Peru, Rwanda, Sudan and Thailand. In addition,
causality running from economic growth to FDI was found to be strong in Benin,
Cameroon, Mauritania, Mauritius, Pakistan, Peru and Philippines.

307
6.7 Conclusion
In this chapter, I have examined the relationship between FDI, financial development
and economic growth for a panel of 60 developing countries over the period 1980-2007
by using the recently developed panel data unit root tests and Pedroni panel data co-
integration technique. The data are based on twelve Asian, eleven Latin American and
Caribbean, and thirty-seven SSA countries. Three different types of proxies were used
for financial development (Bank credit, private credit and deposit money bank asset).
The LLC, IPSHIN and Maddala and Wu panel unit root test results show that the series
in the panel are integrated of the order one. Using Pedroni, Kao and Johansen Fisher
panel co-integration method to test the relationship between FDI, financial development
and economic growth, the results indicate that there is a strong long-run relationship
between the variables. The results suggest that economic growth, FDI and financial
development are significant in the long run and have their expected positive sign. In the
short run, the above variables are also correctly signed and significant.

308
Appendix VI: Countries used in sample
Table 6-10: List of countries in sample
Angola Colombia Mali Senegal
Argentina Congo Republic Mauritania Seychelles
Bangladesh Costa Rica Mauritius Sierra Leone
Benin Cote d’Ivoire Mexico South Africa
Bolivia Ethiopia Mozambique Sri Lanka
Botswana Gabon Nepal Sudan
Brazil Gambia Niger Swaziland
Burkina Faso Ghana Nigeria Tanzania
Burundi India Pakistan Thailand
Cameroon Indonesia Papua New Guinea Togo
Cape Verde Kenya Paraguay Uganda
Central African Republic Lesotho Peru Uruguay
Chad Madagascar Philippines Venezuela
Chile Malawi Russia Zambia
China Malaysia Rwanda Zimbabwe
Source: World Bank, World Development Indicators (2010)
Table 6-11: Countries by geographical classification and economic group
ASIA BRIMC LAC SSA
Bangladesh Brazil Argentina Angola Gambia South Africa
China China Bolivia Benin Ghana Senegal
India India Brazil Botswana Kenya Seychelles
Indonesia Mexico Chile Burkina Faso Lesotho Sierra Leone
Malaysia Russia Colombia Burundi Madagascar Sudan
Nepal Costa Rica Cameroon Malawi Swaziland
Pakistan Mexico Cape Verde Mali Tanzania
Papua New Guinea Paraguay Central African Republic Mauritania Togo
Philippines Peru Chad Mauritius Uganda
Russia Uruguay Congo Republic Mozambique Zambia
Sri Lanka Venezuela Cote d’Ivoire Niger Zimbabwe
Thailand Ethiopia Nigeria
Gabon Rwanda
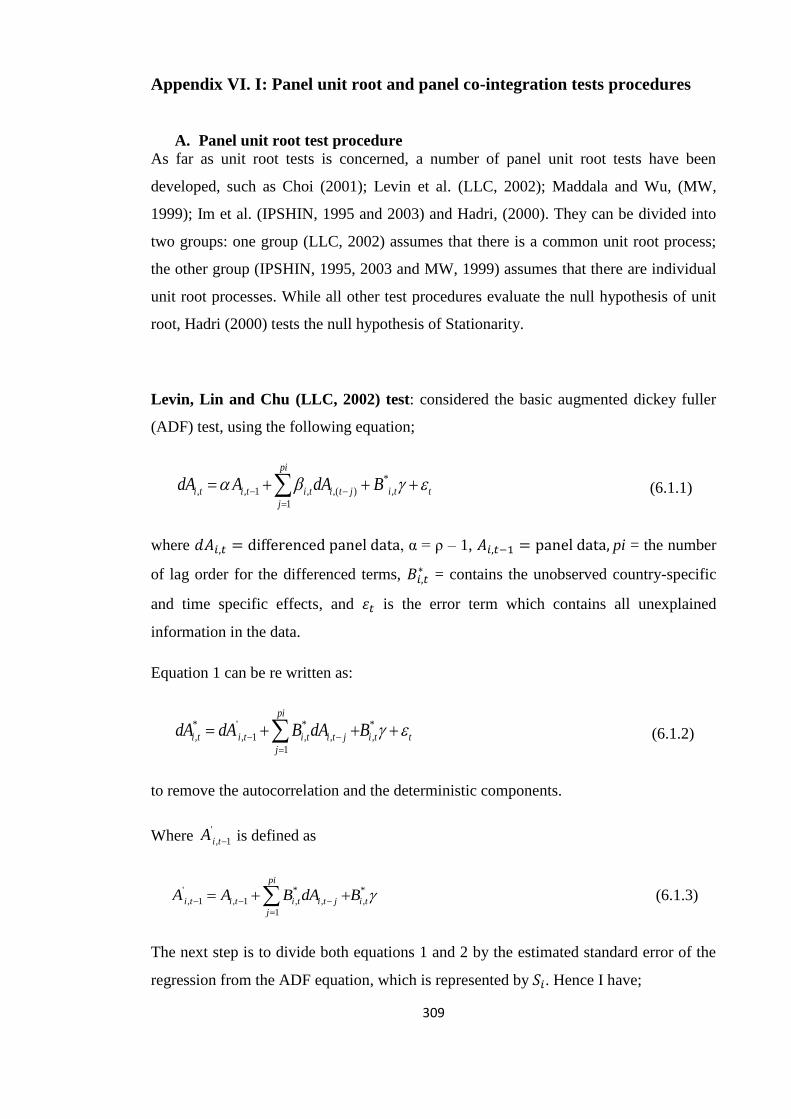
309
Appendix VI. I: Panel unit root and panel co-integration tests procedures
A. Panel unit root test procedure
As far as unit root tests is concerned, a number of panel unit root tests have been
developed, such as Choi (2001); Levin et al. (LLC, 2002); Maddala and Wu, (MW,
1999); Im et al. (IPSHIN, 1995 and 2003) and Hadri, (2000). They can be divided into
two groups: one group (LLC, 2002) assumes that there is a common unit root process;
the other group (IPSHIN, 1995, 2003 and MW, 1999) assumes that there are individual
unit root processes. While all other test procedures evaluate the null hypothesis of unit
root, Hadri (2000) tests the null hypothesis of Stationarity.
Levin, Lin and Chu (LLC, 2002) test: considered the basic augmented dickey fuller
(ADF) test, using the following equation;
*
, , 1 , ,( ) ,
1
pi
i t i t i t i t j i t t
j
dA A dA B
(6.1.1)
where , α = ρ – 1, pi = the number
of lag order for the differenced terms, = contains the unobserved country-specific
and time specific effects, and is the error term which contains all unexplained
information in the data.
Equation 1 can be re written as:
* ' * *
, , 1 , , ,
1
pi
i t i t i t i t j i t t
j
dA dA B dA B
(6.1.2)
to remove the autocorrelation and the deterministic components.
Where '
, 1i tA is defined as
' * *
, 1 , 1 , , ,
1
pi
i t i t i t i t j i t
j
A A B dA B
(6.1.3)
The next step is to divide both equations 1 and 2 by the estimated standard error of the
regression from the ADF equation, which is represented by . Hence I have;

310
* *
, ,i t i t idA d A S (6.1.4)
' '
, , 1 /i t i t iA A S (6.1.5)
Levin, Lin and Chu (2002) show that, under the null hypothesis, a modified t-statistics
for the resulting ^ is asymptotical normally distributed and can be written as:
* ^ ^ * *2 / `t t NT SN Se mT mT aN (6.1.6)
where
*t = the standard t-statistic for ^a = 0
^ = the estimated variance of the error term *, 1ipi
T TN
Se ^ = the standard error of ^a .
The null and alternative hypothesis for this test may be written as,
0 1: 0H panel data has unit root (assumes common unit root process)
1 1: 0H panel data has not unit root
If *t is significant, then I reject the conclusion that the panel data has no unit root.
Otherwise, if *t is not significant, then I accept the null hypothesis that the panel has a
unit root.
Im, Pesaran and Shin (IPSHIN, 1995 and 2003) test: focused on small sample
properties of unit root tests in panels with heterogeneous dynamics; they developed an
alternative test based on the group mean statistics. In 2003, IPSHIN proposed a t-bar
unit root test that allows for complete heterogeneity units in the dynamic panel
framework. The test is based on individual ADF regressions, which can be written as:
, , 1 , , ,
1
p
i t i i t ij i t j i t i t
j
y z
(6.2.1)
where i= 1,.....N, t = 1,.....T.
The null hypothesis for equation (7) may be written as,

311
0 : 0iH for all i
while the alternative hypothesis is given by:
: 0a iH , 1,2,.... ,i N 0i , 1,i ii N N N
In a traditional ADF, the t values are compared to a critical value while in the Ipshin
unit root test the sample mean (t-bar) is estimated as
11
1 N
pit t
N (6.2.2)
is the individual t- statistics for testing the null hypothesis. Whereas LLC (2002)
assumes that is the same for all members in the panel as the test is done on a pooled
data.
The Fisher ADF and Fisher PP type tests: this test was developed by Maddala and
Wu (1999) and Choi (2001) who considered the shortcomings of the LLC and IPSHIN
and offered an alternative method. In testing whether a panel has unit root, they suggest
to use a non-parametric Fisher-type test, which is, based on a combination of the p-
values of the test statistics for a unit root in each cross-sectional unit i (the ADF test or
other non-stationarity tests). Thus, in testing for panel data unit roots, Fisher-type tests
conduct the unit root tests for each panel individually and then combine the p-values
from these tests to produce overall tests. The Fisher type test is similar to the IPSHIN
test in that it allows unit root process to vary across countries. However, the main
advantage of the Fisher-type test is that it does not require the panel to be balanced and
allows for gaps in individual series, unlike LLC (2001) and IPSHIN (2003). The
proposed Fisher type test takes the following form:
1
2 lnN
i
i
P P
(6.2.3)
which combines the p-values from the unit root tests for each cross-section i to test for
unit root in panel data. Under the null hypothesis, p is distributed as:
2 2N as
iT for all N.

312
In addition, Choi (2001) proposed a Z-statistic which is given by the following:
1
12ln 2
2
N
i
i
Z pN
(6.2.4)
B. Panel co-integration test procedure
The analysis in this chapter uses three types of panel co-integration tests. The first one is
Pedroni (1999 and 2004), the second, Kao and the third Johansen Fisher type.
Pedroni co-integration test
The first type of panel co-integration test used in this chapter was developed by Pedroni
(1999 and 2004). The technique was developed to determine if a long-run relationship
exists between variables. Pedroni extends the two step residual based strategy of Engle
and Granger (1987). The first step is to test for the hypothesis of no co-integration by
regressing residuals from the hypothesised co-integration regression. To justify the use
of panel co-integration analysis on the set of cross-country data on FDI, economic
growth and financial development, let us consider the following theoretical equation of
the Pedroni (1999 and 2004) panel co-integration test, which takes the form:
1 1, , 2 2, , , ,..........it i i i t i t m m i t ity t X X X (6.3.1)
for t=1,….,T; n=1,…., N, m=1,....M
where are the independent variables, T is the number of observations over time, and
N is the number of cross-sections. The parameters i and i allows for the possibility of
country-specific fixed and trend effects, which may be set to zero if desired.
The second step involves computing a regression on the residuals obtained from the
previous equation:
, , 1 ,i t i i t i t (6.3.2)
Pedroni (1999 and 2004) co-integration test allows the investigation of heterogeneous
panels, in which heterogeneous slope coefficient, fixed effects and individual specific
deterministic trends are permitted. This is because there is no reason to believe that the
parameters are the same across countries (Lee and Chang, 2009). Pedroni (1999 and
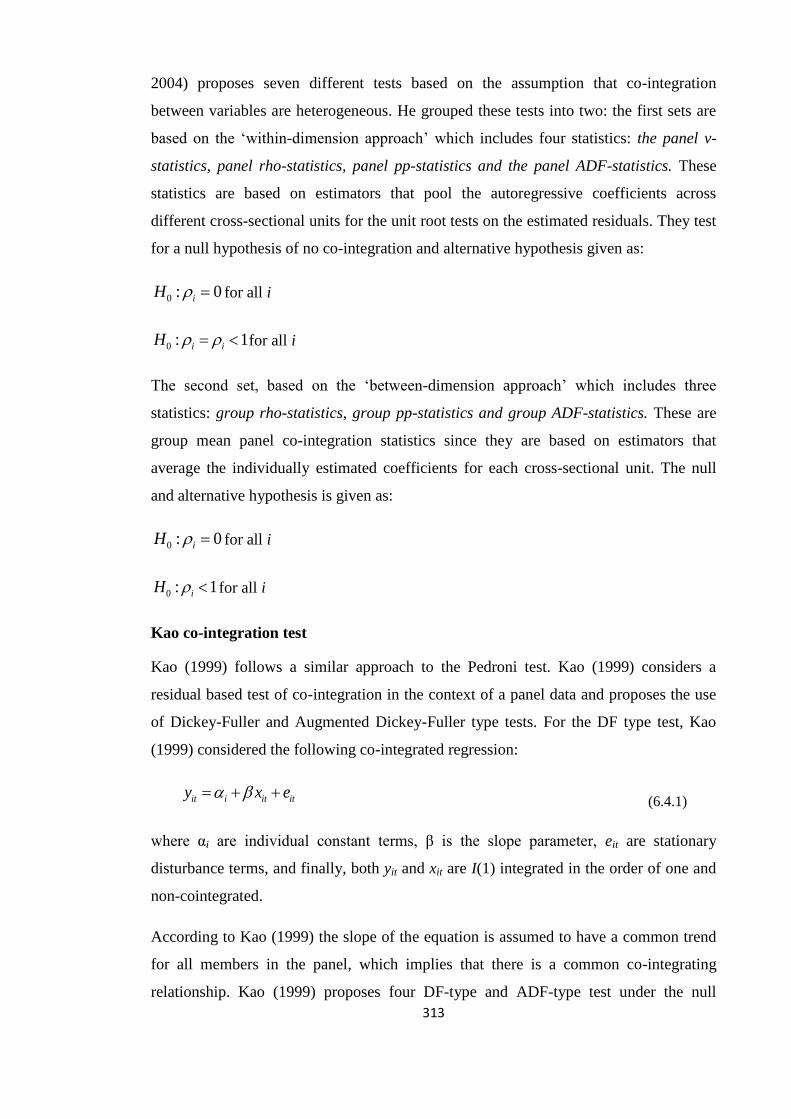
313
2004) proposes seven different tests based on the assumption that co-integration
between variables are heterogeneous. He grouped these tests into two: the first sets are
based on the ‘within-dimension approach’ which includes four statistics: the panel v-
statistics, panel rho-statistics, panel pp-statistics and the panel ADF-statistics. These
statistics are based on estimators that pool the autoregressive coefficients across
different cross-sectional units for the unit root tests on the estimated residuals. They test
for a null hypothesis of no co-integration and alternative hypothesis given as:
0 : 0iH for all i
0 : 1i iH for all i
The second set, based on the ‘between-dimension approach’ which includes three
statistics: group rho-statistics, group pp-statistics and group ADF-statistics. These are
group mean panel co-integration statistics since they are based on estimators that
average the individually estimated coefficients for each cross-sectional unit. The null
and alternative hypothesis is given as:
0 : 0iH for all i
0 : 1iH for all i
Kao co-integration test
Kao (1999) follows a similar approach to the Pedroni test. Kao (1999) considers a
residual based test of co-integration in the context of a panel data and proposes the use
of Dickey-Fuller and Augmented Dickey-Fuller type tests. For the DF type test, Kao
(1999) considered the following co-integrated regression:
it i it ity x e (6.4.1)
where αi are individual constant terms, β is the slope parameter, eit are stationary
disturbance terms, and finally, both yit and xit are I(1) integrated in the order of one and
non-cointegrated.
According to Kao (1999) the slope of the equation is assumed to have a common trend
for all members in the panel, which implies that there is a common co-integrating
relationship. Kao (1999) proposes four DF-type and ADF-type test under the null

314
hypothesis of no co-integration which can be applied to the residual of the OLS panel
estimating in (6.4.1) in the form:
ititit vee 1ˆˆ (6.4.2)
To test the null hypothesis of no co-integration amounts to test 1:0 H in equation
(6.4.2) against the hypothesis that Y and X are co-integrated (i.e., 1 : 1H ).
The OLS estimates of is:
11 2
2
11 2
ˆ ˆˆ
ˆ
N T
it iti t
N T
iti t
The null hypothesis is tested by 1 is tested by:
11 2
2
121 2
1 1ˆ ˆ
ˆ 11 1
ˆ
N T
it iti t
N T
iti t
TNNT
N T
Kao (1999) proposed the following four DF type test by assuming { }it ix :
ˆ
2
2* 0
4
4
0
ˆ
* 0
2 2
2 2
0 0
ˆ 1 3,
10.2
1.25 1.875
ˆ3ˆ 1
,ˆ36
3ˆ5
ˆ6
ˆ2
ˆ ˆ3
ˆ ˆ2 10
t
t
NT NDF
DF t N
NNT
DF
and
Nt
DF
where 2ˆ and
2
0ˆ
are consistent estimates of 2
and 2
0 . The limiting distributions
of *
DF and *
tDF (where it is assumed that both regressors are endogenous) are by
construction not dependent on 2
and 2
0 . It can be shown easily that * (0,1)DF N

315
and * (0,1)tDF N by the sequential limit theory. Alternatively, he defines a bias-
corrected serial correlation coefficient estimate and, consequently, the bias-corrected
test statistics and calls them DF and tDF . In this case, the assumption is the strong
exogeneity regressors and the errors.
For the Augmented-Dickey-Fuller (ADF) type test, the following regression is
considered:
1
1
ˆ ˆ ˆp
it it it j itp
j
j
(6.4.3)
where is chosen so that the residuals itp are serially uncorrelated. The ADF test
statistic here is the usual t-statistic with 1 in the ADF equation.
Johansen Fisher co-integration test (combined individual test)
Maddala and Wu, (1999) propose a Fisher co-integration test based on the multivariate
framework of Johansen (1988). They suggest combining tests from individual cross-
sections to obtain a test statistics for the whole panel.
Johansen (1988) describes two different approaches; one of them is the likelihood ratio
trace statistics and the other one is maximum eigen value statistics to determine the
presence of co-integration vectors in non-stationary time series. The trace statistics and
the maximum eigen value statistics can be written as:
1
ˆln 1n
trace
i r
r T
(6.5.1)
max 1ˆ, 1 ln 1 rr r T
(6.5.2)
where T is the sample size, n = 3 variables growth rate of real GDP per capita, FDI and
financial development, ˆi is the ith largest canonical correlation between residuals from
the three dimensional processes and residual from the three dimensional differentiate
processes.

316
For the trace test tests the null hypothesis of at most r co-integration vector against the
alternative hypothesis of full rank r=n co-integration vector, the null and alternative
hypothesis of maximum eigen value statistics is to check the r co-integrating vectors
against the alternative hypothesis of r+1 co-integrating vectors.
If i is the p‐value from an individual co-integration test for cross‐section i, then under
the null hypothesis for the whole panel,
1
2 logN
e i
i
(6.5.3)
is distributed as 2
2N
The value of the chi-square ( 2 ) statistic (reported in EViews) is based on the
MacKinnon‐Haug‐Michelis (1999) p‐values for Johansen's (1988) co-integration trace
test and maximum eigenvalue test.

317
7 Conclusion and Policy Recommendations
The difference in economic growth across countries has accelerated over the last
century. According to Maddison’s (2001) estimates, the level of per capita GDP in
Western Europe was the same as that of Africa, but lower than in Asia in the year 1000.
Sometime around the late 1990s, per capita GDP in Western Europe had risen to about
thirteen times higher than that of Africa and about five times higher than in Asia. Not
only has the disparity in the level of incomes in developing and developed countries
greatly worsened over time, the level of income in developing countries also experience
a similar divergence trend. In the 1960s for instance, Africa and Asia shared almost
similar levels of income; however, due to rapid growth episode realised in Asia, it has
since outpaced Africa in economic growth. The rapid growth realised in Asia has been
linked to their substantial potential for catching up with local investment, development
of inward looking policies and creation of sound institutions with a focus on improving
economic performance and growth.
To achieve rapid growth, attracting foreign direct investment (FDI) and promoting
financial development have been prescribed by international institutions such as the
World Bank, United Nations and some analysts, basing it on the rapid growth of the
Asian Newly Industrialised Countries (NICs) and the BRIMCs. Hence, it is argued that
in order to catch-up with industrialised countries and achieve rapid growth, FDI, with its
superior production and organisational methods may be a force of convergence. This is
because, FDI is generally seen as a composite bundle of capital stock and technology
and can augment the existing stock of knowledge in the host economy through labour
training, skill acquisition and diffusion and the introduction of new managerial practices
and organisation arrangements. In addition, it is argued that the domestic financial
sector plays a significant role in promoting economic growth. A well-functioning
financial sector can facilitate economic growth by mobilising savings, allocating these
savings to the most productive investment and facilitating the smooth flow of trade in a
market driven economy.
To this end, this thesis examined the role of financial development and foreign direct
investment in promoting economic growth in developing countries and in particular the
BRIMCs and SSA region. The argument behind focusing on the BRIMCs and SSA is
simply because, the BRIMCs as a group are the fastest growing developing countries in

318
the current decade that have succeeded in sustaining long term economic growth in a
period of ten years due to changes in policies to reflect a shift to a market-oriented
economy. In addition, it is believed that by comparing SSA’s economic growth with
countries of similar or greater degree of economic development can provide a baseline
from which to identify the development gap that the country’s authorities face in
designing their policies.
The four empirical chapters of this thesis, using different panel econometric techniques,
each considered the relationship between financial development, foreign direct
investment and economic growth in developing countries, with an emphasis on the
emerging economies, which are potentially important in the world of globalisation. The
analysis used annual data for a panel of 60 developing countries for the period 1980-
2007. Each chapter uses a combination of countries and different time period from the
60 countries in our analysis. The following variables were involved; the ratio of FDI to
GDP, the ratio of trade to GDP, adult literacy rate, the ratio of private credit to GDP, the
ratio of liquid liabilities to GDP, stock market capitalisation, stock traded value, bank
credit, BHL liberalisation dates, KAOPEN, FINDEX, TINDEX, inflation, investment
and government consumption. In this chapter, I summarise the major findings and
policy implications derived from the empirical chapters in this thesis. This chapter is
divided into two sections: Section 7.1 presents the general summary of the findings
from the empirical chapters, Section 7.2 presents contributions to the literature and
Section 7.3 presents the policy implications from the study.
7.1 General summary findings
The general objective of this study was thus to examine the relationship between
finance, FDI and economic growth in developing countries, in particular the BRIMCs
and SSA countries using a panel data technique. Specifically, this study attempted to
address four questions:
1. Does financial liberalisation lead to financial development in emerging
countries? If so, what is the impact of financial liberalisation in the emerging
countries of the BRIMCs and frontier markets in the SSA region?
319
2. Does financial development lead to economic growth in developing countries?
In particular, I focus on the role of institutions in the relationship between
financial development and economic growth.
3. What determines FDI inflow in developing countries? Does the interaction
between trade openness and human capital influence the inflow of FDI? And
does FDI promote economic growth in the BRIMCs and SSA regions?
4. Is financial development a precondition for the growth effect of FDI?
The second chapter examined the reasons for the differences in economic growth in
developing countries using Brazil, Russia, India, Mexico and China (i.e. BRIMCs) and
some selected Sub-Saharan African countries as case studies. For comparison to be
more meaningful, this chapter uses countries with similar level of per capita GDP.
Seychelles, Gabon, South Africa, Mauritius and Botswana display similar level of per
capita GDP to the BRIMC countries, thus making them suitable for a comparative case
study. However, there are other differences present to shed light on the divergent
growth paths they exhibit. The most obvious difference that may be instrumental in their
divergent growth experience is the nature of economic policies. Using the BRIMC
countries as a benchmark for growth, some economic projections were made for the
SSA countries. The results obtained reveal that if SSA countries should growth at their
present rate of 1.15 percent, it would take about 45 years for them to reach a similar
status with China; however it would take about 17years to reach the level of economic
development in the rest of the BRIMC countries. The main lessons for SSA countries
from the experience of the BRIMCs is for SSA government to develop an environment
that is free from excessive government interference, create favourable business
environment, promote and encourage a stable environment that would promote financial
development and encourage economic growth.
Following the results from Chapter two, the third chapter was set to examine the impact
of financial liberalisation on financial development in 11 emerging and frontier markets
for the period 1980-2007. In this chapter, I employed various measures of financial
liberalisation indicators to capture different aspects of financial reforms in developing
countries. The BHL official liberalisation date developed by Bekaert et al. (2000) was

320
used to capture the date when the financial system was liberalised. KAOPEN,
developed by Chinn and Ito, (2002) was used to capture capital account openness. I also
use FINDEX, developed by freedom house and is used to capture banking sector
efficiency as well as independence from government control in the financial sector. In
this section, I examine the impact of financial liberalisation on both banking sector and
stock market development in the SSA countries. The results obtained in this section
indicate that overall, liberalisation date is important in the development of the financial
sector. According to the result, BHL has a significant and positive impact on private
credit, market capitalisation and the value of stocks traded in the sample of countries.
The results also indicate that too much government intervention, as indicated by
FINDEX tends to dampen the development of the financial sector.
A closer look at both the emerging and frontier market indicates that whilst
liberalisation dates were important for financial development in emerging countries, too
much government control has led to a significant decrease in both the banking sector
and the stock markets. A similar result is noted with respect to capital account openness.
In the frontier market, I observe that whilst liberalisation date seem to be important for
the development of the stock market, the banking sector, in particular, liquid liability
seem to reduce with the date of liberalisation. I find that bank liquidity, stock market
capitalisation and the value of stocks traded were constrained by the government. A
similar result is noted with respect to capital account openness.
The results in the chapter also indicate that inflation has a positive and significant
relationship with financial development (Table 3-5, specification 3c). This result is
surprising; however it is possible that the countries in the sample exhibit a stable
environment. One of the major findings in Chapter three was that the proxy for
institutional development, ICRG_QoG shows a negative and highly significant sign of
the coefficient. This implies that institutions in the form of control of corruption,
bureaucratic quality and rule of law does not promote to level of development of liquid
liability and private credit. The findings of this chapter suggested that further empirical
studies are required to re-examine which type of institution promote financial
development in the frontier market. This investigation may help in determining which
aspect of institution is responsible for hindering financial development in SSA region.
This claim was investigated in Chapter four.
321
In the fourth chapter, I examined the role of institutions in financial development in
SSA countries. The main question was to investigate whether institutions, in particular,
economic, political and legal institutions were important for financial development in
SSA countries. Here, I found that whilst the quality of institutions was important for the
overall development of financial institutions, voice and accountability was equally as
important. Due to the heterogeneity of the SSA region, I further examined the role of
institution on financial development, according to their level of economic development.
As such, I examined the impact of institution on financial development in low income,
lower middle income and upper middle income countries. The results indicated that
institutions in the form of control of corruption, government effectiveness, and voice
and accountability tend to promote financial development in low income countries,
whereas regulatory quality seemed to be more important in lower middle income
countries. In the upper middle income countries, institutional quality does not appear to
be important for financial development, rather I found that the level of economic growth
coupled with low inflation was important.
Chapter five examined the determinants of FDI in developing countries, and in
particular the BRIMC and SSA countries. I examined whether the interaction between
openness and human capital was related to the inflow of FDI. Our results indicated that
an increase in the level of openness and human capital led to a slight increase in FDI,
and our result was statistically significant for all 30 countries used in the sample. In the
BRIMC countries, the result indicates that there is a threshold effect for the positive
impact of trade on FDI and vice versa. The implication is that, trade and human capital
are substitutes. This study also analysed the impact of the interaction between openness
and human capital, and FDI and openness on economic growth. The results showed that
the interaction terms are significant in promoting economic growth in the selected
developing countries.
Chapter five presents an interesting result in terms of the relationship between inflation
and economic growth. I find that inflation has a positive relationship with economic
growth in Asia albeit an insignificant coefficient. The positive sign of the coefficient
provides support to theoretical vagueness regarding the impact of inflation on economic
growth. According to the literature, regions with low and stable rates of inflation are
expected to grow faster when compared to other regions with high inflation rate.

322
The sixth chapter examined the long-run relationship between FDI, financial
development and economic growth in developing countries using a sample of 60
developing countries. The main findings from this chapter are that there is a long run
relationship between economic growth, FDI and financial development.
7.2 Contributions to the literature
The thesis contributes to the existing literature on finance-growth and FDI-growth
relationship by identifying and filling the gap in the literature on this topic and can be
summarised in the following aspect:
1. In chapter three, the research extends previous empirical evidence showing that
financial development differs along with the type of financial liberalisation
policy in place. With this in mind; several questions arise: Does financial
liberalisation lead to financial development in emerging countries and does the
structure of the financial system matter? Does the simultaneous opening of both
the financial and trade sector improve financial development?
2. In Chapter four, I contribute to the literature in several ways: I re-examine the
role of institutions in the law-finance, politics-finance and finance-growth
relationship by estimating a panel data equation that includes the various facets
of governance for 37 countries from SSA region. Recent empirical studies
suggest that a well-developed institution is important for the development of an
efficient financial sector. This chapter contributes to this debate by presenting a
deeper insight into this issue. Due to the low level of institutional quality in the
region, it was important to examine which aspect of institution was important for
financial development so that suitable policies can be drawn. Although
institutional quality has been gaining popularity in recent years, the role of
institutions on financial development is scare. In particular empirical studies on
the role of institutions in the development of the financial sector in Africa are
scare. Hence, this chapter contributes to the literature by examining the role of
institutions in the development of the financial sector in the SSA. In particular, I
try to establish which aspect of institution is important for financial development
so that policy makers can focus on such aspect. The main results of this chapter
were that rule of law, bureaucratic quality and control of corruptions, if
effectively managed, can promote financial development. In addition, the results

323
also indicate that good quality institutions influence the positive impact of
finance on growth in the SSA region. I tackle multicollinearity and endogeneity
bias by implementing a two-stage procedure for instrumentation and generalised
methods of moment (GMM). Generally, the most important contribution of this
thesis was providing a better understanding of the relationship between the
various facets of institutional quality and financial development. In addition to
examining the role of institutions in the finance-growth relationship.
3. In Chapter five, this thesis contributes to the existing literature on FDI-growth
relationship by identifying and filling the gap on this topic by analysing the
determinants of FDI and examining whether the level of human capital mediates
the positive influence of economic openness. It also contributes to the literature
by analysing the absorptive capacity and the growth effect of FDI in developing
countries with a particular focus on the BRIMCs and SSA region. The chapter
examines the role of both trade openness and human capital and examines the
impact of both factors simultaneously on the FDI-growth relationship. The
chapter also contributes to the literature by determining the threshold value of
absorptive capacity in the host country that positively correlates FDI with
growth.
4. Chapter Six contributes to existing economic literature by helping to reduce the
inconclusiveness of the empirical evidence regarding the role of financial
development in determining the relationship between FDI and economic growth.
The thesis also contributes to existing research by applying panel data analysis,
which is an important econometric technique for establishing solutions to policy
implications with macroeconomic data. In order to obtain consistent parameter
estimates, a number of econometric panel techniques were used in various
chapters.
7.3 Policy implication
As well as the contributions of the thesis, there are several policy implications that can
be drawn from each empirical chapter in this study:
The results of Chapter three suggest some policy implication for the effect of
financial liberalisation on financial development. The findings of this chapter
shows that the positive effect of financial liberalisation on financial development

324
seem to be more pronounced in the stock market than in banking sector.
However, I find that banking sector reforms have led to an increase in the level
of credit available to the private sector. The negative and significant relationship
between FINDEX and private credit indicates that government tend to have a
strong control on the activities of banking sector development in emerging
markets. Hence, it is important for policy makers to direct policies focusing on
reducing government interference in the banking sector. The result obtained in
Chapter three also suggests the need to promote capital account liberalisation in
order to positively benefit from financial liberalisation. In the frontier markets,
the result suggests that to effectively promote stock market development there is
a need for policy makers to carefully develop policies that takes into cognisance
the importance of institutions in order to benefit from financial reforms. In
particular, policy makers need to concentrate on rule of law, bureaucratic quality
and control of corruption. It is also important for government of these economies
to impose less restrictive regulatory regimes to keep away from poorly
functioning financial sectors.
The results of Chapter four suggest that there is a positive and statistically
significant relationship between institutions and financial development. I find
that there is a threshold effect for the simultaneous opening hypothesis to
promote financial development in SSA countries. The main policy implication
according to the study is that enhancing institutional infrastructure and
identifying the particular institution that would encourage the development of
the banking sector is important.
The main policy implication of Chapter five was that SSA countries need to
implement policies that focus mainly on the promotion of the level of stock of
human capital, infrastructural development and economic openness, in order to
be attractive to foreign investors. The result also suggests the need to promote a
good and stable environment and investment climate, in order to be attractive to
foreign investors. Results from this chapter also suggests that not only does FDI
promote growth by itself, but the magnitude of its effect depends on the host
country’s absorptive capacity, confirming the Borensztein et al (1998) and Li
and Liu (2005) findings. Hence, it suggests that there is a need for a change in
the policy recommendation suggesting that FDI’s positive impact on growth is
not dependent on other factors.

325
BIBLIOGRAPHY
Abiad, A., and A. Mody, (2005), “Financial Reform: what shakes it? What shapes it?”
in American Economic Review, 95-1, 66-88.
Abrevaya, J and S. G. Donald, (2010), “A GMM approach for dealing with missing data
on regressors and instruments”, [Online] available
<http://cefup.fep.up.pt/uploads/ECO%20Seminars/2011/StephenDonald_1_July.pdf>
accessed [11th
July, 2012].
Acemoglu, D., S. Johnson, and J.A. Robinson, (2001), “The colonial origins of
comparative development: an empirical investigation.” American Economic Reviews, 91
5, 1369-1401.
Acemoglu, D., S. Johnson, J.A. Robinson, and Y. Thaichareon, (2003), “Institutional
causes, macroeconomic symptoms: volatility, crises and growth.” Journal of Monetary
Economics, 50, 49-123.
Acemoglu D., S. Johnson, and J.A. Robinson, (2004), “Institutions as the fundamental
cause of long-run growth,” CEPR Discussion Paper No. 4458, [Online] available
<http://ssrn.com/abstract=571052> accessed [9th
December, 2009].
Acemoglu. D., and S. Johnson, (2005), “Unbundling Institutions,” Journal of Political
Economy, 113-5, 949-995.
Acemoglu, D., S. Johnson, J.A. Robinson, and P. Yared, (2005): “Income and
Democracy”, NBER Working Paper, 11205, National Bureau of Economic Research.
Achy, L., (2005), “Financial liberalisation, savings, investment and growth in MENA
countries”, Research in Middle East Economist, 6, 67-94.
Ackah, C., and O. Morrissey, (2005), “Trade policy and performance in Sub-Saharan
African since the 1980s”, Centre for research on economic development and
international trade, CREDIT, School of Economics, University of Nottingham, African
Development Bank, Economic Research Working Paper no 78.
Adams, S., (2009), “Can foreign direct investment (FDI) help to promote growth in
Africa?” African Journal of Business Management, 3-2, 178-183.
326
Adegbite O.E (2005), “Financial sector reforms and economic development in Nigeria:
the role of management”. Being a paper delivered at the National Conference of the
Academy of Management Nigeria, titled: Key to National Development November 22-
23, at Rockview Hotel, Abuja.
Adenikinju, A.F., (2003), “Electric infrastructure failures in Nigeria: A survey based
analysis of the costs and adjustment responses.” Energy policy, 31-14, 1519 – 30.
Adeniyi, O., (2008), “Foreign direct Investment, economic growth and financial sector
development in small open developing economies,” [Online] available
<http://www.revecap.com/encuentros/trabajos/a/pdf/008.pdf> accessed [10th August,
2011].
Adugna L. and S. Asefa, (2003), “Foreign direct investment and uncertainty: empirical
evidence from Africa,” The African Finance Journal, 5-1, 36-67.
Agarwal, S., (2001), “Stock market development and economic growth: preliminary
evidence from African countries”, Journal of Sustainable Development in Africa.
Agenor, P., and O. Montiel, (1996), Development Macroeconomics, Chapters 5 and 14,
Princeton, N.J.; Oxford Princeton University Press.
Aghion, P., and O.J. Blanchard, (1998), “On the privatisation methods in Eastern
Europe and their implications,” Economics of Transition, 6-1, 87-99.
Ahmad, E., and A. Malik, (2009), “Financial sector development and economic growth:
An empirical analysis of developing countries”, Journal of Economic cooperation and
development, 30-1, 17-40.
Ajakaiye. O, M. Ncube, and J. Macakiage, (2007), “Services and Economic development
in Africa: An overview” Journal of African Economies 161, 3-12
Ajayi, S.I., (2006), “FDI and economic development in Africa”, [Online] available
<http://www.afdb.org/fileadmin/uploads/afdb/Documents/Knowledge/09484246-EN-
FDI-AND-ECONOMIC-GROWTH.PDF> accessed [22nd
October 2008].
Akinboade, O. A. (2000), “The relationship between financial deepening and economic
growth in Tanzania”. Journal of International Development, 12: 939–950.

327
Akinlo, A., (2004), “Foreign direct investment and growth in Nigeria: An empirical
investigation,” Journal of Policy Modelling 26, 627–639.
Al-Tammam, M.G, (2005), “Causality between financial development and economic
growth: The cases of Kuwait, Oman and Saudi Arabia”, Unpublished PhD thesis
Colorado State University.
Alessandrini, M., and T. Buccellato, (2008), “China, India and Russia: Economic
reforms, structural changes and regional disparities,” UCL School of Slavonic and East
European Studies, centre for the study of economic and social change in Europe,
Economic working paper no 97.
Alfaro, L., A. Chanda, S. Kalemli-Ozcan, and S. Sayek, (2003), “FDI and economic
growth: The role of the local financial markets”, Journal of International Economics,
64-1, 89-112.
Alfaro. L., A. Chanda, S. Kalemli-Ozcan, and S. Sayek, (2004), “How does FDI
promote economic growth? Exploring the effects of financial markets on linkages.
NBER Working Paper no 12522, National Bureau of Economic Research, Cambridge,
MA.
Alfaro, L., Areendam, C., Kalemli-Ozcan, S., and Sayek, S. (2004), “FDI and economic
growth: The role of the financial markets”. Journal of International Economics, 64-1, 89-
112.
Alfaro, L., A. Chanda, S. Kalemli-Ozcan and S. Sayek, (2006), “How does Foreign
Direct Investment promote economic growth? Exploring the effects of financial markets
on the linkages” [Online], available <http://www.hbs.edu/research/pdf/07-013.pdf>
accessed [20th
January, 2009].
Alfaro, L., and A. Charlton (2006), “International Financial Integration and
Entrepreneurial Firm Dynamics”, Harvard Business School Working Paper 07-012
(August).
Al-Iriani, M., and F. Al-Shamsi, (2007), “Foreign direct investment and economic
growth in the GCC countries: A causality investigation using heterogeneous panel
analysis,” Discussion Papers.

328
Allen, D.S and L. Ndikumana, (2000), “Financial intermediation and economic growth
in Southern Africa”, Journal of African Economics, 9-2, 132-160.
Allen, F. and D. Gale (2000a), Comparing financial systems, Cambridge, MA: MIT
Press.
Allen, F. and D. Gale (2000b), “Bubbles and Crises”, The Economic Journal, 110, 236-
255.
Allen, F., E. Carletti, R. Cull, J. Qian, and L. Senbet, (2009), “The African financial
development gap,” [Online] available <http://erd.eui.eu/media/allen1.pdf> accessed [16th
November, 2010].
Alper, A (2008), “Financial development and economic growth: A panel co-integration
analysis of Middle East countries”, [Online], available <http://mpra.ub.uni-
muenchen.de/10593/1/MPRA_paper_10593.pdf> accessed [1st September, 2008].
Amal, M., B.T. Tomio and H. Rabouch, (2010), “Determinants of FDI in Latin
America,”Revista Journal, 4-3, 116-133.
Andrianova, S., P. Demetriades, and A. Shortland, (2008), “Government ownership of
banks, institutions and financial development”, Journal of Development Economics, 85,
218-252.
Ang, J.B., (2007), “What are the mechanisms linking financial development and
economic growth in Malaysia”, Economic Modelling, 25-1, 38-53.
Ang, J.B, (2008), Financial development and Economic Growth in Malaysia, Routledge
Studies in the Growth Economies of Asia.
Ang, J.B., and W.J. McKibbin, (2007), “Financial liberalisation, financial sector
development and growth: Evidence from Malaysia”, Journal of Development
Economics, 84-1, 215-233.
Anwar, S., and N.P. Nguyen (2010), “Foreign direct investment and economic growth
in Vietnam,” Asia Pacific Business Review, 16-1-2, 183-202.
Anyawu, J.C. (2011), “Determinants of Foreign Direct Investment in Africa: 1980-
2007,” working paper series no 136, African Development Bank Group.

329
Apergis, N, I. Filippidis and C. Economidou, (2007), “Financial deepening and
economic growth linkages: A panel data analysis”, Review of World Economics, 143-1.
Applegarth, P.A., W.H. Kansteiner, and J.S. Morrison, (2004), “Capital market and
financial sector development in Sub-Saharan Africa: A report of the Africa Policy
advisory Panel”, Centre for strategic and international studies, [Online] available
<http://csis.org/files/media/csis/pubs/0405_capitalmarkets.pdf> accessed [6th
June, 2011].
Arestis, P., and P.O. Demetriades (1996) “Finance and Growth: Institutional
considerations and causality,” University of East London, Department of Economics
Working paper no 5.
Arestis. P., and P.O. Demetriades, (1997), “Financial development and economic
growth: Assessing the evidence”, The Economic Journal, 107442, 783-799.
Arestis, P. and P.O. Demetriades (1999), “Financial liberalization: The experience of
developing countries”, Eastern Economic Journal, 25: 441-458.
Arestis. P., P.O. Demetriades, and K.B. Luintel, (2001), “Financial development and
economic growth: The role of stock market”, Journal of Money, Credit and Banking,
33-1, 16-41.
Arestis. P. (2003), “Financial Sector Reforms in Developing Countries with Special
reference to Egypt”, EconWPA in its series Economic History with no 0307001.
Arestis, P, (2005), “Financial liberalisation and the relationship between finance and
growth”, CEPP working paper no 05/05, Department of Land Economy, Cambridge
University.
Arestis, P., and A. Carner, (2009), “Financial development and the geography of
poverty”, Cambridge Journal of Regions, Economy and Society, 2, 229–244.
Aryeetey, E and F. Tarp, (2000), “Structural Adjustment and After: Which Way
Forward.” In: Aryeetey, Ernest, J. Harrigan and M. Nisanke (Eds.) Economic Reforms
in Ghana: The Miracle and the Mirage, Oxford: James Currey and Woeli Publishers.
330
Aryeetey, E., J. Court, M. Nissanke, and B. Weder, (2003), “Asia and Africa in the
global economy,” United Nations University Press Hong Kong.
Asiedu, E., (2002), “On the determinants of foreign direct Investment to developing
countries: Is Africa different?” World Development, 30-1, 107-119.
Asiedu, E. (2003), “Foreign Direct Investment to Africa: The role of government policy,
governance and political instability”, University of Kansas, Kansas, Mimeo.
Asogwa, R. C., (1993), “Financial liberalisation and macroeconomic stabilisation in
Nigeria”, Unpublished PhD Dissertation, University of Nigeria, Nsukka, Nigeria.
Atje, R., and B. Jovanovic, (1993), “Stock markets and development,” European
Economic Review, 37(2-3), 632-640.
Ayadi, O.F., E.O. Adegbite, and F.S. Ayadi, (2008), “Structural adjustment, financial
sector development and economic prosperity in Nigera”, International Research
Journal of Finance and Economics, 15, 318-331.
Ayanwale A.B. “FDI and Economic Growth: Evidence from Nigeria”, African
Economic Research Consortium Research Paper No. 165. H216
Azam, J.P., A. Fosu, and N.S Ndung'u, (2002), “Explaining slow growth in Africa”,
Africa Development Review, 14-2, 177-220.
Aziakpano, M., (2005), “Financial development and economic growth in small and
open African economy: Evidence from Lesotho”, [Online], The Economic Society of
South Africa, (ESSA), available <http://www.essa.org.za/download/2005Conference/
Aziakpono.pdf> accessed [2nd
June, 2011].
Azman-Saini, W.N.W., S.H. Law, and A. H. Ahmad, (2010), “FDI and economic
growth: New evidence on financial markets,” Economics Letter, 107-2, 211-213.
Badjun, M., (2009), “Financial intermediation by banks and economic growth: A
Review of empirical evidence”, Financial Theory and Practice, 33-2, 121-152.
Bagehot, W., (1873), Lombard Street, Homewood, IL: Richard D. Irwin, 1962 edition.

331
Bai, J. and S. Ng, (2010), “Panel unit root tests with cross-section dependence: A
further investigation,” Econometric Theory, 26, 1088-1114.
Balasubramanyam, V.N., M. Salisu, and D. Sapsord, (1996), “Foreign direct investment
and growth in EP and IS Countries”, The Economic Journal, 106-434, 92-105.
Balasubramanyan, V.N., (2001), “Foreign direct investment in developing countries:
determinants and impact”, OECD Global Forum on International Investment.
Baltagi, B.H. (2001), Econometric Analysis of Panel Data. 2d ed. New York: John
Wiley and Sons.
Baltagi, B., P.O. Demetriades, and S.H. Law, (2007), “Financial development, openness
and institutions: Evidence from panel data”, Paper provided by ESRC World Economy
and Finance Research Programme, Birkbeck, University of London in its series WEF
Working Paper with no. 0022.
Baltagi, B.H, (2008), Econometric Analysis of Panel Data, 4th
ed Chichester, UK: John
Riley.
Baltagi, B.H., P.O. Demetriades, and S.H. Law, (2008), “Financial development,
openness and institutions: evidence from panel data”, World Economy and Finance
research program.
Bandiera. O., G. Caprio, P. Honohan, and F. Schiantarelli, (2000), “Does Financial
Reform Raise or Reduce Saving?” Review of Economics and Statistics, 82-2, 239-263.
Bandyopadhyay, D., (2006), “How financial development caused economic growth in
the APEC: financial integration with FDI or privatisation without FDI,” Asia-Pacific
development Journal, 13-1, 75-100.
Bangake, C., and E. C. Jude, (2011), “Further evidence on finance-growth causality: A
panel data analysis,” Economic Systems, 35-2, 176-188.
Banister, J., D.E. Bloom, and L. Rosenberg, (2010), “Population aging and economic
growth in China,” [Online] Program on the global demography of aging, PGDA
working paper no 53, available <http://www.hsph.harvard.edu/pgda
/WorkingPapers/2010/PGDA_WP_53.pdf>, accessed [14th
November, 2011].

332
Barro, R.J., (1991), “Economic growth in cross-section of Countries”, Quarterly
Journal of Economics, 106, 407-444.
Barro, R.J. and J.W. Lee, (1993), “International comparisons of educational
attainment,” Journal of Monetary Economics, 32-3, 363-394.
Barro, R.J. and J.W. Lee, (1994), “Sources of economic growth”, Carnegie-Rochester
Conference Series on Public Policy, 40, 1-46.
Barro, R.J., and J.W. Lee, (2000), “International Data on Educational Attainment:
Updates and Implications”, Human Capital Updated files, CID Working Paper no. 42.
Barro, R.J., and X. Sala-i-Martin, (2004), Economic Growth, [e-book] The MIT Press:
available [https://rs69dt.rapidshare.com/#!download|69tl6|426882243| Barro__R.
Sala_i_Martin__X.Economic_Growth__MIT_Press__2004__2nd_Ed_.pdf|7059|R~667
06D9FC860D4345C473E3C584F07D7|0|0] accessed [4th
October, 2011].
Basu, P., H. Kawakatsu and M.R. Morey, (2000), “Liberalization and stock prices in
emerging markets”. Emerging Markets Quarterly, 4-3, 7-17.
Basu, P., C. Chakraborty, and D. Reagle, (2003), “Liberalization, FDI, and Growth in
Developing Countries: A Panel Co-integration Approach,” Economic Inquiry, 41, 510-
516.
Basu, S. and J. Abekah, (2008), “Foreign Direct Investment and Economic Growth of
Africa,” Atlantic Economic Journal, 36-1,117-118.
Batuo, E. M., and M. Kupukile, (2009), “How can economic and political liberalisation
improve financial development in African Countries?” [Online] MPRA Paper No. 19116.
available <http://mpra.ub.uni-munchen.de/19116/> accessed [17th September, 2010].
Beck, N., and J.N. Katz (1995), “What to do (and not what to do) with times series
cross-section data” American Political Science Review, 89-3, 634-647.
Beck, T. A. Dermirguc-Kunt, and R. Levine, (1999), “A new database on financial
development and structure”, World Bank Policy Research Working Paper no 2146.

333
Beck, T., A. Demirguc-Kunt, and R. Levine, (2000), “A new database on financial
development and structure,” World Bank Economic Review 14, 597-605.
Beck, T., A. Demirgüç-Kunt, R. Levine and V. Maksimovic. (2001), “Financial
Structure and Economic Development: Firm, Industry, and Country Evidence.” In A.
Demirgüç-Kunt and R. Levine (eds.), Financial Structure and Economic Growth: A
Cross-Country Comparison of Banks, Markets, and Development, New York: Oxford
University Press.
Beck, T and R. Levine, R., (2002), “Industry Growth and capital accumulation: does
having a market- or bank-based system matter?” Journal of Financial Economics, 64,
147–180.
Beck, T., A. Demirguc-Kunt, and R. Levine, (2003), “Law, endowment and finance”,
Journal of Financial Economics, 70,137-181.
Beck, T., A. Demirguc-Kunt, and R. Levine, (2004), “Finance, inequality, and poverty:
Cross-country Evidence”, The World Bank in its series policy research working paper
no 3338.
Beck, T., and R. Levine, (2004), “Stock markets, banks and growth: Panel evidence”.
Journal of Banking and Finance, 28, 423–442.
Beck, T., and L. Laeven, (2005), “Institutions building and growth in transition
economies”, The World Bank in its series policy research working paper no 3657.
Beck, T., and L. Laeven, (2006), “Institutions building and growth in transition
economies”, Journal of Economic Growth, 11-2, 157-186.
Beck, T., A. Demirguc-Kunt, and R. Levine, (2007), “Finance, inequality, and the
poor”, Journal of Economic Growth, 12-1, 27-49.
Beck, T, E. Feyen, A. Ize and A.F. Moizeszowicz, (2008), “Benchmarking financial
development”, The World Bank in its series policy research working paper no 4638.
334
Beck, T., and A. Demirguc-Kunt, (2009), “Financial institutions and markets across
countries and over time: Data and Analysis”, World Bank, [Online] available
http://siteresources.worldbank.org/INTRES/Resources/4692321107449512766/Financia
l_Institutions_and_Markets_across_Countries.pdf, accessed [2nd
February, 2010].
Beck, T., Demirguc-Kunt, A. and R. Levine, (2010), “Financial institutions and markets
across countries and over time: The updated financial development and structure
database”, World Bank Economic Review, 24-1, 77–92.
Becker, C., and C. Noone, (2008), “Volatility and persistence of capital flow in
Regional financial integration in Asia: present and future,” [Online], available
<http://www.bis.org/publ/bppdf/bispap42f.pdf?noframes=1>, Bank for International
Settlement paper chapters no 42, 159-180 accessed [12th
February, 2009].
Becker, G. (1993), “The Economic way of looking at behaviour”, Journal of Political
Economy, 101-3, 385-409.
Bekaert, G., Harvey, C. R., & Lundblad, C. (2001), “Does financial liberalization spur
growth?, NBER Working Paper no. 8245.
Bekaert, G., and C.R. Harvey, (2002), “A Chronology of Important Financial,
Economic and Political Events in Emerging Markets”, [Online] available
http://www.duke.edu/~charvey/chronology.htm, accessed [12th
May, 2008].
Bekaert, G., Harvey, C. R., & Lundblad, C. (2005), “Does financial liberalization spur
growth?” Journal of Financial Economics, 77-1, 3–56.
Bencivenga V.R and B.D Smith, (1991), “Financial intermediation and endogenous
growth”, Review of Economic studies, 58-2, 195-209.
Bencivenga, V.R. and B.D Smith, (1993), “Some consequences of credit rationing in an
endogenous growth model”, Journal of Economic Dynamics and Control, 17, 97-122.
Bencivenga, V.R., B.D. Smith and R.M. Starr, (1996), “Liquidity of secondary capital
markets: Allocative efficiency and the maturity composition of the capital stock,”
Economic Theory, 7-1, 19-50.
335
Berglof, E., and A. Lehmann, (2009), “Sustaining Russia’s Growth: The role of
financial reforms”, Journal of Comparative Economics, 37-2, 198-206.
Bertola, G., and A. Lo Prete, (2011), “Governments, Trade and finance”, [Online],
available <http://www.nottingham.ac.uk/gep/documents/conferences/2011/gep-ifo-
conf-february/anna-lo-prete.pdf > accessed [26th June, 2011].
Bhide, A., (1993), Reversing Corporate Diversification. In: The New Corporate
Finance- Where theory meets practice, ed. D.H. Chew Jr., McGraw Hill.
Bianchi, M., (2008), “Financial development, entrepreneurship and job satisfaction”,
Paris School of Economics working paper no 2008-59. [Online], available <
http://hal.archives-ouvertes.fr/docs/00/58/60/59/PDF/wp200859.pdf> accessed [26th
May, 2011].
Blackburn, K., N. Bose and M.E. Haque, (2005), “The incidence and persistence of
corruption in economic development”, Journal of Economic Dynamics and Control,
forthcoming.
Blomstrom, M, R.E. Lipsey and M. Zejan, (1992) “What Explains Developing Country
Growth?” NBER Working Paper No. 4132. NBER.
Blomstrom, M., A. Kokko and M. Zejan (1994), “Host Country Competition and
Technology Transfer by Multinationals”, Weltwirtschaftliches Archiv, Band 130, 521-
533.
Blomstrom, M., and F. Sjoholm, (1998), “Technology transfers and spillovers: Does
local participation with multinationals matter?” NBER Working paper no 6818.
Blomstrom, M., and A. Kokko, (2003), “Human capital and inward FDI”, Centre for
Economic Policy Research, CEPR discussion paper 3762.
Boot, A, and A. Thakor, (1997), “Financial system architecture”, Review of Financial
Studies, 10-3, 693-733.
Bordo, Michael D. and P.L. Rousseau, (2006), “Legal-political factors and the historical
evolution of the finance-growth link,” European Review of Economic History,
Cambridge University Press, 10-03, 421-444.
336
Borensztein, E., J. Gregorio, and J. W. Lee, (1995), “How does FDI affect growth?”
[Online], available <http://papers.ssrn.com/sol3/papers.cfm?abstract_id=225836>
National Bureau of Economic Research working paper no W5057 accessed [20th
January, 2009].
Borensztein, E., et al. (1998), “How does foreign direct investment affect economic
growth?” Journal of international economics, 45, 115-135.
Bosworth, B., and S. Colllins, (1999), “Capital Flows to Developing Economies:
Implications for Saving and Investment,” Brookings Papers on Economic Activity, 1,
143-169.
Boyd, J and B. Smith (1996), “The Co-evolution of the Real and Financial Sectors in
The Growth Process”, The World Bank Economic Review, 10, 371-396.
Boyd, J. H; and B.D Smith (1998), “The evolution of debt and equity market in
Economic development”, Economic Theory, 12, 519-560.
Brakman, S., H. Garretsen, and C. Van Marrewijk, (2006), An Introduction to
Geographical Economics, Cambridge University Press, Cambridge.
Brooks, S.M, (2004), “Explaining capital account liberalisation in Latin America: A
transitional cost approach”, World Politics, 56(3), 389-430.
Brownbridge, M., and C. Kirkpatrick, (1999), “Financial Sector Regulation: The
Lessons of the Asian Financial Crisis”. Development Policy Review 17, 243-266.
Buckley, P., and M. Casson, (1976), The future of the Multinational Enterprise.
Macmillan press ltd, London.
Buckley, P and M. Casson, (1981), The economic theory of the Multinational
enterprise. Macmillan press ltd, London.
Bueno, N.P., (2008), “Institutions and economic growth in Sub-Saharan Africa, 2001-
2006”, paper prepared for workshop in political theory and policy analysis
miniconference [Online], available <http://www.indiana.edu/~workshop/seminars/
papers/bueno_mcpaper08.pdf> accessed [8th
June, 2011].

337
Buiter, W., and A. Taci, (2003), “Capital account liberalisation and financial sector
development in transition countries”, in Capital Liberalisation in Transition Countries:
Lessons from the Past and for the Future, ed. By A. Bakker, and B. Chapple,
(Cheltenham, England, and Northampton, Massachusetts: Edward Elgar), p. 105-41.
Calderon, C. and L. Liu, (2002), “The Direction of Causality Between Financial
Development and Economic Growth” Working Papers Central Bank of Chile 184,
Central Bank of Chile.
Cameron R, O. Crisp, T.H Patrick and R. Tilly, (1967), Banking in the early stages of
industrialisation, New York: Oxford University Press.
Campos, N.F., and Y. Kinoshita, (2002a), “When is FDI good for growth? A First Look
at the Experience of the Transition Economies”. Working Paper.
Campos, N. F. and Y. Kinoshita, (2002b), “Foreign Direct Investment as Technology
Transferred: Some panel Evidence from the Transition Economies,” Centre for
Economic Policy Research. Discussion papers no 3417. [Online] available
<www.cepr.org/pubs/dps/DP3417.asp> accessed [16th
February, 2009].
Campos, N.F. and Y. Kinoshita, (2003), “Why does FDI go where it goes? New
evidence from the transition economies”, [Online] available at
<http://www.bus.umich.edu/KresgeLibrary/Collections/Workingpapers/wdi/wp573.pdf
> William Davidson Institute working paper no 573 accessed [16th
February 2009].
Campos, N.F., and Y. Kinoshita, (2004), “Estimating the Determinants of Foreign
Direct Investment Inflows: How Important are Sampling and Omitted Variable
Biases?,” BOFIT Discussion Papers 10/2004, Bank of Finland, Institute for Economies
in Transition.
Campos, N.F. and Y. Kinoshita, (2008), “Foreign direct investment and domestic
financial reform: A marriage made in heaven” [Online] available
<http://www.imf.org/external/np/vc/2008/032408.htm> accessed [15th
March 2009].
Campos, N., and F. Coricelli, (2009), “Financial liberalization and democracy: The role
of reform reversal.” Institute for the Study of Labor (IZA), in its series IZA Discussion
Papers with number 4338.

338
Carkovic, M., and R. Levine, (2002), “Does Foreign Direct Investment Accelerate
Economic Growth?” University of Minnesota, Working Paper.
Carkovic, M., and R. Levine, (2005), “Does foreign direct investment accelerate
economic growth?” In Graham E. M., T.H. Moran, and M. Blomstrom (eds.), “Does
Foreign Direct Investment Promote Development: New Methods, Outcomes and Policy
Approaches”, 195–220, Washington, D.C.: Institute for International Economics Press.
Carmignani, F. and A. Chowdhury, (2007), “Does Financial Openness Promote
Economic Integration?,” UNECE in its series ECE Discussion Papers Series with no
2007_4.
Caves, R.E. (1971). “International Corporations: The industrial economics of foreign
investment”, Economica, 38, 1-27.
Caves, R.E. (1982), Multinational enterprise and economic analysis, Cambridge
University Press, Cambridge.
Central Statistics Office (CSO) (2006), Preliminary Labour Force Survey Results, Stats
Brief. No. 02/2006. Gaborone: Central Statistics Office
Chakrabarti, A., (2001), “The determinants of foreign direct investment: sensitivity
analyses of cross-country regressions”, Kyklos, 54: 89-113.
Chakraborty, C., and P. Nunnenkamp (2008), “Economic Reforms, FDI and Economic
Growth in India: A Sector Level Analysis”. World Development, 36-9, 1192-1212.
Chandavarker, A, (1992), “Of finance and development: Neglected and unsettled
questions”, World Development, 20:133-42.
Charles, A. and N. Biekpe, (2006) “Interest rate and stock market returns in Africa,”
The African Finance Journal, 8-2:12-30.
Cheng, L.K., and Y.K. Kwan, (2000), “What are the determinants of the location of
FDI? The Chinese Experience”, Journal of International Economics, 51, 379-400

339
Cheng, X., and H.A. Degryse, (2006), “The impact of Bank and non-Bank financial
institutions on local economic growth in China” Tilburg University, Centre for
Economic Research in its series Discussion Paper no. 2006-82.
Cherif, M., and K. Gazdar, (2010), “Macroeconomic and institutional determinants of
stock market development in MENA region: new results from panel data analysis”, The
International Journal of Banking and Finance, 7-1, 145-166.
Chinn, M.D., and H. Ito, (2002), “Capital account liberalization, institutions and
financial development: Cross-country evidence.” NBER Working Papers No. 8967.
Chinn, M.D., and H. Ito, (2006), “What matters for financial development? Capital
controls, Institutions and Interaction”, Journal of Development Economics, 81-1, 163-
192.
Chinn, M.D., and H. Ito, (2008), “A new measure of financial openness”, Journal of
Comparative Policy Analysis, 10-3, 309-322.
Chinn, M.D., and H. Ito, (2009a), “East Asia and global imbalances: Saving,
investment, and financial development”. In T. Ito and A. Rose, ed., Financial sector
development in the Pacific Rim, National Bureau of Economic Research-East Asian
Seminar on Economics (NBER-EASE), 18.
Chinn, M.D., and H.Ito, (2009b), “Notes on the Chinn-Ito Openness Index,” [Online]
available <http://web.pdx.edu/~ito/Readme_kaopen2009.pdf>, accessed [12th
July,
2010].
Choi, I. (2001), “Unit Roots Tests for Panel Data.” Journal of International Money and
Finance, 20, 229-27.
Christopoulos, D. and E. Tsionas, (2004), “Financial development and economic
growth: Evidence from panel unit root and co-integration tests”, Journal of
Development economics 51-2: 387-411.
Chuhan-Pole, P, (2010), Yes Africa Can: Success stories from a dynamic continent, The
International Bank for Reconstruction and Development / The World Bank, Washington
DC
340
Cinyabuguma, M.M., and L. Putterman, (2010), “Sub-Saharan growth surprises: Being
heterogeneous, inland and close to the equator does not slow growth within Africa”,
Journal of African Economies, 20-2, 217–262.
Claessens, S., and L. Laeven, (2002), “Financial development, property rights and
growth”, The World Bank in its series policy research working paper no 2924.
Claessens, S., and E. Feijen, (2006), “Financial sector development and the Millennium
development goals”, [Online], available <http://www.microfinancegateway.org/
gm/document-1.9.25779/36636_file_1.pdf>, accessed [26th
May, 2011].
Clague, C., et al. (1996), “Property and Contract Rights Under Autocracy and
Democracy”. Journal of Economic Growth, 1: 243-76.
Collier, P., and J.W. Gunning, (1999), “Explaining African economic performance,”
Journal of Economic Literature, 37-1, 64-111.
Collier, P., and J.W. Gunning, (1999), “Why Has Africa Grown Slowly?” Journal of
Economic Perspectives 12-3, 3-22.
Collier, P., and J.W. Gunning, (1994), “Trade and development: Protection, shocks, and
liberalization”. In D. Greenway and L.A. Winters, eds., Surveys in International Trade.
Oxford: Blackwell
Collier, P., (2004), ‘Development and Conflict’, Centre for the Study of African
Economies, Department of Economics, Oxford University [Online] available <
http://www.un.org/esa/documents/Development.and.Conflict2.pdf> accessed [26th
May,
2011].
Collier, P., (2006), “Economic causes of civil wars and their implications for policy”,
[Online], available <http://users.ox.ac.uk/~econpco/research/pdfs/EconomicCausesof
CivilConflict-ImplicationsforPolicy.pdf>, accessed [20th
September, 2011].
Collier, P., & Gunning, J.W (2006), “Why has Africa grown so slowly?”. Journal of
Economic Perspectives, 13, 3-2.

341
Creane, S., R. Goyal, A.M. Mobarak, and R. Sab, (2003), “Financial development in the
Middle East and North Africa”, International Monetary Fund, in its series IMF working
papers with number 04/201.
Crespo, N., and M.P. Fontoura, (2007), “Determinant Factor of FDI spillovers - What
do we really know”? World Development, 35-3, 410-425.
Das, D.K., (2006), “Globalisation in the world of finance: An analytical history,”
Global Economy Journal, 6-1, 12
Data and Statistical Services, (2007), “Panel Data”, [Online] available
<http://dss.princeton.edu/online_help/analysis/panel.htm>, The Trustees of Princeton
University accessed [25th
July, 2010].
Daumont, R., F. Le Gall and F. Leroux, (2004), “Banking in Sub-Saharan Africa: What
went wrong?”, International Monetary Fund, in its series IMF working papers with
number 04/55.
De Carvalho, F.J.C., (n.d)., “Domestic financial liberalisation: The recent experience of
Argentina, Brazil and Mexico,” [Online], available <
http://www.ie.ufrj.br/datacenterie/pdfs/seminarios/pesquisa/texto2503.pdf> accessed
[6th
November, 2011].
De Gregorio, J. and P.E. Guidotti, (1995), “Financial development and economic
growth” World Development Journal. 3, 433-448.
De Mello, L.R, (1997), “Foreign direct investment in developing countries and growth:
A selective survey”, Journal of Development Studies, 34, 1-34.
De Mello, L.R, (1999), “Foreign direct investment-led growth: Evidence from time
series and panel data”, Oxford Economic papers, 51, 133-151.
De Mello, J., and J. Tybout, (1986), “The effect of financial liberalisation on savings
and investment in Uruguay”, Economic development and culture change, 34(3), Growth
reform and adjustment: Latin America’s trade and macroeconomic policies in the 1970s
and 1980s. p. 561-587.

342
De Soto, H. (1989). The Other Path: the Invisible Revolution in the Third World.
Harper and Row, New York.
De Soto, H. (2000), The Mystery of Capital: Why Capitalism Triumphs in the West and
Fails Everywhere Else. Bantam Press – Black Swan edition, London.
De Soysa, I., and S. Jutting, (2006), “Informal institutions and development: think local,
act global?” Discussion paper presented at the International seminar on: “Informal
Institutions and Development–What do we know and what can we do?, OECD
Development Centre and Development Assistance Committee – Network on Governance
Demetriades. P.O., and P. Arestis, (1996), “Financial Development and Economic
Growth: Assessing the Evidence,” Keele Department of Economics Discussion Papers
(1995-2001) 96/16, Department of Economics, Keele University.
Demetriades, P. O. and K.B. Luintel (2001), “Financial restraints in the South Korean
miracle,” Journal of Development Economics, 64-2, 459-479.
Demetriades, P.O, and S. Andrianova, (2003) ‘Finance and Growth: What We Know
and What We Need to Know’, Department of Economics, University of Leicester in its
series discussion papers in Economics with no 03/15.
Demirguc-Kunt, A and J. Maksimovic, (1998), “Law, finance and firm growth”, The
Journal of Finance, 53, 2107-2137.
Demirguc-Kunt, A., and E. Detragiache, (1999), “Financial liberalisation and financial
fragility”, World Bank Policy Research Working Paper no 1917.
Demirguc-Kunt, A., and R. Levine, (1999), “Bank-based and Market-based financial
systems: Cross-country comparisons”, World Bank policy working paper no 2143.
Demirguc-Kunt, A. and R. Levine, (2008), “Finance, Financial Sector Policies, and
Long-Run Growth”, [Online], available <http://papers.ssrn.com/sol3/papers
.cfm?abstract_id =1081783> World Bank policy research paper no 4469.
Denmark National Bank, (2004), “Monetary Review, 4th
Quarter”, [Online] available <
http://www.statsgaeld.dk/C1256BE9004F6416/side/Monetary_review_4_Quarter_2004/
$file/MON4_04.pdf > accessed [16th
October, 2008]

343
Department for International Development (DFID), ‘The importance of financial sector
for growth and poverty reduction’, <http://www.ncrc.org/global/europe/UK/
UKArticle7.pdf> accessed, [22nd October, 2008].
Detragiache, E., P. Gupta and T. Tressel (2005). “Finance in Lower Income Countries:
an Empirical Exploration”, Working Paper no 05/167, International Monetary Fund,
Washington, D. C.
Dhakal, D, F. Mixon, Jr., and K. Upadhyaya, (2007), “Foreign direct investment and
transition economies: empirical evidence from a panel data estimator.”Economics
Bulletin, 6-33, 1-9.
Diamond, D.W and R.E. Verrecchia, (1982), “Optimal managerial contracts and
equilibrium security prices,” Journal of Finance, American Finance Association, 37-2,
275-87.
Diamond, D., (1984): “Financial Intermediation and Delegated Monitoring”, Review of
Economic Studies, 51, 393-414.
Diop, A., G. Dufrenot, and G. Sanon, (2010), “Is Per Capita Growth in Africa
Hampered by Poor Governance and Weak Institutions? An Empirical Study on the
ECOWAS Countries”, African Development Review, 22-2, 265-275.
Djankov. S., C. McLiesh, and A. Shleifer (2007), “Private Credit in 129 Countries,”
Journal of Financial Economics, 84-2, 299-329.
Do, Q.T. and A. Levchenko (2006), “Comparative Advantage, Demand for External
Finance and Financial Development”, World Bank Policy Research Working Paper,
Washington D.C.
Doring, T., and J. Schnellenbach, (2004), “What do we know about geographical
knowledge spillovers and regional growth? – A survey of the literature”, Deutsche Bank
research, research notes working paper series.
Dunning, J.H., (1980), “Toward an eclectic theory of international production: Some
empirical tests”, Journal of International Business Studies, 11, 9-31.
344
Dunning, J.H. (1988), “The Eclectic Paradigm of International Production: A
restatement and some possible extensions”, Journal of International Business Studies
19, 1-32.
Dunning, J.H. (1993), Multinational Enterprises and the Global Economy, Addison-
Wesley, Wokingham England.
Dunning, J.H., (1998) “Location and the Multinational enterprise: A neglected factor”,
Journal of International Business Studies, 29-1, 46-66.
Dupasquier, C., and P.N. Osakwe (2005), “FDI in Africa: Performance, challenges and
responsibilities,” African Trade Policy Centre, ATPC Working Paper no. 21, Economic
Commission for Africa.
Easterly, W., and R. Levine, (1997), “Africa’s growth tragedy: Policies and Ethnic
Divisions” Paper provided by Harvard - Institute for International Development in its
series paper with no. 536.
Economic Intelligence Unit, (2005), “Country Profile,” Louisiana State University,
[Online] available <http://www.eiu.com>, accessed [16th
November, 2011].
Edwards, S., (1990) Capital Flows, Foreign Direct Investment, and Debt-Equity Swaps
in Developing Countries, NBER working paper no. 3497.
Edwards, S., (1999), Crisis and Reform in Latin America: From Despair to Hope, New
York, NY: Oxford University Press.
Egbetunde, T. and H.I. Mobolaji, (2010), “An Empirical Analysis of Causality between
financial development economic growth: further evidence from Sub-Saharan Africa”,
Journal of Economics theory, 4-2, 50-58.
Egger, P., and M. Pfaffermayr, (2004), “Distance, trade and FDI: A Hausman-Taylor
SUR approach”, Journal of Applied Economics, 19, 227-46.
Eller M., P. R. Haiss and K. Steiner, (2005), “Foreign direct investment in the financial
sector: The Engine of growth for Central and Eastern Europe” [Online], available
<http://papers.ssrn.com/sol3/papers.cfm?abstract_id=875614> accessed [20th January
2009].

345
Engel R.F and C.W.J Granger (1987), “Cointegration and error correction:
representation, estimation and testing”, Econometrica, 55, 251-276.
Favara, G., (2003), “An empirical reassessment of the relationship between finance and
growth.” IMF Working Paper 03/123, IMF.
Feenstra, R. C., and G.H. Hanson, (1997), “Foreign direct investment and relative
wages: Evidence from Mexico’s Maquiladoras”, Journal of International Economics,
42-3, 371-393.
Fernandes, A.M., and A.C. Kraay, (2007), Property rights institutions, contracting
institutions and growth in South Asia: Macro and Micro evidence. In Ahmed S, and G.
Ejaz, (eds.), South Asia: Growth and regional integration, MACMILLAN, New Delhi.
Fowowe, B., (2008), “Financial liberalisation policies and economic growth: Panel data
evidence from Sub-Saharan Africa”, African Development Bank,20-3, 549-574.
Fowowe, B., (2010), “The finance-growth nexus in Sub-Saharan Africa: Panel Co-
integration and Causality test,” Journal of International Development, 23-2, 220-239.
Friedman, T. (2006), The World is Flat – A Brief History of the Twenty-First Century.
New York. Farrar, Straus, and Giroux.
Fry, M.J., (1995), Money, Interest and Banking in Economic Development, 2nd
edn.
London: John Hopkins University Press.
Fry, M. J., (1997), “In favour of financial liberalisation”. Economic Journal, 107, 754-
770.
Fry, M .J. (1998), “Pitfalls and potential of financial liberalisation”, Ekonomia, 2, 1-28.
Fuchs-Schundeln, N., and N. Funke, (2001), “Stock market liberalization: Financial and
macroeconomic implications”. Working paper No. 01/193. International Monetary
Fund, Washington, DC.
Fukuyama, F., and S. Marwah, (2000), “Comparing East Asia and Latin America:
dimensions of development”, Journal of Democracy, 11-4, 80-94.

346
Galan, B.I.V., (2006) “The effect of trade liberalisation and foreign direct investment in
Mexico”, Unpublished PhD Thesis, University of Birmingham, UK.
Garrido, L. (2009, March, 23rd), Income Benchmark, [PowerPoint slides] World Bank,
Washington DC.
Gastanaga, V., J. Nugent, and B. Pashamiova, (1998), “Host Country Reforms and FDI
Inflows: How Much Difference Do They Make?” World Development, 26-7, 1299-1314
Gastil, R. (1989), “Freedom in the World: Political Rights and Civil Liberties, 1988-
1989”, New York: Freedom House.
Gelbard, E.A., and S. P. Leite, (1999), “Measuring financial development in Sub-
Saharan Africa,” International Monetary Fund IMF Working Paper 99/105.
Gerschenkron, A., (1962), Economics backwardness in historical perspective. A Book of
Essays. Harvard University Press, Cambridge, MA.
Ghimire, B., and G. Giorgioni, (2009), “Puzzles in financial development and economic
growth”. Working Paper, Liverpool Business School, Liverpool John Moores
University.
Gholami, R., S-Y. Tom Lee, and A. Heshmati, (2006), “The causal relationship between
information and communication technology and Foreign Direct Investment, The World
Economy, 29-1, 43-62.
Girma, S. (2003), “Absorptive capacity and productivity spillovers from FDI: A threshold
regression analysis”, Working Paper No. 25/2003, European Economy Group.
Goldsmith, R.W., (1959), Supplementary Memoranda - Financial structure and
development as a subject for international comparative study, National Bureau of
Economic Research, As submitted to the Princeton meeting. [Online] available <
http://www.nber.org/chapters/c4417.pdf>, accessed [20th
November, 2008].
Goldsmith R.W., (1969). Financial structure and development, Yale University Press,
New Haven.

347
Goldsmith, A.A. (1998). “Institutions and economic growth in Africa”. Harvard
Institute for International Development [Online] available < http://pdf.usaid.gov/pdf
_docs/PNACE023.pdf > accessed [15th
October, 2011].
Goodspeed, T., J. Martinez-Vazquez and L. Zhang, (2006), “Are Government Policies
More Important Than Taxation in Attracting FDI?.” ISP Working Paper Number 06-14,
International Studies Program working paper series.
Granger, C.W.J., (1988), “Causality, cointegration, and control,” Journal of Economic
Dynamics and Control, 12-(2-3), 551-559
Greenberg, D., (2003), Longitudinal Data Analysis, personal communication, referring
to the research of Nathaniel Beck.
Greenidge, K., C. Milner, and G. Reed, (2004), “Financial developments and the
Saving-Investment-Growth Nexus: Evidence from the Caribbean and Latin America.”
Paper Presented at the 37th Annual Monetary Studies Conference, Central Bank of
Trinidad and Tobago Conference Facilities, 16th Floor, November 14, 2004.
Greenwood, J and B. Javanovic, (1990), “Financial development, growth, and the
distribution of income,” Journal of Political Economy, 98-5: 1076-1107.
Greenwood, J and B.D. Smith, (1997), “Financial markets in development, and the
development of financial markets,” Journal of Economic Dynamics and Control, 21-1,
145-181.
Gries, T., and D. Meierrieks, (2010), “Institutional quality and financial development in
Sub-Saharan Africa”, [Online] available <http://www.ile-hamburg.de/_data/Gries___
Meierrieks_Institutional_Quality_and_Financial_Development_in_Sub-Saharan_Africa
.pdf> accessed [16th
November, 2010].
Grossman, G.M. and E. Helpman, (1991), “Trade, knowledge spillovers, and growth,”
European Economic Review, 35-(2-3), 517-526.
Guillaumont, J. S., P. Hua and Z. Liang, (2006), “Financial development, economic
efficiency and productivity growth: Evidence from China”, The Developing Economies,
44, 27- 2.
348
Gulde, A.M, C. Patillo and J. Christensen, (2006), “Sub-Saharan Africa financial sector
challenges”, (Washington: IMF) [Online], available <http://www.imf.org/
external/Pubs/NFT/2006/Africa/eng/ssa.pdf> accessed [18th September, 2010].
Gurley, J.G and E.S, Shaw, (1955), “Financial aspects of economic development”,
American Economic Review, 45-4, 515-538.
Gwartney, J.D., J. C. Hall, and R. Lawson, (2010), Economic Freedom of the World:
2010 Annual Report. Vancouver, BC: The Fraser Institute. Data retrieved from
<www.freetheworld.com>, accessed [13th
September, 2010].
Gyimah-Brempong, K., and M.E. Corlry, (2005), “Civil wars and economic growth in
Sub-Saharan Africa,” Journal of African Economies, 14-2, 270-311.
Hadenius, A., and J. Teorell (2005), “Assessing Alternative Indices of Democracy”,
CandM Working Papers 6, IPSA, [Online] available <http://www.conceptsmethods.org/
working_papers/20050812_16_PC%206%20Hadenius%20and%20Teorell.pdf>,
accessed [21st July, 2010].
Hadfield, G.K., (2004), “Delivering legality on the internet: developing principles for the
private provision of commercial law,” American Law and Economics Review, 6-1: 154-
184.
Hadri, K., (2000), “Testing for stationarity in heterogeneous panel data,” Econometrics
Journal, 3-2, 148-161.
Harrison, A. and A. Revenga, (1995), “The effects of trade reform policy: what do we
really know?,” National Bureau of Economic Research, Inc in its series NBER Working
Papers with number 5225, Cambridge Mass.
Harrold, P., M. Jayawickrama, and D. Bhattasali, (1996), “Practical lessons for Africa
from East Asia in industrial and trade policies.” In World Bank discussion papers WDS
310, African technical development series, World Bank Publication, Washington/US.
Hassan, M. K., and J. Suk-Yu, (2007), “Financial Sector Reform and Economic Growth
in Morocco: An Empirical Analysis”. Networks Financial Institute Working Paper, WP-
28, Social Science Electronic Publishing.

349
Hawksworth and Cookson (2008), ‘The World in 2050: Beyond the BRICs: a broader
look at emerging market growth prospects’ [Online] PriceWaterhouseCoopers LLP,
available on <http://www.pwc.com/gx/en/world-2050/pdf/world_2050_brics.pdf>
accessed [12th
November, 2011].
Hawksworth, J. (2006), “The World in 2050: How big will the major emerging market
economies get and how can the OECD compete?” [Online] PriceWaterhouseCoopers,
available on <http://www.pwc.com/gx/en/world-2050/pdf/world2050emerging
economies.pdf> accessed [12th
November, 2011].
Hellman, J.S., G. Jones, and D. Kaufmann, (2000), ‘Seize the State, Seize the Day: State
Capture, Corruption and Influence in Transition.’ World Bank Policy Research Working
Paper 2444.
Henry, P.B., (2006), “Capital account liberalization: Theory, evidence and speculation”,
NBER Working Paper, no.12698.14.
Herbst, J., (2005), “Africa and the challenge of globalisation”, presented at the
conference on globalisation and economic success: policy options for Africa, Singapore,
7-8, November.
Herger, N., R. Hodler, and M. Lobsinger, (2007), “What determines financial
development? Culture, Institutions or Trade”, DEGIT, Dynamics, Economic Growth,
and International Trade in its series DEGIT Conference papers with number c012_033.
Heritage Foundation Index of Economic Freedom (2010), 2010 Index of economic
freedom: Promoting economic opportunity and prosperity, [Online] available <
http://www.heritage.org/index/> accessed [16th
February, 2010].
Hermes, N. and R. Lensink, (2003), “Foreign direct investment, financial development
and economic growth,” The Journal of Development Studies, 40-1, 142-163.
Hermes, N., and R. Lensik, (2005), “Does financial liberalisation in financial
liberalisation influence saving, investment and economic growth? Evidence from 25
emerging market economies, 1973-96”, United Nations University World Institute for
Development Economic Research, UNU-WIDER research paper no 2005/69.

350
Heston, A., R. Summers, and B. Aten, (2009), “Penn World Table Version 6.3”. Centre
for International Comparisons of Production, Income and Prices at the University of
Pennsylvania [Online] available <http://pwt.econ.upenn.edu/php_site/pwt63/pwt
63_form.php> accessed [13th
March, 2010].
Heston, A., R. Summers and B. Aten, (2011), “Penn World Table Version 7.0”, Centre
for International Comparisons of Production, Income and Prices at the University of
Pennsylvania.
Hirano, T., (2003),“Financial sector FDI in Asian economies: Some stylized facts and
observations”, Central Bank paper submitted for the CGFS Working Group on foreign
direct investment in the financial sectors of emerging market economies. [Online]
available <http://www.bis.org/publ/cgfs22boj1.pdf> accessed [9th
February, 2009].
Holmstrom, B., and J. Tirole, (1993), “Market liquidity and performance monitoring,”
Journal of Political Economy, 101, 678-709.
Hsiao, C., (2003), Analysis of panel data, Cambridge University press: Cambridge.
Huang, W., (2005), “Emerging markets financial openness and financial development?”
Department of Economics, University of Bristol in Bristol Economics Discussion paper
no 06/588.
Huang, Y., and J. Temple, (2005), “Does external trade promote financial
development?” Department of Economics, University of Bristol in Bristol Economics
discussion paper 05/575.
Huang, Y., (2005), “What determines financial development?” Discussion paper no
05/580, Department of Economics, University of Bristol.
Huang, Y., (2010), “Political Institutions and Financial Development: An Empirical
Study”, World Development, 38-12, 1667-1677.
Hussein, M.A., (2009), “Impacts of Foreign direct investment on economic growth in
the gulf cooperation council (GCC) countries”, International Review of Business
Research Papers, 5-3, 362-376.

351
Hymer, S.H., (1976), The International Operations of National Firms: A study of direct
foreign investment, PhD Dissertation, MIT press Cambridge.
Hyun, H.J., (2006), “Quality of institutions and foreign direct investment in developing
countries: Causality test for cross-country panels”, Korea Institute for International
Economic Policy, 7-3, 103-110.
Im, K.S, M. H Pesaran and Y. Shin, (1995). “Testing for Unit Roots in heterogeneous
Panels,” Cambridge Working Papers in Economics 9526, Faculty of Economics,
University of Cambridge.
Im, K.S., M.H. Pesaran and Y. Shin, (2002), “Testing for unit root in heterogeneous
panels”, Econometric Reviews, 21, 49-87.
Im, K.S., M. H. Pesaran and Y. Shin, (2003), “Testing for unit roots in heterogeneous
panels”, Journal of Econometrics, 115, 53-74.
International Monetary Fund, IMF, (1997), “Development Focus: Economic trends in
the developing world”, [Online] Finance and Development, available
<http://www.imf.org/external/pubs/ft/fandd/1997/03/pdf/devfocus.pdf> accessed [15th
September, 2011].
International Monetary Fund, IMF, (2001), World Economic Outlook: Fiscal policy and
Macroeconomic Stability, World Economic and Financial Surveys. International
Monetary Fund.
International Monetary Fund, IMF, (2003), Global financial stability report: Markets
development and issues, [Online], available <http://www.imf.org/External/Pubs/FT/
GFSR/2006/01/pdf/chp1.pdf> accessed [9th
February, 2009].
International Monetary Fund, IMF, (2006), “Global financial resilience in the face of
cyclical challenges”. [Online], available <http://www.imf.org/External/Pubs/
FT/GFSR/2006/01/pdf/chp1.pdf> accessed [9th
February, 2009].

352
International Monetary Fund, (IMF, 2008), “South Africa: Financial system stability
and assessment, including report on the observance of standards and codes on the
following topic: Securities regulation”, [Online], available <
http://www.imf.org/external/pubs/ft/scr/2008/cr08349.pdf> accessed [9th
July, 2010].
International Financial Statistics, IMF, (2009), “Global financial stability: Responding to
the financial crisis and measuring systematic risks”, [Online] World Economic Financial
Surveys available <http://www.imf.org/external/pubs/ft/gfsr/2009/01/pdf/text.pdf>,
accessed [3rd
May, 2010]
Ireland, P.N., (1994). “Money and Growth: An Alternative Approach”, American
Economic Review, 84: 47-65.
Ito, H., (2005), “Financial development and financial liberalisation in Asia: Threshold,
institutions and sequence of liberalisation” [Online] available
<http://web.pdx.edu/~ito/Ito_findev_Asia2.pdf> accessed [12th February, 2010].
Jappelli, T., and M. Pagano, (1992), “Saving, Growth and Liquidity Constraints,” CEPR
Discussion Papers 662, C.E.P.R. Discussion Papers.
Jaspersen, F., A. Aylward and A. Knox, (2000), “The Effects of Risk on Private
Investment: Africa Compared with Other Developing Areas”. In: P. Collier & C.
Pattillo (Eds.), Investment and Risk in Africa, (p.71-95), St. Martin’s Press, New York.
Jeaneney, S.G., and K. Kpodar, (2005), “Financial development, financial instability
and poverty”, Centre for the study of African Economies, CSAE WPS 2005/09, [Online]
available <http://economics.ouls.ox.ac.uk/13250/1/2005-09text.pdf> accessed [7th
February, 2011].
Jenkins C. and L. Thomas, (2002), ‘Foreign Direct Investment in Southern Africa:
Determinants, Characteristics and Implications for Economic Growth and Poverty
Alleviation”[Online], available < http://www.csae.ox.ac.uk/reports/pdfs/rep2002-02.pdf
>, accessed [24th June, 2011].
Jensen, M.C and K.J. Murphy, (1990), “Performance pay and top-management
incentives,” Journal of Political Economy, 98-2, 225-64.
353
Johanson, J. and F. Wiedersheim-Paul, (1975), “The Internationalisation of the Firm-
Four Swedish Cases”, Journal of Management Studies, 12-3, 305- 322.
Johnson, A., (2005), “The effects of FDI inflows on host country economic growth”,
Working paper No. 58, Centre for Excellence for Science and Innovation Studies, Royal
Institute of Technology.
Jones, C.I., (2002): “Sources of US economic growth in a world of ideas”, American
Economic Review, 92.
Kablan, S., (2010), “Bank efficiency and financial development in Sub-Saharan Africa”,
International Monetary Fund, in its IMF series working paper with paper no
WP/10/136.
Kalyvitis, S., and K. Vlachaki, (2008), “Democratic aid and the democratisation of
recipients” forthcoming in Contemporary Economic Policy, [Online] available <
http://www.aueb.gr/users/kalyvitis/Democracy_Aid_and_the_Democratization_of_Reci
pients_Sep08.pdf > accessed [6th May, 2011].
Kaminsky, G.L., and S.L. Scmukler, (2003), “Short run pain, Long term gain: The
effects of financial liberalisation”, IMF Working paper WP/03/34, Washington SC,
International Monetary Fund.
Kandiero, T. and M. Chitiga, (2003), “Trade openness and foreign direct investment in
Africa,” paper prepared for the Economic Society of Southern Africa 2003 Annual
Conference, Cape Town, South Africa.
Kao, C. (1999), “Spurious regressions and residual based tests for co-integration in
panel data”, Econometrics, 90: 1-44.
Karikari, J., (2010), “Governance, financial liberalisation and financial development in
Sub-Saharan Africa” presented at the African development banks’ African Economic
Conference, Tunisia, October 27-29.
Kasekende, L., (2007), “Plenary session on financial services and economic
development in Africa: Uganda’s experience with financial sector reform and lessons
for Africa”, Journal of African Economies, 16-1, 58-74.

354
Kauffman, D., Kraay, A. and Zoido-Labaton, (2002), “Governance Matters,” World
Bank, MIMEO.
Kauffmann, D., A. Kraay, and M. Mastruzzi, (2008), “Governance Matters VII:
Aggregate and Individual Governance Indicators for 1996-2007”, World Bank Policy
research paper no 4654.
Kaufmann, D. and A. Kraay and M. Mastruzzi, (2009), “Governance matters VIII :
aggregate and individual governance indicators 1996-2008,” Policy Research Working
Paper Series 4978, The World Bank.
Kauffmann, D., A. Kraay, and M. Mastruzzi, (2010), “The Worldwide Governance
Indicators : A Summary of Methodology, Data and Analytical Issues”. World Bank
Policy Research.
Kawakatsu, H., and M.R. Morey, (1999), “An empirical examination of financial
liberalisation and the efficiency of emerging market stock prices”, The Journal of
Financial Researches, 22-4, 385-411.
Kayne, T., K.R. Holmes, and M.A. O’Grady, (2010), “Index of Economic Freedom,
Heritage Foundation and Wall Street Journal.” [Online] available
<http://www.heritage.org/index/> accessed [14th
June, 2010].
Kemal, A.R., A. Qayyum, and M.N. Hanif, (2007), “Financial Development and
Economic Growth: Evidence from a Heterogeneous Panel of High Income Countries”.
The Lahore Journal of Economics, 12-1, 1-34.
Kennedy, P., (2008), A Guide to Econometrics, Wiley - Blackwell Publishing, 6th
edn,
350 Main Street, Malden, MA 02148-5020, USA.
Kenny, C., and T. Moss, (1998), “Stock Markets in Africa: Emerging Lions or White
Elephants?” World Development, 26, 5.
Khan, A. H., (1995), “Need and scope for further reforms in the financial sector in
Pakistan”. Journal of Institute of Bankers of Pakistan. 61, 41-58.
Khan, M. (2007), “The role of human capital in attracting foreign direct investment: A
South Asian perspectives”, Journal of Human Resource Development.

355
Kholdy, S. and A. Sohrabian, (2005), “Financial Markets, FDI, and Economic Growth:
Granger Causality Test in Panel Data Models”, Working Paper, California State
Polytechnic University.
King, R.G., and R. Levine, (1993a), “Finance and Growth: Schumpeter Might Be
Right”, Quarterly Journal of Economics, 8, 717-737.
King, R.G., and R. Levine, (1993b) “Finance, Entrepreneurship and Growth: Theory
and Evidence”, Journal of Monetary Economics, 32-3, 513-542.
Kiran B., N.C. Yavuz, and B. Guris, (2009), “Financial development and economic
growth: A panel data analysis of emerging countries”, International Research Journal
of Finance and Economics, 30, 87-94.
Klein, M., and G. Olivei, (1999) “Capital account liberalisation, financial depth and
economic growth”, Federal Reserve Bank of Boston Working Paper, 99-6.Laurens, B.,
(2005), “Monetary policy implementation at different stages of market development”,
International monetary fund IMF occasional paper.
Knack, S. and P. Keefer (1995), “Institutions and Economic Performance: Cross-
Country Tests Using Alternative Measures”, Economics and Politics, 7-3, 207-227.
Knack, S. ed. (2003) Democracy, Governance, and Growth. University of Michigan
Press, Ann Arbor.
Kobrin, S., (2005), “The determinants of liberalization of FDI Policy in developing
countries: A cross-sectional analysis, 1992-2001”, Transnational Corporations, 14-1, 1-
38.
Kokko, Ari, (1994), “Effects on Swedish Investment and Growth of Membership in the
European Union,” Working Paper Series in Economics and Finance 15, Stockholm
School of Economics.
Kokko, Ari and M. Blomstrom, (1995), “Policies to encourage inflows of technology
through foreign multinationals,” World Development, 23-3, 459-468.

356
Kumo, L. W., (2008), “Stock exchange in Africa: Prospects and Challenges”, [Online]
available <http://www.printfriendly.com/system/pdfs/afroarticles.com-
Stock_Exchange_in_Africa_Prospects_and_Challenges-1960255.pdf> accessed [15th
October, 2008].
Lakstutiene, A. (2008), “Correlations of the indicators of financial system and Gross
Domestic Product in European Union Countries”, Engineering Economics, Economics
of Engineering Decisions, 3-58, 7-18.
La Porta, R, F. Lopez-de-Silanes, A. Shleifer, and R. Vishny, (1997), “Legal
Determinants of External Finance”, Journal of Finance, 52-3, 1131-1150.
La Porta, R, F. Lopez-de-Silanes, A. Shleifer, and R. Vishny, (1998), “Law and
Finance”, Journal of Political Economy, 106-6, 1113-1155.
La Porta, R, F. Lopez-de-Silanes, C. Pop-Eleches, and A. Shleifer, (2004), “Judicial
Checks and Balances”, Journal of Political Economy, 112-2, 445-470.
La Porta, R., F. Lopez-de Silanes and A. Shleifer, (2008), “The economic consequences
of legal origins,” Journal of Economic Literature, 46-2, 285-332.
Laurens, B. (2005), Monetary policy implementation at different stages of market
development, International Monetary Fund, IMF Occasional Paper, 244, Washington
DC.
Law, S. H., (2008), “Does a country’s openness to trade and capital accounts lead to
financial development? Evidence from Malaysia”, Asian Economic Journal, 22-2, 161-
177.
Law, S. H., (2009), “Trade openness, capital inflows and financial development in
developing countries”, International Economic Journal, 23-3, 409-426.
Law, S., and W.N.M. Azman-Saini, (2008), “The quality of institutions and financial
development”, University Library of Munich, Germany in its series MPRA paper with
no 12107.

357
Law, S.H., and M.S. Habibullah, (2009), “The determinants of financial development:
Institutions, openness and financial liberalisation”, South African Journal of Economics,
77-1), 45-58.
Lawrence, P., and I. Longjam, (2003), “Financial liberalisation in India: Measuring
relative progress”, Centre for Economic Eesearch, Keele University in its Keele
Economics Research Papers with number KERP 2003/08.
Lee, C., and C. Chang, (2009), “FDI, Financial Development, and Economic Growth:
International Evidence”, Journal of Applied Economics, 12-2, 249-271.
Lee, C., (2010), “Education and Economic growth: Further empirical results”, European
Journal of Economics, Finance and Administrative Sciences, 23, 161-169.
Levine A., and C.F. Lin, (1992), “Unit root tests in panel data: Asymptotic and finite
sample properties”, Mimeo, University of California San Diego.
Levine A., C.F. Lin and C. Chu, (2002), “Unit root tests in panel data: Asymptotic and
finite sample properties,” Journal of Econometrics, 108, 1-24.
Levine, R., (1991), “Stock markets, growth, and tax policy”, The Journal of Finance, 46
-4, 1445-1465.
Levine, R., (1997), “Financial development and economic growth: Views and Agenda”,
Journal of Economic Literature, 35, 688-726.
Levine, R., (1999), “Law, Finance, and Economic Growth”, Journal of Financial
Intermediation, 8(1-2), 8-35.
Levine, R., (2001), “International financial liberalization and economic growth”, Review
of International Economics, 9-4:688-702.
Levine, R., (2002), “Bank-Based or Market-Based Financial Systems: Which Is
Better?,” Journal of Financial Intermediation, 11-4, 398-428.
Levine, R, (2004), “Finance and growth: theory, evidence and mechanisms”, [Online],
available <http://www.econ.brown.edu/fac/Ross_Levine/Publication/Forthcoming
/Forth_ Book_Durlauf_FinNGrowth.pdf> accessed [20th January, 2009].

358
Levine, R., and S. Zervos, (1996), “Stock market development and economic
growth”, World Bank Economic Review, 10, 323–340.
Levine, R., and S. Zervos, (1998), “Stock markets, banks and economic growth”
American Economic Review, 88-3, 578-58.
Levine R, N. Loayza and T. Beck, (2000), “Financial intermediation and growth:
Causality and causes”, Journal of Monetary Economics, 46-1, 31-77.
Li, K.W., (1995), “Capital efficiency in the pearl river Delta”, In: J. Cheng and S.
MacPherson (eds), Development in Southern China, Longman Asia Limited, Hong
Kong, 171-85.
Lipsey, R.E., (1999), “The role of foreign direct investment in international capital
flows”, NBER Working Paper No. 7094.
Lipsey, R E (2000), “Interpreting Developed Countries’ Foreign Direct Investment”,
Working Paper 7810, National Bureau of Economic Research, Cambridge,
Massachusetts, July.
Lipsey, R.E., (2001), “Foreign Direct Investment and the Operations of Multinational
firms: Concepts, History, and Data”, Working Paper 8665, National Bureau of Economic
Research, Cambridge, Massachusetts, December.
Loayza, N. and R. Ranciere (2004), “Financial Development, Financial Fragility and
Growth”, paper provided by World Bank in its series Policy Research Working Paper
Series with number 3431.
Loof, H., (2004), “Dynamic capital structure and technical change,” Structural Change
and Economic Dynamics, 15, 449-468.
Lubeck, P. (1992). “The Crisis of African Development: Conflicting interpretations and
resolutions,” Annual Review of Sociology. 18, 519-540.
Lucas, R.E, (1988), “On the mechanics of economic development”, The Journal of
Monetary Economics, 22-1, 3-42
359
MacKinnon, J.G., A.A. Haug and L. Michelis, (1999), “Numerical distribution
functions of likelihood ratio tests for co-integration”, Journal of Applied Econometrics,
14, 563-577.
Maddala, G.S. and S. Wu, (1999), “Comparative study of unit root tests with panel data
and a new simple test”. Oxford Bulletin of Economics and Statistics, 61, 631-652.
Maddison, A., (2001), “The World Economy: A Millennial Perspective.” Paris:
Organisation for Economic Cooperation and Development.
Maddison, A. (2010), “Statistics on World Population, GDP and per capita GDP, 1-
2008AD”, [Online] available on <http://www.ggdc.net/MADDISON/oriindex.htm>
accessed [12th
November, 2011].
Makki, S.S., and A. Somwaru, (2004), “Impact of foreign direct investment and trade on
economic growth”, American Journal of Agricultural Economics, 3-8, 795-801.
Mankiw, N.G., D. Romer, and D.N. Weil, (1992), “A contribution to the empirics of
economic growth”. Quarterly Journal of Economics, 407-437.
Mansfield, E., A. Romeo, (1980), “Technology transfers to overseas subsidiaries by US
based firms”. Quarterly Journal of Economics, 95-4, 737-750.
Marshall, M.G., and K. Jaggers, (2009), “Polity IV Project: Political Regime
Characteristics and Transitions, 1800–2007—Dataset Users’ Manual”, (Arlington,
Virginia: Polity IV Project).
McDonald, C., and L. Schumacher, (2007), “Financial deepening in sub-Saharan Africa:
Empirical evidence on the role of creditor rights protection and information sharing,”
IMF Working Paper, WP/07/203.
McKinnon, R., (1973), Money and Capital in Economic Development, Brookings
Institution, Washington, D.C.
McKinnon, R., (1988), “Financial liberalization and economic development: A
reassessment of interest rate policies in Asia and Latin America”, International Centre
for Economic Growth, Occasional paper no.6.

360
McKinnon, R., (1993), The Order of Economic Liberalization: Financial Control in the
Transition to a Market Economy, 2nd edn, The Johns Hopkins Studies in Economic
Development, Baltimore & London.
McPherson, M.F., and T. Rakovski, (1999), “Financial Deepening and Investment in
Africa: Evidence from Botswana and Mauritius”, Harvard Institute of International
Development in its HIID Development discussion paper no. 727.
Miletkov, M., and M.B. Wintoki, (2008), Legal institutions, democracy and financial
sector development. In: M. Hirschey, K. John and A.K. Makhija (eds.) Corporate
Governance and Firm Performance (Advances in Financial Economics, 13), 171-196.
Misati, R.N., and E.S. Nyamongo, (2011), “Financial development and private
investment in Sub-Saharan Africa”, Journal of Economics and Business, 63, 139-151.
Mishkin, F.S., (2007), “Globalisation and financial development”, Journal of
Development Economics, 89-2, 164-169.
Miyamoto, K., (2003), “Human capital formation and foreign direct investment in
developing countries,” [Online] available < http://www.oecd.org/dataoecd/45/25/
5888700.pdf> OECD development centre, working paper no. 211, accessed [14th
February, 2009].
Mobolaji, H.I., (2008), “Essays of financial development and growth in Sub-Saharan
African countries”, Unpublished PhD Thesis, University of Leicester, Leicester: UK.
Mohtadi, H. and S. Agarwal, (2004), “Stock Market Development and Economic
Growth: Evidence from Developing Countries”, Oxford University Press, New York.
Moran, T., (2002), “The relationship between trade, foreign direct investment and
development: New evidence strategy and tactics under the Doha development agenda
negotiations”, [Online] available <http://www.libertyparkusafd.org/lp/Hamilton/reports
%5CRelationship%20Between%20Trade.pdf> accessed [14th
February 2009].
Morgan Stanley Capital International, MSCI Barra (2009), “Classification of emerging
and frontier markets”, [Online], available on <http://www.msci.com/> accessed [12th
May, 2010].

361
Morisset, P, (2000), “Foreign direct investment to Africa: Policies also matter”,
Transitional Corporations, 9-2, 107–125.
Morrissey, O. (2003). “Finance for Development: Enhancing the Role of Private
Finance”, Development Report, Globalization and Poverty,
http://www.gapresearch.org/finance/.
Morrissey, O., (2003), “Private Capital Flows to Sub-Saharan Africa: Managing Volatility
with an Application to Tanzania”, paper presented to an ESRF seminar.
Moshirian, F., and P.K. Pham, (2000), “Determinants of US investments in real estate
abroad”, Journal of Multinational Financial Management, 10-1, 63-72.
Mottaleb, K.A., (2007), “Determinants of foreign direct investment and its impact on
economic growth in developing countries”, [Online] available
<http://mpra.ub.unimuencchen.de/94571/1/MPRA_paper_9457.pdf> accessed [16th
February 2006].
Ncube, M., (2007), “Financial services and economic development in Africa”, Journal
of African Economies, 16, 13-57.
Ndikumana, L., (2003), “Financial development, financial structure and domestic
investment: International evidence”, Political Economy Research Institute, (PERI)
University of Massachusetts Amherst, working paper no 16.
Ndulu, B.J., and S.A. O’Connell, (1999), “Governance and growth in Sub-Saharan
Africa”, Journal of Economic Perspectives, 13-3, 41–66.
Nelson, R.R. and H. Pack, (1999), “The Asian miracle and modern growth theory”, The
Economic Journal, 109, 416-436
Ng’ang’a, P.K., (2005), “Determinants and effects of foreign direct investment in
developing countries: Theoretical and empirical analysis” Unpublished Ph.D
Dissertation, Southern Illinois University, Carbondale.
Ngowi, H.P., (2001), “Attracting New Foreign Direct Investments to Tanzania”
Tanzanet Journal, 1-2, 23 39.

362
Ngugi, R., D. Amanja, and I. Maana, (2009), “Capital market, financial deepening and
economic growth in Kenya”, [Online] available <http://www.csae.ox.ac.uk
/conferences/2009-EDiA/papers/513-Isaya.pdf>, Centre for the studies of African
economies (CSAE) Oxford University, accessed [26th
October, 2010].
Noorbakhsh, F., A. Paloni, and A. Youssef, (2001). “Human Capital and FDI to
Developing Countries: New Empirical Evidence,” World Development, 29-9, 1593-
1610.
Norris, P., (2008), Driving Democracy: Do power-saving institutions work? Cambridge
University Press, New York Cambridge.
North, D., (1990), Institutions, Institutional Change, and Economic Performance.
Cambridge University Press, Cambridge.
North, D.C., (1991), “Institutions”, The Journal of Economic Perspectives, 5-1: 97-112.
North, D., (1995), “The New Institutional Economics and Third World Development”.
In: Haris J., Hunter J. and Lewis C. The New Institutional Economics and Third World
Development. London : Routledge.
North, D., and R.P. Thomas, (1973), The Rise of the Western World. Cambridge:
Cambridge University Press, New York Cambridge.
North, D., and M. Shirley, (2008), “Conclusion: Economics, Political Institutions, and
Financial Markets.” In: S. Haber, D. North B. Weingast, editors. Political institutions
and financial development. Stanford, United States: Stanford University Press.
Nyakerario, M.R., (2007), “Liberalization, Stock Market Development and Investment
Efficiency in Africa”, International Review of Business Research Papers, 3-4, 183-191.
O’Neill, J. (2001), “Building better global economic BRICs,” Global Economics Paper
no 66, [Online], available < http://www.goldman-sachs.com/our-thinking/brics/brics-
reports-pdfs/build-better-brics.pdf> Goldman Sachs Economic Research, accessed [15th
November, 2010].

363
O’Neill, J. D. Wilson and A. Stupnytska, (2005), How Solid are the BRICs? Global
Economics Paper no 134, [Online], available <http://www2.goldmansachs.com/our-
thinking/brics/brics-reports-pdfs/how-solid.pdf> Goldman Sachs Economic Research,
accessed [15th
November, 2010].
O’Neill, J., (2007), “BRICs and Beyond”. [Online], available <http://www2.
goldmansachs.com/our-thinking/brics/brics-and-beyond-book-pdfs/brics-full-book.pdf>
accessed [7th
December, 2010].
Odedokun, M.O, (1996), “Alternative econometric approaches for analysing the role of
the financial sector in economic growth: Time-series evidence from LDCs”, Journal of
Development Economics, 50, 119-146.
Ohlin, B, (1933), “Interregional and international trade”, Harvard Press, Cambridge,
Mass.
Ohno, K., (2006), “FDI strategy under global and regional integration,” In Lecture note
of International Economics. [Online] available <http://www.grips.ac.jp/
teacher/oono/hp/lecture_F/lec06.htm> accessed [12th
October, 2011].
Olofsdotter, K. (1998), “Foreign direct investment, country capabilities and economic
growth”, Weltwirtschaftliches Archive, 134-3, 534-547.
Omran, M., and A. Bolbol, (2003), “Foreign direct investment, financial development
and economic growth: Evidence from the Arab countries”, Review of Middle East
Economics and Finance, 1-3, 231-249.
Ong’ayo, A.O., (2008), “Political instability in Africa: Where the problem lies and
alternate perspectives”, presented at the symposium: “Afrika: een continent op drift”
organised by Stictching Naionaal Erfgoed Hotel De Wereld Wageningen, 19th
September. [Online] available <http://www.diaspora-centre.org/DOCS/Political
_Instabil.pdf> accessed [20th
June, 2011].
Onyeiwu, S. (2003), “Analysis of FDI flows to Developing Countries: Is the MENA
region different?” Unpublished paper, [Online] available <http://www.erf.org.eg/
CMS/uploads/pdf/1184754629_Steve_Onyeiwu.pdf> accessed [20th
February, 2009].
364
Organisation for Economic Co-operation and Development, OECD (2005), “African
Economic Outlook, 2004 and 2005: What’s new for Africa?” Nigeria, African
Development Bank annual meeting, [Online] available <
http://www.oecd.org/dataoecd/41/41/34873439.pdf> accessed [16th
November, 2011].
Organisation for Economic Co-operation and Development, OECD (2010), “Growth,
employment and inequality in Brazil, China, India and South Africa: An overview”,
[Online] available < http://www.oecd.org/dataoecd/16/59/45282661.pdf> accessed [12th
September, 2011].
Oshikoya, T.W., (1994), “Macroeconomic determinants of domestic private investment in
Africa: An empirical analysis”, Economic Development and Cultural Change, 42-3: 573-
596
Oteng-Abayie, E.F., (2011), “Government expenditure and economic growth in five
ECOWAS countries: A panel econometric estimation,” Journal of Economic Theory, 5-
1, 11-14.
Ouattara, D.A., (1997), “The challenges of globalisation for Africa”, International
Monetary Fund Paper presented at the Southern Africa Economic Summit sponsored by
the World Economic Forum, Harare.
Ozdemir, D., and C. Erbil, (2008), “Does financial liberalisation trigger long term
economic growth? New evidence from EU8 and Turkey”, EcoMod Internation
Conference on Policy Modelling, Berlin, German Institute for Economic Research
DIW-Berlin, Germany, July 2-4.
Pagano, Marco (1993), “Financial Markets and Growth: An Overview”, European
Economic Review, 37, 613-22.
Panitchpakdi, S., (2010), “Reconstructing economic governance: An agenda for
sustainable growth and development”, Exim Bank Commencement Day Annual
Lecture, [Online] available <http://www.unctad.org/sections/edm_dir/docs/edm_osg
_exim2010_en.pdf> accessed [6th
February, 2011].
Patrick, H.T, (1966), “Financial development and economic growth in underdeveloped
countries”, Economic Development and Cultural Change, 14, 174- 189.

365
Pedroni, P. (1996), “Fully Modified OLS for heterogeneous co-integrated panels and the
case of Purchasing Power Parity”. Working paper No. 96–020, Department of
Economics, Indiana University.
Pedroni, P., (1999), “Critical values for co-integration tests in heterogeneous panels
with multiple regressors,” Oxford Bulletin of Economics and Statistics, 61, 653–70.
Pedroni, P., (2000), “Fully Modified OLS for heterogeneous cointegrated panels,”
Advances in Econometrics, 15, 93-130.
Pedroni, P. (2001), “Purchasing Power Parity tests in co-integrated panels”, The Review
of Economics and Statistics, 83(4), 727-731.
Pedroni, P. (2004), “Panel co-integration; asymptotic and finite sample properties of
pooled time series tests with an application to the PPP hypothesis,” Econometric
Theory, 20, 597–625.
People’s Bank of China, PBC (2007), “China Financial Stability Report”, [Online]
Financial Stability Analysis Group of the People’s Bank of China, available <
http://www.pbc.gov.cn/publish/english/959/1958/19585/19585_.html> accessed [13th
November, 2010].
Pesaran, M.H., Y. Shin, and R.P. Smith, (1999), “Pooled mean group estimation of
dynamic heterogeneous panels”, Journal of American Statistical Association, 94, 621-
634.
Philip, A and S. Basu and S. Mallick, (2005), “Financial globalization: the need for a
single currency and a global central bank,” Journal of Post Keynesian Economics, 27-3,
507-531..
Philip, A. and M. Nissanke and H. Stein, (2005), “Finance and Development:
Institutional and Policy Alternatives to Financial Liberalization Theory,” Eastern
Economic Journal, Eastern Economic Association, 31-2, 245-263.
Pill, H., and M. Pradhan, (1995), “Financial indicators and financial change in Africa
and Asia”, International Monetary Fund in its series IMF working papers no 95/123,
Washington.

366
Pill, H., and M. Pradhan, (1997), “Financial liberalisation in Africa and Asia,” Finance
and Development, 7-10.
Pistor, K., M. Raiser, and S. Gelfer, (2000), “Law and finance in transition economies”,
The Economics of Transition, 8, 325-368.
Plumper, T., and E. Neumayer, (2010), “The Level of Democracy during Interregnum
Periods: Recoding the polity2 Score.” Political Analysis, 18:206-226.
Popiel, P.A., (1994), “Financial systems in Sub-Saharan Africa,” World Bank
Discussion Papers 260, Washington, D.C.
Posner, E., (1998), “Symbols, Signals, and Social Norms in Politics and Law,” Journal of
legal Studies, 27:765–97.
Pradhan, R.P. (2006), “FDI in the globalization era: Chinese and Indian economic
growth”. Prajnan, 34, 323-343.
Pradhan, R. P. (2008), “Causality between FDI and Economic Growth in Malaysia:
Application of Co-integration & Error Correction Modelling Technique”. Finance
India, 22, 501-516.
Prasad, E., K. Rogoff, S. Wei and M.A. Kose, (2003), “Effects of financial globalisation
on developing countries: Some empirical evidence,” International Monetary Fund staff
papers 17, 86
Quah, D., (1994), “Exploiting cross-section variations for unit root inference in dynamic
data”, Economic letters, Vol 44, 9-19.
Quinn, D.P., and C. Inclan. (1997), “The Origins of Financial Openness: A Study of
Current and Capital Account Liberalization”, American Journal of Political Science,
41, 771-813.
Quinn, D., A.M. Toyoda, and C. Inclan, (2002), “Does capital account liberalization
lead to economic growth? An empirical investigation”. Washington, DC: Georgetown
University, Unpublished manuscript.
367
Rachdi, H., and H.B. Mbarek, (2011), “The Causality between Financial Development
and Economic Growth: Panel Data Cointegration and GMM System Approaches”,
International Journal of Economics and Finance, 3-1, 143-151.
Radelet, S., J. Gallup and A. Warner (1997), “Economic growth and the income of the
poor”. CAER Discussion Paper no. 36. Harvard Institute for International Development:
Cambridge, MA, USA.
Rajan, R.G., and L. Zingales, (2003), “The Great Reversals: The Politics of Financial
Development in the Twentieth Century”, Journal of Financial Economics 69, 5-50.
Ramanathan, R (2002), Introductory Econometrics with Applications, 5th Edition,
Harcourt College Publisher.
Randall, M. and M. Nakamura, (2007), “Business groups and the big push: Meiji
Japan's mass privatization and subsequent growth,” NBER Working Papers 13171,
National Bureau of Economic Research.
Rao, S., (2008), “The rise of the BRICs: What does it mean for Canada?” The
Conference Board of Canada, Insights you can count on. [Online] available <
http://zonecours.hec.ca/documents/H2011-P5-2337399.TheRiseoftheBRICs.pdf>
accessed [12th June, 2009].
Raynal, L.B., (2006), “Is financial deepening really beneficial for Latin American
Countries?” Working Paper, University of Oklahoma.
Rathinam, F.X., and A.V. Raja, (2010), “Law, regulations and institutions for financial
development: Evidence from India”, Emerging Markets Review, 11-2, 106-118.
Rioja, F. and N. Velv, (2002), “Finance and sources of growth at various stages of
economic development”, International Studies Working Paper, 2-17.
Rioja, F. and N. Velv, (2004), “Finance and sources of growth at various stages of
economic development”. Economic Inquiry, 42-1, 127-140.
Rioja, F., and N. Valev. (2004), “Does one size fit all? A re-examination of the finance
and growth relationship”, Journal of Development Economics, 74, 429-447.

368
Rivera-Batiz, F.L., (2000), “Foreign Direct Investment in Latin America: Current trends
and future prospects,” United Nations, Interregional Cooperation in Trade and
Investment: Asia-Latin America, United Nations Economic and Social Commission for
Asia and the Pacific, Studies in Trade and Investment No. 43, New York, 2000, 161-
191.
Rivlin, P., (2001), Economic Policy and Performance in the Arab World. Lynne
Rienner, London.
Rjan, R.G. and L. Zingales, (1998), “Financial dependence and growth”, American
Economic Review, 88-6, 559-586.
Robinson, J., (1952), “The generalization of the general theory”, In: The Rate of Interest
and Other Essays, London: Macmillan.
Rodrik, D. (1998), “Trade policy and economic performance in Sub-Saharan Africa.”
NBER Working Paper 6562, National Bureau of Economic Research, Cambridge, Mass.
Rodrik, D, (1999), “The new global economy and developing countries: Making
openness work, Overseas Development Council, Washington, DC.
Rodrik, D., A. Subramanian and F. Trebbi, (2002) “Institutions rule: the primacy of
institutions over geography and integration in economic development”, NBER Working
Paper, 9305.
Rodrik, D., (2003), “Growth strategies,” Department of Economics, Johannes Kepler
University Linz, Austria in its series Economics working papers with number 0317.
Rodrik, D., (2004), “Industrial policy in the twenty-first century”. [Online] Paper
prepared for UNIDO, available
<http://www.hks.harvard.edu/fs/drodrik/Research%20papers/ UNIDOSep.pdf>
accessed [13th
January, 2010].
Rodrik, D., (2005), “Growth strategies,” In: P.Aghion and S. Durlauf (ed), Handbook of
Economic Growth, Ed. I, Vol. 1, Chapter 14, 967-1014.
Roe, M. J. and J.I. Siegel, (2011), “Political instability: Effects on financial
development, roots in the severity of economic inequality,” Journal of Comparative
Economics, 39-3, 279-309.
369
Romer, P.M, (1986), “Increasing returns and long run growth”, Journal of Political
Economy, 94-5, 1002-1037.
Romer, P.M., (1993), “New goods, old theory and the welfare costs of trade
restrictions”, Journal of Development Economics, 43, 5-38.
Root, F., and A. Ahmed, (1979), “Empirical determinants of manufacturing direct
foreign investment in developing countries”, Economic development and Cultural
Change, 27, 751-767.
Rousseau, P.L. and P. Wachtel, (2000), “Equity markets and growth: Cross-country
evidence on timing and outcomes, 1980-1995,” Journal of Banking and Finance, 24-12,
1933-1957.
Rousseau, P.L and P. Wachtel, (2002), “In financial liberalisation thresholds and the
finance-growth nexus” Journal of International money and finance, 21-6, 777-793.
Sacerdoti, E., (2009), “Credit to the private sector in Sub-Saharan Africa: Development
and Issues”, SME financing in Sub-Saharan Africa, private sector and development,
proparcos magazine [Online] available <http://www.ffem.net/jahia/webdav/
site/proparco/shared/PORTAILS/Secteur_prive_developpement/PDF/SPD1_PDF/Sacer
doti_EN.pdf > accessed [28th
March, 2011].
Sachs J.D., and A.M. Warner, (1995), “Economic reforms and the process of global
integration”, Brookings Paper on Economic Activity, 1, 1-95.
Sachs J.D., and A.M. Warner, (1997), “Sources of slow growth in African economies”,
Journal of African Economies, 6-3, 335-376.
Sachs, J.D. and A.M. Warner, (1997), “Fundamental Sources of Long Run Growth”,
American Economic Review, May 1997, 184-188.
Saibal, G., (2010), “Credit growth, bank soundness and financial fragility: Evidence
from Indian banking sector”, [Online] available <http://mpra.ub.uni-
muenchen.de/24715/1/MPRA_paper_24715.pdf> accessed [28th March, 2011].

370
Saibu, M.O., P.I. Nwosa and A.M. Agbeluyi, (2011), “Financial development foreign
direct investment and economic growth in Nigeria”, Journal of Emerging Trends in
Economics and Management Sciences, 2-2, 146-154.
Sala-i-Martin, X., (1995), “The classical approach to convergence analysis,” Economics
Working Papers 117, Department of Economics and Business, Universitat Pompeu
Fabra.
Sala-i-Martin, X., (2006), “The World Distribution of Income: Falling Poverty and
Convergence, Period,” Quarterly Journal of Economics, 121-2, 351-397.
Salvatore, C., (2008), “Endogenous information frictions, stock market development
and economic growth,” Manchester School, University of Manchester, 76-2, 204-222.
Samad, A., (2009), “Does FDI cause economic growth? Evidence from South East Asia
and Latin America,” Finance and Economics Department, Utah Valley University,
Woodbury School of Business Working Paper, 1-09.
Teorell, J., N. Charron, M. Samanni, S. Holmberg, and B. Rothstein, (2010), “The QoG
Social Policy Dataset: version 27th
May, 2010”, University of Gothenburg: The Quality
of Government Institute, [Online] available <http://www.qog.pol.gu.se> accessed [14th
June, 2010].
Sandoyan, E.M, S. A. Mkhitaryan, E.G. Karapetyan and S. A. Sahakyan, (2007),
“International financial integration and its distinctions in transition economies,”
Transition Studies Review, 14-3: 413–424.
Schmukler, S.L., (2003), “Financial globalisation: Gain and pain for developing
countries”, [Online] available <http://www.frbatlanta.org/filelegacydocs/erq204_
schmukler.pdf> accessed [12th
May, 2010].
Schneider, F., and B. Frey, (1985), “Economic and political determinants of foreign
direct investment”, World Development, 13, 161-175.
Schumpeter, J.A (1911), The theory of economic development, Cambridge, MA:
Harvard University Press.
371
Seychelles European Community, (2007) Country strategy paper and indicative
programme for the period 2002-2007, [Online] available <
http://ec.europa.eu/development/icenter/repository/print_sc_csp_en.pdf> accessed [15th
October, 2011].
Shahbaz, M., and N. Amir (2008), “Foreign direct investment and income distribution:
A Case Study for Pakistan,” International Research Journal of Finance and Economics,
7, 7-18.
Shahbaz, M., K. Ahmad, and A.R. Chaudhary (2008), “Economic growth and its
determinants in Pakistan,” The Pakistan Development Review, 47, 471-486.
Shahbaz, M., and M.M. Rahman, (2010), “Foreign Capital Inflows-Growth Nexus and
Role of Domestic Financial Sector: An ARDL Co-integration Approach for Pakistan”,
Journal of Economic Research, 15-3, 207-231.
Shaw, E.S. (1973), Financial Deepening in Economic Development. Oxford University
Press, New York.
Siddhartha, B., (2004), “Endogenous Market Thickness and Honesty: A Quality Trap
Model,” Industrial Organization 0408006, EconWPA.
Singh, A., (1997), “Financial liberalisation, stock market and economic development”,
The Economic Journal, 107-442, 771-782.
Singh, A. (1998), “Asian Capitalism and the financial crisis”, CEPA Working Papers
Series III, no. 10, New School for Social Research.
Singh, R.J., M. Haacker, and K. Lee (2009). “Determinants and Macroeconomic Impact
of Remittances to Sub-Saharan Africa.” IMF Working Paper 09/216, International
Monetary Fund, Washington DC.
Smith, A. (1776), “An inquiry into the nature and causes of the Wealth of Nations”,
[Online] available on <http://www2.hn.psu.edu/faculty/jmanis/adam-smith/Wealth-
Nations.pdf> A Penn State Electronic Classics Series Publication, accessed [12th
November, 2011].

372
Solomon, T., (2001), “Financial Architecture and Economic Performance: International
Evidence,” William Davidson Institute Working Papers Series 449, William Davidson
Institute at the University of Michigan
Solow, R., (1956), “A contribution to the theory of economic growth”, The Quarterly
Journal of Economics, 70, 65–94
Soubbotina, T.P., and K. A. Sheram, (2000), “Beyond Economic Growth: Meeting the
challenges of global development”, The International Bank for Reconstruction and
Development/The World Bank, Washington DC.
Sqaulli, J., and K. Wilson, (2006), “A new approach to measuring trade openness”,
[Online] available <http://www.business.curtin.edu.au/files/squalli_wilson.pdf>,
accessed [13th
January, 2010].
Standley, S., (2010), “What are the determinants of financial sector development in
Sub-Saharan Africa”, In: African financial markets: A real development tool, Proparco’s
Magazine [Online] available <http://www.proparco.fr/jahia/webdav/site/ proparco/
shared/PORTAILS/Secteur_prive_developpement/PDF/SPD5_PDF/Proparco
Revue%2005UK%20WEB%20020410.pdf> accessed [28th
March, 2011].
Stata, (2003), Cross-Sectional Time Series. College Station, Texas: Stata Press.
Stiglitz, J.E., and A. Weiss (1981), “Credit Rationing in Markets with Imperfect
Information”, American Economic Review, 71, 393-410.
Stiglitz, J.E. (1985), “Credit Markets and the Control of Capital”, Journal of Money,
Credit, and Banking, 17-1, 133-152.
Stiglitz, J.E. (2000), “Capital Market Liberalization, Economic Growth and Instability”,
World Development, 28-6, 1075-1086.
Sukhdev, P., (2004), “Green Accounting: the missing link between developing nations
and sustainable growth”, [Online] available <http://gistadvisory.com/Green%20
Accounting%20-%20Equilibrium-Dec04-%20(page%204-7%20of%2022).pdf>
accessed [11th
June, 2011].

373
Svaleryd, H., and J. Vlachos, (2001), “Markets for risks and openness to trade: how are
they related?” Stockholm School of Economics in its Working paper Series in
Economics and Finance no 327.
Tanna, S., and K. Topaiboul, (2005), “Human capital, trade, FDI and economic growth
in Thailand, what causes what?” Dynamics, Economic Growth, and International Trade,
DEGIT in its series DEGIT conference papers with number c010_046.
Temple, J., (2000), “Growth regressions and what the textbooks don’t tell you”, Bulletin
of Economic Research, 52-3, 181-205.
Teorell, J., N. Charron, M. Samanni, S. Holmberg, and B. Rothstein, (2010), “The QoG
Social Policy Dataset: version 27th May, 2010”, University of Gothenburg: The Quality
of Government Institute, [Online] available <http://www.qog.pol.gu.se> accessed [14th
June, 2010].
Thomas, B.A, and F. Tarp, (2003), “Financial liberalization, financial development and
economic growth in LDCs,” Journal of International Development, 15-2, 189-209
Todaro, M.P. and S.C. Smith, (2003), Economic Development. Pearson Education
Limited. Boston, Massachusetts: Addison Wesley.
Tokat, E. (2005), The Impact of Financial Liberalization on Macroeconomic variables:
A two Country Analysis. A Paper Presented at the Eastern Economic Association
Annual Conference in New York City. March 4-6.
Tornell, A., F. Westermann, and L. Martinez, (2004), “The positive link between
financial liberalization, growth, and crises”, National Bureau of Economic Research
working paper series no. 10293.
Tressel, T and E. Detragiache, (2008), “Do financial sector reforms lead to financial
sector development: Evidence from new dataset,” IMF working paper no 08/265,
Washington, D.C, International Monetary Fund.
Trochim, W.M, (2007), Research methods knowledge base, 3rd ed, Mason, Ohio:
Thomson/Atomic Dog.
374
Turkcan, K., and A. Ates, (2010), “Vertical intra-industry trade and fragmentation: An
empirical examination of the U.S auto-parts industry”, [Online] available
<http://www.eiit.org/WorkingPapers/Papers/TradePatterns/FREIT029.pdf> accessed
[21st July, 2010].
Ucer, E.M, (1998), “Notes on financial liberalisation” [Online] available
<http://www.econ.chula.ac.th/about/member/sothitorn/liberalization_1.pdf>, accessed
[25th
May, 2010].
Udo, E. A. and I.K. Obiora, (2006), “Determinants of Foreign Direct Investment and
Economic Growth in the West African Monetary Zone: A System Equations
Approach”, GTAP, paper presented at the 9th Annual Conference on Global Economic
Analysis, Addis Ababa, Ethiopia.
United Kingdom Department for International Development, DFID (2004), “The
Importance of Financial Sector Development for Growth and Poverty Reduction”.
Provided by the Department for International Development in its series Policy Division
Working Papers with number 12886: [Online] available
<http://www.ncrc.org/global/europe/UK/ UKArticle7.pdf> accessed [22nd
October,
2008]
United Nations Conference on Trade and Development, UNCTAD (2000), “Cross
border mergers and acquisitions and development” in World Investment Report 2000,
[Online] available <http:// www.unctad.org/en/docs/wir2000_en.pdf> United Nations,
New York and Geneva.
United Nations Conference on Trade and Development, UNCTAD (2005), “World
Investment Report, Transnational Corporations and Internationalization of R and D”.
United Nations, New York
United Nations Conference on Trade and Development, UNCTAD (2006), “Foreign
direct investment from developing and transition economies: Implications for
development”, United Nations Conference on Trade and Development, UNCTAD,
United Nations, GENEVA.

375
United Nations Conference on Trade and Development, UNCTAD (2007), “World
Investment Report TNCs in Extractive Industries and Development”. United Nations
New York
United Nations Conference on Trade and Development, UNCTAD (2008),
“Transnational corporations and the infrastructure challenge”, [Online] available
<http://www.unctad.org/en/docs/wir2008_en.pdf> accessed [12th
February, 2009].
United Nations Conference on Trade and Development, UNCTAD (2008), World
Investment Report 2008, [Online], available <www.unctad.org/wir> accessed [12th
February 2009].
United Nations Conference on Trade and Development, UNCTAD (2008), “World
Investment Report, TNCs and the Infrastructural Challenge”. United Nations New York
United Nations Conference on Trade and Development, UNCTAD (2009), “Illiteracy
rates by sexes, aged 15+, percent UNESCO estimates”, [Online], available
<http://data.un.org/ Data.aspx?d=UNESCO&f=srID%3a25600> accessed [5th
June,
2009].
United Nations Conference on Trade and Development, UNCTAD (2010), “UNCTAD
stat online database”, [Online] available <http://unctadstat.unctad.org> [accessed 23rd
June 2009].
United Nations Development Program, (UNDP, 2006) ‘Human Development Report
2006,’ [Online] available <http://hdr.undp.org/en/media/HDR06-complete.pdf>
accessed [17th
May, 2011] (New York: UNDP 2006).
United Nations Economic Commission for Africa, UNECA (2008), Financial
integration in Africa, [Online], available <http://www.uneca.org/aria3/chap7.pdf>
accessed [9th
July, 2010].
United Nations Economic Commission for Africa, UNECA, (2010), “Accessing
regional integration in Africa IV: Enhancing Intra-African Trade”, Addis Ababa,
Ethiopia. [Online] available on < http://www.uneca.org/aria4/ARIA4Full.pdf > accessed
[21st November, 2010].
376
United Nations Educational, Scientific and Cultural Organization, UNESCO (2009),
“Education Indicators: Technical guidelines,” [Online] available
<http://www.uis.unesco.org/ Library/Documents/eiguide09-en.pdf> accessed [5th
June,
2009].
United Nations, (2001), “Responding to globalisation: facilitating the integration of
developing countries into the world economy in the 21st century”, General Assembly,
56th
Session Agenda item 109(c) of the provisional agenda High-level dialogue on
strengthening international economic cooperation for development through
partnership. New York.
United States Department of Agriculture (USDA, 2011), Economic Research Service,
International Macroeconomic Data Set.
University of Pretoria (1989), “Focus on key economic issues”, No 45.
Uy, M., (2010), “Africa’s private sector: A catalyst for growth: Conference on
entrepreneurship in Africa,” Whitman school of management, Syracuse University,
April 1-3, 2010.
Vadlamannati, K. C., A. Tamazian, and L.R. Irala, (2009), “Determinants of foreign
direct investment and volatility in South East Asian economies,” Journal of the Asia
Pacific Economy, 14, 246-261.
Van De Walle, S., (2005), “Measuring Bureaucratic quality in governance indicators”,
Paper for the 8th Public Management Research Conference, [Online] available <
http://www.pmranet.org/conferences/USC2005/USC2005papers/pmra.vandewalle.2005.
pdf > accessed [4th
April, 2011].
Vernon, R., (1966), “International investment and international trade in the product
cycle”, Quarterly Journal of Economics, 80, 190-207.
Verspagen, B., (1991): “A new empirical approach to catching up or falling behind”,
Structural Change and Economic Dynamics, 2-2, 359-380.

377
Vijayakumar, N., and P. Sridharan, (2010), “Determinant of FDI in BRICS countries: A
panel analysis”, International Journal of Business Science and Applied Management, 5-
3, 1-13.
Wakeman-Linn, J., C. Delechat, A. Kovanen, G. Ramirez, J. Vadasz, and S. Wagh,
(2008), “Private capital inflows to Sub-Saharan Africa: Financial globalisation’s final
frontier”, Based on chapter 3 of the Spring 2008 Regional Economic Outlook for Sub-
Saharan Africa, World Economic and Financial Surveys, April, Washington DC:
International Monetary Fund.
Wang, M., (2009), “Manufacturing FDI and economic growth: Evidence from Asian
economies,” Applied Economics, 41, 991-1002.
Wachtel, P., and P.L. Rousseau, (2000), “Inflation, Financial Development and
Growth,” Working Papers 00-10, New York University, Leonard N. Stern School of
Business, Department of Economics.
Wei, S.J., (2000), “How Taxing is Corruption on International Investors?,” The Review
of Economics and Statistics, 82-1, 1-11.
Weil, D.N., (2005), Economic growth. Pearson Education.
Wilson, D., and A. Stupnytska, (2007), “The N-11: More than an Acronym”. Goldman
Sachs, Global Economics Paper no. 153. [Online] available <
http://www.chicagobooth.edu/alumni/clubs/pakistan/docs/next11dream-march%20'07-
goldmansachs.pdf> Goldman Sachs Economic Research, accessed [15th
November,
2010].
Wilson, D., and R. Purushothaman, (2003), “Dreaming with the BRICs: The path to
2050”, Goldman Sachs Global Economics paper (99), [Online] available
<http://www2.goldmansachs.com/our-thinking/brics/brics-reports-pdfs/brics-
dream.pdf> accessed [8th
July, 2008].
Woodward, D., and R. Rolfe. (1993), “The Location of Export-Oriented Foreign Direct
Investment in the Caribbean Basin,” Journal of International Business Studies, 24,121-
144

378
World Bank (1997), Private Capital Flows to Developing Countries: The Road to
Financial Integration. Oxford: Oxford University Press.
World Bank, (1989), World Development Report: Financial systems and development
Washington, D.C.
World Bank, (2003), “Global Economic Prospects and the Developing Countries”,
Washington DC: World Bank.
World Bank, (2005), “Economic growth in the 1990s: Learning from a decade of
reform”, The International Bank for reconstruction and development/ The World Bank,
Washington DC.
World Bank, (2007), World Bank development report: Development and the next
generation, Washington DC.
World Bank, (2008), “The growth report: strategies for sustained growth and inclusive
development: Commission on growth and development, The International Bank for
Reconstruction and Development / The World Bank, Washington DC.
World Bank, (2008), World Development Indicators, Economic and Social Data Service
International, University of Manchester.
World Bank, (2009), World Development Indicators, [Online], available <
http://data.worldbank.org/indicator>, accessed [13th December, 2010].
World Bank, (2010), World Development Indicators, [Online], available <
http://data.worldbank.org/indicator>, accessed [4th October, 2010].
World Bank, (2011), World Development Indicators, (edn: September 2011). Economic
and Social Data Service International, University of Manchester.
World Economic Forum, (2008), “The financial development report 2008”, [Online],
available <https://members.weforum.org/pdf/financialdevelopmentreport/2008.pdf>
accessed [2nd
July, 2011].
379
World Investment Report (2006), “FDI from developing and transition economies:
implication for development”. [Online] available <http://www.unctad.org/en/docs/
wir2006_en.pdf> accessed [12th
February, 2009]
World Trade Organisation, (2008), “Trade in a globalising world”, [Online] available
<http://www.wto.org/english/res_e/booksp_e/anrep_e/world_trade_report08_e.pdf>
accessed [21st November, 2010].
Wright, J. H. (2000), “Alternative Variance-Ratio Tests Using Ranks and Signs,” Journal
of Business and Economic Statistics, 18-1, 1-9.
Wright, M., I. Filatotchev R. Hoskisson, and M.W. Peng, (2005). ‘Strategy research in
emerging economies: challenging the conventional wisdom’. Journal of Management
Studies, 42, 1–33.
Yago, M., and W. Morgan, (2008), “The impact of policy reversal in economic
performance in Sub-Saharan Africa”, European Journal of Political Economy, 24-1, 88-
106.
Yartey, C.A., and C.K. Adjasi, (2007), “Stock market development in Sub-Saharan
Africa: Critical issues and Challenges” International Monetary Fund working paper,
WP/07/209, IMF.
Zhao T., V. Murinde and K. Mlambo, (2011), “How Does the Institutional Setting for
Creditor Rights Affect Bank Lending and Risk-Taking?” Stirling Economics Discussion
Paper, 2011.
Zhang, K.H., (1999), “How does FDI interact with economic growth in a large
developing country? The case of China”, Economic Systems, 21, 291-304.
Zhang K.H., (2001a), “FDI and economic growth: Evidence from ten East Asian
Economies,” International Economics, 52-4, 517-535.
Zhang, K.H., (2001b). “Does foreign direct investment promote economic growth?
Evidence from East Asia and Latin America”, Contemporary Economic Policy, 19-2,
175-185.

380
Zhang, K.H. (2003), “Does financial development promote economic growth in East
Asia?” China Journal of Finance”, 1-2, 1-10.
Zhang, K.H. (2009), “FDI and export performance,” Princeton University Press,
Princeton, NJ, 2009: 454-456.
Zhuang, H., (2008), “Foreign direct investment and human capital accumulation in
China”, International Research Journal of Finance and Economics, 1-19, 205-215.