Embed Size (px)
Citation preview
THE UNIVERSITY OF NORTH CAROLINA
Continuing Operational Efficiencies
October 10, 2013
Setting the StageMr. Charles Perusse, Chief Operating Officer
UNC Resourcing Survey AnalysisMr. Ken Craig, UNCFIT Program Management Officer
Public-Private PartnershipsDr. Rick Niswander, Chief Financial Officer, East Carolina University
Unlocking Capital AssetsMr. Jonathan Womer, Associate VP for Finance and Economic Analysis
Moving ForwardMr. Charles Perusse, Chief Operating Officer
Continuing Operating Efficiencies
Outline
2
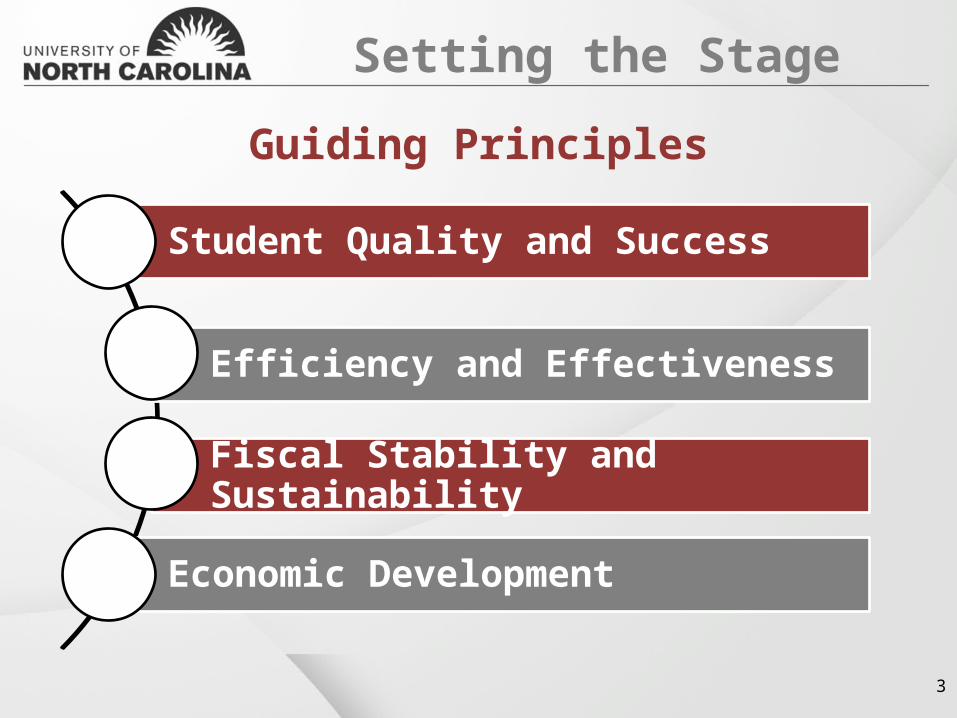
Student Quality and Success
Efficiency and Effectiveness
Fiscal Stability and Sustainability
Economic Development
Setting the Stage
Guiding Principles
3

Providing instruction, research, and public service excellence within the context of declining or finite resources
Increased focus on Return on Investment (ROI)
Heightened demand for transparency and accountability
Setting the Stage
Higher Education Trends
4

Ernst &Young
McKinsey&
Company
UNC / OSBM
Efficiency Report
Goal 4: Maximizing Efficiencies
UNC Strategic Plan
GA Execution Campus Execution
Campus- Initiated
Innovation(i.e. Bain)
PACE
UNC Resourcing Survey Analysis
Setting the Stage
UNC Efficiency Background
5
UNC Resourcing Survey Analysis
6
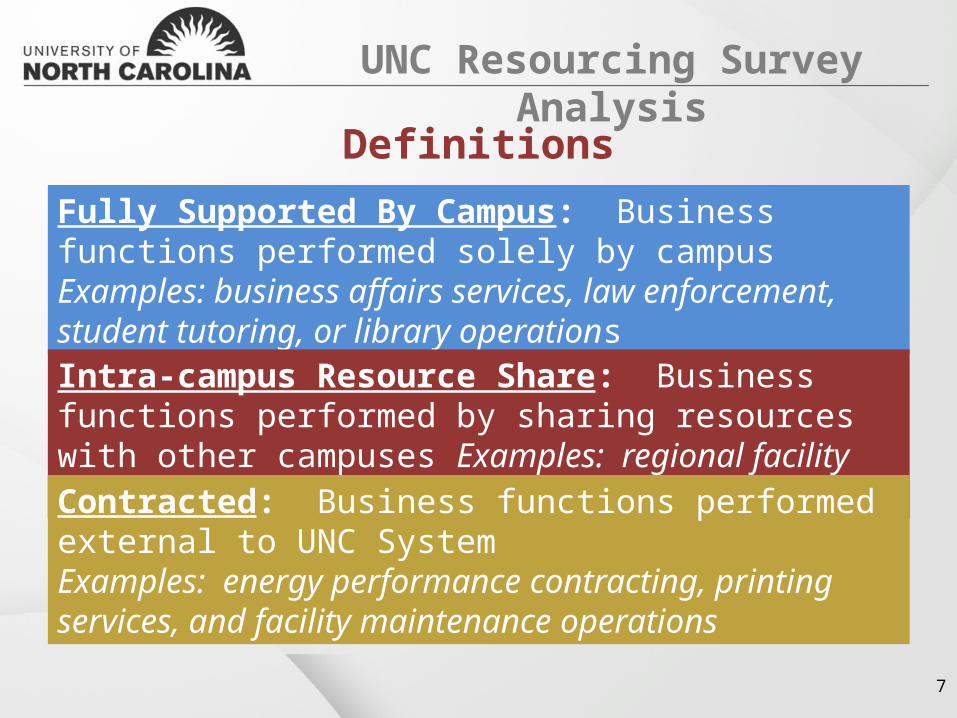
Fully Supported By Campus: Business functions performed solely by campus Examples: business affairs services, law enforcement, student tutoring, or library operationsIntra-campus Resource Share: Business functions performed by sharing resources with other campuses Examples: regional facility maintenance and IT supportContracted: Business functions performed external to UNC System Examples: energy performance contracting, printing services, and facility maintenance operations
UNC Resourcing Survey Analysis
Definitions
7
In continuing the Strategic Plan efforts regarding Maximizing Efficiencies, General Administration conducted a campus survey in July to: Determine similarities related to campus services
being delivered internally, co-sourced, or outsourced;
Provide examples of campus effectiveness efforts; and
Identify building blocks for new operational efficiency actions.
UNC Resourcing Survey Analysis
Campus Innovation
8

UNC Resourcing Survey Analysis
Survey Results
9
Business Area
Fully Supported by Campus
Contracted Service
Intra Campus
Resource Share
Common UNC Synergies
Athletics/Special Events 78 63 1
Facilities 451 339 19
Finance and Administration 162 60 16
Human Resources 92 31 5
Student Services 74 62 7
Systems and Technology 203 83 67
Travel 68 36 6
Grand Total 1,128 674 121
Notes :1. The analysis documents samples of campus resourcing. The results identify similarities but do not provide an all-inclusive listing of life-to-date campus resourcing efforts.2. Checkmarks apply to services where eight or more campuses used either outsource and/or co-source solutions resulting in a combined alternative service delivery percentage of 33% or higher.
UNC Resourcing Survey Analysis
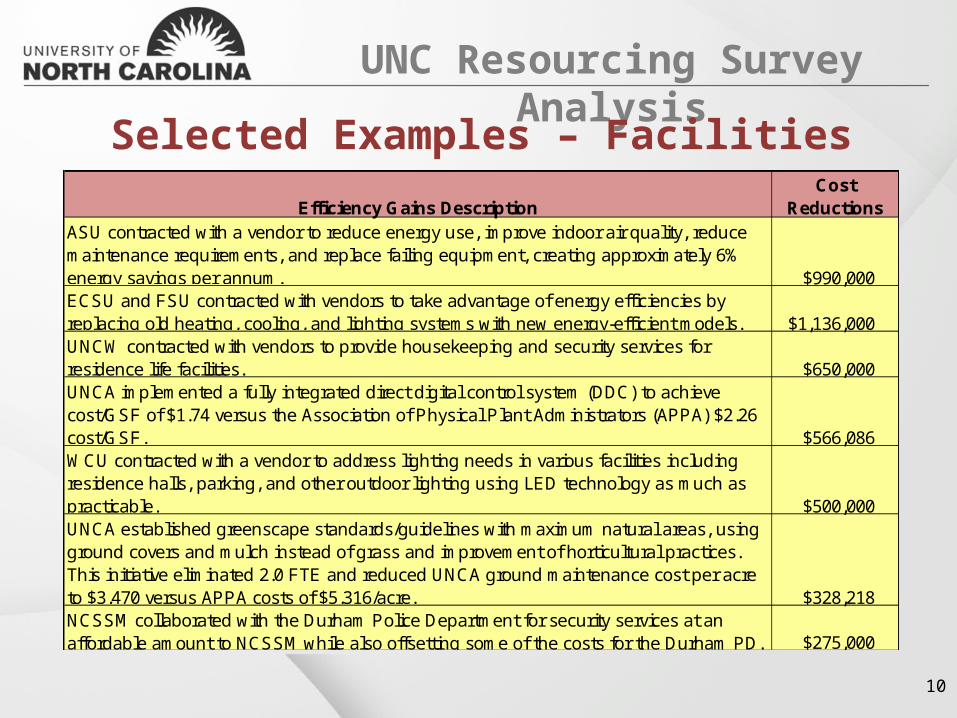
Selected Examples – Facilities
Efficiency Gains DescriptionCost
ReductionsASU contracted with a vendor to reduce energy use, improve indoor air quality, reduce maintenance requirements, and replace failing equipment, creating approximately 6% energy savings per annum. $990,000 ECSU and FSU contracted with vendors to take advantage of energy efficiencies by replacing old heating, cooling, and lighting systems with new energy-efficient models. $1,136,000 UNCW contracted with vendors to provide housekeeping and security services for residence life facilities. $650,000 UNCA implemented a fully integrated direct digital control system (DDC) to achieve cost/GSF of $1.74 versus the Association of Physical Plant Administrators (APPA) $2.26 cost/GSF. $566,086 WCU contracted with a vendor to address lighting needs in various facilities including residence halls, parking, and other outdoor lighting using LED technology as much as practicable. $500,000 UNCA established greenscape standards/guidelines with maximum natural areas, using ground covers and mulch instead of grass and improvement of horticultural practices. This initiative eliminated 2.0 FTE and reduced UNCA ground maintenance cost per acre to $3,470 versus APPA costs of $5,316/acre. $328,218 NCSSM collaborated with the Durham Police Department for security services at an affordable amount to NCSSM while also offsetting some of the costs for the Durham PD. $275,000
10

UNC Resourcing Survey Analysis
Selected Examples – Finance and Administration
11
Efficiency Gains DescriptionCost
Reductions
UNCC implemented SciQuest automated purchase-to-payment solution for university commerce. The solution automated the internal approval and purchasing process, reduced order and invoicing errors, increased the amount of purchases using vendors on State contract, eliminated unnecessary delays, alleviated ordering and billing errors, allowed for consortia catalog savings, maintained audit trail that allowed for supporting documentation. $900,000
NCSSM co-sourced legal affairs and internal audit services with UNCGA. $149,000
UNCW optimized the central receiving function to reduce warehouse receiving costs by 33% and shifted responsibility to vendors to provide departmental delivery. $100,000
UNCG contracted with a vendor to enable credit card payments online and reduce PCI compliance costs. $100,000
UNCG contracted with a vendor to provide motor fleet management services. $90,000
UNC Resourcing Survey Analysis
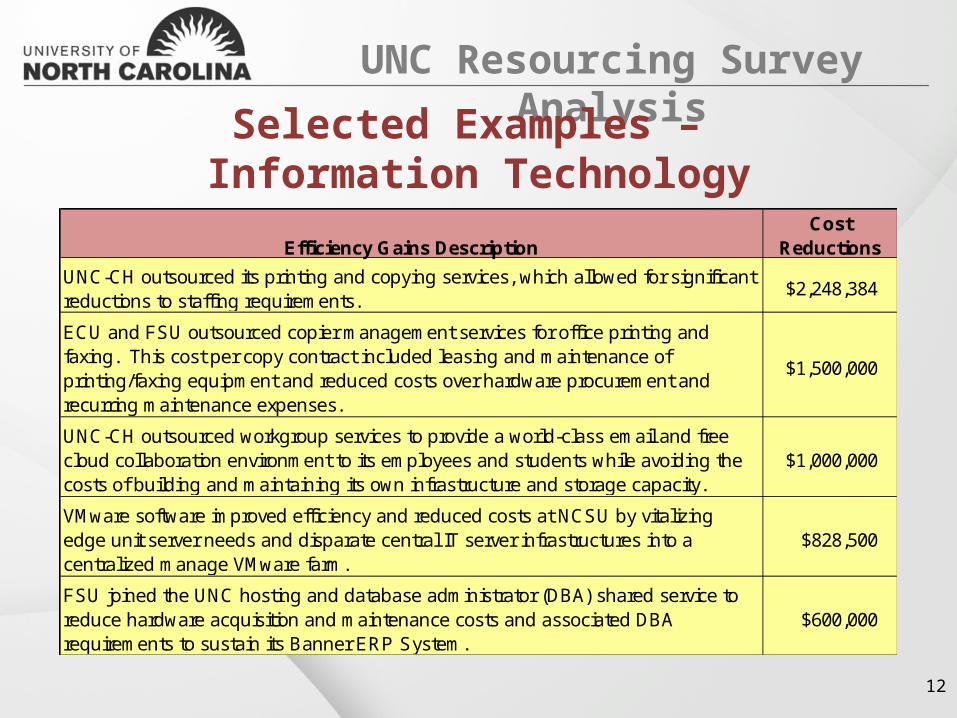
Selected Examples – Information Technology
12
Efficiency Gains DescriptionCost
Reductions
UNC-CH outsourced its printing and copying services, which allowed for significant reductions to staffing requirements.
$2,248,384
ECU and FSU outsourced copier management services for office printing and faxing. This cost per copy contract included leasing and maintenance of printing/faxing equipment and reduced costs over hardware procurement and recurring maintenance expenses.
$1,500,000
UNC-CH outsourced workgroup services to provide a world-class email and free cloud collaboration environment to its employees and students while avoiding the costs of building and maintaining its own infrastructure and storage capacity.
$1,000,000
VMware software improved efficiency and reduced costs at NCSU by vitalizing edge unit server needs and disparate central IT server infrastructures into a centralized manage VMware farm.
$828,500
FSU joined the UNC hosting and database administrator (DBA) shared service to reduce hardware acquisition and maintenance costs and associated DBA requirements to sustain its Banner ERP System.
$600,000

UNC Resourcing Survey Analysis
Selected Examples – Student Services
Efficiency Gains DescriptionCost
Reductions
UNC-CH piloted a revolutionary joint electronic resource acquisition and sharing initiative with Oxford University Press in order to provide larger and more robust digital resources to students and researchers at all Triangle Research Library Network (TRLN) libraries. This pilot directly contributed to reduction of electronic titles among the TRLN libraries. $430,940 UNCA outsourced its bookstore operations to reduce operating costs by 4.0 FTE, decreased rental program costs by $65K/year, and increased contributions to scholarship aid by 103% for an annual contribution of $178K. $329,413 UNCSA outsourced bookstore operations that resulted in the reduction of operating costs by $255K and 2.0 FTE annually. $255,038 NCSU contracted with a vendor to reduce food costs by taking advantage of the alliance's national network consortia negotiated pricing discounts. $200,000 UNC-CH implemented an interlibrary lending and borrowing service for the purpose of sharing system-wide library collections. This initiative significantly reduced costs associated with storage, cataloging, circulation, and preservation of library assets for the entire UNC System. $195,000 NCSSM collaborated with UNC Hospitals for health services to students at an affordable cost. $125,000
13

UNC Resourcing Survey Analysis
Selected Examples – System-wide Services
Efficiency Gains DescriptionCost
Reductions
Strategic Sourcing $5,700,000
Public Private Partnerships - Energy Savings $3,500,000
SciQuest e-Procurement $3,500,000
Payroll Shared Services for nine campuses $1,500,000
Human Resources Data Mart $800,000
Shared Banner Hosting Service $800,000
Shared Database Administrator Service $500,000
Export Control and Data Mining Capabilities for Contract and Grant Opportunities $200,000
14
Public-Private Partnerships
15
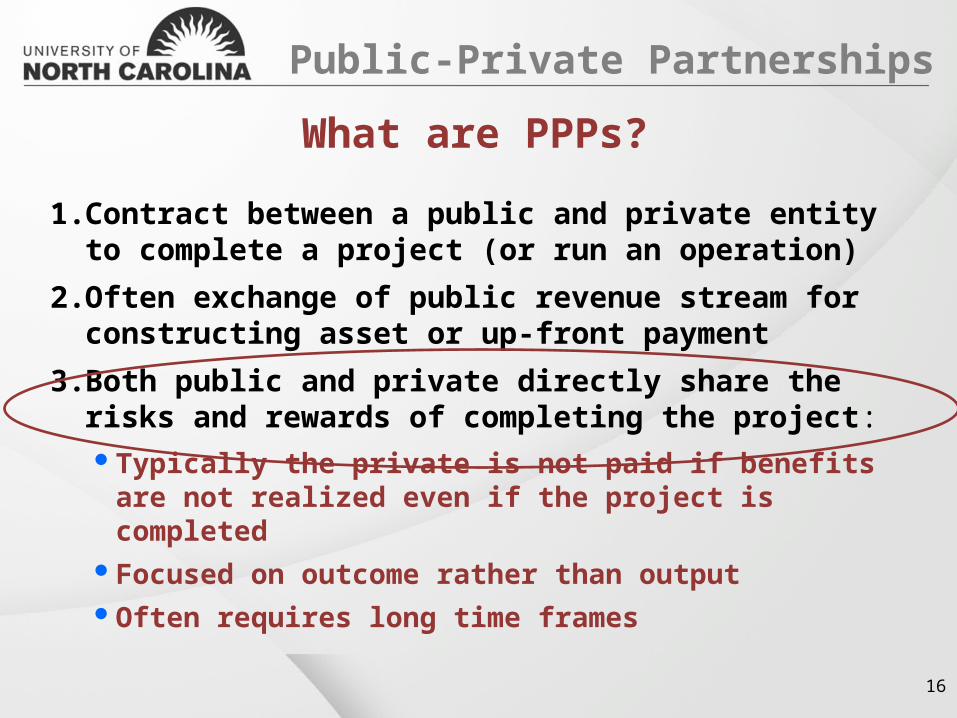
1. Contract between a public and private entity to complete a project (or run an operation)
2. Often exchange of public revenue stream for constructing asset or up-front payment
3. Both public and private directly share the risks and rewards of completing the project: Typically the private is not paid if benefits are
not realized even if the project is completed Focused on outcome rather than output Often requires long time frames
What are PPPs?
Public-Private Partnerships
16

Potential Risks: Requires more
vendor/contract management skills
It’s “different” – legal, process, financial issues
Potential Benefits: Vendor and the public
agency can focus on core expertise
Start without a big budget or get large up-front payment
Recent construction example (2013):
Public-Private Partnerships
What are PPPs?
17
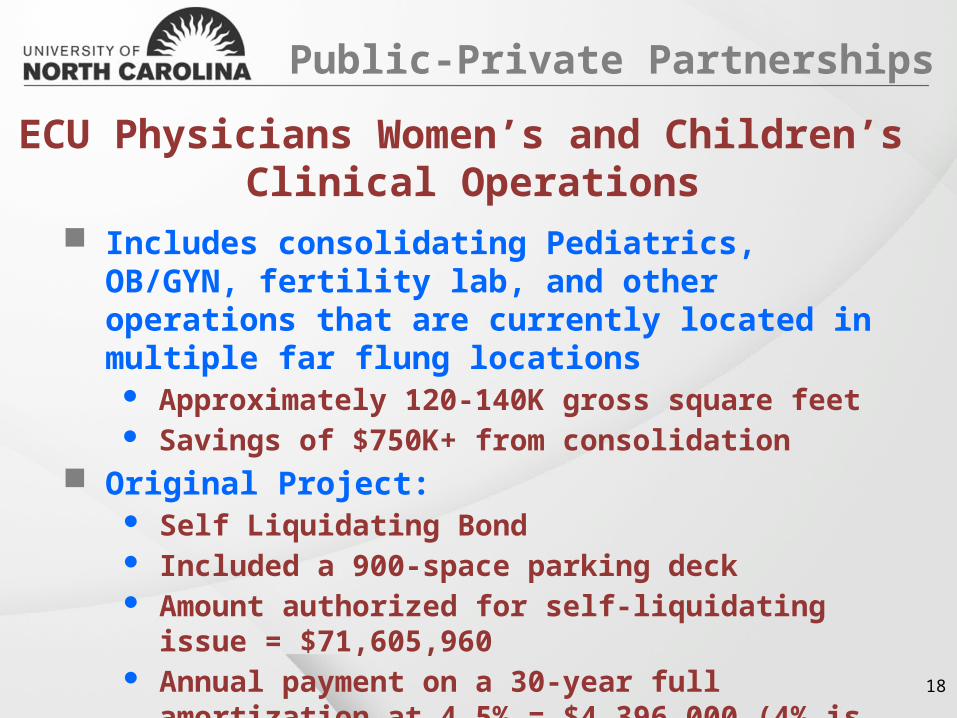
Includes consolidating Pediatrics, OB/GYN, fertility lab, and other operations that are currently located in multiple far flung locations
Approximately 120-140K gross square feet Savings of $750K+ from consolidation
Original Project: Self Liquidating Bond Included a 900-space parking deck Amount authorized for self-liquidating issue =
$71,605,960 Annual payment on a 30-year full amortization at
4.5% = $4,396,000 (4% is $4,140,980)
Public-Private Partnerships
ECU Physicians Women’s and Children’s Clinical Operations
18

New Project: Lease term will be 10 years and ECU will have the
right to enter into another 10-year lease with option to purchase at fair market value
Annual lease cost is estimated to be $2.5M to $3.1M, depending on eventual size and the types of operations within the facility
Annual cash flow savings between $1.3M to $1.9M Parking deck not needed since facility will be built in
a lower density area where surface parking is sufficient
Adjacent to two leased clinical buildings and across the street from Brody School of Medicine
Public-Private Partnerships
ECU Physicians Women’s and Children’s Clinical Operations
19

Public-Private Partnerships
ECU Women’s and Children’s ClinicGreenville, NC
20

Benefits: Lowers risk and higher return Reduces leverage on balance sheet Reduces operating risk to ECU
Physicians Facility built to ECU specifications Shorter time of construction Helps control fixed costs
Public-Private Partnerships
ECU Physicians Women’s and Children’s Clinical Operations
21

Unlocking Capital AssetsThe Ohio State University Parking Case Study
22

Exchanging the long‐term operation and use of infrastructure assets (or other capital assets with a revenue stream) for an up-front cash payment: Sale vs. lease Must be able to isolate (enough) from core
services to enable independent operation Legal constraints and possible tax benefits Deal must be big enough Common public sector examples: highways,
parking, water treatment plants
Unlocking Capital Assets
What is asset monetization?
23
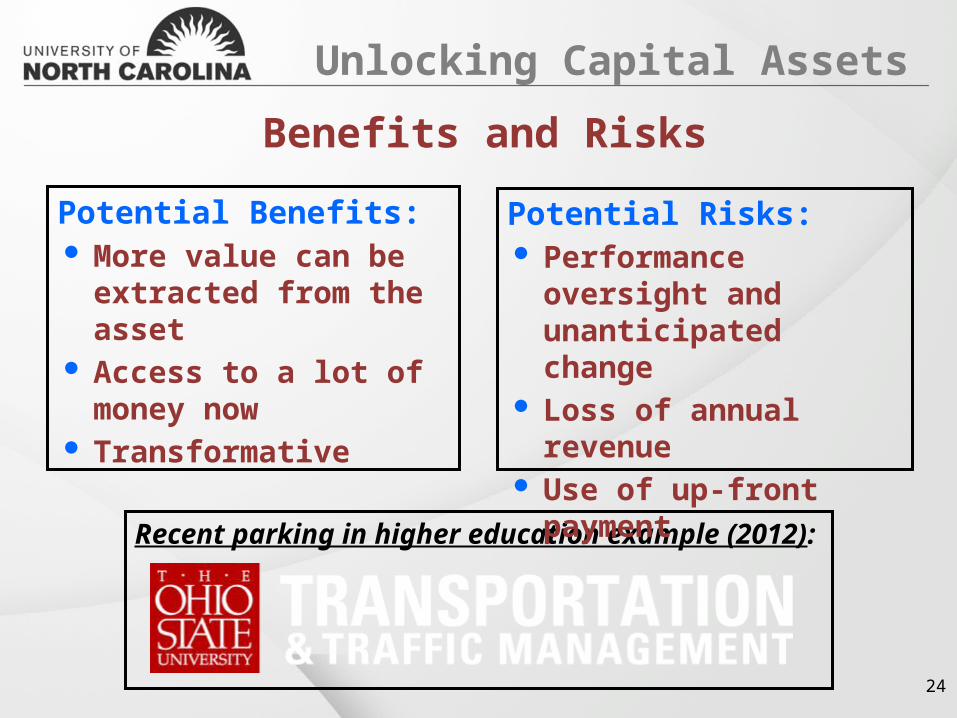
Potential Benefits: More value can be
extracted from the asset Access to a lot of
money now Transformative
Recent parking in higher education example (2012):
Potential Risks: Performance oversight
and unanticipated change
Loss of annual revenue Use of up-front payment
Unlocking Capital Assets
Benefits and Risks
24
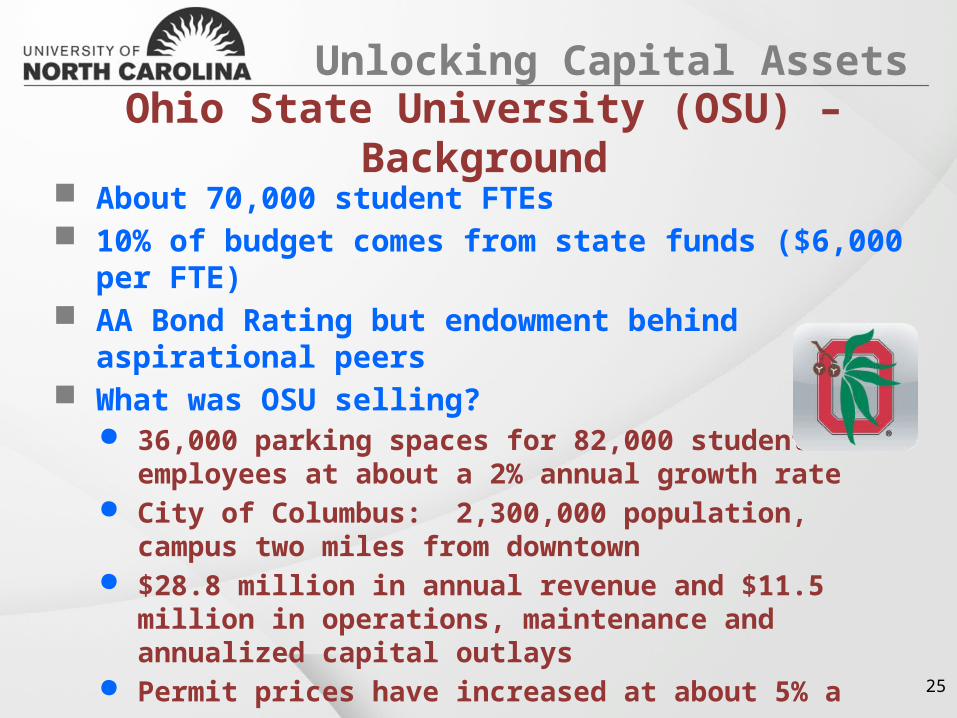
About 70,000 student FTEs 10% of budget comes from state funds ($6,000 per
FTE) AA Bond Rating but endowment behind aspirational
peers What was OSU selling?
36,000 parking spaces for 82,000 students and employees at about a 2% annual growth rate
City of Columbus: 2,300,000 population, campus two miles from downtown
$28.8 million in annual revenue and $11.5 million in operations, maintenance and annualized capital outlays
Permit prices have increased at about 5% a year
Unlocking Capital Assets
Ohio State University (OSU) – Background
25

Transportation
ParkingServices
PublicSafety
Ohio State University
Unlocking Capital Assets
OSU Lease Parking Operations
26

March 2011 – University Working Team formed Hired Morgan Stanley as financial advisor Mapping/questioning business processes,
inventory and condition of assets September 2011–Board authorization October 2011–RFQ issued for Concessionaires January 2012–Four bidders begin Due Diligence April 2012–RFP issued to three remaining
bidders May 2012–Three proposals received by OSU June 29, 2012–University awards to QIC September 21, 2012–Closing Day
Forums, protests, meetings,
faculty papers, email
campaigns
Governance
Unlocking Capital Assets
Ohio State University Timeline
27

$483M one-time up-front payment ($375M was minimum bid allowed)
20% higher than other two bids 5.5% cap on rate increases for the first 10 years and
4% thereafter Protections against competition Acceptance of OSU Transportation Sustainability Plan Performance requirements Faculty/student parking
benefits remain
Giving up about $17.3M a year – funded buses and other transportation
Unlocking Capital Assets
Ohio State University – Accepted Bid Terms
28

$483M put into endowment and designated for: Faculty Initiatives & Research: $200M Transportation & Sustainability: $150M
CABS (partial funding of the bus system) Pedestrian friendly infrastructure Energy efficiency projects
Student Scholarships: $83M Arts District: $50M
9% Expected Growth
Remaining transportation operating costs coming from other sources.
4.75%Reinvest
4.25%Spend
Unlocking Capital Assets
Ohio State University – Where the money is spent?
29
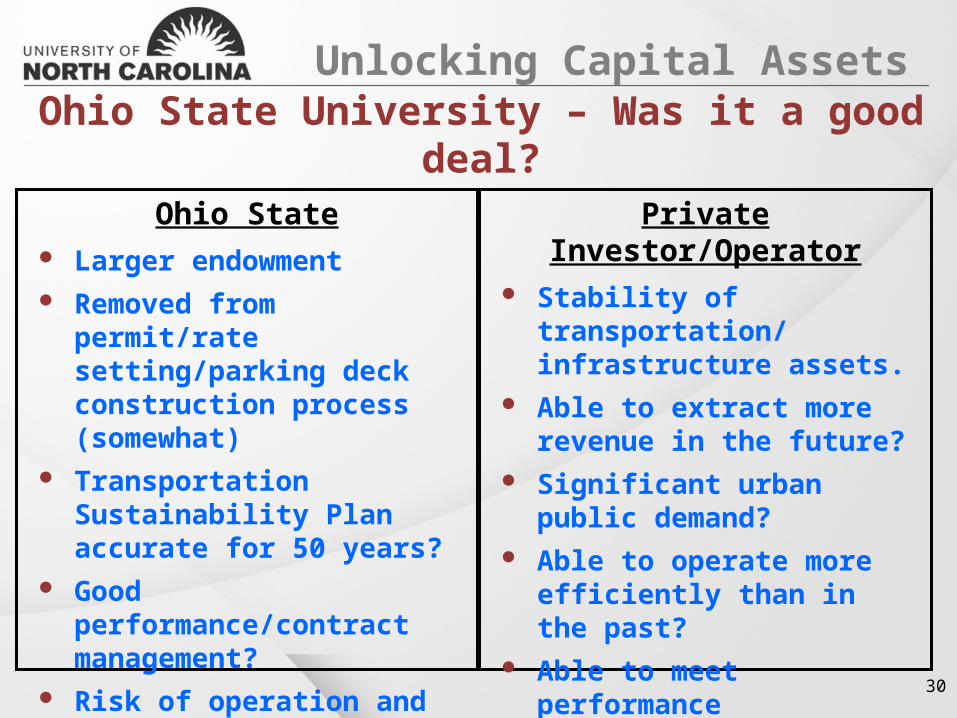
Ohio State Larger endowment Removed from permit/rate
setting/parking deck construction process (somewhat)
Transportation Sustainability Plan accurate for 50 years?
Good performance/contract management?
Risk of operation and capital cost vs. rate of return (9%?)
Private Investor/Operator Stability of transportation/
infrastructure assets. Able to extract more revenue
in the future? Significant urban public
demand? Able to operate more
efficiently than in the past? Able to meet performance
requirements?
Unlocking Capital Assets
Ohio State University – Was it a good deal?
30
Moving Forward
31

Efficiency
Cost (ROI)
Mission
Quality
Moving Forward
Priorities
32

Continue expanding energy conservation efforts and reducing energy consumption
Implement a spend analysis tool to enable further catalog and strategic sourcing savings
Continue expanding strategic sourcing efforts with Department of Administration, public schools, and private colleges and universities
Expand IT shared services for ERP hosting and DBA support services
Moving Forward
On-going Plans
33

Leverage center of excellence support from UNC-CH/NCSU to constituent campuses
Develop facilities maintenance optimization plans to reduce operating costs, seek private-public facility partnerships, and leverage existing capital assets
Moving Forward
Future Plans
34
BOG Discussion
Questions?
35