Embed Size (px)
Citation preview
Annual Report2015
The University of Sydney Annual Report 2015

The University of SydneyNSW 2006
April 2016
The Hon. Adrian Piccoli, MPMinister for Education
Governor Macquarie Tower1 Farrer PlaceSydney NSW 2000
Dear Minister,
The Senate of the University of Sydney has the honour of presenting to you, in accordance with the Annual Reports (Statutory Bodies) Act 1984 and its subsequent amendments, the report of the proceedings and financial statements of the University of Sydney for the year ended 31 December 2015.
Belinda Hutchinson AMChancellor
Dr Michael SpenceVice-Chancellor and Principal

2015 in numbers ������������������������������������������������������������������� 2Year in review �����������������������������������������������������������������������4The University of Sydney ������������������������������������������������������� 6Learning and teaching ���������������������������������������������������������� 7Research and innovation �����������������������������������������������������15Development and engagement ��������������������������������������������18Our staff ���������������������������������������������������������������������������� 22Academic promotions �������������������������������������������������������� 26Governance and leadership ������������������������������������������������30University Officers ���������������������������������������������������������������31University of Sydney Senate 2015 ���������������������������������������� 33Senate committees ����������������������������������������������������������� 34Senate governance ������������������������������������������������������������� 34Senior executive remuneration 2015 ����������������������������������� 37Resources and investment �������������������������������������������������� 38Operations �������������������������������������������������������������������������40Work health and safety governance ������������������������������������40Legal affairs ������������������������������������������������������������������������41Waste management and sustainability �������������������������������� 42Consumer response ����������������������������������������������������������� 43 Privacy and personal information ���������������������������������������44Government Information (Public Access) Act �����������������������44
Financial year in review 47Operating revenue ������������������������������������������������������������� 48Operating expenses�������������������������������������������������������������51Expenditure on assets �������������������������������������������������������� 52Equity �������������������������������������������������������������������������������� 52Operating statement ���������������������������������������������������������� 53Investments and investment performance �������������������������� 54Creditors’ payment performance ��������������������������������������� 55Summary of real estate owned or occupied by the University������������������������������������������������������������������������������������������ 56Overseas travel ������������������������������������������������������������������ 57Financial statements for subsidiaries ��������������������������������� 57
Financial Reports and Statements 2015 58

As Australia’s first university our reputation spans more than 160 years� In 2015, we were ranked in the top 0.3% of universities worldwide, including 45 in the QS World University Rankings� We taught more than 33,000 undergraduate and 21,000 postgraduate students, including more than 10,000 international students from more than 140 countries�
2015 in numbersPa
ge 2
sydn
ey.e
du.a
uTh
e Un
iver
sity
of
Sydn
eyAn
nual
Rep
ort
2015
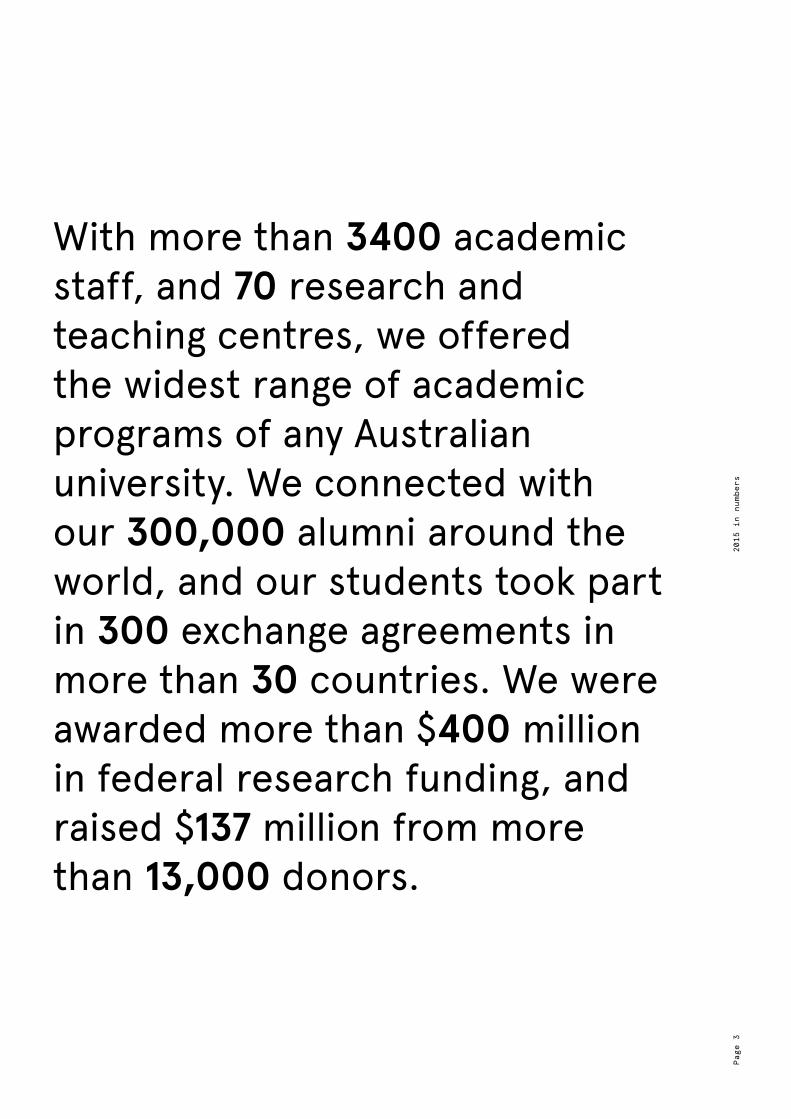
With more than 3400 academic staff, and 70 research and teaching centres, we offered the widest range of academic programs of any Australian university� We connected with our 300,000 alumni around the world, and our students took part in 300 exchange agreements in more than 30 countries� We were awarded more than $400 million in federal research funding, and raised $137 million from more than 13,000 donors�
Page
320
15 i
n nu
mber
s

As we came to the end of the Strategic Plan 2011–15, we spent a year consulting with our community about the future direction of the University� We held numerous town hall meetings, small group discussions and one on ones, all aimed at honing our Strategic Plan 2016–20� We released six discussion papers, covering education, research, culture, and organisational design, and pored over the resulting feedback� The Strategic Plan 2016–20 was approved in March 2016, and we are immensely proud of it and confident that it will take the University in the right direction across the next five years�
During 2015, we appointed our new Deputy Vice‑Chancellor (Research), Professor Duncan Ivison, and we are pleased that the University has continued to rise in the Times Higher Education rankings and is now ranked third in Australia and 56th globally� The University topped the list of Australian universities in the inaugural QS Graduate Employability Rankings and was rated in the top 15 in the world� In the Excellence for Research in Australia (ERA) 2015 results announced by the Australian Research Council in December, 100 per cent of the University’s research was ranked above, or well above, world standard�
The University completed three major building projects in 2015, with the Sydney Nanoscience Hub purpose built for the Australian Institute for Nanoscale Science and Technology, and the exceptional facilities at the new Business School building in the Abercrombie Precinct� We also completed the refurbishment of the Queen Mary Building, providing accommodation for 800 students�
China continued to be a key priority for the University and in 2015 we held another highly successful Sydney China Business Forum, this time looking at China’s health revolution and its implications for Australian research and industry�
Both of us travelled to China in November, where the Vice‑Chancellor signed the agreement for the establishment of the University’s first overseas multidisciplinary centre, to be located in Suzhou, 100km northwest of Shanghai�
Other senior leaders spent time travelling on behalf of the University in 2015, with the Vice‑Chancellor also attending the Boao Forum for Asia and the 25th Annual Meeting of Sydney University Alumni in North America in July� Deputy Vice‑Chancellor (Provost) Professor Stephen Garton also travelled to China, visiting Shenzhen for the Worldwide Universities Network conference, while Deputy Vice‑Chancellor (Education) Professor Pip Pattison attended the Association of Pacific Rim Universities (APRU) Presidential Retreat and 19th Annual Presidents meeting in Osaka, Japan� Among many achievements in the international sphere, we were delighted to accept funding from the government via the New Colombo Plan to support 20 projects and mobility experiences for 123 students in 12 countries in Asia�
And while we achieved success in the areas of education, research and global engagement, 2015 was very much a year when we examined culture, equity and diversity at the University�
Several graduates of our Wingara Mura – Bunga Barrabugu program applied to our University in 2016, demonstrating that our philosophy to engage school students with the University inspires them with both dreams and the commitment to chase them�
In February, we held a successful re‑enactment of the 1965 Freedom Ride across regional New South Wales, connecting with, and raising national and international awareness of, Aboriginal communities� Several of the original Freedom Riders were able to join us on the journey and our students benefited immeasurably from the experience� We extended
Year in review
The University of Sydney is an exciting and rewarding community of thinkers and leaders� Every year, while filled with its own challenges, ends with a feeling of great achievement and pride� 2015 was no exception�
Page
4sy
dney
.edu
.au
The
Univ
ersi
ty o
f Sy
dney
Annu
al R
epor
t 20
15

the celebrations to the very heart of the University, holding a concert open to both our community and the wider Sydney public on the Quadrangle lawns�
We further demonstrated our commitment to diversity and inclusion with alumnus and former High Court judge Michael Kirby AC, CMG launching the University’s first branch of the Ally Network� In a show of support for the Lesbian, Gay, Bisexual, Transgender, Bisexual, Intersex and Queer community, we flew the Rainbow Flag over the Quadrangle for the first time� Mr Kirby was also a leading light in our flagship ‘Leadership for Good’ campaign, featuring well‑known alumni whose achievements have been beneficial to Australia and the world�
In March, we held several very successful events for International Women’s Day, with a further day focused on equality for women taking place in November� These symposiums engender conversation and debate in our community, leading to commitments and action� Following the events of 2014 and 2015, we have set targets to ensure that 40 percent of senior leadership positions are filled by women by 2020� We commenced our ‘culturally and linguistically diverse’ mentorship program for female staff in 2015 and will build on that in 2016, and we successfully applied to join the Science in Australia Gender Equity Pilot of the Athena SWAN Charter� The program’s aim is to address the under‑representation of women in science, technology, engineering and mathematics�
In 2015 the University encouraged staff and students to engage with life’s great philosophical questions, asking what it means to live a ‘life worth living’, with the Vice‑Chancellor himself developing a six‑week course open to all staff and students� The modules were very well attended and we anticipate broadening the course’s scope in 2016�
We reached out to the wider Sydney community through our sponsorship of the Sydney Writers’ Festival and the Sydney Film Festival, and through our participation in VIVID, which once again lit up the Quadrangle with an inspirational light and sound show designed and composed by our own students� We were also delighted to join the centenary celebrations for the Sydney Conservatorium of Music, including the Bernstein Mass performed magnificently at Sydney Opera House�
We are only touching the tip of the iceberg with the University’s achievements in 2015, but they were great� There are too many to mention, but we close with the INSPIRED campaign, which exceeded its original target a full year earlier than planned� With $600 million now raised, we took the opportunity to set a new target of $750 million to be raised by the end of 2017�
We are so proud of the hard work of all our staff� We thank the Senate, Provost, deputy vice‑chancellors, vice‑principals and our academic and professional staff for their dedication in 2015� Our thanks also to the retiring members of the Senate — two staff Fellows, Dr Gil Merom and Professor Robert van Krieken� We welcome our new Fellows, Professor Sharon Naismith and Professor Jill White, with whom we look forward to working in 2016�
Finally, we acknowledge the life, work and generosity of Robert Leece AO RFD, Pro‑Chancellor and Fellow of Senate, who died suddenly in December� Bob was a colleague and a friend, and made an enormous contribution to the University� We valued his commitment, expertise and integrity greatly, and he is much missed by us and the University community�
Belinda Hutchinson AMChancellor
Dr Michael SpenceVice‑Chancellor and Principal
Page
5Ye
ar i
n re
view

We have been producing the next generation of leaders in diverse fields since we were established in 1850� Through learning, critical analysis and active contribution to public debate, we help to shape Australia’s national and international agenda� This Annual Report tells you about our University in 2015�
To find out more about who we are and what we aspire to be, visit sydney.edu.au
Our charterThe University of Sydney was incorporated by the Parliament of New South Wales on 1 October 1850, making it the first university to be established in Australia� Under the University of Sydney Act 1989 (as amended), the University’s principal functions include:
− provision of facilities for education and research of university standard
− encouragement of the dissemination, advancement, development and application of knowledge informed by free enquiry
− provision of courses of study or instruction across a range of fields, and the carrying out of research, to meet the needs of the community
− participation in public discourse
− conferring of degrees, including those of bachelor, master and doctor, and the awarding of diplomas, certificates and other awards
− provision of teaching and learning that engage with advanced knowledge and enquiry�
Our mission and visionAs a leader in tertiary education, we have been challenging traditions for more than 160 years� We were one of the first universities in the world to admit students solely on academic merit, and to open our doors to women on the same basis as men�
We aim to create and sustain a university in which, for the benefit of both Australia and the wider world, the brightest researchers and the most promising students, whatever their social or cultural background, can thrive and realise their full potential�
In creating the first university in Australia, our founders recognised the power of education to change society� We hold that belief just as strongly today�
The University of Sydney
The University of Sydney is a leading, comprehensive research and teaching community� We’re committed to the transformative power of education and to fostering greater understanding of the world around us�
Page
6sy
dney
.edu
.au
The
Univ
ersi
ty o
f Sy
dney
Annu
al R
epor
t 20
15

Attracting the brightest young thinkersIn 2015 once again we received the highest number of undergraduate preferences among applicants for university entry in NSW and the highest number of undergraduate offers to the top students of 99�95 (ATAR) and 45 (International Baccalaureate) in NSW� The Sydney Scholars program, supporting high‑achieving students with leadership potential, has been expanded to include student development opportunities as well as bespoke employer engagement and linkage programs� E12 schemeE12 is for students who have been financially disadvantaged during their time at school and who have the potential to succeed at Sydney� The E12 scheme shifts the focus from the ATAR alone through an online application where students can show more about themselves and their enthusiasm for study� In 2015 we increased the number of courses on offer from 39 to 69 for the 2016 intake, resulting in an expanded E12 scheme offering courses from all eligible faculties�
Dux scheme We launched the Dux scheme in 2015, which recognises that being named dux of a school is a profound academic achievement that shows leadership potential� We received 348 nominations from NSW schools for 2016 entry�
International scholarshipsIn an effort to attract the finest international minds, in 2015 we formalised a new scholarship called the Vice‑Chancellor’s International Scholarship Scheme, to be introduced in 2016� This scheme provides international student recipients with first‑year tuition and is open to all students, including those from smaller markets, to develop the University’s reach and the diversity of the student cohort�
Graduate outcomesIn 2015, the University of Sydney introduced the Sydney Graduate Trajectories Survey which measures employment and further study outcomes of students 12 months after graduation� The University was ranked first in Australia, and in the top 15 globally, in the inaugural QS Graduate Employability Rankings published by Quacquarelli Symonds� This outstanding result reinforces our commitment to producing the highest quality graduates in Australia� Another highlight in 2015 was the feedback received from our recent research postgraduates, with 90 percent reporting overall satisfaction with their degree� This represents a substantial improvement since 2014 in perceptions of our intellectual climate and quality of supervision�
Student transition, progression and retentionWe offered the student transition, progression and retention program to first‑year students across seven faculties in 2015 to facilitate early problem resolution and academic engagement for those students most likely to encounter difficulties in their first semester of study�
Supporting students with disabilities The University of Sydney Disability Awareness Week, held 7‑11 September 2015, focused on creating a broader understanding of how we can create an inclusive University and engage students and staff with disabilities� Following a successful launch of the event in 2014, we have embedded Disability Awareness Week as an annual event, with the aim of improving the culture of inclusivity at the University and shifting mindsets and attitudes�
Support for international studentsWe held a variety of orientation events for international students� More than 3000 students participated in orientation and transition activities in which we partnered with student organisations to provide student‑focused academic and social activities� In partnership with StudyNSW we established a daily airport arrivals desk to facilitate transition to Sydney for newly arrived international students�
Learning and teaching
Page
7Le
arni
ng a
nd t
each
ing

In 2015, the Careers Centre focused on increasing engagement with international students in its events and workshops� In August, the centre held an International Students Employability Forum that was attended by 310 students� There was a 22 percent increase in attendance at Careers Centre events and workshops for international students, with more than 4900 students accessing the centre during 2015�
The Careers Centre also continued collaborating with faculties to enhance student employability, including through the Faculty of Arts and Social Sciences’ ArtSS Career Ready program that offers workshops for students before and after their placement�
Student accommodation In 2015, successful completion of the Queen Mary building (800 beds) and Abercrombie Student Accommodation (200 beds) provided a substantial uplift to student housing on the campus doorstep�
New Student CentreIn November 2015 the new Student Centre and the Higher Degree by Research Administration Centre opened� These purpose‑built centres include concierge, self‑service, counter and interview spaces and queue‑management technology to support allocation of enquiries to appropriate staff�
The centres are more student‑friendly spaces, reflecting our commitment to deliver effective and high‑quality customer service to our students� The centres are part of the implementation of a tiered service delivery model whereby all general (tier 1) student administration enquiries, either in person, by phone, via email or web based have been transitioned from faculties to the centres�
New evaluation framework for learning and teachingThe Education Portfolio is working in partnership with the faculties to enhance learning and teaching at the University� In 2015 we introduced Education Key Performance Indicators� These relate to the learning experience of current coursework and postgraduate research students, as well as our recent graduates� We anticipate that this transparency in reporting and clearly identifying strengths and weaknesses will lead to targeted quality‑improvement strategies�
Student feedbackWe introduced the new automatic and online Unit of Study Survey in 2015 to replace the previous optional paper‑based survey� This means coverage on this important measure of quality of the student experience rose from 39 percent to 90 percent of unit of study offerings across all teaching sessions� We have had good engagement from students with the new survey: 59 percent participated in at least one survey in 2015�
Teaching Colloquium: building cultural competence through collaboration In 2015, the newly formed Educational Innovation Team within the Education Portfolio hosted the Sydney Teaching Colloquium� The focus on cultural competence was twofold:
− to highlight the work of the National Cultural Competence Strategy and the Wingara Mura – Bunga Barrabugu (‘Thinking path to make tomorrow’) Strategy
− to build cultural competence, which is a key graduate quality adopted in the University’s Strategic Plan 2016‑2020�
In 2015, the Teaching Colloquium reached new heights, with record attendance by 348 delegates from across the University:
− 46 percent academic staff − 29 percent professional staff − 22 percent students − 3 percent external delegates�
Page
8sy
dney
.edu
.au
The
Univ
ersi
ty o
f Sy
dney
Annu
al R
epor
t 20
15

Delegates praised the high‑quality program: − 85 percent of those who completed the
event evaluation indicated they would implement what they had learned
− 84 percent agreed that the Teaching Colloquium encouraged collaboration�
Strong participation from a broad cross‑section of the University community and positive feedback demonstrated the value of collaboration in building cultural competence� The program included a keynote address by Race Discrimination Commissioner Dr Tim Soutphommasane and 25 presentations covering topics such as:
− industry and alumni perspectives on cultural competence
− collaborating for cultural competence − embedding Aboriginal and Torres
Strait Islander culture into learning, teaching, research and campus life�
The colloquium also benefited from the involvement of six undergraduate student ambassadors who:
− supported planning of the program − engaged with the student
community via social media − presented their experiences of
cultural competence − developed the evaluation strategy – collecting
data and interviewing presenters and delegates�
Educational innovation In 2015, more than 50 teams were collectively awarded about $850,000 to support initiatives that will improve students’ learning experiences� Both the Small and Large Educational Innovation Grants (valued up to $10,000 and $35,000 respectively) are designed to improve learning experiences by:
− supporting faculty or cross‑faculty activities that involve the creative application of existing methodologies and tools or
− development of innovative approaches and software to one or more units of study�
HDR+ grantsAn additional $80,000 funded academic enrichment for higher degrees by research (HDR) in the form of HDR+ staff grants and HDR+ student grants� The staff grants supported development of faculty‑led, online resources to enhance successful HDR candidature and academic enrichment�
These funds enabled faculties to develop resources to address educational needs that have been identified through the HDR Training Needs Analysis process, Student Research Experience Questionnaire results, or other faculty processes�
The student grants funded 18 student‑led HDR initiatives that were designed to enhance the cohort experience and support development of broader skills for research�
Awards for educational excellence and innovationDr Elizabeth New from the School of Chemistry was awarded an Early Career Award for Teaching Excellence from the federal government’s Office for Learning and Teaching (OLT)� The award recognised Dr New’s original and innovative contributions to various aspects of teaching, including a school‑wide redesign of first‑year teaching, involving the use of weekly video and self‑assessment tools and in‑class active worksheets over the past three years�
The Peer Assisted Learning (PAL) program team from the University of Sydney Medical School received an Award for Programs that Enhance Learning, also awarded from the OLT� The Medical School’s PAL team, Dr Annette Burgess, Associate Professor Kirsten Black, Associate Professor Renata Chapman, Professor Craig Mellis and Associate Professor Chris Roberts received an Award for Programs that Enhance Learning for innovation and flexibility in curricula, learning and teaching�
Seven staff members won prestigious international teaching awards for innovation in higher education at the 2015 Wharton‑QS Star Reimagine Awards� Associate Professor Olivera Marjonovic from the University of Sydney Business School won a bronze award in the social science and MBA category for developing innovative learning activities for business students�
Page
9Le
arni
ng a
nd t
each
ing

A team of professional and academic staff from the Faculty of Health Sciences won a bronze award in the arts and humanities category� The team was recognised for its collaborative project, CAPTain (Comprehensive Auditory Perceptual Training), an online tool for students to practise diagnosis of speech disorders� CAPTain was a collaborative project led by Dr Cate Madill� It included Dr Elizabeth Murray, Dr Alison Purcell and Associate Professor Tricia McCabe from the discipline of speech pathology and Sonya Corcoran and Terry So from the educational development team�
National grants and fellowshipsA number of academics were awarded national grants and extension grants from the federal government’s Office for Learning and Teaching (OLT)� These grants will develop and drive innovation in higher education teaching and learning� Our recipients included:
− Dr Gabrielle Russell‑Mundine, a lecturer from the National Centre for Cultural Competence, will lead a team to create an interdisciplinary model and resources for service learning in Aboriginal‑community‑controlled organisations�
− Associate Professor Simon Barrie, will lead a project that seeks to reframe the future of the Australian PhD�
− Dr Bronwyn James, Head of Academic Enrichment, is a team member in a project awarded an extension grant, developing discipline‑specific case studies and approaches to preventing academic misconduct�
− Dr Kate Thomson is leading a project awarded an extension grant, enhancing the evaluation of personalised mobile websites for learning from student feedback, as a professional development tool for academics�
The OLT also awarded National Teaching Fellowships to lead change that improves graduate capabilities and enhances the experience of students� Professor Adam Bridgeman, Director, Educational Innovation, received a fellowship to develop approaches that empower teachers to create individualised, adaptive learning environments and personalised student experiences for large classes�
Health Education ChallengeThe Health Education Challenge, developed by Associate Professor Timothy Chen, Dr Christopher Gordon, Associate Professor Christine Jorm, Dr Gillian Nisbet, and Associate Professor Christopher Roberts, is an interprofessional learning challenge aimed at mimicking the real‑life cases of people struggling with heart disease, diabetes and obesity�
In 2015, more than 1300 students from nursing, medicine, pharmacy, occupational therapy, speech pathology, physiotherapy, diagnostic radiography, and exercise physiology came together for the challenge� Over three days they took part in team building activities and competed in teams of six to devise a management plan for a patient with complex health needs� Each team was required to produce a five‑minute video and a one‑page abstract to demonstrate their management plan for their patient� They also peer‑evaluated each other’s work�
MOOCs and Coursera partnershipIn 2015, an expression of interest process open to all faculties for the development of MOOCs (massive open online courses) resulted in seven MOOC projects being awarded a total of $245,000�
The first MOOC, Technology in Music Education (Sydney Conservatorium of Music), will be launched in early 2016� Other MOOC projects currently under development include:
− eHealth (Faculty of Health Sciences) − Social Media for Social Good (Faculty
of Arts and Social Sciences) − Aboriginal Sydney (National Centre
for Cultural Competence) − Chronic Disease Prevention
(Charles Perkins Centre) − Positive Psychiatry (Brain, Mind and Research
Institute with the Sydney Medical School) − Astronomy in the Era of Big Data (School
of Physics in the Faculty of Science)�
The University of Sydney has partnered with Coursera to deliver the MOOCs�
Page
10
sydn
ey.e
du.a
uTh
e Un
iver
sity
of
Sydn
eyAn
nual
Rep
ort
2015

Educational Technology Incubator (ETI) The Education Portfolio, in collaboration with ICT, established a ‘virtual’ ETI� The incubator currently houses all of the University’s MOOCs projects as well as projects funded through Educational Innovation Grants that have been identified as having broader University‑wide application� The purpose of locating these projects in the incubator is to ensure further evaluation with the possibility of uptake for University‑wide benefit from these pilot programs� The physical footprint of the ETI will be finalised in 2016�
Inherent requirementsIn 2015, following extensive consultation with faculties, inherent requirements for health professional and other professional courses were developed� These make available clear guidance for students and staff in relation to our professional degrees� The Inherent Requirements Advisory Committee, a sub‑committee of the Senior Executive Group (SEG) Education Committee, has been established to oversee the inherent requirements renewal process to ensure they remain contemporary and take advantage of emerging assistive and educational technologies�
Educational integrity A key finding of the Academic Misconduct and Plagiarism Taskforce in 2015 was the need for a clear point of contact for staff and students when dealing with matters related to student academic integrity, and it recommended the establishment of the Office of Educational Integrity� Sitting within the Education Portfolio, this office provides coordination and support to faculties on matters related to student academic integrity� The taskforce also recommended creation of a number of resources, including educational modules for students and professional learning requirements for staff� The Education Portfolio is supporting development of these resources�
Targeted academic enrichment courses supporting student diversity, inclusion, and success The Learning Centre and the Mathematics Learning Centre works directly with students and/or staff to support student diversity, inclusion and success using a variety of strategies�
The Learning Centre delivered a 16‑hour bridging course to support eligible students (those with refugee status, in financial hardship, from a disadvantaged school environment or from culturally and linguistically diverse backgrounds) entering the University with an ATAR lower than 80�
The centre also provided an extensive workshop program and individual consultations� More than 1750 students registered for this program in 2015, and of this cohort:
− 65 percent came from language backgrounds other than English
− 70 percent were the first in their family to attend university
− 44 percent were international students�
More than 4000 students also attended orientation lectures offered in the first six weeks of semester 1, 2015� Lecture topics included:
− Developing critical thinking − Plagiarism and how to avoid it − Strategies for successful learning in first year�
Resources supporting academic writing and learning are also available to students online via the Learning Centre website�
In 2015, the Learning Centre website recorded 281,244 visits and 3,336,938 page views� Work within faculty units of study grew, reaching more than 2000 students through the faculty program in 2015, with all 16 faculties involved�
Page
11
Lear
ning
and
tea
chin
g

Two new initiatives in 2015 were: − co‑development and teaching of a
University‑wide Education elective EDGU1006 to support students to engage effectively with their assessment tasks (in partnership with the Faculty of Education and Social Work)
− the Academic Literacy for Cultural Competence project (in partnership with the National Centre for Cultural Competence) designed to support students’ development of academic capabilities for cultural competence�
The Mathematics Learning Centre delivered a wide range of teaching programs to meet the needs of those undergraduate students who enter without the assumed knowledge in mathematics for their first‑ level mathematics or statistics units of study� These programs include bridging courses held before the start of the academic year, as well as semester programs� In 2015, about 780 students attended Mathematics Learning Centre programs, with more than 560 students attending semester programs and 257 students attending bridging programs (some students attended multiple programs)�
Learning analyticsFor the first time in 2015, the University of Sydney hosted the Australian Learning Analytics Summer Institute for the exchange of knowledge, innovation, and experiences in the area of learning analytics and was awarded $10,000 in sponsorship from the Office for Learning and Teaching� More than 27 percent of delegates were University of Sydney staff, with attendees from an additional 24 Australian and five international institutions� In 2015, the University also developed ‘Principles for the use of University‑held student personal information for Learning Analytics at the University of Sydney’ to facilitate the appropriate use and interpretation of learning data�
Aboriginal and Torres Strait Islander access and participationIn 2015 the University consolidated and improved its contribution to Aboriginal and Torres Strait Islander student access to and success in tertiary education at Sydney� Early and sustained engagement with Aboriginal and Torres Strait Islander young people, their parents, schools and communities is a primary focus of our pipeline strategy� This strategy takes a comprehensive approach starting with opportunities for more than 300 Year 7 and 8 high school students in 2015 to build a clear aspiration to and experience of university�
In 2015 we engaged with 145 teachers, careers advisers and teaching assistants in a discussion about the increasing range of access, support, quality of offerings and success of students at the University� This was an increase of about 20 percent over 2014 participation figures�
Our highly visible middle and senior high school initiatives, Wingara Mura – Bunga Barrabugu and the Engineering Summer Programs, in 2015 supported more than 197 students to prepare for university by expanding their understanding of courses and focusing their knowledge of the relationship between HSC subjects and their chosen careers� The Winter Programs connected with year 12 students and provided intensive HSC preparation and tutorial support� Some 33 percent of students who participated in the Winter Program in 2015 took up places at Sydney in 2016�
We sustain our engagement beyond on‑campus events through our A‑star TV and through our online tutorial support program� In 2015 our online tutorial support saw an 885 percent increase in high school students’ use� This is one way that high school students stay connected with each other and to the University community�
Page
12
sydn
ey.e
du.a
uTh
e Un
iver
sity
of
Sydn
eyAn
nual
Rep
ort
2015

Our comprehensive approach reached some 540 Aboriginal and Torres Strait Islander High School students in 2015�
In 2015, 132 new Aboriginal and Torres Strait Islander students commenced at Sydney� The Cadigal and Pemulwuy alternative pathways continued to provide an effective entry to university for many students� Again in 2015 the diversification of Aboriginal and Torres Strait Islander study destinations continued, with Aboriginal and Torres Strait Islander students again enrolled in every faculty�
Ninety‑one students accessed the Indigenous Tutorial Support Scheme and the Student Transition and Retention (STaR) Team within Student Services provided more than 4000 occasions of service to students�
In 2015, the University of Sydney produced more Aboriginal and Torres Strait Islander graduates than any of the Group of Eight Universities� Sydney has held this distinction since 2008�
Cultural competency During 2015 the University expanded its efforts to develop and include cultural competence as a feature of the Sydney educational experience� This work included a curriculum framework for cultural competence, academic literacy for cultural competence, and professional development and resources to support academics to teach cultural competence�
The 2015 Sydney Teaching Colloquium, themed ‘Cultural competence is everyone’s business’, featured the National Centre for Cultural Competence and other academics and students from across the University� Feedback received at the colloquium was extremely positive from students and staff on the journey that the University is taking towards cultural competence�
Developing Service Learning Hubs with Murdi Paaki Regional Assembly (the peak body representing Aboriginal and Torres Strait Islander people in 16 communities across Western NSW) and Gundjeihmi Aboriginal Corporation in Kakadu National Park (the representative body of the Traditional Owners of Kakadu National Park) will provide students with considerable opportunities to:
− expand their cultural and intellectual capability to approach the world with a more comprehensive and inclusive view
− enhance their capabilities to contribute and operate in different cultural settings across Australia and internationally�
Service Learning placements in these areas will commence in 2016�
Page
13
Lear
ning
and
tea
chin
g

Student enrolments 2015Data as at 31 March 2015
Undergraduate enrolments by attendance and genderAttendance Gender EnrolmentsFull‑time Women 15,987
Men 12,337Others 4
Part‑time Women 2,754Men 2,170Others 1
Total 33,253
Undergraduate enrolments by course levelCourse Level EnrolmentsBachelor(Grad Entry) 1,173Bachelor(Hons) 1,423Bachelor(Pass) 29,491Diploma(UG/Adv) 1Diploma(UG/Assoc) 149Non‑Award(UG) 926Cross‑Inst(UG) 87Enabling Course 3Total Undergraduate 33,253
Postgraduate enrolments by attendance and genderAttendance Gender EnrolmentsFull‑time Women 7,543
Men 5,490Others
Part‑time Women 4,695Men 3,332Others 1
Total 21,061
Postgraduate enrolments by course levelCourse Level EnrolmentsHigher Doctorate 1Doctorate(Res) 3,704Doctorate(Cw) 60Master(Res) 1,030Master(Cw) 14,442Graduate Diploma 935Graduate Certificate 674Non‑Award(PG) 186Cross‑Inst(PG) 29Total Postgraduate 21,061
Enrolments by faculty of course registration and course levelFaculty PG UG TotalAgriculture and Environment 141 516 657Architecture, Design and Planning
708 682 1,390
Arts and Social Sciences 2,104 7,054 9,158Business (Business School) 4,641 3,547 8,188Dentistry 433 118 551Education and Social Work 1,161 2,148 3,309Engineering and Information Technologies
1,624 4,423 6,047
Health Sciences 1,506 2,883 4,389Law (Sydney Law School) 1,842 563 2,405Sydney Medical School 3,838 605 4,443Nursing and Midwifery 693 1,039 1,732Pharmacy 421 1,069 1,490Science 1,167 5,619 6,786Sydney College of the Arts 212 456 668Sydney Conservatorium of Music 239 727 966Veterinary Science 248 1,059 1,307University Programs* 83 745 828Total enrolments 21,061 33,253 54,314
*Faculty of Registration; ‘University Program’ includes enrolments in the Exchange Program, the Study Abroad Program and Summer School only
Student enrolment and human resource figures included in this publication are based on a reference date of 31 March 2015 for consistency
Source: Planning and Information Office
Page
14
sydn
ey.e
du.a
uTh
e Un
iver
sity
of
Sydn
eyAn
nual
Rep
ort
2015

This research makes a real difference, reaching beyond our campuses to bring tangible benefits to the wider community, both locally and internationally�
For more information about the impact of our research, visit sydney.edu.au/research
National competitive grants success Each year our researchers submit successful grant applications for funding from granting bodies listed on the federal government’s Australian Competitive Grants Register� In 2015, we were the third‑highest recipient of competitive funding in Australia� The primary sources of competitive funding were grants awarded by the Australian Research Council (ARC) and the National Health and Medical Research Council (NHMRC)� We attracted new ARC grants and fellowships starting in 2015 totalling $50�8 million over the life of the awards, including:
− 16 new Future Fellowships for mid‑career researchers ($12 million over four years)
− 14 Discovery Early Career Researcher Awards (DECRA) ($4�8 million over three years)
− 65 ARC Project Grants ($26�1 million over the life of the grants)
− 16 ARC Linkage Grants ($6�6 million over the life of the grants, plus at least $9�6 million that includes cash and in‑kind contributions from partner organisations)
− ARC Linkage Equipment funding for four University‑led projects ($1�3 million plus cash and in‑kind contributions from partner organisations)�
New NHMRC project grants and fellowships starting in 2015 totalled $73�1 million over the life of the awards, including:
− 61 project grants, with two new investigator grants among them ($55�8 million over the life of the grants)
− one Centre of Clinical Research Excellence in better evidence, better care and outcomes for people with chronic kidney disease ($2�5 million)
− two development grants ($1�2 million) and a partnership grant ($0�5 million)
− fellowships ($13�1 million) including 14 early‑career fellowships (10 in Australia and four overseas), four career development fellowships, eight established career fellowships, a practitioner fellowship and a Translating Research into Practice fellowship�
Excellence in Research for AustraliaIn December the ARC announced the outcomes of the 2015 Excellence in Research for Australia (ERA) initiative� The 2015 ERA rated our research at “world standard or above” in all 22 broad discipline areas in which we were rated (21 were rated “above and well above world standard”)� We scored well above the world average, with a maximum score of five across a wide spectrum of academic disciplines� The University had very strong outcomes in the humanities, social sciences, medical and physical sciences, and in key multidisciplinary areas, indicative of the depth and breadth of quality of our research� We are placed second nationally (at the four‑digit level) in the number of ‘fields of research’ ranked at the highest level, ‘well above world standard’, with an increase of 41 percent over the 2012 ERA�
Research and innovation
In 2015, we supported the research of more than 3500 academic staff across one of the broadest ranges of disciplines in Australia� We also continued to invest in and support our whole of University ‘grand challenge’ multidisciplinary initiatives, one of the most ambitious programs of its kind in the region� It includes the Charles Perkins Centre, the Brain and Mind Centre, the Australian Institute for Nanoscale Science and Technology, the China Studies Centre and the Sydney Southeast Asia Centre�
Page
15
Rese
arch
and
inn
ovat
ion

Commercial incomeWe secured signed contracts in 2015 with a total value of $63�9 million – 59 percent more than 2014� Commercialisation income for the year was $3�7 million, significantly higher than 2014� There were 96 new records of invention reported to the Commercialisation Office of the University compared with 76 in 2014� Around 20 new commercialisation deals done during the year resulted in six new start up companies based around University intellectual property� In December the University announced that it, along with three other universities and CSIRO, joined Uniseed, a commercialisation fund designed specifically for commercialising early stage intellectual property produced by research institutions�
Australian Institute for Nanoscale Science and Technology (AINST)In June, the Sydney Nanoscience Hub building was delivered to the University and a 12‑month commissioning phase commenced in preparation for the official launch of the facility in April 2016� The completed hub will house key enabling capabilities and state‑of‑the‑art research infrastructure, bringing together the design, fabrication, characterisation, measurement and application of devices, structures, and systems at the nanoscale� The initiating AINST leadership team has been appointed, reporting to a board chaired by the Vice‑Chancellor, to oversee implementation activities including the development and implementation of a comprehensive research strategy with stakeholder input� The first round of the AINST Accelerator Scheme engaged the University’s nanoscale research community to identify and seed projects with potential to accelerate the institute’s establishment and to support the evolution of new high‑profile flagship programs�
Higher education research data collectionWe collect data about all research publications published by staff, students, and honorary associates� Our 2015 Higher Education Research Data Collection submission (covering 2014), reported 9123 publications� This information is reported annually, as required by the Department of Education and Training� The collection is a key contributor towards university funding, and its data is used to calculate performance based funding allocations�
Rankings strategySignificant progress was made in data‑cleansing and verification in partnership with Scopus and Thomsons‑Reuters, enabling the addition of six University of Sydney academics to the Thomson Highly Cited Researcher list� These initiatives will increase the accuracy of citation data and maximise the impact of our current and past research performances in key international rankings� Sydney ranked second in Australia and 51st globally in the US News Global University Rankings in 2015�
New KPIs have been developed using international external benchmarks to support evidence‑based recruitment and retention of high‑performing researchers, and to inform decision‑making processes such as appointments and promotions� All chair candidates are now assessed using these criteria and all strategic hires are assessed against national and international researchers working in similar fields�
QS Employability RankingsSydney graduates have been rated the most sought after in Australia and 14th globally in the inaugural Quacquarelli Symonds (QS) Employability Rankings, which assess research partnerships, industry collaboration and student employment outcomes�
Research and cultural competency In 2015, Professor Jakelin Troy, a Ngarigu woman from the Snowy Mountains, joined the University as the inaugural Director of Aboriginal and Torres Strait Islander Research� Her brief is to bring the best and brightest minds to research, with high‑impact value to Aboriginal and Torres Strait Islander interests, and to grow the next generation of leading Aboriginal researchers�
Page
16
sydn
ey.e
du.a
uTh
e Un
iver
sity
of
Sydn
eyAn
nual
Rep
ort
2015

The National Centre for Cultural Competence (NCCC) welcomed its inaugural Academic Director, Professor Juanita Sherwood� Professor Sherwood’s appointment is integral to developing the NCCC as a knowledge centre that fosters cultural competence scholarship and research nationally and globally�
In 2015, cultural competence was also a feature of our continuing partnerships with the Australian Institute of Aboriginal and Torres Strait Islander Studies (AIATSIS), and Georgetown University in the US� Our partnership with AIATSIS focusses on intangible cultural heritage, while our work with Georgetown is centred on the development of teaching resources and cultural competence in public administration�
Implementation of the Health and Medical Research Strategic Review In July NSW Premier Mike Baird launched the Brain and Mind Centre, which joins the Charles Perkins Centre and AINST as one of the University’s flagship multidisciplinary initiatives� The centre brings together leading scientists nationally and internationally to address the significant societal challenges arising from disorders of the brain and mind� For the next five years the centre will focus on three key themes: building and maintaining a healthy brain and mind across the lifecycle; being in control of one’s own actions; and maximising the social and economic participation of those living with disorders of the brain and mind�
The University signed a memorandum of understanding with the University of NSW to collaboratively tackle significant societal challenges in the areas of mental health, addiction and neuroscience research� The partners will combine and consolidate efforts in these areas of research excellence to:
− attain national and international leadership and recognition
− maximise opportunities to attract funding − develop and attract academic expertise − maximise the impact of their research�
Sydney Health PartnersIn March an international panel recognised Sydney Health Partners as one of only five NHMRC Advanced Health Research and Translation Centres nationally and acknowledged its success in translating research evidence into better patient care and health outcomes� The partnership comprises the University, Western, Northern and Sydney Local Health Districts, the Sydney Children’s Hospitals Network and affiliated medical research institutes� It adopts a collaborative approach between health leaders and academia (which has had success internationally), and will focus on delivering better healthcare with a clear focus on patient outcomes and greater efficiencies�
Twelve thematic streams have been identified as flagships for collaborative translational research� The first six discipline‑specific themes (Cardio‑metabolic, Mental Health/Neurosciences, Cancer, Renal/Transplant, Infectious Diseases and Liver) are those identified as our research translation strengths in the NHMRC submission� The remaining six are cross‑cutting themes (Informatics, Education, Research Enablers, Genomics, Biobanking and Clinical Trials), believed to be integral to the future success of the partnership�
Page
17
Rese
arch
and
inn
ovat
ion

Record year for givingIn 2015, the University had another record year for philanthropic giving, with $137,061,717 raised from 13,307 donors� Our INSPIRED campaign – the largest and most ambitious fundraising campaign in Australian higher education history – also surpassed $600 million in gifts two years early� INSPIRED now aims to raise $750 million by the end of 2017�
Our 24‑hour fundraising challenge Pave the Way raised $3,680,382 from 1009 donors� In 2015 the day was supported by a number of major gifts, including $1 million from University Chancellor Belinda Hutchinson AM and her husband Roger Massy‑Greene� Their gift will establish scholarships to attract and support more science, technology, engineering and mathematics (STEM) graduates into the Master of Teaching degree and ultimately improve STEM teaching in disadvantaged schools�
For more information, visit pavetheway.sydney.edu.au
Significant gifts for 2015Barry and Joy Lambert $33,728,241 gift
$15 million museum gift announcement: Chau Chak Wing
Isaac and Susan Wakil $10,853,000 gift to nursing
$7,031,797�00 from the McKnight Charitable Trust to the Ageing and Alzheimer’s Research Foundation
Financial Markets Foundation $5m gift to fund the University of Sydney’s Financial Markets Foundation for Children Chair of Translational Childhood Medicine at the Charles Perkins Centre
$5 million from Warren Halloran to the Henry Halloran Trust at the University of Sydney
$3,370,000 from the estate of the late Peter Sculthorpe to establish a Chair of Australian Music
$2,500,000 from the estate of the late Mabs Melville to the Veterinary Science Foundation
$2,140,000 from the estate of the late Liselotte Brasch to the Rabbi Brasch Bursary
$2 million from Professor Colin Sullivan to establish the Colin Sullivan Post‑doctoral Research Fellowship
For more information, visit inspired.sydney.edu.au
Community engagement 2015 saw a consolidation of the University’s Aboriginal and Torres Strait Islander community engagement� Two service learning agreements were signed between the Murdi Paaki Regional Assembly and Gundejihmi Aboriginal Corporation from Kakadu National Park� These agreements provide a five‑year commitment to a partnership that provides unique opportunities for staff and students� These opportunities include:
− taking theory to practice in intercultural settings − expanding engagement with Aboriginal
peoples and communities − building experience that is highly sought after
in contemporary Australian workplaces�
In 2015 the University of Sydney partnered with the NSW Aboriginal Land Council, the Charlie Perkins Trust and the University of Sydney Students’ Representative Council to celebrate the 50th anniversary of the 1965 Freedom Ride� The series of events strengthened the legacy of the original ride through:
− whole‑of‑community celebrations − acknowledging the achievements of the
original Freedom Riders through a mini re‑creation of the original bus tour
− art exhibitions, journal articles, free public events, town hall meetings, discussions and reconciliation walks�
Thousands of community members participated in ride re‑enactment events in Dubbo, Walgett, Moree, Bowraville and Kempsey as well as at the Camperdown Campus� Media coverage of the events reached an audience of approximately 7�1 million people and the ride re‑enactment was named NSW Best Community Event in the 2015 Australian Event Awards�
Development and engagementPa
ge 1
8sy
dney
.edu
.au
The
Univ
ersi
ty o
f Sy
dney
Annu
al R
epor
t 20
15

International promotionOverseas visits made by the Vice‑Chancellor and members of the Senior Executive Group in 2015 included the following� By the Vice-Chancellor11 – 23 July: China and USA
− Development meetings in Guangzhou and Hong Kong
− SUGUNA 25th annual conference, New York
6 – 10 September: Hong Kong − University Grants Committee meeting − Quality Assurance Council meeting, Hong Kong
25 November – 1 December: China (with the Chancellor, Deputy Vice‑Chancellor (Registrar) and the deans of Arts and Social Sciences, Science, Engineering and Information Technologies, Education and Social Work, Health Sciences and Nursing)
− University delegation: graduation ceremony and development activities
2 – 3 December: India (with the deans of Arts and Social Sciences, Engineering and Information Technologies, the Business School and Health Sciences)
− University delegation: development activities, public lecture, industry meetings
By members of the Senior Executive Group12 – 19 January: EuropeDean of Business School
− European Foundation for Management Development International Deans Program, London
8 – 11 February: USADean of Business School
− Association to Advance Collegiate Schools of Business international conference, San Diego
19 – 24 February: CanadaDean, Sydney Conservatorium of Music
− Schulich School of Music, McGill University, Montreal
21 February – 2 March: EuropeDeputy Vice‑Chancellor (Research)
− European Molecular Biology Laboratory meeting, Hamburg
21 February – 3 March: CanadaDean of Dentistry
− Student recruitment Toronto and Vancouver
8 – 18 March: ChinaDean of Science
− Student recruitment activities in Beijing, Shanghai, Nanjing and Taiwan
9 – 15 March: USADean of Dentistry
− International Association for Dental Research meeting, Boston
9 – 16 March: ChinaDean of Business School
− Alumni and student recruitment events, Shanghai and Beijing
10 – 13 March: ChinaDean of Engineering and Information Technologies
− Alumni and student recruitment events
17 – 25 March: Middle EastDean of Engineering and Information Technologies
− Qatar Computing Research Institute meeting
6 – 10 April: SingaporeDean, Sydney Conservatorium of Music
− Pacific Alliance of Music Schools
11 – 18 April: Middle EastDean of Health Sciences
− Recruitment and relationship building, Dubai, Abu Dhabi and Saudi Arabia
12 – 20 April: EuropeDean of Business School
− International Deans’ Program, Sweden and Denmark
19 – 28 April: China and KoreaDean, Sydney College of the Arts
− Alumni and student recruitment events
Page
19
Deve
lopm
ent
and
enga
geme
nt

5 – 12 May: USADean of Dentistry
− American Association of Orofacial Pain meeting, Denver
9 – 24 May: Latin AmericaDean of Engineering and Information Technologies
− Student recruitment, research collaboration, alumni and industry engagements in Chile, Peru, Brazil, Argentina and Mexico
16 – 20 May: ChinaDean, Sydney Conservatorium of Music
− Auditions, Guangzhou, Beijing and Hong Kong
25 May – 1 June: EuropeDean of Business School
− CEMS Strategic Board meeting, Italy
22 – 24 June: EuropeDean of Arts and Social Sciences
− Meetings at University of Copenhagen and Sciences Po
22 – 29 June: EuropeDean of Law
− Labour Law research network conference, Amsterdam
23 – 29 June: ChinaDean of Business School
− Visit to University’s multifunction centre, Suzhou
28 June – 15 July: EuropeDean, Sydney Conservatorium of Music
− International benchmarking exercise, Austria − Estivo Summer School, Italy
28 June – 2 July: JapanDeputy Vice‑Chancellor (Education)
− Association of Pacific Rim Universities (APRU) retreat and presidents’ meeting
− Meetings at Australian Embassy and Tokyo University
11 – 20 July: ChinaDeputy Vice‑Chancellor (Registrar)
− Student recruitment activities
19 – 27 July: China, Thailand and SingaporeDean of Engineering and Information Technologies
− Meetings with universities, industry and alumni
21 – 27 July: ChinaDean of Business School
− Group of Eight Business School event, deans and alumni meetings, Beijing
1 – 17 August: South AmericaDean of Medicine
− University delegation to Chile, Brazil, Argentina and Peru
3 – 7 August: JapanDean of Dentistry
− Presentation and relationship building, Tohoku University
11 – 13 August: New ZealandDeputy Vice‑Chancellor (Indigenous)
− Healing our Spirit conference
16 – 19 August: Singapore and MalaysiaDeputy Vice‑Chancellor (Registrar)
− Meetings with student recruitment agents
22 – 27 August: New ZealandDean of Dentistry
− International Association for Dental Research meeting
23 August – 1 September: Southeast AsiaDean of Health Sciences
− Student recruitment, alumni event and research symposium, Singapore, Malaysia, Philippines, Vietnam
1 – 4 September: New ZealandDean of Engineering and Information Technologies
− APRU meeting
2 – 7 September: SingaporeDeputy Vice‑Chancellor (Registrar) and Dean, Sydney Nursing School
− Graduation ceremony
3 – 15 September: Israel and LondonDean of Science
− Speaker at conference in Israel − Alumni events in LondonPa
ge 2
0sy
dney
.edu
.au
The
Univ
ersi
ty o
f Sy
dney
Annu
al R
epor
t 20
15

4 – 7 September: SingaporeDeans of Pharmacy and Veterinary Science
− Singapore Open Day recruitment activities
4 – 18 September: EuropeDean of Education and Social Work
− Education conferences in Budapest and Belfast
6 – 15 September: ChinaDean of Architecture, Design and Planning
− Signing of memorandums of understanding at Tsinghua and Tongji universities, meeting with Dean at Sichuan University, meetings with student recruitment agents
7 – 13 September: China and KoreaDean, Sydney College of the Arts
− Industry meetings and relationship building activities
8 – 11 September: ChinaDeputy Vice‑Chancellor (Research)
− World Economic Forum, Dalian
14 – 21 September: ChinaDean of Business School
− International Deans’ Forum and meetings, Shanghai and Guangzhou
17 – 18 September: JapanDean of Dentistry
− Group of Eight Roundtable
18 – 28 September: ChinaDeputy Vice‑Chancellor (Indigenous)
− State Ethnic Affairs Commission Scholarship and meetings with ethnic minorities in Tibet
21 September – 4 October: EuropeDean of Engineering and Information Technologies
− Meetings at Copenhagen University, VTT Research Centre of Finland, KTH Royal Institute of Technology, DTU Denmark
15 – 19 October: ChinaDean of Education and Social Work
− Education conferences and deans’ meetings
17 – 28 October: IndiaDean of Architecture, Design and Planning
− Relationship‑building activities and assessment of market
8 – 13 November: USADeputy Vice‑Chancellor (Research)
− AmCham Innovation Mission, California
9 – 13 November: VietnamDean of Medicine
− Research training, business and alumni meetings, student interviews
9 – 16 November: ChinaDean of Engineering and Information Technologies
− Alumni events, meetings at Shenzhen Economic and Trade Office, MTR Corporation and Shenzhen University
12 – 20 November: CanadaDean of Law
− Student recruitment and alumni events
13 – 24 November: Middle EastDean of Health Sciences
− Recruitment and research collaboration, Abu Dhabi, Qatar and Jordan
17 – 24 November: ChinaDean of Education and Social Work
− Faculty delegation to Taiwan and Beijing; partnership, research and student recruitment activities
21 – 28 November: USADean, Sydney College of the Arts
− Conference presentation, meetings with universities, industry and alumni
23 November – 7 December: Russia and IndiaDean of Business School
− CEMS annual event, St Petersburg, and India delegation, Delhi and Kolkata
1 – 4 December: ChinaDean, Sydney College of the Arts
− Alumni, industry and university meetings
Page
21
Deve
lopm
ent
and
enga
geme
nt
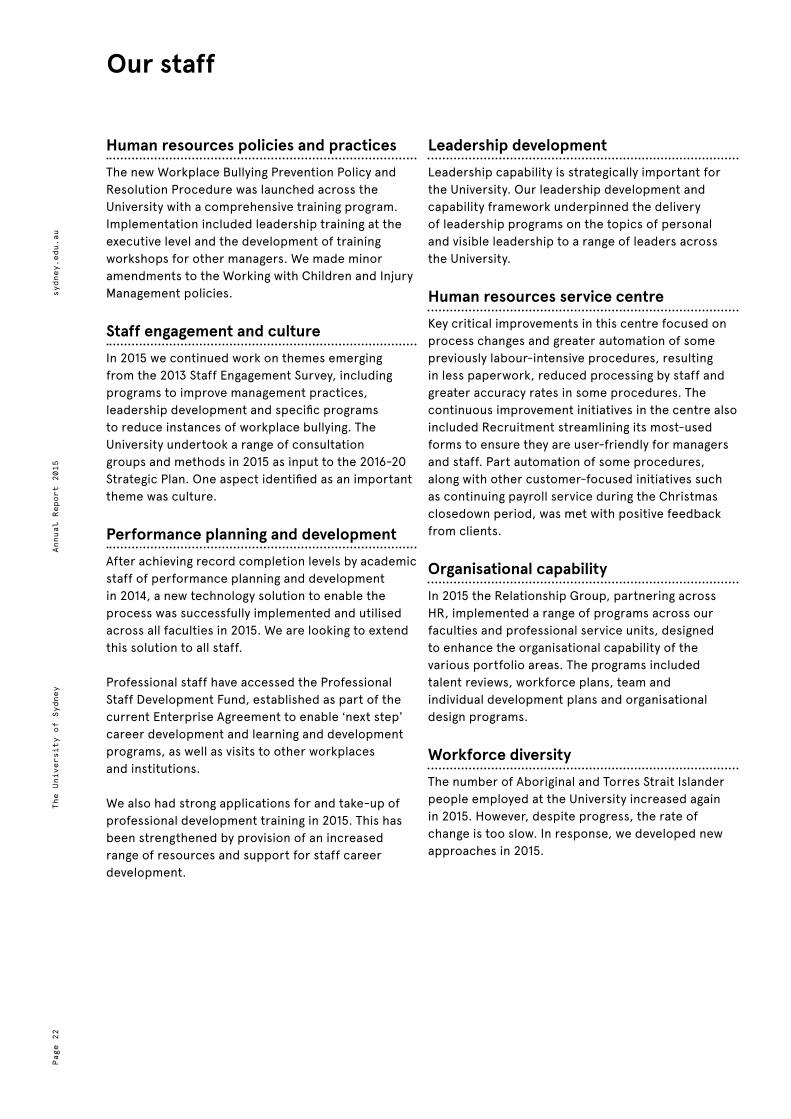
Human resources policies and practicesThe new Workplace Bullying Prevention Policy and Resolution Procedure was launched across the University with a comprehensive training program� Implementation included leadership training at the executive level and the development of training workshops for other managers� We made minor amendments to the Working with Children and Injury Management policies�
Staff engagement and cultureIn 2015 we continued work on themes emerging from the 2013 Staff Engagement Survey, including programs to improve management practices, leadership development and specific programs to reduce instances of workplace bullying� The University undertook a range of consultation groups and methods in 2015 as input to the 2016‑20 Strategic Plan� One aspect identified as an important theme was culture�
Performance planning and developmentAfter achieving record completion levels by academic staff of performance planning and development in 2014, a new technology solution to enable the process was successfully implemented and utilised across all faculties in 2015� We are looking to extend this solution to all staff�
Professional staff have accessed the Professional Staff Development Fund, established as part of the current Enterprise Agreement to enable ‘next step’ career development and learning and development programs, as well as visits to other workplaces and institutions�
We also had strong applications for and take‑up of professional development training in 2015� This has been strengthened by provision of an increased range of resources and support for staff career development�
Leadership developmentLeadership capability is strategically important for the University� Our leadership development and capability framework underpinned the delivery of leadership programs on the topics of personal and visible leadership to a range of leaders across the University�
Human resources service centreKey critical improvements in this centre focused on process changes and greater automation of some previously labour‑intensive procedures, resulting in less paperwork, reduced processing by staff and greater accuracy rates in some procedures� The continuous improvement initiatives in the centre also included Recruitment streamlining its most‑used forms to ensure they are user‑friendly for managers and staff� Part automation of some procedures, along with other customer‑focused initiatives such as continuing payroll service during the Christmas closedown period, was met with positive feedback from clients�
Organisational capabilityIn 2015 the Relationship Group, partnering across HR, implemented a range of programs across our faculties and professional service units, designed to enhance the organisational capability of the various portfolio areas� The programs included talent reviews, workforce plans, team and individual development plans and organisational design programs�
Workforce diversityThe number of Aboriginal and Torres Strait Islander people employed at the University increased again in 2015� However, despite progress, the rate of change is too slow� In response, we developed new approaches in 2015�
Our staffPa
ge 2
2sy
dney
.edu
.au
The
Univ
ersi
ty o
f Sy
dney
Annu
al R
epor
t 20
15

The Wingara Mura (‘Thinking Path’) Leadership Program was established in 2015 to lift Aboriginal and Torres Strait Islander staff numbers, particularly in the academic stream where roles are designed to support and develop Aboriginal and Torres Strait Islander early career academics� In addition to academic duties, the appointees will have an individualised career development program and an academic supervisor and faculty sponsor to assist and support their development� The first cohort for the program commenced in Semester 1, 2016�
The Wingara Mura Leadership Program also offers opportunities for professional staff to join the University, gain postgraduate qualifications and develop a broad range of professional experience that will create solid foundations for a long‑term professional career�
Gender inclusionThroughout 2015, the Women’s Career Acceleration and Leadership strategy gained momentum, with a focus on building inclusive leadership capability, embedding diversity and inclusion principles into HR management practices, and driving an inclusive culture through a range of targeted leadership and staff initiatives� It is also focused on accelerating women’s careers to achieve greater gender balance in senior positions�
The Senior Executive Group (SEG) set gender targets that include women occupying 40 percent of senior leadership roles by 31 March 2020� In early 2016, faculty deans and heads of professional service units will develop and implement local targets and action plans to support the strategy and the University‑wide targets� Actions range from mentoring and sponsoring women at critical career junctures to addressing diversity in recruitment, strategic talent sourcing and providing flexible working arrangements for all staff�
We achieved greater staff diversity and inclusion through unconscious bias and inclusive leadership training and the introduction of a University‑wide, Vice‑Chancellor‑led sponsorship program for 15 female leaders from Culturally and Linguistically Diverse (CALD) backgrounds to increase their profile and accelerate their careers and leadership�
In 2015 we held a series of important Women at Sydney events that continued to engaged staff and leaders across the university� On International Women’s Day more than 100 staff and members of the public attended the ‘Celebrating women: leading and sustaining communities’ conference�
The Accelerating Careers Leader Workshop attracted 165 university leaders and staff� More than 100 STEMM (science, technology, engineering, mathematics and medicine) faculty staff attended the Imagining New Metrics Seminar with visiting Australian Academy of Science Professor Jenny Martin in March� In September the University hosted a Sydney Ideas event featuring the previous Sex Discrimination Commissioner Elizabeth Broderick talking about ‘Women in leadership – why aren’t we there yet?’ with 700 people in the Great Hall�
In November 2015, the University hosted the second Women at Sydney leader event with 150 university leaders attending, and with a keynote speech delivered by retired Lieutenant General David Morrison (2016 Australian of the Year)�
Eight Equity fellowships were awarded in 2015 to members of academic staff:
− four Thompson fellowships, which aim to promote and enhance the careers of academic women at senior lecturer and associate professor level
− four Brown fellowships, which are open to researchers whose careers have been interrupted by sustained primary caring duties�
Four senior female academic and professional leaders will also participate in the 2016 prestigious Chief Executive Women’s Development Program�
The University also received accreditation as a Breastfeeding Friendly Workplace� The staff parent network, established in 2006, continues to grow with more than 340 members and four events held in 2015�
Page
23
Our
staf
f

The University of Sydney became the first university to join the Male Champions of Change (MCC) collaboration, with 30 chief executives, department heads and non‑executive directors from across business and federal government aiming to achieve a significant and sustainable increase in the representation of women in leadership in Australia� The Vice‑Chancellor’s personal involvement in the MCC initiative means the University is at the forefront of the public discussion on gender equality and pay equity�
In 2015 the University signed up to take part in the Science Australia Gender Equality (SAGE) pilot program; the Australian pilot of the UK’s Athena SWAN program (along with 32 other institutions across Australia and seven of the Go8 universities), with official involvement commencing in September 2016 and the application for a Bronze Award to be submitted by January 2019�
The SAGE initiative, driven originally by Professor Nalini Joshi of the School of Mathematics and Statistics at Sydney, and Professor Brian Schmidt, Vice‑Chancellor of ANU and Nobel prize‑winning astronomer, through the Australian Academy of Science, is about merit and fairness� The University’s success in this area will see us attract and maintain the best talent� As part of our ongoing commitment to the SAGE program, a working party was established under the lead of Professor Trevor Hambley and the University hosted a visit from SAGE Project Manager Dr Zuleyka Zevallos in November� Dr Zevallos gave a presentation about the program for the SAGE working party�
To lead the University in addressing the important issue of violence against women, the Vice‑Chancellor developed a video message endorsing the University’s support for White Ribbon Day, encouraging staff to take the oath to stop men’s violence against women� The Equity and Diversity Strategy team gave out 700 white ribbons to staff, students and visitors on Eastern Avenue� A laptop was also available for people to sign up to the online pledge to “stand up, speak out and act to prevent men’s violence against women”�
LGBTIQ inclusion initiatives The University officially launched the Ally Network on 3 March 2015 in the Great Hall to support and empower LGBTIQ (Lesbian, Gay, Bisexual, Transgender, Bisexual, Intersex and Queer) staff and students and to help them feel welcome and safe on campus� This important event was supported by the Chancellor and the Vice‑Chancellor and 300 staff and students attended� Distinguished alumnus the Hon� Mr Michael Kirby AC CMG gave a keynote presentation� The Hon� Mr Don Harwin MLC represented the NSW Parliament� The launch concluded with raising of the Rainbow Flag over the Quadrangle Clocktower� We also established a steering committee for the Ally Network�
The University became a member of Pride in Diversity, Australia’s only workplace program to assist employers with the inclusion of LGBTIQ staff� Approval was granted for the inaugural University of Sydney float in the 2016 Sydney Gay and Lesbian Mardi Gras Parade�
To mark World AIDS Day (1 December), the University flew the World AIDS Day flag in recognition of all those who have been touched by HIV and AIDS� The Ally Network hosted a morning tea, held in the cloisters of the Quadrangle, where red ribbons were provided by donation to staff and students�
Page
24
sydn
ey.e
du.a
uTh
e Un
iver
sity
of
Sydn
eyAn
nual
Rep
ort
2015

Disability inclusion In 2015 we proceeded with the second full year of our 2013–18 Disability Action Plan which aims to establish the University as a leader in inclusive practices for all staff and students� We presented a case study on the development and implementation of our Disability Action Plan at the Equity Practitioners in Higher Education Australia Conference in November�
The University community celebrated Disability Awareness Week 2015 with a full program of events that raised awareness of issues such as mental health and disability employment, as well as challenging negative perceptions of people with disability� More than 500 staff and students attended�
The Disability at Work Staff Network is building momentum� It hosted a disability employment forum, Why Disability Employment Matters – with Graeme Innes AM – and 90 staff attended� The key message was that everyone has the right to meaningful and satisfying employment� The network also celebrated the International Day of People with Disability on 3 December, hosting a networking luncheon with the theme of ‘Sharing Stories’� This provided a great opportunity for staff to discuss how they have been supported and how they support others at the University�
The University community also marked RU OK? Day with a Q&A forum, attended by about 150 people� Our engaging and insightful host, broadcaster and comedian Julie McCrossin, facilitated an informative conversation about what helps when we feel stressed or blue�
The Equity and Diversity Strategy team partnered with the Australian Network on Disability to develop and deliver a Disability Awareness Training Program for staff: we delivered 12 workshops in 2015 attended by more than 200 staff�
Cultural and linguistically diverse inclusionOn Tuesday 24 March the University officially launched its affiliation with the ‘Racism� It Stops with Me�’ campaign as part of our commitment to a safe and inclusive campus� Diversity of culture and ideas is one of the University’s greatest strengths� Our commitment to the campaign aims to raise awareness among students and staff that racism is unacceptable, and to provide the tools and resources to take practical actions against racism�
Aboriginal and Torres Strait Islander employmentIn 2015, 74 staff at the University identified as Aboriginal or Torres Strait Islander� Numbers may be underreported as not all staff identify their background�
In 2015 our Aboriginal and Torres Strait Islander Staff Network ran the We Belong Forum that enabled Aboriginal and Torres Strait Islander staff to connect and network with one another� Staff from the University’s Broken Hill campus travelled to Sydney to meet colleagues�
Two Aboriginal and Torres Strait Islander leaders commenced participation under the inaugural Vice‑Chancellor’s Sponsorship Program for culturally and linguistically diverse female leaders�
Page
25
Our
staf
f

Academic promotionsAssociate Professor Robyn McConchie (Faculty of Agriculture and Environment)Preferred Professorial Title: Professor of Horticulture
Associate Professor Balwant Singh (Faculty of Agriculture and Environment)Preferred Professorial Title: No title specified
Associate Professor Mary Louise Roberts (Faculty of Arts and Social Sciences)Preferred Professorial Title: Professor of Art History and Nineteenth Century Studies
Associate Professor James Barton Curran (Faculty of Arts and Social Sciences) Preferred Professorial Title: No title specified
Associate Professor Fjelda Elizabeth Martin (Faculty of Dentistry) Preferred Professorial Title: Professor of Dentistry
Associate Professor Janette Bobis (Faculty of Education and Social Work) Preferred Professorial Title: Professor of Mathematics Education
Associate Professor Fran Waugh (Faculty of Education and Social Work) Preferred Professorial Title: Professor in Social Work
Associate Professor Gianluca Ranzi (Faculty of Engineering and Information Technologies) Preferred Professorial Title: No title specified
Associate Professor Yonghui Li (Faculty of Engineering and Information Technologies) Preferred Professorial Title: No title specified
Associate Professor Colleen Canning (Faculty of Health Sciences) Preferred Professorial Title: No title specified
Associate Professor Peter Banks (Faculty of Science) Preferred Professorial Title: Professor in Conservation Biology
Associate Professor Simon Ho (Faculty of Science) Preferred Professorial Title: Professor of Molecular Evolution
Associate Professor Bill Pritchard (Faculty of Science) Preferred Professorial Title: Professor of Geography
Associate Professor Anthony Henderson (Faculty of Science) Preferred Professorial Title: Professor of Mathematics
Associate Professor Mary Ruth Myerscough (Faculty of Science) Preferred Professorial Title: Professor of Mathematical Biology
Associate Professor Yee Hwa Jean Yang (Faculty of Science) Preferred Professorial Title: Professor of Statistics
Associate Professor Scott Croom (Faculty of Science) Preferred Professorial Title: Professor of Astrophysics
Associate Professor Andrew Doherty (Faculty of Science) Preferred Professorial Title: No title specified
Associate Professor Kevin Ernest Varvell (Faculty of Science) Preferred Professorial Title: Professor of Experimental Particle Physics
Associate Professor Caroline Hunt (Faculty of Science) Preferred Professorial Title: No title specified
Associate Professor Ofer Gal (Faculty of Science) Preferred Professorial Title: No title specified
Associate Professor Vanessa Rosemary Duke Barrs (Faculty of Veterinary Science) Preferred Professorial Title: Professor of Feline Medicine and Infectious Diseases
Associate Professor Simon Butt (Sydney Law School) Preferred Professorial Title: Professor of Indonesian Law
Page
26
sydn
ey.e
du.a
uTh
e Un
iver
sity
of
Sydn
eyAn
nual
Rep
ort
2015

Associate Professor Thomas Crofts (Sydney Law School) Preferred Professorial Title: Professor of Criminal Law
Associate Professor Murray Lee (Sydney Law School) Preferred Professorial Title: Professor in Criminology
Associate Professor Simon John Geoffrey Lewis (Sydney Medical School) Preferred Professorial Title: Professor of Cognitive Neuroscience
Associate Professor Adam Guastella (Sydney Medical School) Preferred Professorial Title: No title specified
Associate Professor Janette Vardy (Sydney Medical School) Preferred Professorial Title: Professor of Cancer Medicine
Associate Professor Daniela Traini (Sydney Medical School) Preferred Professorial Title: Professor of Respiratory Science
Associate Professor Simon Carlile (Sydney Medical School) Preferred Professorial Title: Professor of Neuroscience
Associate Professor Guy D Eslick (Sydney Medical School) Preferred Professorial Title: Professor of Cancer Epidemiology and Medical Statistics
Associate Professor Anthony James Gill (Sydney Medical School)Preferred Professorial Title: Professor of Surgical Pathology
Associate Professor Lisa Harvey (Sydney Medical School) Preferred Professorial Title: No title specified
Associate Professor Martin Robert Kluckow (Sydney Medical School) Preferred Professorial Title: Professor of Neonatology
Associate Professor Andrew John Spillane (Sydney Medical School) Preferred Professorial Title: Professor of Surgical Oncology
Associate Professor Helena Britt (Sydney Medical School) Preferred Professorial Title: Professor of Primary Care Research
Associate Professor Ian Kerridge (Sydney Medical School) Preferred Professorial Title: Professor of Bioethics and Medicine
Associate Professor Mu Li (Sydney Medical School) Preferred Professorial Title: Professor in International Public Health
Associate Professor Barend (Ben) Marais (Sydney Medical School) Preferred Professorial Title: Professor in Paediatrics and Infectious Diseases
Associate Professor Susan Rachel Skinner (Sydney Medical School) Preferred Professorial Title: No title specified
Associate Professor James Bennett-Levy (Sydney Medical School) Preferred Professorial Title: No title specified
Associate Professor David Booth (Sydney Medical School) Preferred Professorial Title: Professor of Immunogenetics
Associate Professor Kate Curtis (Sydney Nursing School) Preferred Professorial Title: Professor of Trauma and Emergency Nursing
Associate Professor Sandra Lee van der Laan (University of Sydney Business School) Preferred Professorial Title: Professor in Accounting
Associate Professor Kai Riemer (University of Sydney Business School) Preferred Professorial Title: Professor of Business Information Systems
Page
27
Our
staf
f

Staff level and salary ranges as at 31 March 2015
Academic staffLevel E & above $177,887+Level D $138,096 ‑ $152,135Level C $114,691 ‑ $132,247Level B $93,629 ‑ $111,182Level A $65,540 ‑ $88,941
General staff (35 Hour Week)HEO 10 & above $114,818 +HEO 9 $107,413 ‑$113,337HEO 8 $92,621 ‑ $104,456HEO 7 $82,750 ‑ $90,152HEO 6 $75,351 ‑ $81,268HEO 5 $65,485 ‑ $73,376 HEO 4 $60,550 ‑ $64,004HEO 3 $53,151 ‑ $59,070HEO 2 $50,682 ‑ $52,164HEO 1 & below <=$49,203
Combined totals of academic and general staff positions 2015 by appointment term and genderAppointment Term Women Men Number (%) Number (%)Continuing 2063 53% 1782 59%Fixed Term 1853 47% 1256 41%All staff 3916 100% 3038 100%
Academic staff positions 2015 by appointment term, level and genderAppointment Term Women Men Number (%) Number (%)ContinuingLevel E & above 88 26�3 247 73�7Level D 120 35�0 223 65�0Level C 217 46�8 247 53�2Level B 173 54�4 145 45�6Level A 25 56�8 19 43�2All continuing academic staff
623 41.4 881 58.6
Fixed TermLevel E & above 71 29�6 169 70�4Level D 77 48�4 82 51�6Level C 133 52�0 123 48�0Level B 238 55�5 191 44�5Level A 318 54�1 270 45�9All fixed-term academic staff
837 50.1 835 49.9
All academic staff 1460 46.0 1716 54.0
General staff positions 2015 by appointment term, level and genderAppointment Term Women Men Number (%) Number (%)ContinuingHEO 10 & above 128 57�1 96 42�9HEO 9 92 49�7 93 50�3HEO 8 208 56�4 161 43�6HEO 7 273 60�8 176 39�2HEO 6 359 69�7 156 30�3HEO 5 221 70�4 93 29�6HEO 4 89 65�9 46 34�1HEO 3 42 40�8 61 59�2HEO 2 22 53�7 19 46�3HEO 1 & below 6 100�0All continuing general staff
1440 61�5 901 38�5
Fixed TermHEO 10 & above 55 43�7 71 56�3HEO 9 41 53�9 35 46�1HEO 8 121 69�5 53 30�5HEO 7 167 65�2 89 34�8HEO 6 256 79�5 66 20�5HEO 5 223 79�4 58 20�6HEO 4 80 81�6 18 18�4HEO 3 64 75�3 21 24�7HEO 2 6 54�5 5 45�5HEO 1 & below 3 37�5 5 62�5All fixed‑term general staff
1016 70�7 421 29�3
All general staff 2456 65�0 1322 35�0
Page
28
sydn
ey.e
du.a
uTh
e Un
iver
sity
of
Sydn
eyAn
nual
Rep
ort
2015

Combined totals of academic and general staff positions 2011-2015 by appointment term and gender 2011 2012 2013 2014 2015
Women Men Total Women Men Total Women Men Total Women Men Total Women Men TotalContinuing 1989 1772 3761 1990 1735 3725 1922 1706 3628 2015 1742 3757 2063 1782 3845Fixed Term 1853 1392 3245 1856 1430 3286 1913 1426 3339 1907 1340 3247 1853 1256 3109Total 3842 3164 7006 3846 3165 7011 3835 3132 6967 3922 3082 7004 3916 3038 6954
Academic staff positions 2011-2015 by appointment term, level and gender 2011 2012 2013 2014 2015
Women Men Total Women Men Total Women Men Total Women Men Total Women Men TotalContinuing Level E & above 69 215 284 80 220 300 72 226 298 74 226 300 88 247 335
Level D 103 177 280 112 183 295 102 185 287 119 208 327 120 223 343Level C 224 250 474 218 264 482 215 252 467 204 254 458 217 247 464Level B 208 193 401 195 165 360 165 138 303 165 145 310 173 145 318Level A 26 20 46 19 23 42 15 14 29 22 22 44 25 19 44Subtotal 630 855 1485 624 855 1479 569 815 1384 584 855 1439 623 881 1504 Fixed Term Level E & above 40 187 227 40 195 235 57 196 253 61 182 243 71 169 240
Level D 50 90 140 53 94 147 76 96 172 76 94 170 77 82 159Level C 114 110 224 119 128 247 130 126 256 134 126 260 133 123 256Level B 244 201 445 257 192 449 246 197 443 255 195 450 238 191 429Level A 303 296 599 302 320 622 316 334 650 325 294 619 318 270 588Subtotal 751 884 1635 771 929 1700 825 949 1774 851 891 1742 837 835 1672Total academic 1381 1739 3120 1395 1784 3179 1394 1764 3158 1435 1746 3181 1460 1716 3176
Page
29
Our
staf
f

SenateThe Senate is the governing authority of the University, with functions conferred on it by the University of Sydney Act 1989 (as amended)� The Senate oversees all major decisions concerning the conduct of the University, including staff appointments and welfare, student welfare and discipline, financial matters and the University’s physical and academic development�
Composed of 22 Fellows and chaired by the Chancellor, the Senate awards all degrees and diplomas and is responsible to the Parliament of New South Wales� The Vice‑Chancellor and Principal and the Chair of the Academic Board are both ex‑officio members of the Senate�
Academic BoardThe Academic Board, which reports to the Senate, is responsible for safeguarding the quality of the University’s academic activities� It is an elected body that includes staff and student representation from across the University’s academic communities� The Academic Board provides advice to the Senate and the Vice‑Chancellor on all academic matters, including their relation to the University’s strategic priorities and policies, the conditions of appointment and employment of academic staff, the approval of new and revised courses, and the maintenance of academic standards�
Executive managementThe Vice‑Chancellor is the principal administrative officer, or chief executive, of the University and has line‑management responsibility for a number of deputy vice‑chancellors who, with the Vice‑Chancellor, comprise the University’s executive team� Directors of strategic administrative areas within the University also report to the Vice‑Chancellor�
The Vice‑Chancellor chairs the Senior Executive Group (SEG), a management decision‑making body that includes the faculty deans� SEG is representative of the University’s diverse academic and administrative communities and is accountable to the Senate for the academic and financial health of the University� For more information about our governance and structure, visit sydney.edu.au/about-us/governance-and-structure.html�
Principal activitiesUnder section 6 of the University of Sydney Act 1989 (as amended), the object of the University is the promotion, within the limits of the University’s resources, of scholarship, research, free enquiry, the interaction of research and teaching, and academic excellence�
The University has the following principal functions for the promotion of this object:
− the provision of facilities for education and research of university standard
− the encouragement of the dissemination, advancement, development and application of knowledge informed by free enquiry
− the provision of courses of study or instruction across a range of fields, and the carrying out of research, to meet the needs of the community
Governance and leadershipPa
ge 3
0sy
dney
.edu
.au
The
Univ
ersi
ty o
f Sy
dney
Annu
al R
epor
t 20
15

− the participation in public discourse − the conferring of degrees, including those of
bachelor, master and doctor, and the awarding of diplomas, certificates and other awards
− the provision of teaching and learning that engage with advanced knowledge and enquiry
− the development of governance, procedural rules, admission policies, financial arrangements and quality assurance processes that are underpinned by the values and goals referred to in the functions set out in this subsection, and that are sufficient to ensure the integrity of the University’s academic programs�
The University has other functions, as follows: − The University may exercise commercial functions
comprising the commercial exploitation or development, for the University’s benefit, of any facility, resource or property of the University or in which the University has a right or interest (including, for example, study, research, knowledge and intellectual property and the practical application of study, research, knowledge and intellectual property), whether alone or with others�
− The University may develop and provide cultural, sporting, professional, technical and vocational services to the community�
− The University has such general and ancillary functions as may be necessary or convenient for enabling or assisting the University to promote the object and interests of the University, or as may complement or be incidental to the promotion of the object and interests of the University�
− The University has such other functions as are conferred or imposed on it by or under this or any other Act�
− The functions of the University may be exercised within or outside the state, including outside Australia�
University officersAs at 31 December 2015
ChancellorBelinda Hutchinson AMBEc Sydney, FCAElected 4 February 2013
Deputy ChancellorAlexander (Alec) Brennan AMBSc(Food Technology) UNSW MBA City(UK)Elected 5 February 2015
Vice-Chancellor and PrincipalDr Michael SpenceBA LLB Sydney DPhil PGDipTheol Oxf
Provost and Deputy Vice-ChancellorProfessor Stephen GartonBA Sydney PhD UNSW, FAHA FASSA FRAHS
Deputy Vice-Chancellor (Registrar)Professor Tyrone CarlinLLB(Hons) LLM Sydney MCom UNSW PhD Macquarie GradDip FinSIA CA FCPA FFin
Deputy Vice-Chancellor (Indigenous Strategy and Services)Professor Shane HoustonPhD Curtin
Deputy Vice-Chancellor (Education)Professor Philippa PattisonPhD Melbourne, FASSA
Deputy Vice-Chancellor (Research)Professor Duncan IvisonBA McGill MSc PhD LSE
Vice-Principal (Advancement)Tim DolanBA UCLA
Vice-Principal (Operations)Sara WattsBSc Sydney MBA Macquarie FCPA GAICD
Page
31
Gove
rnan
ce a
nd l
eade
rshi
p

Chair of the Academic BoardAssociate Professor Peter McCallumBMus Dunelm MMus Lond PhD Sydney, DSCM
General CounselRichard Fisher AMMEc UNE LLB Sydney
Deans DIVISION OF ARCHITECTURE AND CREATIVE ARTS
Faculty of Architecture, Design and PlanningProfessor John RedmondBA CSAD MA(RCA) RCA DipID(Eng) CSAD, FRSA AADM FDIA
Sydney College of the ArtsProfessor Colin RhodesBA Lond MA PhD Essex
Sydney Conservatorium of MusicProfessor Anna Reid (Acting)BMus Sydney MEd UNE PhD UTS
DIVISION OF BUSINESSThe University of Sydney Business SchoolProfessor Gregory WhitwellBEc(Hons) Monash PhD Melbourne
DIVISION OF ENGINEERING AND INFORMATION TECHNOLOGIESFaculty of Engineering and Information TechnologiesProfessor Archie JohnstonPhD H-W, FTSE FIEAust EngExec FICE FAICD
DIVISION OF HEALTH SCIENCESFaculty of Health SciencesProfessor Kathryn RefshaugeMBiomedE PhD UNSW DipPhty GradDipManipTher Cumb
DIVISION OF HUMANITIES AND SOCIAL SCIENCES
Faculty of Arts and Social SciencesProfessor Barbara CaineBA Sydney MPhil Sus PhD Monash, FAHA FRHS FASSA
Faculty of Education and Social WorkProfessor Diane MayerDipEd(Primary) CAE (Mt Gravatt) BEd DDIAE MEd UNSW PhD USQ
Faculty of LawProfessor Joellen RileyMA LLB PhD Sydney BCL Oxf
DIVISION OF MEDICINE, DENTISTRY, NURSING AND PHARMACY
Faculty of DentistryProfessor Chris PeckMScDent Sydney PhD BrCo GradDipScMed(Pain) Sydney, GAIC
Faculty of PharmacyProfessor Iqbal RamzanMSc PhD Sydney DipPharm CIT(NZ)
Faculty of MedicineProfessor Bruce RobinsonMD BS MSc Sydney, FRACP
Faculty of Nursing and MidwiferyProfessor Donna WatersBA Macquarie MPH PhD Sydney FACN, RN
DIVISION OF NATURAL SCIENCES
Faculty of Agriculture and EnvironmentProfessor Alex McBratneyBSc PhD DSc Aberdeen DScAgr Sydney
Faculty of ScienceProfessor Trevor HambleyBSc UWA PhD Adelaide, FRACI CChem
Faculty of Veterinary ScienceProfessor Rosanne TaylorBVSc DipVetClinStud PhD GradCertHighEd Sydney
Page
32
sydn
ey.e
du.a
uTh
e Un
iver
sity
of
Sydn
eyAn
nual
Rep
ort
2015

University of Sydney Senate 2015The Fellows of the Senate of the University of Sydney present their report on the consolidated entity consisting of the University of Sydney and the entities it controlled at the end of, or during, the year ended 31 December 2015�
The Role of the SenateThe Senate is the governing authority of the University of Sydney with functions conferred on it by the University of Sydney Act 1989 (as amended)�
The Senate oversees all major decisions concerning the conduct of the University, including staff appointments and welfare, student welfare and discipline, financial matters and the physical and academic development of the University�
Composed of 22 Fellows and chaired by the Chancellor, the Senate awards all degrees and diplomas and is responsible to the Parliament of New South Wales� The Vice‑Chancellor and Principal and the Chair of the Academic Board are both ex‑officio members of the Senate�
Fellows of SenateIn 2015, the Senate comprised:
ChancellorBelinda Hutchinson AMBEc Sydney, FCAChancellor from 4 February 2013
Deputy Chancellor Alexander (Alec) Brennan AMBSc(Food Technology) UNSW MBA City(UK)(Fellow of Senate appointed by the Minister for Education)Fellow from 1 January 2006Deputy Chancellor from 5 February 2015
Pro-Chancellor Mr Robert (Bob) Leece AO RFD (Deceased)BE Sydney, MEngSc UNSW, MBA Macq, FIEAust CPEng(Fellow of Senate elected by Senate)Fellow from 1 December 2009Pro‑Chancellor from 23 February 2015 to 6 December 2015
Pro-Chancellor Mr Peter J FitzSimons AMBA Sydney(Fellow of Senate elected by and from the graduates)Fellow from 1 December 2009Pro‑Chancellor from 23 February 2015
Pro-ChancellorMrs Dorothy Hoddinott AOMA DipEd Sydney, FACE FACEL(Fellow of Senate appointed by the Minister)Fellow from 1 January 2010Pro‑Chancellor from 23 February 2015
Pro-ChancellorMr Kevin McCann AMBA LLB (Hons) Sydney LLM Harv�, FAICD(Fellow of Senate appointed by the Minister)Fellow from 9 March 2010Pro‑Chancellor from 23 February 2015
Vice-Chancellor and PrincipalDr Michael SpenceBA LLB Sydney DPhil PGDipTheol OxfFellow from 11 July 2008
Chair of the Academic BoardAssociate Professor Peter McCallumBMus Dunelm MMus Lond PhD Sydney, DSCMFellow from 12 December 2009
APPOINTED MEMBERS OF SENATESix Fellows appointed by the Minister for Education for four‑year terms:
Ms Leah ArmstrongFellow from 1 January 2014
Ms Ilana AtlasLLB LLM Sydney B�Juris(Hons) UWAFellow from 1 January 2015
Mr Alexander (Alec) Brennan AMBSc(Food Technology) UNSW MBA City(UK)Fellow from 1 January 2006
Mrs Dorothy Hoddinott AOMA DipEd Sydney, FACE FACELFellow from 1 January 2010
Mr Kevin McCann AMBA LLB Sydney LLM Harvard, FAICDFellow from 9 March 2010
Page
33
Gove
rnan
ce a
nd l
eade
rshi
p

Mr David Mortimer AOBEc Sydney, FCPAFellow from 1 January 2010
One external Fellow appointed by Senate (vacant)
ELECTED MEMBERS OF SENATEFour Fellows elected by and from the academic staff for two‑year terms:
Professor Marian BairdBEc(Hons) DipEd PhD SydneyFellow from 1 June 2011
Professor Sharon NaismithBA Macquarie Hons Queensland MClinPsych DPsych MacquarieFellow from 1 June 2015
Professor Christopher (Chris) MurphyBSc(Hons) Adelaide PhD Flinders DSc SydneyFellow from 1 June 2011
Professor Jill White AMBEd Flinders MEd Sydney PhD Adelaide RN RMFellow from 1 June 2015
One Fellow elected by and from the non‑academic staff for two‑year terms: Jordi AustinBA(Hons) MPsych(Clin) UNSW, MAPS GAICDFellow from 1 June 2013
One Fellow elected by and from the undergraduate students for two‑year terms: Dalton FogartyBCom SydneyFellow from 1 December 2014
One Fellow elected by and from the postgraduate students for two‑year terms: Simon HillBA(Adv)(Hons) SydneyFellow from 1 December 2014
Five Fellows elected by and from the graduates of the University for four‑year terms:
The Hon Verity FirthBA LLB SydneyFellow from 1 December 2013
Mr Peter FitzSimons AMBA SydneyFellow from 1 December 2009
Ms Kate McClymontBA(Hons) SydneyFellow from 1 December 2013
Dr Catriona Menzies‑PikeBA(Hons) PhD SydneyFellow from 1 December 2013
Mr Andrew WestBA(Hons) Sydney MSc ColumbiaFellow from 1 December 2013
Senate committeesThe Senate has established the following committees to assist it with the exercise of its functions:
− Buildings and Estates Committee − Chair Appointments Committee − Education and Research Committee − Finance and Audit Committee − Human Resources Committee − Nominations and Appointments Committee − Safety and Risk Management Committee
For more information about the University of Sydney Senate Committees, visit sydney.edu.au/senate/committees�
Senate governanceIn 2015, Senate:
− provided leadership for the development of the new University Strategic Plan
− undertook an external review of Senate governance
− approved the recommendations from the external review, including opting‑in to the Universities Governing Bodies Act
− approved the latest business cases for the Campus Improvement Program
− oversaw the coming online of four key transformational building projects, including the Queen Mary Building and the Australian Institute for Nanoscale Science and Technology (AINST)�
Page
34
sydn
ey.e
du.a
uTh
e Un
iver
sity
of
Sydn
eyAn
nual
Rep
ort
2015

New and ceased activities
CentresThe following internal centres of the University were opened in 2015:
On 1 June 2015 Senate approved the naming of the Australian Institute for Nanoscale Science and Technology, the naming of its building, the Sydney Nanoscience Hub and its cleanroom, the Research and Prototype Foundry�
The Sydney Centre for Aboriginal and Torres Strait Islander Statistics was established with approval of the Provost and DVC, effective 17 September 2015�
The Sydney Energy Internet Research Institute was established with approval of the Provost and DVC, effective 21 September 2015�
The Sydney Asia Pacific Migration Centre was established with approval of the Provost and DVC, effective 14 December 2015�
The following internal centres of the University were closed in 2015:
Nepean Centre for Perinatal Care was closed with approval of the Provost and DVC, effective 26 February 2015�
China Education Centre was closed with approval of the Provost and DVC, effective 27 February 2015�
Centre for Mathematical Biology was closed with approval of the Provost and DVC, effective 23 July 2015�
Ian Buchan Fell Housing Research Centre was closed with approval of the Provost and DVC, effective 15 October 2015�
Sydney University Nitrogen Fixation Centre was closed with approval of the Provost and DVC, effective 24 November 2015�
Australian Centre for Asian Art and Archaeology was closed with approval of the Provost and DVC, effective 15 December 2015�
FoundationsNo University foundations were opened or closed in 2015�
Controlled entitiesWayahead Pty Limited, a wholly owned subsidiary of the University, was deregistered, effective 8 July 2015�
A14 Holdings Pty Ltd, a wholly owned subsidiary of the University, was registered by the University, effective 20 October 2015
The business of Bandwidth Foundry International Pty Ltd, a wholly owned subsidiary of the University, was moved into the University on 22 October 2015 and the company was deregistered, effective 30 December 2015�
Insurance of officersThe University maintains a comprehensive insurance program to protect itself against the financial effects of insurable risks� This program extends to its subsidiaries and controlled entities, and also includes the Senate and Senate subcommittee members, the University’s officers, employees, volunteers and students� The University’s insurance program is renewed annually at the end of October�
Page
35
Gove
rnan
ce a
nd l
eade
rshi
p

Attendance by Fellows at Senate and its committees in 2015Position Name Senate BEC CAC E&R FAC HR ICC NAC SRMC
A B A B A B A B A B A B A B A B A BChancellor Ms B Hutchinson AM 7 7 6 4 13 13 3 3 7 5 4 4 4 3 5 5 4 2Deputy Chancellor Mr A Brennan AM 7 7 6 5 13 13 3 2 7 7 4 4 4 0 5 5 4 3Vice‑Chancellor Dr M Spence 7 7 6 1 13 13 3 3 7 5 4 1 5 4 4 3Pro‑Chancellors Mr R Leece AO RFD (#) 6 5 6 6 11 11 4 3
Mr P FitzSimons AM 7 6 13 11Mrs D Hoddinott AO 7 5 13 11 3 3 7 7 4 4Mr K McCann AM (##) 7 5 7 2 4 1 5 5 4 3
Chair of Academic Board
Associate Professor P McCallum
7 6 13 12 3 3 7 7 5 5
Fellows Ms L Armstrong (+) 7 6 5 3Ms A Atlas 7 5 7 3 4 2Ms J Austin 7 7 6 5 4 4Professor M Baird 7 6 4 2 5 5The Hon V Firth 7 3 5 3Mr D Fogarty (++) 7 6 7 3 4 3Mr S Hill 7 7 6 5 13 13Ms K McClymont 7 6 5 4Dr C Menzie‑Pike 7 6 3 1Dr G Merom (*) 7 3Mr D Mortimer AO 7 6 4 2Professor C Murphy 7 6 13 13Professor S Naismith (^)(^^)
7 3 3 2
Professor R van Krieken (*)
7 3 3 1
Mr A West 7 6Professor J White (^) 7 3
A No. of meetings heldB No. of meetings attended
BEC Buildings and EstatesCAC Chair AppointmentsE&R Education and ResearchFAC Finance and AuditHR Human ResourcesNAC Nominations and AppointmentsSRMC Safety and Risk Management
(#) Mr Leece passed away on 6 December 2015. He was an apology for the 23 February 2015 Senate Meeting and the 12 February 2015 ICC Meeting away on 6 December 2015(##) Withdrew from FAC and became member of ICC in August 2015(+) Became a member of NAC in March 2015(++) Became a member of SRMC in August 2015(*) No longer staff Fellow as at 31 May 2015(^) New staff Fellow as at 1 June 2015(^^) Became a member of ERC in August 2015
Page
36
sydn
ey.e
du.a
uTh
e Un
iver
sity
of
Sydn
eyAn
nual
Rep
ort
2015

Senior executive remuneration 2015The University’s management is led by a team of senior executives, comprising the Vice‑Chancellor, Deputy Vice‑Chancellors and Vice‑Principals� The Senate Human Resources Committee determines the remuneration of the Vice‑Chancellor, and also reviews and approves the Vice‑Chancellor’s recommendations in relation to the remuneration of his direct reports�
The following section summarises the remuneration of the senior executives in 2015�
Vice-Chancellor and PrincipalDr Michael SpenceBA LLB Sydney DPhil PGDipTheol OxfordRemuneration: $858,726Performance bonus paid in 2015: $199,096This remuneration figure includes use of a residence owned by the University� The residence is required to be available and is used regularly for official University functions and promotional activities�
Provost and Deputy Vice-ChancellorProfessor Stephen GartonBA Sydney, PhD UNSW, FAHA FASSA FRAHSRemuneration: $589,226 Performance bonus paid in 2015: $90,543
Deputy Vice-Chancellor (Indigenous Strategy and Services)Professor Shane HoustonPhD CurtinRemuneration: $435,819 Performance bonus paid in 2015: $59,730
Deputy Vice-Chancellor (Registrar)Professor Tyrone CarlinBCom UNSW, LLB (Hons) Sydney, MCom (Hons) UNSW, LLM Sydney, PhD Macquarie, Grad Dip Fin SIA, CA FCPA FFinRemuneration: $470,761Performance bonus paid in 2015: $68,429
Deputy Vice-Chancellor (Education)Professor Pip Pattison AOPhD Melbourne, FASSARemuneration: $470,761 Performance bonus paid in 2015 (prorated): $37,899
Deputy Vice-Chancellor (Research)Professor Duncan IvisonBA McGill, MSc PhD LSE, FAHARemuneration: $470,761Performance bonus paid in 2015: not applicable
Vice-Principal (Operations)Ms Sara WattsBSc Sydney, MBA Macquarie, FCPA GAICDRemuneration: $481,572 Performance bonus paid in 2015 (prorated): $29,077
Vice-Principal (Advancement) Mr Tim DolanBA UCLA Remuneration: $452,359 Performance bonus paid in 2015: not applicable
Page
37
Gove
rnan
ce a
nd l
eade
rshi
p

Campus Improvement ProgramThe 2014‑20 Campus Improvement Program (CIP) Stage 1 proposal was approved by the NSW Government in February 2015� The proposal is now the official framework for planning, designing and building new infrastructure on the Camperdown/Darlington Campus�
The program will transform many of the University’s buildings and spaces over 15 years, facilitating co‑locations and collaborations of faculties, schools and PSUs, delivery of up to 4000 affordable student accommodation spaces, and upgrade of transport systems and infrastructure on the campus� The CIP will enable the University to deliver excellence in world‑class teaching, research and support facilities long into the future�
Sydney Nanoscience HubCompleted in Semester 2, 2015, this new building was delivered to extremely high specifications on a relatively tight budget� The Sydney Nanoscience Hub is a world‑leading research and teaching facility that will meet the requirements of nanoscience research for decades to come� The new building was designed to house precision instruments required to support basic and applied nanoscience research� The building won the Excellence in Construction Award for Tertiary Buildings $50 to $100 million in the Master Builders Association Awards 2015�
University of Sydney Business SchoolThe University of Sydney Business School on Abercrombie Street was completed in 2015� The building provides more than 11,000 square metres of new high‑quality learning and teaching space, including one 550‑seat and three 300‑seat lecture theatres, eight 100‑seat study rooms, 40 seminar rooms of varying sizes, a learning hub and 1500 square metres of informal learning space�
Abercrombie Student AccommodationThe University completed 200 private self‑catered apartment rooms in the Abercrombie Student Accommodation building� Residents of this facility have access to common and games areas, a theatre and meeting and study rooms� The building opened in Semester 1, 2016�
Queen Mary Building Student AccommodationThe University proudly redeveloped the Queen Mary Building at Camperdown as a student accommodation facility, with operations commencing in July 2015�
Already 799 students have moved in and are enjoying the unique features of the building, including sky lounges, a fully landscaped sky garden, barbecue area, soundproof music rooms, a theatre, gym and study hub areas� A magnificent mural features in the common area, recognising and celebrating Aboriginal heritage and culture and acknowledging the traditional owners of the land on which the building stands�
The project was awarded the Excellence in Construction Award for refurbishment/renovation/extension $50 to $100 million category in the Master Builders Association Awards 2015�
Sale of the St James Building in the Sydney CBDThe St James facility in the Sydney CBD formerly housed the University’s law school and library but was only being used for a limited number of postgraduate classes and evening lectures, with most law classes being held at the New Law Building at the main campus in Camperdown� The University successfully sold the St James building in 2015 for $46 million, with the proceeds being invested in the Future Fund�
Resources and investmentPa
ge 3
8sy
dney
.edu
.au
The
Univ
ersi
ty o
f Sy
dney
Annu
al R
epor
t 20
15

Expansion of Castlereagh Street CBD CampusThe University opened its new purpose‑built campus, delivering leading edge innovative education in the heart of the Sydney CBD in July 2015� The new facility is of world‑class standard and is located on levels 16, 17 and 18 of 133 Castlereagh Street� The CBD campus offers an executive boardroom with audio‑visual and video conference equipment, associated lounge facilities, and new teaching spaces� These areas will be used by postgraduate students and alumni� The lounge will also be used by senior members of the University�
Technology-enhanced learningIn 2015, the Learning Spaces Development Program comprised four projects to enhance students’ learning experiences�
The first was the Bring Your Own Device (BYOD) project that involved a complete redesign and refurbishment of eight existing learning and teaching facilities into BYOD spaces, including six seminar rooms and two learning studios�
The second project was the complete renewal of education technologies in 53 seminar rooms across the University to improve the teaching and learning experiences of staff and students�
The third project included the maintenance of education technologies in 19 lecture theatres and seminar rooms on campus�
The fourth project was the completion of the new 72‑seat Physical Containment 2 (PC2) teaching laboratory in the Charles Perkins Centre for students studying advanced microbiological techniques� The PC2 laboratory features an all‑in‑one student PC to allow the teaching to be completely paperless via the use of the electronic lab notebook (ELN) system, two teaching stations, 18 biosafety cabinets, three preparation spaces for media and culture, and a general dry preparation area�
Lecture recordingsIn 2015, our lecture recording service more than doubled with 92 percent of lectures recorded� The small percentage of lectures not recorded was due to administrative reasons such as repeat lectures, guest lectures, and units cancelled� Recorded lectures attracted more than 3�3 million views throughout the year�
Page
39
Reso
urce
s an
d in
vest
ment

StrategyThe University continued to support a strategy focused on University work health and safety (WHS) and a culture of wellbeing championed by active and visible leadership� We are working to shift our safety culture from reactive and process‑focused to a proactive and risk‑based culture� Developments in the Safety Management System (SMS) have included an updated WHS induction and a series of minimum performance standards for safety�
Work health and safety governanceThe Safety and Risk Management Committee of Senate, chaired by Mr Kevin McCann, met throughout 2015 to oversee the WHS governance framework for the University�
Work health and safety managementThe Senior Executive Group (SEG) Work Health and Safety Committee, chaired by the Provost, met quarterly throughout 2015 to monitor University‑wide WHS performance� The terms of reference for the SEG WHS committee were updated to increase visibility to SEG and optimise the committee’s decision‑making processes for University‑wide WHS issues�
Safety Management System auditThe Safety Management System (SMS) audit was recommenced in September 2015� This updated audit is a three‑year rolling program with three tiers of audit; local workgroup audits, faculty audits and a due diligence review with officers of the organisation�
WHS trainingDuring 2015, 3043 workers completed the online WHS induction� This included 2070 employees and 973 other workers (HDR students, contractors and volunteers)� This represents a 38 percent increase in participation from 2014, largely driven by the safety management system auditing program�
In 2015, 1213 workers attended face‑to‑face safety training delivered by Safety Health and Wellbeing, representing a 10 percent increase on 2014� Work is underway to transition biosafety and chemical safety training to online delivery to meet actual demand�
All 27 elected health and safety representatives, whose role is to provide a secondary consultation mechanism, were trained in 2015�
Key operational risksChemical safety and complianceUpdated chemical safety management standards and University standards for safely working with gases were developed and published in 2015� The University continues to work on systems and processes to align with the global harmonised system of chemical labelling�
Radiation safety and complianceThe Radiation Safety Committee, chaired by Professor Brendan Kennedy, met throughout 2015 and provided advice� Seven new premises carried out ionising and non‑ionising radiation activities at the University�
Biosafety and complianceThe Institutional Biosafety Committee, chaired by Professor Anthony Weiss, met throughout 2015 to review all applications for work with genetically modified organisms� In line with changes in the Gene Technology Act, a reapplication process to manage the required five‑year retiring approvals was engineered for existing approved notifiable low‑risk dealings�
Work health and safety incidentsIn 2015, there were a total of 1267 hazards and incidents reported via RiskWare� This represents a four percent increase in overall reporting from the previous year� Fifty‑seven percent of reports were hazards and near misses, an increase of seven percent on 2014� An increase in hazard and near‑miss reporting is an indicator of an improved safety culture� Of these reports, 70 percent involved employees, 24 percent involved students and six percent involved contractors, affiliates and visitors� Cut, puncture, graze was the most frequent mechanism of injury (22 percent) reported during 2015, followed by slip or trip and fall (20 percent), manual handling (seven percent), poor ergonomics set‑up (six percent) and acute illness (six percent)� For the first time, acute illness has been featured in the top five mechanisms of injury, with 81 percent of cases of reported acute illness being caused by a personal condition of the person affected� The most frequent mechanism of reported staff injuries was slip, trip or fall on slippery or uneven surface while the most frequent mechanism of student injuries was cut puncture and graze involving glassware, scalpels and other cutting tools�
OperationsPa
ge 4
0sy
dney
.edu
.au
The
Univ
ersi
ty o
f Sy
dney
Annu
al R
epor
t 20
15

StaffMechanism Number % of totalSlip or trip and fall 102 14Cut puncture or graze 99 14Acute illness 56 8
StudentsMechanism Number % of totalCut puncture or graze 72 40Slip or trip and fall 20 11Acute illness 18 10
WellbeingDuring 2015, 3081 staff across 17 University work areas participated in Healthy Body At Work program� Planning is underway to develop a network of ‘wellness champions’ to promote and support staff health and wellbeing� Musculoskeletal strains due to poor ergonomics of workstations remain a key risk factor for potential injury� To mitigate, 142 face‑to‑face workstation assessments were completed in 2015�
Physical wellbeing at work was promoted via Australian flu vaccination, Sit less/move more and Global Corporate Challenge initiatives�
Mental wellbeing is being addressed through provision of mindfulness practice and training opportunities� In 2015, 418 staff attended the positive psychology courses� The University continued to provide an employee assistance program for staff�
Workers compensationIn 2015, the University saw its strongest performance in workers compensation in its history, with improvements in every measure� A total of 581 incidents reported through Riskware involved injury or illness to staff, affiliates, students and others� Of these, 394 incidents (68 percent) were reported as notification of potential injury to our workers compensation insurer, with 86 of those resulting in workers compensation injury claims�
The total number of injuries reported in 2015 decreased by 17 percent, with average lost time per injury reduced by 58 percent in 2015 as compared with 2014� An average of 0�46 days lost per injury was recorded� As at 31 December 2015, 25 claims remained open�
2012 2013 2014 2015Total cost of claims
$451,342 $224,301 $440,481 $111,536
Average cost of claim
$4129 $2080 $5302 $2613
Average time lost per claim
1�95 days 1�04 days 1�1 days 0�46 days
Injuries reported 151 86 103 86
Insurance arrangementsThe University has completed its fourth successive year in the NSW Retro Paid Loss Workers Compensation Scheme� The cost of claims and premium costs for all four years have remained at the minimum premium payable ($1�29 million)�
Legal affairsRisk managementThe University has set up a Risk Management Framework that includes a University Register of Consolidated Risks and individual registers for each Senate and Senior Executive Group (SEG) committee�The Register of Consolidated Risks is linked to the Strategic Plan, contains all significant risks to University operations and details existing controls and mitigation plans (as required) for each identified risk� The register is subject to regular revision throughout the year�
The SEG committees are responsible for reviewing the revisions and the documented mitigation strategies in their risk registers, which are a subset of the Consolidated Risk Register� This occurs at least twice per year for each of the relevant SEG committees�
In the same way the Senate committees also review their risk registers at least twice per year� The Senate Safety and Risk Management Committee is responsible for overseeing this process on behalf of the Senate�
Public interest disclosuresThe Public Interest Disclosures Act 1994 (the Act) sets in place a system to encourage public officials to report serious wrongdoing� Under section 6D of the Act, public authorities are required to have a policy and procedures for receiving, assessing and dealing with reports of wrongdoing� As a public authority, our Reporting Wrongdoing Policy 2012 satisfies this requirement�
Page
41
Oper
atio
ns

Public authorities are required to report annually to Parliament on their obligations under section 31 of the Act� The following is the University’s report for 2015:
− number of public officials who made public interest disclosures in the University: 9
− number of disclosures received by the University: 9
Disclosures received by the University were about: − corrupt conduct: 3 − maladministration: 4 − serious and substantial waste: 0 − government information contravention: 0 − Number of disclosures finalised: 9
Waste management and sustainabilityIn July 2015 the University of Sydney endorsed a new Environmental Sustainability Policy that targets a number of key sustainability objectives:1� planning strategically for University‑wide
environmental sustainability 2� integrating environmental sustainability into
teaching, learning and research3� planning and developing environmentally
sustainable buildings and infrastructure 4� conserving and efficiently using energy and water
resources 5� reducing climate change impacts and managing
the University’s carbon footprint 6� conserving natural resources and minimising
waste 7� conserving and enhancing biodiversity 8� improving environmental sustainability of the
University’s supply chain 9� promoting sustainable transport and mobility 10� implementing green leases 11� establishing environmental management systems 12� promoting environmental sustainable
investments�
Energy management and GHG emissionsThe University of Sydney reports its energy consumption under the National Greenhouse and Energy Reporting (NGER) Act 2007� Reporting annual greenhouse gas emissions and energy consumption for all facilities falls under the University’s operational control� This includes energy, greenhouse gas emissions from electricity use, gas use, liquid fuels and wastewater treatment plants� Campus Infrastructure and Services has continued to implement process and procedural improvements to improve the quality of reported data�
In 2015^ the University’s greenhouse emissions (GHG) increased by approximately 1�6 percent in comparison to 2014*� The University consumed a total of 515,542 GJ of energy, a net increase of five percent�
The overall increase in the University’s energy consumption and greenhouse gas emissions is predominately due to increased occupancy of the Charles Perkins Centre� In 2014, the centre operated for approximately six months, compared to a full year for 2015�
The University continues to implement a range of programs aimed at increasing energy productivity and reducing greenhouse gas emissions�
Total energy consumed 515,542 GJTotal energy generated 5,942 GJNet energy consumed 509,600 GJTotal GHG emissions 95,985 tCO2‑e
Water managementThe University of Sydney consumed approximately 559,000 kL in 2015^ – an 8�7 percent decrease compared to 2014�
2013 total waste consumed 524,869 kL2014* total waste consumed 612,051 kL2015^ total waste consumed 559,053 kL
* 2013-2014 reporting period; 1 July 2013 to 30 June 2014^ 2014-2015 reporting period; 1 July 2014 to 30 June 2015.Pa
ge 4
2sy
dney
.edu
.au
The
Univ
ersi
ty o
f Sy
dney
Annu
al R
epor
t 20
15

Resource recovery and waste management General waste from the University of Sydney is diverted to an Advanced Resource Recovery Facility, which uses modern mechanical separation technologies to gather recyclable materials from mixed general waste streams� Dry‑waste components like plastics, glass, cans and other metals are separated from wet organic food‑based waste components� Organic waste is aerobically composted in enclosed tunnels to produce compost� A limited amount of residual waste is sent to landfill� The facility diverts approximately 43 percent of incoming material from landfill�
Paper and cardboard waste is sent to a facility and processed into marketable paper products and cardboard packaging�
Electronic waste is sent to a specialist e‑waste recycler where items are dismantled to recover useful marketable material such as steel metal� About 95 percent by weight of electronic waste is recovered�
In 2015, the University commenced deployment of centralised twin‑bin recycling and waste stations across workplaces at the main Camperdown and Darlington campuses� Centralised twin‑bin stations comprise a mixed recyclables bin and a general waste bin typically located within 20m of work desks� Individual workplace desk bins are being progressively eliminated wherever the twin bin stations are being deployed� Materials collected from the mixed recyclables bins are sent to a materials recovery facility to separate marketable paper, metals and plastics�
The table above right summarises the recycling and waste data for the University’s office and general campus waste streams� This does not include waste generation from student accommodation�
In 2015 the University’s total waste generation decreased by 19 percent, with a 34 percent decrease on paper and cardboard even though waste generation data was obtained from additional three satellite sites, two student accommodation buildings and two new buildings on main campus: the Charles Perkins Centre and the Sydney Nanoscience Hub� However, the University was still able to increase comingled recycling by 16 percent and achieve an overall recycling rate of 62 percent�
Summary of waste and recycling data in 2015 Landfill (general) waste 1,058 tonnesComingled (mixed) recycling 822 tonnesPaper and cardboard recycling 854 tonnesElectronic waste 23�86 tonnesFluoro tubes and fittings 1�06 tonnesTotal waste 2,759 tonnesRecycling rate 62%
Consumer responseThe University of Sydney is a high‑profile, multifaceted research and teaching organisation� Our commitment to freedom of speech remains staunch, and we always welcome feedback from our community and the wider public�
The range of issues on which we received comment in 2015 was broad and, as ever, we endeavoured to investigate and to respond as fully and as quickly as possible� Our stakeholders include, of course, our students, staff and alumni, other universities, government, business, industry, media and private individuals� In 2015 we consulted broadly and encouraged comment on our future through development of our 2016‑20 Strategic Plan�
In 2015, we received comments on many issues, including:
− the elements of our 2016‑20 Strategic Plan, broadly divided into four categories: education; research; culture; and organisational design
− the federal government’s higher education reform package
− the University’s use of mice in experiments aimed at improving public health outcomes
− an incident at a public lecture in March involving students, academics and members of the public
− a peace rally planned to take place on ANZAC Day − changed venue arrangements for
the Renaissance Players − the approved new structure for
Senate, to take effect in 2017 − the flying of the Rainbow Flag over the quadrangle − media reports of academic misconduct�
As in previous years, communication ranges from individual letters and telephone calls to large‑volume petitions�
Page
43
Oper
atio
ns

We receive many letters of appreciation: for events; for the actions of individual staff members; and for public engagement programs�
We also receive representations from and on behalf of students, which are referred to our Deputy Vice‑Chancellor (Registrar) for action, and occasionally to more formal processes for resolution�
We always endeavour to respond quickly to all our stakeholders and to achieve resolutions that are amenable to all�
Privacy and personal informationThe Annual Reports (Statutory Bodies) Regulation 2010 requires the University to report on the actions it has taken to comply with the NSW Privacy and Personal Information Protection Act 1998 (the Act) and to provide statistical details of any review conducted by or on its behalf�
The strategic actions we took to promote privacy in 2015 include:
− ongoing reporting of privacy matters to the University’s Serious Complaints Committee and to the Safety and Risk Management Committee of Senate
− voluntarily notifying the NSW Privacy Commissioner of privacy‑related matters that do not result in or involve an application for review of conduct (which would be required to be notified to the Commissioner), and of the University’s responses to those matters
− development of an online privacy training module to be deployed in 2016�
At an operational level, we continued to promote privacy through liaison and communication with staff to:
− facilitate privacy notices on electronic and hardcopy forms used to collect personal information
− include consideration of privacy issues in the development of systems, policies, procedures and guidelines, with particular emphasis on the collection of personal information through web interfaces
− provide accurate and timely advice on privacy matters to members of our community�
ReviewsSix reviews were conducted under Part 5 of the Act during 2015� In addition we identified about seven other privacy issues that were investigated and remedial or mitigating actions initiated�
This reporting year there was a further decrease in the number of privacy matters raised� The matters dealt with concerned the inadvertent disclosure of personal information�
Actions we took in response to the matters included: − enquiring into the facts of the privacy issues − reviewing and changing processes − providing additional training − advising affected individuals of their
rights under the PPIP Act�
The University received no requests for amendment of records and 14 requests for access to personal information under section 14 of the Act� No privacy matters were decided by the NSW Civil and Administrative Tribunal or were investigated by the NSW Privacy Commissioner�
Government Information (Public Access) ActProgram for the release of informationThe Government Information (Public Access) Act 2009 (GIPA Act) requires us to review, at least annually, its program for the release of information that is in the public interest to be made publicly available without imposing unreasonable additional costs on the agency� The Government Information (Public Access) Regulation 2010 requires that details of this review be included in our Annual Report�
During 2015 we reviewed our program for the release of information� As in the previous reporting year, we assessed access applications received for the previous reporting period, and confirmed the adequacy of the program of proactive release (as the types of requests received were not generated by the program)� Also, having regard to issues inherent to the current disclosure regime, we initiated a review into the efficacy of contract reporting activities�
Our website is an important avenue for the proactive release of as much of this information as practicable, where there is no overriding public interest against disclosure of the information� This proactive release was free of charge�
Page
44
sydn
ey.e
du.a
uTh
e Un
iver
sity
of
Sydn
eyAn
nual
Rep
ort
2015

We continued to accompany initiatives or changes, such as new buildings, units, staff appointments or events, with websites, updated media releases and contact details for further information� The University also redesigned its website which enhanced public access to the University’s information�
Total number of access applications We received 38 new access applications under the GIPA Act in 2015� Eleven were requests for the personal information of the applicant, 23 were for information other than personal information, and four were for a combination of personal information and information other than personal� One application was withdrawn� Five internal reviews were conducted, and one external review finalised�
Applications refused under Schedule 1 of the Act We are required to report the total number of access applications we refused during the reporting year, either wholly or partly, because the applications were for the disclosure of information referred to in Schedule 1 of the GIPA Act (information for which there is conclusive presumption of overriding public interest against disclosure)� There were four such applications in 2015�
Table A: Number of applications by type of applicant and outcome*
Acce
ss g
rant
ed in
full
Acce
ss g
rant
ed in
par
t
Acce
ss r
efus
ed in
full
Info
rmat
ion
not h
eld
Info
rmat
ion
alre
ady
avai
labl
e
Refu
se to
dea
l with
ap
plic
atio
n
Refu
se to
con
firm
/den
y w
heth
er in
form
atio
n is
hel
d
Appl
icat
ion
with
draw
n
Media 1 1 1 0 0 0 0 0Members of Parliament 0 1 0 1 0 0 0 0
Private sector businesses 0 0 0 0 0 0 0 0
Not‑for‑profit organisations or community groups
4 1 4 9 1 0 0 1
Members of the public (application by legal representative)
0 0 0 0 0 0 0 0
Members of the public (other) 4 2 4 4 2 0 0 1
* More than one decision can be made in respect of a particular access application. If so, a recording must be made in relation to each such decision. This also applies to Table B.
Table B: Number of applications by type of application and outcome
Acce
ss g
rant
ed in
full
Acce
ss g
rant
ed in
par
t
Acce
ss r
efus
ed in
full
Info
rmat
ion
not h
eld
Info
rmat
ion
alre
ady
avai
labl
e
Refu
se to
dea
l with
ap
plic
atio
n
Refu
se to
con
firm
/den
y w
heth
er in
form
atio
n is
hel
d
Appl
icat
ion
with
draw
n
Personal information applications
3 2 0 0 0 0 0 1
Access applications (other than personal information applications)
6 3 6 13 3 0 0 1
Access applications that are partly personal information applications and partly other
0 0 3 1 0 0 0 0
* A personal information application is an access application for personal information (as defined in clause 4 of Schedule 4 to the Act) about the applicant (the applicant being an individual).
Table C: Invalid applications
Reason for invalidity No of applicationsApplication does not comply with formal requirements (section 41 of the Act)
0
Application is for excluded information of the agency (section 43 of the Act)
1
Application contravenes restraint order (section 110 of the Act) 0
Total number of invalid applications received 0
Invalid applications that subsequently became valid applications 0
Page
45
Oper
atio
ns
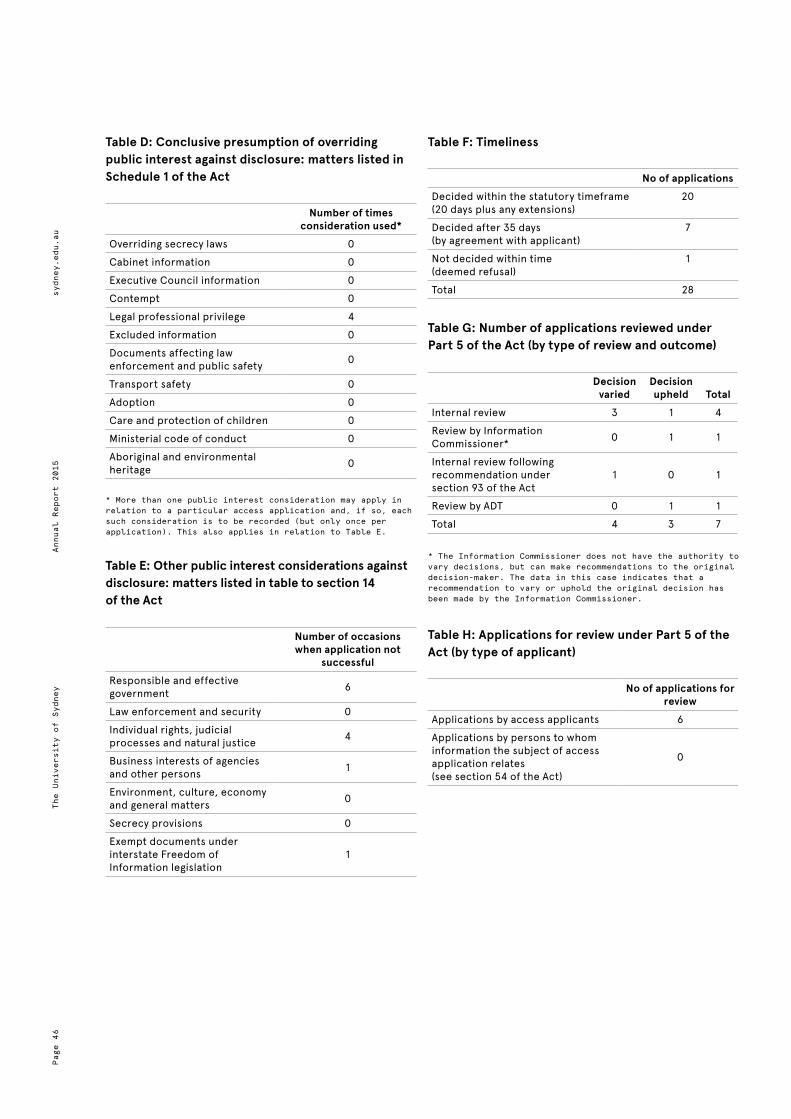
Table D: Conclusive presumption of overriding public interest against disclosure: matters listed in Schedule 1 of the Act
Number of times consideration used*
Overriding secrecy laws 0Cabinet information 0Executive Council information 0Contempt 0Legal professional privilege 4Excluded information 0Documents affecting law enforcement and public safety 0
Transport safety 0Adoption 0Care and protection of children 0Ministerial code of conduct 0Aboriginal and environmental heritage 0
* More than one public interest consideration may apply in relation to a particular access application and, if so, each such consideration is to be recorded (but only once per application). This also applies in relation to Table E.
Table E: Other public interest considerations against disclosure: matters listed in table to section 14 of the Act
Number of occasions when application not
successfulResponsible and effective government 6
Law enforcement and security 0Individual rights, judicial processes and natural justice 4
Business interests of agencies and other persons 1
Environment, culture, economy and general matters 0
Secrecy provisions 0Exempt documents under interstate Freedom of Information legislation
1
Table F: Timeliness
No of applicationsDecided within the statutory timeframe (20 days plus any extensions)
20
Decided after 35 days (by agreement with applicant)
7
Not decided within time (deemed refusal)
1
Total 28
Table G: Number of applications reviewed under Part 5 of the Act (by type of review and outcome)
Decision varied
Decision upheld Total
Internal review 3 1 4Review by Information Commissioner* 0 1 1
Internal review following recommendation under section 93 of the Act
1 0 1
Review by ADT 0 1 1Total 4 3 7
* The Information Commissioner does not have the authority to vary decisions, but can make recommendations to the original decision-maker. The data in this case indicates that a recommendation to vary or uphold the original decision has been made by the Information Commissioner.
Table H: Applications for review under Part 5 of the Act (by type of applicant)
No of applications for review
Applications by access applicants 6Applications by persons to whom information the subject of access application relates (see section 54 of the Act)
0
Page
46
sydn
ey.e
du.a
uTh
e Un
iver
sity
of
Sydn
eyAn
nual
Rep
ort
2015

The University of Sydney’s financial statements for the year ended 31 December 2015 show a modest underlying margin of $6�0 million (2014: deficit of $6�0 million)� This operating surplus excludes quarantined items that cannot be spent on day‑to‑day operations�
If quarantined items (such as unspent funds relating to specific research grants, philanthropic funds allocated by donors to certain purposes, and funds that must be spent on specific capital investment projects) are included, the University recorded a 2015 operating result of $158�2 million (2014: $161�2 million)�
While an operating result of $158�2 million reflects the University’s financial position in accordance with Australian accounting standards as required by the federal government, it does not represent a surplus that can be spent freely� The operating result can be reconciled to the underlying result as follows:
2015 2014 Change Change$M $M $M %
Operating revenue1 2,030�3 1,897�9 132�4 7�0Operating expenses2 1,872�1 1,736�7 135�4 7�8Operating result per financial statements (parent only)
158.2 161.2 (3.0) (1.9)
Adjusted for:Philanthropic funds3 (69�4) (98�4) 29�0 29�5Investment funds3 (38�1) (1�7) (36�4) ‑Capital grants (10�6) (10�9) 0�3 2�7Specific purpose grants (34�1) (27�2) (6�9) (25�3)Other adjustments4 0�0 (29�0) 29�0 100�0Underlying margin 6.0 (6.0) 12.0 (200.7)
1 For further information, see Section 1 on operating revenue (opposite)
2 For further information, see Section 2 on operating expenses (page 51)
3 Figures include internal rate of return and reflect net margin. Certain philanthropic and investment funds are restricted and unavailable for general use.
4 Restatement of opening balances in defined benefits, as result of signed government memorandums of understanding to fund previously unfunded State Authorities Non-contributory Superannuation (SANCS) funds.
The positive operating result per the financial statements was achieved through contributions delivered by ‘quarantined items’ that include the following:
− Philanthropic funds: A large proportion of the philanthropic funds managed by the University must be invested in perpetuity� Under the terms of many of the endowments, some investment income derived from these investments must be retained to maintain the real value of the endowment and is not therefore available to fund day‑to‑day operations�
− Investment funds: Must be held in reserve to meet capital requirements for a collateral fund to support the University’s debt and protect against any unforeseen circumstances� These reserves also support our obligation to meet employee entitlements, and will assist in providing accommodation for our students�
− Capital grants: A number of capital grants have been received to fund specific infrastructure projects such as the refurbishment of the CBD campus on Castlereagh Street and the new grandstand for the Number 2 Oval�
− Unspent research and education funds: A range of research and education grants must be applied to specific projects including National Health and Medical Research Council and Australian Research Council grants and student scholarship funds�
− Other adjustments: An agreement was reached in late 2014 between the federal and state governments to provide certainty in respect to the funding of the defined benefits superannuation funds managed by the State Authorities Superannuation Trustee Corporation, previously held as an unfunded liability by the University� This created a one‑time superannuation adjustment for the University in 2014�
Financial review of 2015
Page
47
Fina
ncia
l re
view
of
2015

1. Operating revenueThe 2015 operating revenue of $2,030�2 million was $132�4 million greater than 2014� The following table and chart show the major components of this increased revenue�
2015 2014 Change Change$M $M $M %
Income from students (incl HECS‑HELP and FEE‑HELP)
872�7 758�9 113�8 15�0
Federal government operating and capital grants
305�7 306�4 (0�7) (0�2)
Research and consultancy activities
522�8 529�7 (6�9) (1�3)
NSW Government operating grant
3�0 2�4 0�6 25�0
Income from private sources
326�0 300�5 25�5 8�5
Total 2,030.2 1,897.8 132.4 7.0
$3.0m
$872.7m
$522.8m
$326.0m
$305.7m
450
400
350
300
250
200
150
100
50
003 04 05 06 07 08 09 10 11 12 13 14 15
FFPS – overseas
HECS–HELP
FFPS – postgraduate (incl FEE-HELP)
Non-award
Summer School
FFPS – local undergraduate (incl FEE-HELP)
Income from students (including HECS and FEE–HELP)
Research and consultancy activities
Income from private sources (including philanthropy)
Federal government operating grants
NSW Government operating grant
Page
48
sydn
ey.e
du.a
uTh
e Un
iver
sity
of
Sydn
eyAn
nual
Rep
ort
2015

1.1 Income from studentsThe growth of overseas full fee‑paying students (FFPS) in 2015 continues to provide significant income to the University� Once again, overseas FFPS income accounted for the largest proportion of student income, contributing 55 percent of total income from students� See chart on page 48�
The 2015 growth in income from students of $113�7 million was mainly attributable to additional course fees generated from full fee‑paying overseas students of $88�4 million, an increase of 22�6 percent�
2015 2014 Change Change$M $M $M %
FFPS ‑ overseas 479�6 391�2 88�4 22�6HECS ‑ HELP 206�0 201�9 4�0 2�0FFPS ‑ postgraduate (incl FEE‑HELP)
110�1 96�7 13�4 13�9
Non‑award 40�9 37�6 3�3 8�7Summer School 28�6 22�9 5�7 24�7FFPS ‑ local undergraduate (incl FEE‑HELP)
7�6 8�7 (1�1) (12�8)
Total income from Students
872.7 759.0 113.7 15.0
1.2 Federal government fundingThe continuing decline in federal financial support has intensified the financial pressure on the University, as federal financial support as a percentage of total revenue declined again in 2015� The overall level of federal funding decreased by $11�4 million, a fall of 1�6 percent�
This decrease was driven largely by the drop of $8�9 million in Australian Research Council (ARC) funding� The drop is attributed to both lower success rates and a steady decline of total available ARC funding� The University has managed to maintain a 9‑12 percent share of ARC grant funds over recent years�
2015 2014 Change Change$M $M $M %
Teaching and learning operating grants
304�4 299�5 4�9 1�6
Capital funding 1�3 6�9 (5�6) (81�4)Federal government operating and capital grants
305.7 306.4 (0.7) (0.2)
Research block grant funding
150�9 150�4 0�5 0�3
Other federal agencies ‑ research
157�2 160�6 (3�4) (2�1)
Australian Research Council
64�1 73�0 (8�9) (12�2)
Scholarships 30�3 29�1 1�2 4�0Federal research funding
402.5 413.2 (10.7) (2.6)
Total federal funding 708.2 719.6 (11.4) (1.6)
04 05 06 07 08 09 10 11 12 13 14 15
33.4 32.4 29.4 30.5 34.9 34.6 37.2 34.3 34.6 36.1 40.0 43.0 HECS-HELP and student fee income
21.4 20.8 19.2 20.7 24.0 24.5 26.4 24.9 24.3 25.2 28.9 32.4 Student fee income (excluding HECS-HELP)
15.8 17.8 15.8 16.0 17.7 17.3 17.6 17.0 16.9 16.6 15.8 15.0 Federal operating grants
11.9 11.6 10.2 9.8 10.9 10.1 10.8 9.4 10.3 10.9 11.1 10.6 HECS-HELP
45%
40%
35%
30%
25%
20%
15%
10%
5%
0
Page
49
Fina
ncia
l re
view
of
2015
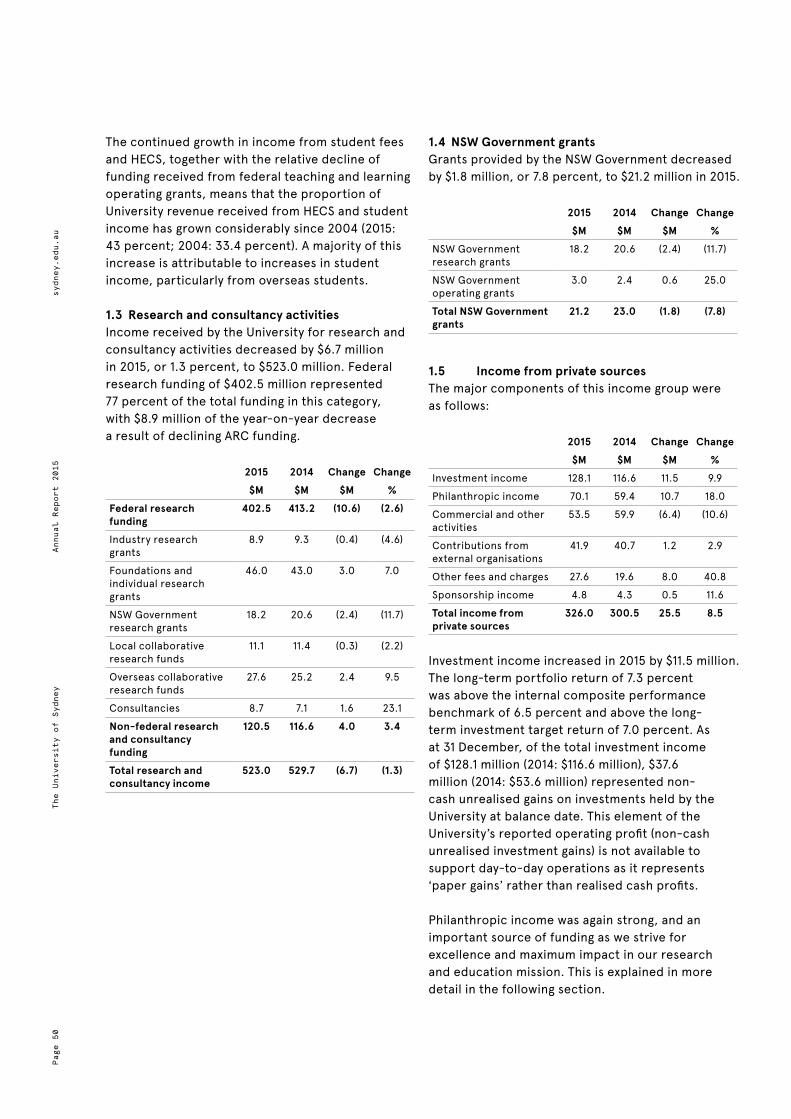
The continued growth in income from student fees and HECS, together with the relative decline of funding received from federal teaching and learning operating grants, means that the proportion of University revenue received from HECS and student income has grown considerably since 2004 (2015: 43 percent; 2004: 33�4 percent)� A majority of this increase is attributable to increases in student income, particularly from overseas students�
1.3 Research and consultancy activitiesIncome received by the University for research and consultancy activities decreased by $6�7 million in 2015, or 1�3 percent, to $523�0 million� Federal research funding of $402�5 million represented 77 percent of the total funding in this category, with $8�9 million of the year‑on‑year decrease a result of declining ARC funding�
2015 2014 Change Change$M $M $M %
Federal research funding
402.5 413.2 (10.6) (2.6)
Industry research grants
8�9 9�3 (0�4) (4�6)
Foundations and individual research grants
46�0 43�0 3�0 7�0
NSW Government research grants
18�2 20�6 (2�4) (11�7)
Local collaborative research funds
11�1 11�4 (0�3) (2�2)
Overseas collaborative research funds
27�6 25�2 2�4 9�5
Consultancies 8�7 7�1 1�6 23�1Non-federal research and consultancy funding
120.5 116.6 4.0 3.4
Total research and consultancy income
523.0 529.7 (6.7) (1.3)
1.4 NSW Government grantsGrants provided by the NSW Government decreased by $1�8 million, or 7�8 percent, to $21�2 million in 2015�
2015 2014 Change Change$M $M $M %
NSW Government research grants
18�2 20�6 (2�4) (11�7)
NSW Government operating grants
3�0 2�4 0�6 25�0
Total NSW Government grants
21.2 23.0 (1.8) (7.8)
1.5 Income from private sourcesThe major components of this income group were as follows:
2015 2014 Change Change$M $M $M %
Investment income 128�1 116�6 11�5 9�9Philanthropic income 70�1 59�4 10�7 18�0Commercial and other activities
53�5 59�9 (6�4) (10�6)
Contributions from external organisations
41�9 40�7 1�2 2�9
Other fees and charges 27�6 19�6 8�0 40�8Sponsorship income 4�8 4�3 0�5 11�6Total income from private sources
326.0 300.5 25.5 8.5
Investment income increased in 2015 by $11�5 million� The long‑term portfolio return of 7�3 percent was above the internal composite performance benchmark of 6�5 percent and above the long‑term investment target return of 7�0 percent� As at 31 December, of the total investment income of $128�1 million (2014: $116�6 million), $37�6 million (2014: $53�6 million) represented non‑cash unrealised gains on investments held by the University at balance date� This element of the University’s reported operating profit (non‑cash unrealised investment gains) is not available to support day‑to‑day operations as it represents ‘paper gains’ rather than realised cash profits�
Philanthropic income was again strong, and an important source of funding as we strive for excellence and maximum impact in our research and education mission� This is explained in more detail in the following section�
Page
50
sydn
ey.e
du.a
uTh
e Un
iver
sity
of
Sydn
eyAn
nual
Rep
ort
2015
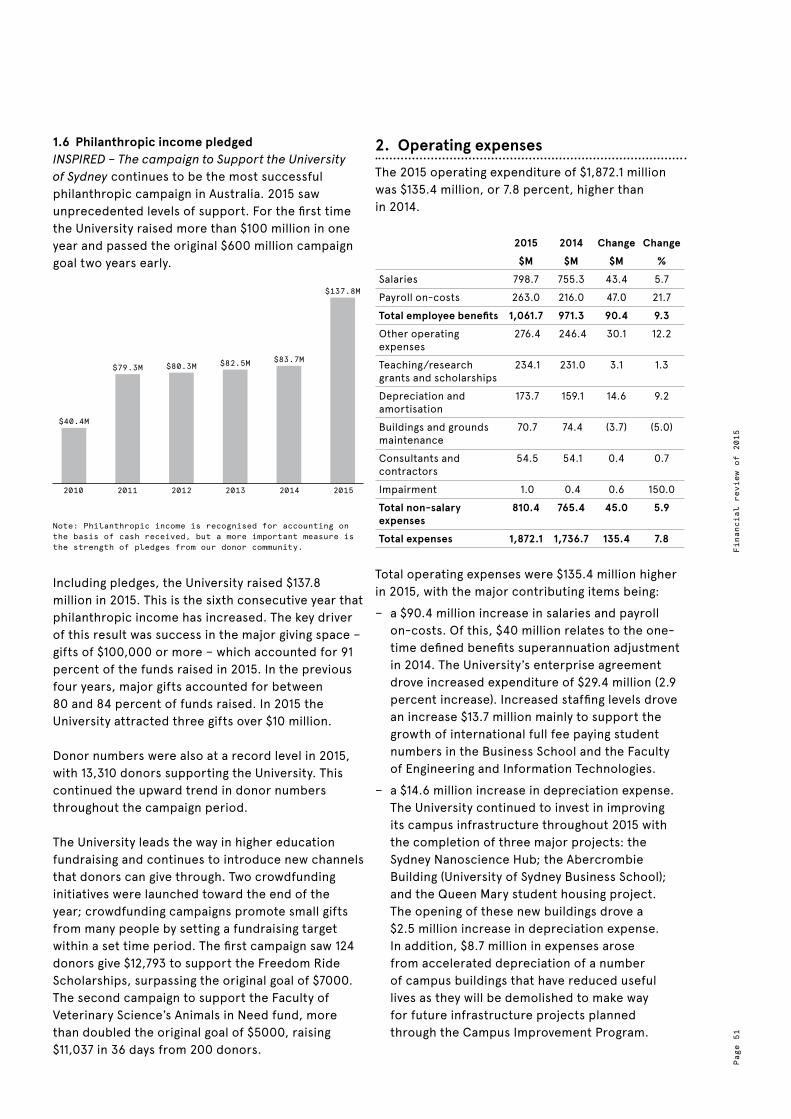
1.6 Philanthropic income pledgedINSPIRED – The campaign to Support the University of Sydney continues to be the most successful philanthropic campaign in Australia� 2015 saw unprecedented levels of support� For the first time the University raised more than $100 million in one year and passed the original $600 million campaign goal two years early�
Note: Philanthropic income is recognised for accounting on the basis of cash received, but a more important measure is the strength of pledges from our donor community.
Including pledges, the University raised $137�8 million in 2015� This is the sixth consecutive year that philanthropic income has increased� The key driver of this result was success in the major giving space – gifts of $100,000 or more – which accounted for 91 percent of the funds raised in 2015� In the previous four years, major gifts accounted for between 80 and 84 percent of funds raised� In 2015 the University attracted three gifts over $10 million�
Donor numbers were also at a record level in 2015, with 13,310 donors supporting the University� This continued the upward trend in donor numbers throughout the campaign period�
The University leads the way in higher education fundraising and continues to introduce new channels that donors can give through� Two crowdfunding initiatives were launched toward the end of the year; crowdfunding campaigns promote small gifts from many people by setting a fundraising target within a set time period� The first campaign saw 124 donors give $12,793 to support the Freedom Ride Scholarships, surpassing the original goal of $7000� The second campaign to support the Faculty of Veterinary Science’s Animals in Need fund, more than doubled the original goal of $5000, raising $11,037 in 36 days from 200 donors�
2010 2011 2012 2013 2014 2015
$79.3M
$40.4M
$82.5M $83.7M
$137.8M
$80.3M
2. Operating expensesThe 2015 operating expenditure of $1,872�1 million was $135�4 million, or 7�8 percent, higher than in 2014�
2015 2014 Change Change$M $M $M %
Salaries 798�7 755�3 43�4 5�7Payroll on‑costs 263�0 216�0 47�0 21�7Total employee benefits 1,061.7 971.3 90.4 9.3Other operating expenses
276�4 246�4 30�1 12�2
Teaching/research grants and scholarships
234�1 231�0 3�1 1�3
Depreciation and amortisation
173�7 159�1 14�6 9�2
Buildings and grounds maintenance
70�7 74�4 (3�7) (5�0)
Consultants and contractors
54�5 54�1 0�4 0�7
Impairment 1�0 0�4 0�6 150�0Total non-salary expenses
810.4 765.4 45.0 5.9
Total expenses 1,872.1 1,736.7 135.4 7.8
Total operating expenses were $135�4 million higher in 2015, with the major contributing items being:
− a $90�4 million increase in salaries and payroll on‑costs� Of this, $40 million relates to the one‑time defined benefits superannuation adjustment in 2014� The University’s enterprise agreement drove increased expenditure of $29�4 million (2�9 percent increase)� Increased staffing levels drove an increase $13�7 million mainly to support the growth of international full fee paying student numbers in the Business School and the Faculty of Engineering and Information Technologies�
− a $14�6 million increase in depreciation expense� The University continued to invest in improving its campus infrastructure throughout 2015 with the completion of three major projects: the Sydney Nanoscience Hub; the Abercrombie Building (University of Sydney Business School); and the Queen Mary student housing project� The opening of these new buildings drove a $2�5 million increase in depreciation expense� In addition, $8�7 million in expenses arose from accelerated depreciation of a number of campus buildings that have reduced useful lives as they will be demolished to make way for future infrastructure projects planned through the Campus Improvement Program�
Page
51
Fina
ncia
l re
view
of
2015

− $30�1 million increase in other operating expenses, mainly comprising a $12�7 million increase in expenditure to support increased student load, a $7�4 million increase in non‑capitalised IT hardware and software projects, $4�1 million in increased laboratory consumable costs and a $3�9 million increase in financing costs arising from the University’s bond issues completed in 2014 and 2015�
3. Expenditure on assetsIn accordance with its 2011–15 Strategic Plan the University has committed to a long‑term capital expenditure plan to assure its future sustainability as a leading research‑intensive university and to provide its researchers and students with facilities befitting that status� This includes funding for state‑of‑the‑art buildings, information and communications technology and library infrastructure to support the University’s core teaching and research activities�
In 2015, the University incurred capital expenditure of $366�3 million, which represented an increase in spend of $40�7 million or 12�5 percent in comparison to 2014�
2015 2014 Change Change$M $M $M %
Land and buildings 18�9 2�7 16�2 611�7Equipment 31�0 14�5 16�5 113�8Capital works – software 25�2 35�6 (10�4) (29�2)Capital works – buildings 267�7 265�4 2�3 0�8Other 23�6 7�4 16�2 217�4Total capital expenditure
366.3 325.6 40.7 12.5
The increase in capital expenditure in 2015 was largely due to the completion of the Sydney Nanoscience Hub� The University also purchased the L’lara property near Narrabri to expand our agricultural research capability�
In 2015 the University entered into capital expenditure commitments for property, plant and equipment totalling $86 million (2014: $193 million)�
4. EquityThe total equity of the University at 31 December 2015 was $4,202�0 million, $206�0 million higher than at 31 December 2014�
2015 2014 Change Change$M $M $M %
Restricted funds 1,057�4 987�7 69�7 7�1Reserves 405�1 355�0 50�0 14�1Retained earnings 2,739�6 2,653�3 86�3 3�3Total equity 4,202.0 3,996.1 206.0 5.2
The three major components of the total equity were as follows�
1� Restricted funds, which total $1,057�4 million at 31 December 2015 (2013: $987�7 million) and which include the unexpended portion of funds received through the income statement and which have restrictions on their use� These funds relate to long‑term restricted funds received originally as gifts including bequests, capital preserved trusts, scholarships and prizes and are quarantined from use to support the University’s day‑to‑day operations�
2� Reserves, which largely comprise revaluation adjustments for the University’s land and buildings� All investment gains and losses are now recognised through profit or loss� In 2015, there was a net increase of $50�0 million in the reserves, $48�1 million arising from the annual revaluation of commercial teaching and research properties through an independent external valuer� Changes in local market conditions for various properties resulted in a number of valuation adjustments� In particular, the Brain and Mind Centre and Medical Foundation buildings in Camperdown were revalued upwards by $24�4 million and $12�4 million respectively� In addition, two farms in the Badgerys Creek area were revalued upwards by $4�7 million and a number of the University’s student housing assets had positive valuation adjustment totalling $5�1 million�
3� Retained earnings of the University have increased to $2,739�6 million, made up of the initial revaluation reserve of $1,660�5 million created in 1992 (when the NSW Government transferred the land and buildings to the University) together with the cumulative net operating surpluses generated, excluding reserves, in the periods up to 31 December 2015�
Page
52
sydn
ey.e
du.a
uTh
e Un
iver
sity
of
Sydn
eyAn
nual
Rep
ort
2015

5. Operating statement
2015 2015 2015 2016Comparison to Budget Budget Forecast Actual BudgetParent Entity (University) $’000 $’000 $’000 $’000Revenue and income from continuing operationsAustralian Government financial assistance: Australian Government grants 733�7 705�4 708�1 697�2 HECS‑HELP 170�0 173�7 172�9 178�7 FEE‑HELP 87�6 83�5 82�8 95�2 SA‑HELP 4�0 4�2 4�2 4�3New South Wales Government financial assistance 24�8 22�5 21�1 23�4HECS‑HELP ‑ student payments 36�9 33�2 33�1 34�2SA‑HELP ‑ student payments 8�2 9�5 9�6 9�8Fees and charges 555�0 593�2 597�8 691�9Investment revenue 102�7 80�4 96�4 110�0Royalties, trademarks and licences 2�5 5�8 5�6 4�7Consultancy and contract research 101�1 103�6 102�3 102�1Other revenue 88�8 80�0 74�9 78�1Other income 62�9 118�4 89�8 93�2Gains/(losses) on disposal of assets ‑ ‑ 31�7* ‑Total revenue and income from continuing operations 1,978.3 2,013.4 2,030.3 2,122.7Expenses from continuing operationsEmployee related expenses 1,060�0 1,045�8 1,061�7 1,132�8Depreciation and amortisation 156�9 167�0 173�7 189�1Repairs and maintenance 64�5 68�5 70�7 75�5Borrowing costs 23�2 22�7 22�5** 24�0Impairment of assets 0�6 ‑ 1�0** ‑Other expenses 255�6 240�2 253�9 268�6Grant and scholarship expenses 105�2 104�6 97�5 117�3Consultants and contractors 52�7 57�8 54�5 59�3Teaching and research grants 128�0 137�7 136�6 134�7Total expenses from continuing operations 1,846.6 1,844.3 1,872.1 2,001.4Operating result before income tax 131.7 169.1 158.2 121.3Income tax benefit/(expense) ‑ ‑ ‑ ‑Operating result after income tax 131.7 169.1 158.2 121.3Operating result attributable to members of the University of Sydney 131.7 169.1 158.2 121.3
Notes:* Net gain/(loss) on sale of property, plant and equipment.** The approved budget/forecast, where possible, has been adjusted above to take account of the year-end presentation of
accounting adjustments, including fixed asset purchases and depreciation, to provide a meaningful comparison.
Page
53
Fina
ncia
l re
view
of
2015

6. Investments and investment performance
As shown in the chart below, the 2015 investment environment was favourable, with positive returns across most asset classes, except for Australian small‑cap stocks�
12 months to December 2015 (UH: unhedged, H: hedged)Data Source: Thomson Financial Data-stream; MSCI. Data provided ‘as is’.
Despite a volatile year, most asset classes generated positive returns in 2015� Concerns over a slowing Chinese economy lingered throughout the year, and falling oil prices adversely impacted corporate credit markets, particularly the materials and energy sectors� As most central banks continued to ease monetary policy, the US Federal Reserve increased the Fed fund rate by 25 basis points�
In comparison with its Organisation for Economic Co‑operation and Development peers, Australia’s economy was in line with most major economies experiencing stable yet moderate growth� Australia’s growth rate stood at an annual rate of 2�5 percent, inflation remained low at an annualised rate of 1�7 percent and unemployment fell to 5�8 percent� During the year, the Reserve Bank of Australia reduced the cash rate from 2�5 percent to 2 percent, reflecting in part concerns about the domestic economy’s ability to transition from mining to non‑mining sectors� Declining commodity prices and the continued strength of the US dollar precipitated an 11 percent depreciation of the Australian dollar�
The University’s long‑term funds portfolio, which had a total market value of approximately $1,179 million as at December 2015, recorded a strong positive return for the year (see the long‑term fund performance chart)� The long‑term funds portfolio outperformed its internal benchmark over the rolling one, three and five‑year periods� This outperformance reflects positive contributions from both asset allocation and security selection (manager selection)� Relative to the comparable TCorp Hour‑Glass Long Term Growth Facility (referred to as the statutory benchmark), the University’s long‑term fund outperformed over the rolling one‑year and rolling five‑year periods but underperformed over the rolling three‑year period� The underperformance of 0�1 percent over the rolling three‑year period reflects differences in asset allocation�
University Long Term Funds return
Long Term Funds approved benchmark
TCorp Hour-Glass Long Term Growth Facility
Notes:– University portfolio returns are after external management
fees and include franking credits. External management fees are approximately 70 basis points per annum for the long-term funds.
– Unless otherwise stated, reference to a benchmark in this report refers to a benchmark approved by the Investment and Commercialisation Committee, a committee of Senate.
– Statutory Benchmark refers to the NSW TCorp Hour-Glass Long Term Growth Facility. NSW TCorp reported returns are after external manager fees. These returns have been adjusted upwards to reflect performance before TCorp’s internal administration fees.
Aust
rali
an s
hare
s
Aust
rali
an s
mall
cap
s
Over
seas
sha
res
(UH)
Over
seas
sha
res
(H)
Over
seas
sma
ll c
aps
(UH)
Emer
ging
mar
kets
(UH
)
Dire
ct p
rope
rty
Aust
rali
an R
EITS
Glob
al R
EITS
(H)
Glob
al l
iste
d in
fr.
(UH)
Aust
rali
an f
ixed
inc
ome
Over
seas
fix
ed i
ncom
e (H
)
Cash
15
10
5
0
-5
2.8
10.211.8
12.6
-4.3
12.7
3.8
14.4
5.2
-1.8
2.63.6
2.3
15
10
5
0Rolling 12 months p.a. Rolling 3 years p.a. Rolling 5 years p.a.
7.36.5
5.5
12.111.512.2
10.1 9.5 9.3
Page
54
sydn
ey.e
du.a
uTh
e Un
iver
sity
of
Sydn
eyAn
nual
Rep
ort
2015

The following table provides a broader peer‑based comparison (on a ‘net of fees’ basis) of the University’s long‑term funds performance over the rolling one, three, and five‑year periods (annualised), including superannuation and pension funds�
Period University of SydneyLong‑Term funds
NSW T‑Corp, Long Term Growth Facility
Pension funds, Mercer Pension Balanced Growth, (60‑80% growth), Median
The Australian Government Future Fund
1 year 7�3% 5�7% 4�7% 8�5%3‑year pa 12�1% 12�5% 10�0% 13�0%5‑year pa 10�1% 9�5% 8�1% 10�6%
Note: All results are after underlying manager fees, and before administration costs.
7. Creditors’ payment performance
Quarter 2015 March June September DecemberActual Target Actual Target Actual Target Actual Target
Percentage of accounts paid on time:By number of invoices 90% 80% 93% 80% 96% 80% 96% 80%By value of invoices 94% 80% 96% 80% 91% 80% 97% 80%Amount of accounts paid on time (Excluding investments) $214�8M $230�1M $174�4M $234�0M
Total amount of accounts paid (Excluding iInvestments) $228�8M $239�2M $192�3M $242�5M
For enquiry on Payment on time Criteria, please contact the Procurement Operations Team.Performance excludes time delay factors attributed to invoices receipted directly by the business unit.
Page
55
Fina
ncia
l re
view
of
2015

8. Summary of real estate owned or occupied by the University
The University classifies its land and buildings into the following categories:
− teaching and research land − teaching and research leased land − commercial farms − student housing − commercial land�
Teaching and research land and propertiesThe major teaching and research facilities of the University, located on the Camperdown and Darlington campuses adjoining Parramatta Road and City Road in Sydney, cover a total of 50�6 hectares� The University has several teaching and research facilities in addition to these premises� University‑owned properties as at 31 December 2015 include:
− Cumberland Campus (Faculty of Health Sciences, East Street, Lidcombe)
− Brain and Mind Centre, Mallett Street, Camperdown
− Camden Campus (Faculty of Veterinary Science and Faculty of Agriculture and Environment)
− Australian Archaeological Institute at Athens and Thessaloniki, Greece
− University‑owned and commercially operated farms throughout eastern Australia (covering a total area of approximately 10,313 hectares) which support the teaching and research activities of the faculties of Agriculture and Environment, Veterinary Science and Science�
The University’s teaching and research facilities are classified into two sub‑categories� The non‑commercial teaching and research component represents land that is subject to specific restrictions� These include land grants, zoned special use and/or specific contractual arrangements� The book value of this land as at 31 December 2015, utilising the cost basis as defined in the accounting standards, was $178�3 million (2014: $161�7 million)�
The balance of the facilities held for teaching and research, which are not subject to specific usage constraints, are classified as commercial land� These properties are valued utilising the fair value basis as defined in the accounting standards and were valued at $209�9 million as at 31 December 2015 (2014: $182�4 million)�
The total value of land held by the University (teaching and research, and commercial) as at 31 December 2015 was $388�2 million (2014: $344�1 million)�
Teaching and research leased landThe University occupies a number of sites on long‑term leases, licences and agreements in New South Wales for entities including:
− Sydney College of the Arts at Rozelle − Sydney Conservatorium of Music in central Sydney − the Plant Breeding Institute at
Narrabri and other field stations − University teaching and research hospitals − Science facilities at Australian
Technology Park at Redfern�
Commercial farmsThe University operates two commercial farms that support teaching and research activities� The farms, which are located in the Liverpool plains and Southern Highlands regions of New South Wales, are valued on a fair value basis� The value of these farms was $16�5 million as at 31 December 2015 (2014: $18�6 million)�
Student housingThe University owns approximately 70 halls of residence in the vicinity of the Camperdown, Darlington, Cumberland and Camden campuses� Each of these properties provides student accommodation� In 2015, the University opened two new student accommodation facilities that increased total accommodation capacity by 1000 beds� The Queen Mary Building (800 beds) opened in July 2015, and the Abercrombie Student Accommodation (200 beds) opened in October 2015� In addition, the University owns an 18‑unit residential block at Kingswood that accommodates 44 students who are studying at the Nepean Clinical School at Penrith�
The student housing halls of residence were valued on a fair value basis as defined in the accounting standards at $184�5 million as at 31 December 2015 (2014: $91�7 million)�
Page
56
sydn
ey.e
du.a
uTh
e Un
iver
sity
of
Sydn
eyAn
nual
Rep
ort
2015

9. Overseas travelThe University paid $24�1 million for staff overseas travel in 2015 (2014: $22�1 million)� These payments supported a wide range of activities, including attendance and presentation of research papers at international conferences, staff development and research and teaching at affiliated institutions�
10. Financial statements for subsidiaries Please refer to note 38 of the financial statements for details of the University’s subsidiaries�
The financial statements for the subsidiaries will be available at sydney.edu.au/about-us/vision-and-values/annual-report.html once this annual report has been tabled in the NSW Parliament�
Page
57
Fina
ncia
l re
view
of
2015

Page
58
sydn
ey.e
du.a
uTh
e Un
iver
sity
of
Sydn
eyAn
nual
Rep
ort
2015

Page
59
Fina
ncia
l re
view
of
2015

Page
60
sydn
ey.e
du.a
uTh
e Un
iver
sity
of
Sydn
eyAn
nual
Rep
ort
2015

2015Annual FinancialStatements
Page
61
Fina
ncia
l Re
port
s an
d St
atem
ents
201
5

The University of SydneyIncome statement
for the year ended 31 December 2015
Economic entity(Consolidated)
Parent entity(University)
Note
2015
$'000
2014
$'000
2015
$'000
2014
$'000
Income from continuing operationsAustralian Government financialassistance
Australian Government grants 2 708,112 719,580 708,112 719,580HELP - Australian Governmentpayments
2 259,951 245,586 259,951 245,586
State and local government financialassistance
3 21,122 22,964 21,122 22,964
Fees and charges 4 608,128 497,309 607,400 496,972HECS-HELP - student payments 33,051 36,027 33,051 36,027Consultancy and contracts 6 102,256 95,913 102,256 95,913Investment revenue 5 104,505 82,413 104,011 82,307Royalties, trademarks and licences 5,634 2,351 5,634 2,351Other revenue 7 75,053 63,825 74,899 63,748
Total revenue from continuingoperations
1,917,812 1,765,968 1,916,436 1,765,448
Gain/(loss) on disposal of assets 8 31,674 81 31,674 77Share of profit/(loss) on investmentsaccounted for using the equity method 1,090 (235) 0 0Other investment income 5 (7,584) 34,143 (7,584) 34,143Other income 7 98,209 102,960 89,767 98,186
Total income from continuingoperations
2,041,201 1,902,917 2,030,293 1,897,854
Expenses from continuing operationsEmployee-related expenses 9 1,066,219 973,880 1,061,670 971,324Depreciation and amortisation 10 173,856 159,342 173,659 159,134Repairs and maintenance 11 71,005 74,870 70,724 74,431Borrowing costs 14 22,532 18,637 22,532 18,637Impairment of assets 12 1,231 540 974 443Grant and scholarship expenses 97,525 95,066 97,525 95,065Consultants and contractors 56,780 55,380 54,542 54,141Teaching and research grants 135,239 134,200 136,567 135,869Other expenses 13 256,961 229,302 253,870 227,636
Total expenses from continuingoperations
1,881,348 1,741,217 1,872,063 1,736,680
Net result before income tax* 159,853 161,700 158,230 161,174Less: income tax (benefit)/expense 15 55 105 0 0
Net result after income tax 159,798 161,595 158,230 161,174
Net result attributable to members ofThe University of Sydney 159,798 161,595 158,230 161,174
* Includes net result for 2015 of $69,641k (2014: $66,850k) received from sources with specific restrictions in use (refer to Note 29'Restricted funds').
The above income statement should be read in conjunction with the accompanying notes.
1
The University of SydneyStatement of comprehensive income
for the year ended 31 December 2015
Economic entity(Consolidated)
Parent entity(University)
Notes
2015
$'000
2014
$'000
2015
$'000
2014
$'000
Net result after income tax 159,798 161,595 158,230 161,174
Items that may be reclassified to profit orloss
Valuation movement on hedge reserve 30(a) 1,972 (1,625) 1,972 (1,625)
Total 1,972 (1,625) 1,972 (1,625)
Items that will not be reclassified to profitor loss
Gains on revaluation of property, plant andequipment
30(a) 48,094 39,981 48,050 39,981
Distributions from subsidiary 30(b) 0 0 320 0Net actuarial gains/(losses) recognised inrespect of defined benefit plans
30(b) (2,646) (7,966) (2,646) (7,966)
Reserve transfer relating to associates andjoint ventures, net of tax
30(a) (425) (5) 0 0
Total 45,023 32,010 45,724 32,015
Total other comprehensive income 46,995 30,385 47,696 30,390
Total comprehensive income 206,793 191,980 205,926 191,564
Total comprehensive income attributable tomembers of The University of Sydney 206,793 191,980 205,926 191,564
The above statement of comprehensive income should be read in conjunction with the accompanying notes.
2Page
62
sydn
ey.e
du.a
uTh
e Un
iver
sity
of
Sydn
eyAn
nual
Rep
ort
2015
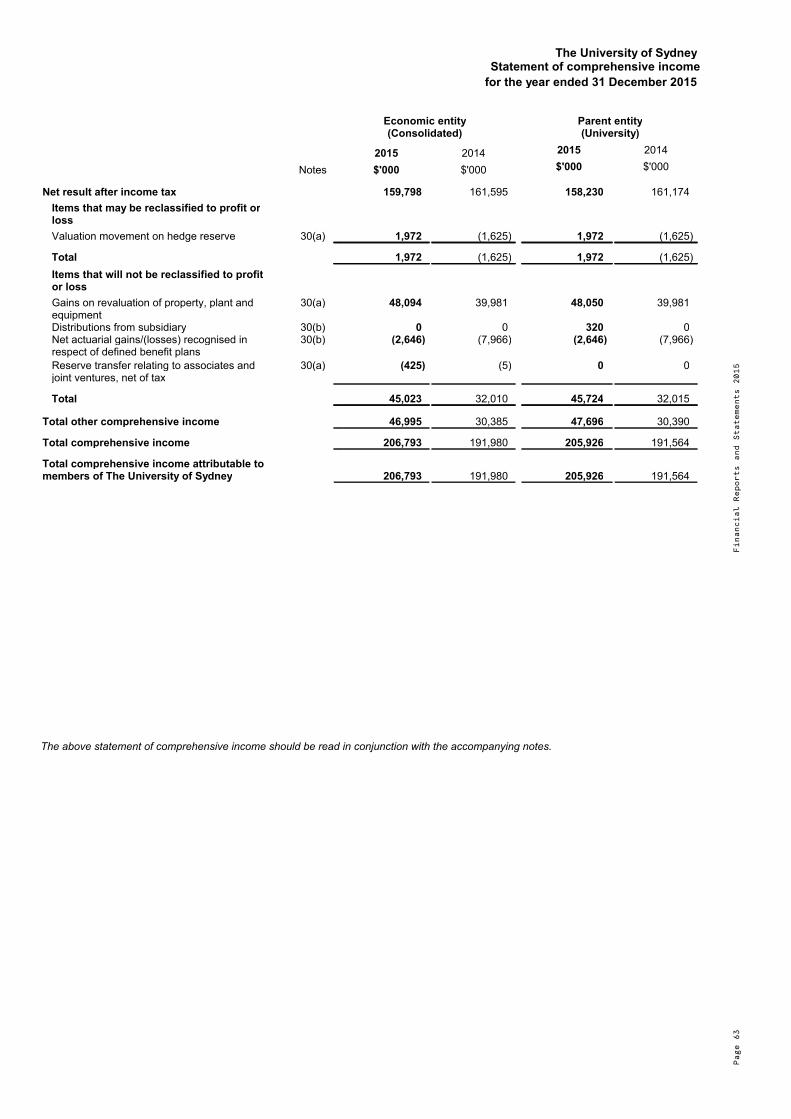
The University of SydneyIncome statement
for the year ended 31 December 2015
Economic entity(Consolidated)
Parent entity(University)
Note
2015
$'000
2014
$'000
2015
$'000
2014
$'000
Income from continuing operationsAustralian Government financialassistance
Australian Government grants 2 708,112 719,580 708,112 719,580HELP - Australian Governmentpayments
2 259,951 245,586 259,951 245,586
State and local government financialassistance
3 21,122 22,964 21,122 22,964
Fees and charges 4 608,128 497,309 607,400 496,972HECS-HELP - student payments 33,051 36,027 33,051 36,027Consultancy and contracts 6 102,256 95,913 102,256 95,913Investment revenue 5 104,505 82,413 104,011 82,307Royalties, trademarks and licences 5,634 2,351 5,634 2,351Other revenue 7 75,053 63,825 74,899 63,748
Total revenue from continuingoperations
1,917,812 1,765,968 1,916,436 1,765,448
Gain/(loss) on disposal of assets 8 31,674 81 31,674 77Share of profit/(loss) on investmentsaccounted for using the equity method 1,090 (235) 0 0Other investment income 5 (7,584) 34,143 (7,584) 34,143Other income 7 98,209 102,960 89,767 98,186
Total income from continuingoperations
2,041,201 1,902,917 2,030,293 1,897,854
Expenses from continuing operationsEmployee-related expenses 9 1,066,219 973,880 1,061,670 971,324Depreciation and amortisation 10 173,856 159,342 173,659 159,134Repairs and maintenance 11 71,005 74,870 70,724 74,431Borrowing costs 14 22,532 18,637 22,532 18,637Impairment of assets 12 1,231 540 974 443Grant and scholarship expenses 97,525 95,066 97,525 95,065Consultants and contractors 56,780 55,380 54,542 54,141Teaching and research grants 135,239 134,200 136,567 135,869Other expenses 13 256,961 229,302 253,870 227,636
Total expenses from continuingoperations
1,881,348 1,741,217 1,872,063 1,736,680
Net result before income tax* 159,853 161,700 158,230 161,174Less: income tax (benefit)/expense 15 55 105 0 0
Net result after income tax 159,798 161,595 158,230 161,174
Net result attributable to members ofThe University of Sydney 159,798 161,595 158,230 161,174
* Includes net result for 2015 of $69,641k (2014: $66,850k) received from sources with specific restrictions in use (refer to Note 29'Restricted funds').
The above income statement should be read in conjunction with the accompanying notes.
1
The University of SydneyStatement of comprehensive income
for the year ended 31 December 2015
Economic entity(Consolidated)
Parent entity(University)
Notes
2015
$'000
2014
$'000
2015
$'000
2014
$'000
Net result after income tax 159,798 161,595 158,230 161,174
Items that may be reclassified to profit orloss
Valuation movement on hedge reserve 30(a) 1,972 (1,625) 1,972 (1,625)
Total 1,972 (1,625) 1,972 (1,625)
Items that will not be reclassified to profitor loss
Gains on revaluation of property, plant andequipment
30(a) 48,094 39,981 48,050 39,981
Distributions from subsidiary 30(b) 0 0 320 0Net actuarial gains/(losses) recognised inrespect of defined benefit plans
30(b) (2,646) (7,966) (2,646) (7,966)
Reserve transfer relating to associates andjoint ventures, net of tax
30(a) (425) (5) 0 0
Total 45,023 32,010 45,724 32,015
Total other comprehensive income 46,995 30,385 47,696 30,390
Total comprehensive income 206,793 191,980 205,926 191,564
Total comprehensive income attributable tomembers of The University of Sydney 206,793 191,980 205,926 191,564
The above statement of comprehensive income should be read in conjunction with the accompanying notes.
2 Page
63
Fina
ncia
l Re
port
s an
d St
atem
ents
201
5

The University of SydneyStatement of financial position
as at 31 December 2015
Economic entity(Consolidated)
Parent entity(University)
Notes
2015
$'000
2014
$'000
2015
$'000
2014
$'000
ASSETSCurrent assets
Cash and cash equivalents 16 354,672 383,722 351,725 382,042Receivables 17 66,430 80,904 67,874 80,714Inventories 19 179 280 179 249Other financial assets 20 36,344 21,181 36,344 21,181Assets held for sale 18 600 14,412 600 14,412Other non-financial assets 24 23,315 27,246 23,186 27,146
Total current assets 481,540 527,745 479,908 525,744
Non-current assetsReceivables 17 1,570,366 1,508,100 1,570,366 1,508,100Investments accounted for using the equitymethod
40 5,998 4,833 0 0
Other financial assets 20 1,138,392 1,017,171 1,146,392 1,024,671Property, plant and equipment 21 3,341,252 3,125,279 3,340,352 3,124,242Deferred tax assets 23 291 215 0 0Intangible assets 22 167,314 162,916 161,185 156,787Other non-financial assets 24 19,338 18,594 19,338 18,594
Total non-current assets 6,242,951 5,837,108 6,237,633 5,832,394
Total assets 6,724,491 6,364,853 6,717,541 6,358,138
LIABILITIESCurrent liabilities
Trade and other payables 25 183,625 178,912 183,922 178,544Provisions 28 209,691 193,452 208,881 193,169Income tax payable 0 428 0 0Derivative financial instruments 27 1,186 2,385 1,186 2,385
Total current liabilities 394,502 375,177 393,989 374,098
Non-current liabilitiesBorrowings 26 504,336 438,139 504,336 438,139Derivative financial instruments 27 1,767 2,540 1,767 2,540Provisions 28 1,615,428 1,547,332 1,615,428 1,547,266
Total non-current liabilities 2,121,531 1,988,011 2,121,531 1,987,945
Total liabilities 2,516,033 2,363,188 2,515,520 2,362,043
Net assets 4,208,458 4,001,665 4,202,021 3,996,095
EQUITYParent entity interest
Restricted funds 29 1,057,362 987,721 1,057,362 987,721Reserves 30(a) 406,566 356,925 405,054 355,032Retained earnings 30(b) 2,744,530 2,657,019 2,739,605 2,653,342
Total equity 4,208,458 4,001,665 4,202,021 3,996,095
The above statement of financial position should be read in conjunction with the accompanying notes.
3Page
64
sydn
ey.e
du.a
uTh
e Un
iver
sity
of
Sydn
eyAn
nual
Rep
ort
2015

The University of SydneyStatement of financial position
as at 31 December 2015
Economic entity(Consolidated)
Parent entity(University)
Notes
2015
$'000
2014
$'000
2015
$'000
2014
$'000
ASSETSCurrent assets
Cash and cash equivalents 16 354,672 383,722 351,725 382,042Receivables 17 66,430 80,904 67,874 80,714Inventories 19 179 280 179 249Other financial assets 20 36,344 21,181 36,344 21,181Assets held for sale 18 600 14,412 600 14,412Other non-financial assets 24 23,315 27,246 23,186 27,146
Total current assets 481,540 527,745 479,908 525,744
Non-current assetsReceivables 17 1,570,366 1,508,100 1,570,366 1,508,100Investments accounted for using the equitymethod
40 5,998 4,833 0 0
Other financial assets 20 1,138,392 1,017,171 1,146,392 1,024,671Property, plant and equipment 21 3,341,252 3,125,279 3,340,352 3,124,242Deferred tax assets 23 291 215 0 0Intangible assets 22 167,314 162,916 161,185 156,787Other non-financial assets 24 19,338 18,594 19,338 18,594
Total non-current assets 6,242,951 5,837,108 6,237,633 5,832,394
Total assets 6,724,491 6,364,853 6,717,541 6,358,138
LIABILITIESCurrent liabilities
Trade and other payables 25 183,625 178,912 183,922 178,544Provisions 28 209,691 193,452 208,881 193,169Income tax payable 0 428 0 0Derivative financial instruments 27 1,186 2,385 1,186 2,385
Total current liabilities 394,502 375,177 393,989 374,098
Non-current liabilitiesBorrowings 26 504,336 438,139 504,336 438,139Derivative financial instruments 27 1,767 2,540 1,767 2,540Provisions 28 1,615,428 1,547,332 1,615,428 1,547,266
Total non-current liabilities 2,121,531 1,988,011 2,121,531 1,987,945
Total liabilities 2,516,033 2,363,188 2,515,520 2,362,043
Net assets 4,208,458 4,001,665 4,202,021 3,996,095
EQUITYParent entity interest
Restricted funds 29 1,057,362 987,721 1,057,362 987,721Reserves 30(a) 406,566 356,925 405,054 355,032Retained earnings 30(b) 2,744,530 2,657,019 2,739,605 2,653,342
Total equity 4,208,458 4,001,665 4,202,021 3,996,095
The above statement of financial position should be read in conjunction with the accompanying notes.
3
Th
e U
niv
ers
ity o
f S
yd
ne
yS
tate
me
nt
of
ch
an
ge
s i
n e
qu
ity
for
the
ye
ar
en
de
d 3
1 D
ec
em
be
r 2
01
5
Ec
on
om
icen
tity
(C
on
so
lid
ate
d)
Pare
nt
en
tity
(U
niv
ers
ity)
2014
Restr
icte
dfu
nd
s
$'0
00
Reserv
es
$'0
00
Reta
ined
ea
rnin
gs
$'0
00
To
tal
$'0
00
Restr
icte
dfu
nd
s
$'0
00
Reserv
es
$'0
00
Reta
ined
ea
rnin
gs
$'0
00
To
tal
$'0
00
Bala
nce a
t 1 J
an
uary
2014
920,8
71
318,5
74
2,5
70,2
40
3,8
09,6
85
920,8
71
316,6
76
2,5
66,9
84
3,8
04,5
31
Ne
t re
su
lt a
fte
r in
co
me
ta
x66,8
50
094,7
45
161,5
95
66,8
50
094,3
24
161,1
74
Reva
luatio
n o
f pro
pert
y, p
lant and e
quip
ment
039,9
81
039,9
81
039,9
81
039,9
81
Rese
rve tra
nsf
er
rela
ting to jo
int ve
ntu
re0
(5)
0(5
)0
00
0A
ctu
aria
l ga
ins/(
losse
s)
on
de
fin
ed
be
ne
fit
pla
ns
00
(7,9
66)
(7,9
66)
00
(7,9
66)
(7,9
66)
Va
lua
tio
n m
ove
me
nt
on
he
dg
e r
ese
rve
0(1
,625)
0(1
,625)
0(1
,625)
0(1
,625)
To
tal
co
mp
reh
en
siv
e i
nc
om
e66,8
50
38,3
51
86,7
79
191,9
80
66,8
50
38,3
56
86,3
58
191,5
64
Bala
nce a
t31 D
ecem
ber
2014
987,7
21
356,9
25
2,6
57,0
19
4,0
01,6
65
987,7
21
355,0
32
2,6
53,3
42
3,9
96,0
95
Ec
on
om
ic e
nti
ty (
Co
ns
oli
da
ted
)P
are
nt
en
tity
(U
niv
ers
ity)
2015
Restr
icte
dfu
nd
s
$'0
00
Reserv
es
$'0
00
Reta
ined
ea
rnin
gs
$'0
00
To
tal
$'0
00
Restr
icte
dfu
nd
s
$'0
00
Reserv
es
$'0
00
Reta
ined
ea
rnin
gs
$'0
00
To
tal
$'0
00
Bala
nce a
t 1 J
an
uary
2015
987,7
21
356,9
25
2,6
57,0
19
4,0
01,6
65
987,7
21
355,0
32
2,6
53,3
42
3,9
96,0
95
Ne
t re
su
lt a
fte
r in
co
me
ta
x69,6
41
090,1
57
159,7
98
69,6
41
088,5
89
158,2
30
Reva
luatio
n o
f pro
pert
y, p
lant and e
quip
ment
048,0
94
048,0
94
048,0
50
048,0
50
Rese
rve tra
nsf
err
ed to r
eta
ined e
arn
ings
0(4
25)
0(4
25)
00
00
Actu
aria
l ga
ins/(
losse
s)
on
de
fin
ed
be
ne
fit
pla
ns
00
(2,6
46)
(2,6
46)
00
(2,6
46)
(2,6
46)
Va
lua
tio
n m
ove
me
nt
on
he
dg
e r
ese
rve
01,9
72
01,9
72
01,9
72
01,9
72
Dis
trib
utio
n f
rom
su
bsid
iary
00
00
00
320
320
To
tal
co
mp
reh
en
siv
e i
nc
om
e69,6
41
49,6
41
87,5
11
206,7
93
69,6
41
50,0
22
86,2
63
205,9
26
Bala
nce a
t31 D
ecem
ber
2015
1,0
57,3
62
406,5
66
2,7
44,5
30
4,2
08,4
58
1,0
57,3
62
405,0
54
2,7
39,6
05
4,2
02,0
21
Th
e a
bo
ve
sta
tem
en
t o
f ch
an
ge
s in
eq
uity
sh
ou
ld b
e r
ea
d in
co
nju
nct
ion
with
th
e a
cco
mp
an
yin
g n
ote
s.
4Pa
ge 6
5Fi
nanc
ial
Repo
rts
and
Stat
emen
ts 2
015
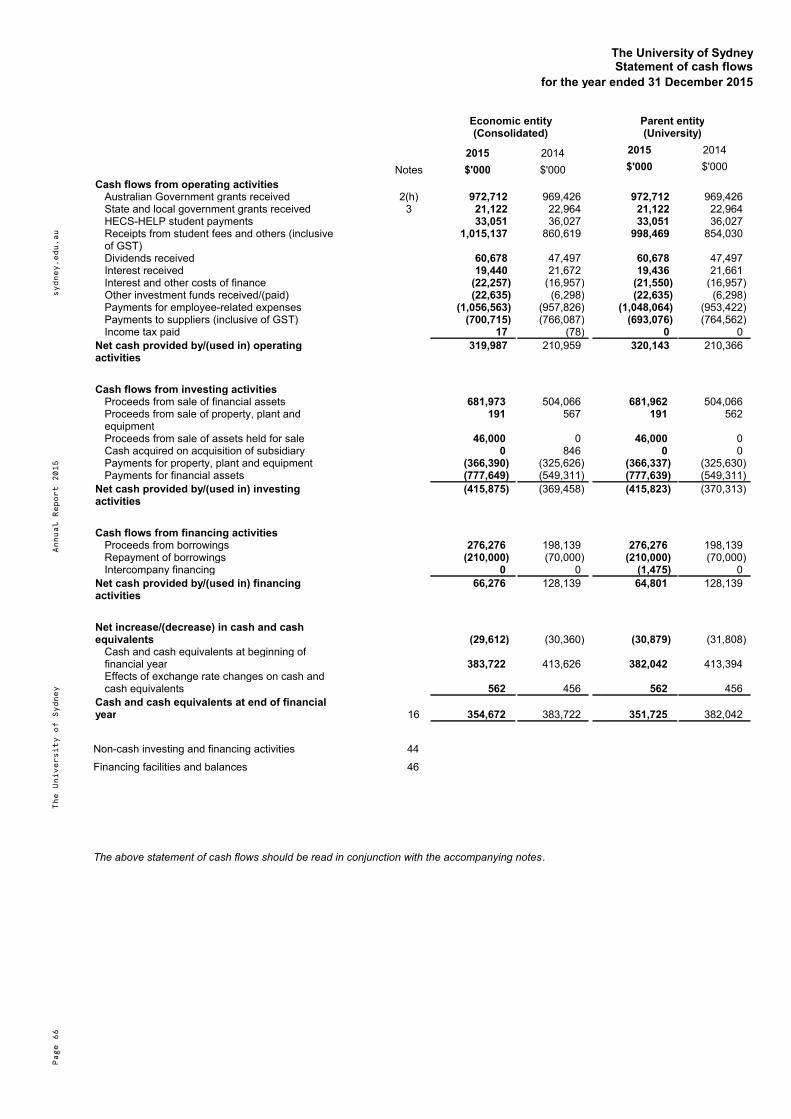
The University of SydneyStatement of cash flows
for the year ended 31 December 2015
Economic entity(Consolidated)
Parent entity(University)
Notes
2015
$'000
2014
$'000
2015
$'000
2014
$'000
Cash flows from operating activitiesAustralian Government grants received 2(h) 972,712 969,426 972,712 969,426State and local government grants received 3 21,122 22,964 21,122 22,964HECS-HELP student payments 33,051 36,027 33,051 36,027Receipts from student fees and others (inclusiveof GST)
1,015,137 860,619 998,469 854,030
Dividends received 60,678 47,497 60,678 47,497Interest received 19,440 21,672 19,436 21,661Interest and other costs of finance (22,257) (16,957) (21,550) (16,957)
Other investment funds received/(paid) (22,635) (6,298) (22,635) (6,298)Payments for employee-related expenses (1,056,563) (957,826) (1,048,064) (953,422)Payments to suppliers (inclusive of GST) (700,715) (766,087) (693,076) (764,562)Income tax paid 17 (78) 0 0
Net cash provided by/(used in) operatingactivities
319,987 210,959 320,143 210,366
Cash flows from investing activitiesProceeds from sale of financial assets 681,973 504,066 681,962 504,066Proceeds from sale of property, plant andequipment
191 567 191 562
Proceeds from sale of assets held for sale 46,000 0 46,000 0Cash acquired on acquisition of subsidiary 0 846 0 0Payments for property, plant and equipment (366,390) (325,626) (366,337) (325,630)Payments for financial assets (777,649) (549,311) (777,639) (549,311)
Net cash provided by/(used in) investingactivities
(415,875) (369,458) (415,823) (370,313)
Cash flows from financing activitiesProceeds from borrowings 276,276 198,139 276,276 198,139Repayment of borrowings (210,000) (70,000) (210,000) (70,000)Intercompany financing 0 0 (1,475) 0
Net cash provided by/(used in) financingactivities
66,276 128,139 64,801 128,139
Net increase/(decrease) in cash and cashequivalents (29,612) (30,360) (30,879) (31,808)
Cash and cash equivalents at beginning offinancial year 383,722 413,626 382,042 413,394Effects of exchange rate changes on cash andcash equivalents 562 456 562 456
Cash and cash equivalents at end of financialyear 16 354,672 383,722 351,725 382,042
Non-cash investing and financing activities 44
Financing facilities and balances 46
The above statement of cash flows should be read in conjunction with the accompanying notes.
5 6
The University of SydneyNotes to the financial statements
for the year ended 31 December 2015
Note Contents of the notes to the financial statements Page
1 Summary of significant accounting policies 7
Revenue2 Australian Government financial assistance including Australian Government loan programs (HELP) 203 State and local government financial assistance 224 Fees and charges 235 Investment revenue and income 236 Consultancy and contracts 237 Other revenue and income 248 Gain/(loss) on disposal of assets 24
Expenses9 Employee-related expenses 25
10 Depreciation and amortisation 2511 Repairs and maintenance 2612 Impairment of assets 2613 Other expenses 2614 Borrowing costs 2615 Income tax 27
Assets16 Cash and cash equivalents 2717 Receivables 2818 Assets held for sale 3019 Inventories 3020 Other financial assets 3121 Property, plant and equipment 3222 Intangible assets 3623 Deferred tax assets 3824 Other non-financial assets 38
Liabilities25 Trade and other payables 3926 Borrowings 3927 Derivative financial instruments 4028 Provisions 41
Equity29 Restricted funds 4330 Reserves and retained earnings 44
Disclosure notes31 Key management personnel disclosures 4432 Remuneration of auditors 4633 Commitments 4634 Contingencies 4735 Amounts owing by Commonwealth and New South Wales governments 4836 Defined benefit plans 4837 Business combinations 5238 Subsidiaries 5339 Joint operations 5340 Investments accounted for using the equity method 5441 Reconciliation of net result after income tax to net cash provided by/(used in) operating
activities 5542 Financial risk management 5543 Fair value measurement 5944 Non-cash investing and financing activities 6345 Events occurring after the balance sheet date 6346 Financing facilities and balances 6447 Acquittal of Australian Government financial assistance 6548 Disaggregated information (dual sector and/or operations outside Australia) 70
Page
66
sydn
ey.e
du.a
uTh
e Un
iver
sity
of
Sydn
eyAn
nual
Rep
ort
2015

The University of SydneyStatement of cash flows
for the year ended 31 December 2015
Economic entity(Consolidated)
Parent entity(University)
Notes
2015
$'000
2014
$'000
2015
$'000
2014
$'000
Cash flows from operating activitiesAustralian Government grants received 2(h) 972,712 969,426 972,712 969,426State and local government grants received 3 21,122 22,964 21,122 22,964HECS-HELP student payments 33,051 36,027 33,051 36,027Receipts from student fees and others (inclusiveof GST)
1,015,137 860,619 998,469 854,030
Dividends received 60,678 47,497 60,678 47,497Interest received 19,440 21,672 19,436 21,661Interest and other costs of finance (22,257) (16,957) (21,550) (16,957)
Other investment funds received/(paid) (22,635) (6,298) (22,635) (6,298)Payments for employee-related expenses (1,056,563) (957,826) (1,048,064) (953,422)Payments to suppliers (inclusive of GST) (700,715) (766,087) (693,076) (764,562)Income tax paid 17 (78) 0 0
Net cash provided by/(used in) operatingactivities
319,987 210,959 320,143 210,366
Cash flows from investing activitiesProceeds from sale of financial assets 681,973 504,066 681,962 504,066Proceeds from sale of property, plant andequipment
191 567 191 562
Proceeds from sale of assets held for sale 46,000 0 46,000 0Cash acquired on acquisition of subsidiary 0 846 0 0Payments for property, plant and equipment (366,390) (325,626) (366,337) (325,630)Payments for financial assets (777,649) (549,311) (777,639) (549,311)
Net cash provided by/(used in) investingactivities
(415,875) (369,458) (415,823) (370,313)
Cash flows from financing activitiesProceeds from borrowings 276,276 198,139 276,276 198,139Repayment of borrowings (210,000) (70,000) (210,000) (70,000)Intercompany financing 0 0 (1,475) 0
Net cash provided by/(used in) financingactivities
66,276 128,139 64,801 128,139
Net increase/(decrease) in cash and cashequivalents (29,612) (30,360) (30,879) (31,808)
Cash and cash equivalents at beginning offinancial year 383,722 413,626 382,042 413,394Effects of exchange rate changes on cash andcash equivalents 562 456 562 456
Cash and cash equivalents at end of financialyear 16 354,672 383,722 351,725 382,042
Non-cash investing and financing activities 44
Financing facilities and balances 46
The above statement of cash flows should be read in conjunction with the accompanying notes.
5 6
The University of SydneyNotes to the financial statements
for the year ended 31 December 2015
Note Contents of the notes to the financial statements Page
1 Summary of significant accounting policies 7
Revenue2 Australian Government financial assistance including Australian Government loan programs (HELP) 203 State and local government financial assistance 224 Fees and charges 235 Investment revenue and income 236 Consultancy and contracts 237 Other revenue and income 248 Gain/(loss) on disposal of assets 24
Expenses9 Employee-related expenses 25
10 Depreciation and amortisation 2511 Repairs and maintenance 2612 Impairment of assets 2613 Other expenses 2614 Borrowing costs 2615 Income tax 27
Assets16 Cash and cash equivalents 2717 Receivables 2818 Assets held for sale 3019 Inventories 3020 Other financial assets 3121 Property, plant and equipment 3222 Intangible assets 3623 Deferred tax assets 3824 Other non-financial assets 38
Liabilities25 Trade and other payables 3926 Borrowings 3927 Derivative financial instruments 4028 Provisions 41
Equity29 Restricted funds 4330 Reserves and retained earnings 44
Disclosure notes31 Key management personnel disclosures 4432 Remuneration of auditors 4633 Commitments 4634 Contingencies 4735 Amounts owing by Commonwealth and New South Wales governments 4836 Defined benefit plans 4837 Business combinations 5238 Subsidiaries 5339 Joint operations 5340 Investments accounted for using the equity method 5441 Reconciliation of net result after income tax to net cash provided by/(used in) operating
activities 5542 Financial risk management 5543 Fair value measurement 5944 Non-cash investing and financing activities 6345 Events occurring after the balance sheet date 6346 Financing facilities and balances 6447 Acquittal of Australian Government financial assistance 6548 Disaggregated information (dual sector and/or operations outside Australia) 70
Page
67
Fina
ncia
l Re
port
s an
d St
atem
ents
201
5

The University of SydneyNotes to the financial statements
for the year ended 31 December 2015
(continued)
1 Summary of significant accounting policies (continued)
(b) Basis of consolidation (continued)
Intragroup assets, liabilities, equity, income, expenses and cashflows relating to transactions between entities in the consolidatedentity have been eliminated in full for the purpose of these financial statements.
Appropriate adjustments have been made to a controlled entity’s financial position, performance and cash flows where the accountingpolicies used by that entity were different from those adopted by the consolidated entity. All controlled entities have a 31 Decemberfinancial year end.
A list of controlled entities is contained in Note 38 to the financial statements.
(i) Subsidiaries
Subsidiaries are all entities (including structured entities) over which the parent has control. Control is established when the parent isexposed to or has rights to variable returns from its involvement with the entity and has the ability to affect those returns through itspower to direct the relevant activities of the entity.
(ii) Joint arrangements
Joint operations:
The University's share of assets, liabilities, revenue and expenses of a joint operation have been incorporated in the financialstatements under the appropriate headings. Details of the joint operations are set out in Note 39.
Joint ventures:
Joint ventures are those joint arrangements which provide the venturer with rights to the net assets of the arrangements. Interests injoint ventures are accounted for using the equity method in accordance with AASB 128 'Investments in Associates and JointVentures'. Under this method, the investment is initially recognised at cost and the carrying amount is increased or decreased torecognise the investor’s share of the profit or loss and other comprehensive income of the investee after the date of acquisition.
If the venturer’s share of losses of a joint venture equals or exceeds its interest in the joint venture, the venturer discontinuesrecognising its share of further losses.
The venturer’s share in the joint venture's gains or losses arising from transactions between a venturer and its joint venture areeliminated.
Adjustments are made to the joint venture's accounting policies where they are different from those of the venturer for the purpose ofthe consolidated financial statements.
(iii) Associates
Associates are entities over which the University has significant influence, generally accompanying a shareholding of between twentypercent and fifty percent of the voting rights. Investments in associates are accounted for in the parent entity using the cost methodand in the consolidated financial statements using the equity method of accounting.
The University's share of an associate's post-acquisition profits or losses is recognised in the income statement and its share of postacquisition movements in reserves is recognised in the associates' reserve. The cumulative post-acquisition movements are adjustedagainst the carrying amount of the investment.
Dividends received from associates are recognised in the parent entity's income statement, while in the consolidated financialstatements they reduce the carrying amount of the investment.
When the economic entity's share of losses in an associate equals or exceeds its interest in the associate, including any otherunsecured receivables, the company does not recognise further losses, unless it has incurred obligations or made payments onbehalf of the associate.
(c) Adoption of new and revised accounting standards
The economic entity has adopted the following new and revised standards and interpretations that are relevant to its operations and effective for the current reporting period.
(i) Impact of the full early adoption of AASB 9 'Financial Instruments'
The University, having adopted the classification and measurement chapters of AASB 9 in 2012, has, following a review of otherchapters, fully adopted AASB 9 in 2014. AASB 9 is mandatory for adoption as of 1 January 2018. There is no material impact of thisdecision on the financial position or performance of the University.
8Page
68
sydn
ey.e
du.a
uTh
e Un
iver
sity
of
Sydn
eyAn
nual
Rep
ort
2015

The University of SydneyNotes to the financial statements
for the year ended 31 December 2015
(continued)
1 Summary of significant accounting policies (continued)
(b) Basis of consolidation (continued)
Intragroup assets, liabilities, equity, income, expenses and cashflows relating to transactions between entities in the consolidatedentity have been eliminated in full for the purpose of these financial statements.
Appropriate adjustments have been made to a controlled entity’s financial position, performance and cash flows where the accountingpolicies used by that entity were different from those adopted by the consolidated entity. All controlled entities have a 31 Decemberfinancial year end.
A list of controlled entities is contained in Note 38 to the financial statements.
(i) Subsidiaries
Subsidiaries are all entities (including structured entities) over which the parent has control. Control is established when the parent isexposed to or has rights to variable returns from its involvement with the entity and has the ability to affect those returns through itspower to direct the relevant activities of the entity.
(ii) Joint arrangements
Joint operations:
The University's share of assets, liabilities, revenue and expenses of a joint operation have been incorporated in the financialstatements under the appropriate headings. Details of the joint operations are set out in Note 39.
Joint ventures:
Joint ventures are those joint arrangements which provide the venturer with rights to the net assets of the arrangements. Interests injoint ventures are accounted for using the equity method in accordance with AASB 128 'Investments in Associates and JointVentures'. Under this method, the investment is initially recognised at cost and the carrying amount is increased or decreased torecognise the investor’s share of the profit or loss and other comprehensive income of the investee after the date of acquisition.
If the venturer’s share of losses of a joint venture equals or exceeds its interest in the joint venture, the venturer discontinuesrecognising its share of further losses.
The venturer’s share in the joint venture's gains or losses arising from transactions between a venturer and its joint venture areeliminated.
Adjustments are made to the joint venture's accounting policies where they are different from those of the venturer for the purpose ofthe consolidated financial statements.
(iii) Associates
Associates are entities over which the University has significant influence, generally accompanying a shareholding of between twentypercent and fifty percent of the voting rights. Investments in associates are accounted for in the parent entity using the cost methodand in the consolidated financial statements using the equity method of accounting.
The University's share of an associate's post-acquisition profits or losses is recognised in the income statement and its share of postacquisition movements in reserves is recognised in the associates' reserve. The cumulative post-acquisition movements are adjustedagainst the carrying amount of the investment.
Dividends received from associates are recognised in the parent entity's income statement, while in the consolidated financialstatements they reduce the carrying amount of the investment.
When the economic entity's share of losses in an associate equals or exceeds its interest in the associate, including any otherunsecured receivables, the company does not recognise further losses, unless it has incurred obligations or made payments onbehalf of the associate.
(c) Adoption of new and revised accounting standards
The economic entity has adopted the following new and revised standards and interpretations that are relevant to its operations and effective for the current reporting period.
(i) Impact of the full early adoption of AASB 9 'Financial Instruments'
The University, having adopted the classification and measurement chapters of AASB 9 in 2012, has, following a review of otherchapters, fully adopted AASB 9 in 2014. AASB 9 is mandatory for adoption as of 1 January 2018. There is no material impact of thisdecision on the financial position or performance of the University.
8 Page
69
Fina
ncia
l Re
port
s an
d St
atem
ents
201
5

The University of SydneyNotes to the financial statements
for the year ended 31 December 2015
(continued)
1 Summary of significant accounting policies (continued)
(d) Income tax
The University is exempt from income tax under subdivision 50-B of the Income Tax Assessment Act 1997. Within the consolidatedentity there are entities that are not exempt from income tax. For these entities, the income tax expense or revenue for the period isthe tax payable on the current period's taxable income, adjusted by changes in deferred tax assets and liabilities attributable totemporary differences between the tax bases of assets and liabilities and their carrying amounts in the financial statements, and tounused tax losses.
Deferred income tax is provided in full, using the liability method, on temporary differences arising between the tax bases of assetsand liabilities and their carrying amounts in the consolidated financial statements. However, the deferred income tax is not accountedfor if it arises from initial recognition of an asset or liability in a transaction other than a business combination that at the time of thetransaction affects neither accounting nor taxable profit or loss. Deferred income tax is determined using tax rates (and laws) thathave been enacted or substantially enacted by the statement of financial position date and are expected to apply when the relateddeferred income tax asset is realised or the deferred income tax liability is settled.
Deferred tax assets are recognised for deductible temporary differences and unused tax losses, only if it is probable that futuretaxable amounts will be available to utilise those temporary differences and losses.
Deferred tax liabilities and assets are not recognised for temporary differences between the carrying amount and tax bases ofinvestments in controlled entities where the parent entity is able to control the timing of the reversal of the temporary differences and itis probable that the differences will not reverse in the foreseeable future.
Current and deferred tax assets and liabilities relating to the same taxation authority are offset when there is a legally enforceableright to offset current tax assets and liabilities and they are intended to be either settled on a net basis, or the asset is to be realisedand the liability settled simultaneously.
(e) Business combinations
Business combinations are accounted for using the acquisition method. The consideration transferred in a business combination ismeasured at fair value, which is calculated as the sum of the acquisition date fair values of the assets transferred by the acquirer, theliabilities incurred by the acquirer to former owners of the acquiree and the equity by the acquirer, and the amount of any non-controlling interest in the acquiree. For each business combination, the acquirer measures the non-controlling interest in the acquireeat fair value or at the proportionate share of the acquiree's identifiable assets. Acquisition-related costs are expensed as incurred. Theexcess at the acquisition date of the aggregate of the consideration transferred, the amount of any non-controlling interest and anypreviously held equity interest in the acquiree, over the net amounts of identifiable assets acquired and liabilities assumed isrecognised as goodwill (refer to note1(u)). If the cost of acquisition is less than the fair value of the identifiable net assets of thesubsidiary acquired, the difference is recognised directly in the income statement of the acquirer but only after a reassessment of theidentification and measurement of the net assets acquired.
When the parent acquires a business, it assesses the financial assets and liabilities assumed for appropriate classification anddesignation in accordance with the contractual terms, economic conditions, the parent's operating or accounting policies and otherpertinent conditions as at the acquisition date. This includes the separation of embedded derivatives in host contracts by the acquiree.
If the business combination is achieved in stages, the acquisition date fair value of the acquirer's previously held equity interest in theacquiree is remeasured at fair value as at the acquisition date through profit or loss.
(f) Revenue recognition
(i) Operating revenue
The University's operating activity income primarily consists of Commonwealth grants, Higher Education Contribution Scheme(HECS-HELP) Commonwealth payments, Higher Education Loan Program (FEE-HELP) student payments, New South Wales StateGovernment grants, other research grants, consultancy and contract research income, investment income, and fees and charges.
Revenue is recognised where it can be reliably measured. Amounts disclosed as revenue are net of returns, trade allowances andduties and taxes.
(ii) Government grants
The University treats operating grants received from Australian Government entities as income in the year of receipt, irrespective ofwhether more grants have been expended in the year of receipt.
The grants are recognised at their fair value when the University obtains control of the right to receive a grant, it is probable thateconomic benefits will flow to the University and it can be reliably measured.
9
The University of SydneyNotes to the financial statements
for the year ended 31 December 2015
(continued)
1 Summary of significant accounting policies (continued)
(f) Revenue recognition (continued)
(iii) Fees and charges
Student fees are recognised as revenue in the relevant session. Revenue from rendering services is recognised in the period in whichthe service is provided, having regard to the stage of completion of the service.
(iv) Investment income
Investment income is recognised as it is earned.
(v) Rental income
Rental income is recognised as it is earned over the period that the properties are leased to third parties.
(vi) Asset sales
Net realised gains/(losses) are included as income/(expenses) and are further analysed in Note 8.
(vii) Other revenue and income
Represents donations, bequests and contributions from external organisations and miscellaneous income not derived from coreoperations which are recognised when the University becomes entitled to receive the contribution and the contribution can be reliablymeasured. Miscellaneous income is brought to account as it is earned and is recognised when the goods and services are provided.
(g) Goods and services tax (GST)
Revenues, expenses and assets are recognised net of the amount of GST, except where the amount of GST incurred is notrecoverable from the Australian Taxation Office (ATO). In these circumstances, the GST is recognised as part of the cost ofacquisition of the asset or as part of the item of expense.
Receivables and payables are stated inclusive of the amount of GST receivable or payable. The net amount of GST recoverable from,or payable to, the ATO is included as a current asset or liability in the balance sheet.
Cash flows are included in the cash flow statement on a gross basis. The GST component of cash flows arising from investing andfinancing activities which are recoverable from, or payable to, the ATO are classified as operating cash flows.
(h) Rounding of amounts
Amounts in the financial statements and notes to the financial statements have, unless otherwise stated, been rounded to the nearestthousand dollars.
(i) Cash and cash equivalents
Cash and cash equivalents include cash on hand and short-term investments with a maturity of three months or less, that are readilyconvertible to known amounts of cash and which are subject to insignificant risk of change in value. For the purpose of the statementof cash flows, cash and cash equivalents consist of cash and cash equivalents as defined above, net of outstanding bank overdrafts.
Financial assets at fair value through profit or loss with a maturity date of three months or less from the date of deposit or issue andwhere there is an insignificant risk of a change in value are reclassified to cash and cash equivalents.
(j) Investments and other financial assets
(i) Financial assets at fair value through profit or loss
Financial assets which do not meet a criteria of the objective of the University's business model for managing financial assets or thecharacteristics of the contractual cash flows are measured at fair value through profit or loss.
Financial assets at fair value through profit or loss principally comprise marketable securities, unit trusts and debt instruments. Theyare included in non-current assets unless the maturity date of the asset is within twelve months of the reporting date. Financial assetsat fair value through profit or loss (Note 20) are initially recognised at fair value, with subsequent increases or decreases in fair valuerecognised in profit or loss. Transaction costs incurred in the acquisition of financial assets at fair value through profit or loss arerecognised as expenses in net profit in the period in which they are incurred.
10Page
70
sydn
ey.e
du.a
uTh
e Un
iver
sity
of
Sydn
eyAn
nual
Rep
ort
2015

The University of SydneyNotes to the financial statements
for the year ended 31 December 2015
(continued)
1 Summary of significant accounting policies (continued)
(d) Income tax
The University is exempt from income tax under subdivision 50-B of the Income Tax Assessment Act 1997. Within the consolidatedentity there are entities that are not exempt from income tax. For these entities, the income tax expense or revenue for the period isthe tax payable on the current period's taxable income, adjusted by changes in deferred tax assets and liabilities attributable totemporary differences between the tax bases of assets and liabilities and their carrying amounts in the financial statements, and tounused tax losses.
Deferred income tax is provided in full, using the liability method, on temporary differences arising between the tax bases of assetsand liabilities and their carrying amounts in the consolidated financial statements. However, the deferred income tax is not accountedfor if it arises from initial recognition of an asset or liability in a transaction other than a business combination that at the time of thetransaction affects neither accounting nor taxable profit or loss. Deferred income tax is determined using tax rates (and laws) thathave been enacted or substantially enacted by the statement of financial position date and are expected to apply when the relateddeferred income tax asset is realised or the deferred income tax liability is settled.
Deferred tax assets are recognised for deductible temporary differences and unused tax losses, only if it is probable that futuretaxable amounts will be available to utilise those temporary differences and losses.
Deferred tax liabilities and assets are not recognised for temporary differences between the carrying amount and tax bases ofinvestments in controlled entities where the parent entity is able to control the timing of the reversal of the temporary differences and itis probable that the differences will not reverse in the foreseeable future.
Current and deferred tax assets and liabilities relating to the same taxation authority are offset when there is a legally enforceableright to offset current tax assets and liabilities and they are intended to be either settled on a net basis, or the asset is to be realisedand the liability settled simultaneously.
(e) Business combinations
Business combinations are accounted for using the acquisition method. The consideration transferred in a business combination ismeasured at fair value, which is calculated as the sum of the acquisition date fair values of the assets transferred by the acquirer, theliabilities incurred by the acquirer to former owners of the acquiree and the equity by the acquirer, and the amount of any non-controlling interest in the acquiree. For each business combination, the acquirer measures the non-controlling interest in the acquireeat fair value or at the proportionate share of the acquiree's identifiable assets. Acquisition-related costs are expensed as incurred. Theexcess at the acquisition date of the aggregate of the consideration transferred, the amount of any non-controlling interest and anypreviously held equity interest in the acquiree, over the net amounts of identifiable assets acquired and liabilities assumed isrecognised as goodwill (refer to note1(u)). If the cost of acquisition is less than the fair value of the identifiable net assets of thesubsidiary acquired, the difference is recognised directly in the income statement of the acquirer but only after a reassessment of theidentification and measurement of the net assets acquired.
When the parent acquires a business, it assesses the financial assets and liabilities assumed for appropriate classification anddesignation in accordance with the contractual terms, economic conditions, the parent's operating or accounting policies and otherpertinent conditions as at the acquisition date. This includes the separation of embedded derivatives in host contracts by the acquiree.
If the business combination is achieved in stages, the acquisition date fair value of the acquirer's previously held equity interest in theacquiree is remeasured at fair value as at the acquisition date through profit or loss.
(f) Revenue recognition
(i) Operating revenue
The University's operating activity income primarily consists of Commonwealth grants, Higher Education Contribution Scheme(HECS-HELP) Commonwealth payments, Higher Education Loan Program (FEE-HELP) student payments, New South Wales StateGovernment grants, other research grants, consultancy and contract research income, investment income, and fees and charges.
Revenue is recognised where it can be reliably measured. Amounts disclosed as revenue are net of returns, trade allowances andduties and taxes.
(ii) Government grants
The University treats operating grants received from Australian Government entities as income in the year of receipt, irrespective ofwhether more grants have been expended in the year of receipt.
The grants are recognised at their fair value when the University obtains control of the right to receive a grant, it is probable thateconomic benefits will flow to the University and it can be reliably measured.
9
The University of SydneyNotes to the financial statements
for the year ended 31 December 2015
(continued)
1 Summary of significant accounting policies (continued)
(f) Revenue recognition (continued)
(iii) Fees and charges
Student fees are recognised as revenue in the relevant session. Revenue from rendering services is recognised in the period in whichthe service is provided, having regard to the stage of completion of the service.
(iv) Investment income
Investment income is recognised as it is earned.
(v) Rental income
Rental income is recognised as it is earned over the period that the properties are leased to third parties.
(vi) Asset sales
Net realised gains/(losses) are included as income/(expenses) and are further analysed in Note 8.
(vii) Other revenue and income
Represents donations, bequests and contributions from external organisations and miscellaneous income not derived from coreoperations which are recognised when the University becomes entitled to receive the contribution and the contribution can be reliablymeasured. Miscellaneous income is brought to account as it is earned and is recognised when the goods and services are provided.
(g) Goods and services tax (GST)
Revenues, expenses and assets are recognised net of the amount of GST, except where the amount of GST incurred is notrecoverable from the Australian Taxation Office (ATO). In these circumstances, the GST is recognised as part of the cost ofacquisition of the asset or as part of the item of expense.
Receivables and payables are stated inclusive of the amount of GST receivable or payable. The net amount of GST recoverable from,or payable to, the ATO is included as a current asset or liability in the balance sheet.
Cash flows are included in the cash flow statement on a gross basis. The GST component of cash flows arising from investing andfinancing activities which are recoverable from, or payable to, the ATO are classified as operating cash flows.
(h) Rounding of amounts
Amounts in the financial statements and notes to the financial statements have, unless otherwise stated, been rounded to the nearestthousand dollars.
(i) Cash and cash equivalents
Cash and cash equivalents include cash on hand and short-term investments with a maturity of three months or less, that are readilyconvertible to known amounts of cash and which are subject to insignificant risk of change in value. For the purpose of the statementof cash flows, cash and cash equivalents consist of cash and cash equivalents as defined above, net of outstanding bank overdrafts.
Financial assets at fair value through profit or loss with a maturity date of three months or less from the date of deposit or issue andwhere there is an insignificant risk of a change in value are reclassified to cash and cash equivalents.
(j) Investments and other financial assets
(i) Financial assets at fair value through profit or loss
Financial assets which do not meet a criteria of the objective of the University's business model for managing financial assets or thecharacteristics of the contractual cash flows are measured at fair value through profit or loss.
Financial assets at fair value through profit or loss principally comprise marketable securities, unit trusts and debt instruments. Theyare included in non-current assets unless the maturity date of the asset is within twelve months of the reporting date. Financial assetsat fair value through profit or loss (Note 20) are initially recognised at fair value, with subsequent increases or decreases in fair valuerecognised in profit or loss. Transaction costs incurred in the acquisition of financial assets at fair value through profit or loss arerecognised as expenses in net profit in the period in which they are incurred.
10 Page
71
Fina
ncia
l Re
port
s an
d St
atem
ents
201
5

The University of SydneyNotes to the financial statements
for the year ended 31 December 2015
(continued)
1 Summary of significant accounting policies (continued)
(j) Investments and other financial assets (continued)
The University classifies fair value measurements using a fair value hierarchy that reflects the significance of the inputs used in themeasurements. The fair value of financial instruments traded in active markets is based on quoted market prices at the balance date(Level 1). The fair values of quoted investments are based on current bid prices. If the market for a financial asset is not active (andfor unlisted securities), the University establishes fair value by using valuation techniques. The University uses a variety of methodsand makes assumptions that are based on market conditions existing at each balance date. These include reference to the fair valuesof recent arm's length transactions involving the same instruments or other instruments that are substantially the same (Level 2).Valuation techniques that are not based on using observable market data (Level 3) such as discounted cash flow analysis involvingsubstantial estimates, or option pricing models refined for the issuer's specific circumstances, are used to determine fair value for theremaining financial instruments.
If the University reclassifies these assets, their fair value is determined at reclassification date. Any gain or loss arising from adifference between the previous carrying amount and fair value is recognised in profit or loss.
(ii) Financial assets at amortised cost
Where the main objective of the University holding an asset or portfolio of assets is to collect contractual cash inflows on specificdates and those cash flows are generally in the form of principal and/or interest, they are measured at amortised cost using theeffective interest method and net of any impairment loss.
Financial assets at amortised cost are assessed for evidence of impairment at each balance date.
When a financial asset at amortised cost is reclassified, its fair value at the reclassification date becomes its new carrying amount.
The University assesses, at each reporting date, whether there is objective evidence that a financial asset is impaired. An impairmentexists if one or more events that has occurred since the initial recognition of the asset has an impact on the estimated future cashflows of the financial assets that can be reliably estimated. Evidence of impairment may include, but is not limited to, indications thatthe debtor or a group of debtors is experiencing significant financial difficulty, default or delinquency in interest or principal payments.
The carrying amount of the asset is reduced through the use of an allowance account and the loss is recognised in the statement ofprofit or loss. Loans, together with the associated allowance, are written off when there is no realistic prospect of future recovery. If ina subsequent year, the amount of the estimated impairment loss changes, the allowance account is adjusted. If a write off is laterrecovered, the recovery is credited to financial costs in the statement of profit or loss.
(k) Derivatives
Derivatives are initially recognised at fair value on the date a derivative contract is entered into and are subsequently remeasured totheir fair value. The method of recognising the resulting gain or loss depends on whether the derivative is designated as a hedginginstrument, and if so, the nature of the item being hedged. The University designates certain derivatives as either hedges of the fairvalue of recognised assets or liabilities or a firm commitment (fair value hedge) or hedges of highly probable forecast transactions(cash flow hedges).
(i) Fair value hedge
Changes in the fair value of derivatives that are designated and qualify as fair value hedges are recorded in the income statement,together with any changes in the fair value of the hedged asset or liability that are attributable to the hedged risk.
(ii) Cash flow hedge
The effective portion of changes in the fair value of derivatives that are designated and qualify as cash flow hedges is recognised inother comprehensive income. The gain or loss relating to the ineffective portion is recognised immediately in the income statementwithin other income or other expense.
Amounts that have been recognised in other comprehensive income are reclassified from equity to profit or loss as a reclassificationadjustment in the periods when the hedged item affects profit or loss (for instance, when the forecast sale that is hedged takes place).The gain or loss relating to the effective portion of interest rate swaps that are hedging variable rate borrowings is recognised in theincome statement within ’Borrowing costs’.
However, when the forecast cash flow that is hedged results in the recognition of a non-financial asset (for example, inventory or fixedassets), the gains and losses previously recognised in other comprehensive income are either reclassified as a reclassificationadjustment to the income statement or are included in the initial measurement of the cost of the asset. The deferred amounts areultimately recognised in profit or loss as cost of goods sold in the case of inventory, or as depreciation in the case of fixed assets.
When a hedging instrument expires or is sold or terminated, or when a hedge no longer meets the criteria for hedge accounting, anycumulative gain or loss that has been recognised in other comprehensive income from the period when the hedge was effective shallremain separately in equity until the forecast transaction occurs. When a forecast transaction is no longer expected to occur, thecumulative gain or loss that was recognised in other comprehensive income shall be reclassified to profit or loss as a reclassificationadjustment.
11
The University of SydneyNotes to the financial statements
for the year ended 31 December 2015
(continued)
1 Summary of significant accounting policies (continued)
(k) Derivatives (continued)
(iii) Derivatives that do not qualify for hedge accounting
Certain derivative instruments do not qualify for hedge accounting. Changes in the fair value of any derivative instrument that doesnot qualify for hedge accounting are recognised immediately in the income statement and are included in other income or otherexpenses.
(l) Fair value measurement
The University classifies fair value measurements using a fair value hierarchy that reflects the significance of the inputs used inmaking the measurements.
The fair value of assets or liabilities traded in active markets (such as publicly traded derivatives and financial assets held at fair valuethrough profit or loss) is based on quoted market prices for identical assets or liabilities at the reporting date (Level 1). The quotedmarket price used for assets held by the University is the most representative of fair value in the circumstances within the bid-askspread.
The fair value of assets or liabilities that are not traded in an active market (for example, over-the-counter-derivatives) is determinedusing valuation techniques. The University uses a variety of methods and makes assumptions that are based on market conditionsexisting at each balance date. Quoted market prices or dealer quotes for similar instruments (Level 2) are used for long-term debtinstruments held. Other techniques that are not based on observable market data (Level 3), such as estimated discounted cash flows,are used to determine fair value for the remaining assets and liabilities.The fair value of interest-rate swaps is calculated as thepresent value of the estimated future cash flows. The fair value of forward exchange contracts is determined using forward exchangemarket rates at the reporting date. The level in the fair value hierarchy is determined on the basis of the lowest level input that issignificant to the fair value measurement in its entirety.
In assessing the fair value, the University considers market participant's ability to use the asset in a manner that would be the highestand best use.
The carrying value less impairment provision of trade receivables and payables are assumed to approximate their fair values due totheir short-term nature. The fair value of financial liabilities is estimated by discounting the future contractual cash flows at the currentmarket interest rate that is available to the University for similar financial instruments.
(m) Valuation of assets
(i) Property, plant and equipment
In accordance with AASB 116 'Property, Plant and Equipment', the University has chosen to apply the cost model to value its plantand equipment, library collections and non-commercial teaching and research land, buildings and infrastructure. Cost includesexpenditure directly attributable to acquisition of items. After recognition, these classes of assets are carried at cost less anyaccumulated depreciation and any accumulated impairment losses. Non-commercial land, buildings and infrastructure are identifiedas assets that are subject to specific restrictions; for example, land grants, zoned specific use and specific contractual arrangements.In regards to commercial land, buildings and infrastructure, and heritage assets, the University has determined that these assetclasses can be reliably measured and has applied the revaluation model. After recognition, these classes of assets are recorded attheir fair value and carried at a revalued amount, being the fair value at the date of the revaluation less any subsequent accumulateddepreciation and subsequent accumulated impairment losses. Under the revaluation model, revaluations are undertaken of allclasses of assets with sufficient regularity to ensure the carrying amount does not differ materially from the value determined usingfair value at the reporting date. At the date of revaluation the accumulated depreciation is eliminated against the gross carryingamount of the assets and the net amount restated to the revalued amount of the assets. Any increase in the asset class carryingamount is credited to other comprehensive income. Commercial teaching and research land, buildings, and infrastructure areexternally revalued every five years and in the remaining four years by an internal valuer.
Subsequent costs are included in the asset's carrying amount or recognised as a separate asset, as appropriate, only when it isprobable that future economic benefits associated with the item will flow to the University and the cost of the item can be measuredreliably. Repairs and maintenance are charged to the income statement during the financial period in which they are incurred.
Increases in the carrying amounts arising on revaluation of land and buildings are recognised, net of tax, in other comprehensiveincome and accumulated in equity under the heading of revaluation surplus. To the extent that the increase reverses a decreasepreviously recognised in profit or loss, the increase is first recognised in profit or loss. Decreases that reverse previous increases ofthe same asset class are also recognised in other comprehensive income to the extent of the remaining reserve attributable to theasset class. All other decreases are charged to the income statement.
Commercial properties
Investments in commercial properties are land and buildings carried at fair value that are used by the University to meet servicedelivery obligations. The University's commercial properties have been revalued during the year ending 31 December 2015.
12Page
72
sydn
ey.e
du.a
uTh
e Un
iver
sity
of
Sydn
eyAn
nual
Rep
ort
2015

The University of SydneyNotes to the financial statements
for the year ended 31 December 2015
(continued)
1 Summary of significant accounting policies (continued)
(j) Investments and other financial assets (continued)
The University classifies fair value measurements using a fair value hierarchy that reflects the significance of the inputs used in themeasurements. The fair value of financial instruments traded in active markets is based on quoted market prices at the balance date(Level 1). The fair values of quoted investments are based on current bid prices. If the market for a financial asset is not active (andfor unlisted securities), the University establishes fair value by using valuation techniques. The University uses a variety of methodsand makes assumptions that are based on market conditions existing at each balance date. These include reference to the fair valuesof recent arm's length transactions involving the same instruments or other instruments that are substantially the same (Level 2).Valuation techniques that are not based on using observable market data (Level 3) such as discounted cash flow analysis involvingsubstantial estimates, or option pricing models refined for the issuer's specific circumstances, are used to determine fair value for theremaining financial instruments.
If the University reclassifies these assets, their fair value is determined at reclassification date. Any gain or loss arising from adifference between the previous carrying amount and fair value is recognised in profit or loss.
(ii) Financial assets at amortised cost
Where the main objective of the University holding an asset or portfolio of assets is to collect contractual cash inflows on specificdates and those cash flows are generally in the form of principal and/or interest, they are measured at amortised cost using theeffective interest method and net of any impairment loss.
Financial assets at amortised cost are assessed for evidence of impairment at each balance date.
When a financial asset at amortised cost is reclassified, its fair value at the reclassification date becomes its new carrying amount.
The University assesses, at each reporting date, whether there is objective evidence that a financial asset is impaired. An impairmentexists if one or more events that has occurred since the initial recognition of the asset has an impact on the estimated future cashflows of the financial assets that can be reliably estimated. Evidence of impairment may include, but is not limited to, indications thatthe debtor or a group of debtors is experiencing significant financial difficulty, default or delinquency in interest or principal payments.
The carrying amount of the asset is reduced through the use of an allowance account and the loss is recognised in the statement ofprofit or loss. Loans, together with the associated allowance, are written off when there is no realistic prospect of future recovery. If ina subsequent year, the amount of the estimated impairment loss changes, the allowance account is adjusted. If a write off is laterrecovered, the recovery is credited to financial costs in the statement of profit or loss.
(k) Derivatives
Derivatives are initially recognised at fair value on the date a derivative contract is entered into and are subsequently remeasured totheir fair value. The method of recognising the resulting gain or loss depends on whether the derivative is designated as a hedginginstrument, and if so, the nature of the item being hedged. The University designates certain derivatives as either hedges of the fairvalue of recognised assets or liabilities or a firm commitment (fair value hedge) or hedges of highly probable forecast transactions(cash flow hedges).
(i) Fair value hedge
Changes in the fair value of derivatives that are designated and qualify as fair value hedges are recorded in the income statement,together with any changes in the fair value of the hedged asset or liability that are attributable to the hedged risk.
(ii) Cash flow hedge
The effective portion of changes in the fair value of derivatives that are designated and qualify as cash flow hedges is recognised inother comprehensive income. The gain or loss relating to the ineffective portion is recognised immediately in the income statementwithin other income or other expense.
Amounts that have been recognised in other comprehensive income are reclassified from equity to profit or loss as a reclassificationadjustment in the periods when the hedged item affects profit or loss (for instance, when the forecast sale that is hedged takes place).The gain or loss relating to the effective portion of interest rate swaps that are hedging variable rate borrowings is recognised in theincome statement within ’Borrowing costs’.
However, when the forecast cash flow that is hedged results in the recognition of a non-financial asset (for example, inventory or fixedassets), the gains and losses previously recognised in other comprehensive income are either reclassified as a reclassificationadjustment to the income statement or are included in the initial measurement of the cost of the asset. The deferred amounts areultimately recognised in profit or loss as cost of goods sold in the case of inventory, or as depreciation in the case of fixed assets.
When a hedging instrument expires or is sold or terminated, or when a hedge no longer meets the criteria for hedge accounting, anycumulative gain or loss that has been recognised in other comprehensive income from the period when the hedge was effective shallremain separately in equity until the forecast transaction occurs. When a forecast transaction is no longer expected to occur, thecumulative gain or loss that was recognised in other comprehensive income shall be reclassified to profit or loss as a reclassificationadjustment.
11
The University of SydneyNotes to the financial statements
for the year ended 31 December 2015
(continued)
1 Summary of significant accounting policies (continued)
(k) Derivatives (continued)
(iii) Derivatives that do not qualify for hedge accounting
Certain derivative instruments do not qualify for hedge accounting. Changes in the fair value of any derivative instrument that doesnot qualify for hedge accounting are recognised immediately in the income statement and are included in other income or otherexpenses.
(l) Fair value measurement
The University classifies fair value measurements using a fair value hierarchy that reflects the significance of the inputs used inmaking the measurements.
The fair value of assets or liabilities traded in active markets (such as publicly traded derivatives and financial assets held at fair valuethrough profit or loss) is based on quoted market prices for identical assets or liabilities at the reporting date (Level 1). The quotedmarket price used for assets held by the University is the most representative of fair value in the circumstances within the bid-askspread.
The fair value of assets or liabilities that are not traded in an active market (for example, over-the-counter-derivatives) is determinedusing valuation techniques. The University uses a variety of methods and makes assumptions that are based on market conditionsexisting at each balance date. Quoted market prices or dealer quotes for similar instruments (Level 2) are used for long-term debtinstruments held. Other techniques that are not based on observable market data (Level 3), such as estimated discounted cash flows,are used to determine fair value for the remaining assets and liabilities.The fair value of interest-rate swaps is calculated as thepresent value of the estimated future cash flows. The fair value of forward exchange contracts is determined using forward exchangemarket rates at the reporting date. The level in the fair value hierarchy is determined on the basis of the lowest level input that issignificant to the fair value measurement in its entirety.
In assessing the fair value, the University considers market participant's ability to use the asset in a manner that would be the highestand best use.
The carrying value less impairment provision of trade receivables and payables are assumed to approximate their fair values due totheir short-term nature. The fair value of financial liabilities is estimated by discounting the future contractual cash flows at the currentmarket interest rate that is available to the University for similar financial instruments.
(m) Valuation of assets
(i) Property, plant and equipment
In accordance with AASB 116 'Property, Plant and Equipment', the University has chosen to apply the cost model to value its plantand equipment, library collections and non-commercial teaching and research land, buildings and infrastructure. Cost includesexpenditure directly attributable to acquisition of items. After recognition, these classes of assets are carried at cost less anyaccumulated depreciation and any accumulated impairment losses. Non-commercial land, buildings and infrastructure are identifiedas assets that are subject to specific restrictions; for example, land grants, zoned specific use and specific contractual arrangements.In regards to commercial land, buildings and infrastructure, and heritage assets, the University has determined that these assetclasses can be reliably measured and has applied the revaluation model. After recognition, these classes of assets are recorded attheir fair value and carried at a revalued amount, being the fair value at the date of the revaluation less any subsequent accumulateddepreciation and subsequent accumulated impairment losses. Under the revaluation model, revaluations are undertaken of allclasses of assets with sufficient regularity to ensure the carrying amount does not differ materially from the value determined usingfair value at the reporting date. At the date of revaluation the accumulated depreciation is eliminated against the gross carryingamount of the assets and the net amount restated to the revalued amount of the assets. Any increase in the asset class carryingamount is credited to other comprehensive income. Commercial teaching and research land, buildings, and infrastructure areexternally revalued every five years and in the remaining four years by an internal valuer.
Subsequent costs are included in the asset's carrying amount or recognised as a separate asset, as appropriate, only when it isprobable that future economic benefits associated with the item will flow to the University and the cost of the item can be measuredreliably. Repairs and maintenance are charged to the income statement during the financial period in which they are incurred.
Increases in the carrying amounts arising on revaluation of land and buildings are recognised, net of tax, in other comprehensiveincome and accumulated in equity under the heading of revaluation surplus. To the extent that the increase reverses a decreasepreviously recognised in profit or loss, the increase is first recognised in profit or loss. Decreases that reverse previous increases ofthe same asset class are also recognised in other comprehensive income to the extent of the remaining reserve attributable to theasset class. All other decreases are charged to the income statement.
Commercial properties
Investments in commercial properties are land and buildings carried at fair value that are used by the University to meet servicedelivery obligations. The University's commercial properties have been revalued during the year ending 31 December 2015.
12 Page
73
Fina
ncia
l Re
port
s an
d St
atem
ents
201
5

The University of SydneyNotes to the financial statements
for the year ended 31 December 2015
(continued)
1 Summary of significant accounting policies (continued)
(m) Valuation of assets (continued)
Infrastructure
Infrastructure includes roads, paths and paving, ovals, playing fields, perimeter fencing, boundary gates, farm fencing (wire, electric orpost and rail), water, electricity, gas, telecommunications services, sewerage, drainage, bridges, pedestrian ramps, surface car park,power generation plants, reservoirs, dams and landscaping. The University applies the cost basis for its non-commercialinfrastructure and the fair value basis for commercial infrastructure. Commercial infrastructure has been revalued during the yearending 31 December 2015.
Plant and equipment
The University's plant and equipment are recorded at historical cost less accumulated depreciation.
Heritage assets
Valuations for the University’s heritage assets were provided by the curators of each collection. The valuation of the University’s rarebooks collection was as at 31 December 2015. The Power Collection of Contemporary Art is owned by the University and is on loanunder a management agreement with the Museum of Contemporary Art. The collection was last valued in 2015 by the Museum ofContemporary Art Limited and is recorded on the University’s books at a value of $31,271k (2014: $30,658k). The valuations for theother collections are provided annually by the curators of each collection and are based on current market value using a combinationof prices at auction of similar works, the curator’s experience and appropriate indexation. Where assets are valued in a foreigncurrency they are translated into their Australian dollar equivalent at reporting date. These assets are not subject to depreciation.With the application of AASB 116 'Property, Plant and Equipment', the valuations are arrived at by curators using the fair valuemethod.
Library
The University’s research and undergraduate collections were capitalised at 31 December 1998 at market value. Under AASB 116'Property, Plant and Equipment', the library collections continue to be valued using the cost model less accumulated depreciation.
Works in progress
Works in progress represent the cost of unoccupied and incomplete building projects and other major capital works projects atreporting date. It also includes the costs of major information technology systems developments that had not been implemented as atthe reporting date.
Leasehold improvements
Leasehold improvements are capitalised and amortised over the shorter of their useful life or the remaining life of the lease.
(ii) Agriculture assets
Agriculture assets comprise livestock. The University values its agriculture assets at fair value less the estimated costs to sell.
(iii) Inventories
Inventories consist of store stock and unsold crops in silos. Costs have been assigned to inventory quantities on hand at reportingdate using the 'first in, first out' basis. Inventories are valued at the lower of cost and net realisable value.
(iv) Trade and other receivables
Trade receivables are recognised initially at fair value and subsequently measured at amortised cost using the effective interestmethod less provision for impairment.
Collectability of trade receivables is reviewed on an ongoing basis. Debtor uncollectability is established where there is objectiveevidence that the University or a subsidiary will not be able to collect all amounts due according to the original terms of the receivable.
The following matters are considered when assessing the level of impairment in relation to receivables; the level of financial difficultyof the debtor, the probability that the debtor will enter bankruptcy or financial reorganisation, default or delinquency in payments (morethan thirty days overdue).
Bad debts are charged to the income statement. If the debt has been provided for, any change in the allowance amount is recognisedin the income statement.
(v) Assets held for sale
The University recognises income from the sale of assets when the receipt of income from the sale is virtually certain. In most cases,this occurs on completion of the sale. However, in accordance with AASB 5 'Non-current Assets Held for Sale and DiscontinuedOperations', where an asset's carrying amount is to be recognised through sale rather than continuing operations, the non-currentasset is to be classed as held for sale as a current asset.
13
The University of SydneyNotes to the financial statements
for the year ended 31 December 2015
(continued)
1 Summary of significant accounting policies (continued)
(n) Repairs and maintenance
Repairs and maintenance costs are recognised as expenses as incurred, except where they relate to the replacement of a componentof an asset, in which case, the costs are capitalised and depreciated. Other routine operating maintenance, repair and minor renewalcosts are also recognised as expenses, as incurred.
(o) Comparative amounts
Where necessary, comparative information has been reclassified to enhance comparability in respect to changes in presentation inthe current year.
(p) Financial guarantee contracts
Financial guarantee contracts are recognised as a financial liability at the time the guarantee is issued. The liability is initiallymeasured at fair value and subsequently at the higher of the amount determined in accordance with AASB137 'Provisions, ContingentLiabilities and Contingent Assets' and the amount initially recognised less cumulative amortisation, where appropriate.
The fair value of financial guarantees is determined as the present value of the difference in net cash flows between the contractualpayments under the debt instrument and the payments that would be required without the guarantee, or the estimated amount thatwould be payable to a third party for assuming the obligations.
Where guarantees in relation to loans or other payables of subsidiaries or associates are provided for no compensation, the fairvalues are accounted for as contributions and recognised as part of the cost of the investment.
(q) Trade and other payables
Trade and other payables, including accruals not yet billed, represent liabilities for goods and services provided to the economic entityprior to the end of the reporting period. These amounts are unsecured and are usually settled within 30 days of recognition.
(r) Borrowings
Borrowings are initially recognised at fair value, net of transaction costs incurred. Borrowings are subsequently measured atamortised cost. Any difference between the proceeds (net of transaction costs) and the redemption amount is recognised in theincome statement over the period of the borrowings using the effective interest method.
Borrowings are removed from the statement of financial position when the obligation specified in the contract is discharged, cancelledor expired. The difference between the carrying amount of a financial liability that has been extinguished or transferred to anotherparty and the consideration paid, including any non-cash assets transferred or liabilities assumed, is recognised in other income orother expenses.
Borrowings are classified as current liabilities unless the economic entity has an unconditional right to defer settlement of the liabilityfor at least twelve months after the statement of financial position date and does not expect to settle the liability for at least twelvemonths after the statement of financial position date.
(s) Borrowing costs
Borrowing costs, including those incurred for the construction of any qualifying asset, are expensed during the period of time that isrequired to complete and prepare the asset for its intended use or sale.
(t) Foreign currency transactions and balances
Foreign currency transactions are translated into Australian currency at rates of exchange ruling at the dates of the transactions.Amounts receivable and payable in foreign currency at reporting date are translated at the rates of exchange ruling on that date.Exchange differences relating to amounts payable and receivable in foreign currencies are brought to account as exchange gains orlosses in the income statement.
14Page
74
sydn
ey.e
du.a
uTh
e Un
iver
sity
of
Sydn
eyAn
nual
Rep
ort
2015

The University of SydneyNotes to the financial statements
for the year ended 31 December 2015
(continued)
1 Summary of significant accounting policies (continued)
(m) Valuation of assets (continued)
Infrastructure
Infrastructure includes roads, paths and paving, ovals, playing fields, perimeter fencing, boundary gates, farm fencing (wire, electric orpost and rail), water, electricity, gas, telecommunications services, sewerage, drainage, bridges, pedestrian ramps, surface car park,power generation plants, reservoirs, dams and landscaping. The University applies the cost basis for its non-commercialinfrastructure and the fair value basis for commercial infrastructure. Commercial infrastructure has been revalued during the yearending 31 December 2015.
Plant and equipment
The University's plant and equipment are recorded at historical cost less accumulated depreciation.
Heritage assets
Valuations for the University’s heritage assets were provided by the curators of each collection. The valuation of the University’s rarebooks collection was as at 31 December 2015. The Power Collection of Contemporary Art is owned by the University and is on loanunder a management agreement with the Museum of Contemporary Art. The collection was last valued in 2015 by the Museum ofContemporary Art Limited and is recorded on the University’s books at a value of $31,271k (2014: $30,658k). The valuations for theother collections are provided annually by the curators of each collection and are based on current market value using a combinationof prices at auction of similar works, the curator’s experience and appropriate indexation. Where assets are valued in a foreigncurrency they are translated into their Australian dollar equivalent at reporting date. These assets are not subject to depreciation.With the application of AASB 116 'Property, Plant and Equipment', the valuations are arrived at by curators using the fair valuemethod.
Library
The University’s research and undergraduate collections were capitalised at 31 December 1998 at market value. Under AASB 116'Property, Plant and Equipment', the library collections continue to be valued using the cost model less accumulated depreciation.
Works in progress
Works in progress represent the cost of unoccupied and incomplete building projects and other major capital works projects atreporting date. It also includes the costs of major information technology systems developments that had not been implemented as atthe reporting date.
Leasehold improvements
Leasehold improvements are capitalised and amortised over the shorter of their useful life or the remaining life of the lease.
(ii) Agriculture assets
Agriculture assets comprise livestock. The University values its agriculture assets at fair value less the estimated costs to sell.
(iii) Inventories
Inventories consist of store stock and unsold crops in silos. Costs have been assigned to inventory quantities on hand at reportingdate using the 'first in, first out' basis. Inventories are valued at the lower of cost and net realisable value.
(iv) Trade and other receivables
Trade receivables are recognised initially at fair value and subsequently measured at amortised cost using the effective interestmethod less provision for impairment.
Collectability of trade receivables is reviewed on an ongoing basis. Debtor uncollectability is established where there is objectiveevidence that the University or a subsidiary will not be able to collect all amounts due according to the original terms of the receivable.
The following matters are considered when assessing the level of impairment in relation to receivables; the level of financial difficultyof the debtor, the probability that the debtor will enter bankruptcy or financial reorganisation, default or delinquency in payments (morethan thirty days overdue).
Bad debts are charged to the income statement. If the debt has been provided for, any change in the allowance amount is recognisedin the income statement.
(v) Assets held for sale
The University recognises income from the sale of assets when the receipt of income from the sale is virtually certain. In most cases,this occurs on completion of the sale. However, in accordance with AASB 5 'Non-current Assets Held for Sale and DiscontinuedOperations', where an asset's carrying amount is to be recognised through sale rather than continuing operations, the non-currentasset is to be classed as held for sale as a current asset.
13
The University of SydneyNotes to the financial statements
for the year ended 31 December 2015
(continued)
1 Summary of significant accounting policies (continued)
(n) Repairs and maintenance
Repairs and maintenance costs are recognised as expenses as incurred, except where they relate to the replacement of a componentof an asset, in which case, the costs are capitalised and depreciated. Other routine operating maintenance, repair and minor renewalcosts are also recognised as expenses, as incurred.
(o) Comparative amounts
Where necessary, comparative information has been reclassified to enhance comparability in respect to changes in presentation inthe current year.
(p) Financial guarantee contracts
Financial guarantee contracts are recognised as a financial liability at the time the guarantee is issued. The liability is initiallymeasured at fair value and subsequently at the higher of the amount determined in accordance with AASB137 'Provisions, ContingentLiabilities and Contingent Assets' and the amount initially recognised less cumulative amortisation, where appropriate.
The fair value of financial guarantees is determined as the present value of the difference in net cash flows between the contractualpayments under the debt instrument and the payments that would be required without the guarantee, or the estimated amount thatwould be payable to a third party for assuming the obligations.
Where guarantees in relation to loans or other payables of subsidiaries or associates are provided for no compensation, the fairvalues are accounted for as contributions and recognised as part of the cost of the investment.
(q) Trade and other payables
Trade and other payables, including accruals not yet billed, represent liabilities for goods and services provided to the economic entityprior to the end of the reporting period. These amounts are unsecured and are usually settled within 30 days of recognition.
(r) Borrowings
Borrowings are initially recognised at fair value, net of transaction costs incurred. Borrowings are subsequently measured atamortised cost. Any difference between the proceeds (net of transaction costs) and the redemption amount is recognised in theincome statement over the period of the borrowings using the effective interest method.
Borrowings are removed from the statement of financial position when the obligation specified in the contract is discharged, cancelledor expired. The difference between the carrying amount of a financial liability that has been extinguished or transferred to anotherparty and the consideration paid, including any non-cash assets transferred or liabilities assumed, is recognised in other income orother expenses.
Borrowings are classified as current liabilities unless the economic entity has an unconditional right to defer settlement of the liabilityfor at least twelve months after the statement of financial position date and does not expect to settle the liability for at least twelvemonths after the statement of financial position date.
(s) Borrowing costs
Borrowing costs, including those incurred for the construction of any qualifying asset, are expensed during the period of time that isrequired to complete and prepare the asset for its intended use or sale.
(t) Foreign currency transactions and balances
Foreign currency transactions are translated into Australian currency at rates of exchange ruling at the dates of the transactions.Amounts receivable and payable in foreign currency at reporting date are translated at the rates of exchange ruling on that date.Exchange differences relating to amounts payable and receivable in foreign currencies are brought to account as exchange gains orlosses in the income statement.
14 Page
75
Fina
ncia
l Re
port
s an
d St
atem
ents
201
5

The University of SydneyNotes to the financial statements
for the year ended 31 December 2015
(continued)
1 Summary of significant accounting policies (continued)
(u) Intangible assets
(i) Goodwill
Goodwill represents the excess of the fair value measurement of consideration transferred in an acquisition over the fair value of theUniversity's share of the net identifiable assets of the acquiree at the date of acquisition. Goodwill on acquisitions of subsidiaries isincluded in intangible assets. Goodwill on acquisitions of associates is included in investments in associates. Goodwill is notamortised, instead it is tested for impairment annually, or more frequently if events or changes in circumstances indicate that it mightbe impaired, and is carried at cost less accumulated impairment losses. Gains and losses on the disposal of an entity include thecarrying amount of goodwill relating to the entity sold.
(ii) Computer software
Major computer software is recorded at historic cost and amortisation and where applicable any impairment losses. Amortisation isprovided on a straight line basis at a rate of 14.29%.
(iii) Digitalised library collections
Digitalised library collections are held by perpetual licence and are not expected to be subject to technical obsolescence or incurmaintenance costs. They are recorded at historic costs and are not amortised as they are deemed to have an indefinite useful life.
(iv) Other intangible assets
Other intangible assets include the right to use assets that have been purchased, developed and/or implemented. This includes theright to use a cyclotron and water rights.
The right to use a cyclotron was acquired at cost and is amortised over its effective life, which is twenty years. The water rights wereacquired at cost and are not amortised as they are deemed to have indefinite useful life.
(v) Employee benefits
(i) Short-term obligations
Liabilities for short-term employee benefits including wages and salaries and non-monetary benefits are measured at the amountexpected to be paid when the liability is settled, if it is expected to be settled wholly before twelve months after the end of the reportingperiod, and is recognised in other payables. Liabilities for non-accumulating sick leave are recognised when the leave is taken andmeasured at the rates payable.
(ii) Other long-term obligations
The liability for other long-term benefits is recognised in current provisions for employee benefits if they are not expected to be settledwholly before twelve months after the end of the reporting period. Other long-term employee benefits include such things as annualleave, accumulating sick leave and long service leave liabilities.
Other long-term employee benefits are measured at the present value of expected future payments to be made in respect of servicesprovided by employees up to the reporting date using the projected unit credit method. Consideration is given to expected future wageand salary levels, experience of employee departures and periods of service. Expected future payments are discounted using marketyields at the reporting date on national government bonds with terms to maturity and currency that match, as closely as possible, theestimated future cash outflows.
Regardless of the expected timing of settlements, provisions made in respect of employee benefits are classified as a current liability,unless there is an unconditional right to defer the settlement of the liability for at least twelve months after the reporting date, in whichcase it would be classified as a non-current liability.
(iii) Retirement benefit obligations
The University provides for superannuation based on information and formulae provided by the Superannuation AdministrationCorporation in respect of contributors to the defined benefit schemes administered by the SAS Trustee Corporation. These schemesinclude the State Superannuation Scheme, the State Authorities Superannuation Scheme and the State Authorities Non-ContributoryScheme. In addition, the University contributes to the Superannuation Scheme for Australian Universities, which is a funded definedbenefits scheme that also provides an Accumulation Superannuation Plan. The University also contributes to the University of SydneyProfessorial Superannuation Scheme.
A liability or asset in respect of defined benefit superannuation plans is recognised in the statement of financial position, and ismeasured as the present value of the defined benefit obligation at the reporting date, less the fair value of the superannuation fund’sassets at that date and any unrecognised past service cost. The present value of the defined benefit obligation is based on expectedfuture payments which arise from membership of the fund to the reporting date, calculated annually by independent actuaries usingthe projected unit credit method. Consideration is given to expected future wage and salary levels, contribution taxes payable,experience of employee departures and periods of service.
Expected future payments are discounted using market yields at the reporting date on national government bonds with terms tomaturity and currency that match, as closely as possible, the estimated future cash outflows.
15
The University of SydneyNotes to the financial statements
for the year ended 31 December 2015
(continued)
1 Summary of significant accounting policies (continued)
(v) Employee benefits (continued)
Remeasurement gains and losses arising from experience adjustments and changes in actuarial assumptions are recognised in theperiod in which they occur, directly in other comprehensive income. They are included in retained earnings in the statement ofchanges in equity and in the statement of financial position.
Contributions to the defined contribution section of the University's superannuation fund and other independent defined contributionsuperannuation funds are recognised as an expense as they become payable.
A liability or asset in respect of the defined benefit superannuation plan for UniSuper has not been recognised in the statement offinancial position based on advice from UniSuper that the defined benefit plan is a contribution fund for the purposes of AASB 119'Employee Benefits' due to the amendment of the trust deed during 2006 (clause 34 of the UniSuper Trust Deed). The plan has beenclassified as a contribution plan in the parent entity's accounts.
(iv) Termination benefits
Termination benefits are payable when employment is terminated before the normal retirement date, or when an employee acceptsvoluntary redundancy in exchange for these benefits. The University recognises termination benefits when it is demonstrablycommitted to either terminating the employment of current employees according to a detailed formal plan without possibility ofwithdrawal or providing termination benefits as a result of a formally accepted offer of voluntary redundancy. Benefits falling due withintwelve months are valued at their nominal amounts and amounts falling due more than twelve months after the reporting date arediscounted to their net present values.
(w) Depreciation
Land is not depreciated. Depreciation is calculated on a straight-line basis. The depreciation rates are based on the estimated usefullives of the various classes of assets employed. Pro-rata depreciation is charged in the year of purchase and disposal. Depreciationrates by class of assets are as follows:
2015 2014
Plant and equipment 5%-20% 5%-20%Buildings and infrastructure 2% 2%Leasehold improvements* various variousLibrary collections 10% 10%
* The amortisation rates applied to leasehold improvements are based on the term of the lease or the useful life, whichever is lower.
The amortisation rates applied to leasehold improvements in respect of make good are based on the estimated period in which themake good will occur.
In addition to the depreciation specified above, the University has a number of buildings that are planned to be demolished within thenext five years. Where the University's future plan for campus development include a reduction in the useful life of buildings, thedepreciation rate is increased in order to appropriately amortise the remaining value of the building
(x) Provision
Provisions are recognised when the economic entity has a present obligation (legal or constructive) as a result of a past event, and itis probable that an outflow of resources will be required to settle the obligation and the amount of the obligation can be reliablyestimated.
Provisions are measured at the present value of management's best estimate of the expenditure required to settle the presentobligation at the end of the reporting period. The discount rate used to determine the present value is a pre-tax rate that reflectscurrent market assessments of the time value of money and risks specific to the liability. The liability is reassessed each reportingperiod and the resulting change in value is recorded as a finance cost.
(i) Make good provisions
The University leases a number of properties which include make good requirements at the expiry of the lease.
On initial recognition of the make good provision a leasehold improvement asset is recognised to record the future economic outflowsrequired to perform the restoration.
Changes to the estimated future costs of the restoration are recognised in the statement of financial position by adjusting the cost ofthe related asset.
(ii) Deferred lease provision
The University leases a number of properties where the lease agreement provides for a fixed increase in the rent each year. Wherethe rental increase amount is set at a fixed rate the University recognises a provision for the difference between the rent paid and therent that would have been paid had the total payments been allocated evenly across the lease term.
16Page
76
sydn
ey.e
du.a
uTh
e Un
iver
sity
of
Sydn
eyAn
nual
Rep
ort
2015

The University of SydneyNotes to the financial statements
for the year ended 31 December 2015
(continued)
1 Summary of significant accounting policies (continued)
(u) Intangible assets
(i) Goodwill
Goodwill represents the excess of the fair value measurement of consideration transferred in an acquisition over the fair value of theUniversity's share of the net identifiable assets of the acquiree at the date of acquisition. Goodwill on acquisitions of subsidiaries isincluded in intangible assets. Goodwill on acquisitions of associates is included in investments in associates. Goodwill is notamortised, instead it is tested for impairment annually, or more frequently if events or changes in circumstances indicate that it mightbe impaired, and is carried at cost less accumulated impairment losses. Gains and losses on the disposal of an entity include thecarrying amount of goodwill relating to the entity sold.
(ii) Computer software
Major computer software is recorded at historic cost and amortisation and where applicable any impairment losses. Amortisation isprovided on a straight line basis at a rate of 14.29%.
(iii) Digitalised library collections
Digitalised library collections are held by perpetual licence and are not expected to be subject to technical obsolescence or incurmaintenance costs. They are recorded at historic costs and are not amortised as they are deemed to have an indefinite useful life.
(iv) Other intangible assets
Other intangible assets include the right to use assets that have been purchased, developed and/or implemented. This includes theright to use a cyclotron and water rights.
The right to use a cyclotron was acquired at cost and is amortised over its effective life, which is twenty years. The water rights wereacquired at cost and are not amortised as they are deemed to have indefinite useful life.
(v) Employee benefits
(i) Short-term obligations
Liabilities for short-term employee benefits including wages and salaries and non-monetary benefits are measured at the amountexpected to be paid when the liability is settled, if it is expected to be settled wholly before twelve months after the end of the reportingperiod, and is recognised in other payables. Liabilities for non-accumulating sick leave are recognised when the leave is taken andmeasured at the rates payable.
(ii) Other long-term obligations
The liability for other long-term benefits is recognised in current provisions for employee benefits if they are not expected to be settledwholly before twelve months after the end of the reporting period. Other long-term employee benefits include such things as annualleave, accumulating sick leave and long service leave liabilities.
Other long-term employee benefits are measured at the present value of expected future payments to be made in respect of servicesprovided by employees up to the reporting date using the projected unit credit method. Consideration is given to expected future wageand salary levels, experience of employee departures and periods of service. Expected future payments are discounted using marketyields at the reporting date on national government bonds with terms to maturity and currency that match, as closely as possible, theestimated future cash outflows.
Regardless of the expected timing of settlements, provisions made in respect of employee benefits are classified as a current liability,unless there is an unconditional right to defer the settlement of the liability for at least twelve months after the reporting date, in whichcase it would be classified as a non-current liability.
(iii) Retirement benefit obligations
The University provides for superannuation based on information and formulae provided by the Superannuation AdministrationCorporation in respect of contributors to the defined benefit schemes administered by the SAS Trustee Corporation. These schemesinclude the State Superannuation Scheme, the State Authorities Superannuation Scheme and the State Authorities Non-ContributoryScheme. In addition, the University contributes to the Superannuation Scheme for Australian Universities, which is a funded definedbenefits scheme that also provides an Accumulation Superannuation Plan. The University also contributes to the University of SydneyProfessorial Superannuation Scheme.
A liability or asset in respect of defined benefit superannuation plans is recognised in the statement of financial position, and ismeasured as the present value of the defined benefit obligation at the reporting date, less the fair value of the superannuation fund’sassets at that date and any unrecognised past service cost. The present value of the defined benefit obligation is based on expectedfuture payments which arise from membership of the fund to the reporting date, calculated annually by independent actuaries usingthe projected unit credit method. Consideration is given to expected future wage and salary levels, contribution taxes payable,experience of employee departures and periods of service.
Expected future payments are discounted using market yields at the reporting date on national government bonds with terms tomaturity and currency that match, as closely as possible, the estimated future cash outflows.
15
The University of SydneyNotes to the financial statements
for the year ended 31 December 2015
(continued)
1 Summary of significant accounting policies (continued)
(v) Employee benefits (continued)
Remeasurement gains and losses arising from experience adjustments and changes in actuarial assumptions are recognised in theperiod in which they occur, directly in other comprehensive income. They are included in retained earnings in the statement ofchanges in equity and in the statement of financial position.
Contributions to the defined contribution section of the University's superannuation fund and other independent defined contributionsuperannuation funds are recognised as an expense as they become payable.
A liability or asset in respect of the defined benefit superannuation plan for UniSuper has not been recognised in the statement offinancial position based on advice from UniSuper that the defined benefit plan is a contribution fund for the purposes of AASB 119'Employee Benefits' due to the amendment of the trust deed during 2006 (clause 34 of the UniSuper Trust Deed). The plan has beenclassified as a contribution plan in the parent entity's accounts.
(iv) Termination benefits
Termination benefits are payable when employment is terminated before the normal retirement date, or when an employee acceptsvoluntary redundancy in exchange for these benefits. The University recognises termination benefits when it is demonstrablycommitted to either terminating the employment of current employees according to a detailed formal plan without possibility ofwithdrawal or providing termination benefits as a result of a formally accepted offer of voluntary redundancy. Benefits falling due withintwelve months are valued at their nominal amounts and amounts falling due more than twelve months after the reporting date arediscounted to their net present values.
(w) Depreciation
Land is not depreciated. Depreciation is calculated on a straight-line basis. The depreciation rates are based on the estimated usefullives of the various classes of assets employed. Pro-rata depreciation is charged in the year of purchase and disposal. Depreciationrates by class of assets are as follows:
2015 2014
Plant and equipment 5%-20% 5%-20%Buildings and infrastructure 2% 2%Leasehold improvements* various variousLibrary collections 10% 10%
* The amortisation rates applied to leasehold improvements are based on the term of the lease or the useful life, whichever is lower.
The amortisation rates applied to leasehold improvements in respect of make good are based on the estimated period in which themake good will occur.
In addition to the depreciation specified above, the University has a number of buildings that are planned to be demolished within thenext five years. Where the University's future plan for campus development include a reduction in the useful life of buildings, thedepreciation rate is increased in order to appropriately amortise the remaining value of the building
(x) Provision
Provisions are recognised when the economic entity has a present obligation (legal or constructive) as a result of a past event, and itis probable that an outflow of resources will be required to settle the obligation and the amount of the obligation can be reliablyestimated.
Provisions are measured at the present value of management's best estimate of the expenditure required to settle the presentobligation at the end of the reporting period. The discount rate used to determine the present value is a pre-tax rate that reflectscurrent market assessments of the time value of money and risks specific to the liability. The liability is reassessed each reportingperiod and the resulting change in value is recorded as a finance cost.
(i) Make good provisions
The University leases a number of properties which include make good requirements at the expiry of the lease.
On initial recognition of the make good provision a leasehold improvement asset is recognised to record the future economic outflowsrequired to perform the restoration.
Changes to the estimated future costs of the restoration are recognised in the statement of financial position by adjusting the cost ofthe related asset.
(ii) Deferred lease provision
The University leases a number of properties where the lease agreement provides for a fixed increase in the rent each year. Wherethe rental increase amount is set at a fixed rate the University recognises a provision for the difference between the rent paid and therent that would have been paid had the total payments been allocated evenly across the lease term.
16 Page
77
Fina
ncia
l Re
port
s an
d St
atem
ents
201
5

The University of SydneyNotes to the financial statements
for the year ended 31 December 2015
(continued)
1 Summary of significant accounting policies (continued)
(y) Leases
The University leases various items of plant and equipment under operating leases. Under these arrangements a significant portion ofthe risks and rewards of ownership are retained by the lessor. The costs in relation to these are presented in Note 13 as 'Operatinglease and rental expenses'.
Payments made under operating leases (net of any incentives received from the lessor) are charged to the income statement on astraight-line basis over the period of the lease.
(z) Restricted funds
Restricted funds are funds or assets granted by external parties under conditions that they may only be utilised for specifiedexpenditure purposes and cannot be allocated to general purpose expenditure. The grantor of the funds specifies how the funds areto be used.
(aa) Reserves
The University has the following reserves:
(i) Property, plant and equipment revaluation reserve
This reserve is used to account for the increases or decreases in the value of assets as a result of revaluations. Increases in thevalue of reserves are in accordance with the valuation of assets policies stated in Note 1(m). Decrements in reserves are either ondisposal of assets where the disposed asset had previously been revalued and a reserve existed or on impairment of assets inaccordance with AASB 136 'Impairment of Assets' where a revaluation reserve had existed for that asset class.
(ii) Hedging reserve - cash flow hedges
The hedging reserve is used to record gains or losses on a hedging instrument in a cash flow hedge that are, for the effective portionof changes in the fair value of the interest rate swap, recognised in other comprehensive income, as described in Note 1(k). Any gainor loss in respect of the ineffective portion of an interest rate swap is recognised immediately in profit or loss.
(iii) Associates' reserve
This represents the reserves held by associated entities and is recognised in the consolidated financial statements using the equitymethod of accounting (see Note 40). In addition, an initial asset valuation reserve was created in 1992 for the purpose of bringing toaccount the University’s assets for the first time. This includes the transfer of properties between the University and the Department ofSchool Education in 1994; this transfer did not involve any cash transactions. This initial asset valuation reserve is included inretained earnings.
(ab) Private sector participation in the provision of student accommodation
The University of Sydney has entered into an arrangement where, under a long-term lease of its land in Carillon Avenue, Newtown, astudent university village (SUV) has been constructed and is being operated in partnership with the private sector. This 650-bed SUVwas opened in January 2003. Under the terms of the project deed, ownership in the accommodation complex reverts to the Universityforty years after the opening of the SUV. At this stage the emerging share of the asset is not material.
(ac) Impairment of assets
Goodwill and intangible assets that have an indefinite useful life are not subject to amortisation and are tested annually forimpairment, or more frequently if events or changes in circumstances indicate that they might be impaired. Other assets are reviewedfor impairment whenever events or changes in circumstances indicate that the carrying amount may not be recoverable. Animpairment loss is recognised for the amount by which the asset's carrying amount exceeds its recoverable amount. The recoverableamount is the higher of an asset's fair value less costs of disposal and value in use. For the purposes of assessing impairment,assets are grouped at the lowest levels for which there are separately identifiable cash flows which are largely independent of thecash inflows from other assets or groups of assets (cash generating units). Non-financial assets other than goodwill that suffered animpairment are reviewed for possible reversal of the impairment at each reporting date.
17
The University of SydneyNotes to the financial statements
for the year ended 31 December 2015
(continued)
1 Summary of significant accounting policies (continued)
(ad) New accounting standards and AASB interpretations
A number of new accounting standards, amendments and interpretations have been issued during 2015 or in prior years but are notyet effective. The University has not elected to early adopt any of these new standards or amendments or interpretations apart fromAASB 9 'Financial Instruments'. When applied in future periods, they are not expected to have a material impact on the financialposition or performance of the University, unless stated otherwise hereunder:
(i) AASB 2014-3 'Amendments to Australian Accounting Standards - Accounting for Acquisitions of Interests in Joint Operations'
This standard amends AASB 11 'Joint Arrangements' to provide guidance on the accounting for acquisition of interests in jointoperations in which the activity constitutes a business. The amendments require:
the acquirer of an interest in a joint operation in which the activity constitutes a business, as defined in AASB 3 'Business
Combinations', to apply all of the principles on business combinations accounting in AASB 3 and other Australian Accounting
Standards except for those principles that conflict with the guidance in AASB 11; and
the acquirer to disclose the information required by AASB 3 and other Australian Accounting Standards for business
combinations.
AASB 2014-3 is mandatory for adoption from 1 January 2016.
(ii) AASB 2014-4 'Clarification of Acceptable Methods of Depreciation and Amortisation (Amendments to AASB 116 and AASB 138)'
This standard amends AASB 116 'Property, Plant and Equipment and AASB 138 'Intangible Assets' to:
establish the principle for the basis of depreciation and amortisation as being the expected pattern of consumption of the future
economic benefits of an asset.
clarify that the use of revenue-based methods to calculate the depreciation of an asset is not appropriate because revenue
generated by an activity that includes the use of an asset generally reflects factors other than the consumption of the economic
benefits embodied in the asset; and
clarify that revenue is generally presumed to be an inappropriate basis for measuring the consumption of the economic benefits
embodied in an intangible asset. This presumption, however, can be rebutted in certain limited circumstances.
AASB 2014-4 is mandatory for adoption from 1 January 2016.
(iii) AASB 15 - 'Revenue from Contracts with Customers'
The Australian Accounting Standards Board issued new accounting standard AASB 15 'Revenue from Contracts with Customers' on12 December 2014 which is mandatory for adoption from 1 January 2018. The standard replaces AASB 118 'Revenue', AASB 111'Construction Contracts' and AASB 1004 'Contributions'.
AASB 15 establishes a single and comprehensive framework which sets out how and when revenue is recognised.
The core principle of AASB 15 is that revenue is recognised when transfers of goods or services to customers occur in exchange forconsideration which the vendor expects to be entitled to in exchange for the provision of those goods or services (i.e. fulfillment ofperformance obligations). Revenue will only be recognised when control over the goods or services is transferred to the customer,either over time or at a point in time.
The application of AASB 15 is likely to have a material impact on the University’s revenue recognition policy. However, the impact ofthe new standard is not known or currently estimable and therefore management is currently assessing and quantifying the impactthereof.
(iv) AASB 2014-9 - 'Amendments to Australian Accounting Standards - Equity Method in Separate Financial Statements'
AASB 2014-9 amends AASB 127 'Separate Financial Statements', and consequentially amends AASB 1 'First-time adoption ofAustralian Accounting Standards' and AASB 128 'Investments in Associates and Joint Ventures', to allow entities to use the equitymethod of accounting for investments in subsidiaries, joint ventures and associates in their separate financial statements.
AASB 2014-9 also makes editorial correction to AASB 127. AASB 2014-9 applies to annual reporting periods on or after 1 January2016.
18Page
78
sydn
ey.e
du.a
uTh
e Un
iver
sity
of
Sydn
eyAn
nual
Rep
ort
2015
The University of SydneyNotes to the financial statements
for the year ended 31 December 2015
(continued)
1 Summary of significant accounting policies (continued)
(y) Leases
The University leases various items of plant and equipment under operating leases. Under these arrangements a significant portion ofthe risks and rewards of ownership are retained by the lessor. The costs in relation to these are presented in Note 13 as 'Operatinglease and rental expenses'.
Payments made under operating leases (net of any incentives received from the lessor) are charged to the income statement on astraight-line basis over the period of the lease.
(z) Restricted funds
Restricted funds are funds or assets granted by external parties under conditions that they may only be utilised for specifiedexpenditure purposes and cannot be allocated to general purpose expenditure. The grantor of the funds specifies how the funds areto be used.
(aa) Reserves
The University has the following reserves:
(i) Property, plant and equipment revaluation reserve
This reserve is used to account for the increases or decreases in the value of assets as a result of revaluations. Increases in thevalue of reserves are in accordance with the valuation of assets policies stated in Note 1(m). Decrements in reserves are either ondisposal of assets where the disposed asset had previously been revalued and a reserve existed or on impairment of assets inaccordance with AASB 136 'Impairment of Assets' where a revaluation reserve had existed for that asset class.
(ii) Hedging reserve - cash flow hedges
The hedging reserve is used to record gains or losses on a hedging instrument in a cash flow hedge that are, for the effective portionof changes in the fair value of the interest rate swap, recognised in other comprehensive income, as described in Note 1(k). Any gainor loss in respect of the ineffective portion of an interest rate swap is recognised immediately in profit or loss.
(iii) Associates' reserve
This represents the reserves held by associated entities and is recognised in the consolidated financial statements using the equitymethod of accounting (see Note 40). In addition, an initial asset valuation reserve was created in 1992 for the purpose of bringing toaccount the University’s assets for the first time. This includes the transfer of properties between the University and the Department ofSchool Education in 1994; this transfer did not involve any cash transactions. This initial asset valuation reserve is included inretained earnings.
(ab) Private sector participation in the provision of student accommodation
The University of Sydney has entered into an arrangement where, under a long-term lease of its land in Carillon Avenue, Newtown, astudent university village (SUV) has been constructed and is being operated in partnership with the private sector. This 650-bed SUVwas opened in January 2003. Under the terms of the project deed, ownership in the accommodation complex reverts to the Universityforty years after the opening of the SUV. At this stage the emerging share of the asset is not material.
(ac) Impairment of assets
Goodwill and intangible assets that have an indefinite useful life are not subject to amortisation and are tested annually forimpairment, or more frequently if events or changes in circumstances indicate that they might be impaired. Other assets are reviewedfor impairment whenever events or changes in circumstances indicate that the carrying amount may not be recoverable. Animpairment loss is recognised for the amount by which the asset's carrying amount exceeds its recoverable amount. The recoverableamount is the higher of an asset's fair value less costs of disposal and value in use. For the purposes of assessing impairment,assets are grouped at the lowest levels for which there are separately identifiable cash flows which are largely independent of thecash inflows from other assets or groups of assets (cash generating units). Non-financial assets other than goodwill that suffered animpairment are reviewed for possible reversal of the impairment at each reporting date.
17
The University of SydneyNotes to the financial statements
for the year ended 31 December 2015
(continued)
1 Summary of significant accounting policies (continued)
(ad) New accounting standards and AASB interpretations
A number of new accounting standards, amendments and interpretations have been issued during 2015 or in prior years but are notyet effective. The University has not elected to early adopt any of these new standards or amendments or interpretations apart fromAASB 9 'Financial Instruments'. When applied in future periods, they are not expected to have a material impact on the financialposition or performance of the University, unless stated otherwise hereunder:
(i) AASB 2014-3 'Amendments to Australian Accounting Standards - Accounting for Acquisitions of Interests in Joint Operations'
This standard amends AASB 11 'Joint Arrangements' to provide guidance on the accounting for acquisition of interests in jointoperations in which the activity constitutes a business. The amendments require:
the acquirer of an interest in a joint operation in which the activity constitutes a business, as defined in AASB 3 'Business
Combinations', to apply all of the principles on business combinations accounting in AASB 3 and other Australian Accounting
Standards except for those principles that conflict with the guidance in AASB 11; and
the acquirer to disclose the information required by AASB 3 and other Australian Accounting Standards for business
combinations.
AASB 2014-3 is mandatory for adoption from 1 January 2016.
(ii) AASB 2014-4 'Clarification of Acceptable Methods of Depreciation and Amortisation (Amendments to AASB 116 and AASB 138)'
This standard amends AASB 116 'Property, Plant and Equipment and AASB 138 'Intangible Assets' to:
establish the principle for the basis of depreciation and amortisation as being the expected pattern of consumption of the future
economic benefits of an asset.
clarify that the use of revenue-based methods to calculate the depreciation of an asset is not appropriate because revenue
generated by an activity that includes the use of an asset generally reflects factors other than the consumption of the economic
benefits embodied in the asset; and
clarify that revenue is generally presumed to be an inappropriate basis for measuring the consumption of the economic benefits
embodied in an intangible asset. This presumption, however, can be rebutted in certain limited circumstances.
AASB 2014-4 is mandatory for adoption from 1 January 2016.
(iii) AASB 15 - 'Revenue from Contracts with Customers'
The Australian Accounting Standards Board issued new accounting standard AASB 15 'Revenue from Contracts with Customers' on12 December 2014 which is mandatory for adoption from 1 January 2018. The standard replaces AASB 118 'Revenue', AASB 111'Construction Contracts' and AASB 1004 'Contributions'.
AASB 15 establishes a single and comprehensive framework which sets out how and when revenue is recognised.
The core principle of AASB 15 is that revenue is recognised when transfers of goods or services to customers occur in exchange forconsideration which the vendor expects to be entitled to in exchange for the provision of those goods or services (i.e. fulfillment ofperformance obligations). Revenue will only be recognised when control over the goods or services is transferred to the customer,either over time or at a point in time.
The application of AASB 15 is likely to have a material impact on the University’s revenue recognition policy. However, the impact ofthe new standard is not known or currently estimable and therefore management is currently assessing and quantifying the impactthereof.
(iv) AASB 2014-9 - 'Amendments to Australian Accounting Standards - Equity Method in Separate Financial Statements'
AASB 2014-9 amends AASB 127 'Separate Financial Statements', and consequentially amends AASB 1 'First-time adoption ofAustralian Accounting Standards' and AASB 128 'Investments in Associates and Joint Ventures', to allow entities to use the equitymethod of accounting for investments in subsidiaries, joint ventures and associates in their separate financial statements.
AASB 2014-9 also makes editorial correction to AASB 127. AASB 2014-9 applies to annual reporting periods on or after 1 January2016.
18 Page
79
Fina
ncia
l Re
port
s an
d St
atem
ents
201
5
The University of SydneyNotes to the financial statements
for the year ended 31 December 2015
(continued)
1 Summary of significant accounting policies (continued)
(ad) New accounting standards and AASB interpretations (continued)
(v) AASB 2015-2 - 'Amendments to Australian Accounting Standards - Disclosure Initiative: Amendments to AASB 101'
The standard makes amendment to AASB 101 'Presentation of Financial Statements' arising from the IASB's disclosure initiativeproject.
The amendments are designed to further encourage companies to apply professional judgment in determining what information to
disclose in the financial statements.
The amendments also clarify that companies should use professional judgment in determining where and what order information
is presented in the financial disclosures.
AASB 2015-2 applies to annual reporting periods on or after 1 January 2016.
19
The University of SydneyNotes to the financial statements
for the year ended 31 December 2015
(continued)
2 Australian Government financial assistance including Australian Government loan programs (HELP)
(a) Commonwealth Grant Scheme and other grants
Economic entity(Consolidated)
Parent entity(University)
Notes
2015
$'000
2014
$'000
2015
$'000
2014
$'000
Commonwealth Grant Scheme 297,991 292,800 297,991 292,800Indigenous Support Program 1,169 1,257 1,169 1,257Partnership and Participation Program 3,283 4,208 3,283 4,208Disability Support Program 71 83 71 83Promotion of Excellence in Learning andTeaching - award 70 0 70 0Promotion of Excellence in Learning andTeaching
978 282 978 282
Australian Mathematics and SciencePartnership Program
839 877 839 877
Total Commonwealth Grant Scheme and othergrants 47(a) 304,401 299,507 304,401 299,507
(b) Higher Education Loan Programs
HECS-HELP 172,947 165,884 172,947 165,884FEE-HELP 82,755 75,458 82,755 75,458SA-HELP 4,249 4,244 4,249 4,244
Total Higher Education Loan Programs 47(b) 259,951 245,586 259,951 245,586
(c) Scholarships
Australian Postgraduate Awards 27,416 26,885 27,416 26,885International Postgraduate Research Scholarships 2,193 2,198 2,193 2,198Commonwealth Education Costs Scholarships 610 (12) 610 (12)Commonwealth Accommodation Scholarships 20 7 20 7Indigenous Access Scholarships 44 57 44 57
Total scholarships 47(c) 30,283 29,135 30,283 29,135
(d) Education research
Joint Research Engagement Program 32,051 31,979 32,051 31,979Research Training Scheme 67,901 68,134 67,901 68,134Research Infrastructure Block Grants 27,760 28,386 27,760 28,386JRE Engineering Cadetships 510 377 510 377Sustainable Research Excellence inUniversities 22,684 21,540 22,684 21,540
Total education research grants 47(d) 150,906 150,416 150,906 150,416
(e) Other capital funding
Education Investment Fund 0 6,800 0 6,800
Total other capital funding 47(e) 0 6,800 0 6,800
20Page
80
sydn
ey.e
du.a
uTh
e Un
iver
sity
of
Sydn
eyAn
nual
Rep
ort
2015

The University of SydneyNotes to the financial statements
for the year ended 31 December 2015
(continued)
1 Summary of significant accounting policies (continued)
(ad) New accounting standards and AASB interpretations (continued)
(v) AASB 2015-2 - 'Amendments to Australian Accounting Standards - Disclosure Initiative: Amendments to AASB 101'
The standard makes amendment to AASB 101 'Presentation of Financial Statements' arising from the IASB's disclosure initiativeproject.
The amendments are designed to further encourage companies to apply professional judgment in determining what information to
disclose in the financial statements.
The amendments also clarify that companies should use professional judgment in determining where and what order information
is presented in the financial disclosures.
AASB 2015-2 applies to annual reporting periods on or after 1 January 2016.
19
The University of SydneyNotes to the financial statements
for the year ended 31 December 2015
(continued)
2 Australian Government financial assistance including Australian Government loan programs (HELP)
(a) Commonwealth Grant Scheme and other grants
Economic entity(Consolidated)
Parent entity(University)
Notes
2015
$'000
2014
$'000
2015
$'000
2014
$'000
Commonwealth Grant Scheme 297,991 292,800 297,991 292,800Indigenous Support Program 1,169 1,257 1,169 1,257Partnership and Participation Program 3,283 4,208 3,283 4,208Disability Support Program 71 83 71 83Promotion of Excellence in Learning andTeaching - award 70 0 70 0Promotion of Excellence in Learning andTeaching
978 282 978 282
Australian Mathematics and SciencePartnership Program
839 877 839 877
Total Commonwealth Grant Scheme and othergrants 47(a) 304,401 299,507 304,401 299,507
(b) Higher Education Loan Programs
HECS-HELP 172,947 165,884 172,947 165,884FEE-HELP 82,755 75,458 82,755 75,458SA-HELP 4,249 4,244 4,249 4,244
Total Higher Education Loan Programs 47(b) 259,951 245,586 259,951 245,586
(c) Scholarships
Australian Postgraduate Awards 27,416 26,885 27,416 26,885International Postgraduate Research Scholarships 2,193 2,198 2,193 2,198Commonwealth Education Costs Scholarships 610 (12) 610 (12)Commonwealth Accommodation Scholarships 20 7 20 7Indigenous Access Scholarships 44 57 44 57
Total scholarships 47(c) 30,283 29,135 30,283 29,135
(d) Education research
Joint Research Engagement Program 32,051 31,979 32,051 31,979Research Training Scheme 67,901 68,134 67,901 68,134Research Infrastructure Block Grants 27,760 28,386 27,760 28,386JRE Engineering Cadetships 510 377 510 377Sustainable Research Excellence inUniversities 22,684 21,540 22,684 21,540
Total education research grants 47(d) 150,906 150,416 150,906 150,416
(e) Other capital funding
Education Investment Fund 0 6,800 0 6,800
Total other capital funding 47(e) 0 6,800 0 6,800
20 Page
81
Fina
ncia
l Re
port
s an
d St
atem
ents
201
5

The University of SydneyNotes to the financial statements
for the year ended 31 December 2015
(continued)
2 Australian Government financial assistance including Australian Government loan programs (HELP)(continued)
(f) Australian Research Council
Economic entity(Consolidated)
Parent entity(University)
Notes
2015
$'000
2014
$'000
2015
$'000
2014
$'000
(i) DiscoveryProjects 26,523 29,399 26,523 29,399Fellowships 10,289 12,588 10,289 12,588DECRA 4,211 7,504 4,211 7,504Indigenous researchers development 493 555 493 555
Total discovery 47(f)(i) 41,516 50,046 41,516 50,046
(ii) LinkagesInfrastructure 1,280 1,370 1,280 1,370Industrial transformation research program 2,832 1,870 2,832 1,870Laureate fellowships 5,118 6,286 5,118 6,286Projects 5,857 6,103 5,857 6,103
Total linkages 47(f)(ii) 15,087 15,629 15,087 15,629
(iii) Networks and centresCentres 7,467 7,335 7,467 7,335
Total networks and centres 47(f)(iii) 7,467 7,335 7,467 7,335
Total Australian Research Council 47(f) 64,070 73,010 64,070 73,010
(g) Other Australian Government financial assistance
Non-capitalNational Health and Medical Research Council 96,987 102,959 96,987 102,959Other Commonwealth research funding 36,245 30,006 36,245 30,006Other Commonwealth non-research funding 23,936 27,647 23,936 27,647
Total non-capital 157,168 160,612 157,168 160,612
CapitalOther Commonwealth non-research funding 1,284 100 1,284 100
Total capital 1,284 100 1,284 100
Total Other Australian Government financialassistance 158,452 160,712 158,452 160,712
Total Australian Government financialassistance 968,063 965,166 968,063 965,166
ReconciliationAustralian Government grants (a+c+d+e+f+g) 708,112 719,580 708,112 719,580HECS-HELP 172,947 165,884 172,947 165,884FEE-HELP 82,755 75,458 82,755 75,458SA-HELP 4,249 4,244 4,249 4,244
Total Australian Government financialassistance 968,063 965,166 968,063 965,166
21
The University of SydneyNotes to the financial statements
for the year ended 31 December 2015
(continued)
2 Australian Government financial assistance including Australian Government loan programs (HELP)(continued)
(h) Australian Government grants received - cash basis
Economic entity(Consolidated)
Parent entity(University)
Notes
2015
$'000
2014
$'000
2015
$'000
2014
$'000
Commonwealth Grant Scheme and othergrants
47(a) 307,905 301,627 307,905 301,627
Higher Education Loan Programs 47(b) 260,157 246,747 260,157 246,747Scholarships 47(c) 30,283 29,059 30,283 29,059Education research 47(d) 150,906 150,416 150,906 150,416ARC - Discovery 47(f)(i) 41,516 50,045 41,516 50,045ARC - Linkages 47(f)(ii) 15,087 15,629 15,087 15,629ARC - Networks and centres 47(f)(iii) 7,467 7,335 7,467 7,335Other Australian Government financialassistance
158,453 160,787 158,453 160,787
Other capital funding 47(e) 0 6,800 0 6,800
Total Australian Government grants received -cash basis
971,774 968,445 971,774 968,445
OS-HELP (net) 47(g) 938 981 938 981
Total Australian Government funding received -cash basis
972,712 969,426 972,712 969,426
3 State and local government financial assistance Economic entity
(Consolidated) Parent entity
(University)
2015
$'000
2014
$'000
2015
$'0002014$'000
Non-capitalState government research grants 18,162 20,583 18,162 20,583Other 2,960 2,381 2,960 2,381
Total state and local government financialassistance 21,122 22,964 21,122 22,964
22Page
82
sydn
ey.e
du.a
uTh
e Un
iver
sity
of
Sydn
eyAn
nual
Rep
ort
2015

The University of SydneyNotes to the financial statements
for the year ended 31 December 2015
(continued)
2 Australian Government financial assistance including Australian Government loan programs (HELP)(continued)
(f) Australian Research Council
Economic entity(Consolidated)
Parent entity(University)
Notes
2015
$'000
2014
$'000
2015
$'000
2014
$'000
(i) DiscoveryProjects 26,523 29,399 26,523 29,399Fellowships 10,289 12,588 10,289 12,588DECRA 4,211 7,504 4,211 7,504Indigenous researchers development 493 555 493 555
Total discovery 47(f)(i) 41,516 50,046 41,516 50,046
(ii) LinkagesInfrastructure 1,280 1,370 1,280 1,370Industrial transformation research program 2,832 1,870 2,832 1,870Laureate fellowships 5,118 6,286 5,118 6,286Projects 5,857 6,103 5,857 6,103
Total linkages 47(f)(ii) 15,087 15,629 15,087 15,629
(iii) Networks and centresCentres 7,467 7,335 7,467 7,335
Total networks and centres 47(f)(iii) 7,467 7,335 7,467 7,335
Total Australian Research Council 47(f) 64,070 73,010 64,070 73,010
(g) Other Australian Government financial assistance
Non-capitalNational Health and Medical Research Council 96,987 102,959 96,987 102,959Other Commonwealth research funding 36,245 30,006 36,245 30,006Other Commonwealth non-research funding 23,936 27,647 23,936 27,647
Total non-capital 157,168 160,612 157,168 160,612
CapitalOther Commonwealth non-research funding 1,284 100 1,284 100
Total capital 1,284 100 1,284 100
Total Other Australian Government financialassistance 158,452 160,712 158,452 160,712
Total Australian Government financialassistance 968,063 965,166 968,063 965,166
ReconciliationAustralian Government grants (a+c+d+e+f+g) 708,112 719,580 708,112 719,580HECS-HELP 172,947 165,884 172,947 165,884FEE-HELP 82,755 75,458 82,755 75,458SA-HELP 4,249 4,244 4,249 4,244
Total Australian Government financialassistance 968,063 965,166 968,063 965,166
21
The University of SydneyNotes to the financial statements
for the year ended 31 December 2015
(continued)
2 Australian Government financial assistance including Australian Government loan programs (HELP)(continued)
(h) Australian Government grants received - cash basis
Economic entity(Consolidated)
Parent entity(University)
Notes
2015
$'000
2014
$'000
2015
$'000
2014
$'000
Commonwealth Grant Scheme and othergrants
47(a) 307,905 301,627 307,905 301,627
Higher Education Loan Programs 47(b) 260,157 246,747 260,157 246,747Scholarships 47(c) 30,283 29,059 30,283 29,059Education research 47(d) 150,906 150,416 150,906 150,416ARC - Discovery 47(f)(i) 41,516 50,045 41,516 50,045ARC - Linkages 47(f)(ii) 15,087 15,629 15,087 15,629ARC - Networks and centres 47(f)(iii) 7,467 7,335 7,467 7,335Other Australian Government financialassistance
158,453 160,787 158,453 160,787
Other capital funding 47(e) 0 6,800 0 6,800
Total Australian Government grants received -cash basis
971,774 968,445 971,774 968,445
OS-HELP (net) 47(g) 938 981 938 981
Total Australian Government funding received -cash basis
972,712 969,426 972,712 969,426
3 State and local government financial assistance Economic entity
(Consolidated) Parent entity
(University)
2015
$'000
2014
$'000
2015
$'0002014$'000
Non-capitalState government research grants 18,162 20,583 18,162 20,583Other 2,960 2,381 2,960 2,381
Total state and local government financialassistance 21,122 22,964 21,122 22,964
22 Page
83
Fina
ncia
l Re
port
s an
d St
atem
ents
201
5

The University of SydneyNotes to the financial statements
for the year ended 31 December 2015
(continued)
4 Fees and charges Economic entity
(Consolidated) Parent entity
(University)
2015
$'000
2014
$'000
2015
$'000
2014
$'000
Course fees and chargesFee-paying onshore overseas students 479,607 391,162 479,607 391,162Continuing education 16,027 14,115 15,383 13,778Fee-paying domestic postgraduate students 30,923 25,816 30,923 25,816Fee-paying domestic undergraduate students 4,044 4,134 4,044 4,134Students undertaking non-award courses 1,237 1,201 1,237 1,201Other course fees and charges 36,452 30,015 36,452 30,015Law extension course fees 2,475 2,459 2,475 2,459
Total course fees and charges 570,765 468,902 570,121 468,565
Other non-course fees and chargesHire of equipment and venues 3,255 2,918 3,255 2,918Parking fees 2,853 2,671 2,853 2,671Rental - other 3,591 2,819 3,507 2,819Student residences 13,850 7,849 13,850 7,849Miscellaneous 4,181 3,321 4,181 3,321Student Services and Amenities Fees fromstudents 9,633 8,829 9,633 8,829
Total non-course fees and charges 37,363 28,407 37,279 28,407
Total fees and charges 608,128 497,309 607,400 496,972
5 Investment revenue and income Economic entity
(Consolidated) Parent entity
(University)
2015
$'000
2014
$'000
2015
$'000
2014
$'000
Distributions from managed funds 44,741 30,017 44,741 30,017 Dividends received 16,164 17,480 16,164 17,480
Interest received 19,475 21,564 19,572 21,653 Realised gains/(losses) (21,664) (6,298) (21,664) (6,298)
Unrealised gains/(losses) and other investmentincome 45,789 19,650 45,198 19,455
Total investment revenue 104,505 82,413 104,011 82,307
Change in fair value of financial assets designatedat fair value through profit or loss (7,584) 34,143 (7,584) 34,143
Total other investment income (7,584) 34,143 (7,584) 34,143
Total investment income 96,921 116,556 96,427 116,450
6 Consultancy and contracts
Economic entity(Consolidated)
Parent entity(University)
2015
$'000
2014
$'000
2015
$'000
2014
$'000
Local collaborative and other research 11,065 11,351 11,065 11,351Consultancy 8,742 7,078 8,742 7,078Contract research industry 8,870 9,294 8,870 9,294Contract research individuals and foundations 45,979 43,001 45,979 43,001Contract research overseas organisations 27,600 25,189 27,600 25,189
Total consultancy and contracts 102,256 95,913 102,256 95,913
23
The University of SydneyNotes to the financial statements
for the year ended 31 December 2015
(continued)
7 Other revenue and income
Economic entity(Consolidated)
Parent entity(University)
2015
$'000
2014
$'000
2015
$'000
2014
$'000
Other revenuePhilanthropic income* 70,054 59,438 70,054 59,438Sponsorship income 4,999 4,387 4,845 4,310
Total other revenue 75,053 63,825 74,899 63,748
Other incomeVeterinary/medical practice income 13,931 14,495 13,931 14,495Reimbursement income 14,595 15,382 14,557 15,382
Commission received 1,778 1,307 1,778 1,307Memberships and subscriptions 401 360 401 360Contributions (external organisations) 41,874 40,685 41,874 40,711Shop sales (incl. commercial services) 13,607 10,038 4,325 4,631Farms 4,219 2,791 4,219 2,791Other 7,804 17,902 8,682 18,509
Total other income 98,209 102,960 89,767 98,186
Total other revenue and income 173,262 166,785 164,666 161,934
* Income received as donations, bequests and other philanthropic sources.
8 Gain/(loss) on disposal of assets Economic entity
(Consolidated) Parent entity
(University)
2015
$'000
2014
$'000
2015
$'000
2014
$'000
Disposal of property, plant and equipmentProceeds from sale 191 566 191 562Carrying amount of assets sold (105) (485) (105) (485)
Gain from disposal of property, plant andequipment 86 81 86 77
Disposal of assets held for saleProceeds from sale 46,000 0 46,000 0Carrying amount of asset sold (14,412) 0 (14,412) 0
Gain from disposal of assets held for sale 31,588 0 31,588 0
Net gain/(loss) on disposal of assets 31,674 81 31,674 77
The consolidated net gain on disposal of property, plant and equipment in 2015 includes a gain of $82k (2014: loss of $100k) onmotor vehicles, a gain of $4k (2014: $181k) on other property, plant and equipment and a gain of $31,588k on the sale of assets heldfor sale (2014: nil).
24Page
84
sydn
ey.e
du.a
uTh
e Un
iver
sity
of
Sydn
eyAn
nual
Rep
ort
2015

The University of SydneyNotes to the financial statements
for the year ended 31 December 2015
(continued)
4 Fees and charges Economic entity
(Consolidated) Parent entity
(University)
2015
$'000
2014
$'000
2015
$'000
2014
$'000
Course fees and chargesFee-paying onshore overseas students 479,607 391,162 479,607 391,162Continuing education 16,027 14,115 15,383 13,778Fee-paying domestic postgraduate students 30,923 25,816 30,923 25,816Fee-paying domestic undergraduate students 4,044 4,134 4,044 4,134Students undertaking non-award courses 1,237 1,201 1,237 1,201Other course fees and charges 36,452 30,015 36,452 30,015Law extension course fees 2,475 2,459 2,475 2,459
Total course fees and charges 570,765 468,902 570,121 468,565
Other non-course fees and chargesHire of equipment and venues 3,255 2,918 3,255 2,918Parking fees 2,853 2,671 2,853 2,671Rental - other 3,591 2,819 3,507 2,819Student residences 13,850 7,849 13,850 7,849Miscellaneous 4,181 3,321 4,181 3,321Student Services and Amenities Fees fromstudents 9,633 8,829 9,633 8,829
Total non-course fees and charges 37,363 28,407 37,279 28,407
Total fees and charges 608,128 497,309 607,400 496,972
5 Investment revenue and income Economic entity
(Consolidated) Parent entity
(University)
2015
$'000
2014
$'000
2015
$'000
2014
$'000
Distributions from managed funds 44,741 30,017 44,741 30,017 Dividends received 16,164 17,480 16,164 17,480
Interest received 19,475 21,564 19,572 21,653 Realised gains/(losses) (21,664) (6,298) (21,664) (6,298)
Unrealised gains/(losses) and other investmentincome 45,789 19,650 45,198 19,455
Total investment revenue 104,505 82,413 104,011 82,307
Change in fair value of financial assets designatedat fair value through profit or loss (7,584) 34,143 (7,584) 34,143
Total other investment income (7,584) 34,143 (7,584) 34,143
Total investment income 96,921 116,556 96,427 116,450
6 Consultancy and contracts
Economic entity(Consolidated)
Parent entity(University)
2015
$'000
2014
$'000
2015
$'000
2014
$'000
Local collaborative and other research 11,065 11,351 11,065 11,351Consultancy 8,742 7,078 8,742 7,078Contract research industry 8,870 9,294 8,870 9,294Contract research individuals and foundations 45,979 43,001 45,979 43,001Contract research overseas organisations 27,600 25,189 27,600 25,189
Total consultancy and contracts 102,256 95,913 102,256 95,913
23
The University of SydneyNotes to the financial statements
for the year ended 31 December 2015
(continued)
7 Other revenue and income
Economic entity(Consolidated)
Parent entity(University)
2015
$'000
2014
$'000
2015
$'000
2014
$'000
Other revenuePhilanthropic income* 70,054 59,438 70,054 59,438Sponsorship income 4,999 4,387 4,845 4,310
Total other revenue 75,053 63,825 74,899 63,748
Other incomeVeterinary/medical practice income 13,931 14,495 13,931 14,495Reimbursement income 14,595 15,382 14,557 15,382
Commission received 1,778 1,307 1,778 1,307Memberships and subscriptions 401 360 401 360Contributions (external organisations) 41,874 40,685 41,874 40,711Shop sales (incl. commercial services) 13,607 10,038 4,325 4,631Farms 4,219 2,791 4,219 2,791Other 7,804 17,902 8,682 18,509
Total other income 98,209 102,960 89,767 98,186
Total other revenue and income 173,262 166,785 164,666 161,934
* Income received as donations, bequests and other philanthropic sources.
8 Gain/(loss) on disposal of assets Economic entity
(Consolidated) Parent entity
(University)
2015
$'000
2014
$'000
2015
$'000
2014
$'000
Disposal of property, plant and equipmentProceeds from sale 191 566 191 562Carrying amount of assets sold (105) (485) (105) (485)
Gain from disposal of property, plant andequipment 86 81 86 77
Disposal of assets held for saleProceeds from sale 46,000 0 46,000 0Carrying amount of asset sold (14,412) 0 (14,412) 0
Gain from disposal of assets held for sale 31,588 0 31,588 0
Net gain/(loss) on disposal of assets 31,674 81 31,674 77
The consolidated net gain on disposal of property, plant and equipment in 2015 includes a gain of $82k (2014: loss of $100k) onmotor vehicles, a gain of $4k (2014: $181k) on other property, plant and equipment and a gain of $31,588k on the sale of assets heldfor sale (2014: nil).
24 Page
85
Fina
ncia
l Re
port
s an
d St
atem
ents
201
5

The University of SydneyNotes to the financial statements
for the year ended 31 December 2015
(continued)
9 Employee-related expenses
Economic entity(Consolidated)
Parent entity(University)
2015
$'000
2014
$'000
2015
$'000
2014
$'000
AcademicSalaries 420,828 401,971 420,828 401,971
Contributions to superannuation and pensionschemes:
Contributions to funded schemes 65,418 61,520 65,418 61,520Contributions to unfunded schemes 2,538 (19,267) 2,538 (19,267)
Payroll tax 28,193 26,736 28,193 26,736 Workers' compensation 981 1,048 981 1,048
Long service leave expense 15,118 17,920 15,118 17,920Annual leave 29,864 27,056 29,864 27,056Severance fixed term 773 878 773 878Termination payments 1,296 1,878 1,296 1,878
Total academic 565,009 519,740 565,009 519,740
Non-academicSalaries 369,748 348,121 366,441 346,113
Contributions to superannuation and pensionschemes
Contributions to funded schemes 55,442 50,814 54,785 50,477Contributions to unfunded schemes 2,735 (15,180) 2,735 (15,180)
Payroll tax 24,649 22,611 24,257 22,617Workers' compensation 360 335 357 333Long service leave expense 11,405 12,907 11,334 12,875Annual leave 26,111 23,280 25,992 23,210Severance fixed term 619 479 619 478Termination payments 10,090 5,398 10,090 5,286
Total non-academic 501,159 448,765 496,610 446,209
Deferred employment benefits for superannuation* 51 5,375 51 5,375
Total employee related expenses 1,066,219 973,880 1,061,670 971,324
* Includes expense of $51k (2014: income ($160k)) for the Professorial Superannuation Scheme and expense of nil (2014: expense$5,535k) for the State Authorities Non-contributory Scheme.
10 Depreciation and amortisation Economic entity
(Consolidated) Parent entity
(University)
2015
$'000
2014
$'000
2015
$'000
2014
$'000
DepreciationTeaching and research buildings 50,312 48,677 50,158 48,667Plant and equipment 46,073 40,210 46,030 40,012Leasehold improvements 4,268 4,054 4,268 4,054Infrastructure 3,599 3,676 3,599 3,676Library collection 47,150 46,979 47,150 46,979Commercial buildings 5,281 4,127 5,281 4,127
Total depreciation 156,683 147,723 156,486 147,515
AmortisationIntangible assets 17,173 11,619 17,173 11,619
Total depreciation and amortisation 173,856 159,342 173,659 159,134
25
The University of SydneyNotes to the financial statements
for the year ended 31 December 2015
(continued)
11 Repairs and maintenance Economic entity
(Consolidated) Parent entity
(University)
2015
$'000
2014
$'000
2015
$'000
2014
$'000
Maintenance of buildings and grounds 27,921 26,559 27,868 26,476Other buildings and grounds expenses 30,455 34,503 30,354 34,373Equipment repairs and maintenance 12,629 13,808 12,502 13,582
Total repairs and maintenance 71,005 74,870 70,724 74,431
12 Impairment of assets Economic entity
(Consolidated) Parent entity
(University)
2015
$'000
2014
$'000
2015
$'000
2014
$'000
Bad debts 260 869 81 761Doubtful debts 971 (329) 893 (318)
Total impairment of assets 1,231 540 974 443
13 Other expenses Economic entity
(Consolidated) Parent entity
(University)
2015
$'000
2014
$'000
2015
$'000
2014
$'000
Non-capitalised equipment 33,242 25,743 33,208 25,734Advertising, marketing and promotional expenses 8,759 7,704 8,517 7,619Audit fees, bank charges, legal costs, insuranceand taxes 14,505 12,624 14,214 12,371Printing and stationery 12,961 11,432 12,956 11,402Operating lease and rental expenses 17,933 16,596 17,926 16,591Rent and room hire 13,175 10,232 12,578 9,900Telecommunications 10,448 11,855 10,377 11,814Travel and related staff development and training 46,700 42,563 46,514 42,483Farm operations 7,882 6,221 7,882 6,221Laboratory, medical supplies and materials 28,507 23,682 27,282 23,168Library materials 6,519 5,905 6,452 5,870Licences, patents, copyright and commissions 25,998 22,998 25,940 22,965Miscellaneous expenses 16,589 18,236 16,286 17,987Retired assets at net book value 973 1,498 973 1,498Non-capitalised project costs 12,770 12,013 12,765 12,013
Total other expenses 256,961 229,302 253,870 227,636
14 Borrowing costs
Economic entity(Consolidated)
Parent entity(University)
2015
$'000
2014
$'000
2015
$'000
2014
$'000
Fees and charges 388 622 388 622Interest expense 22,144 18,015 22,144 18,015
Total borrowing costs 22,532 18,637 22,532 18,637
26Page
86
sydn
ey.e
du.a
uTh
e Un
iver
sity
of
Sydn
eyAn
nual
Rep
ort
2015

The University of SydneyNotes to the financial statements
for the year ended 31 December 2015
(continued)
9 Employee-related expenses
Economic entity(Consolidated)
Parent entity(University)
2015
$'000
2014
$'000
2015
$'000
2014
$'000
AcademicSalaries 420,828 401,971 420,828 401,971
Contributions to superannuation and pensionschemes:
Contributions to funded schemes 65,418 61,520 65,418 61,520Contributions to unfunded schemes 2,538 (19,267) 2,538 (19,267)
Payroll tax 28,193 26,736 28,193 26,736 Workers' compensation 981 1,048 981 1,048
Long service leave expense 15,118 17,920 15,118 17,920Annual leave 29,864 27,056 29,864 27,056Severance fixed term 773 878 773 878Termination payments 1,296 1,878 1,296 1,878
Total academic 565,009 519,740 565,009 519,740
Non-academicSalaries 369,748 348,121 366,441 346,113
Contributions to superannuation and pensionschemes
Contributions to funded schemes 55,442 50,814 54,785 50,477Contributions to unfunded schemes 2,735 (15,180) 2,735 (15,180)
Payroll tax 24,649 22,611 24,257 22,617Workers' compensation 360 335 357 333Long service leave expense 11,405 12,907 11,334 12,875Annual leave 26,111 23,280 25,992 23,210Severance fixed term 619 479 619 478Termination payments 10,090 5,398 10,090 5,286
Total non-academic 501,159 448,765 496,610 446,209
Deferred employment benefits for superannuation* 51 5,375 51 5,375
Total employee related expenses 1,066,219 973,880 1,061,670 971,324
* Includes expense of $51k (2014: income ($160k)) for the Professorial Superannuation Scheme and expense of nil (2014: expense$5,535k) for the State Authorities Non-contributory Scheme.
10 Depreciation and amortisation Economic entity
(Consolidated) Parent entity
(University)
2015
$'000
2014
$'000
2015
$'000
2014
$'000
DepreciationTeaching and research buildings 50,312 48,677 50,158 48,667Plant and equipment 46,073 40,210 46,030 40,012Leasehold improvements 4,268 4,054 4,268 4,054Infrastructure 3,599 3,676 3,599 3,676Library collection 47,150 46,979 47,150 46,979Commercial buildings 5,281 4,127 5,281 4,127
Total depreciation 156,683 147,723 156,486 147,515
AmortisationIntangible assets 17,173 11,619 17,173 11,619
Total depreciation and amortisation 173,856 159,342 173,659 159,134
25
The University of SydneyNotes to the financial statements
for the year ended 31 December 2015
(continued)
11 Repairs and maintenance Economic entity
(Consolidated) Parent entity
(University)
2015
$'000
2014
$'000
2015
$'000
2014
$'000
Maintenance of buildings and grounds 27,921 26,559 27,868 26,476Other buildings and grounds expenses 30,455 34,503 30,354 34,373Equipment repairs and maintenance 12,629 13,808 12,502 13,582
Total repairs and maintenance 71,005 74,870 70,724 74,431
12 Impairment of assets Economic entity
(Consolidated) Parent entity
(University)
2015
$'000
2014
$'000
2015
$'000
2014
$'000
Bad debts 260 869 81 761Doubtful debts 971 (329) 893 (318)
Total impairment of assets 1,231 540 974 443
13 Other expenses Economic entity
(Consolidated) Parent entity
(University)
2015
$'000
2014
$'000
2015
$'000
2014
$'000
Non-capitalised equipment 33,242 25,743 33,208 25,734Advertising, marketing and promotional expenses 8,759 7,704 8,517 7,619Audit fees, bank charges, legal costs, insuranceand taxes 14,505 12,624 14,214 12,371Printing and stationery 12,961 11,432 12,956 11,402Operating lease and rental expenses 17,933 16,596 17,926 16,591Rent and room hire 13,175 10,232 12,578 9,900Telecommunications 10,448 11,855 10,377 11,814Travel and related staff development and training 46,700 42,563 46,514 42,483Farm operations 7,882 6,221 7,882 6,221Laboratory, medical supplies and materials 28,507 23,682 27,282 23,168Library materials 6,519 5,905 6,452 5,870Licences, patents, copyright and commissions 25,998 22,998 25,940 22,965Miscellaneous expenses 16,589 18,236 16,286 17,987Retired assets at net book value 973 1,498 973 1,498Non-capitalised project costs 12,770 12,013 12,765 12,013
Total other expenses 256,961 229,302 253,870 227,636
14 Borrowing costs
Economic entity(Consolidated)
Parent entity(University)
2015
$'000
2014
$'000
2015
$'000
2014
$'000
Fees and charges 388 622 388 622Interest expense 22,144 18,015 22,144 18,015
Total borrowing costs 22,532 18,637 22,532 18,637
26 Page
87
Fina
ncia
l Re
port
s an
d St
atem
ents
201
5

The University of SydneyNotes to the financial statements
for the year ended 31 December 2015
(continued)
15 Income tax
(a) Income tax (benefit)/expense
Economic entity(Consolidated)
2015
$'000
2014
$'000
The components of tax expense comprise:Current tax expense 391 270Deferred tax expense (336) (165)
Income tax (benefit)/expense 55 105
(b) Numerical reconciliation of income tax expense to prima facie tax payable
Net result before income tax expense 159,853 161,700Tax at the Australian tax rate of 30% (2014: 30%) 47,956 48,510
Tax effect of amounts which are notdeductible/(taxable) in calculating taxableincome/(loss) of the tax exempt entities
(47,464) (48,324)
Differential on tax attributed to equity accountedentities
(327) (61)
Reversal of prior period deferred tax assets 0 (11)Tax effect of non-deductible expenditure 5 2Current period tax losses not brought toaccount
0 59
Utilisation of prior period tax losses nowbrought to account
(115) (70)
Total income tax expense 55 105
16 Cash and cash equivalents Economic entity
(Consolidated) Parent entity
(University)
2015
$'000
2014
$'000
2015
$'000
2014
$'000
Cash at bank and on hand 150,213 97,206 147,266 95,776Short term deposits* 204,459 286,516 204,459 286,266
Total cash and cash equivalents** 354,672 383,722 351,725 382,042
As at 31 December 2015, the amount of cash and cash equivalents held by the University that was subject to capital preserved trustrestrictions was $13.4m (2014: $19.9m).
* Short-term deposits includes term deposits held by the University which are used to meet operational cash flow requirements, areshort-term in nature, highly liquid and are not subject to significant change in value.
** These are interest bearing at a variable average rate of 2.47% (2014: 3.08%).
Reconciliation to cash at the end of the year
The above figures are reconciled to cash at the end of the year as shown in the statement of cash flows as follows:
Economic entity(Consolidated)
Parent entity(University)
2015
$'000
2014
$'000
2015
$'000
2014
$'000
Cash and cash equivalents 354,672 383,722 351,725 382,042
Balance per statement of cash flows 354,672 383,722 351,725 382,042
27
The University of SydneyNotes to the financial statements
for the year ended 31 December 2015
(continued)
17 Receivables Economic entity
(Consolidated) Parent entity
(University)
2015
$'000
2014
$'000
2015
$'000
2014
$'000
Current
Student feesStudent fees 21,575 13,516 21,575 13,516Less: provision for impaired receivables (1,507) (579) (1,507) (579)
Total student fees 20,068 12,937 20,068 12,937
GST recoverableGST receivable 7,078 7,859 6,922 7,765GST payable (2,133) (1,821) (1,892) (1,787)
Net GST recoverable 4,945 6,038 5,030 5,978
DebtorsDebtors 27,847 34,608 26,911 33,942Less: provision for impaired receivables (1,131) (1,038) (1,001) (1,038)
Total debtors 26,716 33,570 25,910 32,904
OtherStudent loans 431 399 431 399Less: provision for other impaired receivables (57) (54) (57) (54)Amount due from controlled entities 0 0 2,200 598Other receivables 236 181 236 181Accrued income 14,091 27,833 14,056 27,771
Total other 14,701 28,359 16,866 28,895
Total current receivables 66,430 80,904 67,874 80,714
Non-current
Deferred government benefits for superannuation 36(d) 1,564,430 1,490,471 1,564,430 1,490,471Super Asset Plan (State AuthoritiesSuperannuation Trustee Corporation)
36(d) 4,890 16,363 4,890 16,363
Super Asset Plan (Professorial SuperannuationSystem)
36(d) 595 728 595 728
Staff loans 344 394 344 394Student loans 107 144 107 144
Total non-current receivables 1,570,366 1,508,100 1,570,366 1,508,100
Total receivables 1,636,796 1,589,004 1,638,240 1,588,814
28Page
88
sydn
ey.e
du.a
uTh
e Un
iver
sity
of
Sydn
eyAn
nual
Rep
ort
2015

The University of SydneyNotes to the financial statements
for the year ended 31 December 2015
(continued)
15 Income tax
(a) Income tax (benefit)/expense
Economic entity(Consolidated)
2015
$'000
2014
$'000
The components of tax expense comprise:Current tax expense 391 270Deferred tax expense (336) (165)
Income tax (benefit)/expense 55 105
(b) Numerical reconciliation of income tax expense to prima facie tax payable
Net result before income tax expense 159,853 161,700Tax at the Australian tax rate of 30% (2014: 30%) 47,956 48,510
Tax effect of amounts which are notdeductible/(taxable) in calculating taxableincome/(loss) of the tax exempt entities
(47,464) (48,324)
Differential on tax attributed to equity accountedentities
(327) (61)
Reversal of prior period deferred tax assets 0 (11)Tax effect of non-deductible expenditure 5 2Current period tax losses not brought toaccount
0 59
Utilisation of prior period tax losses nowbrought to account
(115) (70)
Total income tax expense 55 105
16 Cash and cash equivalents Economic entity
(Consolidated) Parent entity
(University)
2015
$'000
2014
$'000
2015
$'000
2014
$'000
Cash at bank and on hand 150,213 97,206 147,266 95,776Short term deposits* 204,459 286,516 204,459 286,266
Total cash and cash equivalents** 354,672 383,722 351,725 382,042
As at 31 December 2015, the amount of cash and cash equivalents held by the University that was subject to capital preserved trustrestrictions was $13.4m (2014: $19.9m).
* Short-term deposits includes term deposits held by the University which are used to meet operational cash flow requirements, areshort-term in nature, highly liquid and are not subject to significant change in value.
** These are interest bearing at a variable average rate of 2.47% (2014: 3.08%).
Reconciliation to cash at the end of the year
The above figures are reconciled to cash at the end of the year as shown in the statement of cash flows as follows:
Economic entity(Consolidated)
Parent entity(University)
2015
$'000
2014
$'000
2015
$'000
2014
$'000
Cash and cash equivalents 354,672 383,722 351,725 382,042
Balance per statement of cash flows 354,672 383,722 351,725 382,042
27
The University of SydneyNotes to the financial statements
for the year ended 31 December 2015
(continued)
17 Receivables Economic entity
(Consolidated) Parent entity
(University)
2015
$'000
2014
$'000
2015
$'000
2014
$'000
Current
Student feesStudent fees 21,575 13,516 21,575 13,516Less: provision for impaired receivables (1,507) (579) (1,507) (579)
Total student fees 20,068 12,937 20,068 12,937
GST recoverableGST receivable 7,078 7,859 6,922 7,765GST payable (2,133) (1,821) (1,892) (1,787)
Net GST recoverable 4,945 6,038 5,030 5,978
DebtorsDebtors 27,847 34,608 26,911 33,942Less: provision for impaired receivables (1,131) (1,038) (1,001) (1,038)
Total debtors 26,716 33,570 25,910 32,904
OtherStudent loans 431 399 431 399Less: provision for other impaired receivables (57) (54) (57) (54)Amount due from controlled entities 0 0 2,200 598Other receivables 236 181 236 181Accrued income 14,091 27,833 14,056 27,771
Total other 14,701 28,359 16,866 28,895
Total current receivables 66,430 80,904 67,874 80,714
Non-current
Deferred government benefits for superannuation 36(d) 1,564,430 1,490,471 1,564,430 1,490,471Super Asset Plan (State AuthoritiesSuperannuation Trustee Corporation)
36(d) 4,890 16,363 4,890 16,363
Super Asset Plan (Professorial SuperannuationSystem)
36(d) 595 728 595 728
Staff loans 344 394 344 394Student loans 107 144 107 144
Total non-current receivables 1,570,366 1,508,100 1,570,366 1,508,100
Total receivables 1,636,796 1,589,004 1,638,240 1,588,814
28 Page
89
Fina
ncia
l Re
port
s an
d St
atem
ents
201
5

The University of SydneyNotes to the financial statements
for the year ended 31 December 2015
(continued)
17 Receivables (continued)
(a) Impaired receivables
As at 31 December 2015 current receivables of the University with a nominal value of $2,695k (2014: $1,671k) were impaired.
The amount of the provision that relates to specific provisions was $2,589k (2014: $1,350k).The individually impaired receivablesmainly relate to private sector organisations which are in unexpectedly difficult economic situations.
The remaining provision of $106k (2014: $321k) is a provision for a portion of receivables over ninety days where it was assessed thatthis portion of the receivables is not expected to be recovered.
The ageing of these receivables is as follows:
Economic entity(Consolidated)
Parent entity(University)
2015
$'000
2014
$'000
2015
$'000
2014
$'000
3 to 6 months 90 206 90 2066 to 12 months 450 212 450 212Over 12 months 2,155 1,253 2,024 1,253
Total current impaired receivables 2,695 1,671 2,564 1,671
As at 31 December 2015 trade receivables of $24,883k (2014: $22,122k) were past due but not impaired. These relate to a numberof independent customers for whom there is no recent history of default.
The ageing analysis of these receivables is as follows:
Economic entity(Consolidated)
Parent entity(University)
2015
$'000
2014
$'000
2015
$'000
2014
$'000
Under 3 months 7,564 6,956 7,095 6,5763 to 6 months 9,176 11,102 9,061 11,0086 to 12 months 5,267 2,297 5,229 2,297Over 12 months 2,876 1,767 2,876 1,767
Total past due but not impairedreceivables 24,883 22,122 24,261 21,648
Movements in the provision for other impaired receivables are as follows:
Economic entity(Consolidated)
Parent entity(University)
2015
$'000
2014
$'000
2015
$'000
2014
$'000
At 1 January 1,671 2,003 1,671 1,989Provision for impairment recognisedduring the year
1,084 387 953 387
Receivables written off during the year (60) (719) (60) (705)
At 31 December 2,695 1,671 2,564 1,671
The creation and release of the provision for impaired receivables has been included in 'Impairment of assets’ in the incomestatement. Amounts charged to the provision account are generally written off when there is no expectation of recovering additionalcash. The other amounts within receivables do not contain impaired assets and are not past due. Based on credit history, it isexpected that these amounts will be received when due.
29
The University of SydneyNotes to the financial statements
for the year ended 31 December 2015
(continued)
17 Receivables (continued)
(b) Foreign exchange and interest rate risk
The carrying amounts of the consolidated and parent entity's current and non-current receivables are denominated in Australiandollars and are non-interest bearing.
18 Assets held for sale Economic entity
(Consolidated) Parent entity
(University)
2015
$'000
2014
$'000
2015
$'000
2014
$'000
Assets held for sale 600 14,412 600 14,412
Total assets held for sale 600 14,412 600 14,412
The University signed an irrevocable deed for the sale of a building in 2014. The sale of this building was completed on 30 June 2015.The University signed a contract for the sale of another property in 2015, for which settlement is scheduled to occur in January 2016.
19 Inventories Economic entity
(Consolidated) Parent entity
(University)
2015
$'000
2014
$'000
2015
$'000
2014
$'000
Current Harvested crops and other inventory 179 280 179 249
Total inventories 179 280 179 249
30Page
90
sydn
ey.e
du.a
uTh
e Un
iver
sity
of
Sydn
eyAn
nual
Rep
ort
2015
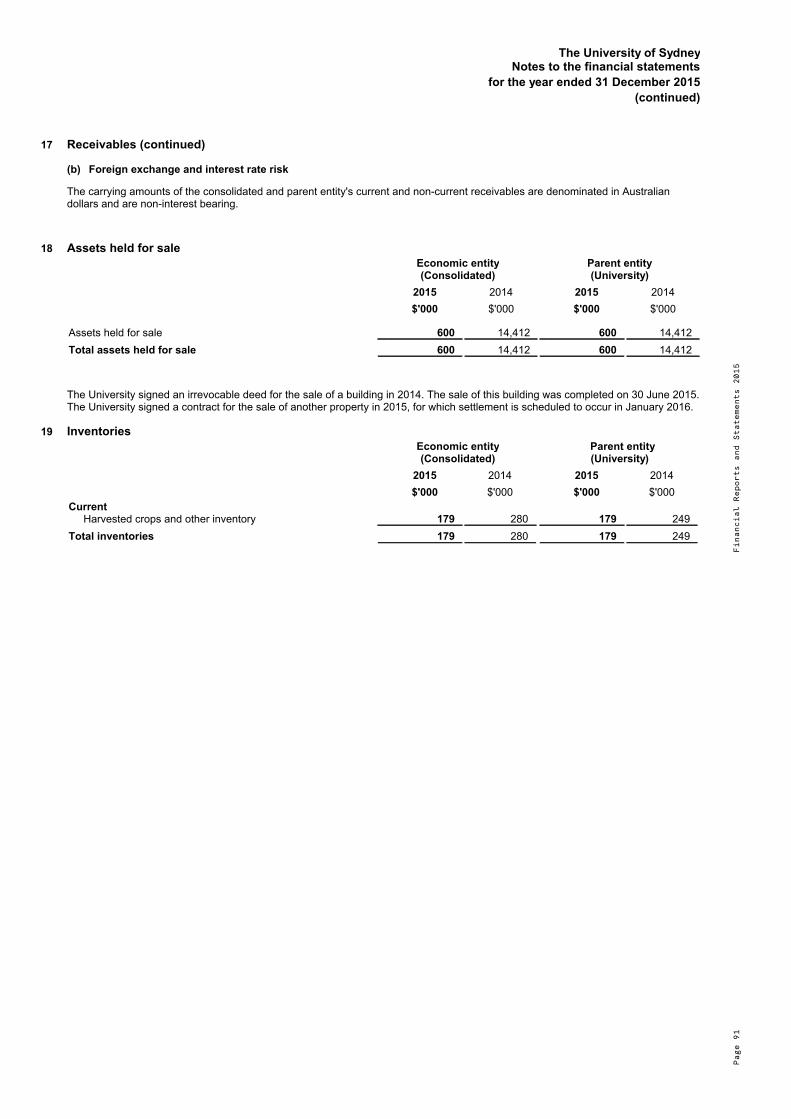
The University of SydneyNotes to the financial statements
for the year ended 31 December 2015
(continued)
17 Receivables (continued)
(a) Impaired receivables
As at 31 December 2015 current receivables of the University with a nominal value of $2,695k (2014: $1,671k) were impaired.
The amount of the provision that relates to specific provisions was $2,589k (2014: $1,350k).The individually impaired receivablesmainly relate to private sector organisations which are in unexpectedly difficult economic situations.
The remaining provision of $106k (2014: $321k) is a provision for a portion of receivables over ninety days where it was assessed thatthis portion of the receivables is not expected to be recovered.
The ageing of these receivables is as follows:
Economic entity(Consolidated)
Parent entity(University)
2015
$'000
2014
$'000
2015
$'000
2014
$'000
3 to 6 months 90 206 90 2066 to 12 months 450 212 450 212Over 12 months 2,155 1,253 2,024 1,253
Total current impaired receivables 2,695 1,671 2,564 1,671
As at 31 December 2015 trade receivables of $24,883k (2014: $22,122k) were past due but not impaired. These relate to a numberof independent customers for whom there is no recent history of default.
The ageing analysis of these receivables is as follows:
Economic entity(Consolidated)
Parent entity(University)
2015
$'000
2014
$'000
2015
$'000
2014
$'000
Under 3 months 7,564 6,956 7,095 6,5763 to 6 months 9,176 11,102 9,061 11,0086 to 12 months 5,267 2,297 5,229 2,297Over 12 months 2,876 1,767 2,876 1,767
Total past due but not impairedreceivables 24,883 22,122 24,261 21,648
Movements in the provision for other impaired receivables are as follows:
Economic entity(Consolidated)
Parent entity(University)
2015
$'000
2014
$'000
2015
$'000
2014
$'000
At 1 January 1,671 2,003 1,671 1,989Provision for impairment recognisedduring the year
1,084 387 953 387
Receivables written off during the year (60) (719) (60) (705)
At 31 December 2,695 1,671 2,564 1,671
The creation and release of the provision for impaired receivables has been included in 'Impairment of assets’ in the incomestatement. Amounts charged to the provision account are generally written off when there is no expectation of recovering additionalcash. The other amounts within receivables do not contain impaired assets and are not past due. Based on credit history, it isexpected that these amounts will be received when due.
29
The University of SydneyNotes to the financial statements
for the year ended 31 December 2015
(continued)
17 Receivables (continued)
(b) Foreign exchange and interest rate risk
The carrying amounts of the consolidated and parent entity's current and non-current receivables are denominated in Australiandollars and are non-interest bearing.
18 Assets held for sale Economic entity
(Consolidated) Parent entity
(University)
2015
$'000
2014
$'000
2015
$'000
2014
$'000
Assets held for sale 600 14,412 600 14,412
Total assets held for sale 600 14,412 600 14,412
The University signed an irrevocable deed for the sale of a building in 2014. The sale of this building was completed on 30 June 2015.The University signed a contract for the sale of another property in 2015, for which settlement is scheduled to occur in January 2016.
19 Inventories Economic entity
(Consolidated) Parent entity
(University)
2015
$'000
2014
$'000
2015
$'000
2014
$'000
Current Harvested crops and other inventory 179 280 179 249
Total inventories 179 280 179 249
30 Page
91
Fina
ncia
l Re
port
s an
d St
atem
ents
201
5

The University of SydneyNotes to the financial statements
for the year ended 31 December 2015
(continued)
20 Other financial assets
Economic entity(Consolidated)
Parent entity(University)
2015
$'000
2014
$'000
2015
$'000
2014
$'000
CurrentFinancial assets at fair value through profit orlossFixed interest bonds 5,194 1,027 5,194 1,027Short term holdings 31,150 20,154 31,150 20,154
Total current other financial assets throughprofit or loss 36,344 21,181 36,344 21,181
Non-currentShares in unlisted companies at fair valuethrough profit or lossShares in unlisted companies 11,158 7,565 19,158 15,065
Total shares in unlisted companies at fair valuethrough profit or loss 11,158 7,565 19,158 15,065
Financial assets at fair value through profit orlossListed securities 234,243 255,803 234,243 255,803External fund managers* 730,301 641,013 730,301 641,013Fixed interest bonds 148,267 97,460 148,267 97,460Floating rate notes 5,955 5,908 5,955 5,908Convertible notes 3,452 3,895 3,452 3,895
Total other financial assets at fair valuethrough profit or loss 1,122,218 1,004,079 1,122,218 1,004,079
Financial assets at amortised costSecured company loans 5,016 5,527 5,016 5,527
Total other financial assets at amortised cost 5,016 5,527 5,016 5,527
Total non-current other financial assets 1,138,392 1,017,171 1,146,392 1,024,671
Total other financial assets 1,174,736 1,038,352 1,182,736 1,045,852
*Includes unlisted managed investment schemes, unlisted partnerships and unlisted equities.
31Page
92
sydn
ey.e
du.a
uTh
e Un
iver
sity
of
Sydn
eyAn
nual
Rep
ort
2015

The University of SydneyNotes to the financial statements
for the year ended 31 December 2015
(continued)
20 Other financial assets
Economic entity(Consolidated)
Parent entity(University)
2015
$'000
2014
$'000
2015
$'000
2014
$'000
CurrentFinancial assets at fair value through profit orlossFixed interest bonds 5,194 1,027 5,194 1,027Short term holdings 31,150 20,154 31,150 20,154
Total current other financial assets throughprofit or loss 36,344 21,181 36,344 21,181
Non-currentShares in unlisted companies at fair valuethrough profit or lossShares in unlisted companies 11,158 7,565 19,158 15,065
Total shares in unlisted companies at fair valuethrough profit or loss 11,158 7,565 19,158 15,065
Financial assets at fair value through profit orlossListed securities 234,243 255,803 234,243 255,803External fund managers* 730,301 641,013 730,301 641,013Fixed interest bonds 148,267 97,460 148,267 97,460Floating rate notes 5,955 5,908 5,955 5,908Convertible notes 3,452 3,895 3,452 3,895
Total other financial assets at fair valuethrough profit or loss 1,122,218 1,004,079 1,122,218 1,004,079
Financial assets at amortised costSecured company loans 5,016 5,527 5,016 5,527
Total other financial assets at amortised cost 5,016 5,527 5,016 5,527
Total non-current other financial assets 1,138,392 1,017,171 1,146,392 1,024,671
Total other financial assets 1,174,736 1,038,352 1,182,736 1,045,852
*Includes unlisted managed investment schemes, unlisted partnerships and unlisted equities.
31
Th
e U
niv
ers
ity o
f S
yd
ne
yN
ote
s t
o t
he
fin
an
cia
l s
tate
me
nts
for
the
ye
ar
en
de
d 3
1 D
ec
em
be
r 2
01
5
(co
nti
nu
ed
)
21
Pro
pert
y,
pla
nt
an
d e
qu
ipm
en
t
Mo
vem
en
t in
th
e c
arr
yin
g a
mo
un
ts f
or
ea
ch c
lass
of
pro
pe
rty,
pla
nt
an
d e
qu
ipm
en
t b
etw
ee
n t
he
be
gin
nin
g a
nd
th
e e
nd
of
the
cu
rre
nt fin
an
cia
l ye
ar:
Pare
nt
en
tity
(U
niv
ers
ity)
Teach
ing
an
d
researc
h
lan
d
$'0
00
Teach
ing
an
d
researc
h
bu
ild
ing
$'0
00
Teach
ing
an
d
researc
h
infr
astr
uctu
re
$'0
00
Co
mm
erc
ial
lan
d
$'0
00
Co
mm
erc
ial
bu
ild
ing
$'0
00
Co
mm
erc
ial
infr
astr
uctu
re
$'0
00
Pla
nt
an
d
eq
uip
men
t
$'0
00
Leaseh
old
imp
rovem
en
t
$'0
00
Wo
rk in
pro
gre
ss
$'0
00
Heri
tag
e
assets
$'0
00
Lib
rary
co
llecti
on
s
$'0
00
To
tal
$'0
00
At
1Jan
uary
2014
Cost
161,6
86
1,3
11,6
55
160,5
47
00
0385,9
41
72,6
25
553,0
10
0534,2
21
3,1
79,6
85
Valu
atio
n382
00
167,5
76
160,1
91
194
00
0278,7
47
0607,0
90
Acc
um
ula
ted d
epre
ciatio
n a
nd im
pairm
ent
0(3
12,5
41)
(50,0
36)
0(6
62)
(1)
(187,5
38)
(16,9
04)
00
(206,0
17)
(773,6
99)
Net
bo
ok a
mo
un
t162,0
68
999,1
14
110,5
11
167,5
76
159,5
29
193
198,4
03
55,7
21
553,0
10
278,7
47
328,2
04
3,0
13,0
76
Year
en
ded
31 D
ecem
ber
2014
Co
st
an
d v
alu
ati
on
:
Additi
ons
00
64
350
266
014,6
32
1,9
38
301,0
69
534
2,5
12
321,3
65
Tra
nsf
er
from
work
in p
rogre
ss0
210,3
29
8,1
70
36
3,3
41
348
166,6
17
1,7
74
(468,8
89)
00
(78,2
74)
Donatio
ns
00
00
00
00
01,8
41
274
2,1
15
Ass
et dis
posa
ls0
00
00
0(2
,873)
00
00
(2,8
73)
Ass
et re
tirem
ents
0(3
75)
0(4
5)
00
(5,2
09)
00
(1)
0(5
,630)
Reva
luatio
n in
crem
ent/(d
ecr
em
ent)
38
00
26,1
43
6,1
29
60
00
7,6
64
039,9
80
Non c
apita
lisable
cost
s0
00
00
00
0(1
2,0
13)
00
(12,0
13)
Tra
nsf
ers
/reca
tegorisa
tion*
(420)
00
(11,6
88)
(7,0
29)
(6)
1,8
83
0(7
70)
00
(18,0
30)
Dep
recia
tio
n
Depre
ciatio
n c
harg
e0
(48,6
67)
(3,6
66)
0(4
,127)
(10)
(40,0
12)
(4,0
54)
00
(46,9
79)
(147,5
15)
Write
back
acc
um
ula
ted d
epre
ciatio
n o
n a
sset:
Dis
posa
l0
00
00
02,3
88
00
00
2,3
88
Retir
em
ents
0139
00
00
4,7
12
00
00
4,8
51
Reva
luatio
ns
00
00
4,7
25
60
00
00
4,7
31
Tra
nsf
ers
/reca
tegorisa
tion*
00
00
00
71
00
00
71
Clo
sin
g n
et
bo
ok a
mo
un
t161,6
86
1,1
60,5
40
115,0
79
182,3
72
162,8
34
537
340,6
12
55,3
79
372,4
07
288,7
85
284,0
11
3,1
24,2
42
A
t 31 D
ecem
ber
2014
Cost
161,6
86
1,5
21,6
09
168,7
81
00
0560,9
91
76,3
38
372,4
07
0537,0
07
3,3
98,8
19
Valu
atio
n0
00
182,3
72
162,8
98
542
00
0288,7
85
0634,5
97
Acc
um
ula
ted d
epre
ciatio
n a
nd im
pairm
ent
0(3
61,0
69)
(53,7
02)
0(6
4)
(5)
(220,3
79)
(20,9
59)
00
(252,9
96)
(909,1
74)
Net
bo
ok a
mo
un
t161,6
86
1,1
60,5
40
115,0
79
182,3
72
162,8
34
537
340,6
12
55,3
79
372,4
07
288,7
85
284,0
11
3,1
24,2
42
* In
clu
de
s t
he
tra
nsfe
r o
f a
sse
ts t
o a
sse
t h
eld
fo
r sa
le.
32
Page
93
Fina
ncia
l Re
port
s an
d St
atem
ents
201
5

Th
e U
niv
ers
ity o
f S
yd
ne
yN
ote
s t
o t
he
fin
an
cia
l s
tate
me
nts
for
the
ye
ar
en
de
d 3
1 D
ec
em
be
r 2
01
5
(co
nti
nu
ed
)
21
Pro
pe
rty,
pla
nt
an
d e
qu
ipm
en
t (c
on
tin
ue
d)
Pare
nt
en
tity
(U
niv
ers
ity)
Teach
ing
an
dre
searc
hla
nd
$'0
00
Teach
ing
an
dre
searc
hb
uild
ing
$'0
00
Teach
ing
an
dre
searc
hin
frastr
uctu
re
$'0
00
Co
mm
erc
ial
lan
d
$'0
00
Co
mm
erc
ial
bu
ild
ing
$'0
00
Co
mm
erc
ial
infr
astr
uctu
re
$'0
00
Pla
nt
an
deq
uip
men
t
$'0
00
Leaseh
old
imp
rovem
en
t
$'0
00
Wo
rk in
pro
gre
ss
$'0
00
Heri
tag
e
assets
$'0
00
Lib
rary
co
llecti
on
s
$'0
00
To
tal
$'0
00
At
1 J
an
uary
2015
Cost
161,6
86
1,5
21,6
09
168,7
81
00
0560,9
91
76,3
38
372,4
07
0537,0
07
3,3
98,8
19
Valu
atio
n0
00
182,3
72
162,8
98
542
00
0288,7
85
0634,5
97
Acc
um
ula
ted d
epre
ciatio
n a
nd im
pairm
ent
0(3
61,0
69)
(53,7
02)
0(6
4)
(5)
(220,3
79)
(20,9
59)
00
(252,9
96)
(909,1
74)
Net
bo
ok a
mo
un
t161,6
86
1,1
60,5
40
115,0
79
182,3
72
162,8
34
537
340,6
12
55,3
79
372,4
07
288,7
85
284,0
11
3,1
24,2
42
Year
en
ded
31 D
ecem
ber
2015
Co
st
an
d v
alu
ati
on
:
Additi
ons
16,4
13
922
00
00
31,3
32
1,2
08
292,8
51
189
2,2
26
345,1
41
Tra
nsf
er
from
work
in p
rogre
ss225
80,2
65
00
83,7
20
2,1
21
83,3
18
3,2
43
(259,3
64)
00
(6,4
72)
Donatio
ns
00
00
00
51
00
0208
259
Ass
et dis
posa
ls0
00
00
0(5
84)
00
00
(584)
Ass
et re
tirem
ents
0(4
57)
00
00
(9,1
29)
(1,4
06)
0(1
4)
0(1
1,0
06)
Reva
luatio
n in
crem
ent/(d
ecr
em
ent)
00
04,6
33
34,6
73
(89)
00
03,4
43
042,6
60
Non c
apita
lisable
cost
s0
00
00
00
0(1
2,7
65)
00
(12,7
65)
Tra
nsf
ers
/reca
tegorisa
tion*
0(2
09)
022,9
12
(23,3
04)
01,3
35
00
00
734
Dep
recia
tio
n
Depre
ciatio
n0
(50,1
58)
(3,5
60)
0(5
,281)
(39)
(46,0
30)
(4,2
68)
00
(47,1
50)
(156,4
86)
Write
back
acc
um
ula
ted d
epre
ciatio
n o
n a
sset:
Dis
posa
ls0
00
00
0480
00
00
480
Retir
em
ents
0152
00
00
8,2
03
1,7
40
00
010,0
95
Reva
luatio
ns
00
00
5,3
45
44
00
00
05,3
89
Tra
nsf
ers
/reca
tegorisa
tion*
00
00
00
(1,3
35)
00
00
(1,3
35)
Clo
sin
g n
et
bo
ok a
mo
un
t178,3
24
1,1
91,0
55
111,5
19
209,9
17
257,9
87
2,5
74
408,2
53
55,8
96
393,1
29
292,4
03
239,2
95
3,3
40,3
52
A
t 31 D
ecem
ber
2015
Cost
178,3
24
1,6
02,1
30
168,7
81
00
0667,3
14
79,3
83
393,1
29
0539,4
41
3,6
28,5
02
Valu
atio
n0
00
209,9
17
257,9
87
2,5
74
00
0292,4
03
0762,8
81
Acc
um
ula
ted d
epre
ciatio
n a
nd im
pairm
ent
0(4
11,0
75)
(57,2
62)
00
0(2
59,0
61)
(23,4
87)
00
(300,1
46)
(1,0
51,0
31)
Net
bo
ok a
mo
un
t178,3
24
1,1
91,0
55
111,5
19
209,9
17
257,9
87
2,5
74
408,2
53
55,8
96
393,1
29
292,4
03
239,2
95
3,3
40,3
52
* In
clu
de
s t
he
tra
nsfe
r o
f a
sse
ts t
o a
sse
t h
eld
fo
r sa
le.
33
Page
94
sydn
ey.e
du.a
uTh
e Un
iver
sity
of
Sydn
eyAn
nual
Rep
ort
2015

Th
e U
niv
ers
ity o
f S
yd
ne
yN
ote
s t
o t
he
fin
an
cia
l s
tate
me
nts
for
the
ye
ar
en
de
d 3
1 D
ec
em
be
r 2
01
5
(co
nti
nu
ed
)
21
Pro
pert
y,
pla
nt
an
d e
qu
ipm
en
t (c
on
tin
ue
d)
Eco
no
mic
en
tity
(C
on
so
lid
ate
d)
Teach
ing
an
d
researc
h
lan
d
$'0
00
Teach
ing
an
d
researc
h
bu
ild
ing
$'0
00
Teach
ing
an
d
researc
h
infr
astr
uctu
re
$'0
00
Co
mm
erc
ial
lan
d
$'0
00
Co
mm
erc
ial
bu
ild
ing
$'0
00
Co
mm
erc
ial
infr
astr
uctu
re
$'0
00
Pla
nt
an
d
eq
uip
men
t
$'0
00
Leaseh
old
imp
rovem
en
t
$'0
00
Wo
rk in
pro
gre
ss
$'0
00
Heri
tag
e
assets
$'0
00
Lib
rary
co
llecti
on
s
$'0
00
To
tal
$'0
00
At
1 J
an
uary
2014
Cost
161,6
86
1,3
11,6
55
160,5
47
00
0387,4
19
72,6
25
553,0
10
0534,2
21
3,1
81,1
63
Valu
atio
n382
00
167,5
76
160,1
91
194
00
0278,7
47
0607,0
90
Acc
um
ula
ted d
epre
ciatio
n a
nd im
pairm
ent
0(3
12,5
41)
(50,0
36)
0(6
62)
(1)
(188,8
52)
(16,9
04)
00
(206,0
17)
(775,0
13)
Net
bo
ok a
mo
un
t162,0
68
999,1
14
110,5
11
167,5
76
159,5
29
193
198,5
67
55,7
21
553,0
10
278,7
47
328,2
04
3,0
13,2
40
Year
en
ded
31 D
ecem
ber
2014
Co
st
an
d v
alu
ati
on
:
Additi
ons
0662
64
350
266
015,5
80
1,9
38
301,0
68
534
2,5
12
322,9
74
Tra
nsf
er
from
work
in p
rogre
ss0
210,3
29
8,1
70
36
3,3
42
348
166,6
17
1,7
75
(468,8
89)
00
(78,2
72)
Donatio
ns
00
00
00
00
01,8
41
274
2,1
15
Ass
et dis
posa
ls0
00
00
0(2
,880)
00
00
(2,8
80)
Ass
et re
tirem
ents
0(3
75)
0(4
5)
00
(5,2
10)
00
(1)
0(5
,631)
Reva
luatio
n in
crem
ent/(d
ecr
em
ent)
38
00
26,1
43
6,1
29
60
00
7,6
64
039,9
80
Non c
apita
lisable
cost
s0
00
00
00
0(1
2,0
12)
00
(12,0
12)
Tra
nsf
ers
/reca
tegorisa
tion*
(420)
00
(11,6
88)
(7,0
29)
(6)
1,8
83
0(7
70)
00
(18,0
30)
Dep
recia
tio
n
Depre
ciatio
n c
harg
e0
(48,6
77)
(3,6
65)
0(4
,127)
(11)
(40,2
10)
(4,0
54)
00
(46,9
79)
(147,7
23)
Write
back
acc
um
ula
ted d
epre
ciatio
n o
n a
sset:
Dis
posa
ls0
00
00
01,9
06
00
00
1,9
06
Retir
em
ents
0140
00
00
4,7
11
(1)
00
04,8
50
Reva
luatio
ns
0(4
0)
(1)
04,7
25
70
00
00
4,6
91
Tra
nsf
ers
/reca
tegorisa
tion*
00
00
00
71
00
00
71
Clo
sin
g n
et
bo
ok a
mo
un
t161,6
86
1,1
61,1
53
115,0
79
182,3
72
162,8
35
537
341,0
35
55,3
79
372,4
07
288,7
85
284,0
11
3,1
25,2
79
A
t 31 D
ecem
ber
2014
C
ost
161,6
86
1,5
22,2
71
168,7
81
00
0563,4
09
76,3
38
372,4
07
0537,0
07
3,4
01,8
99
Valu
atio
n0
00
182,3
72
162,8
99
542
00
0288,7
85
0634,5
98
Acc
um
ula
ted d
epre
ciatio
n a
nd im
pairm
ent
0(3
61,1
18)
(53,7
02)
0(6
4)
(5)
(222,3
74)
(20,9
59)
00
(252,9
96)
(911,2
18)
Net
bo
ok a
mo
un
t161,6
86
1,1
61,1
53
115,0
79
182,3
72
162,8
35
537
341,0
35
55,3
79
372,4
07
288,7
85
284,0
11
3,1
25,2
79
* In
clu
de
s t
he
tra
nsfe
r o
f a
sse
ts t
o a
sse
t h
eld
fo
r sa
le.
34
Page
95
Fina
ncia
l Re
port
s an
d St
atem
ents
201
5

Th
e U
niv
ers
ity o
f S
yd
ne
yN
ote
s t
o t
he
fin
an
cia
l s
tate
me
nts
for
the
ye
ar
en
de
d 3
1 D
ec
em
be
r 2
01
5
(co
nti
nu
ed
)
21
Pro
pe
rty,
pla
nt
an
d e
qu
ipm
en
t (c
on
tin
ue
d)
Eco
no
mic
en
tity
(C
on
so
lid
ate
d)
Teach
ing
an
dre
searc
hla
nd
$'0
00
Teach
ing
an
dre
searc
hb
uild
ing
$'0
00
Teach
ing
an
dre
searc
hin
frastr
uctu
re
$'0
00
Co
mm
erc
ial
lan
d
$'0
00
Co
mm
erc
ial
bu
ild
ing
$'0
00
Co
mm
erc
ial
infr
astr
uctu
re
$'0
00
Pla
nt
an
deq
uip
men
t
$'0
00
Leaseh
old
imp
rovem
en
t
$'0
00
Wo
rk in
pro
gre
ss
$'0
00
Heri
tag
e
assets
$'0
00
Lib
rary
co
llecti
on
s
$'0
00
To
tal
$'0
00
At
1 J
an
uary
2015
Cost
161,6
86
1,5
22,2
71
168,7
81
00
0563,4
09
76,3
38
372,4
07
0537,0
07
3,4
01,8
99
Valu
atio
n0
00
182,3
72
162,8
99
542
00
0288,7
85
0634,5
98
Acc
um
ula
ted d
epre
ciatio
n a
nd im
pairm
ent
0(3
61,1
18)
(53,7
02)
0(6
4)
(5)
(222,3
74)
(20,9
59)
00
(252,9
96)
(911,2
18)
Net
bo
ok a
mo
un
t161,6
86
1,1
61,1
53
115,0
79
182,3
72
162,8
35
537
341,0
35
55,3
79
372,4
07
288,7
85
284,0
11
3,1
25,2
79
Year
en
ded
31 D
ecem
ber
2015
Co
st
an
d v
alu
ati
on
:
Additi
ons
16,4
13
900
00
00
31,3
41
1,2
08
292,8
51
189
2,2
26
345,1
28
Tra
nsf
er
from
work
in p
rogre
ss225
80,2
66
00
83,7
19
2,1
21
83,3
18
3,2
43
(259,3
64)
00
(6,4
72)
Donatio
ns
00
00
00
51
00
0208
259
Ass
et dis
posa
ls0
00
00
0(2
,112)
00
00
(2,1
12)
Ass
et re
tirem
ents
0(4
57)
00
00
(9,1
28)
(1,4
06)
0(1
4)
0(1
1,0
05)
Reva
luatio
n in
crem
ent/(d
ecr
em
ent)
00
04,6
33
34,6
73
(89)
00
03,4
43
042,6
60
Non c
apita
lisable
cost
s0
00
00
00
0(1
2,7
65)
00
(12,7
65)
Tra
nsf
ers
/reca
tegorisa
tion*
0(2
09)
022,9
12
(23,3
04)
01,1
47
00
00
546
Dep
recia
tio
n
Depre
ciatio
n c
harg
e0
(50,3
12)
(3,5
60)
0(5
,281)
(39)
(46,0
73)
(4,2
68)
00
(47,1
50)
(156,6
83)
Write
back
acc
um
ula
ted d
epre
ciatio
n o
n a
sset:
00
00
00
00
00
00
Dis
posa
ls0
00
00
01,9
76
00
00
1,9
76
Retir
em
ents
0152
00
00
8,2
04
1,7
40
00
010,0
96
Reva
luatio
ns
045
00
5,3
45
44
00
00
05,4
34
Tra
nsf
ers
/reca
tegorisa
tion*
0158
00
00
(1,2
47)
00
00
(1,0
89)
Clo
sin
g n
et
bo
ok a
mo
un
t178,3
24
1,1
91,6
96
111,5
19
209,9
17
257,9
87
2,5
74
408,5
12
55,8
96
393,1
29
292,4
03
239,2
95
3,3
41,2
52
A
t 31 D
ecem
ber
2015
C
ost
178,3
24
1,6
02,7
71
168,7
81
00
0668,0
26
79,3
83
393,1
29
0539,4
41
3,6
29,8
55
Valu
atio
n0
00
209,9
17
257,9
87
2,5
74
00
0292,4
03
0762,8
81
Acc
um
ula
ted d
epre
ciatio
n a
nd im
pairm
ent
0(4
11,0
75)
(57,2
62)
00
0(2
59,5
14)
(23,4
87)
00
(300,1
46)
(1,0
51,4
84)
Net
bo
ok a
mo
un
t178,3
24
1,1
91,6
96
111,5
19
209,9
17
257,9
87
2,5
74
408,5
12
55,8
96
393,1
29
292,4
03
239,2
95
3,3
41,2
52
* In
clu
de
s t
ran
sfe
r o
f a
sse
ts t
o a
sse
t h
eld
fo
r sa
le.
35
The University of SydneyNotes to the financial statements
for the year ended 31 December 2015
(continued)
22 Intangible assets
Economic entity (Consolidated)
Computersoftware
$'000
Otherintangible
assets
$'000
Digitalisedlibrary
collections
$'000
Goodwill onconsolidation
$'000
Total
$'000
At 1 January 2014
Cost 67,528 3,255 58,235 0 129,018
Accumulated amortisation andimpairment
(42,387) (506) 0 0 (42,893)
Net book amount 25,141 2,749 58,235 0 86,125
Year ended 31 December 2014Cost
Additions 106 0 8,107 0 8,213
Transfer from work in progress 78,276 0 0 0 78,276
Acquisition of subsidiary 0 0 0 6,129 6,129
Asset retirements (11,495) 0 0 0 (11,495)
Transfers/recategorisation (3,420) 0 0 0 (3,420)
Amortisation
Amortisation charge (11,452) (167) 0 0 (11,619)
Writeback accumulatedamortisation;
Retirements 10,777 0 0 0 10,777
Transfers/recategorisation (70) 0 0 0 (70)
Closing net book amount 87,863 2,582 66,342 6,129 162,916
At 31 December 2014
Cost 130,995 3,255 66,342 6,129 206,721
Accumulated amortisation andimpairment
(43,132) (673) 0 0 (43,805)
Net book amount 87,863 2,582 66,342 6,129 162,916
Year ended 31 December 2015
Balance 1 January 87,863 2,582 66,342 6,129 162,916
Additions 126 800 14,236 0 15,162
Transfer from work in progress 6,471 0 0 0 6,471
Asset retirements (969) 0 0 0 (969)
Transfers/recategorisation 0 0 0 0 0
Amortisation
Amortisation charge (17,006) (167) 0 0 (17,173)
Writeback accumulatedamortisation;
Retirements 907 0 0 0 907
Transfers/recategorisation 0 0 0 0 0
Closing net book amount 77,392 3,215 80,578 6,129 167,314
At 31 December 2015
Cost 136,623 4,055 80,578 6,129 227,385
Accumulated amortisation andimpairment
(59,231) (840) 0 0 (60,071)
Net book amount 77,392 3,215 80,578 6,129 167,314
36Page
96
sydn
ey.e
du.a
uTh
e Un
iver
sity
of
Sydn
eyAn
nual
Rep
ort
2015

The University of SydneyNotes to the financial statements
for the year ended 31 December 2015
(continued)
22 Intangible assets
Economic entity (Consolidated)
Computersoftware
$'000
Otherintangible
assets
$'000
Digitalisedlibrary
collections
$'000
Goodwill onconsolidation
$'000
Total
$'000
At 1 January 2014
Cost 67,528 3,255 58,235 0 129,018
Accumulated amortisation andimpairment
(42,387) (506) 0 0 (42,893)
Net book amount 25,141 2,749 58,235 0 86,125
Year ended 31 December 2014Cost
Additions 106 0 8,107 0 8,213
Transfer from work in progress 78,276 0 0 0 78,276
Acquisition of subsidiary 0 0 0 6,129 6,129
Asset retirements (11,495) 0 0 0 (11,495)
Transfers/recategorisation (3,420) 0 0 0 (3,420)
Amortisation
Amortisation charge (11,452) (167) 0 0 (11,619)
Writeback accumulatedamortisation;
Retirements 10,777 0 0 0 10,777
Transfers/recategorisation (70) 0 0 0 (70)
Closing net book amount 87,863 2,582 66,342 6,129 162,916
At 31 December 2014
Cost 130,995 3,255 66,342 6,129 206,721
Accumulated amortisation andimpairment
(43,132) (673) 0 0 (43,805)
Net book amount 87,863 2,582 66,342 6,129 162,916
Year ended 31 December 2015
Balance 1 January 87,863 2,582 66,342 6,129 162,916
Additions 126 800 14,236 0 15,162
Transfer from work in progress 6,471 0 0 0 6,471
Asset retirements (969) 0 0 0 (969)
Transfers/recategorisation 0 0 0 0 0
Amortisation
Amortisation charge (17,006) (167) 0 0 (17,173)
Writeback accumulatedamortisation;
Retirements 907 0 0 0 907
Transfers/recategorisation 0 0 0 0 0
Closing net book amount 77,392 3,215 80,578 6,129 167,314
At 31 December 2015
Cost 136,623 4,055 80,578 6,129 227,385
Accumulated amortisation andimpairment
(59,231) (840) 0 0 (60,071)
Net book amount 77,392 3,215 80,578 6,129 167,314
36 Page
97
Fina
ncia
l Re
port
s an
d St
atem
ents
201
5

The University of SydneyNotes to the financial statements
for the year ended 31 December 2015
(continued)
22 Intangible assets (continued)
Parent entity (University)
Computersoftware
$'000
Otherintangible
assets
$'000
Digitalisedlibrary
collections
$'000
Goodwill onconsolidation
$'000
Total
$'000
At 1 January 2014
Cost 67,528 3,255 58,235 0 129,018
Accumulated amortisation andimpairment
(42,387) (506) 0 0 (42,893)
Net book amount 25,141 2,749 58,235 0 86,125
Year ended 31 December 2014Cost
Additions 106 0 8,107 0 8,213
Transfer from work in progress 78,276 0 0 0 78,276
Acquisition of subsidiary 0 0 0 0 0
Asset retirements (11,495) 0 0 0 (11,495)
Transfers/recategorisation (3,420) 0 0 0 (3,420)
Amortisation
Amortisation charge (11,452) (167) 0 0 (11,619)
Writeback accumulatedamortisation:
Retirements 10,777 0 0 0 10,777
Transfers/recategorisation (70) 0 0 0 (70)
Closing net book amount 87,863 2,582 66,342 0 156,787
At 31 December 2014
Cost 130,995 3,255 66,342 0 200,592
Accumulated amortisation andimpairment
(43,132) (673) 0 0 (43,805)
Net book amount 87,863 2,582 66,342 0 156,787
Year ended 31 December 2015
Balance 1 January 87,863 2,582 66,342 0 156,787
Additions 126 800 14,236 0 15,162
Transfer from work in progress 6,471 0 0 0 6,471
Asset retirements (969) 0 0 0 (969)
Transfers/recategorisation 0 0 0 0 0
Amortisation
Amortisation charge (17,006) (167) 0 0 (17,173)
Writeback accumulatedamortisation:
0 0 0 0 0
Retirements 907 0 0 0 907
Transfers/recategorisation 0 0 0 0 0
Closing net book amount 77,392 3,215 80,578 0 161,185
At 31 December 2015
Cost 136,623 4,055 80,578 0 221,256
Accumulated amortisation andimpairment
(59,231) (840) 0 0 (60,071)
Net book amount 77,392 3,215 80,578 0 161,185
37
The University of SydneyNotes to the financial statements
for the year ended 31 December 2015
(continued)
23 Deferred tax assets
Economic entity(Consolidated)
Parent entity(University)
2015
$'000
2014
$'000
2015
$'000
2014
$'000
Deferred tax asset 291 215 0 0
Total deferred tax assets 291 215 0 0
The balance comprises temporary differencesattributable to:Amounts recognised in the net result
Tax losses 0 0 0 0Deferred tax assets relating to the origination andreversal of temporary differences 291 215 0 0
291 215 0 0
A number of controlled entities within the economic entity have tax losses and temporary differences that have not been brought toaccount as it is not virtually certain that the deferred tax asset will be realised.
These benefits will only be obtained if the entity derives the necessary future assessable income and capital gains and there are noadverse changes in relevant income tax legislation.
Deferred tax assets of $431k were not brought to account (2014: $627k)
24 Other non-financial assets Economic entity
(Consolidated) Parent entity
(University)
2015
$'000
2014
$'000
2015
$'000
2014
$'000
CurrentPrepaid expense 23,315 27,246 23,186 27,146
Total current other non-financial assets 23,315 27,246 23,186 27,146
Non-currentLivestock
Balance 1 January 3,509 3,030 3,509 3,030Purchases 43 28 43 28Natural increase/revaluation 2,757 1,185 2,757 1,185Sales (1,596) (689) (1,596) (689)Natural decrease (142) (45) (142) (45)
Total livestock 4,571 3,509 4,571 3,509
Prepaid leasePrepaid lease 14,767 15,085 14,767 15,085
Total prepaid lease 14,767 15,085 14,767 15,085
Total non-current other non-financialassets 19,338 18,594 19,338 18,594
Total other non-financial assets 42,653 45,840 42,524 45,740
38Page
98
sydn
ey.e
du.a
uTh
e Un
iver
sity
of
Sydn
eyAn
nual
Rep
ort
2015

The University of SydneyNotes to the financial statements
for the year ended 31 December 2015
(continued)
22 Intangible assets (continued)
Parent entity (University)
Computersoftware
$'000
Otherintangible
assets
$'000
Digitalisedlibrary
collections
$'000
Goodwill onconsolidation
$'000
Total
$'000
At 1 January 2014
Cost 67,528 3,255 58,235 0 129,018
Accumulated amortisation andimpairment
(42,387) (506) 0 0 (42,893)
Net book amount 25,141 2,749 58,235 0 86,125
Year ended 31 December 2014Cost
Additions 106 0 8,107 0 8,213
Transfer from work in progress 78,276 0 0 0 78,276
Acquisition of subsidiary 0 0 0 0 0
Asset retirements (11,495) 0 0 0 (11,495)
Transfers/recategorisation (3,420) 0 0 0 (3,420)
Amortisation
Amortisation charge (11,452) (167) 0 0 (11,619)
Writeback accumulatedamortisation:
Retirements 10,777 0 0 0 10,777
Transfers/recategorisation (70) 0 0 0 (70)
Closing net book amount 87,863 2,582 66,342 0 156,787
At 31 December 2014
Cost 130,995 3,255 66,342 0 200,592
Accumulated amortisation andimpairment
(43,132) (673) 0 0 (43,805)
Net book amount 87,863 2,582 66,342 0 156,787
Year ended 31 December 2015
Balance 1 January 87,863 2,582 66,342 0 156,787
Additions 126 800 14,236 0 15,162
Transfer from work in progress 6,471 0 0 0 6,471
Asset retirements (969) 0 0 0 (969)
Transfers/recategorisation 0 0 0 0 0
Amortisation
Amortisation charge (17,006) (167) 0 0 (17,173)
Writeback accumulatedamortisation:
0 0 0 0 0
Retirements 907 0 0 0 907
Transfers/recategorisation 0 0 0 0 0
Closing net book amount 77,392 3,215 80,578 0 161,185
At 31 December 2015
Cost 136,623 4,055 80,578 0 221,256
Accumulated amortisation andimpairment
(59,231) (840) 0 0 (60,071)
Net book amount 77,392 3,215 80,578 0 161,185
37
The University of SydneyNotes to the financial statements
for the year ended 31 December 2015
(continued)
23 Deferred tax assets
Economic entity(Consolidated)
Parent entity(University)
2015
$'000
2014
$'000
2015
$'000
2014
$'000
Deferred tax asset 291 215 0 0
Total deferred tax assets 291 215 0 0
The balance comprises temporary differencesattributable to:Amounts recognised in the net result
Tax losses 0 0 0 0Deferred tax assets relating to the origination andreversal of temporary differences 291 215 0 0
291 215 0 0
A number of controlled entities within the economic entity have tax losses and temporary differences that have not been brought toaccount as it is not virtually certain that the deferred tax asset will be realised.
These benefits will only be obtained if the entity derives the necessary future assessable income and capital gains and there are noadverse changes in relevant income tax legislation.
Deferred tax assets of $431k were not brought to account (2014: $627k)
24 Other non-financial assets Economic entity
(Consolidated) Parent entity
(University)
2015
$'000
2014
$'000
2015
$'000
2014
$'000
CurrentPrepaid expense 23,315 27,246 23,186 27,146
Total current other non-financial assets 23,315 27,246 23,186 27,146
Non-currentLivestock
Balance 1 January 3,509 3,030 3,509 3,030Purchases 43 28 43 28Natural increase/revaluation 2,757 1,185 2,757 1,185Sales (1,596) (689) (1,596) (689)Natural decrease (142) (45) (142) (45)
Total livestock 4,571 3,509 4,571 3,509
Prepaid leasePrepaid lease 14,767 15,085 14,767 15,085
Total prepaid lease 14,767 15,085 14,767 15,085
Total non-current other non-financialassets 19,338 18,594 19,338 18,594
Total other non-financial assets 42,653 45,840 42,524 45,740
38 Page
99
Fina
ncia
l Re
port
s an
d St
atem
ents
201
5

The University of SydneyNotes to the financial statements
for the year ended 31 December 2015
(continued)
25 Trade and other payables Economic entity
(Consolidated) Parent entity
(University)
2015
$'000
2014
$'000
2015
$'000
2014
$'000
CurrentCreditors 21,075 26,813 20,906 26,265Prepaid income 81,638 63,762 81,405 63,592Accrued expenses 72,741 79,953 73,276 79,593OS-HELP liability to Australian Government 2,504 1,566 2,504 1,566Amounts due to associates 0 2,146 0 2,146Amounts owed to controlled entities 0 0 164 710Accrued interest and financing costs 5,667 4,672 5,667 4,672
Total current trade and other payables 183,625 178,912 183,922 178,544
Total trade and other payables 183,625 178,912 183,922 178,544
Foreign currency risk
The carrying amounts of the economic and parent entity's trade and other payables are denominated in the following currencies:
Economic entity(Consolidated)
Parent entity(University)
2015
$'000
2014
$'000
2015
$'000
2014
$'000
Australian dollars 182,974 178,586 183,271 178,218US dollars 604 233 604 233Canadian dollars 2 0 2 0Swiss francs 0 1 0 1Chinese renminbi 0 4 0 4Euros 35 62 35 62UK pounds 7 19 7 19Indonesian rupiah 2 0 2 0Singapore dollars 1 7 1 7
183,625 178,912 183,922 178,544
For an analysis of the sensitivity of trade and other payables to foreign currency risk refer to Note 42.
26 Borrowings
Economic entity(Consolidated)
Parent entity(University)
2015
$'000
2014
$'000
2015
$'000
2014
$'000Non-currentUnsecured bank loans 110,000 240,000 110,000 240,000Bonds payable 394,336 198,139 394,336 198,139
Total non-current borrowings 504,336 438,139 504,336 438,139
Total borrowings 504,336 438,139 504,336 438,139
In March 2014 the University received approval from the Treasurer of New South Wales to issue medium term notes into thedomestic capital markets for a face value of $200 million and a term of seven years. The notes were issued in April 2014 at a fixedcoupon rate of 4.75% with the interest payable on a semi-annual basis.
In August 2015 the University issued a second parcel of medium term notes into the domestic capital markets for a face value of$200 million and a term of ten years. The notes were issued at a fixed coupon rate of 3.75% with the interest payable on a semi-annual basis.
39
The University of SydneyNotes to the financial statements
for the year ended 31 December 2015
(continued)
27 Derivative financial instruments
Economic entity(Consolidated)
Parent entity(University)
2015
$'000
2014
$'000
2015
$'000
2014
$'000
Current
Derivative financial instruments 1,186 2,385 1,186 2,385
Total current derivative financial instruments 1,186 2,385 1,186 2,385
Non-currentDerivative financial instruments 1,767 2,540 1,767 2,540
Total non-current derivative financialinstruments 1,767 2,540 1,767 2,540
Total derivative financial instruments 2,953 4,925 2,953 4,925
(a) Instruments used by the University
The University is party to derivative financial instruments in the normal course of business in order to hedge exposure to fluctuationsin interest rates in accordance with the University’s financial risk management policies (Refer to Note 42).
Interest rate swap contracts – cash flow hedges
Bank loans of the University currently bear interest at variable rates. It is the University's policy to protect the loans from exposure toincreasing variable interest rates. Accordingly, the University has entered into interest rate swap contracts under which it is obliged toreceive interest at variable rates and to pay interest at fixed rates.
At the balance date approximately 100% (2014: 86.50%) of the variable loan principal outstanding was hedged by variable interestrate swaps at a fixed average interest rate of 3.70% (2014: 3.90%). Also at balance date approximately 100% of total borrowings(unsecured borrowings from National Australia Bank and Westpac Banking Corporation and bonds on issue) was hedged by interestrate swaps and fixed interest debt (bonds) at a weighted average rate of 4.27% (2014: 4.40%).
The contracts require settlement of net interest receivable or payable each ninety days. The settlement dates coincide with the dateson which interest is payable on the underlying debt. The contracts are settled on a net basis.
The gain or loss from remeasuring the hedging instruments at fair value is recognised in other comprehensive income and deferred inequity in the hedging reserve, to the extent that the hedge is effective. It is reclassified into profit or loss when the hedged interestexpense is recognised. In the year ended 31 December 2015 there was no profit or loss impact (2014: Nil). There was no hedgeineffectiveness in the current year.
(b) Risk exposures and fair value measurements
Information about the University’s exposure to credit risk, foreign exchange and interest rate risk is provided at Note 42. Informationabout the methods and assumptions used in determining fair values is provided in Note 43. The maximum exposure to credit risk atthe end of the reporting period is the carrying amount of each class of derivative financial asset mentioned above.
40Page
100
sydn
ey.e
du.a
uTh
e Un
iver
sity
of
Sydn
eyAn
nual
Rep
ort
2015

The University of SydneyNotes to the financial statements
for the year ended 31 December 2015
(continued)
25 Trade and other payables Economic entity
(Consolidated) Parent entity
(University)
2015
$'000
2014
$'000
2015
$'000
2014
$'000
CurrentCreditors 21,075 26,813 20,906 26,265Prepaid income 81,638 63,762 81,405 63,592Accrued expenses 72,741 79,953 73,276 79,593OS-HELP liability to Australian Government 2,504 1,566 2,504 1,566Amounts due to associates 0 2,146 0 2,146Amounts owed to controlled entities 0 0 164 710Accrued interest and financing costs 5,667 4,672 5,667 4,672
Total current trade and other payables 183,625 178,912 183,922 178,544
Total trade and other payables 183,625 178,912 183,922 178,544
Foreign currency risk
The carrying amounts of the economic and parent entity's trade and other payables are denominated in the following currencies:
Economic entity(Consolidated)
Parent entity(University)
2015
$'000
2014
$'000
2015
$'000
2014
$'000
Australian dollars 182,974 178,586 183,271 178,218US dollars 604 233 604 233Canadian dollars 2 0 2 0Swiss francs 0 1 0 1Chinese renminbi 0 4 0 4Euros 35 62 35 62UK pounds 7 19 7 19Indonesian rupiah 2 0 2 0Singapore dollars 1 7 1 7
183,625 178,912 183,922 178,544
For an analysis of the sensitivity of trade and other payables to foreign currency risk refer to Note 42.
26 Borrowings
Economic entity(Consolidated)
Parent entity(University)
2015
$'000
2014
$'000
2015
$'000
2014
$'000Non-currentUnsecured bank loans 110,000 240,000 110,000 240,000Bonds payable 394,336 198,139 394,336 198,139
Total non-current borrowings 504,336 438,139 504,336 438,139
Total borrowings 504,336 438,139 504,336 438,139
In March 2014 the University received approval from the Treasurer of New South Wales to issue medium term notes into thedomestic capital markets for a face value of $200 million and a term of seven years. The notes were issued in April 2014 at a fixedcoupon rate of 4.75% with the interest payable on a semi-annual basis.
In August 2015 the University issued a second parcel of medium term notes into the domestic capital markets for a face value of$200 million and a term of ten years. The notes were issued at a fixed coupon rate of 3.75% with the interest payable on a semi-annual basis.
39
The University of SydneyNotes to the financial statements
for the year ended 31 December 2015
(continued)
27 Derivative financial instruments
Economic entity(Consolidated)
Parent entity(University)
2015
$'000
2014
$'000
2015
$'000
2014
$'000
Current
Derivative financial instruments 1,186 2,385 1,186 2,385
Total current derivative financial instruments 1,186 2,385 1,186 2,385
Non-currentDerivative financial instruments 1,767 2,540 1,767 2,540
Total non-current derivative financialinstruments 1,767 2,540 1,767 2,540
Total derivative financial instruments 2,953 4,925 2,953 4,925
(a) Instruments used by the University
The University is party to derivative financial instruments in the normal course of business in order to hedge exposure to fluctuationsin interest rates in accordance with the University’s financial risk management policies (Refer to Note 42).
Interest rate swap contracts – cash flow hedges
Bank loans of the University currently bear interest at variable rates. It is the University's policy to protect the loans from exposure toincreasing variable interest rates. Accordingly, the University has entered into interest rate swap contracts under which it is obliged toreceive interest at variable rates and to pay interest at fixed rates.
At the balance date approximately 100% (2014: 86.50%) of the variable loan principal outstanding was hedged by variable interestrate swaps at a fixed average interest rate of 3.70% (2014: 3.90%). Also at balance date approximately 100% of total borrowings(unsecured borrowings from National Australia Bank and Westpac Banking Corporation and bonds on issue) was hedged by interestrate swaps and fixed interest debt (bonds) at a weighted average rate of 4.27% (2014: 4.40%).
The contracts require settlement of net interest receivable or payable each ninety days. The settlement dates coincide with the dateson which interest is payable on the underlying debt. The contracts are settled on a net basis.
The gain or loss from remeasuring the hedging instruments at fair value is recognised in other comprehensive income and deferred inequity in the hedging reserve, to the extent that the hedge is effective. It is reclassified into profit or loss when the hedged interestexpense is recognised. In the year ended 31 December 2015 there was no profit or loss impact (2014: Nil). There was no hedgeineffectiveness in the current year.
(b) Risk exposures and fair value measurements
Information about the University’s exposure to credit risk, foreign exchange and interest rate risk is provided at Note 42. Informationabout the methods and assumptions used in determining fair values is provided in Note 43. The maximum exposure to credit risk atthe end of the reporting period is the carrying amount of each class of derivative financial asset mentioned above.
40 Page
101
Fina
ncia
l Re
port
s an
d St
atem
ents
201
5

The University of SydneyNotes to the financial statements
for the year ended 31 December 2015
(continued)
28 Provisions Economic entity
(Consolidated) Parent entity
(University)
2015
$'000
2014
$'000
2015
$'000
2014
$'000
Current provisions expected to be settledwithin 12 monthsEmployee benefits
Annual leave 65,838 61,316 65,449 61,174Long service leave 31,280 28,313 31,280 28,313Professorial Superannuation System 0 356 0 356Provision for severance payment 1,637 947 1,637 835
Provision for make good 1,181 138 1,181 138
Subtotal 99,936 91,070 99,547 90,816
Current provisions expected to be settled aftermore than 12 monthsEmployee benefits
Annual leave 2,897 3,225 2,897 3,225Long service leave 106,858 99,157 106,437 99,128
Subtotal 109,755 102,382 109,334 102,353
Total current provisions 209,691 193,452 208,881 193,169
Non-current provisionsEmployee benefits
Long service leave 31,960 30,281 31,960 30,215Defined benefit obligation 1,572,635 1,506,478 1,572,635 1,506,478
Provision for make good 8,919 8,730 8,919 8,730
Deferred lease provision 1,914 1,843 1,914 1,843
Total non-current provisions 1,615,428 1,547,332 1,615,428 1,547,266
Total provisions 1,825,119 1,740,784 1,824,309 1,740,435
41
The University of SydneyNotes to the financial statements
for the year ended 31 December 2015
(continued)
28 Provisions (continued)
(a) Movement in provisions
Movements in each class of provision during the financial year, other than employee benefits, are set out below:
Deferred lease$'000
Make goodprovisions
$'000Total$'000
Economic entity (Consolidated) 2014Carrying amount at 1 January 1,813 6,836 8,649
Additional provisions recognised 30 2,032 2,062
Amounts used 0 0 0
Carrying amount at 31 December 1,843 8,868 10,711
Economic entity (Consolidated) 2015Carrying amount at 1 January 1,843 8,868 10,711
Additional provisions recognised 248 1,232 1,480Amounts used (177) 0 (177)
Carrying amount at 31 December 1,914 10,100 12,014
Parent entity (University) 2014Carrying amount at 1 January 1,813 6,836 8,649
Additional provisions recognised 30 2,032 2,062
Carrying amount at 31 December 1,843 8,868 10,711
Parent entity (University) 2015Carrying amount at 1 January 1,843 8,868 10,711Additional provisions recognised 248 1,232 1,480
Amounts used (177) 0 (177)
Carrying amount at 31 December 1,914 10,100 12,014
42Page
102
sydn
ey.e
du.a
uTh
e Un
iver
sity
of
Sydn
eyAn
nual
Rep
ort
2015

The University of SydneyNotes to the financial statements
for the year ended 31 December 2015
(continued)
28 Provisions Economic entity
(Consolidated) Parent entity
(University)
2015
$'000
2014
$'000
2015
$'000
2014
$'000
Current provisions expected to be settledwithin 12 monthsEmployee benefits
Annual leave 65,838 61,316 65,449 61,174Long service leave 31,280 28,313 31,280 28,313Professorial Superannuation System 0 356 0 356Provision for severance payment 1,637 947 1,637 835
Provision for make good 1,181 138 1,181 138
Subtotal 99,936 91,070 99,547 90,816
Current provisions expected to be settled aftermore than 12 monthsEmployee benefits
Annual leave 2,897 3,225 2,897 3,225Long service leave 106,858 99,157 106,437 99,128
Subtotal 109,755 102,382 109,334 102,353
Total current provisions 209,691 193,452 208,881 193,169
Non-current provisionsEmployee benefits
Long service leave 31,960 30,281 31,960 30,215Defined benefit obligation 1,572,635 1,506,478 1,572,635 1,506,478
Provision for make good 8,919 8,730 8,919 8,730
Deferred lease provision 1,914 1,843 1,914 1,843
Total non-current provisions 1,615,428 1,547,332 1,615,428 1,547,266
Total provisions 1,825,119 1,740,784 1,824,309 1,740,435
41
The University of SydneyNotes to the financial statements
for the year ended 31 December 2015
(continued)
28 Provisions (continued)
(a) Movement in provisions
Movements in each class of provision during the financial year, other than employee benefits, are set out below:
Deferred lease$'000
Make goodprovisions
$'000Total$'000
Economic entity (Consolidated) 2014Carrying amount at 1 January 1,813 6,836 8,649
Additional provisions recognised 30 2,032 2,062
Amounts used 0 0 0
Carrying amount at 31 December 1,843 8,868 10,711
Economic entity (Consolidated) 2015Carrying amount at 1 January 1,843 8,868 10,711
Additional provisions recognised 248 1,232 1,480Amounts used (177) 0 (177)
Carrying amount at 31 December 1,914 10,100 12,014
Parent entity (University) 2014Carrying amount at 1 January 1,813 6,836 8,649
Additional provisions recognised 30 2,032 2,062
Carrying amount at 31 December 1,843 8,868 10,711
Parent entity (University) 2015Carrying amount at 1 January 1,843 8,868 10,711Additional provisions recognised 248 1,232 1,480
Amounts used (177) 0 (177)
Carrying amount at 31 December 1,914 10,100 12,014
42 Page
103
Fina
ncia
l Re
port
s an
d St
atem
ents
201
5
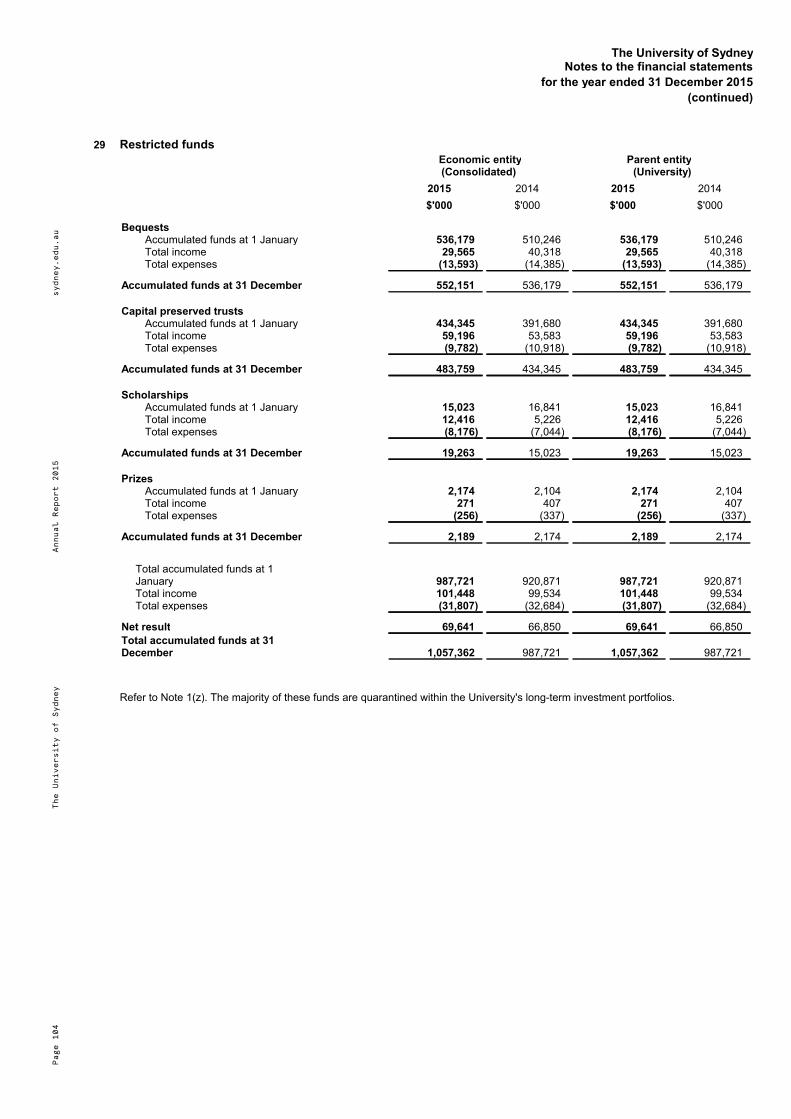
The University of SydneyNotes to the financial statements
for the year ended 31 December 2015
(continued)
29 Restricted funds Economic entity
(Consolidated) Parent entity
(University)
2015
$'000
2014
$'000
2015
$'000
2014
$'000
BequestsAccumulated funds at 1 January 536,179 510,246 536,179 510,246Total income 29,565 40,318 29,565 40,318Total expenses (13,593) (14,385) (13,593) (14,385)
Accumulated funds at 31 December 552,151 536,179 552,151 536,179
Capital preserved trustsAccumulated funds at 1 January 434,345 391,680 434,345 391,680Total income 59,196 53,583 59,196 53,583Total expenses (9,782) (10,918) (9,782) (10,918)
Accumulated funds at 31 December 483,759 434,345 483,759 434,345
ScholarshipsAccumulated funds at 1 January 15,023 16,841 15,023 16,841Total income 12,416 5,226 12,416 5,226Total expenses (8,176) (7,044) (8,176) (7,044)
Accumulated funds at 31 December 19,263 15,023 19,263 15,023
PrizesAccumulated funds at 1 January 2,174 2,104 2,174 2,104Total income 271 407 271 407Total expenses (256) (337) (256) (337)
Accumulated funds at 31 December 2,189 2,174 2,189 2,174
Total accumulated funds at 1January 987,721 920,871 987,721 920,871Total income 101,448 99,534 101,448 99,534Total expenses (31,807) (32,684) (31,807) (32,684)
Net result 69,641 66,850 69,641 66,850
Total accumulated funds at 31December 1,057,362 987,721 1,057,362 987,721
Refer to Note 1(z). The majority of these funds are quarantined within the University's long-term investment portfolios.
43
The University of SydneyNotes to the financial statements
for the year ended 31 December 2015
(continued)
30 Reserves and retained earnings
(a) Reserves
Economic entity(Consolidated)
Parent entity(University)
2015
$'000
2014
$'000
2015
$'000
2014
$'000
Property, plant and equipment revaluation reserve 408,051 359,957 408,007 359,957Hedging reserve - cash flow hedges (2,953) (4,925) (2,953) (4,925)Associates' reserves 1,468 1,893 0 0
Balance at 31 December 406,566 356,925 405,054 355,032
Movements
Property, plant and equipment revaluationreserve
Balance at 1 January 359,957 319,976 359,957 319,976Revaluation increments/(decrements) 48,094 39,981 48,050 39,981
Balance at 31 December 408,051 359,957 408,007 359,957
Hedging reserve - cash flow hedgesBalance at 1 January (4,925) (3,300) (4,925) (3,300)Less: expired hedges 1,126 0 1,126 0Valuation movement on hedge reserve 846 (1,625) 846 (1,625)
Balance at 31 December (2,953) (4,925) (2,953) (4,925)
Associates' reserveBalance at 1 January 1,893 1,898 0 0Less: transfers from reserves (425) (5) 0 0
Balance at 31 December 1,468 1,893 0 0
(b) Retained earnings
Economic entity(Consolidated)
Parent entity(University)
2015
$'000
2014
$'000
2015
$'000
2014
$'000
Retained earnings at 1 January 2,657,019 2,570,240 2,653,342 2,566,984Net result after income tax 159,798 161,595 158,230 161,174Distribution from subsidiaries 0 0 320 0Less: amount set aside for restricted funds (69,641) (66,850) (69,641) (66,850)Actuarial gains/(losses) on defined benefit plans (2,646) (7,966) (2,646) (7,966)
Retained earnings at 31 December 2,744,530 2,657,019 2,739,605 2,653,342
31 Key management personnel disclosures
(a) Responsible persons, executive officers and other key management personnel
The Senate of the University oversees all major decisions concerning the conduct of the University, including staff appointments andwelfare, student welfare and discipline, financial matters and the physical and academic development of the University. Apart frommembers of staff serving on Senate receiving remuneration as per their employment conditions, the Fellows of Senate received noremuneration in their capacity as Fellows of Senate.
44Page
104
sydn
ey.e
du.a
uTh
e Un
iver
sity
of
Sydn
eyAn
nual
Rep
ort
2015

The University of SydneyNotes to the financial statements
for the year ended 31 December 2015
(continued)
29 Restricted funds Economic entity
(Consolidated) Parent entity
(University)
2015
$'000
2014
$'000
2015
$'000
2014
$'000
BequestsAccumulated funds at 1 January 536,179 510,246 536,179 510,246Total income 29,565 40,318 29,565 40,318Total expenses (13,593) (14,385) (13,593) (14,385)
Accumulated funds at 31 December 552,151 536,179 552,151 536,179
Capital preserved trustsAccumulated funds at 1 January 434,345 391,680 434,345 391,680Total income 59,196 53,583 59,196 53,583Total expenses (9,782) (10,918) (9,782) (10,918)
Accumulated funds at 31 December 483,759 434,345 483,759 434,345
ScholarshipsAccumulated funds at 1 January 15,023 16,841 15,023 16,841Total income 12,416 5,226 12,416 5,226Total expenses (8,176) (7,044) (8,176) (7,044)
Accumulated funds at 31 December 19,263 15,023 19,263 15,023
PrizesAccumulated funds at 1 January 2,174 2,104 2,174 2,104Total income 271 407 271 407Total expenses (256) (337) (256) (337)
Accumulated funds at 31 December 2,189 2,174 2,189 2,174
Total accumulated funds at 1January 987,721 920,871 987,721 920,871Total income 101,448 99,534 101,448 99,534Total expenses (31,807) (32,684) (31,807) (32,684)
Net result 69,641 66,850 69,641 66,850
Total accumulated funds at 31December 1,057,362 987,721 1,057,362 987,721
Refer to Note 1(z). The majority of these funds are quarantined within the University's long-term investment portfolios.
43
The University of SydneyNotes to the financial statements
for the year ended 31 December 2015
(continued)
30 Reserves and retained earnings
(a) Reserves
Economic entity(Consolidated)
Parent entity(University)
2015
$'000
2014
$'000
2015
$'000
2014
$'000
Property, plant and equipment revaluation reserve 408,051 359,957 408,007 359,957Hedging reserve - cash flow hedges (2,953) (4,925) (2,953) (4,925)Associates' reserves 1,468 1,893 0 0
Balance at 31 December 406,566 356,925 405,054 355,032
Movements
Property, plant and equipment revaluationreserve
Balance at 1 January 359,957 319,976 359,957 319,976Revaluation increments/(decrements) 48,094 39,981 48,050 39,981
Balance at 31 December 408,051 359,957 408,007 359,957
Hedging reserve - cash flow hedgesBalance at 1 January (4,925) (3,300) (4,925) (3,300)Less: expired hedges 1,126 0 1,126 0Valuation movement on hedge reserve 846 (1,625) 846 (1,625)
Balance at 31 December (2,953) (4,925) (2,953) (4,925)
Associates' reserveBalance at 1 January 1,893 1,898 0 0Less: transfers from reserves (425) (5) 0 0
Balance at 31 December 1,468 1,893 0 0
(b) Retained earnings
Economic entity(Consolidated)
Parent entity(University)
2015
$'000
2014
$'000
2015
$'000
2014
$'000
Retained earnings at 1 January 2,657,019 2,570,240 2,653,342 2,566,984Net result after income tax 159,798 161,595 158,230 161,174Distribution from subsidiaries 0 0 320 0Less: amount set aside for restricted funds (69,641) (66,850) (69,641) (66,850)Actuarial gains/(losses) on defined benefit plans (2,646) (7,966) (2,646) (7,966)
Retained earnings at 31 December 2,744,530 2,657,019 2,739,605 2,653,342
31 Key management personnel disclosures
(a) Responsible persons, executive officers and other key management personnel
The Senate of the University oversees all major decisions concerning the conduct of the University, including staff appointments andwelfare, student welfare and discipline, financial matters and the physical and academic development of the University. Apart frommembers of staff serving on Senate receiving remuneration as per their employment conditions, the Fellows of Senate received noremuneration in their capacity as Fellows of Senate.
44 Page
105
Fina
ncia
l Re
port
s an
d St
atem
ents
201
5

The University of SydneyNotes to the financial statements
for the year ended 31 December 2015
(continued)
31 Key management personnel disclosures (continued)
(b) Key management personnel compensation
Economic entity(Consolidated)
Parent entity(University)
2015
$'000
2014
$'000
2015
$'000
2014
$'000
Short-term employee benefits 5,087 4,155 5,087 4,155Post-employment benefits 160 0 160 0
Total key management personnelcompensation 5,247 4,155 5,247 4,155
(c) Loans to key management personnel
The University has not made any loans to key management personnel.
32 Remuneration of auditors Economic entity
(Consolidated) Parent entity
(University)
2015
$'000
2014
$'000
2015
$'000
2014
$'000
(a) Audit servicesFees paid to the Audit Office of NSW
Audit and review of financial statements andother audit work. 618 580 526 521Audit fees for subsidiaries paid by parent entity 5 3 5 3
Audit services by private sector contractors 79 171 79 148
Total remuneration for audit services 702 754 610 672
(b) Other audit and assurance services Audit-related services
Fees paid to the Audit Office of NSWAudit of regulatory returns 165 29 165 29
Fees paid to other audit firms 55 0 55 0
Total remuneration paid for audit relatedservices 220 29 220 29
Total remuneration of auditors 922 783 830 701
33 Commitments
(a) Capital commitments
Capital expenditure contracted for at the reporting date but not recognised as liabilities are:
Economic entity(Consolidated)
Parent entity(University)
2015
$'000
2014
$'000
2015
$'000
2014
$'000
Property, plant and equipmentWithin one year 86,152 193,045 86,152 193,045Between one year and five years 0 0 0 0
Total PPE commitments 86,152 193,045 86,152 193,045
46Page
106
sydn
ey.e
du.a
uTh
e Un
iver
sity
of
Sydn
eyAn
nual
Rep
ort
2015
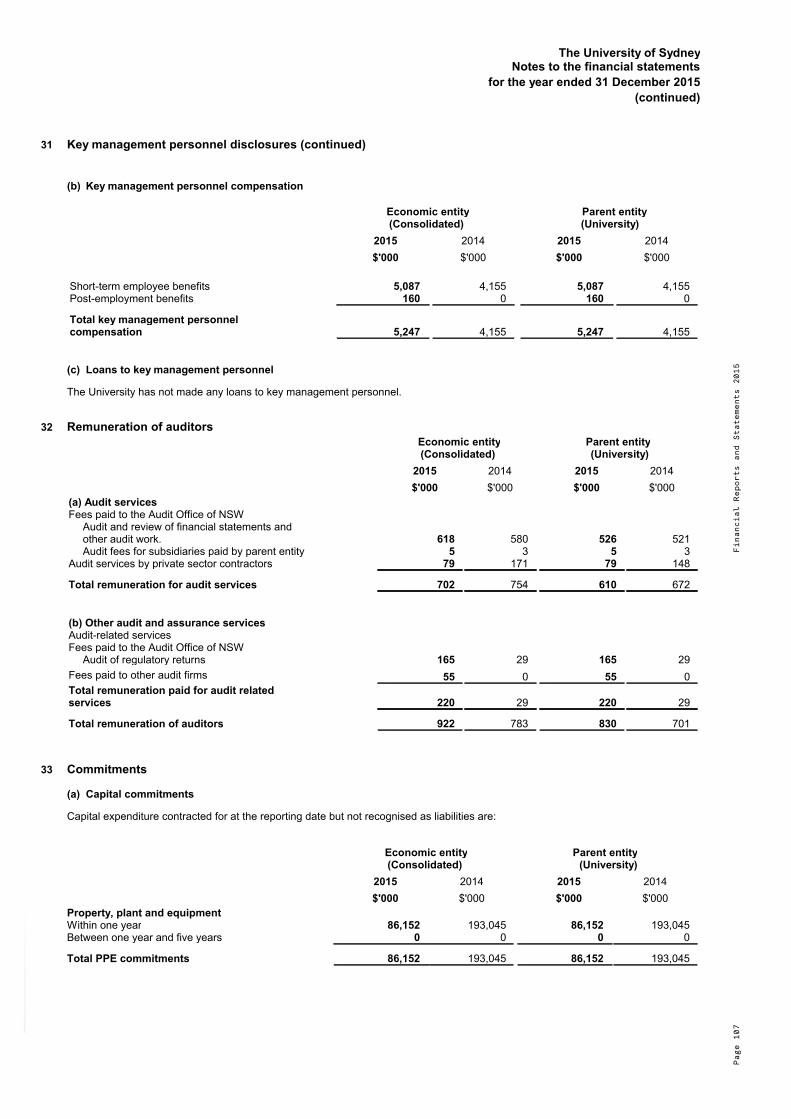
The University of SydneyNotes to the financial statements
for the year ended 31 December 2015
(continued)
31 Key management personnel disclosures (continued)
(b) Key management personnel compensation
Economic entity(Consolidated)
Parent entity(University)
2015
$'000
2014
$'000
2015
$'000
2014
$'000
Short-term employee benefits 5,087 4,155 5,087 4,155Post-employment benefits 160 0 160 0
Total key management personnelcompensation 5,247 4,155 5,247 4,155
(c) Loans to key management personnel
The University has not made any loans to key management personnel.
32 Remuneration of auditors Economic entity
(Consolidated) Parent entity
(University)
2015
$'000
2014
$'000
2015
$'000
2014
$'000
(a) Audit servicesFees paid to the Audit Office of NSW
Audit and review of financial statements andother audit work. 618 580 526 521Audit fees for subsidiaries paid by parent entity 5 3 5 3
Audit services by private sector contractors 79 171 79 148
Total remuneration for audit services 702 754 610 672
(b) Other audit and assurance services Audit-related services
Fees paid to the Audit Office of NSWAudit of regulatory returns 165 29 165 29
Fees paid to other audit firms 55 0 55 0
Total remuneration paid for audit relatedservices 220 29 220 29
Total remuneration of auditors 922 783 830 701
33 Commitments
(a) Capital commitments
Capital expenditure contracted for at the reporting date but not recognised as liabilities are:
Economic entity(Consolidated)
Parent entity(University)
2015
$'000
2014
$'000
2015
$'000
2014
$'000
Property, plant and equipmentWithin one year 86,152 193,045 86,152 193,045Between one year and five years 0 0 0 0
Total PPE commitments 86,152 193,045 86,152 193,045
46 Page
107
Fina
ncia
l Re
port
s an
d St
atem
ents
201
5

The University of SydneyNotes to the financial statements
for the year ended 31 December 2015
(continued)
33 Commitments (continued)
(a) Capital commitments (continued)
IntangiblesWithin one year 5,803 10,005 5,803 10,005Between one year and five years 1,286 0 1,286 0
Total intangible asset commitments 7,089 10,005 7,089 10,005
(b) Operating lease commitments
Economic entity(Consolidated)
Parent entity(University)
2015
$'000
2014
$'000
2015
$'000
2014
$'000
Within one year 24,380 21,202 24,372 21,128Between one and five years 51,685 44,961 51,682 44,951Later than five years* 10,501 11,959 10,501 11,959
Total future minimum lease payments 86,566 78,122 86,555 78,038
* The University has a lease arrangement which terminates in 2095 for the Sydney College of the Arts (SCA) in the heritage protectedKirkbride Complex at Callan Park, Rozelle. The long-term portion of this lease is not included above as the University may outgrowthe premises or relocate the SCA to another campus or location in the longer term. The University can relocate under thesecircumstances subject to receipt of Ministerial approval.
(c) Other commitments
Economic entity(Consolidated)
Parent entity(University)
2015
$'000
2014
$'000
2015
$'000
2014
$'000
Within one year 100,270 86,542 100,270 86,542Between one year and five years 50,312 70,308 50,312 70,308Later than five years 106 797 106 797
Total other non-payroll expenditurecommitment 150,688 157,647 150,688 157,647
Note: Commitments are GST inclusive.
34 Contingencies
(i) Proceedings against the University
An estimate of the maximum exposure on proceedings against the University amounts to $1,572k for 2015 (2014: $2,068k). It isestimated that the University's insurance policies would provide reimbursement of $975k (2014: $1,099k) in the event that theseproceedings were successful.
(ii) Occupancy Support Deed - Carillon Avenue Pty Ltd.
The University has given certain financial undertakings in support of bed vacancies that may occur at the Sydney University Village(SUV), which is owned by Carillon Avenue Pty Ltd. This financial support gradually reduces to nil by 2022 (and can only be calledupon when overall occupancy falls below 98 percent). Any payments made under this deed are considered not to be material as theycan firstly be offset by "claw back" payment arrangements that can be served on the operator and summer income net operatingprofits.
(iii) Bank guarantee and credit facility
The University currently has a bank guarantee facility up to a limit of $32,000k of which $16,718k was used during 2015. The bankguarantees given primarily relate to provision of security for the workers' compensation insurance program. The University has astandby letter of credit facility with a limit of $3,850k of which $2,525k was utilised.
47
The University of SydneyNotes to the financial statements
for the year ended 31 December 2015
(continued)
34 Contingencies (continued)
(iv) Letters of comfort to subsidiaries
The University has provided certain controlled entities with Letters of Comfort guaranteeing the liabilities of the relevant controlledentities as follows:
SydneyLearning Pty Limited
Sydney Talent Pty Limited
The Warren Centre for Advanced Engineering Limited
At the date of this report the net assets of the controlled entities covered by a letter of comfort total $395k (2014: $341k).
The University did not provide a letter of comfort for Bandwidth Foundry International Pty Ltd in 2015 as the company wasderegistered on 30 December 2015.
35 Amounts owing by Commonwealth and New South Wales governments
The University contributes to a number of superannuation schemes. Three of these schemes, namely the State AuthoritiesSuperannuation Scheme (SASS), the State Superannuation Scheme (SSS) and the State Authorities Non-contributorySuperannuation Scheme (SANCS), are State schemes and are subject to reimbursement arrangements under the Higher EducationSupport Act 2003.
In 2014 the Commonwealth and New South Wales Governments signed a memorandum of understanding to establish cost sharingarrangements for the State Schemes in the proportion of 78:22 between the Commonwealth and the State Government respectively.In order to facilitate payments in accordance with this arrangement, Amendment No.3 to the Other Grants Guidelines (Education)2012 under the Higher Education Support Act 2003 was registered on the Federal Register of Legislative Instruments on 4 December2014 and is now in effect.
The amount receivable from the Commonwealth and State in respect to the three state schemes as at 31 December 2015 was$1,564m (2014: $1,490m) and this is reflected in Note 17 as non-current receivables.
36 Defined benefit plans
(a) Fund specific disclosure
State Authorities Superannuation Trustee Corporation
The University maintains a reserve account within the State Authorities Superannuation Trustee Corporation to assist in financing theemployer contributions to SASS, SANCS and SSS.
These schemes are all defined benefit schemes. Each member's final benefit in relation to these schemes is derived from a multipleof their salary and years of membership. All three schemes are closed to new members.
Professorial Superannuation System (PSS)
The Professorial Superannuation System is closed to new members and provides active members with a combination ofaccumulation benefits and defined benefits. Pensioner members receive pension payments from the system. The Defined BenefitsSection of the system provides members with an optional funded Widows' Contributory Pension, an optional funded Spouses'Contributory Pension and an unfunded Non-Contributory Pension payable from age sixty five. These benefits are funded bycontributions from system members and the University. Accumulation benefit entitlements are not included. For these members,assets and liabilities are always equal in value and so have no impact on the University's net liability.
The gross liability for the University of Sydney Professorial Superannuation System was based on the Alea Actuarial Consulting PtyLtd assessment as at 31 December 2015.
Liability
A net unfunded liability for retirement benefits of $1,567m (2014: $1,490m) is included in the statement of financial position as $6m(2014: $17m) within non-current receivables and $1,573m (2014: $1,507m) within non-current provisions. $1,564m (2014: $1,490m)of this is payable by the Commonwealth and New South Wales Governments (Refer to Note 35).
The valuation methodology and principal actuarial assumptions as at 31 December 2015 are as follows:
(i) Valuation method
The projected unit credit valuation method was used to determine the present value of the defined benefit obligations and the relatedcurrent service costs.
This method sees each period of service as giving rise to an additional unit of benefit entitlement and measures each unit separatelyto build up the final obligation.
48Page
108
sydn
ey.e
du.a
uTh
e Un
iver
sity
of
Sydn
eyAn
nual
Rep
ort
2015

The University of SydneyNotes to the financial statements
for the year ended 31 December 2015
(continued)
33 Commitments (continued)
(a) Capital commitments (continued)
IntangiblesWithin one year 5,803 10,005 5,803 10,005Between one year and five years 1,286 0 1,286 0
Total intangible asset commitments 7,089 10,005 7,089 10,005
(b) Operating lease commitments
Economic entity(Consolidated)
Parent entity(University)
2015
$'000
2014
$'000
2015
$'000
2014
$'000
Within one year 24,380 21,202 24,372 21,128Between one and five years 51,685 44,961 51,682 44,951Later than five years* 10,501 11,959 10,501 11,959
Total future minimum lease payments 86,566 78,122 86,555 78,038
* The University has a lease arrangement which terminates in 2095 for the Sydney College of the Arts (SCA) in the heritage protectedKirkbride Complex at Callan Park, Rozelle. The long-term portion of this lease is not included above as the University may outgrowthe premises or relocate the SCA to another campus or location in the longer term. The University can relocate under thesecircumstances subject to receipt of Ministerial approval.
(c) Other commitments
Economic entity(Consolidated)
Parent entity(University)
2015
$'000
2014
$'000
2015
$'000
2014
$'000
Within one year 100,270 86,542 100,270 86,542Between one year and five years 50,312 70,308 50,312 70,308Later than five years 106 797 106 797
Total other non-payroll expenditurecommitment 150,688 157,647 150,688 157,647
Note: Commitments are GST inclusive.
34 Contingencies
(i) Proceedings against the University
An estimate of the maximum exposure on proceedings against the University amounts to $1,572k for 2015 (2014: $2,068k). It isestimated that the University's insurance policies would provide reimbursement of $975k (2014: $1,099k) in the event that theseproceedings were successful.
(ii) Occupancy Support Deed - Carillon Avenue Pty Ltd.
The University has given certain financial undertakings in support of bed vacancies that may occur at the Sydney University Village(SUV), which is owned by Carillon Avenue Pty Ltd. This financial support gradually reduces to nil by 2022 (and can only be calledupon when overall occupancy falls below 98 percent). Any payments made under this deed are considered not to be material as theycan firstly be offset by "claw back" payment arrangements that can be served on the operator and summer income net operatingprofits.
(iii) Bank guarantee and credit facility
The University currently has a bank guarantee facility up to a limit of $32,000k of which $16,718k was used during 2015. The bankguarantees given primarily relate to provision of security for the workers' compensation insurance program. The University has astandby letter of credit facility with a limit of $3,850k of which $2,525k was utilised.
47
The University of SydneyNotes to the financial statements
for the year ended 31 December 2015
(continued)
34 Contingencies (continued)
(iv) Letters of comfort to subsidiaries
The University has provided certain controlled entities with Letters of Comfort guaranteeing the liabilities of the relevant controlledentities as follows:
SydneyLearning Pty Limited
Sydney Talent Pty Limited
The Warren Centre for Advanced Engineering Limited
At the date of this report the net assets of the controlled entities covered by a letter of comfort total $395k (2014: $341k).
The University did not provide a letter of comfort for Bandwidth Foundry International Pty Ltd in 2015 as the company wasderegistered on 30 December 2015.
35 Amounts owing by Commonwealth and New South Wales governments
The University contributes to a number of superannuation schemes. Three of these schemes, namely the State AuthoritiesSuperannuation Scheme (SASS), the State Superannuation Scheme (SSS) and the State Authorities Non-contributorySuperannuation Scheme (SANCS), are State schemes and are subject to reimbursement arrangements under the Higher EducationSupport Act 2003.
In 2014 the Commonwealth and New South Wales Governments signed a memorandum of understanding to establish cost sharingarrangements for the State Schemes in the proportion of 78:22 between the Commonwealth and the State Government respectively.In order to facilitate payments in accordance with this arrangement, Amendment No.3 to the Other Grants Guidelines (Education)2012 under the Higher Education Support Act 2003 was registered on the Federal Register of Legislative Instruments on 4 December2014 and is now in effect.
The amount receivable from the Commonwealth and State in respect to the three state schemes as at 31 December 2015 was$1,564m (2014: $1,490m) and this is reflected in Note 17 as non-current receivables.
36 Defined benefit plans
(a) Fund specific disclosure
State Authorities Superannuation Trustee Corporation
The University maintains a reserve account within the State Authorities Superannuation Trustee Corporation to assist in financing theemployer contributions to SASS, SANCS and SSS.
These schemes are all defined benefit schemes. Each member's final benefit in relation to these schemes is derived from a multipleof their salary and years of membership. All three schemes are closed to new members.
Professorial Superannuation System (PSS)
The Professorial Superannuation System is closed to new members and provides active members with a combination ofaccumulation benefits and defined benefits. Pensioner members receive pension payments from the system. The Defined BenefitsSection of the system provides members with an optional funded Widows' Contributory Pension, an optional funded Spouses'Contributory Pension and an unfunded Non-Contributory Pension payable from age sixty five. These benefits are funded bycontributions from system members and the University. Accumulation benefit entitlements are not included. For these members,assets and liabilities are always equal in value and so have no impact on the University's net liability.
The gross liability for the University of Sydney Professorial Superannuation System was based on the Alea Actuarial Consulting PtyLtd assessment as at 31 December 2015.
Liability
A net unfunded liability for retirement benefits of $1,567m (2014: $1,490m) is included in the statement of financial position as $6m(2014: $17m) within non-current receivables and $1,573m (2014: $1,507m) within non-current provisions. $1,564m (2014: $1,490m)of this is payable by the Commonwealth and New South Wales Governments (Refer to Note 35).
The valuation methodology and principal actuarial assumptions as at 31 December 2015 are as follows:
(i) Valuation method
The projected unit credit valuation method was used to determine the present value of the defined benefit obligations and the relatedcurrent service costs.
This method sees each period of service as giving rise to an additional unit of benefit entitlement and measures each unit separatelyto build up the final obligation.
48 Page
109
Fina
ncia
l Re
port
s an
d St
atem
ents
201
5

The University of SydneyNotes to the financial statements
for the year ended 31 December 2015
(continued)
36 Defined benefit plans (continued)
(a) Fund specific disclosure (continued)
(ii) Economic assumptions
The principal assumptions used for the purposes of the actuarial valuations were as follows (expressed as weighted averages):
2015 2014% %
Discount rate(s)* 2.90% 2.83%Expected rate(s) of salary increase** 2.50% 2.50%
* The actuarial calculation for the Professorial Superannuation System specifically for the University of Sydney in 2015 used 2.9%(2014: 2.8%) as the discount rate assumption.
** The actuarial calculation for the Professorial Superannuation System specifically for the University of Sydney in 2015 used 2.9%(2014: 2.90%) as the salary increase assumption. The actuarial calculation for SASS, SANCS and SSS funds in 2015 used 2.5%(2014: 2.50%) as the salary increase assumption.
The University expects to make a contribution of $5,596k (2014: $6,243k) to the defined benefit plans during the next financial year.
The weighted average duration of the defined benefit obligation is 11.3 years (2014: 11.4 years). The expected maturity analysis ofundiscounted benefit payments is as follows:
Less than 1year$'000
Between 1and 2 years
$'000
Between 2and 5 years
$'000Over 5 years
$'000Total$'000
Defined benefit obligations - 31 December 2015 100,273 100,290 301,998 1,674,812 2,177,373Defined benefit obligations - 31 December 2014 99,963 100,260 301,925 1,796,657 2,298,805
(b) Categories of plan assets
The analysis of the plan assets at the reporting date is as follows:
2015 ($) 2014 ($)
Active MarketNo Active
Market Active Market No ActiveMarket
Cash and cash equivalents 20,645 207 6,140 21,253Equity instruments 127,239 21,198 166,828 25,988Debt instruments 8,267 20,170 9,150 27,681Property 6,059 14,042 7,549 18,996Other 6,412 42,045 8,137 47,753
Total 168,622 97,662 197,804 141,671
(c) Actuarial assumptions and sensitivity
The sensitivity of the defined benefit obligation to change in the significant assumptions is:
Change inassumption Impact on defined benefit obligation
Increase in assumption Decrease in assumption
Discount rate +/-1.0% Decrease by 10.0% Increase by 12.0%Salary growth rate +/-0.5% Increase by 0.3% Decrease by 0.3%
The above sensitivity analyses are based on a change in an assumption while holding all the other assumptions constant. In practicethis is unlikely to occur, and changes in some of the assumptions may be correlated. When calculating the sensitivity of the definedbenefit obligation to significant actuarial assumptions the same method has been applied as when calculating the defined benefitliability recognised in the statement of financial position.
The methods and types of assumptions used in the preparation of the sensitivity analysis did not change compared to the priorperiod.
49
The University of SydneyNotes to the financial statements
for the year ended 31 December 2015
(continued)
36 Defined benefit plans (continued)
(d) Statement of financial position amounts
Present value obligations - 2015$'000SASS
$'000SANCS
$'000SSS
$'000PSS
$'000Total
Opening defined benefit obligation 126,377 26,619 1,639,121 37,102 1,829,219Current service cost 4,226 949 1,736 70 6,981Taxes, premiums and benefit paid (209) 364 6,414 (70) 6,499Interest expense/(income) 3,376 694 45,289 989 50,348
133,770 28,626 1,692,560 38,091 1,893,047Remeasurements
Actuarial losses/(gains) arising fromchanges in financial demographic
1,554 (759) 57,252 0 58,047
Actuarial losses/(gains) arising fromchanges in financial assumptions
(105) 3 (13,773) (268) (14,143)
Experience losses/(gains) 3,539 (2,466) (7,552) 410 (6,069)
4,988 (3,222) 35,927 142 37,835Contributions
Plan participants 1,588 0 971 0 2,559
1,588 0 971 0 2,559Payments from plan
Benefits paid (17,891) (3,350) (75,174) (3,591) (100,006)
(17,891) (3,350) (75,174) (3,591) (100,006)
Closing defined benefit obligation 122,455 22,054 1,654,284 34,642 1,833,435
Present value of plan assets - 2015Opening fair value of plan assets 142,740 (7,939) 166,845 37,830 339,476Past service cost 0 0 0 0 0
142,740 (7,939) 166,845 37,830 339,476
Remeasurements
Interest income 3,774 (115) 3,599 1,008 8,266Actuarial losses/(gains) arisingfrom changes in financialassumptions
1,958 (137) 2,002 60 3,883
5,732 (252) 5,601 1,068 12,149Contributions
Employers (4,615) 11,950 (1,727) 0 5,608Plan participants 1,588 0 971 0 2,559
(3,027) 11,950 (756) 0 8,167Payments from plan
Benefits paid (17,891) (3,350) (75,174) (3,591) (100,006)Taxes, premiums and expensespaid
(209) 364 6,414 (70) 6,499
(18,100) (2,986) (68,760) (3,661) (93,507)
Closing fair value of plan assets 127,345 773 102,930 35,237 266,285
Reimbursement rights - 2015Opening value of reimbursement right (16,363) 34,559 1,472,275 0 1,490,471Expected return on reimbursementrights
8,443 (10,194) 45,153 0 43,402
Actuarial remeasurements 3,030 (3,084) 33,926 0 33,872Remeasurement through profit or loss (132) (25) (594) 0 (751)Remeasurement through othercomprehensive income
(1,402) (315) (847) 0 (2,564)
Closing value of reimbursementright (6,424) 20,941 1,549,913 0 1,564,430
Net liability - 2015Defined benefit obligation 122,455 22,054 1,654,284 34,642 1,833,435Fair value of plan assets (127,345) (773) (102,930) (35,237) (266,285)
Net liability (4,890) 21,281 1,551,354 (595) 1,567,150Reimbursement right (6,424) 20,941 1,549,913 0 1,564,430
Total net liability/(asset) instatement of financial position 1,534 340 1,441 (595) 2,720
50Page
110
sydn
ey.e
du.a
uTh
e Un
iver
sity
of
Sydn
eyAn
nual
Rep
ort
2015

The University of SydneyNotes to the financial statements
for the year ended 31 December 2015
(continued)
36 Defined benefit plans (continued)
(a) Fund specific disclosure (continued)
(ii) Economic assumptions
The principal assumptions used for the purposes of the actuarial valuations were as follows (expressed as weighted averages):
2015 2014% %
Discount rate(s)* 2.90% 2.83%Expected rate(s) of salary increase** 2.50% 2.50%
* The actuarial calculation for the Professorial Superannuation System specifically for the University of Sydney in 2015 used 2.9%(2014: 2.8%) as the discount rate assumption.
** The actuarial calculation for the Professorial Superannuation System specifically for the University of Sydney in 2015 used 2.9%(2014: 2.90%) as the salary increase assumption. The actuarial calculation for SASS, SANCS and SSS funds in 2015 used 2.5%(2014: 2.50%) as the salary increase assumption.
The University expects to make a contribution of $5,596k (2014: $6,243k) to the defined benefit plans during the next financial year.
The weighted average duration of the defined benefit obligation is 11.3 years (2014: 11.4 years). The expected maturity analysis ofundiscounted benefit payments is as follows:
Less than 1year$'000
Between 1and 2 years
$'000
Between 2and 5 years
$'000Over 5 years
$'000Total$'000
Defined benefit obligations - 31 December 2015 100,273 100,290 301,998 1,674,812 2,177,373Defined benefit obligations - 31 December 2014 99,963 100,260 301,925 1,796,657 2,298,805
(b) Categories of plan assets
The analysis of the plan assets at the reporting date is as follows:
2015 ($) 2014 ($)
Active MarketNo Active
Market Active Market No ActiveMarket
Cash and cash equivalents 20,645 207 6,140 21,253Equity instruments 127,239 21,198 166,828 25,988Debt instruments 8,267 20,170 9,150 27,681Property 6,059 14,042 7,549 18,996Other 6,412 42,045 8,137 47,753
Total 168,622 97,662 197,804 141,671
(c) Actuarial assumptions and sensitivity
The sensitivity of the defined benefit obligation to change in the significant assumptions is:
Change inassumption Impact on defined benefit obligation
Increase in assumption Decrease in assumption
Discount rate +/-1.0% Decrease by 10.0% Increase by 12.0%Salary growth rate +/-0.5% Increase by 0.3% Decrease by 0.3%
The above sensitivity analyses are based on a change in an assumption while holding all the other assumptions constant. In practicethis is unlikely to occur, and changes in some of the assumptions may be correlated. When calculating the sensitivity of the definedbenefit obligation to significant actuarial assumptions the same method has been applied as when calculating the defined benefitliability recognised in the statement of financial position.
The methods and types of assumptions used in the preparation of the sensitivity analysis did not change compared to the priorperiod.
49
The University of SydneyNotes to the financial statements
for the year ended 31 December 2015
(continued)
36 Defined benefit plans (continued)
(d) Statement of financial position amounts
Present value obligations - 2015$'000SASS
$'000SANCS
$'000SSS
$'000PSS
$'000Total
Opening defined benefit obligation 126,377 26,619 1,639,121 37,102 1,829,219Current service cost 4,226 949 1,736 70 6,981Taxes, premiums and benefit paid (209) 364 6,414 (70) 6,499Interest expense/(income) 3,376 694 45,289 989 50,348
133,770 28,626 1,692,560 38,091 1,893,047Remeasurements
Actuarial losses/(gains) arising fromchanges in financial demographic
1,554 (759) 57,252 0 58,047
Actuarial losses/(gains) arising fromchanges in financial assumptions
(105) 3 (13,773) (268) (14,143)
Experience losses/(gains) 3,539 (2,466) (7,552) 410 (6,069)
4,988 (3,222) 35,927 142 37,835Contributions
Plan participants 1,588 0 971 0 2,559
1,588 0 971 0 2,559Payments from plan
Benefits paid (17,891) (3,350) (75,174) (3,591) (100,006)
(17,891) (3,350) (75,174) (3,591) (100,006)
Closing defined benefit obligation 122,455 22,054 1,654,284 34,642 1,833,435
Present value of plan assets - 2015Opening fair value of plan assets 142,740 (7,939) 166,845 37,830 339,476Past service cost 0 0 0 0 0
142,740 (7,939) 166,845 37,830 339,476
Remeasurements
Interest income 3,774 (115) 3,599 1,008 8,266Actuarial losses/(gains) arisingfrom changes in financialassumptions
1,958 (137) 2,002 60 3,883
5,732 (252) 5,601 1,068 12,149Contributions
Employers (4,615) 11,950 (1,727) 0 5,608Plan participants 1,588 0 971 0 2,559
(3,027) 11,950 (756) 0 8,167Payments from plan
Benefits paid (17,891) (3,350) (75,174) (3,591) (100,006)Taxes, premiums and expensespaid
(209) 364 6,414 (70) 6,499
(18,100) (2,986) (68,760) (3,661) (93,507)
Closing fair value of plan assets 127,345 773 102,930 35,237 266,285
Reimbursement rights - 2015Opening value of reimbursement right (16,363) 34,559 1,472,275 0 1,490,471Expected return on reimbursementrights
8,443 (10,194) 45,153 0 43,402
Actuarial remeasurements 3,030 (3,084) 33,926 0 33,872Remeasurement through profit or loss (132) (25) (594) 0 (751)Remeasurement through othercomprehensive income
(1,402) (315) (847) 0 (2,564)
Closing value of reimbursementright (6,424) 20,941 1,549,913 0 1,564,430
Net liability - 2015Defined benefit obligation 122,455 22,054 1,654,284 34,642 1,833,435Fair value of plan assets (127,345) (773) (102,930) (35,237) (266,285)
Net liability (4,890) 21,281 1,551,354 (595) 1,567,150Reimbursement right (6,424) 20,941 1,549,913 0 1,564,430
Total net liability/(asset) instatement of financial position 1,534 340 1,441 (595) 2,720
50 Page
111
Fina
ncia
l Re
port
s an
d St
atem
ents
201
5

The University of SydneyNotes to the financial statements
for the year ended 31 December 2015
(continued)
36 Defined benefit plans (continued)
(d) Statement of financial position amounts (continued)
Present value obligations - 2014$'000SASS
$'000SANCS
$'000SSS
$'000PSS
$'000Total
Opening defined benefit obligation 126,024 21,444 1,235,184 34,054 1,416,706Adjustment due to contribution tax (3,546) 4,325 176,535 0 177,314Current service cost 4,458 978 1,497 34 6,967Past service cost (267) (1,078) 3,725 (34) 2,346Interest expense/(income) 4,923 1,042 58,639 1,435 66,039
131,592 26,711 1,475,580 35,489 1,669,372Remeasurements
Actuarial losses/(gains) arisingfrom changes in financialassumptions
8,512 2,040 242,192 4,241 256,985
Experience losses/(gains) 754 1,528 (3,645) 953 (410)
9,266 3,568 238,547 5,194 256,575Contributions
Plan participants 1,682 0 1,330 0 3,012
1,682 0 1,330 0 3,012Payments from plan
Benefits paid (16,163) (3,660) (76,336) (3,581) (99,740)
(16,163) (3,660) (76,336) (3,581) (99,740)
Closing defined benefit obligation 126,377 26,619 1,639,121 37,102 1,829,219
Present value of plan assets - 2014Opening fair value of plan assets 143,456 (3,838) 220,276 38,846 398,740Past service cost 0 0 0 0 0
143,456 (3,838) 220,276 38,846 398,740Remeasurements
Return on plan assets, excludingamounts included in interestexpense
5,893 (200) 7,791 1,629 15,113
Actuarial losses/(gains) arisingfrom changes in financialassumptions
4,653 (174) 8,831 970 14,280
10,546 (374) 16,622 2,599 29,393Contributions
Employers 3,486 1,011 1,229 0 5,726Plan participants 1,682 0 1,330 0 3,012
5,168 1,011 2,559 0 8,738Payments from plan
Benefits paid (16,163) (3,660) (76,336) (3,581) (99,740)Taxes, premiums and expensespaid (267) (1,078) 3,724 (34) 2,345
(16,430) (4,738) (72,612) (3,615) (97,395)
Closing fair value of plan assets 142,740 (7,939) 166,845 37,830 339,476
Reimbursement rights - 2014Opening value of reimbursement right (17,432) 0 1,009,244 0 991,812Expected return on reimbursementrights 2 0 51,118 0 51,120Actuarial remeasurements 1,067 0 406,250 0 407,317Restatement of opening balance 0 34,558 5,664 0 40,222
Closing value of reimbursementright (16,363) 34,558 1,472,276 0 1,490,471
Net liability - 2014
Defined benefit obligation 126,377 26,619 1,639,121 37,102 1,829,219
Fair value of plan assets (142,740) 7,939 (166,845) (37,830) (339,476)
Net liability (16,363) 34,558 1,472,276 (728) 1,489,743Reimbursement right (16,363) 34,558 1,472,276 0 1,490,471
Total net liability/(asset) instatement of financial position 0 0 0 (728) (728)
51
The University of SydneyNotes to the financial statements
for the year ended 31 December 2015
(continued)
36 Defined benefit plans (continued)
(e) UniSuper defined benefit division (UniSuper)
The superannuation scheme used by the University is the UniSuper defined benefit division (UniSuper), formerly known as theSuperannuation Scheme for Australian Universities (SSAU). UniSuper has operated from 1 March 1988 for academics and from 1July 1991 for general staff.
Clause 34 of the UniSuper Trust Deed outlines the process UniSuper must undertake (including employer notifications and noticeperiods) in order to request additional contributions from employers if the UniSuper assets are considered by the Trustee to beinsufficient to provide benefits payable under the deed. In these circumstances, at least four years notice is required. If such a requestwas agreed to by all employers then members would have to contribute additional funds. If all the employers did not agree to increasecontributions, the Trustee would have to reduce benefits payable to members on a fair and equitable basis. Due to the deterioration ofthe defined benefit division funding position since 2008, the Trustee decided to reduce the rate at which benefits accrue in respect ofthe defined benefits division after 1 January 2015.
Should the balance of UniSuper become a deficit, the universities are not liable to make any payments to UniSuper unless all theuniversities (including the University of Sydney) who are members of the UniSuper Fund unanimously agree to make additionalcontributions to the fund. It is only on this basis that the universities would be liable for the agreed additional contribution.Management of the parent entity believes it is unlikely that any additional contribution will be required in the foreseeable future.
Historically, surpluses in UniSuper were used to improve members' benefits and have not affected the amount of participatingemployers' contributions.
As at 30 June 2015, the assets of UniSuper in aggregate, were estimated to be $1,479m above vested benefits, after allowing forvarious reserves. As at 30 June 2014 the total assets of UniSuper were estimated to be $271m above vested benefits. The vestedbenefits are benefits that are not conditional upon continued membership (or any factor other than leaving the service of theparticipating institution) and include the value of indexed pensions being provided by the Defined Benefit Division.
As at 30 June 2015, the assets of UniSuper were estimated to be $3,377m above accrued benefits, after allowing for variousreserves. As at 30 June 2014 the assets of the fund were estimated to be $2,071m above accrued benefits. The accrued benefitshave been calculated as the present value of expected future benefits payments to members and indexed pensioners that arise frommembership of UniSuper up to the reporting date.
37 Business combinations
(a) Summary of acquisition
On 30 June 2014, the University was donated a company, Westmead IVF Pty Limited. This entity is located at Westmead Hospitaland provides assisted reproductive services to customers largely in Sydney's western suburbs. There were no acquisitions in 2015.
Following the donation, management adopted a valuation of $7.5m for the entity which was largely based on a third party valuationcompleted as part of the University's pre-donation due diligence activity. The fair value of the identifiable assets acquired of $1.371mtherefore gave rise to goodwill on acquisition of $6.129m as follows:
2014
$'000
Purchase consideration (refer to (b) below) 0Contingent consideration 0
Fair value of net identifiable assets acquired (refer to (c)below) 1,371
Goodwill (refer to (d) below) 6,129
(b) Purchase consideration
Economic entity(Consolidated)
Parent entity(University)
2015
$'000
2014
$'000
2015
$'000
2014
$'000
Outflow of cash to acquire subsidiary,net of cash acquired
Cash consideration 0 0 0 0
Less: balance acquired 0 846 0 0
Cash 0 (846) 0 0
Bank overdraft 0 0 0 0
Outflow/(inflow) of cash 0 (846) 0 0
52Page
112
sydn
ey.e
du.a
uTh
e Un
iver
sity
of
Sydn
eyAn
nual
Rep
ort
2015

The University of SydneyNotes to the financial statements
for the year ended 31 December 2015
(continued)
36 Defined benefit plans (continued)
(d) Statement of financial position amounts (continued)
Present value obligations - 2014$'000SASS
$'000SANCS
$'000SSS
$'000PSS
$'000Total
Opening defined benefit obligation 126,024 21,444 1,235,184 34,054 1,416,706Adjustment due to contribution tax (3,546) 4,325 176,535 0 177,314Current service cost 4,458 978 1,497 34 6,967Past service cost (267) (1,078) 3,725 (34) 2,346Interest expense/(income) 4,923 1,042 58,639 1,435 66,039
131,592 26,711 1,475,580 35,489 1,669,372Remeasurements
Actuarial losses/(gains) arisingfrom changes in financialassumptions
8,512 2,040 242,192 4,241 256,985
Experience losses/(gains) 754 1,528 (3,645) 953 (410)
9,266 3,568 238,547 5,194 256,575Contributions
Plan participants 1,682 0 1,330 0 3,012
1,682 0 1,330 0 3,012Payments from plan
Benefits paid (16,163) (3,660) (76,336) (3,581) (99,740)
(16,163) (3,660) (76,336) (3,581) (99,740)
Closing defined benefit obligation 126,377 26,619 1,639,121 37,102 1,829,219
Present value of plan assets - 2014Opening fair value of plan assets 143,456 (3,838) 220,276 38,846 398,740Past service cost 0 0 0 0 0
143,456 (3,838) 220,276 38,846 398,740Remeasurements
Return on plan assets, excludingamounts included in interestexpense
5,893 (200) 7,791 1,629 15,113
Actuarial losses/(gains) arisingfrom changes in financialassumptions
4,653 (174) 8,831 970 14,280
10,546 (374) 16,622 2,599 29,393Contributions
Employers 3,486 1,011 1,229 0 5,726Plan participants 1,682 0 1,330 0 3,012
5,168 1,011 2,559 0 8,738Payments from plan
Benefits paid (16,163) (3,660) (76,336) (3,581) (99,740)Taxes, premiums and expensespaid (267) (1,078) 3,724 (34) 2,345
(16,430) (4,738) (72,612) (3,615) (97,395)
Closing fair value of plan assets 142,740 (7,939) 166,845 37,830 339,476
Reimbursement rights - 2014Opening value of reimbursement right (17,432) 0 1,009,244 0 991,812Expected return on reimbursementrights 2 0 51,118 0 51,120Actuarial remeasurements 1,067 0 406,250 0 407,317Restatement of opening balance 0 34,558 5,664 0 40,222
Closing value of reimbursementright (16,363) 34,558 1,472,276 0 1,490,471
Net liability - 2014
Defined benefit obligation 126,377 26,619 1,639,121 37,102 1,829,219
Fair value of plan assets (142,740) 7,939 (166,845) (37,830) (339,476)
Net liability (16,363) 34,558 1,472,276 (728) 1,489,743Reimbursement right (16,363) 34,558 1,472,276 0 1,490,471
Total net liability/(asset) instatement of financial position 0 0 0 (728) (728)
51
The University of SydneyNotes to the financial statements
for the year ended 31 December 2015
(continued)
36 Defined benefit plans (continued)
(e) UniSuper defined benefit division (UniSuper)
The superannuation scheme used by the University is the UniSuper defined benefit division (UniSuper), formerly known as theSuperannuation Scheme for Australian Universities (SSAU). UniSuper has operated from 1 March 1988 for academics and from 1July 1991 for general staff.
Clause 34 of the UniSuper Trust Deed outlines the process UniSuper must undertake (including employer notifications and noticeperiods) in order to request additional contributions from employers if the UniSuper assets are considered by the Trustee to beinsufficient to provide benefits payable under the deed. In these circumstances, at least four years notice is required. If such a requestwas agreed to by all employers then members would have to contribute additional funds. If all the employers did not agree to increasecontributions, the Trustee would have to reduce benefits payable to members on a fair and equitable basis. Due to the deterioration ofthe defined benefit division funding position since 2008, the Trustee decided to reduce the rate at which benefits accrue in respect ofthe defined benefits division after 1 January 2015.
Should the balance of UniSuper become a deficit, the universities are not liable to make any payments to UniSuper unless all theuniversities (including the University of Sydney) who are members of the UniSuper Fund unanimously agree to make additionalcontributions to the fund. It is only on this basis that the universities would be liable for the agreed additional contribution.Management of the parent entity believes it is unlikely that any additional contribution will be required in the foreseeable future.
Historically, surpluses in UniSuper were used to improve members' benefits and have not affected the amount of participatingemployers' contributions.
As at 30 June 2015, the assets of UniSuper in aggregate, were estimated to be $1,479m above vested benefits, after allowing forvarious reserves. As at 30 June 2014 the total assets of UniSuper were estimated to be $271m above vested benefits. The vestedbenefits are benefits that are not conditional upon continued membership (or any factor other than leaving the service of theparticipating institution) and include the value of indexed pensions being provided by the Defined Benefit Division.
As at 30 June 2015, the assets of UniSuper were estimated to be $3,377m above accrued benefits, after allowing for variousreserves. As at 30 June 2014 the assets of the fund were estimated to be $2,071m above accrued benefits. The accrued benefitshave been calculated as the present value of expected future benefits payments to members and indexed pensioners that arise frommembership of UniSuper up to the reporting date.
37 Business combinations
(a) Summary of acquisition
On 30 June 2014, the University was donated a company, Westmead IVF Pty Limited. This entity is located at Westmead Hospitaland provides assisted reproductive services to customers largely in Sydney's western suburbs. There were no acquisitions in 2015.
Following the donation, management adopted a valuation of $7.5m for the entity which was largely based on a third party valuationcompleted as part of the University's pre-donation due diligence activity. The fair value of the identifiable assets acquired of $1.371mtherefore gave rise to goodwill on acquisition of $6.129m as follows:
2014
$'000
Purchase consideration (refer to (b) below) 0Contingent consideration 0
Fair value of net identifiable assets acquired (refer to (c)below) 1,371
Goodwill (refer to (d) below) 6,129
(b) Purchase consideration
Economic entity(Consolidated)
Parent entity(University)
2015
$'000
2014
$'000
2015
$'000
2014
$'000
Outflow of cash to acquire subsidiary,net of cash acquired
Cash consideration 0 0 0 0
Less: balance acquired 0 846 0 0
Cash 0 (846) 0 0
Bank overdraft 0 0 0 0
Outflow/(inflow) of cash 0 (846) 0 0
52 Page
113
Fina
ncia
l Re
port
s an
d St
atem
ents
201
5

The University of SydneyNotes to the financial statements
for the year ended 31 December 2015
(continued)
37 Business combinations (continued)
(c) Assets acquired and liabilities assumed
The assets and liabilities arising from the acquisition are as follows:
2014
Acquiree’scarrying amount
$'000
Fair value
$'000
Cash and cash equivalents 846 846Trade and other receivables 412 412Property, plant and equipment 1,049 1,049Other assets 111 111Trade and other payables (573) (573)Deferred revenue (246) (246)Current tax liability (228) (228)
Net assets 1,371 1,371
Net identifiable assets acquired 1,371 1,371
(d) Goodwill arising on acquisition
2014
Acquiree’scarrying amount
$'000
Fair value
$'000
Goodwill arising on acquisition 6,129 6,129
38 Subsidiaries
The consolidated financial statements incorporate the assets, liabilities and results of the following subsidiaries in accordance with theaccounting policy described in Note 1(b).
Ownership interest
Name of EntityPrincipal place of
business
2015
%
2014
%
SydneyLearning Pty Limited Camperdown, NSW 100 100
Sydney Talent Pty Limited Camperdown, NSW 100 100
The Warren Centre for AdvancedEngineering Limited
Camperdown, NSW 100 100
WayAhead Pty Limited* Camperdown NSW 0 100
Bandwidth Foundry International PtyLimited**
Camperdown, NSW 0 100
Westmead IVF Pty Limited Westmead NSW 100 100
A14 Holdings Pty Limited*** Camperdown, NSW 100 0
* Deregistered 8 July 2015
** Deregistered 30 December 2015
*** Registered 20 October 2015
39 Joint operations
Ownership interest/voting rights held
Name of joint operations Nature of relationship Principle place of business
2015
%
2014
%
United States Studies Centre*Australian public company,limited by guarantee Camperdown, NSW 50 50
53
The University of SydneyNotes to the financial statements
for the year ended 31 December 2015
(continued)
39 Joint operations (continued)
* The United States Studies Centre is a company limited by guarantee. Its constitution prohibits distribution to members. Accordingly,the University's share of net assets, revenue and expenses has not been recorded.
40 Investments accounted for using the equity method
(a) Associates
Ownership Interest
Name of Entity Place of business Measurement method
2015
%
2014
%
Abercombie Street ChildcareLimited*
Darlington, NSW Equity method 1 1
Acumine Pty Limited Eveleigh, NSW Equity method 25 25
ANZAC Health and MedicalResearch Foundation*
Concord, NSW Equity method 18 18
Australian Technology ParkInnovations Pty Limited
Eveleigh, NSW Equity method 25 25
Glycemic Index Foundation* St Leonards, NSW Equity method 50 50
Medsaic Pty Limited Camperdown, NSW Equity method 22 22
Nuflora International Pty Limited Sydney, NSW Equity method 38 38
Sydney Institute of Marine Science* Mosman, NSW Equity method 25 25
Westmead Millennium Institute forMedical Research*
Westmead, NSW Equity method 33 33
ZingoTX Pty Limited Camperdown, NSW Equity method 21 21
UIIT Pty Ltd St. Lucia, QLD Equity method 20 0
UIIT Trust No 7** St. Lucia, QLD Equity method 100 0
Uniseed Management Pty Ltd St. Lucia, QLD Equity method 20 0
Praxis Australia Limited* Eastwood, SA Equity method 33 0
* These companies are public companies limited by guarantee. The constitutions of these companies prohibit distribution of funds tothe members. Accordingly, the results of these companies are equity accounted at nil value.
** The University holds 100% of the units in UIIT Trust No.7; however by virtue of the Unitholders Deed in relation to the UIIT's andUniseed Management Shareholders Agreement the trust is subject to significant influence and is therefore considered an associate.
The total value of associates accounted for using the equity method at 31 December 2015 is $5,693k (2014: $4,549k). The Universityhas assessed that none of the above associates are individually material to the financial statements.
(b) Joint ventures
Ownership Interest %
Name of Entity Place of business Measurement method
2015
%
2014
%
University of Sydney FoundationProgram Pty Limited
Waterloo, NSW Share of net assets 50 50
NSW Centre for Animal and PlantBiosecurity
Camden, NSW Share of net assets 50 50
The total value of joint ventures accounted for using the equity method at 31 December 2015 is $305k (2014: $284k). The Universityhas assessed that none of the above joint ventures are individually material to the financial statements.
54Page
114
sydn
ey.e
du.a
uTh
e Un
iver
sity
of
Sydn
eyAn
nual
Rep
ort
2015

The University of SydneyNotes to the financial statements
for the year ended 31 December 2015
(continued)
37 Business combinations (continued)
(c) Assets acquired and liabilities assumed
The assets and liabilities arising from the acquisition are as follows:
2014
Acquiree’scarrying amount
$'000
Fair value
$'000
Cash and cash equivalents 846 846Trade and other receivables 412 412Property, plant and equipment 1,049 1,049Other assets 111 111Trade and other payables (573) (573)Deferred revenue (246) (246)Current tax liability (228) (228)
Net assets 1,371 1,371
Net identifiable assets acquired 1,371 1,371
(d) Goodwill arising on acquisition
2014
Acquiree’scarrying amount
$'000
Fair value
$'000
Goodwill arising on acquisition 6,129 6,129
38 Subsidiaries
The consolidated financial statements incorporate the assets, liabilities and results of the following subsidiaries in accordance with theaccounting policy described in Note 1(b).
Ownership interest
Name of EntityPrincipal place of
business
2015
%
2014
%
SydneyLearning Pty Limited Camperdown, NSW 100 100
Sydney Talent Pty Limited Camperdown, NSW 100 100
The Warren Centre for AdvancedEngineering Limited
Camperdown, NSW 100 100
WayAhead Pty Limited* Camperdown NSW 0 100
Bandwidth Foundry International PtyLimited**
Camperdown, NSW 0 100
Westmead IVF Pty Limited Westmead NSW 100 100
A14 Holdings Pty Limited*** Camperdown, NSW 100 0
* Deregistered 8 July 2015
** Deregistered 30 December 2015
*** Registered 20 October 2015
39 Joint operations
Ownership interest/voting rights held
Name of joint operations Nature of relationship Principle place of business
2015
%
2014
%
United States Studies Centre*Australian public company,limited by guarantee Camperdown, NSW 50 50
53
The University of SydneyNotes to the financial statements
for the year ended 31 December 2015
(continued)
39 Joint operations (continued)
* The United States Studies Centre is a company limited by guarantee. Its constitution prohibits distribution to members. Accordingly,the University's share of net assets, revenue and expenses has not been recorded.
40 Investments accounted for using the equity method
(a) Associates
Ownership Interest
Name of Entity Place of business Measurement method
2015
%
2014
%
Abercombie Street ChildcareLimited*
Darlington, NSW Equity method 1 1
Acumine Pty Limited Eveleigh, NSW Equity method 25 25
ANZAC Health and MedicalResearch Foundation*
Concord, NSW Equity method 18 18
Australian Technology ParkInnovations Pty Limited
Eveleigh, NSW Equity method 25 25
Glycemic Index Foundation* St Leonards, NSW Equity method 50 50
Medsaic Pty Limited Camperdown, NSW Equity method 22 22
Nuflora International Pty Limited Sydney, NSW Equity method 38 38
Sydney Institute of Marine Science* Mosman, NSW Equity method 25 25
Westmead Millennium Institute forMedical Research*
Westmead, NSW Equity method 33 33
ZingoTX Pty Limited Camperdown, NSW Equity method 21 21
UIIT Pty Ltd St. Lucia, QLD Equity method 20 0
UIIT Trust No 7** St. Lucia, QLD Equity method 100 0
Uniseed Management Pty Ltd St. Lucia, QLD Equity method 20 0
Praxis Australia Limited* Eastwood, SA Equity method 33 0
* These companies are public companies limited by guarantee. The constitutions of these companies prohibit distribution of funds tothe members. Accordingly, the results of these companies are equity accounted at nil value.
** The University holds 100% of the units in UIIT Trust No.7; however by virtue of the Unitholders Deed in relation to the UIIT's andUniseed Management Shareholders Agreement the trust is subject to significant influence and is therefore considered an associate.
The total value of associates accounted for using the equity method at 31 December 2015 is $5,693k (2014: $4,549k). The Universityhas assessed that none of the above associates are individually material to the financial statements.
(b) Joint ventures
Ownership Interest %
Name of Entity Place of business Measurement method
2015
%
2014
%
University of Sydney FoundationProgram Pty Limited
Waterloo, NSW Share of net assets 50 50
NSW Centre for Animal and PlantBiosecurity
Camden, NSW Share of net assets 50 50
The total value of joint ventures accounted for using the equity method at 31 December 2015 is $305k (2014: $284k). The Universityhas assessed that none of the above joint ventures are individually material to the financial statements.
54 Page
115
Fina
ncia
l Re
port
s an
d St
atem
ents
201
5

The University of SydneyNotes to the financial statements
for the year ended 31 December 2015
(continued)
41 Reconciliation of net result after income tax to net cash provided by/(used in) operating activities
Economic entity(Consolidated)
Parent entity(University)
Notes2015$'000
2014$'000
2015$'000
2014$'000
Net operating result after income tax 159,798 161,595 158,230 161,174Depreciation and amortisation 173,856 159,342 173,660 159,134Retired assets written off 973 1,665 973 1,665(Gain)/loss on disposal of property, plant andequipment (86) (81) (86) (77)(Gain)/loss on sale of asset held for sale (31,588) 0 (31,588) 0Non-cash investment income (37,614) (53,599) (37,614) (53,599)Non-cash impairment of receivables 12 1,052 436 974 443Non-cash other (income)/expenses 13,968 4,034 15,052 4,509
(Increase)/decrease in inventories 101 176 70 186(Increase)/decrease in receivables (50,578) (503,510) (50,373) (502,967)(Increase)/decrease in deferred tax assets 0 (215) 0 0(Increase)/decrease in other assets (1,423) (10,564) (744) (10,564)(Increase)/decrease in current non-financial assets 3,960 (9,387) 3,960 (9,288)(Increase)/decrease in assets held for sale (600) (14,412) (600) (14,412)Increase/(decrease) in payables 4,867 (11,519) 5,379 (12,209)Increase/(decrease) in other liabilities (1,911) 1,625 (1,972) 1,625Increase/(decrease) in tax liabilities 948 1,740 948 1,312Increase/(decrease) in provisions 84,264 483,633 83,874 483,434
Net cash provided by/(used in) operatingactivities 319,987 210,959 320,143 210,366
42 Financial risk management
The University's activities expose it to a variety of financial risks including market risk (currency risk, interest rate risk and price risk),credit risk and liquidity risk. The overall risk management program focuses on the unpredictability of financial markets and seeks tominimise potential adverse effects on the University's financial performance.
The University has adopted a Treasury Management Policy approved by the Finance and Audit Committee (FAC), a Committee ofSenate that establishes and controls the policy framework for the management of risk. These risks are managed at an operationallevel by Financial Control and Treasury (FCT).
A variety of risk mitigation measures are used to manage the different types of risk to which the University is exposed.
Investment risk for the University's unitised investment funds is managed by Investment and Capital Management (ICM) underpolicies approved by the Investment and Commercialisation Committee (ICC), a committee of Senate. ICC meets on a quarterly basisto review the performance of the University's unitised investment portfolios and to approve matters relevant to its terms of referencethat have been submitted by ICM. The strategic asset allocation profiles of each of the unitised investment portfolio is reviewed on athree yearly basis.
The University maintains two unitised investment portfolios managed by ICM and a cash and short-term deposit portfolio managed byFCT to address a variety of objectives:
A medium-term unitised portfolio is used for funds with an investment horizon of three to seven years. These funds generally have
no requirement to preserve capital in perpetuity. This portfolio invests in growth type assets (shares) and in short to medium-term
fixed and floating rate securities.
A long-term unitised portfolio is used for the University's accumulated discretionary capital, the endowment portfolio and other
reserves that have a long-term investment horizon. This portfolio has an investment profile oriented towards growth assets and is
largely managed by external sector specialist managers.
A cash and short-term deposit portfolio performs the role of working capital fund and is used as a liquidity buffer to manage the
timing difference inherent in operational revenue and expenditure flows. This comprises a short-duration low-risk portfolio of fixed
rate term deposits together with cash held in an interest bearing bank account, all denominated in Australian dollars.
Consistent with asset management best practice, the medium-term and long-term investment funds are allocated so as to achievediversification of risk. Debt investments are invested across a range of Australian dollar denominated instruments according toapproved credit limits based upon credit ratings within the investment grade ratings band. Growth assets are invested across adiverse range of assets which include both domestic and international asset classes as well as both listed and unlisted investmentvehicles.
55
The University of SydneyNotes to the financial statements
for the year ended 31 December 2015
(continued)
42 Financial risk management (continued)
The Treasury Management Policy establishes the policy framework for the management of interest rate, liquidity and operationalfunding, foreign exchange, counterparty credit and operational risk.
Interest rate risk is managed by the Asset and Liability Committee (ALCO), an internal management committee reporting to FAC.ALCO is responsible for determining interest rate risk management strategies and their tactical implementation, and monitoring thereporting of positions taken.
In managing interest rate risk the University makes use of derivative financial instruments such as interest rate swaps to hedge cashflow risk exposures. Derivatives, in relation to the University's debt, are used for hedging purposes, not as trading or other speculativeinstruments. Overall, a proactive risk management approach is used with an emphasis on risk reduction.
In addition, the University maintains foreign currency balances as a natural hedge against foreign exchange risk or occasionallyenters into short dated forward contracts ahead of an underlying payment schedule.
(a) Market risk
(i) Foreign exchange risk
The University has exposure to foreign exchange risk. This arises from holding investments denominated in foreign currencies andbalances in bank accounts used to pay overseas suppliers.
If the Australian dollar had weakened/strengthened by 10% with all other variables held constant, the net result for the year wouldhave been $5,685k higher/$4,652k lower. In 2014, for a similar 10% weakening/strengthening, the profit or loss impact would havebeen $3,713k higher/$3,038k Iower.
(ii) Price risk
The University has exposure to equity security price risk. This arises from investments held by the University (primarily in the long-term and medium-term portfolios) and classified on the balance sheet at fair value through profit or loss. The impact of a change invalue of the securities would be reflected as either an increase or decrease in the fair value of the security through net result.
The University is not materially exposed to commodity price risk.
To manage its price risk from investments in equity securities, the University has contracted the management of the portfolio toexternal sector specialist managers. These managers are mandated to diversify the investments of the portfolio under theirmanagement. The University's equity investments include a diverse range of asset types including domestic and international classesas well as listed and unlisted investment vehicles. The quantum of funds under management per these managers and the investmentobjectives of each manager are established in accordance with limits and policies set by the ICC. The University also undertakesperiodic reviews of its strategic asset allocation to assess its risk return ratio.
The majority of the University's equity investments managed by managers are denominated in Australian dollars and are publiclytraded and included in the ASX 300 index.
As at 31 December 2015, the profit impact of a 10% increase/decrease in the ASX 300 Index with all other variables held constantwould be a $101,542k improvement/$101,541k reduction. In 2014, for a similar strengthening/weakening, profit or loss would havebeen an $89,694k improvement/$89,694k reduction.
(iii) Interest rate risk
The University's exposure to market interest rates relates primarily to the University's floating bank facility borrowings and investmentin debt securities (short term money market securities).
The University maintains floating to fixed interest rate profiles according to the Treasury Management Policy.
The University uses interest rate swaps to hedge the interest rate risk on a portion of its borrowings drawn on its floating rate bankdebt facility. These interest rate swaps are designated as cash flow hedge accounting relationships. As such, the impact of an interestrate change would be reflected as either an increase or decrease in the fair value of the derivatives through equity for the effectiveportion of the hedge. The gain or loss relating to the ineffective hedge portion (if any) is recognised immediately in profit or loss.
The University’ short-term cash and deposit portfolio consists of short-term deposits held with investment grade Australian bankstogether with cash held in an interest bearing bank account held with an investment grade Australian bank. The short-term cash anddeposit portfolio is fully invested in Australian dollars. This portfolio is classified at fair value through profit or loss and as such, theimpact of an interest rate change would be reflected as either an increase or decrease in profit or loss.
At 31 December 2015 if interest rates decreased/increased by 25 basis points with all other variables held constant, equity wouldhave been $468k lower/$466k higher as a result of a decrease/increase in the fair value of the interest rate swaps (2014: $919klower/$913k higher from debt securities). At 31 December 2015 if interest rates decreased/increased by 25 basis points with all othervariables held constant, profit or loss would have been $2,314k higher/$2,313k lower (2014: $1,714k higher/$1,713k lower) as a resultof an increase/decrease in the fair value of debt securities.
56Page
116
sydn
ey.e
du.a
uTh
e Un
iver
sity
of
Sydn
eyAn
nual
Rep
ort
2015

The University of SydneyNotes to the financial statements
for the year ended 31 December 2015
(continued)
41 Reconciliation of net result after income tax to net cash provided by/(used in) operating activities
Economic entity(Consolidated)
Parent entity(University)
Notes2015$'000
2014$'000
2015$'000
2014$'000
Net operating result after income tax 159,798 161,595 158,230 161,174Depreciation and amortisation 173,856 159,342 173,660 159,134Retired assets written off 973 1,665 973 1,665(Gain)/loss on disposal of property, plant andequipment (86) (81) (86) (77)(Gain)/loss on sale of asset held for sale (31,588) 0 (31,588) 0Non-cash investment income (37,614) (53,599) (37,614) (53,599)Non-cash impairment of receivables 12 1,052 436 974 443Non-cash other (income)/expenses 13,968 4,034 15,052 4,509
(Increase)/decrease in inventories 101 176 70 186(Increase)/decrease in receivables (50,578) (503,510) (50,373) (502,967)(Increase)/decrease in deferred tax assets 0 (215) 0 0(Increase)/decrease in other assets (1,423) (10,564) (744) (10,564)(Increase)/decrease in current non-financial assets 3,960 (9,387) 3,960 (9,288)(Increase)/decrease in assets held for sale (600) (14,412) (600) (14,412)Increase/(decrease) in payables 4,867 (11,519) 5,379 (12,209)Increase/(decrease) in other liabilities (1,911) 1,625 (1,972) 1,625Increase/(decrease) in tax liabilities 948 1,740 948 1,312Increase/(decrease) in provisions 84,264 483,633 83,874 483,434
Net cash provided by/(used in) operatingactivities 319,987 210,959 320,143 210,366
42 Financial risk management
The University's activities expose it to a variety of financial risks including market risk (currency risk, interest rate risk and price risk),credit risk and liquidity risk. The overall risk management program focuses on the unpredictability of financial markets and seeks tominimise potential adverse effects on the University's financial performance.
The University has adopted a Treasury Management Policy approved by the Finance and Audit Committee (FAC), a Committee ofSenate that establishes and controls the policy framework for the management of risk. These risks are managed at an operationallevel by Financial Control and Treasury (FCT).
A variety of risk mitigation measures are used to manage the different types of risk to which the University is exposed.
Investment risk for the University's unitised investment funds is managed by Investment and Capital Management (ICM) underpolicies approved by the Investment and Commercialisation Committee (ICC), a committee of Senate. ICC meets on a quarterly basisto review the performance of the University's unitised investment portfolios and to approve matters relevant to its terms of referencethat have been submitted by ICM. The strategic asset allocation profiles of each of the unitised investment portfolio is reviewed on athree yearly basis.
The University maintains two unitised investment portfolios managed by ICM and a cash and short-term deposit portfolio managed byFCT to address a variety of objectives:
A medium-term unitised portfolio is used for funds with an investment horizon of three to seven years. These funds generally have
no requirement to preserve capital in perpetuity. This portfolio invests in growth type assets (shares) and in short to medium-term
fixed and floating rate securities.
A long-term unitised portfolio is used for the University's accumulated discretionary capital, the endowment portfolio and other
reserves that have a long-term investment horizon. This portfolio has an investment profile oriented towards growth assets and is
largely managed by external sector specialist managers.
A cash and short-term deposit portfolio performs the role of working capital fund and is used as a liquidity buffer to manage the
timing difference inherent in operational revenue and expenditure flows. This comprises a short-duration low-risk portfolio of fixed
rate term deposits together with cash held in an interest bearing bank account, all denominated in Australian dollars.
Consistent with asset management best practice, the medium-term and long-term investment funds are allocated so as to achievediversification of risk. Debt investments are invested across a range of Australian dollar denominated instruments according toapproved credit limits based upon credit ratings within the investment grade ratings band. Growth assets are invested across adiverse range of assets which include both domestic and international asset classes as well as both listed and unlisted investmentvehicles.
55
The University of SydneyNotes to the financial statements
for the year ended 31 December 2015
(continued)
42 Financial risk management (continued)
The Treasury Management Policy establishes the policy framework for the management of interest rate, liquidity and operationalfunding, foreign exchange, counterparty credit and operational risk.
Interest rate risk is managed by the Asset and Liability Committee (ALCO), an internal management committee reporting to FAC.ALCO is responsible for determining interest rate risk management strategies and their tactical implementation, and monitoring thereporting of positions taken.
In managing interest rate risk the University makes use of derivative financial instruments such as interest rate swaps to hedge cashflow risk exposures. Derivatives, in relation to the University's debt, are used for hedging purposes, not as trading or other speculativeinstruments. Overall, a proactive risk management approach is used with an emphasis on risk reduction.
In addition, the University maintains foreign currency balances as a natural hedge against foreign exchange risk or occasionallyenters into short dated forward contracts ahead of an underlying payment schedule.
(a) Market risk
(i) Foreign exchange risk
The University has exposure to foreign exchange risk. This arises from holding investments denominated in foreign currencies andbalances in bank accounts used to pay overseas suppliers.
If the Australian dollar had weakened/strengthened by 10% with all other variables held constant, the net result for the year wouldhave been $5,685k higher/$4,652k lower. In 2014, for a similar 10% weakening/strengthening, the profit or loss impact would havebeen $3,713k higher/$3,038k Iower.
(ii) Price risk
The University has exposure to equity security price risk. This arises from investments held by the University (primarily in the long-term and medium-term portfolios) and classified on the balance sheet at fair value through profit or loss. The impact of a change invalue of the securities would be reflected as either an increase or decrease in the fair value of the security through net result.
The University is not materially exposed to commodity price risk.
To manage its price risk from investments in equity securities, the University has contracted the management of the portfolio toexternal sector specialist managers. These managers are mandated to diversify the investments of the portfolio under theirmanagement. The University's equity investments include a diverse range of asset types including domestic and international classesas well as listed and unlisted investment vehicles. The quantum of funds under management per these managers and the investmentobjectives of each manager are established in accordance with limits and policies set by the ICC. The University also undertakesperiodic reviews of its strategic asset allocation to assess its risk return ratio.
The majority of the University's equity investments managed by managers are denominated in Australian dollars and are publiclytraded and included in the ASX 300 index.
As at 31 December 2015, the profit impact of a 10% increase/decrease in the ASX 300 Index with all other variables held constantwould be a $101,542k improvement/$101,541k reduction. In 2014, for a similar strengthening/weakening, profit or loss would havebeen an $89,694k improvement/$89,694k reduction.
(iii) Interest rate risk
The University's exposure to market interest rates relates primarily to the University's floating bank facility borrowings and investmentin debt securities (short term money market securities).
The University maintains floating to fixed interest rate profiles according to the Treasury Management Policy.
The University uses interest rate swaps to hedge the interest rate risk on a portion of its borrowings drawn on its floating rate bankdebt facility. These interest rate swaps are designated as cash flow hedge accounting relationships. As such, the impact of an interestrate change would be reflected as either an increase or decrease in the fair value of the derivatives through equity for the effectiveportion of the hedge. The gain or loss relating to the ineffective hedge portion (if any) is recognised immediately in profit or loss.
The University’ short-term cash and deposit portfolio consists of short-term deposits held with investment grade Australian bankstogether with cash held in an interest bearing bank account held with an investment grade Australian bank. The short-term cash anddeposit portfolio is fully invested in Australian dollars. This portfolio is classified at fair value through profit or loss and as such, theimpact of an interest rate change would be reflected as either an increase or decrease in profit or loss.
At 31 December 2015 if interest rates decreased/increased by 25 basis points with all other variables held constant, equity wouldhave been $468k lower/$466k higher as a result of a decrease/increase in the fair value of the interest rate swaps (2014: $919klower/$913k higher from debt securities). At 31 December 2015 if interest rates decreased/increased by 25 basis points with all othervariables held constant, profit or loss would have been $2,314k higher/$2,313k lower (2014: $1,714k higher/$1,713k lower) as a resultof an increase/decrease in the fair value of debt securities.
56 Page
117
Fina
ncia
l Re
port
s an
d St
atem
ents
201
5

The University of SydneyNotes to the financial statements
for the year ended 31 December 2015
(continued)
42 Financial risk management (continued)
(a) Market risk (continued)
(iv) Summarised sensitivity analysis
The following table summarises the sensitivity of the University's financial assets to interest rate risk, foreign exchange risk and otherprice risk. The disclosures are materially the same for both the parent and economic entity.
Economic entity (Consolidated) 31 December 2015 Interest rate risk Foreign exchange risk Other price risk
-.25% +.25% -10% +10% -10% +10%
2015
Carryingamount
$'000
Result
$'000
Equity
$'000
Result
$'000
Equity
$'000
Result
$'000
Equity
$'000
Result
$'000
Equity
$'000
Result
$'000
Equity
$'000
Result
$'000
Equity
$'000
Financial assetsCash and cash equivalents 354,672 0 0 0 0 1,176 0 (962) 0 0 0 0 0Financial assets at fair valuethrough profit or loss 1,169,720 2,314 0 (2,313) 0 4,509 0 (3,690) 0 (101,541) 0 101,542 0
Sub total 2,314 0 (2,313) 0 5,685 0 (4,652) 0 (101,541) 0 101,542 0
Financial liabilitiesBorrowings 510,000 0 0 0 0 0 0 0 0 0 0 0 0Derivative financial instruments 2,953 0 (468) 0 466 0 0 0 0 0 0 0 0
Total increase/(decrease) 2,314 (468) (2,313) 466 5,685 0 (4,652) 0 (101,541) 0 101,542 0
Economic entity (Consolidated) 31 December 2014 Interest rate risk Foreign exchange risk Other price risk
-.25% +.25% -10% +10% -10% +10%
2014
Carryingamount
$'000
Result
$'000
Equity
$'000
Result
$'000
Equity
$'000
Result
$'000
Equity
$'000
Result
$'000
Equity
$'000
Result
$'000
Equity
$'000
Result
$'000
Equity
$'000
Financial assetsCash and cash equivalents 383,722 0 0 0 0 956 0 (782) 0 0 0 0 0Financial assets at fair valuethrough profit or loss 1,032,825 1,632 0 (1,632) 0 2,757 0 (2,256) 0 (89,694) 0 89,694 0
Sub total 1,632 0 (1,632) 0 3,713 0 (3,038) 0 (89,694) 0 89,694 0
Financial liabilitiesBorrowings 440,000 82 0 (81) 0 0 0 0 0 0 0 0 0Derivative financial instruments 2,540 0 (919) 0 913 0 0 0 0 0 0 0 0
Total increase/(decrease) 1,714 (919) (1,713) 913 3,713 0 (3,038) 0 (89,694) 0 89,694 0
(b) Credit risk
Credit risk refers to the risk that a counterparty will default on its contractual obligations resulting in a financial loss to the University.The University has a policy of only dealing with counterparties with an investment grade long term credit rating as a means ofmitigating financial loss from defaults. The University's aggregate exposure to, and the credit ratings of, counterparties arecontinuously monitored.
Credit exposure of the debt portfolio is controlled by counterparty limits that are reviewed and approved by ICC. Credit risks in respectto the deferred government contribution for superannuation are discussed at Note 35. The University does not have any othersignificant credit risk exposure to any single counterparty or any group of counterparties having similar characteristics. The credit riskon liquid funds is limited because counterparties are banks with investment grade long term credit ratings assigned by internationalcredit rating agencies.
Impairment and provision against debtors has been duly considered in determining the carrying amounts of financial assets.Therefore the carrying amount of financial assets recorded in the statement of financial position represents the University's maximumexposure to credit risk.
57
The University of SydneyNotes to the financial statements
for the year ended 31 December 2015
(continued)
42 Financial risk management (continued)
(c) Liquidity risk
Liquidity risk is the risk that the University will not be able to meet its financial obligations as and when they fall due. The University'sapproach to managing liquidity is to ensure, as far as possible, that it will always have sufficient liquidity to meet its liabilities whendue, under normal and stressed conditions, without incurring unacceptable losses or risk damage to the University's reputation.
The University receives regular payments from the Commonwealth Government, which constitute a significant proportion of theUniversity's income, which are known as to the date and amount in advance of their receipt. Similarly the majority of expenses of theUniversity are known in quantum and date in advance of their due date for payment. The short-term cash and deposit portfolio is usedas a liquidity buffer for any timing mismatches of revenue inflows and expense outflows.
In addition, the University maintains lines of credit as disclosed in Note 46.
The University has in place daily cash flow forecasting and review procedures to manage its liquidity risk.
The following tables detail the economic entity's maturity profile as at 31 December 2015 and as at 31 December 2014:
Economic entity (Consolidated)
31 December 2015Averageinterest
rate%
Variableinterest
rate$'000
Less than 1year$'000
1 to 5years$'000
More than5 years$'000
Non interest$'000
Total$'000
Financial assetsCash 2.00 150,213 0 0 0 0 150,213Cash equivalents 2.80 0 204,459 0 0 0 204,459Receivables 0.00 0 61,936 0 0 0 61,936Discount securities 2.81 0 30,590 0 0 0 30,590Fixed interest bonds 2.61 0 5,194 76,260 72,006 0 153,460Floating rate notes 1.15 0 0 0 5,955 0 5,955Convertible notes 3.47 0 0 0 3,452 0 3,452Secured company loans atamortised cost
8.03 0 554 2,753 1,709 0 5,016
Listed securities 0.00 0 560 0 0 234,243 234,803Unlisted securities 0.00 0 0 0 0 11,158 11,158External fund managers 0.00 0 0 0 0 730,301 730,301
Total financial assets 150,213 303,293 79,013 83,122 975,702 1,591,343
Financial liabilitiesOther current liabilities 0.00 0 80,912 0 0 0 80,912Creditors 0.00 0 21,074 0 0 0 21,074Borrowings* 0.00 0 0 110,000 400,000 0 510,000Derivative financial instruments 3.70 0 1,186 1,767 0 0 2,953
Total financial liabilities 0 103,172 111,767 400,000 0 614,939
* Due to confidentiality restrictions, the University is unable to disclose the rate applicable to borrowings.
58Page
118
sydn
ey.e
du.a
uTh
e Un
iver
sity
of
Sydn
eyAn
nual
Rep
ort
2015

The University of SydneyNotes to the financial statements
for the year ended 31 December 2015
(continued)
42 Financial risk management (continued)
(a) Market risk (continued)
(iv) Summarised sensitivity analysis
The following table summarises the sensitivity of the University's financial assets to interest rate risk, foreign exchange risk and otherprice risk. The disclosures are materially the same for both the parent and economic entity.
Economic entity (Consolidated) 31 December 2015 Interest rate risk Foreign exchange risk Other price risk
-.25% +.25% -10% +10% -10% +10%
2015
Carryingamount
$'000
Result
$'000
Equity
$'000
Result
$'000
Equity
$'000
Result
$'000
Equity
$'000
Result
$'000
Equity
$'000
Result
$'000
Equity
$'000
Result
$'000
Equity
$'000
Financial assetsCash and cash equivalents 354,672 0 0 0 0 1,176 0 (962) 0 0 0 0 0Financial assets at fair valuethrough profit or loss 1,169,720 2,314 0 (2,313) 0 4,509 0 (3,690) 0 (101,541) 0 101,542 0
Sub total 2,314 0 (2,313) 0 5,685 0 (4,652) 0 (101,541) 0 101,542 0
Financial liabilitiesBorrowings 510,000 0 0 0 0 0 0 0 0 0 0 0 0Derivative financial instruments 2,953 0 (468) 0 466 0 0 0 0 0 0 0 0
Total increase/(decrease) 2,314 (468) (2,313) 466 5,685 0 (4,652) 0 (101,541) 0 101,542 0
Economic entity (Consolidated) 31 December 2014 Interest rate risk Foreign exchange risk Other price risk
-.25% +.25% -10% +10% -10% +10%
2014
Carryingamount
$'000
Result
$'000
Equity
$'000
Result
$'000
Equity
$'000
Result
$'000
Equity
$'000
Result
$'000
Equity
$'000
Result
$'000
Equity
$'000
Result
$'000
Equity
$'000
Financial assetsCash and cash equivalents 383,722 0 0 0 0 956 0 (782) 0 0 0 0 0Financial assets at fair valuethrough profit or loss 1,032,825 1,632 0 (1,632) 0 2,757 0 (2,256) 0 (89,694) 0 89,694 0
Sub total 1,632 0 (1,632) 0 3,713 0 (3,038) 0 (89,694) 0 89,694 0
Financial liabilitiesBorrowings 440,000 82 0 (81) 0 0 0 0 0 0 0 0 0Derivative financial instruments 2,540 0 (919) 0 913 0 0 0 0 0 0 0 0
Total increase/(decrease) 1,714 (919) (1,713) 913 3,713 0 (3,038) 0 (89,694) 0 89,694 0
(b) Credit risk
Credit risk refers to the risk that a counterparty will default on its contractual obligations resulting in a financial loss to the University.The University has a policy of only dealing with counterparties with an investment grade long term credit rating as a means ofmitigating financial loss from defaults. The University's aggregate exposure to, and the credit ratings of, counterparties arecontinuously monitored.
Credit exposure of the debt portfolio is controlled by counterparty limits that are reviewed and approved by ICC. Credit risks in respectto the deferred government contribution for superannuation are discussed at Note 35. The University does not have any othersignificant credit risk exposure to any single counterparty or any group of counterparties having similar characteristics. The credit riskon liquid funds is limited because counterparties are banks with investment grade long term credit ratings assigned by internationalcredit rating agencies.
Impairment and provision against debtors has been duly considered in determining the carrying amounts of financial assets.Therefore the carrying amount of financial assets recorded in the statement of financial position represents the University's maximumexposure to credit risk.
57
The University of SydneyNotes to the financial statements
for the year ended 31 December 2015
(continued)
42 Financial risk management (continued)
(c) Liquidity risk
Liquidity risk is the risk that the University will not be able to meet its financial obligations as and when they fall due. The University'sapproach to managing liquidity is to ensure, as far as possible, that it will always have sufficient liquidity to meet its liabilities whendue, under normal and stressed conditions, without incurring unacceptable losses or risk damage to the University's reputation.
The University receives regular payments from the Commonwealth Government, which constitute a significant proportion of theUniversity's income, which are known as to the date and amount in advance of their receipt. Similarly the majority of expenses of theUniversity are known in quantum and date in advance of their due date for payment. The short-term cash and deposit portfolio is usedas a liquidity buffer for any timing mismatches of revenue inflows and expense outflows.
In addition, the University maintains lines of credit as disclosed in Note 46.
The University has in place daily cash flow forecasting and review procedures to manage its liquidity risk.
The following tables detail the economic entity's maturity profile as at 31 December 2015 and as at 31 December 2014:
Economic entity (Consolidated)
31 December 2015Averageinterest
rate%
Variableinterest
rate$'000
Less than 1year$'000
1 to 5years$'000
More than5 years$'000
Non interest$'000
Total$'000
Financial assetsCash 2.00 150,213 0 0 0 0 150,213Cash equivalents 2.80 0 204,459 0 0 0 204,459Receivables 0.00 0 61,936 0 0 0 61,936Discount securities 2.81 0 30,590 0 0 0 30,590Fixed interest bonds 2.61 0 5,194 76,260 72,006 0 153,460Floating rate notes 1.15 0 0 0 5,955 0 5,955Convertible notes 3.47 0 0 0 3,452 0 3,452Secured company loans atamortised cost
8.03 0 554 2,753 1,709 0 5,016
Listed securities 0.00 0 560 0 0 234,243 234,803Unlisted securities 0.00 0 0 0 0 11,158 11,158External fund managers 0.00 0 0 0 0 730,301 730,301
Total financial assets 150,213 303,293 79,013 83,122 975,702 1,591,343
Financial liabilitiesOther current liabilities 0.00 0 80,912 0 0 0 80,912Creditors 0.00 0 21,074 0 0 0 21,074Borrowings* 0.00 0 0 110,000 400,000 0 510,000Derivative financial instruments 3.70 0 1,186 1,767 0 0 2,953
Total financial liabilities 0 103,172 111,767 400,000 0 614,939
* Due to confidentiality restrictions, the University is unable to disclose the rate applicable to borrowings.
58 Page
119
Fina
ncia
l Re
port
s an
d St
atem
ents
201
5
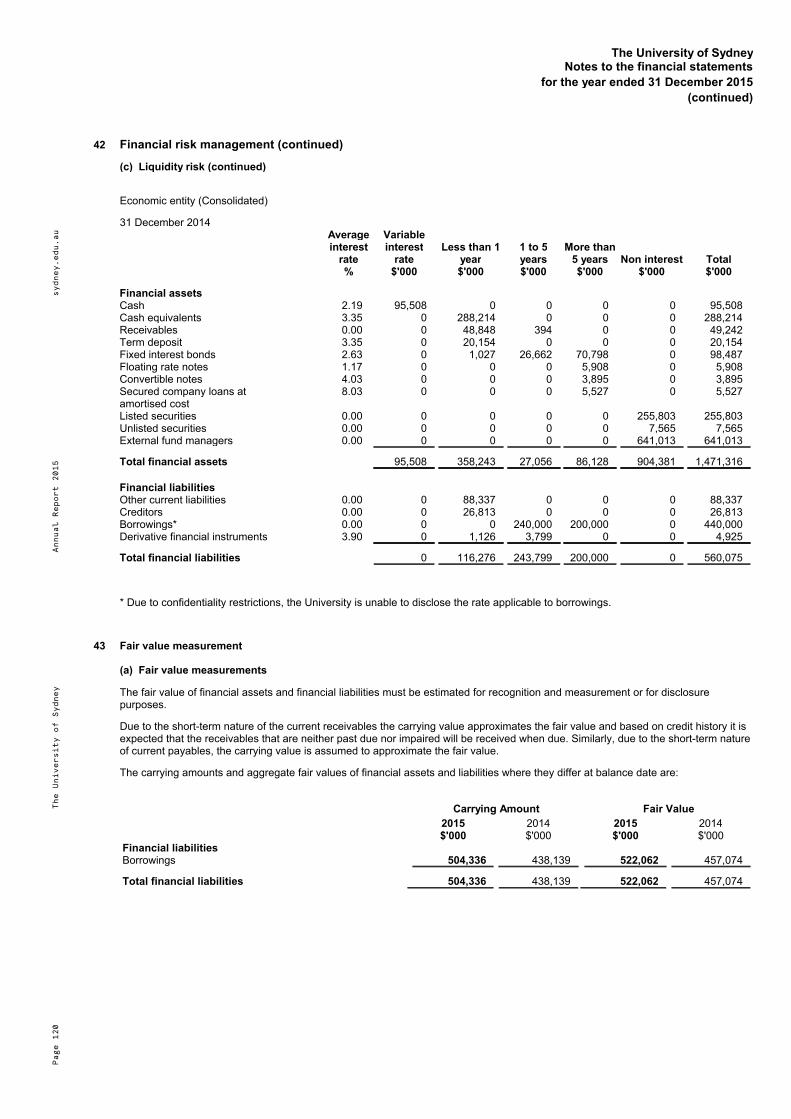
The University of SydneyNotes to the financial statements
for the year ended 31 December 2015
(continued)
42 Financial risk management (continued)
(c) Liquidity risk (continued)
Economic entity (Consolidated)
31 December 2014 Averageinterest
rate%
Variableinterest
rate$'000
Less than 1year$'000
1 to 5years$'000
More than5 years$'000
Non interest$'000
Total$'000
Financial assetsCash 2.19 95,508 0 0 0 0 95,508Cash equivalents 3.35 0 288,214 0 0 0 288,214Receivables 0.00 0 48,848 394 0 0 49,242Term deposit 3.35 0 20,154 0 0 0 20,154Fixed interest bonds 2.63 0 1,027 26,662 70,798 0 98,487Floating rate notes 1.17 0 0 0 5,908 0 5,908Convertible notes 4.03 0 0 0 3,895 0 3,895Secured company loans atamortised cost
8.03 0 0 0 5,527 0 5,527
Listed securities 0.00 0 0 0 0 255,803 255,803Unlisted securities 0.00 0 0 0 0 7,565 7,565External fund managers 0.00 0 0 0 0 641,013 641,013
Total financial assets 95,508 358,243 27,056 86,128 904,381 1,471,316
Financial liabilitiesOther current liabilities 0.00 0 88,337 0 0 0 88,337Creditors 0.00 0 26,813 0 0 0 26,813Borrowings* 0.00 0 0 240,000 200,000 0 440,000Derivative financial instruments 3.90 0 1,126 3,799 0 0 4,925
Total financial liabilities 0 116,276 243,799 200,000 0 560,075
* Due to confidentiality restrictions, the University is unable to disclose the rate applicable to borrowings.
43 Fair value measurement
(a) Fair value measurements
The fair value of financial assets and financial liabilities must be estimated for recognition and measurement or for disclosurepurposes.
Due to the short-term nature of the current receivables the carrying value approximates the fair value and based on credit history it isexpected that the receivables that are neither past due nor impaired will be received when due. Similarly, due to the short-term natureof current payables, the carrying value is assumed to approximate the fair value.
The carrying amounts and aggregate fair values of financial assets and liabilities where they differ at balance date are:
Carrying Amount Fair Value
2015$'000
2014$'000
2015$'000
2014$'000
Financial liabilitiesBorrowings 504,336 438,139 522,062 457,074
Total financial liabilities 504,336 438,139 522,062 457,074
59
The University of SydneyNotes to the financial statements
for the year ended 31 December 2015
(continued)
43 Fair value measurement (continued)
(a) Fair value measurements (continued)
The University measures and recognises the following assets and liabilities at fair value on a recurring basis:
Financial assets at fair value through profit or loss
Commercial properties and infrastructure
Heritage assets
Livestock
Borrowings
Derivative financial instruments
(b) Fair value hierarchy
The University categorises assets and liabilities measured at fair value into a hierarchy based on the level of inputs used inmeasurement.
Level 1 Quoted prices (unadjusted) in active markets for identical assets or liabilities.
Level 2 Inputs other than quoted prices included within Level 1 that are observable for the asset or liability,either directly or indirectly.
Level 3 Inputs for the asset or liability that are not based on observable market data (unobservable inputs)
(i) Recognised fair value measurements
Fair value measurements recognised in the balance sheet are categorised into the following levels at 31 December 2015.
Notes2015$'000
Level 1$'000
Level 2$'000
Level 3$'000
Recurring fair value measurements
Financial assets
Financial assets at fair value through profit orlossListed securities 20 234,803 234,803 0 0Fixed interest securities 153,461 0 153,461 0Convertible notes 20 3,452 3,452 0 0Floating rate notes 20 5,955 0 5,955 0Managed funds 20 730,301 0 730,301 0Unlisted securities 20 11,158 0 0 11,158Discount securities 20 30,590 0 30,590 0
Total financial assets at fair value throughprofit or loss 1,169,720 238,255 920,307 11,158
Non-financial assetsLand and buildings 21 470,478 0 316,744 153,734Heritage assets 21 292,403 0 292,403 0Livestock 24 4,571 0 4,571 0
Total non-financial assets 767,452 0 613,718 153,734
Financial liabilitiesBorrowings 26 522,062 412,062 110,000 0Derivatives financial instruments 27 2,953 0 2,953 0
Total liabilities 525,015 412,062 112,953 0
60Page
120
sydn
ey.e
du.a
uTh
e Un
iver
sity
of
Sydn
eyAn
nual
Rep
ort
2015

The University of SydneyNotes to the financial statements
for the year ended 31 December 2015
(continued)
42 Financial risk management (continued)
(c) Liquidity risk (continued)
Economic entity (Consolidated)
31 December 2014 Averageinterest
rate%
Variableinterest
rate$'000
Less than 1year$'000
1 to 5years$'000
More than5 years$'000
Non interest$'000
Total$'000
Financial assetsCash 2.19 95,508 0 0 0 0 95,508Cash equivalents 3.35 0 288,214 0 0 0 288,214Receivables 0.00 0 48,848 394 0 0 49,242Term deposit 3.35 0 20,154 0 0 0 20,154Fixed interest bonds 2.63 0 1,027 26,662 70,798 0 98,487Floating rate notes 1.17 0 0 0 5,908 0 5,908Convertible notes 4.03 0 0 0 3,895 0 3,895Secured company loans atamortised cost
8.03 0 0 0 5,527 0 5,527
Listed securities 0.00 0 0 0 0 255,803 255,803Unlisted securities 0.00 0 0 0 0 7,565 7,565External fund managers 0.00 0 0 0 0 641,013 641,013
Total financial assets 95,508 358,243 27,056 86,128 904,381 1,471,316
Financial liabilitiesOther current liabilities 0.00 0 88,337 0 0 0 88,337Creditors 0.00 0 26,813 0 0 0 26,813Borrowings* 0.00 0 0 240,000 200,000 0 440,000Derivative financial instruments 3.90 0 1,126 3,799 0 0 4,925
Total financial liabilities 0 116,276 243,799 200,000 0 560,075
* Due to confidentiality restrictions, the University is unable to disclose the rate applicable to borrowings.
43 Fair value measurement
(a) Fair value measurements
The fair value of financial assets and financial liabilities must be estimated for recognition and measurement or for disclosurepurposes.
Due to the short-term nature of the current receivables the carrying value approximates the fair value and based on credit history it isexpected that the receivables that are neither past due nor impaired will be received when due. Similarly, due to the short-term natureof current payables, the carrying value is assumed to approximate the fair value.
The carrying amounts and aggregate fair values of financial assets and liabilities where they differ at balance date are:
Carrying Amount Fair Value
2015$'000
2014$'000
2015$'000
2014$'000
Financial liabilitiesBorrowings 504,336 438,139 522,062 457,074
Total financial liabilities 504,336 438,139 522,062 457,074
59
The University of SydneyNotes to the financial statements
for the year ended 31 December 2015
(continued)
43 Fair value measurement (continued)
(a) Fair value measurements (continued)
The University measures and recognises the following assets and liabilities at fair value on a recurring basis:
Financial assets at fair value through profit or loss
Commercial properties and infrastructure
Heritage assets
Livestock
Borrowings
Derivative financial instruments
(b) Fair value hierarchy
The University categorises assets and liabilities measured at fair value into a hierarchy based on the level of inputs used inmeasurement.
Level 1 Quoted prices (unadjusted) in active markets for identical assets or liabilities.
Level 2 Inputs other than quoted prices included within Level 1 that are observable for the asset or liability,either directly or indirectly.
Level 3 Inputs for the asset or liability that are not based on observable market data (unobservable inputs)
(i) Recognised fair value measurements
Fair value measurements recognised in the balance sheet are categorised into the following levels at 31 December 2015.
Notes2015$'000
Level 1$'000
Level 2$'000
Level 3$'000
Recurring fair value measurements
Financial assets
Financial assets at fair value through profit orlossListed securities 20 234,803 234,803 0 0Fixed interest securities 153,461 0 153,461 0Convertible notes 20 3,452 3,452 0 0Floating rate notes 20 5,955 0 5,955 0Managed funds 20 730,301 0 730,301 0Unlisted securities 20 11,158 0 0 11,158Discount securities 20 30,590 0 30,590 0
Total financial assets at fair value throughprofit or loss 1,169,720 238,255 920,307 11,158
Non-financial assetsLand and buildings 21 470,478 0 316,744 153,734Heritage assets 21 292,403 0 292,403 0Livestock 24 4,571 0 4,571 0
Total non-financial assets 767,452 0 613,718 153,734
Financial liabilitiesBorrowings 26 522,062 412,062 110,000 0Derivatives financial instruments 27 2,953 0 2,953 0
Total liabilities 525,015 412,062 112,953 0
60 Page
121
Fina
ncia
l Re
port
s an
d St
atem
ents
201
5

The University of SydneyNotes to the financial statements
for the year ended 31 December 2015
(continued)
43 Fair value measurement (continued)
(b) Fair value hierarchy (continued)
Notes2014$'000
Level 1$'000
Level 2$'000
Level 3$'000
Recurring fair value measurements
Financial assets
Financial assets at fair value through profit orlossListed securities 20 255,803 255,803 0 0Fixed interest bonds 20 98,487 0 98,487 0Convertible notes 20 3,895 3,895 0 0Floating rate notes 20 5,908 0 5,908 0Managed funds 20 641,013 0 640,759 254Unlisted securities 20 7,565 0 0 7,565Term deposits 20 20,154 20,154 0 0
Total financial assets at fair value throughprofit or loss 1,032,825 279,852 745,154 7,819
Non-financial assetsCommercial properties and infrastructure 21 345,744 0 345,744 0Heritage assets 21 288,785 0 288,785 0Livestock 24 3,509 0 3,509 0
Total non-financial assets 638,038 0 638,038 0
Financial liabilitiesBorrowings 26 457,074 217,074 240,000 0Derivative financial instruments 27 4,925 0 4,925 0
Total liabilities 461,999 217,074 244,925 0
There were no transfers between levels 1 and 2 for recurring fair value measurements during the year. For transfers in and out oflevel 3 measurements, see below.
The University's policy is to recognise transfers into and transfers out of fair value hierarchy levels as at the end of the reportingperiod.
(ii) Disclosed fair values
The fair value of assets or liabilities traded in active markets (such as publicly traded derivatives and traded securities) is based onquoted market prices for identical assets or liabilities at the balance sheet date (Level 1). This is the most representative of fair valuein the circumstances.
The carrying value less impairment provision of trade receivables and payables is a reasonable approximation of their fair values dueto their short-term nature. The fair value of financial liabilities for disclosure purposes is estimated by discounting the futurecontractual cash flows at the current market interest rate that is available to the University for similar financial instruments.
Where applicable, the fair value of non-current borrowings disclosed in Note 26 is estimated by discounting the future contractualcash flows at the current market interest rates that are available to the group for similar financial instruments.
Derivative contracts classified as held for trading are adjusted to fair value by comparing the contracted rate to the current market ratefor a contract with the same remaining period to maturity.
(c) Valuation techniques used to derive level 2 and level 3 fair values
(i) Recurring fair value measurements
The fair value of financial instruments that are not traded in an active market (for example, over-the-counter derivatives) is determinedusing valuation techniques. These valuation techniques maximise the use of observable market data where it is available and rely aslittle as possible on entity specific estimates. If all significant inputs required to fair value an instrument are observable, the instrumentis included in Level 2.
If one or more of the significant inputs is not based on observable market data, the instrument is included in Level 3. This is the casefor unlisted equity securities.
61
The University of SydneyNotes to the financial statements
for the year ended 31 December 2015
(continued)
43 Fair value measurement (continued)
(c) Valuation techniques used to derive level 2 and level 3 fair values (continued)
The University uses a variety of methods and makes assumptions that are based on market conditions existing at each balance date.Specific valuation techniques used to value financial instruments include:
the use of quoted market prices or dealer quotes for similar instruments
the fair value of interest rate swaps is calculated as the present value of the estimated future cash flows based on observable
yield curves
the fair value of forward foreign exchange contracts is determined using forward exchange rates at the balance sheet date
other techniques, such as discounted cash flow analysis, are used to determine fair value for the remaining financial instruments
All of the resulting fair value estimates are included in Level 2, except for unlisted securities, commercial buildings and commercialinfrastructure which are explained in Note 43(d).
Heritage assets and commercial land and buildings (classified as property, plant and equipment) are valued independently at leastevery five years. At the end of each reporting period, the University updates its assessment of the fair value of each asset, taking intoaccount the most recent independent valuations. The University determines the asset’s value within a range of reasonable fair valueestimates. The fair value of commercial land, building and infrastructure for 2015 was performed by AssetVal Pty Ltd (AssetVal),having appropriately recognised qualifications and experience. Due to the change in valuer, the valuation technique changed as AssetVal used depreciated replacement cost (DRC) methodology for buildings with limited comparable sales. This resulted in somecommercial buildings and commercial infrastructure being reclassified from Level 2 to Level 3.
The best evidence of fair value is current prices in an active market for similar assets. Where such information is not available theUniversity considers information from a variety of sources, including:
current prices in an active market for assets of different nature or recent prices of similar assets in less active markets, adjusted
to reflect those differences
discounted cash flow projections based on reliable estimates of future cash flows
capitalised income projections based on a property’s estimated net market income and a capitalisation rate derived from an
analysis of market evidence
All resulting fair value estimates for heritage assets and commercial land are included in Level 2, while commercial buildings andinfrastructure are split between both Level 2 and Level 3.
(d) Fair value measurements using significant unobservable inputs (level 3)
The following table is a reconciliation of level 3 items for the periods ended 31 December 2015 and 2014.
Level 3 Fair Value Measurement2015
Commercialproperties
$'000
Listedsecurities
$'000
Unlistedsecurities
$'000
Managedfunds
$'000
Total
$'000
Balance at 1 January 0 0 7,565 254 7,819
Transfers from level 2** 124,891 0 0 0 124,891
Transfers out of level 3 0 0 0 (254) (254)Recognised in profit or loss* 0 0 3,593 0 3,593Recognised in othercomprehensive income
28,843 0 0 0 28,843
Balance at 31 December 153,734 0 11,158 0 164,892
Level 3 Fair Value Measurement2014
Commercialproperties
$'000
Listedsecurities
$'000
Unlistedsecurities
$'000
Managedfunds
$'000
Total
$'000
Balance at 1 January 0 84 6,051 0 6,135Transfers from level 2** 0 0 0 254 254Recognised in profit or loss* 0 (84) 1,514 0 1,430
Balance at 31 December 0 0 7,565 254 7,819
62Page
122
sydn
ey.e
du.a
uTh
e Un
iver
sity
of
Sydn
eyAn
nual
Rep
ort
2015
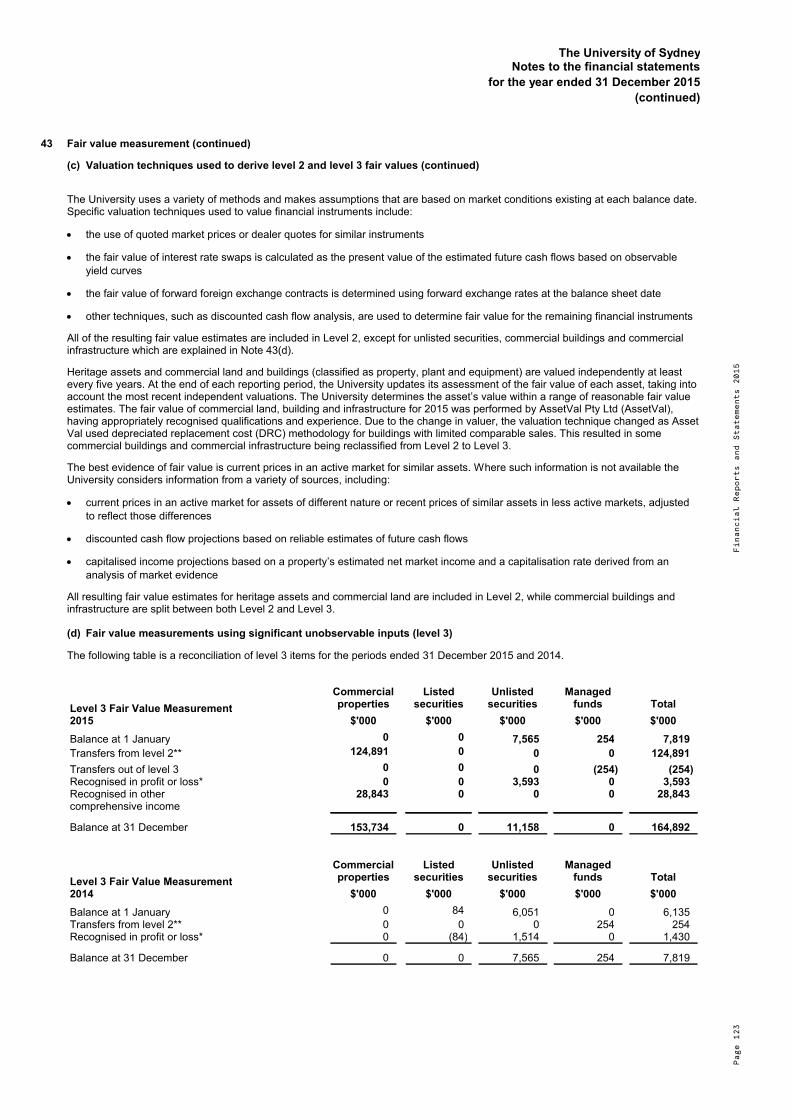
The University of SydneyNotes to the financial statements
for the year ended 31 December 2015
(continued)
43 Fair value measurement (continued)
(b) Fair value hierarchy (continued)
Notes2014$'000
Level 1$'000
Level 2$'000
Level 3$'000
Recurring fair value measurements
Financial assets
Financial assets at fair value through profit orlossListed securities 20 255,803 255,803 0 0Fixed interest bonds 20 98,487 0 98,487 0Convertible notes 20 3,895 3,895 0 0Floating rate notes 20 5,908 0 5,908 0Managed funds 20 641,013 0 640,759 254Unlisted securities 20 7,565 0 0 7,565Term deposits 20 20,154 20,154 0 0
Total financial assets at fair value throughprofit or loss 1,032,825 279,852 745,154 7,819
Non-financial assetsCommercial properties and infrastructure 21 345,744 0 345,744 0Heritage assets 21 288,785 0 288,785 0Livestock 24 3,509 0 3,509 0
Total non-financial assets 638,038 0 638,038 0
Financial liabilitiesBorrowings 26 457,074 217,074 240,000 0Derivative financial instruments 27 4,925 0 4,925 0
Total liabilities 461,999 217,074 244,925 0
There were no transfers between levels 1 and 2 for recurring fair value measurements during the year. For transfers in and out oflevel 3 measurements, see below.
The University's policy is to recognise transfers into and transfers out of fair value hierarchy levels as at the end of the reportingperiod.
(ii) Disclosed fair values
The fair value of assets or liabilities traded in active markets (such as publicly traded derivatives and traded securities) is based onquoted market prices for identical assets or liabilities at the balance sheet date (Level 1). This is the most representative of fair valuein the circumstances.
The carrying value less impairment provision of trade receivables and payables is a reasonable approximation of their fair values dueto their short-term nature. The fair value of financial liabilities for disclosure purposes is estimated by discounting the futurecontractual cash flows at the current market interest rate that is available to the University for similar financial instruments.
Where applicable, the fair value of non-current borrowings disclosed in Note 26 is estimated by discounting the future contractualcash flows at the current market interest rates that are available to the group for similar financial instruments.
Derivative contracts classified as held for trading are adjusted to fair value by comparing the contracted rate to the current market ratefor a contract with the same remaining period to maturity.
(c) Valuation techniques used to derive level 2 and level 3 fair values
(i) Recurring fair value measurements
The fair value of financial instruments that are not traded in an active market (for example, over-the-counter derivatives) is determinedusing valuation techniques. These valuation techniques maximise the use of observable market data where it is available and rely aslittle as possible on entity specific estimates. If all significant inputs required to fair value an instrument are observable, the instrumentis included in Level 2.
If one or more of the significant inputs is not based on observable market data, the instrument is included in Level 3. This is the casefor unlisted equity securities.
61
The University of SydneyNotes to the financial statements
for the year ended 31 December 2015
(continued)
43 Fair value measurement (continued)
(c) Valuation techniques used to derive level 2 and level 3 fair values (continued)
The University uses a variety of methods and makes assumptions that are based on market conditions existing at each balance date.Specific valuation techniques used to value financial instruments include:
the use of quoted market prices or dealer quotes for similar instruments
the fair value of interest rate swaps is calculated as the present value of the estimated future cash flows based on observable
yield curves
the fair value of forward foreign exchange contracts is determined using forward exchange rates at the balance sheet date
other techniques, such as discounted cash flow analysis, are used to determine fair value for the remaining financial instruments
All of the resulting fair value estimates are included in Level 2, except for unlisted securities, commercial buildings and commercialinfrastructure which are explained in Note 43(d).
Heritage assets and commercial land and buildings (classified as property, plant and equipment) are valued independently at leastevery five years. At the end of each reporting period, the University updates its assessment of the fair value of each asset, taking intoaccount the most recent independent valuations. The University determines the asset’s value within a range of reasonable fair valueestimates. The fair value of commercial land, building and infrastructure for 2015 was performed by AssetVal Pty Ltd (AssetVal),having appropriately recognised qualifications and experience. Due to the change in valuer, the valuation technique changed as AssetVal used depreciated replacement cost (DRC) methodology for buildings with limited comparable sales. This resulted in somecommercial buildings and commercial infrastructure being reclassified from Level 2 to Level 3.
The best evidence of fair value is current prices in an active market for similar assets. Where such information is not available theUniversity considers information from a variety of sources, including:
current prices in an active market for assets of different nature or recent prices of similar assets in less active markets, adjusted
to reflect those differences
discounted cash flow projections based on reliable estimates of future cash flows
capitalised income projections based on a property’s estimated net market income and a capitalisation rate derived from an
analysis of market evidence
All resulting fair value estimates for heritage assets and commercial land are included in Level 2, while commercial buildings andinfrastructure are split between both Level 2 and Level 3.
(d) Fair value measurements using significant unobservable inputs (level 3)
The following table is a reconciliation of level 3 items for the periods ended 31 December 2015 and 2014.
Level 3 Fair Value Measurement2015
Commercialproperties
$'000
Listedsecurities
$'000
Unlistedsecurities
$'000
Managedfunds
$'000
Total
$'000
Balance at 1 January 0 0 7,565 254 7,819
Transfers from level 2** 124,891 0 0 0 124,891
Transfers out of level 3 0 0 0 (254) (254)Recognised in profit or loss* 0 0 3,593 0 3,593Recognised in othercomprehensive income
28,843 0 0 0 28,843
Balance at 31 December 153,734 0 11,158 0 164,892
Level 3 Fair Value Measurement2014
Commercialproperties
$'000
Listedsecurities
$'000
Unlistedsecurities
$'000
Managedfunds
$'000
Total
$'000
Balance at 1 January 0 84 6,051 0 6,135Transfers from level 2** 0 0 0 254 254Recognised in profit or loss* 0 (84) 1,514 0 1,430
Balance at 31 December 0 0 7,565 254 7,819
62 Page
123
Fina
ncia
l Re
port
s an
d St
atem
ents
201
5

The University of SydneyNotes to the financial statements
for the year ended 31 December 2015
(continued)
43 Fair value measurement (continued)
(d) Fair value measurements using significant unobservable inputs (level 3) (continued)
*This includes gains/(losses) of $3,339k (2014: $1,430k) attributable to the change in the valuation of the underlying assets.
** The operating activities of the company changed during 2015 to require fair value valuation based on unobservable inputs.
The following table summarises the quantitative information about the significant unobservable inputs used in level 3 fair valuemeasurements. See above for the valuation techniques adopted.
Description Fair value at31 December
2015
$'000
Unobservableinputs*
Range of inputs(probabilityweightedaverage)
Relationship ofunobservable inputs
to fair value
Shares - unquoted 11,158 Discount rate 30% The higher thediscount rate, thelower the fair value
Commercial buildings andinfrastructure
153,734 Remaining usefullife
1-100 years A one yearincrease/(decrease) inthe remaining life ofeach asset wouldcause a 3%increase/(decrease)the total fair value
Total 164,892
*There were no significant inter-relationships between unobservable inputs that materially affect fair value.
44 Non-cash investing and financing activities Economic entity
(Consolidated) Parent entity
(University)
2015
$'000
2014
$'000
2015
$'000
2014
$'000
Non-cash investing and financing activities 259 2,114 259 9,614
The University had no non-cash financing or investing activities, with the exception of the following non-cash items received in 2015:Library collections $208k (2014: $273k), works of art gifted to the University Nil (2014: $1,767k), museum collectibles Nil (2014:$74k), plant and equipment $51k (2014: Nil), rare books Nil (2014: Nil) and building and embedded furniture Nil (2014: Nil). TheUniversity was gifted Westmead IVF in 2014 valued at $7,500k as disclosed in Note 37(a).
45 Events occurring after the balance sheet date
Unless otherwise disclosed, there are no other matters or circumstances that have arisen since the end of the financial year that haveaffected or may subsequently affect the financial position of the University or its subsidiaries.
63
The University of SydneyNotes to the financial statements
for the year ended 31 December 2015
(continued)
46 Financing facilities and balances
The University has access to an unsecured overdraft facility of $25,000k which is unutilised as at 31 December 2015. Interest wouldbe payable at the National Australia Bank's Base Lending Indicator Rate.
There is also a $12,500k credit card facility of which $5,522k has been used as at 31 December 2015, a letter of credit facility of up to$400k which was unutilised during 2015 and an additional letter of credit facility of up to $3,850k of which $1,325k is unutilised as at31 December 2015. The University also has access to a $32,000k bank guarantee facility of which $16,718k has been utilised at 31December 2015.
On 28 August 2015 the University reduced the amount available on the revolving credit facility provided by National Australia Bankfrom $400m to $200m. This coincided with the University issuing a $200m parcel of 10 year medium term notes on 28 August 2015.Subsequently on 20 October 2015 the $200m revolving credit facility provided by National Australia Bank was refinanced into two new5 year revolving credit facilities, one each with National Australia Bank and Westpac Banking Corporation. The unutilised balance onthe National Australia Bank revolving debt facility at 31 December 2015 was nil (2014: $160m). The unutilised balance on theWestpac Banking Corporation revolving debt facility at 31 December 2015 was $90m.
64Page
124
sydn
ey.e
du.a
uTh
e Un
iver
sity
of
Sydn
eyAn
nual
Rep
ort
2015

The University of SydneyNotes to the financial statements
for the year ended 31 December 2015
(continued)
43 Fair value measurement (continued)
(d) Fair value measurements using significant unobservable inputs (level 3) (continued)
*This includes gains/(losses) of $3,339k (2014: $1,430k) attributable to the change in the valuation of the underlying assets.
** The operating activities of the company changed during 2015 to require fair value valuation based on unobservable inputs.
The following table summarises the quantitative information about the significant unobservable inputs used in level 3 fair valuemeasurements. See above for the valuation techniques adopted.
Description Fair value at31 December
2015
$'000
Unobservableinputs*
Range of inputs(probabilityweightedaverage)
Relationship ofunobservable inputs
to fair value
Shares - unquoted 11,158 Discount rate 30% The higher thediscount rate, thelower the fair value
Commercial buildings andinfrastructure
153,734 Remaining usefullife
1-100 years A one yearincrease/(decrease) inthe remaining life ofeach asset wouldcause a 3%increase/(decrease)the total fair value
Total 164,892
*There were no significant inter-relationships between unobservable inputs that materially affect fair value.
44 Non-cash investing and financing activities Economic entity
(Consolidated) Parent entity
(University)
2015
$'000
2014
$'000
2015
$'000
2014
$'000
Non-cash investing and financing activities 259 2,114 259 9,614
The University had no non-cash financing or investing activities, with the exception of the following non-cash items received in 2015:Library collections $208k (2014: $273k), works of art gifted to the University Nil (2014: $1,767k), museum collectibles Nil (2014:$74k), plant and equipment $51k (2014: Nil), rare books Nil (2014: Nil) and building and embedded furniture Nil (2014: Nil). TheUniversity was gifted Westmead IVF in 2014 valued at $7,500k as disclosed in Note 37(a).
45 Events occurring after the balance sheet date
Unless otherwise disclosed, there are no other matters or circumstances that have arisen since the end of the financial year that haveaffected or may subsequently affect the financial position of the University or its subsidiaries.
63
The University of SydneyNotes to the financial statements
for the year ended 31 December 2015
(continued)
46 Financing facilities and balances
The University has access to an unsecured overdraft facility of $25,000k which is unutilised as at 31 December 2015. Interest wouldbe payable at the National Australia Bank's Base Lending Indicator Rate.
There is also a $12,500k credit card facility of which $5,522k has been used as at 31 December 2015, a letter of credit facility of up to$400k which was unutilised during 2015 and an additional letter of credit facility of up to $3,850k of which $1,325k is unutilised as at31 December 2015. The University also has access to a $32,000k bank guarantee facility of which $16,718k has been utilised at 31December 2015.
On 28 August 2015 the University reduced the amount available on the revolving credit facility provided by National Australia Bankfrom $400m to $200m. This coincided with the University issuing a $200m parcel of 10 year medium term notes on 28 August 2015.Subsequently on 20 October 2015 the $200m revolving credit facility provided by National Australia Bank was refinanced into two new5 year revolving credit facilities, one each with National Australia Bank and Westpac Banking Corporation. The unutilised balance onthe National Australia Bank revolving debt facility at 31 December 2015 was nil (2014: $160m). The unutilised balance on theWestpac Banking Corporation revolving debt facility at 31 December 2015 was $90m.
64 Page
125
Fina
ncia
l Re
port
s an
d St
atem
ents
201
5

Th
e U
niv
ers
ity o
f S
yd
ne
yN
ote
s t
o t
he
fin
an
cia
l s
tate
me
nts
for
the
ye
ar
en
de
d 3
1 D
ec
em
be
r 2
01
5
(co
nti
nu
ed
)
47
Ac
qu
itta
l o
f A
us
tra
lia
n G
ov
ern
me
nt
fin
an
cia
l a
ss
ista
nc
e
(a)
Ed
uc
ati
on
- C
GS
an
d o
the
r g
ran
ts
Co
mm
on
we
alt
h G
ran
tS
ch
em
e1
Ind
ige
no
us
Su
pp
ort
Pro
gra
mP
art
ne
rsh
ip a
nd
Pa
rtic
ipa
tio
n P
rog
ram
Dis
ab
ilit
y S
up
po
rtP
rog
ram
Pro
mo
tio
n o
f E
xc
ell
en
ce
in l
ea
rnin
g a
nd
te
ac
hin
ga
wa
rds
Pare
nt
en
tity
(U
niv
ers
ity)
on
ly
2015
$'0
00
2014
$'0
00
2015
$'0
00
2014
$'0
00
2015
$'0
00
2014
$'0
00
2015
$'0
00
2014
$'0
00
2015
$'0
00
2014
$'0
00
Fin
an
cia
l a
ssis
tan
ce r
ece
ive
d in
ca
sh d
urin
g t
he
report
ing p
eriod
301,4
95
294,9
20
1,1
69
1,2
57
3,2
83
4,2
08
71
83
70
0N
et
accru
al a
dju
stm
en
ts(3
,504)
(2,1
20)
00
00
00
00
Reven
ue f
or
the p
eri
od
2(a
)297,9
91
292,8
00
1,1
69
1,2
57
3,2
83
4,2
08
71
83
70
0
Su
rplu
s/(
de
fici
t) f
rom
th
e p
revi
ou
s ye
ar
00
00
12,6
94
11,7
33
00
0(1
0)
To
tal
rev
en
ue
in
clu
din
g a
cc
rue
d r
ev
en
ue
297,9
91
292,8
00
1,1
69
1,2
57
15,9
77
15,9
41
71
83
70
(10)
Less
exp
ense
s in
cludin
g a
ccru
ed e
xpense
s(2
97,9
91)
(292,8
00)
(1,1
69)
(1,2
57)
(5,8
10)
(3,2
47)
(160)
(83)
010
Su
rplu
s/(
de
fic
it)
for
the
re
po
rtin
g p
eri
od
00
00
10,1
67
12,6
94
(89)
070
0
Pro
mo
tio
n o
f E
xc
ell
en
ce
in L
ea
rnin
g a
nd
Te
ac
hin
gg
ran
t
Au
str
ali
an
Ma
the
ma
tic
sa
nd
Sc
ien
ce
Pa
rtn
ers
hip
Pro
gra
mT
ota
l
Pare
nt
en
tity
(U
niv
ers
ity)
on
ly
2015
$'0
00
2014
$'0
00
2015
$'0
00
2014
$'0
00
2015
$'0
00
2014
$'0
00
Fin
an
cia
l a
ssis
tan
ce r
ece
ive
d in
ca
sh d
urin
g t
he
report
ing p
eriod
978
282
839
877
307,9
05
301,6
27
Ne
t a
ccru
al a
dju
stm
en
ts0
00
0(3
,504)
(2,1
20)
Reven
ue f
or
the p
eri
od
2(a
)978
282
839
877
304,4
01
299,5
07
Su
rplu
s/(
de
fici
t) f
rom
th
e p
revi
ou
s ye
ar
632
693
877
014,2
03
12,4
16
To
tal
rev
en
ue
in
clu
din
g a
cc
rue
d r
ev
en
ue
1,6
10
975
1,7
16
877
318,6
04
311,9
23
Less
exp
ense
s in
cludin
g a
ccru
ed e
xpense
s(5
31)
(343)
(309)
0(3
05,9
70)
(297,7
20)
Su
rplu
s/(
de
fic
it)
for
the
re
po
rtin
g p
eri
od
1,0
79
632
1,4
07
877
12,6
34
14,2
03
1 I
ncl
ud
es t
he
ba
sic
CG
S g
ran
t a
mo
un
t, C
GS
-Re
gio
na
l Lo
ad
ing
, C
GS
-En
ab
ling
Lo
ad
ing
, M
ath
s a
nd
Sci
en
ce T
ran
sitio
n L
oa
din
g a
nd
Fu
ll F
ee
Pla
ces
Tra
nsi
tio
n L
oa
din
g.
65
Page
126
sydn
ey.e
du.a
uTh
e Un
iver
sity
of
Sydn
eyAn
nual
Rep
ort
2015

Th
e U
niv
ers
ity o
f S
yd
ne
yN
ote
s t
o t
he
fin
an
cia
l s
tate
me
nts
for
the
ye
ar
en
de
d 3
1 D
ec
em
be
r 2
01
5
(co
nti
nu
ed
)
47
Ac
qu
itta
l o
f A
us
tra
lia
n G
ov
ern
me
nt
fin
an
cia
l a
ss
ista
nc
e (
co
nti
nu
ed
)
(b)
Hig
he
r e
du
ca
tio
n l
oa
n p
rog
ram
s (
ex
cl
OS
-HE
LP
)H
EC
S-H
EL
P (
Au
str
alian
Go
vern
men
t p
aym
en
ts)
FE
E-H
EL
PS
A-H
EL
PT
ota
l
Pare
nt
en
tity
(U
niv
ers
ity)
on
ly
2015
$'0
00
2014
$'0
00
2015
$'0
00
2014
$'0
00
2015
$'0
00
2014
$'0
00
2015
$'0
00
2014
$'0
00
Cash
paya
ble
/(re
ceiv
able
) at begin
nin
g o
f ye
ar
3,6
95
3,0
73
1,1
54
658
123
80
4,9
72
3,8
11
Fin
an
cia
l ass
ista
nce
re
ceiv
ed
in c
ash
du
rin
g t
he
re
po
rtin
gperiod
173,1
45
166,5
06
82,8
61
75,9
54
4,1
51
4,2
87
260,1
57
246,7
47
Ca
sh
av
ail
ab
le f
or
the
pe
rio
d176,8
40
169,5
79
84,0
15
76,6
12
4,2
74
4,3
67
265,1
29
250,5
58
Reve
nue e
arn
ed
2(b
)(1
72,9
47)
(165,8
84)
(82,7
55)
(75,4
58)
(4,2
49)
(4,2
44)
(259,9
51)
(245,5
86)
Cash
paya
ble
/(re
ce
iva
ble
) a
t th
e e
nd
of
the
year
3,8
93
3,6
95
1,2
60
1,1
54
25
123
5,1
78
4,9
72
(c)
Sc
ho
lars
hip
s
Au
str
alian
Po
stg
rad
uate
Aw
ard
s
Inte
rnati
on
al
Po
stg
rad
uate
Researc
hS
ch
ola
rsh
ips
Co
mm
on
we
alt
hE
du
ca
tio
n C
os
tS
ch
ola
rsh
ips
5
Co
mm
on
we
alt
hA
cc
om
mo
da
tio
nS
ch
ola
rsh
ips
5
Ind
ige
no
us
Access
Sc
ho
lars
hip
To
tal
Pare
nt
en
tity
(U
niv
ers
ity)
on
ly
2015
$'0
00
2014
$'0
00
2015
$'0
00
2014
$'0
00
2015
$'0
00
2014
$'0
00
2015
$'0
00
2014
$'0
00
2015
$'0
00
2014
$'0
00
2015
$'0
00
2014
$'0
00
Fin
an
cia
l a
ssis
tan
ce
re
ce
ive
d in
ca
sh
du
rin
gth
e r
eport
ing p
eriod
27,4
16
26,8
85
2,1
93
2,1
98
610
(12)
20
744
57
30,2
83
29,1
35
Reven
ue f
or
the p
eri
od
2(c
)27,4
16
26,8
85
2,1
93
2,1
98
610
(12)
20
744
57
30,2
83
29,1
35
Su
rplu
s/(
de
fici
t) f
rom
th
e p
revi
ou
s ye
ar
5,9
31
7,2
04
0(3
3)
(15)
0(1
)0
(7)
05,9
08
7,1
71
To
tal
rev
en
ue
in
clu
din
g a
cc
rue
d r
ev
en
ue
33,3
47
34,0
89
2,1
93
2,1
65
595
(12)
19
737
57
36,1
91
36,3
06
Less
exp
ense
s in
cludin
g a
ccru
ed e
xpense
s(2
7,7
66)
(28,1
58)
(2,1
93)
(2,1
65)
(285)
(3)
(12)
(8)
(39)
(64)
(30,2
95)
(30,3
98)
Su
rplu
s/(
de
fic
it)
for
the
re
po
rtin
g p
eri
od
5,5
81
5,9
31
00
310
(15)
7(1
)(2
)(7
)5,8
96
5,9
08 6
6Pa
ge 1
27Fi
nanc
ial
Repo
rts
and
Stat
emen
ts 2
015

Th
e U
niv
ers
ity o
f S
yd
ne
yN
ote
s t
o t
he
fin
an
cia
l s
tate
me
nts
for
the
ye
ar
en
de
d 3
1 D
ec
em
be
r 2
01
5
(co
nti
nu
ed
)
47
Ac
qu
itta
l o
f A
us
tra
lia
n G
ov
ern
me
nt
fin
an
cia
l a
ss
ista
nc
e (
co
nti
nu
ed
)
(d)
Ed
ucati
on
Researc
h
Jo
int
Researc
hE
ng
ag
em
en
tR
esearc
h T
rain
ing
Sc
he
me
Researc
h In
frastr
uctu
reB
lock G
ran
ts
Su
sta
inab
le R
esearc
hE
xcellen
ce in
Un
ivers
itie
sJ
RE
En
gin
ee
rC
ad
ets
hip
sT
ota
l
Pare
nt
en
tity
(U
niv
ers
ity)
on
ly
2015
$'0
00
2014
$'0
00
2015
$'0
00
2014
$'0
00
2015
$'0
00
2014
$'0
00
2015
$'0
00
2014
$'0
00
2015
$'0
00
2014
$'0
00
2015
$'0
00
2014
$'0
00
Fin
anci
al a
ssis
tance
rece
ived in
cash d
uring
the r
eport
ing p
eriod
32,0
51
31,9
79
67,9
01
68,1
34
27,7
60
28,3
86
22,6
84
21,5
40
510
377
150,9
06
150,4
16
Ne
t a
ccru
al a
dju
stm
en
ts0
00
00
00
00
00
0
Reven
ue f
or
the p
eri
od
2(d
)32,0
51
31,9
79
67,9
01
68,1
34
27,7
60
28,3
86
22,6
84
21,5
40
510
377
150,9
06
150,4
16
Surp
lus/
(defic
it) fro
m the p
revi
ous
year
00
00
(314)
2,1
86
00
677
327
363
2,5
13
To
tal re
ven
ue in
clu
din
g a
ccru
ed
reven
ue
32,0
51
31,9
79
67,9
01
68,1
34
27,4
46
30,5
72
22,6
84
21,5
40
1,1
87
704
151,2
69
152,9
29
Less
exp
ense
s in
cludin
g a
ccru
ed e
xpense
s(3
2,0
51)
(31,9
79)
(67,9
01)
(68,1
34)
(27,5
87)
(30,8
86)
(22,6
84)
(21,5
40)
0(2
7)
(150,2
23)
(152,5
66)
Su
rplu
s/(
defi
cit
) fo
r th
e r
ep
ort
ing
peri
od
00
00
(141)
(314)
00
1,1
87
677
1,0
46
363
(e)
Oth
er
Cap
ital F
un
din
g
Ed
ucati
on
In
vestm
en
tF
un
dT
ota
l
2015
$'0
00
2014
$'0
00
2015
$'0
00
2014
$'0
00
Pare
nt
en
tity
(U
niv
ers
ity)
on
ly
Fin
anci
al a
ssis
tance
rece
ived in
cash
during the r
eport
ing
period
06,8
00
06,8
00
Ne
t a
ccru
al a
dju
stm
en
ts0
00
0
Reven
ue f
or
the p
eri
od
2(e
)0
6,8
00
06,8
00
Surp
lus/
(defic
it) fro
m the p
revi
ous
year
00
00
To
tal re
ven
ue in
clu
din
g a
ccru
ed
reven
ue
06,8
00
06,8
00
Less
exp
ense
s in
cludin
g a
ccru
ed e
xpense
s0
(6,8
00)
0(6
,800)
Su
rplu
s/(
defi
cit
) fo
r th
e r
ep
ort
ing
peri
od
00
00 6
7
Page
128
sydn
ey.e
du.a
uTh
e Un
iver
sity
of
Sydn
eyAn
nual
Rep
ort
2015

Th
e U
niv
ers
ity o
f S
yd
ne
yN
ote
s t
o t
he
fin
an
cia
l s
tate
me
nts
for
the
ye
ar
en
de
d 3
1 D
ec
em
be
r 2
01
5
(co
nti
nu
ed
)
47
Ac
qu
itta
l o
f A
us
tra
lia
n G
ov
ern
me
nt
fin
an
cia
l a
ss
ista
nc
e (
co
nti
nu
ed
)
(f)
Au
str
alian
Researc
h C
ou
ncil g
ran
ts
Pro
jects
Fe
llo
ws
hip
sD
EC
RA
Ind
ige
no
us
re
se
arc
he
rsd
ev
elo
pm
en
tT
ota
l
(i)
Dis
co
very
Pa
ren
t E
nti
ty (
Un
ivers
ity)
On
ly
2015
$'0
00
2014
$'0
00
2015
$'0
00
2014
$'0
00
2015
$'0
00
2014
$'0
00
2015
$'0
00
2014
$'0
00
2015
$'0
00
2014
$'0
00
Fin
an
cia
l ass
ista
nce
re
ce
ive
d in
ca
sh d
urin
g t
he
report
ing p
eriod
26,5
23
29,3
99
10,2
89
12,5
88
4,2
11
7,5
04
493
555
41,5
16
50,0
46
Ne
t a
ccru
al a
dju
stm
en
ts0
00
00
00
00
0
Reven
ue f
or
the p
eri
od
2(f
)(i)
26,5
23
29,3
99
10,2
89
12,5
88
4,2
11
7,5
04
493
555
41,5
16
50,0
46
Su
rplu
s/(
de
ficit)
fro
m t
he
pre
vio
us y
ea
r176
3,0
88
3,0
08
2,7
10
1,8
07
1,6
59
414
(18)
5,4
05
7,4
39
To
tal
rev
en
ue
in
clu
din
g a
cc
rue
d r
ev
en
ue
26,6
99
32,4
87
13,2
97
15,2
98
6,0
18
9,1
63
907
537
46,9
21
57,4
85
Less
exp
ense
s in
cludin
g a
ccru
ed e
xpense
s(2
9,5
54)
(32,3
11)
(16,0
26)
(12,2
90)
(6,6
98)
(7,3
56)
(383)
(123)
(52,6
61)
(52,0
80)
Su
rplu
s/(
de
fic
it)
for
the
re
po
rtin
g p
eri
od
(2,8
55)
176
(2,7
29)
3,0
08
(680)
1,8
07
524
414
(5,7
40)
5,4
05
Lin
kag
e In
frastr
uctu
re
Ind
us
tria
lT
ran
sfo
rmati
on
Researc
hL
au
rea
te f
ell
ow
sh
ips
Pro
jects
To
tal
(ii)
Lin
ka
ge
s
Pa
ren
t E
nti
ty (
Un
ivers
ity)
On
ly
2015
$'0
00
2014
$'0
00
2015
$'0
00
2014
$'0
00
2015
$'0
00
2014
$'0
00
2015
$'0
00
2014
$'0
00
2015
$'0
00
2014
$'0
00
Fin
an
cia
l ass
ista
nce
re
ceiv
ed
in c
ash
du
rin
g t
he
report
ing p
eriod
1,2
80
1,3
70
2,8
32
1,8
70
5,1
18
6,2
86
5,8
57
6,1
03
15,0
87
15,6
29
Ne
t a
ccru
al a
dju
stm
en
ts0
00
00
00
00
0
Reven
ue f
or
the p
eri
od
2(f
)(ii)
1,2
80
1,3
70
2,8
32
1,8
70
5,1
18
6,2
86
5,8
57
6,1
03
15,0
87
15,6
29
Su
rplu
s/(d
efic
it)
fro
m t
he
pre
vio
us y
ea
r48
2,0
92
1,7
80
0(6
49)
1,3
82
5,7
38
7,1
41
6,9
17
10,6
15
To
tal
rev
en
ue
in
clu
din
g a
cc
rue
d r
ev
en
ue
1,3
28
3,4
62
4,6
12
1,8
70
4,4
69
7,6
68
11,5
95
13,2
44
22,0
04
26,2
44
Less
exp
ense
s in
cludin
g a
ccru
ed e
xpense
s(2
,094)
(3,4
14)
(1,2
78)
(90)
(7,5
40)
(8,3
17)
(6,4
67)
(7,5
06)
(17,3
79)
(19,3
27)
Su
rplu
s/(
de
fic
it)
for
the
re
po
rtin
g p
eri
od
(766)
48
3,3
34
1,7
80
(3,0
71)
(649)
5,1
28
5,7
38
4,6
25
6,9
17 6
8
Page
129
Fina
ncia
l Re
port
s an
d St
atem
ents
201
5

Th
e U
niv
ers
ity o
f S
yd
ne
yN
ote
s t
o t
he
fin
an
cia
l s
tate
me
nts
for
the
ye
ar
en
de
d 3
1 D
ec
em
be
r 2
01
5
(co
nti
nu
ed
)
47
Ac
qu
itta
l o
f A
us
tra
lia
n G
ov
ern
me
nt
fin
an
cia
l a
ss
ista
nc
e (
co
nti
nu
ed
)
(f)
Au
str
alian
Researc
h C
ou
ncil g
ran
ts
Netw
ork
s a
nd
cen
tres
To
tal
(iii
) N
etw
ork
s a
nd
Cen
tres
Pare
nt
En
tity
(U
niv
ers
ity)
on
ly
2015
$'0
00
2014
$'0
00
2015
$'0
00
2014
$'0
00
Fin
anci
al a
ssis
tan
ce r
ece
ived in
cash
during the
report
ing p
eriod
7,4
67
7,3
35
7,4
67
7,3
35
Ne
t a
ccru
al a
dju
stm
en
ts0
00
0
Reven
ue f
or
the p
eri
od
2(f
)(iii
)7,4
67
7,3
35
7,4
67
7,3
35
Surp
lus/
(defic
it) fro
m the p
revi
ous
year
(2,5
41)
(2,3
74)
(2,5
41)
(2,3
74)
To
tal re
ven
ue in
clu
din
g a
ccru
ed
reven
ue
4,9
26
4,9
61
4,9
26
4,9
61
Less
exp
ense
s in
cludin
g a
ccru
ed e
xpense
s(1
2,0
75)
(7,5
02)
(12,0
75)
(7,5
02)
Su
rplu
s/(
defi
cit
) fo
r th
e r
ep
ort
ing
peri
od
(7,1
49)
(2,5
41)
(7,1
49)
(2,5
41)
(g)
OS
-HE
LP
Pare
nt
En
tity
(U
niv
ers
ity)
on
ly
2015
$'0
00
2014
$'0
00
Cash
rece
ived d
uring the r
eport
ing p
eriod
4,3
06
4,6
56
Cash
spent during the r
eport
ing p
eriod
(3,3
68)
(3,6
75)
Net
cash
receiv
ed
2(h
)938
981
Cash
surp
lus/
(defic
it) fro
m the p
revi
ous
period
1,5
66
585
Cash
su
rplu
s/(
defi
cit
) fo
r th
e r
ep
ort
ing
peri
od
2,5
04
1,5
66 6
9
47 Acquittal of Australian Government financial assistance (continued)
(h) Student Services and Amenities Fee
Parent Entity (University) Only
2015
$'000
2014
$'000
Unspent/(overspent) revenue from previous period 0 0SA-HELP revenue earned 2(b) 4,249 4,244Student services fees direct from students 4 9,633 8,829
Total revenue expendable in period 13,882 13,073Student services expenses during period (13,856) (13,073)
Unspent/(overspent) student services revenue 26 0
48 Disaggregated information (dual sector and/or operations outside Australia)
The University operates predominantly in New South Wales for the purpose of teaching and research.
Revenue
2015 2014 2015 2014 2015 2014
Wayne Andrews
Chief Financial Officer
END OF AUDITED FINANCIAL STATEMENTS
AUDITED BY THE AUDIT OFFICE OF NEW SOUTH WALES
Page
130
sydn
ey.e
du.a
uTh
e Un
iver
sity
of
Sydn
eyAn
nual
Rep
ort
2015
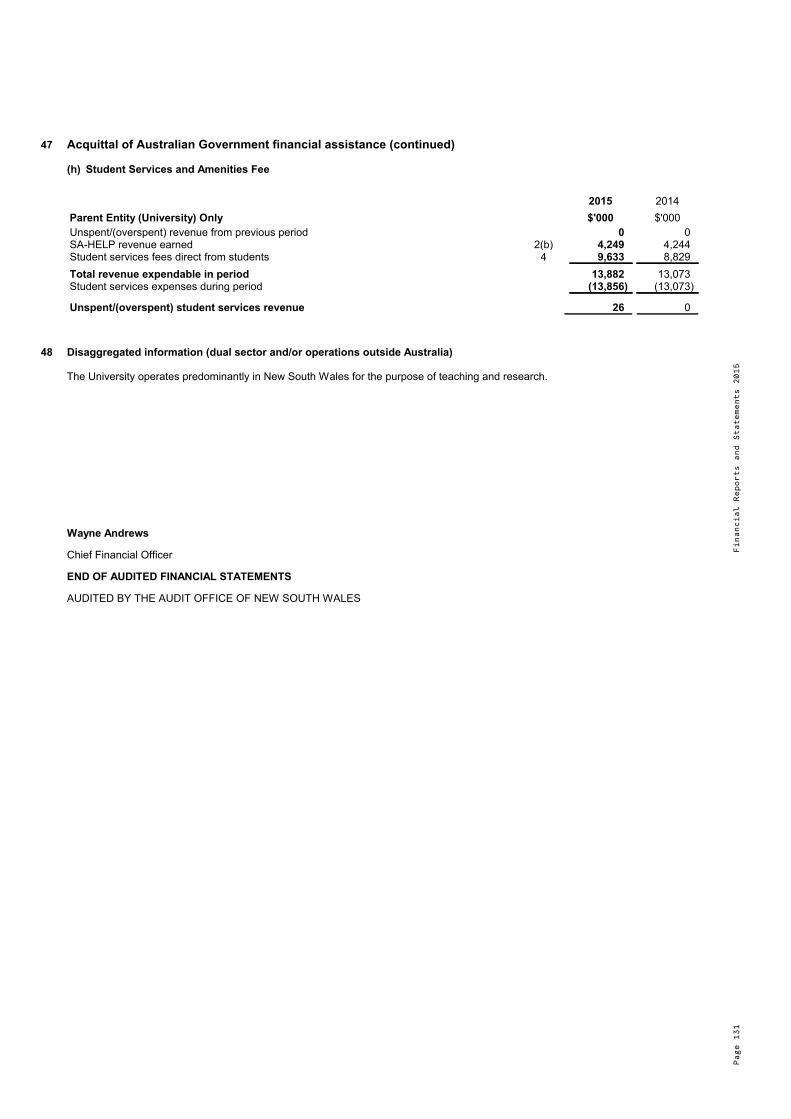
47 Acquittal of Australian Government financial assistance (continued)
(h) Student Services and Amenities Fee
Parent Entity (University) Only
2015
$'000
2014
$'000
Unspent/(overspent) revenue from previous period 0 0SA-HELP revenue earned 2(b) 4,249 4,244Student services fees direct from students 4 9,633 8,829
Total revenue expendable in period 13,882 13,073Student services expenses during period (13,856) (13,073)
Unspent/(overspent) student services revenue 26 0
48 Disaggregated information (dual sector and/or operations outside Australia)
The University operates predominantly in New South Wales for the purpose of teaching and research.
Revenue
2015 2014 2015 2014 2015 2014
Wayne Andrews
Chief Financial Officer
END OF AUDITED FINANCIAL STATEMENTS
AUDITED BY THE AUDIT OFFICE OF NEW SOUTH WALES
Page
131
Fina
ncia
l Re
port
s an
d St
atem
ents
201
5

Page
132
sydn
ey.e
du.a
uTh
e Un
iver
sity
of
Sydn
eyAn
nual
Rep
ort
2015


Prod
uced
by
the
Univer
sity
of
Sydn
ey,
April
2016.
The
Univer
sity
res
erve
s th
e ri
ght
to m
ake
alte
rati
ons
to a
ny i
nfor
mati
on c
ontain
ed w
ithi
n this p
ubli
cati
on w
itho
ut n
otic
e. 16/5233
The University of SydneyNSW 2006 Australia+61 2 9351 2222sydney.edu.au
About the annual reportThis report was produced by the University of Sydney’s Marketing and Communications unit in line with the University’s reporting obligations. To find out more about the University’s current activities, please visit
− sydney.edu.au/about
The Annual Report is also available online at − sydney.edu.au/about/annual_report
For further information, please contact:Information Management OfficerMarketing and CommunicationsThe University of Sydney NSW 200602 9351 [email protected]
Financial statements for subsidiariesThe 2014 financial statements for the subsidiaries of the University have been published as a separate volume of this annual report and provided to the Minister for Education. This volume can be downloaded from
− sydney.edu.au/about/publications/annual_report
Printing costsPrinting costs to comply with NSW annual reporting and legal deposit requirements: $385 (excluding GST)
ISSN 0313-4474 © The University of Sydney 2016 ABN 15 211 513 464 CRICOS 00026A
The University of Sydney Annual Report 2015