Embed Size (px)
Citation preview

1
The University’s Finances - II
Spring Semester, 2010

2
Primary Budget Variables
•Revenue▫Pricing
Comp Fee Discount Rate Net Revenue per student
▫Enrollment▫Endowment▫Giving
•Expenditures▫ Salaries and Wages▫ Benefits▫ Expendables▫ Debt Service

3
Revenue Side of the Equation
4
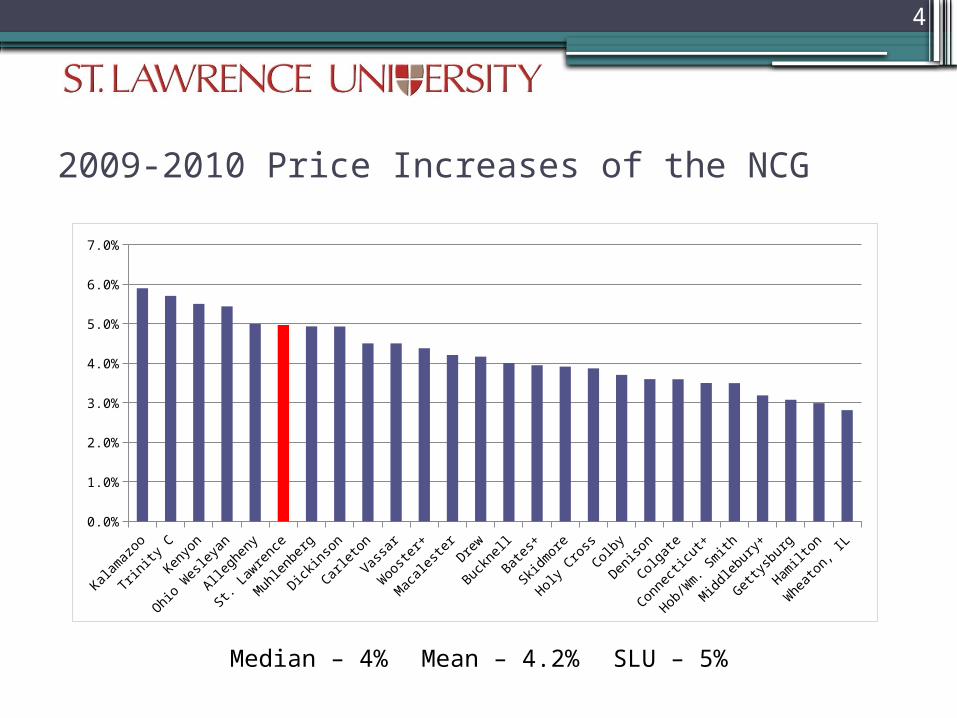
2009-2010 Price Increases of the NCG
Kalam
azoo
Trinity
C
Kenyo
n
Ohio
Wes
leya
n
Allegh
eny
St. Law
renc
e
Muh
lenb
erg
Dickin
son
Carle
ton
Vassa
r
Woo
ster
+
Mac
ales
ter
Drew
Buckn
ell
Bates
+
Skidm
ore
Holy C
ross
Colby
Deniso
n
Colga
te
Conne
cticu
t+
Hob/W
m. S
mith
Mid
dleb
ury+
Getty
sbur
g
Hamilt
on
Whe
aton
, IL
0.0%
1.0%
2.0%
3.0%
4.0%
5.0%
6.0%
7.0%
Median – 4% Mean – 4.2% SLU – 5%

5
• Vassar $51,470• Trinity $51,400• Bates $51,300• Skidmore $51,196• Connecticut $51,115• Colgate $50,940• Middlebury $50,780• Bucknell $50,320• Hobart/William Smith $50,245• Carleton $50,205• Dickinson $50,194• St. Lawrence $49,925• Hamilton $49,860
• Kenyon $49,410• Holy Cross $49,341• Gettysburg $48,500• Drew $48,385• Macalester $47,392• Denison $45,720• Muhlenberg $45,580• Wooster $44,280• Ohio Wesleyan $44,254• Allegheny $42,000• Kalamazoo $40,419• Wheaton, IL $35,496
Comprehensive Fees
St. Lawrence University Ranks 13th in the NCG
6
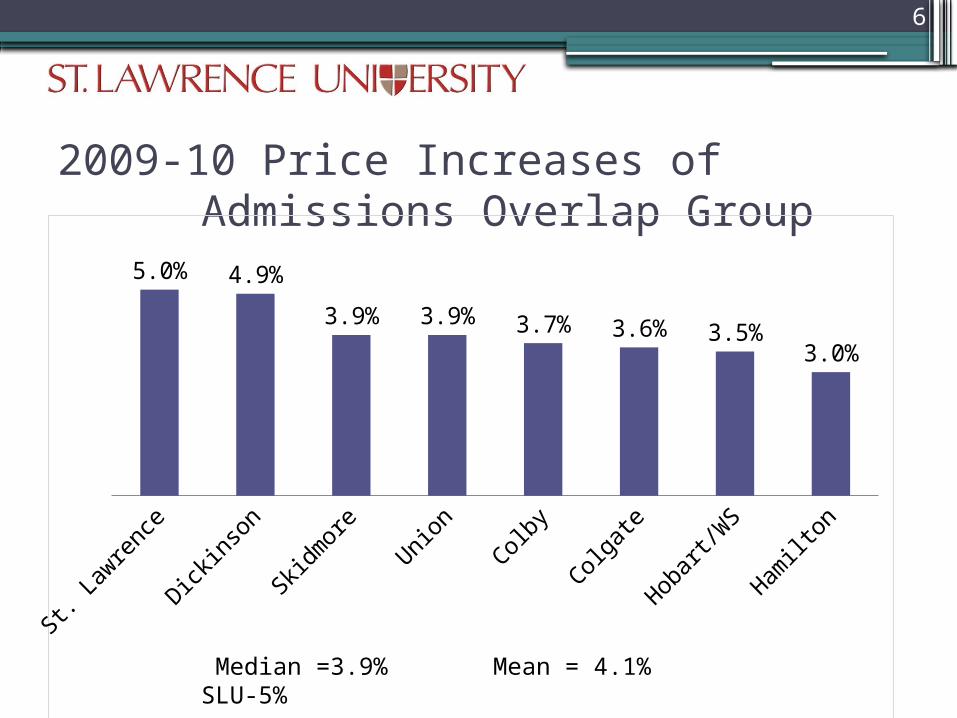
2009-10 Price Increases of Admissions Overlap
Group5.0% 4.9%
3.9% 3.9% 3.7% 3.6% 3.5%3.0%
Median =3.9% Mean = 4.1% SLU-5%

7
•Skidmore $51,196•Colgate $50,940•Union $50,440•Colby $50,320•Hobart/WS $50,245•Dickinson $50,194•St. Lawrence $49,925•Hamilton $49,860
Admissions Overlap Group

8
Comprehensive Fee Discount Rate
00 01 02 03 04 05 06 07 08 09 10 11 12 13 00 01 02 03 04 05 06 07 08 09 10 11 12 13
All Classes 33 32.7 34.5 35.9 38.3 38.5 37.4 36.4 35 34.6 34.9 35.3 35.6 35.5
1st Year Class
33.5 34.7 40.6 41.5 41.5 38.9 36.9 36.7 35.5 38.2 35.6 34.8 35.6 36.8
1st Year Tar-get
NaN NaN NaN NaN 40.4 39.4 38.4 37.4 36.4 35.4 34.4 33.4 32.4 35.6
31.0
33.0
35.0
37.0
39.0
41.0
43.0
Class of

9
NCG Estimated 2007-08Comprehensive Fee Discount
Mid
dleb
ury
Skidm
ore
Conne
cticu
t
Colby
Bates
Buckn
ell
Dickin
son
Trinity
C
H & W
S
Kenyo
n
Colga
te
Hamilt
on
Getty
sbur
g
Carle
ton
Whe
aton
Deniso
n
Vassa
r
CHoly Cro
ss
St. Law
renc
e
Allegh
eny
Mac
ales
ter
Muh
lenb
erg
CWoo
ster
Kalam
azoo
0%
5%
10%
15%
20%
25%
30%
35%
40%

10
SLU Net Comprehensive Fee Revenue/Student
91 93 92 94 95 96 97 98 99 01 00 02 03 04 05 06 07 08 09 10$0
$5,000
$10,000
$15,000
$20,000
$25,000
$30,000
$35,000
Fiscal Year
11
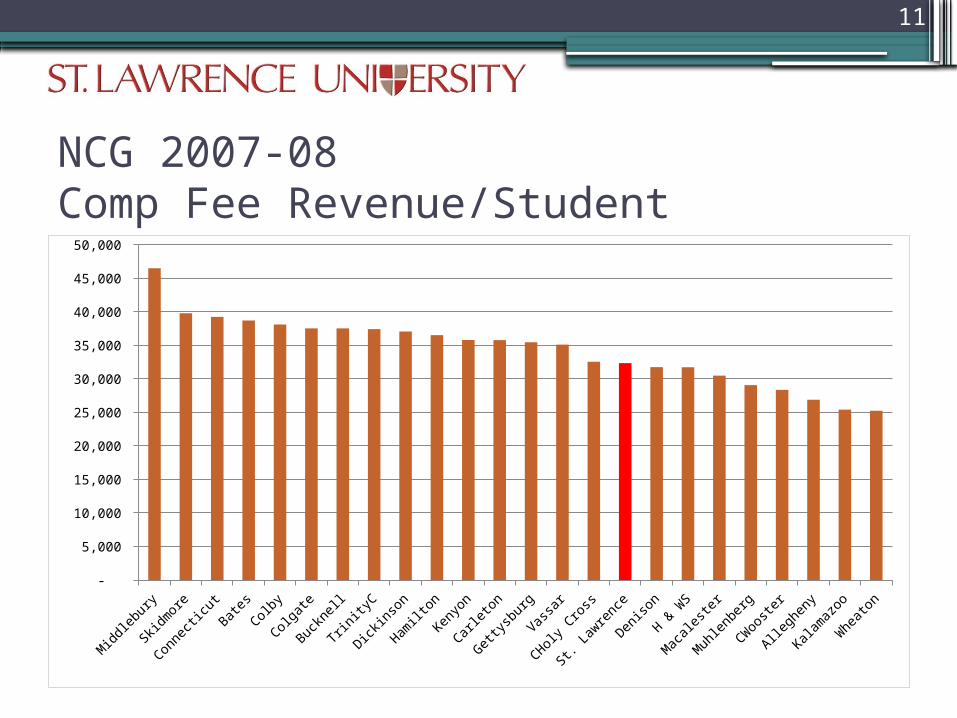
NCG 2007-08Comp Fee Revenue/Student
Mid
dleb
ury
Skidm
ore
Conne
cticu
t
Bates
Colby
Colga
te
Buckn
ell
Trinity
C
Dickin
son
Hamilt
on
Kenyo
n
Carle
ton
Getty
sbur
g
Vassa
r
CHoly Cro
ss
St. Law
renc
e
Deniso
n
H & W
S
Mac
ales
ter
Muh
lenb
erg
CWoo
ster
Allegh
eny
Kalam
azoo
Whe
aton
-
5,000
10,000
15,000
20,000
25,000
30,000
35,000
40,000
45,000
50,000

12
Enrollment (2 semester avg)
96 97 98 99 00 01 02 03 04 05 06 07 08 09 10 11 12 13 14 151000
1200
1400
1600
1800
2000
2200
2400
Fiscal Year
Projections Assume FY Class of 600

13
NCG 07-08 Enrollment (FTE)
Buckn
ell
Colga
te
Getty
sbur
g
Mid
dleb
ury
Muh
lenb
erg
Trinity
C
Denison
Drew
Carle
ton
Colby
Ham
ilton
Bates
Kalam
azoo
-
500
1,000
1,500
2,000
2,500
3,000
3,500
4,000

14
SLU FY to Sophomore Retention Rate
94 95 96 97 98 99 00 01 02 03 04 05 06 07 08 09 10 11 127476788082848688909294
Class of
Perc
en
t
Reached All Time High Retention Rate this Fall

15
Endowment Investment Performance
1984-85
85-86
86-87
87-88
88-89
89-90
90-91
91-92
92-93
93-94
94-95
95-96
96-97
97-98
98-99
99-00
00-01
01-02
02-03
03-04
04-05
05-06
06-07
07-08
08-09
$0
$20
$40
$60
$80
$100
$120
$140
$160
$180
$200
$220
$240
$260
$280
-30.00%
-20.00%
-10.00%
0.00%
10.00%
20.00%
30.00%
$50$63
$72 $72$80 $80
$86$97
$107$110
$126
$145
$172
$195$207
$214
$200
$174$170
$199$211
$230
$269
$245
$188
Year End Market Value Investment Return
16
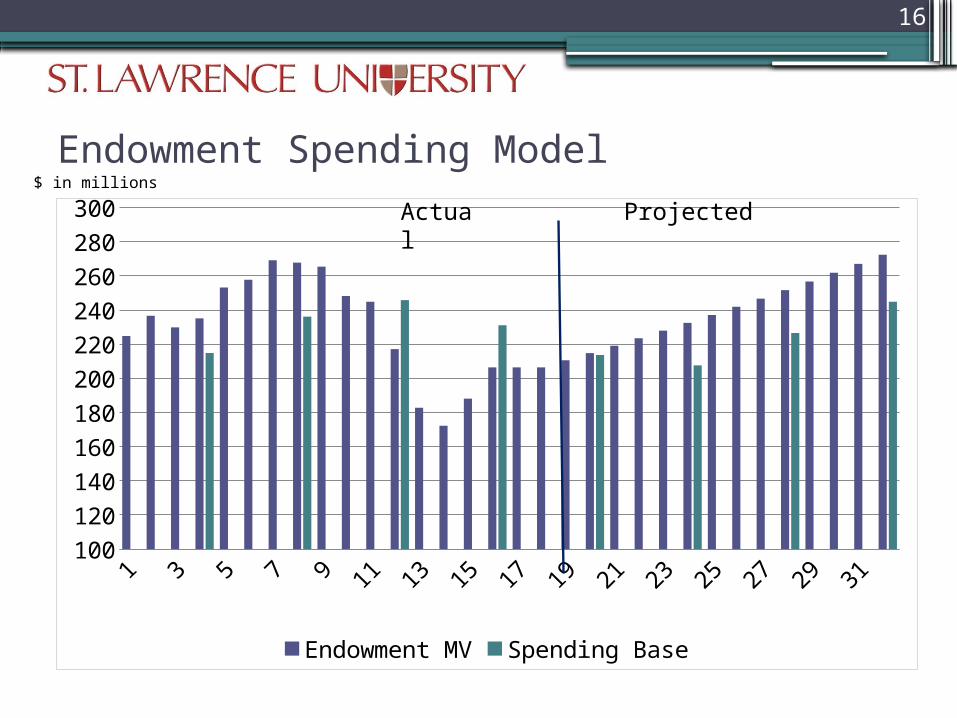
Endowment Spending Model
1 3 5 7 9 11 13 15 17 19 21 23 25 27 29 31100
120
140
160
180
200
220
240
260
280
300
Endowment MV Spending Base
$ in millions
Actual Projected

17
Giving
1998 1999 2000 2001 2002 2003 2004 2005 2006 2007 2008 2009$0
$5,000,000
$10,000,000
$15,000,000
$20,000,000
$25,000,000
$30,000,000
$35,000,000
$0
$5,000,000
$10,000,000
$15,000,000
$20,000,000
$25,000,000
$30,000,000
$35,000,000
NCG 25th percentileNCG 25th percentile*NCG 25th percentile*
NCG 25th percentile*NCG 25th percentile*NCG 25th percentile*NCG 25th percentile*NCG 25th percentile*
NCG 25th percentile*NCG 25th percentile*NCG 25th percentile*
NCG 25th percentile*
NCG 75th percentile
NCG 75th percentile*
NCG 75th percentile*NCG 75th percentile*NCG 75th percentile*
NCG 75th percentile*NCG 75th percentile*
NCG 75th percentile*NCG 75th percentile*
NCG 75th percentile*
NCG 75th percentile*NCG 75th percentile*
NCG Median
St. Lawrence
St. Lawrence
NCG median and 25th & 75th percentiles are based on 25* institutions (not including St. Lawrence).The data reflected in this chart are self-reported and are not official CAE numbers and , therefore, are subject to change when those num -bers become available.**Do not release this data to the public. Preliminary replies are available for analysis by dataminer subscribers only. This data is not considered official until released by CAE in mid-February. For internal purposes only**
$14,228,754 Actual FY09

18
Expenditure Side of the Equation
19
Salaries, Wages and Benefits - 59% of Operating Budget
•Salaries total $46 million•Salary Policy
▫One more year of policy▫Policy level is NCG average increase plus
1%▫NCG Base is likely to be very small (<1%)
•Union Contracts▫Contracts end June, 2010
20
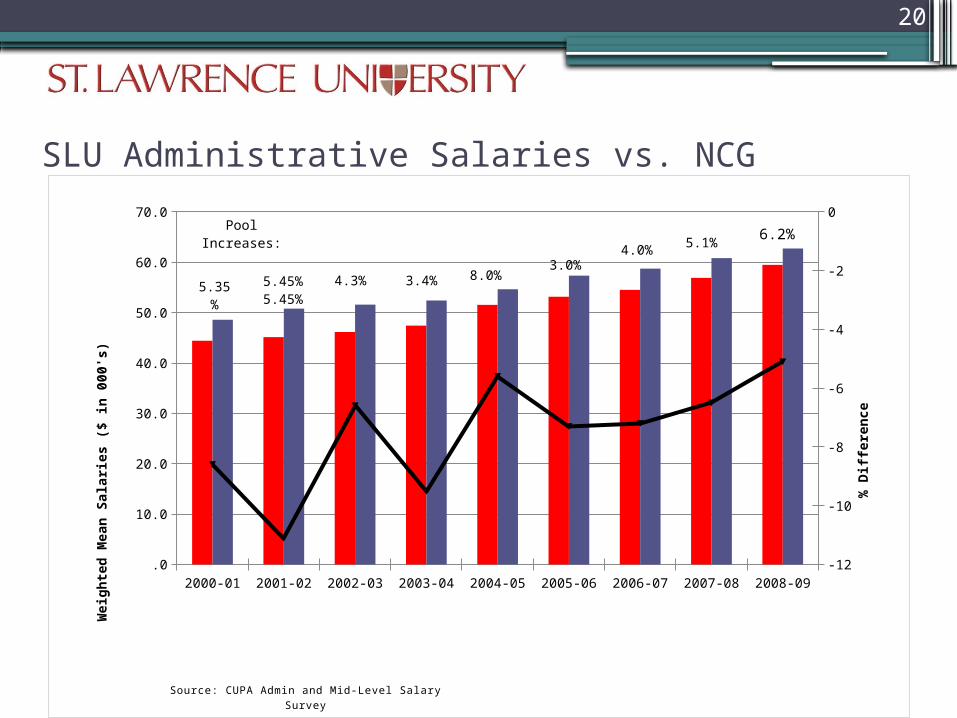
SLU Administrative Salaries vs. NCG
2000-01 2001-02 2002-03 2003-04 2004-05 2005-06 2006-07 2007-08 2008-09 2000-01 2001-02 2002-03 2003-04 2004-05 2005-06 2006-07 2007-08 2008-09
SLU
44415 45155 46168 47433 51557 53168 54525 56897 59500
NCG
48591 50806 51607 52408 54632 57350 58751 60840 62728
% variance
-8.6 -11.1 -6.6 -9.5 -5.6 -7.3 -7.2 -6.5 -5.1
5.0
15.0
25.0
35.0
45.0
55.0
65.0
-11
-9
-7
-5
-3
-1
Wei
ghte
d M
ean
Sala
ries
($
in 0
00's
)
% D
iffer
ence
Source: CUPA Admin and Mid-Level Salary Survey
5.35%5.45%5.45%
4.3% 3.4% 8.0%3.0%
Pool Increases:4.0% 5.1%
6.2%

21
SLU Faculty Salaries vs. NCG Median
95 96 97 98 99 00 01 02 03 04 05 06 07 08 09 95 96 97 98 99 00 01 02 03 04 05 06 07 08 09
SLU
50600
52500
54200
56600
57100
56600
57900
60000
62200
62600
65600
67000
70000
72200
75700
NCG
51800
53600
55600
57400
59600
59800
61400
64400
66300
67300
68000
70400
74100
76600
79900
% Variance
-0.023
-0.021
-0.025
-0.017
-0.042
-0.054
-0.057
-0.068
-0.062
-0.07 -0.035
-0.048
-0.055
-0.057
-0.053
5
15
25
35
45
55
65
75
85
-8%
-7%
-6%
-5%
-4%
-3%
-2%
-1%
Sala
ry $
in
Tho
usan
ds
% D
iffer
ence
fro
m N
CG
Pool Increases:
3.5% 4.8% 3.5%6.2%
1.5%3.0% 5.3%
5.45% 5.2%4.4%
8.6%3.1%
4.0%6.2% 6.1%

22
Benefits - $17M
▫Health Care - $4.2M▫Retirement Plan - $3.7M▫FICA - $3.2M▫Tuition Benefits - $3.1M

23
Expendables - $27M
•Utilities $4.6M•Food $3.2M•Travel (business and athletics) $3.4M•Fac & Equip maint/repair $2.4M•Int’l Program payments $2.0M •Print/copy/mail $1.9M

24
Debt Service
Original Interest* Principle** Total
2009-10 5.2 3.5 8.7
2010-11 5.0 3.5 8.5
2011-12 4.8 5.0 9.8
2012-13 4.7 5.0 9.7
2013-14 4.6 4.6 9.2
*Includes interest rate swap **Based on original payment schedule
$ in millions

25
Hi/Mid/Low Projection
$M 10-11 11-12 12-13 13-14 14-15 TotalImpact
5%* 77.1 80.0 83.3 88.0 92.5 -
4% 76.0 77.6 79.7 82.8 85.8 -19.0
3% 74.9 75.3 76.0 77.8 79.3 -37.6
Comprehensive Fee - Net Student Revenues
$M 10-11 11-12 12-13 13-14 14-15 TotalImpact
37% 76.8 79.4 82.4 86.7 91.2 -4.4
36%* 77.1 80 83.3 88 92.5 -
35% 77.5 80.7 84.3 89.3 97.9 8.8
Discount Rate – Net Student Revenues
*Indicates current variable value

26
Hi/Mid/Low Projection
$M 10-11 11-12 12-13 13-14 14-15 TotalImpact
625 77.9 81.4 85.5 90.5 95.1 9.5
600* 77.1 80.0 83.3 88.0 92.5 -
575 76.3 78.4 80.9 84.6 88.9 -11.8
Enrollment – FY Class Size – Net Student Revenues
$M 10-11 11-12 12-13 13-14 14-15 TotalImpact
9% 11.7 10.8 10.9 11.3 11.8 0.7
8%* 11.7 10.7 10.8 11.1 11.5 -
7% 11.7 10.7 10.8 11.0 11.3 -0.3
Endowment Return – Formula Income
*Indicates current variable value
27
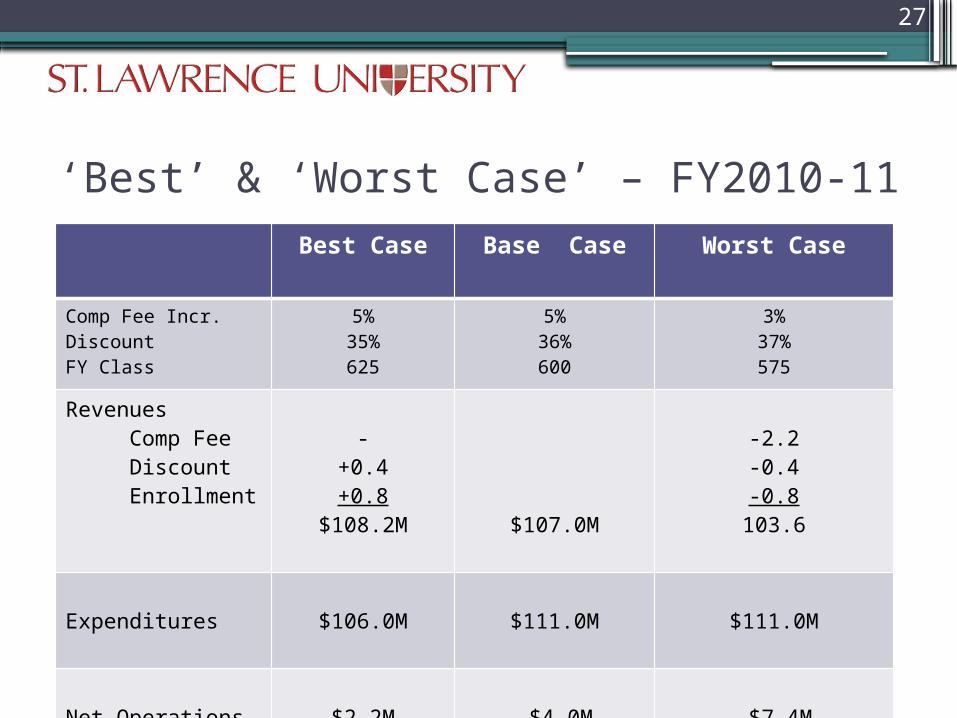
‘Best’ & ‘Worst Case’ – FY2010-11Best Case Base Case Worst Case
Comp Fee Incr.DiscountFY Class
5%35%625
5%36%600
3%37%575
Revenues Comp Fee Discount Enrollment
-+0.4+0.8
$108.2M $107.0M
-2.2-0.4-0.8
103.6
Expenditures $106.0M $111.0M $111.0M
Net Operations $2.2M -$4.0M -$7.4M