Embed Size (px)
Citation preview

The Urban Institute
USING INFORMATION FORCOMMUNITY ACTION
National Neighborhood Indicators Partnership
San Diego, CA March 4, 2011
Kathy Pettit, The Urban Institute

The Urban Institute
National Trends in Using Local Indicators
• More neighborhood level data available than ever before
– Online systems like PolicyMap, Google Data, etc.
– Open Data and Gov 2.0 movements
• Increased role for local administrative data
– American Community Survey 5-year avg. tract data inadequate
• New focus in federal programs on place-based initiatives
– Promise and Choice Neighborhoods (comprehensive perspective)
– Sustainable Communities (links regional and neighborhood issues)

The Urban Institute
• But, still often difficult to find relevant, up-to-date data at the desired geography for community action
• And more than data is needed– Analysis and interpretation
– Knowledge of community issues
– Effective communication & advocacy
National Trends in Using Local Indicators

The Urban Institute
National NeighborhoodIndicators Partnership (NNIP)
• Collaborative effort since 1995
– Urban Institute and local partners in 35 cities
• Success required three innovations
1. Data and technology
2. Institutions
3. Using information for change
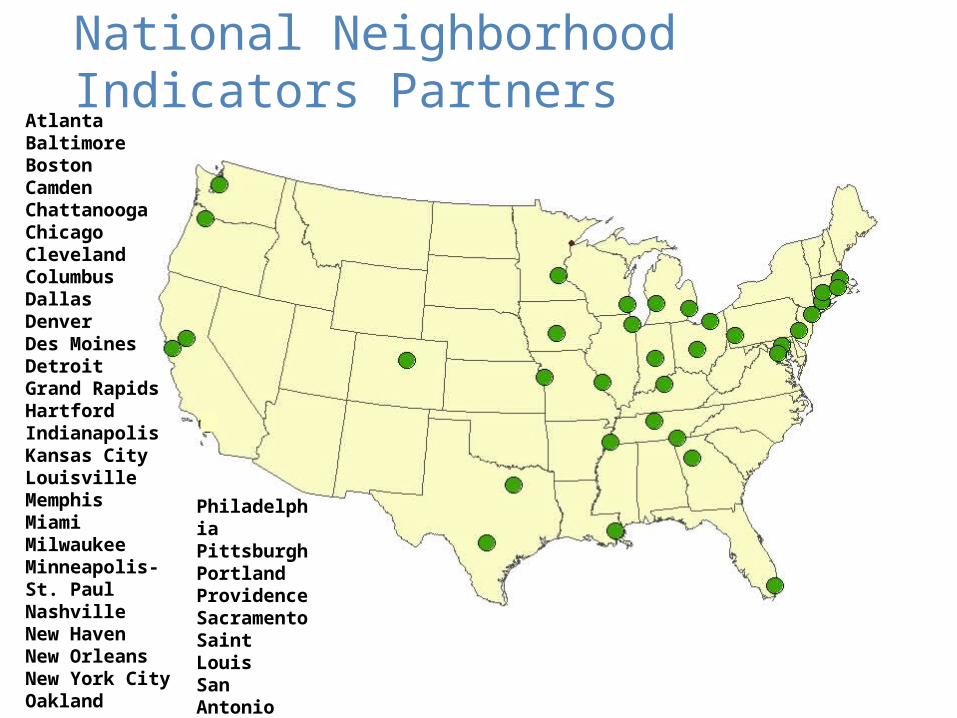
National Neighborhood Indicators PartnersAtlantaBaltimoreBostonCamdenChattanoogaChicagoClevelandColumbusDallasDenverDes MoinesDetroitGrand RapidsHartfordIndianapolisKansas CityLouisvilleMemphisMiami MilwaukeeMinneapolis-St. PaulNashvilleNew HavenNew OrleansNew York CityOakland
Philadelphia PittsburghPortlandProvidenceSacramentoSaint LouisSan AntonioSeattleWashington, DC

CITY
Types of DataProperty sales, pricesForeclosuresBirths, deathsCrimeEducationTANF, Food StampsHealthChild care
Data and TechnologyLinking people information with place information
NEIGHBORHOOD
TRACTS
PARCEL
REGION

The Urban Institute
New Types of Institutions
• All but one outside of government
– Nonprofits, university centers, alliances, funders
• But partner with resident groups, nonprofits, government, and other stakeholders
• Long-term and multifaceted interests
• Positioned to maintain trust of data providers and users

12
9
8
3
2
1
0
2
4
6
8
10
12
14
Nonprofit-broadmission
University Partnership Nonprofit-infoonly
Funder Local govt.agency
Num
ber
of N
NIP
par
tner
s
Type of Organization
Types of NNIP Partner Institutions

The Urban Institute
Shared Mission: Information for Change
• Democratizing Information– Facilitate the direct use of data by stakeholders
• Data serves many varied audiences and purposes
• But a central focus on strengthening and empowering low-income neighborhoods
• Information promotes collaboration
– Acts as a bridge among public agencies, nonprofits, businesses

The Urban Institute
Shared Mission: Types of Applications
• Using indicators in local change initiatives– Citywide analysis to change laws and policies
– Geographic targeting of resources for programs and investments
– Support individual neighborhood improvement initiatives
– Support program and policy evaluation
• Comprehensive community indicator initiatives– Review of indicators across topics to collectively track community
quality of life
– Well-developed in ten NNIP partner sites; full list at http://www2.urban.org/nnip/sharedindic.html

Source: Center on Urban Poverty and Community Development, Case Western University
Inform community development
decisions

Measure Access to Healthy Food
Average Distance to Nearest Grocery
Store by Block in Chattanooga
Source: Ochs Center for Metropolitan Studies
Average miles

Advocate for Legal Reform
Individuals convicted of selling drugs were permanently barred from receiving food stamps, making their transition more difficult and denying help to their children
Source: Providence Plan

Highlight Effects of Foreclosure on Children
Forced mobility can put kids behind academically and socially
Foreclosure prevention counselors should connect families to student services
Schools need to understand the how their students are affected by foreclosure to design appropriate responses.
Source: NeighborhoodInfo DC

The Urban Institute
Developing an NNIP Partnerin your Community

The Urban Institute
Getting Started
• Identify champions
– Individuals committed to shepherding the process (not necessarily the ultimate partner home)
• Catalog existing neighborhood data efforts– Government, universities, non-profits, funders– Availability of source data; culture of data sharing– Applications (operational, planning, evaluation)– Connections to community training & engagement

The Urban Institute
Getting Started, cont.
• Assess community needs for information– Formal or informal process
– Interview potential data providers, indicator users, and funders (government & non-government)
– Learn about interests and high-priority issues, and build support for NNIP model
• Keep eyes out for potential “early wins”– System not built all at once
– Demonstrating the potential is key

The Urban Institute
Finding a Home: Commit to Major Functions
• Build and operate information systems with integrated and recurrently updated indicators on neighborhood conditions
• Facilitate and promote the direct practical use of indicators by community and city leaders in community building and local policy making
• Emphasize the use of information to build the capacities of institutions and residents in distressed neighborhoods
The Urban Institute
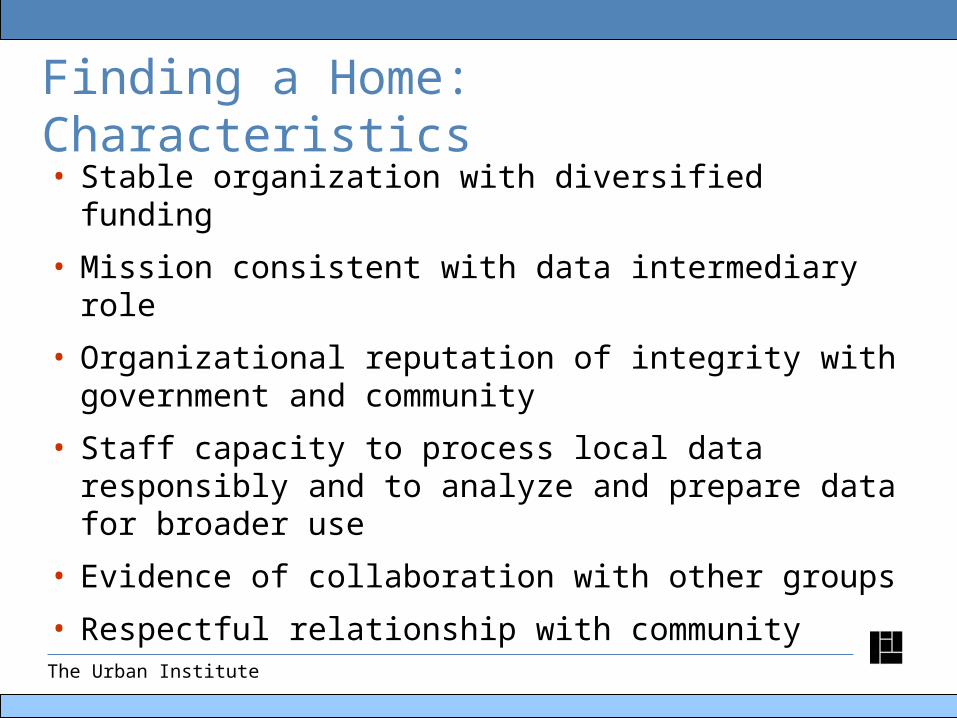
Finding a Home: Characteristics
• Stable organization with diversified funding
• Mission consistent with data intermediary role
• Organizational reputation of integrity with government and community
• Staff capacity to process local data responsibly and to analyze and prepare data for broader use
• Evidence of collaboration with other groups
• Respectful relationship with community

The Urban Institute
Finding a Home: Staffing
Number of Paid Staff
Full & Part-Time Full-Time Equivalent
Low 1 1
Average 6 4
High 20 15

How to Pay for It?Level of Funding
Range of revenue
Percent of partners in range
General support Special projects
Less than $100,000 50% 48% $100,000 - $200,000 12% 17% $200,000 - $300,000 12% 9% $300,000 - $400,000 8% 0% $400,000 - $500,000 4% 13%
$500,000 - $1,000,000 0% 4%
Greater than $1,000,000 8% 4%
None 4% 4%

The Urban Institute
How to Pay for It?Sources of Funding
Sources of revenue Percent of partners
State/Local Government 68% Local Foundations 64% National Foundations 48% Other Nonprofits 48% Universities 44% United Way 36% Federal Government 32% Commercial/Private Business 24%

The Urban Institute
How to Pay for It? Fee-based Services
Types of fee-based services Percent Preparing studies and policy analyses 84%Custom mapping 79%Custom data development 74%Consulting 53%Other 26%

The Urban Institute
NNIP Partnership: Joint Work Program
• Advance the state of practice
1. Informing local policy initiatives (cross-site projects)
2. Developing tools and guides
• Build/strengthen local capacity
3. Developing capacity in new communities
4. Services to an expanding network
• Influence national context/partnering
5. Leadership in building the field

The Urban Institute
NNIP Partnership: Benefits for Members
• Dynamic learning network of people with common goals and struggling with similar challenges
• Invitations to semi-annual partnership meetings
• External validation of your organization’s capacity
• Greater visibility for your work in national forums
• Connection to national policy & program networks
• Opportunity to participate in cross-site projects

The Urban Institute
NNIP Partnership: Expectations of Members
• Contribute to knowledge sharing and supportive network of the partnership
• Report recent partner activities semi-annually
• Regularly attend semi-annual partnership meetings
• Recognize and promote the network to local and national audiences

The Urban Institute
For more information
NNIP Web site: www.urban.org/nnip
NNIP Co-Directors
Kathy Pettit: [email protected], (202) 261-5670
Tom Kingsley: [email protected], (202) 261-5585