Embed Size (px)
Citation preview

177
THE URBAN SOUNDSCAPE
A DIFFERENT PERSPECTIVE
Dick BOTTELDOOREN1, Bert DE COENSEL1, Timothy VAN
RENTERGHEM1, Luc DEKONINCK1 en Dominique GILLIS2
1 Ghent University
Department of Information Technology
Acoustics Group
Sint-Pietersnieuwstraat 41
9000 Gent
tel: +32 9 264 99 68
fax: +32 9 264 99 69
e-mail: [email protected]
2 Ghent University
Civil Engineering Department
Institute for Sustainable Mobility
Vrijdagmarkt 10/301
9000 Gent
tel: +32 9 331 32 59
fax: +32 9 331 32 69
e-mail: [email protected]
Abstract
Sound is an integrated part of the urban society. Overexposure to
unwanted sound - often from mechanical or electronic origin - is often
tackled after it occurs and in a remediating fashion. An integrated
approach to land use planning, urban development, urban traffic
management and quality of life - at least the noise related part of it - opens
interesting new perspectives. This chapter discusses these opportunities
and points at indicators and numerical simulation that can be advantageous
when applying the ideas presented.

178
1. Introduction
Classical urban noise management mainly aims at reducing the level of
unwanted noise - of mechanical or electronic origin - in the city by source
mitigation and by obstructing the propagation path. Remediation after the
problem arises or during planning in a more ideal situation using technical
measures, is by far the most common approach to noise control. No doubt
this approach is a very good one provided that it leads to significant noise
reduction. However, this is certainly not the case in many of our modern
cities and therefore more creative approaches are necessary. This chapter
reports on some recent developments in this area and puts the urban
soundscape (Schafer, 1977) and its design in a slightly different
perspective.
For the reader less familiar with traffic noise management we summarize
the most relevant technological possibilities (VMM, 2007a) for urban
noise control before tackling the problem in detail. Road traffic noise is
caused by the drive train at the one hand and by the wheel-road interaction
(rolling noise) at the other. As driving speed increases and driving is more
regular, the latter contribution start to dominate. Drive train noise is
constrained by European noise emission regulations which have
progressively become more restrictive over the years. Manufacturers have
modified many technical details of cars to comply with these regulations,
but they did not necessarily do much more than just that. Cars and buses
powered by alternative fuel, in particular electric engines, can be
significantly more quiet. Although the European noise regulation can not
be circumvented by member states, they have opportunities to stimulate
citizens and enterprises (including public transport companies) to buy
more environmentally friendly vehicles or to introduce noise testing for
vehicles in use. Rolling noise involves tires and road surface. Tire
requirements, including noise, are also a European matter. A good choice
of road surfaces can significantly reduce rolling noise, but road surface
maintenance is at least as important, in particular in the urban context. In
(VMM, 2007a) it is shown that there is some potential for reducing rolling
noise in Flanders both through modifying road surfaces and through
modifying tires, but the number of dBs to be gained is small.
The picture for railway noise is not all that different. Many rail vehicles
are electrically powered and thus engine noise is often limited. Rolling of

179
metal wheels on metal rails produces a level of sound that depends on the
smoothness of both the rail and the wheel. The opportunities for noise
reduction at the source are probably more significant than for road traffic,
in particular when considering freight. Important European advances can
be expected in near future. Amongst all noise reducing measures, noise
barriers placed close to the source are probably best known.
Unfortunately, it is often difficult to apply them in urban areas due to
space restrictions and visual impact.
2. The ideal urban sonic environment
A naive view of urban soundscape design may aim at making the sonic
environment as quiet as possible. In a more modern view, absolute
quietness is believed not to be a necessity and in some circumstances may
even be unwanted. The ideal urban sonic environment depends on the
context.
2.1. Dwellings: home environment
At home, extensive environmental mechanical or electronic noise is
perceived as intruding the observers private space. As such it will be
perceived as disturbing and annoying as soon as it is noticed. This
immediately implies that different types of traffic noise will result in
different annoyance for the same energetically averaged exposure. Today,
the relationships between façade exposure measured in Lden and self
reported long term annoyance have been well established for different
types of traffic noise and are quite generally accepted (Miedema, 1998).
These curves show that for the same average exposure, annoyance seems
to be greatest for aircraft noise and lowest for train noise. For industrial
noise, characteristics of the sound may differ significantly between sites
and these characteristics (tonality, impulse) may increase noticeability and
thus annoyance. This has been taken into account in regulation such as
Vlarem 2 that are applicable for industrial noise.
Assessing environmental noise levels at the façade is much easier than
measuring noise at the actual ear of the urban dweller and hence most
scientific advances in relating exposure to effects have been made in that
area as stated above. It should nevertheless be remembered that what

180
matters is the sound that reaches the ear. The dwelling itself acts as a
shield for the intruding noise - and in some particular cases as an amplifier
for low frequency sound (Pedersen et al., 2007). At the one hand the
dwelling may (over)amplify low frequency problems, at the other hand it
creates opportunities for indoor noise reduction. Noise reduction by
increased building insulation requires closing all windows and doors at
any time and thus may limit the sense of control and freedom of the
inhabitants which in turn has a negative effect on perceived annoyance.
This has led to the observation that insulation requirements should be
relaxed at least on one façade and this in turn led to the introduction of the
concept: quiet side (Ohrstrom et al., 2006). Availability of a silent or
highly shielded façade relaxes annoyance by an equivalent of a reduction
of most exposed façade level by 5 to 10 dBA as long as the level at the
quiet side does not exceed 55 dBA, and the difference between the loudest
and quiet side is at least 10 dB. Furthermore, the noise levels at the most-
exposed façade may not be excessively high. There is however also
growing evidence that the sonic environment in the wider neighborhood of
the house contributes to the annoyance (Klaeboe, 2007) in particular for
people living in apartments.
Disturbance of activity and in particular sleep disturbance are important as
a first stage negative effect of intruding environmental noise. Subjective
evaluation of sleep quality and fatigue correlate well with energetically
averaged nightly noise levels, LAeq,night, but other sleep indicators (changes
in heart rate, sleep stage, etc.) show a more complicated relationship with
number and level of noise events (Griefahn et al., 2006). There is some
evidence that habituation to traffic noise events during the night does not
occur (Griefahn et al., 2008a). It has also been established that noise
events occurring during the end of sleep have a stronger effect on overall
sleep quality and thus traffic curfews are most effective in the morning
(Griefahn et al., 2008b). Disturbances occurring during the beginning of
the night seem to be compensated. Concerning sleep disturbance, no clear
difference between different types of traffic could be established
indicating that the meaning of sound (within the scope of traffic noises)
may not be as important during sleep as could be expected.
Health effects occur at much longer time scales and thus the analyses and
design of the acoustic environment may need less temporal detail. Today
the best proven effect of long exposure to environmental noise in the home
181
environment is ischemic heart disease, which may in turn be related to
blood pressure (Babisch et al., 2005). The effect threshold seems to lie
around 65 dBA (daytime equivalent noise level in front of the façade) but
odds ratios are small, even 10 dBA above that threshold. Since it is
estimated that the causal path between exposure and health effects of
environmental noise involves the cognitive / emotional path for 75%
(Heimann et al., 2007), urban noise management aiming at reducing
annoyance can be expected also to reduce health effects.
2.2. Urban public space
City dwellers perceive and evaluate the soundscape of the urban public
space in a rather different way than they perceive the intruding sounds in
their home environment. Thus, modern urban soundscape planning is
evolving new ideas and concepts to accommodate this difference. The
soundscape is seen as an integral part of the urban environment,
contributing to the identify and specificity of this environment. The
quality of a soundscape is assessed within the particular context and use
imposed by the urban space. The physical characteristics of the sonic
environment needed to evaluate this quality go far beyond the overall
noise level and include spectral (Raimbault, 2003) and temporal
(Botteldooren, 2006) structure. Today the quest for appropriate physical
indicators is continuing but one could argue that physical indicators will
never be sufficient and the meaning that the listener associates to the
sound is most important (Dubois, 2006).
The urban public space has different uses: shopping, moving between
functions, recreation, …. The soundscape of parks and squares mainly
used for recreation has often been in focus. An important reason for this is
that the availability of high quality (green, quiet) urban space within reach
was proven to benefit the health of urban dwellers. In particular, the
potential for psychological restoration of natural quiet areas has been
suggested (van den Bergh, 2007). Thus the goal for urban planning in
relation to traffic noise is clearly broadened.

182
3. Quality of life and the urban sonic environment
How important is a suitable urban sonic environment in the overall
assessment of the quality of life of the inhabitants? The answer to this
question depends on the degree of urbanization and development of the
region under study (Luz, 2008). Therefore we will focus on the Flemish
context and base the answer on the above question on the SLO
('schriftelijk leefbaarheidsonderzoek') surveys conducted periodically by
the Flemish government (SLO, 2004). The leading question in this 5000
person survey refers to the overall contentment with the quality of life in
the neighborhood. A companion questions polls for reasons to encourage
or discourage friends to come and live in this neighborhood. Inspired by a
conceptual model such as the one shown in Figure 1, the answers to this
open question where recoded to the 16 basic components shown in Figure
1. The correlation between the frequency of mentioning each of these
factors and overall contentment is shown in Figure 2. It becomes clear that
noise is most often mentioned at the same time as high contentment or
discontentment. Bustle and subjective (traffic) safety also score quite high.
Health effects related to noise, air quality or accidents numbers are not
associated to the neighborhood by lay people. Moreover availability of
shopping, schools, (easy access to) work and recreation does not rate very
high, probably because these needs are taken for granted in our society.
The relative importance of environmental noise in overall rating of quality
of life was also observed in French research (Moser & Robin, 2006) where
noise was found to be as important as a cause of stress as serious illness of
a family member.
Figure 1: A conceptual model unraveling quality of life in the context of traffic
liveability - QoL
basic needs healthenvironmental
stressors social support
shoppin
g
schools
work
recr
eati
on
obje
ctiv
e sa
fety
air
qual
ity
nois
e ef
fect
s
nois
e
was
te
odor
indust
rial
saf
ety
vis
ual
bust
le
subje
ctiv
e sa
fety
crim
e
nei
ghborl
y s
upport

183
Figure 2: Correlation coefficient between mentioning each factor in a negative or positive
sense and overall contentment
Close to all studies in post-industrial countries such as Belgium confirm
that traffic is the most important contributor to environmental noise
(Miedema, 1998). Thus it comes as no surprise that the SLO studies (SLO,
2004) confirm that 14.1% of the Flemish population is highly or extremely
annoyed by traffic; neighbors are responsible for highly annoying 5.9% of
the population; recreation and tourism follows with 4.5%, industry and
SME with 4.3% and finally agriculture with 1.4%. Figure 3 confirms that
there is a strong relationship between reported traffic noise annoyance
(rated on a five point scale: not at all, a little, moderately, highly,
extremely) and reported overall contentment with the living environment
(reported on a five point scale: not at all content, not content, more or less
content, content, very content). This is to be expected given the dominance
of traffic noise amongst environmental noise categories.

184
Figure 3: Percentage of the population reporting different degrees of overall contentment
with the living environment as a function of the reported annoyance by road traffic noise
Is environmental noise an urban problem? Due to the concentration of
functions, traffic intensities are generally high near cities. This could
potentially lead to higher noise exposure levels in the urban area where
population density is often rather high as well. The chapter on the urban
area in MIRA (MIRA 2007c) compares high annoyance in the 13 large
Flemish cities with noise annoyance in the countryside and concludes that
the percentage of the population highly annoyed by noise is indeed
significantly higher in those 13 cities. A more detailed analysis
(Botteldooren et al., 2008) revealed that the current situation in Flanders is
slightly more complex. The percentage of the population living in highly
or very highly populated areas very close (less than 50m) to important
roads that is highly annoyed by road traffic noise is extremely high, over
32%. However, at slightly larger distances from the road this percentage
drops considerably, to 11%. This drop is less pronounced outside densely
populated areas with 30% highly annoyed close to the important road and
14% further away. The typical urban building structure discussed in the
next paragraphs is responsible for this. Thus one might conclude that the
influence of road traffic noise on quality of life is not in particular a
problem of the urban area, but it might indeed be different in urban areas
than in the open country.
0%
10%
20%
30%
40%
50%
60%
70%
80%
90%
100%
not at all a little moderately highly extremely
not al all c.
not content
more or less c.
content
very content
185
4. Urban planning and development
Urban planning an development has long discarded noise as a point of
concern. It was believed that environmental noise issues could best be
tackled after all geographic and visual planning of the city had been
finished or in the best case at the very end of the planning stage. Most
technical measures at the source are indeed still applicable then, but they
rarely are efficient in urban context. In the new perspective, sound is an
integral part of the urban setting and thus should be considered at the same
level of importance as visual esthetics.
4.1. Living areas with low exposure
Noise levels in general decrease quite rapidly as the distance to the source
is increased. In open area, near the source, noise levels drop by 6 dBA
with doubling of distance when the source is a well localized point and by
3 dBA with doubling of distance for a line source (a straight road for
example). In natural areas and parks, the ground acts as an acoustical
porous material. Sound propagating above such a material is strongly
attenuated over a certain frequency range. This so called ground effect can
result in a significant additional noise reduction. It does however require
that sound shears the ground and thus the positive effect vanishes under
several conditions: when strong temperature inversion or a wind gradient
bend the sound waves downward; when the sound propagates over a
valley; when the sound source is elevated for example on a bridge; when
the observer is elevated, for example living in a high rise building. In the
urban context, screening by buildings can reduce sound levels
considerably thus leading to a decrease with distance that is well above the
3 or 6 dBA rule mentioned above. This is why it is so important to
increase the distance between urban dwellings or recreational areas and
the source of noise: traffic. To take advantage of the additional ground
effect and screening by buildings, traffic routes are best planned as low as
possible within the 3-dimensional city.
In many Flemish cities and villages, road traffic is at the level of the
surrounding terrain and houses form a continuous screen along this sound
source. This explains why - as mentioned above - the percentage of highly
noise annoyed people drops considerably for houses somewhat further
away from the main roads. In the areal photograph of part of a city and the

186
corresponding noise map in Figure 4 it can be seen that some zoning
occurs naturally because of commerce and SME moving to the arterial
road but also that it is far from perfect.
Figure 4: Areal photograph (left) and corresponding noise map (right) for part of a city
4.2. Noise barrier buildings and quiet sides
The importance of a quiet side for perceived noise annoyance has been
mentioned in Section 2.1 Silent façades can be achieved in various ways.
A cluster of buildings, with a central courtyard is an interesting
configuration (Figure 5), and provides a large number of buildings with a
quiet side. A “noise barrier building” has both a quiet side and moderate
noise levels behind the most-exposed façade. Such a façade only has a
limited number of (acoustically highly insulated) windows. The silent (or
noise-sensitive) side on the other hand contains the necessary windows
and doors, balconies and gardens. Very efficient noise barrier buildings
could make use of a climbing earth berm against the most exposed-side.
When noise barrier buildings are connected together, their efficiency is
largely increases because side diffraction is prevented.
Gentb_curr
,30
30 - 35
35 - 40
40 - 45
45 - 50
50 - 55
55 - 60
60 - 65
65 - 70
70 - 75
75-80
80-85
No Data
Gebouw_scherm_hoogte.shp
Unknown Units: View1
N
EW
S
<Empty Text>

187
Figure 5: Two excerpts from a city noise map (Lden) showing building structure with
pronounced quiet side (left) and buildings where a quiet side is almost absent (right)
Vegetated roofs tops (green roofs) can help in achieving quiet façades.
The substrates used for both extensive (mostly granular material) and
intensive (uncompacted earth) green roofs have sound absorbing
properties. Sound diffracting over the roof will be attenuated more than
when it propagates over classical, acoustical hard roof coverage.
Numerical simulations (Van Renterghem & Botteldooren, 2008; Van
Renterghem & Botteldooren, 2009) showed the potential of using green
roofs to reduce the noise impact near buildings for example in the situation
shown in Figure 6. Important parameters in this respect are the sound
frequency, the layer thickness of the substrate, the building geometry, and
traffic related parameters like vehicle speed and vehicle type. Besides
reducing sound waves shearing over the building, a reduction in the
transmission of sound through the roof construction is obtained.
More generally, roof type and roof slope angle should be considered when
the sound pressure levels at non-directly exposed façades are of interest
(Van Renterghem & Botteldooren, 2009).
Gentb_curr
,30
30 - 35
35 - 40
40 - 45
45 - 50
50 - 55
55 - 60
60 - 65
65 - 70
70 - 75
75-80
80-85
No Data
Gebouw_scherm_hoogte.shp
Unknown Units: View1
N
EW
S
<Empty Text>
Gentb_curr
,30
30 - 35
35 - 40
40 - 45
45 - 50
50 - 55
55 - 60
60 - 65
65 - 70
70 - 75
75-80
80-85
No Data
Gebouw_scherm_hoogte.shp
Unknown Units: View1
N
EW
S
<Empty Text>
Gentb_curr
,30
30 - 35
35 - 40
40 - 45
45 - 50
50 - 55
55 - 60
60 - 65
65 - 70
70 - 75
75-80
80-85
No Data
Gebouw_scherm_hoogte.shp
Unknown Units: View1
N
EW
S
<Empty Text>

188
Figure 6: Example of a building geometry leading to a decrease in sound level at part of
the facade caused by the presence of a green roof
4.3. Street reverberation
Environmental noise heard in an environment with a long reverberation
time is often perceived as very annoying (Kang, 2000). A so-called street
canyon, i.e. a narrow street, enclosed by tall and connected buildings,
induces such long reverberation times. Such street geometries are typically
observed in the centers of (historically grown) European cities. Due to the
confinement of the sound in the street, the sound decay by geometrical
spreading is low (Figure 7). The road surface, the footway, and façades of
buildings mainly consist of acoustically rigid materials. This absence of
absorbing materials further increases the reverberation.
Besides specular reflection (also called mirror source reflection), a non-
flat surface also induces (to some degree) diffuse reflection. As a result,
the incident acoustical energy is spread over a range of directions, while
sound reflection from a fully flat surface is very directive. Architectural
ornaments, window sills, and protrusions and recessions by windows
increase diffuse reflection in a street. Large surfaces of glass are known as
specular elements. In case of diffuse reflection, part of the acoustical
energy is also reflected in upward and sideward direction. This allows
sound to leave the street canyon already after a limited number of diffuse
reflections which causes noise levels to drop and reverberation time to
shorten.
Increasing the absorption of façades largely reduces sound pressure levels
in the street (Van Renterghem et al., 2006). The (classical) porous

189
absorbing materials are often not suited for application near the façades
because they are not weather-resistant. A possible application of such
materials, however, is at the underside of balconies (Hothersall et al.,
1996). Vegetation near facades is another interesting option. By means of
new techniques it is possible to fix the necessary substrates at a few
centimeters from the walls. Given the large number of reflections between
the façades in a street canyon, and since such substrate are highly porous,
strong reductions of noise levels and street reverberation may be achieved.
Reducing extensive reflections in the street canyon also reduces noise
levels at the least exposed façade.
Figure 7: Wavefronts travelling back and fort in a street canyon after a short acoustic
pulse is emitted in the center of the canyon
5. Urban open space
Traditional noise control engineering has two main disadvantages when it
is solely applied in order to mitigate noise at more quiet urban areas with
recreational purposes, such as urban squares and parks. Firstly, the
traditional approach may result in a greying of the sonic environment,
because often black spots are targeted, at a disadvantage of the sound
pressure level at other places (Schafer, 1977). Secondly and more
importantly, noise control engineering is a negative approach: not all
sounds are noise, some sounds do fit well in some environments, and we
should strive to preserve these sounds rather than to eliminate them. A

190
more positive and holistic approach is needed, aimed at designing entire
environments that are pleasing to the ear.
5.1. Soundscape description
A high quality sonic environment can be defined as a sonic environment in
which there is a good match between the sounds that can be heard
(commonly referred to as the soundscape, as an analogy to the term
landscape), and the sounds that are expected. In other words, a high
quality soundscape contains lots of fitting sounds that can be clearly heard,
and less non-fitting sounds. Unfortunately, defining which sounds fit in a
given environment is a complex and interdisciplinary problem.
Understanding the factors which influence the perception of
environmental sounds forms the main subject of acoustic ecology, which
is the study of the interactions, mediated through sound, between humans
and their environment (Truax, 1978; Wrightson, 2000). Whereas
traditional noise control engineering solely involves physical measures,
acoustic ecology departs from a human-centered viewpoint.
Figure 8: Various factors in the perception of environmental sounds
loudness
spectral content temporal
content
information content
source location & movement
lighting
landscape & architectureother
people
temperature
humidity
odour
personal factors
activity & personal goals
personality traits
psychological state of mind

191
The perception of sounds, and as such their perceived degree of fit to the
environment, is determined by both sensory and personal factors (Job et
al., 1999). Sensory factors include auditory aspects, such as the loudness,
spectral, temporal and information content of the sound, visual aspects
such as the location and movement of the source (if it is visible), the
landscape and architecture, lightning, activities of other people, tactile
aspects such as temperature and humidity, and olfactory aspects. Personal
factors include traits such as noise sensitivity and attitude towards
different types of sources, the current activity and personal goals, and the
current emotional state. These various factors are visualized in Figure 8.
5.2. Planning and acoustic design
The visual aspect has been, up to now, the most important factor in the
design of urban parks and open spaces. However, including auditory
aspects and knowledge on perception of soundscapes in urban planning
and design, an approach often referred to as acoustic design, has great
potential (Brown & Muhar, 2004).
Urban public spaces can be designed to encourage activities which
generate unique sounds or soundmarks, that attract attention and reflect
traditional or cultural elements. A first example is music. Studies suggest
that the low frequency content in live music is often not loud enough to
mask traffic sound (Kang, 2007). High frequency components, on the
other hand, can make the music stand out from the background, making
the soundscape more pleasant. Another example is the sound from water
fountains. Altering flow methods and fountain design has proven to
provide great potential in shaping the spectrum of water features (Kang,
2007), making it an ideal instrument for attracting attention and masking
traffic noise. Adding greenery in well arranged spaces may enhance the
natural feeling of the environment and alter the sound pressure level
distribution, but may also attract songbirds. As a more drastic measure,
(camouflaged) loudspeakers can be introduced into the design, which
could play back fitting environmental sounds, such as singing birds in an
urban park (Lee et al., 2004).
Auralisation forms an important tool in acoustic design (Kleiner et al.,
1993; Fürjes et al., 2004). This technique aims at a realistic, artificial
simulation and reproduction of the various sound sources that can be heard

192
in a given environment, such as traffic, fountains, street music, human
voices etc., The full path that sounds travel, from emission at the source to
reception at the ear, is hereby modeled. Reflections and diffractions of
sound on objects has to be taken into account, as well as the Doppler
effect for moving sources or listeners. In order to achieve a realistic
representation, the auralisation should be accompanied with a (3D) visual
representation of the virtual environment.
Artificial soundscapes produced with the auralisation technique have still
to be listened to by human listeners in order to be able to assess their
quality, which limits the applicability of this approach. In the future,
models for automatic acoustic evaluation could replace the human listener.
Several approaches have already been suggested, such as artificial neural
network based models (Prante, 2001), or approaches that try to model the
human perception of sound in a bottom-up fashion, starting from basic
psychoacoustic and psychological principles (De Coensel & Botteldooren,
2007).
5.3. Assessment of quiet areas
Generally, a quiet area is defined as an area that is more quiet than the
surrounding region, and which has a psychological restoring effect on
people visiting it. There is a growing awareness that quiet areas deserve
special attention and preservation, and this goal has therefore been
subscribed in the Environmental Noise Directive of the European
Commission and in policy intentions of many countries. In line with the
ideas described above, an (urban) quiet area such as a park or open space,
does not imply the absence of sound (which would be silence). Rather, its
soundscape should be experienced as quiet by the average visitor. Quality
assessment methods for urban quiet areas have to reflect this principle; the
average sound pressure level is therefore less suited as the only indicator
to characterize quiet areas. Moreover, one should go beyond the use of
only quantitative approaches.
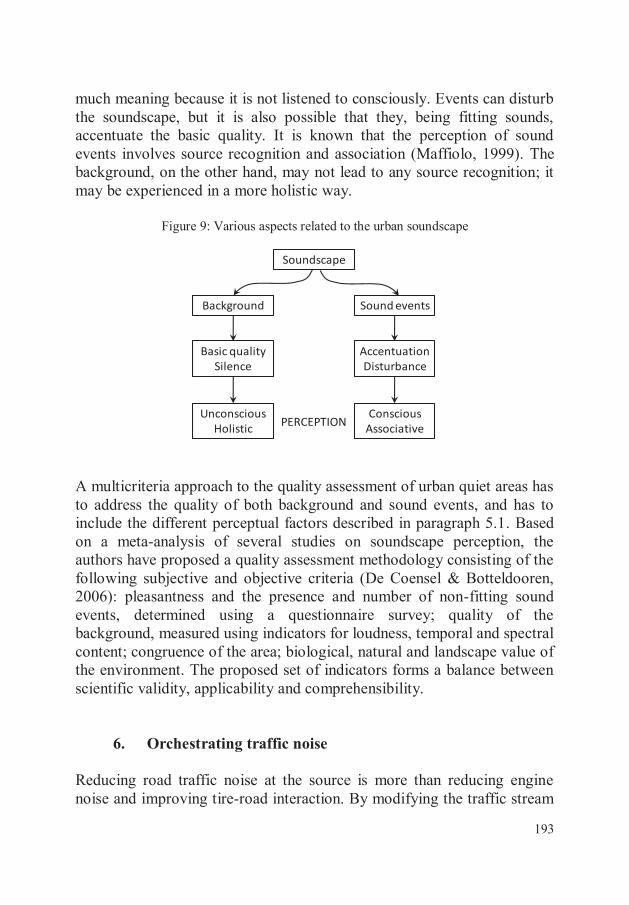
A starting point could be to consider the soundscape of urban quiet areas
as the superposition of an always present background and sound events
(Schafer, 1977). This subdivision is illustrated in Figure 9. The
background largely determines the overall feeling of quietness, and thus
the basic quality of the soundscape. It can be heard, but it does not trigger
193
much meaning because it is not listened to consciously. Events can disturb
the soundscape, but it is also possible that they, being fitting sounds,
accentuate the basic quality. It is known that the perception of sound
events involves source recognition and association (Maffiolo, 1999). The
background, on the other hand, may not lead to any source recognition; it
may be experienced in a more holistic way.
Figure 9: Various aspects related to the urban soundscape
A multicriteria approach to the quality assessment of urban quiet areas has
to address the quality of both background and sound events, and has to
include the different perceptual factors described in paragraph 5.1. Based
on a meta-analysis of several studies on soundscape perception, the
authors have proposed a quality assessment methodology consisting of the
following subjective and objective criteria (De Coensel & Botteldooren,
2006): pleasantness and the presence and number of non-fitting sound
events, determined using a questionnaire survey; quality of the
background, measured using indicators for loudness, temporal and spectral
content; congruence of the area; biological, natural and landscape value of
the environment. The proposed set of indicators forms a balance between
scientific validity, applicability and comprehensibility.
6. Orchestrating traffic noise
Reducing road traffic noise at the source is more than reducing engine
noise and improving tire-road interaction. By modifying the traffic stream
Soundscape
Background Sound events
Basic qualitySilence
AccentuationDisturbance
UnconsciousHolistic
ConsciousAssociative
PERCEPTION
194
itself, through careful traffic planning, many aspects of the urban sonic
environment can be tuned. Dynamics and temporal structure depend on
the pass by of individual cars, trucks, and motorcycles. Microscopic
management can help designing this detail of the soundscape. On a wider
spatial horizon, reorganizing traffic streams can be very useful.
6.1. Dynamics and temporal structure: microscopic
management
Strategic, large scale traffic management decisions, for example on the
scale of a city, are most often based on estimates of average traffic flow
through main roads. However, over the past decades, the awareness has
grown among traffic researchers that small-scale changes in infrastructure,
and even in driving behavior of individual vehicles, can have a large
influence on (macroscopic) traffic flow. A good example is the green
wave induced by the coordinated use of traffic lights at several successive
signalized intersections along a driving direction of a road. Also
stimulated by the growing availability of computing power, traffic
researchers and engineers are therefore more and more considering the use
of microscopic simulation models in their study of urban mobility
problems.
Microscopic models (micromodels in short) consider the exact location
and movement of individual vehicles over time, within an (urban)
environment that is modeled in high detail (locations of kerbs and stop
lines, exact size of intersections etc.). Behavior rules, such as the distance
to keep to the vehicle in front or when to change lanes, form the core of
the model. Micromodels allow traffic engineers to gain insight in the
course of complex phenomena such as the formation of jams or the
propagation of traffic density waves.
Micromodels have great potential as a tool in acoustic design of the urban
soundscape. When coupled with a noise emission model for single
vehicles and a detailed propagation model, micromodels allow to estimate
the (temporal structure of) peaks in the sound pressure level caused by
vehicle pass-bys (see De Coensel et al. (2005) for an example of this
approach). Figure 10 shows an example of the measured time-varying
sound pressure level at the kerbside of the Frederik Burvenichstraat in
Gentbrugge, Belgium, together with a simulated time series at the same

195
spot within a micromodel of the city of Gentbrugge. Note that there is
only a statistical similarity, not an exact one, because of the stochastic
nature of microsimulation models. Nevertheless, this approach allows to
estimate peak levels and statistical levels such as the median sound
pressure level with good accuracy. As such, the influence of detailed
traffic management measures, such as speed bumps, roundabouts or speed
control (Bendtsen & Larsen, 2006; Desarnaulds et al., 2004) and of sound
propagation measures such as inserting noise barriers, on the temporal
structure of the urban soundscape can be assessed.
More detailed study of auditory perception of car and truck passages
allowed to estimate the subjective annoyance (used as an opposite to
sound quality in this study) on the basis of specialized sound quality
measures (Rossberg, 2006): relative approach, peak loudness (5
percentile), and peak sharpness (5 percentile). Relative approach measures
abrupt changes in time of frequency. This sound quality approach is now
being extended to traffic streams as a whole. Micromodels create an
unsurpassed potential for tuning this sound quality using different traffic
measures.
Figure 10: Measured and simulated 5-minute time series of the sound pressure level
caused by traffic noise at the kerbside of the Frederik Burvenichstraat in Gentbrugge
during rush hour
Next to their use in modeling the time-varying sound pressure level in
urban environment, micromodels can also be applied in the assessment of
the impact of dynamic vehicle parameters, such as acceleration, on the

196
average sound pressure level. Urban intersections are an obvious point of
interest, because of the typical acceleration and deceleration pattern of
traffic near intersections. Classical traffic noise estimation models based
on average flows do not allow to take into account the acceleration or
deceleration of vehicles correctly, but they can be corrected based on more
detailed microsimulation results of traffic at and near intersections (De
Coensel et al., 2006, 2007).
6.2. Calming urban traffic: macroscopic management
Calming urban traffic in certain parts of the city is an alternative for
optimally locating dwellings: if you cannot move people away from
traffic, move traffic away from the living areas. This is not always as
straight forward as it seems at first sight. A drastic halving of traffic
intensity theoretically reduces overall noise levels by 3 dBA, but when
taking into account that the traffic will move more freely, hence faster, one
may end up with virtually no noise reduction. Depending on the strategy
for implementing the reduction of traffic intensity, local fleet composition
may change (e.g. more public busses due to private traffic charging). If
traffic calming measures are applied to particular road segments and / or
particular parts of the day (night ban, congestion charging) this may lead
to traffic increases on alternative roads and at alternative times of the day.
Careful traffic modeling with additional focus on day, evening and night
periods is needed to distinguish between noise reduction and noise
redistribution (Sundbergh and Algers, 2007). Unfortunately, current traffic
modeling exercises often neglect nightly traffic or only make rough
assumptions about it.
To quantify these observations, we present a few examples of simulated
traffic noise emission in this section. Three prototype roads are
considered: a highway (HW) of three lanes, a 2 by 2 lanes major road
(MR) with divided directions and a local road (LR) with 1 lane for each
direction. In addition, the three fleet compositions shown in Table 1 are
considered: Fleet 1 corresponds to the current situation in Belgium, Fleet 2
strongly promotes alternative fuels and Fleet 3 bans petrol and diesel from
cars all together. These alternative fleet may seem rather unrealistic, but
one should consider that they could correspond to the local situation in
parts of a city. Fleet 3 for example could correspond to part of a city where

197
classical fuel cars are strongly disencouraged. Still, implementing such
drastic scenarios would take several decades.
Table 1: Fleet compositions used in the model
Noise emission per vehicle is calculated based on the Harmonoise/Imagine
road traffic source model using traffic volume and speed as the main
parameters. The emission data are tuned to account for quieter propulsion
and corresponding lowering of rolling noise in hybrid and electric cars.
The latter is a positive side effect: it was observed that car manufacturers
opt for quiet tires on their hybrid cars. Capacity is estimated at HW:4590
veh/h, MR:2430 veh/h, and LR:1125 veh/h and average speed is deducted
from speed-capacity relationships counting one heavy vehicle as two cars
(Janssens, 1996). Average speed reduction due to congestion is entered in
the emission model rather than a more realistic speed distribution and
acceleration or deceleration that can be obtained from micro-simulation.
Simulation results are shown in Figure 11.
Fuel type petrol Diesel LPG CNG Hybrid Electric
Fleet 1 Cars 44.2% 54.5% 0.9% 0 0.4% 0
Light 44.2% 54.5% 0.9% 0 0.4% 0
Heavy 0 100% 0 0 0 0
Fleet 2 Cars 20.0% 20.0% 0 10.0% 25.0% 25.0%
Light 20.0% 20.0% 0 10.0% 25.0% 25.0%
Heavy 0 80.0% 0 0 20.0% 0
Fleet 3 Cars 0 0 0 25.0% 25.0% 50.0%
Light 0 0 0 25.0% 25.0% 50.0%
Heavy 0 50.0% 0 0 50.0% 0

198
Figure 11: Sound power level emitted by 100m of road (one driving direction) as a
function of traffic volume: for different driving speed (a), for different fleets on highway
and main road (c) and on local road (d), and for two scenarios of heavy traffic ban (b,
including day-evening-night weighting)
(a)
(b)
8486889092949698
100102104106108110112114116
20% 30% 40% 50% 60% 70% 80% 90% 100% 110%
Sound P
ow
er
Leve
l (1
00m
in d
BA
)
Number of vehicles (as percentage of total capacity)
HW: 120 km/h
HW: 110 km/h
HW: 100 km/h
HW: 90 km/h
MR: 90 km/h
MR: 80 km/h
MR: 70 km/h
LR: 60 km/h
LR: 50 km/h
LR: 40 km/h
LR: 30 km/h
88
90
92
94
96
98
100
102
104
1000 3000 5000 7000 9000 11000 13000 15000
Sound P
ow
er
Leve
l in
DE
N (
dB
A)
Total number of vehicles per day
basis
night ban
rush ban

199
(c)
(d)
From Figure 12a the significant effect of speed limit on noise emission
can be recognized. Note that the traffic volume is expressed relative to the
capacity of the different road prototypes and that the percentage of heavy
traffic differs amongst road types (HW: 15%, MR: 10%, LR: 5%). Road
saturation and corresponding lowering of traffic speed reduces noise
emission. This saturation effect was validated against long term
measurements along a Flemish highway in (VMM, 2007b). The rather flat
top of the curves explains why reducing traffic volumes not always leads
to expected sound level reduction.
The influence of fleet composition on noise emission is shown in Figure
12c for highway (speed limit 120km/h) and major road (speed limit 90km/
h) and in Figure 12d for local roads (speed limit 50km/h). As the
100
102
104
106
108
110
112
114
20% 30% 40% 50% 60% 70% 80% 90% 100% 110%
Sound P
ow
er
Leve
l (1
00m
in d
BA
)
Number of vehicles (as percentage of total capacity)
HW, Fleet 1: 20%
HW, Fleet 1: 10%
HW, Fleet 1: 5%
HW, Fleet 2: 20%
HW, Fleet 2: 10%
HW, Fleet 2: 5%
MR, Fleet 1: 20%
MR, Fleet 1: 10%
MR, Fleet 1: 5%
MR, Fleet 2: 20%
MR, Fleet 2: 10%
MR, Fleet 2: 5%
88
90
92
94
96
98
100
20% 30% 40% 50% 60% 70% 80%
Sound P
ow
er
Leve
l (1
00m
in d
BA
)
Number of vehicles (as percentage of total capacity)
Fleet 1: 15%
Fleet 1: 10%
Fleet 1: 5%
Fleet 2: 15%
Fleet 2: 10%
Fleet 2: 5%
Fleet 3: 15%
Fleet 3: 10%
Fleet 3: 5%

200
percentage of heavy traffic increases, noise emission increases since trucks
produce significantly more noise than cars. Closer to saturation, trucks
tend to slow down traffic and thus the overall noise emission depends less
on percentage of heavy traffic. The influence of rather drastic fleet
changes is significant, but comparable to effects of speed limit and
percentage of heavy goods traffic.
Figure 12b illustrates the positive effect of night (23:00 till 7:00) ban for
heavy vehicles on a local road (speed limit 50km/h, a realistic diurnal
pattern, and 10% of heavy traffic) on LW,den, the sound power penalized
with 10 dBA during the night and with 5 dBA during the evening. LW,den is
chosen because it relates directly to Lden, the noise immission indicator
that is used for quantifying noise annoyance in Europe. A night ban
reduces this emission parameter by a few dBA only when the overall
number of trucks per day remains unaffected by the ban. In contrast, a
rush hour (7:00 till 9:00) heavy traffic ban increases this emission
indicator due to shifting of part of the truck traffic to the night hours. As
explained in Section 2.1 increased noise levels at the end of the night may
even have a much stronger effect on sleep. This quantifies our concern
expressed at the beginning of this section.
7. Conclusions
Listening to the urban soundscape from a different perspective opens new
opportunities for improving the quality of life of urban dwellers. This
many facetted problem was touched upon in this contribution. Fine tuning
the goals of soundscape design may improve the real effect of our
endeavors observed in the population. Helped by modern computer
simulation, more aspects of traffic noise production and propagation can
be taken into account. This could lead to a more efficient use of traffic
noise measures in urban context.
References
Babisch, W., Beule, B., Schust, M., Kersten, N. and Ising, H. (2005) Traffic noise and
risk of myocardial infarction. Epidemiology, 16, 33-40.

201
Bendtsen, H. and Larsen, L. E. (2006) "Traffic management and noise." In Proceedings
of the 2006 International Congress and Exhibition on Noise Control Engineering
(Internoise), Honolulu, Hawaii, USA.
Botteldooren, D., De Coensel, B., and De Muer, T. (2006) "The temporal structure of urban soundscapes," Journal of Sound and Vibration 292, 105-123.
Botteldooren, D., Dekoninck, L. and Gillis, D. (2008) Zwarte punten voor geluidshinder
door straatverkeer in Vlaanderen. report steunpunt Mobiliteit en Openbare Werken,
spoor verkeersveiligheid.
Brown, A. L. and Muhar, A. (2004) "An approach to the acoustic design of outdoor
space." Journal of Environmental Planning and Management 47(6):827-842.
De Coensel, B. and Botteldooren, D. (2006) "The quiet rural soundscape and how to
characterize it." Acta Acustica united with Acustica 92(6):887-897.
De Coensel, B. and Botteldooren, D. (2007) "Models for soundscape perception and their
use in planning." In Proceedings of the 2007 International Congress and Exhibition on
Noise Control Engineering (Internoise), Istanbul, Turkey.
De Coensel, B., Botteldooren, D., Vanhove, F. and Logghe, S. (2007) "Microsimulation
based corrections on the road traffic noise emission near intersections." Acta Acustica
united with Acustica 93(2):241-252.
De Coensel, B., Vanhove, F., Logghe, S., Wilmink, I. and Botteldooren, D. (2006)
"Noise emission corrections at intersections based on microscopic traffic simulation." In
Proceedings of the European Conference on Noise Control (Euronoise), Tampere, Finland.
De Coensel, B., De Muer, T., Yperman, I. and Botteldooren, D. (2005) "The influence of
traffic flow dynamics on urban soundscapes." Applied Acoustics 66(2):175-194.
Desarnaulds, V., Monay, G. and Carvalho, A. (2004) "Noise Reduction by Urban Traffic
Management." In Proceedings of the International Congress on Acoustics (ICA), Kyoto,
Japan.
Dubois, D., Guastavino, C. and Raimbault, M. (2006) "A cognitive approach to urban
soundscapes: Using verbal data to access everyday life auditory categories," Acta
Acustica united with Acustica, 92 (6): 865-874.
Fürjes, A. T., Arató-Borsi, É. and Augusztinovicz, F. (2004) "Using auralisation as a tool
for subjective evaluation". In Proceedings of CFA/DAGA‘04, Strasbourg, France.
Griefahn, B., Bröde, P., Marks, A. and Basner, M. (2008a) "Autonomic arousals related
to traffic noise during sleep." Sleep 31(4):569-577.

202
Griefahn, B., Marks, A. and Robens, S. (2006) "Noise emitted from road, rail and air
traffic and their effects on sleep," Journal of Sound and Vibration 295: 129–140.
Griefahn, B., Marks, A. and Robens, S. (2008b) "Experiments on the time frame of
temporally limited traffic curfews to prevent noise induced sleep disturbances," Somnologie 12:140–148.
Heimann, D., de Franceschi, M., Emeis, S., Lercher, P. and Seibert, P. (Eds.) (2007) Air
Pollution, Traffic Noise and Related Health Effects in the Alpine Space − A Guide for
Authorities and Consulters.ALPNAP comprehensive report. Università degli Studi di
Trento, Dipartimento di Ingegneria Civile e Ambientale, Trento, Italy, 335 pp.
Hothersall, D., Horoshenkov, K. and Mercy, S. (1996) "Numerical modeling of the sound
field near a tall building with balconies near a road." Journal of Sound and Vibration 198
():507-515.
Janssens, R. en Marien, H. (1996) Het B4-submodel van het MIM: Toedeling op de weg, verslag DWTC Impulsprogramma “Transport en Mobiliteit”.
Job, R. F. S., Hatfield, J., Carter, N. L., Peploe, P., Taylor, R. and Morrell, S. (1999)
"Reaction to noise: the roles of soundscape, enviroscape and psychscape." In
Proceedings of the 1999 International Congress and Exhibition on Noise Control
Engineering (Internoise), Fort Lauderdale, Florida, USA.
Kang, J. (2000) "Sound propagation in street canyons: Comparison between diffusely and
geometrically reflecting boundaries." Journal of the Acoustical Society of America. 107
():1394-1404.
Kang, J. (2007) "A systematic approach towards intentionally planning and designing
soundscape in urban open public spaces." In Proceedings of the 2007 International
Congress and Exhibition on Noise Control Engineering (Internoise), Istanbul, Turkey.
Klaeboe, R. (2007) "Are adverse impacts of neighbourhood noisy areas the flip side of
quiet area benefits?," Applied Acoustics 68, 557-575.
Kleiner, M., Dalenbäck B. and Svensson, P. (1993) "Auralization – An overview."
Journal of the Audio Engineering Society 41(11):861-875.
Lee, T. G., Park, H. K. and Kim S. W. (2004) "An experimental study on the soundscape
of urban parks." In Proceedings of the 18th International Congress on Acoustics, Kyoto, Japan.
Luz, G. A., (2008) "Maslow‟s hierarchy of needs as a model for the process of the
development of national noise regulations," Proceedings of the 9th International
Congress on Noise as a Public Health Problem (ICBEN) 2008, Foxwoods, CT, USA.

203
Maffiolo, V., Castellengo, M. and Dubois, D. (1999) "Qualitative judgments of urban
soundscapes." In Proceedings of the 1999 International Congress and Exhibition on
Noise Control Engineering (Internoise), Fort Lauderdale, Florida, USA.
Miedema, H. M. E. and Vos, H. (1998) "Exposure-response relationships for transportation noise." Journal of the Acoustical Society of America 104(6):3432-3445.
Moser, G. and Robin, M. (2006) "Environmental annoyances:an urban-specific threat to
quality of life?" Revue européenne de psychologie appliquée 56: 35–41
Ohrstrom, E., Skanberg, A., Svensson, H. and Gidlof-Gunnarsson, A. (2006) "Effects of
road traffic noise and the benefit of access to quietness." Journal of Sound and Vibration
295():40-59.
Pedersen, S., Moller, H. and Persson Waye, K. (2007) "Indoor measurements of noise at
low frequencies - Problems and solutions." Journal of low frequency noise vibration and
active control. 22 (1): 249-270.
Prante, H. U. (2001) Modeling judgements of environmental sounds by means of artificial
neural networks. PhD Dissertation, Technical University of Berlin, Germany.
Raimbault, M., Lavandier, C. and Bérengier, M. (2003) "Ambient sound assessment of
urban environments: field studies in two French cities," Applied Acoustics 64 1241–1256.
Rossberg, S. (2006) Ranking of Noise Sources with Respect to Noise Perception,
deliverable 2.8 of QCity (Quiet City Transport) FP6-516420.
Schafer, R. M. (1977) The Tuning of the World. Knopf, New York, USA. SLO (2004), SLO1-meting: Eindverslag, Market Analysis & Synthesis in. Ministerie van
de Vlaamse Gemeenschap – Afdeling Algemeen Milieu- en Natuurbeleid.
Sundbergh, P. and Algers, S. (2007) Report on ranking of different noise source
mitigation measures, deliverable 2.15 of QCity (Quiet City Transport) FP6-516420.
Truax, B. (1978). Handbook for Acoustic Ecology. ARC Publications, Vancouver,
Canada.
van den Berg, A. E., Hartig, T. and Staats, H. (2007) "Preference for nature in urbanized
societies: Stress, restoration, and the pursuit of sustainability," Journal of Social Issues,
63 (1): 79-96.
Van Renterghem, T., Salomons, E. and Botteldooren, D. (2006) "Parameter study of
sound propagation between city canyons with coupled FDTD-PE model." Applied
Acoustics 67(6):487-510.
Van Renterghem, T. and Botteldooren, D. (2008) "Numerical evaluation of sound
propagating over green roofs." Journal of Sound and Vibration 317(3-5):781-799.

204
Van Renterghem, T. and Botteldooren, D. (2009) "Reducing the acoustical façade load
from road traffic with green roofs." Building and Environment (in press).
Vlaamse Milieumaatschappij (VMM) (2007a), Milieurapport Vlaanderen MIRAT 2007: Indicatorrapport.
Vlaamse Milieumaatschappij (VMM) (2007b), Milieurapport Vlaanderen MIRA –
Achtergronddocument - Thema Stedelijk hinder: lawaai.
Vlaamse Milieumaatschappij (VMM) (2007c), Milieurapport Vlaanderen MIRA –
Achtergronddocument - Thema Stedelijk milieu.
Wrightson, K. (2000). "An introduction to acoustic ecology." Soundscape 1(1) :10-13.