Embed Size (px)
Citation preview
s
THE U.S. DEPARTMENT OF THE TREASURY
[Pick the date]

U.S. Department of the Treasury | Fiscal Year 2012
39
U.S. Department of the Treasury | Fiscal Year 2012
PART II - TABLE OF CONTENTS
Message from the Acting Assistant Secretary for Management and Deputy Chief Financial Officer ...............................................41
Inspector General’s Transmittal Letter ............................................................................................................................................... 43
Independent Auditors’ Report on the Department’s Financial Statements ...................................................................................... 45
Management’s Response to Independent Auditor’s Report............................................................................................................... 55
Financial Statements
Consolidated Balance Sheets ............................................................................................................................................................... 56
Consolidated Statements of Net Cost .................................................................................................................................................. 58
Consolidated Statement of Changes in Net Position .......................................................................................................................... 59
Combined Statements of Budgetary Resources ...................................................................................................................................61
Statements of Custodial Activity ......................................................................................................................................................... 63
Notes to the Financial Statements
1. Summary of Significant Accounting Policies.................................................................................................................................. 64
2. Fund Balance................................................................................................................................................................................... 79
3. Loans and Interest Receivable – Intra-Governmental ...................................................................................................................81
4. Due from the General Fund and Due to the General Fund ........................................................................................................... 82
5. Cash, Foreign Currency, and Other Monetary Assets.................................................................................................................... 84
6. Gold and Silver Reserves, and Gold Certificates Issued to the Federal Reserve Banks ............................................................... 86
7. Troubled Asset Relief Program – Credit Program Receivables, Net............................................................................................. 87
8. Investments in Government Sponsored Enterprises .................................................................................................................... 98
9. Investments in International Financial Institutions ................................................................................................................... 103
10. Other Investments and Related Interest .................................................................................................................................... 103
11. Credit Program Receivables, Net................................................................................................................................................. 104
12. Reserve Position in the International Monetary Fund and Related Loans and Interest Receivable....................................... 109
13. Taxes, Interest and Other Receivables, Net.................................................................................................................................110
14. Property, Plant, and Equipment, Net ...........................................................................................................................................111
15. Non-Entity vs. Entity Assets..........................................................................................................................................................111
16. Federal Debt and Interest Payable............................................................................................................................................... 113
17. Other Debt and Interest Payable.................................................................................................................................................. 115
18. D.C. Pensions and Judicial Retirement Actuarial Liability ........................................................................................................ 115
19. Liabilities....................................................................................................................................................................................... 118
20. Net Position.................................................................................................................................................................................. 119
21. Consolidated Statements of Net Cost and Net Costs of Treasury Sub-Organizations.............................................................. 120
22. Additional Information Related to the Combined Statements of Budgetary Resources ..........................................................126
23. Collection and Disposition of Custodial Revenue...................................................................................................................... 130
24. Earmarked Funds.........................................................................................................................................................................132
25. Reconciliation of Net Cost of Operations to Budget ...................................................................................................................136
26. Non-TARP Investments in American International Group, Inc. ...............................................................................................137
27. Schedule of Fiduciary Activity .....................................................................................................................................................138
28. Commitments and Contingencies ...............................................................................................................................................139
Required Supplemental Information (Unaudited)............................................................................................................................143
40

U.S. Department of the Treasury | Fiscal Year 2012
41
MESSAGE FROM THE ACTING ASSISTANT SECRETARY FOR MANAGEMENT AND DEPUTY CHIEF FINANCIAL OFFICER
In fiscal year 2012, the Department of the Treasury advanced its commitment
to accomplish the following strategic goals:
• Repair and reform the financial system and support the recovery of the housing market
• Enhance U.S. competitiveness and promote international financial stability and balanced global growth
• Protect our national security through targeted financial actions
• Pursue comprehensive tax and fiscal reform
• Manage the U.S. Government’s finances in a fiscally responsible manner
These focus areas, and the continued promise to relentlessly pursue them, have improved the fiscal stewardship of the
American taxpayers’ resources, promoted the security and safety of our people at home and abroad, restored confidence
in our nation’s financial systems and stimulated economic and job growth. Through these efforts, Treasury will continue
to deliver better management of our nation’s finances and better results to the American taxpayer.
With an aggressive set of management programs and initiatives designed to manage the U.S. Government’s finances
responsibly, Treasury has led and supported government-wide financial management efforts to increase productivity,
reduce waste and non-essential expenses, and modernize processes and systems. Our comprehensive approach focused
on governing strategically, working smarter, and leveraging technology to address and support improvements across the
breadth and scope of the Department’s mission and functions. This agenda has led to enhanced decision-making and
ability to innovate and deliver a higher quality and volume of results.
With the economy continuing to recover, Treasury is winding down the Troubled Asset Relief Program (TARP). Treasury
now estimates the lifetime cost of the program will be $60 billion -- less than one-tenth of the $700 billion originally
authorized by Congress. TARP helped stabilize the economy during the financial crisis by helping restore the flow of
credit, save jobs, aid homeowners, and rescue the American auto industry. As of September 30, 2012, American
taxpayers have already recovered more than 88 percent of the TARP funds disbursed.
In efforts to make doing business with the U.S. Government as easy as possible, the Department is leading the U.S.
Government in implementing the use of electronic transactions with the public. In fiscal year 2012, 88 percent of
Treasury payments and associated information was made electronically. Through Treasury’s longstanding push towards
electronic payments, Treasury saved $600 million in costs in one year alone. As the number of Social Security recipients
increases, the savings from electronic payments will also increase while providing beneficiaries a safer, more reliable, and
convenient way to receive their payments.
Nani A. Coloretti Acting Assistant Secretary
for Management
Dorrice C. Roth Deputy Chief Financial
Officer
U.S. Department of the Treasury | Fiscal Year 2012
In fiscal year 2012, Treasury demonstrated leadership in fiscal prudence and financial reform by:
Advancing engagement of small businesses by exceeding all small business contracting goals to jump-start job
creation and stimulate local economies
Implementing a shared services approach to management by establishing the Shared Services Council which
provides a portfolio-wide approach to shared services across the Department to optimize services and drive
accountability
Further reducing administrative expenses as directed by the President’s Executive Order to cut waste, in which we
exceeded the 20 percent reduction goal a year early and garnered more than $241 million in savings
Delivering real property savings by better utilization of existing real property through space realignment efforts,
space reductions from increased employee telework arrangements, and the elimination of expiring leases, resulting
in an estimated $24 million in cumulative cost savings from fiscal years 2010 through 2012
Reducing time and materials/labor hour contracts by over ten percent from fiscal year 2011
Driving additional contracting savings estimated at over $240 million in savings in fiscal year 2012, including $80
million achieved through better leveraging of buying power
The Department again received an unqualified audit opinion on both the Treasury-wide and Office of Financial
Stability/TARP fiscal year 2012 financial statements. Treasury made steady progress toward resolving the three Federal
Managers’ Financial Integrity Act material weaknesses remaining open as of September 30, 2012 (IRS – Computer
Security, IRS – Unpaid Tax Assessments , and FMS – Preparation of the Government-wide Financial Statements). The
complexity of Treasury’s financial systems contributes greatly to these material weaknesses; however, we have made
great strides toward resolving the issues.
Nani A. Coloretti Dorrice C. Roth
Acting Assistant Secretary for Management Deputy Chief Financial Officer
November 15, 2012 November 15, 2012
42
U.S. Department of the Treasury | Fiscal Year 2012
INSPECTOR GENERAL’S TRANSMITTAL LETTER
OFFICE OF
INSPECTOR GENERAL
D E P AR T M EN T O F T H E T R E ASU R YWASHINGTON, D.C. 20220
November 15, 2012
INFORMATION MEMORANDUM FOR SECRETARY GEITHNER
FROM: Eric M. ThorsonInspector General
SUBJECT: Audit of the Department of the Treasury’s Financial Statements for FiscalYears 2012 and 2011
INTRODUCTION
I am pleased to transmit KPMG LLP’s report on the Department of the Treasury’s (the Department)financial statements as of and for the fiscal years (FY) ending September 30, 2012 and 2011.
The Chief Financial Officer’s Act, as amended, requires the Department of the Treasury Office ofInspector General or an independent auditor, as determined by the Inspector General, to audit theDepartment’s financial statements. Under a contract monitored by my office, KPMG LLP, anindependent certified public accounting firm, performed an audit of the Department’s FY 2012 and2011 financial statements. The contract required that the audit be performed in accordance withgenerally accepted government auditing standards issued by the Comptroller General of the UnitedStates; Office of Management and Budget Bulletin No. 07-04, Audit Requirements for FederalFinancial Statements, as amended; and the GAO/PCIE Financial Audit Manual.
RESULTS OF INDEPENDENT AUDIT
In its audit of the Department, KPMG LLP reported the following:
the financial statements were fairly presented, in all material respects, in conformity withU.S. generally accepted accounting principles;
a material weakness related to unpaid tax assessments and a significant deficiency related tofinancial reporting systems identified by the auditor of the Internal Revenue Servicecollectively represent a material weakness for the Department as a whole;
weaknesses related to information systems controls at the Bureau of the Fiscal Servicerepresent a significant deficiency for the Department as a whole;
43
U.S. Department of the Treasury | Fiscal Year 2012
the Department’s financial management systems did not substantially comply with therequirements of the Federal Financial Management Improvement Act of 1996 (FFMIA)related to Federal financial management systems requirements and applicable Federalaccounting standards; and
no instances of reportable noncompliance with laws and regulations , exclusive of FFMIA,that are required to be reported under government auditing standards and Office ofManagement and Budget Bulletin No. 07-04;
an instance of a potential Anti-deficiency Act violation related to voluntary servicesprovided to the Departmental Offices, also reported in the prior year report.
EVALUATION OF AUDITORS’ PERFORMANCE
To ensure the quality of the audit work performed, we reviewed KPMG LLP’s approach andplanning of the audit, evaluated the qualifications and independence of the auditors, monitored theprogress of the audit at key points, reviewed and accepted KPMG LLP’s audit report, andperformed other procedures that we deemed necessary. Additionally, we provide oversight of theaudits of financial statements and certain accounts and activities conducted at 12 component entitiesof the Department. Our review, as differentiated from an audit performed in accordance withgenerally accepted government auditing standards, was not intended to enable us to express, and wedo not express, an opinion on the financial statements or conclusions about the effectiveness ofinternal control or on whether the Department’s financial management systems substantiallycomplied with the Federal Financial Management Improvement Act or conclusions on compliancewith laws and regulations. KPMG LLP is responsible for the attached auditors’ report datedNovember 15, 2012, and the conclusions expressed in that report. However, our review disclosed noinstances where KPMG LLP did not comply, in all material respects, with generally acceptedgovernment auditing standards.
I appreciate the courtesies and cooperation extended to KPMG LLP and my staff during the audit.Should you or your staff have questions, you may contact me at (202) 622-1090 orMarla A. Freedman, Assistant Inspector General for Audit, at (202) 927-5400.
Attachment
cc: Nani A. ColorettiActing Assistant Secretary for Management
Dorrice C. RothDeputy Chief Financial Officer
44
Independent Auditors’ Report
Inspector General U.S. Department of the Treasury:
We have audited the accompanying consolidated balance sheets of the U.S. Department of the Treasury (Department) as of September 30, 2012 and 2011, and the related consolidated statements of net cost and changes in net position, combined statements of budgetary resources, and statements of custodial activity (hereinafter referred to as “consolidated financial statements” or “basic consolidated financial statements”) for the years then ended. The objective of our audits was to express an opinion on the fair presentation of these consolidated financial statements. We did not audit the amounts included in the consolidated financial statements related to the Internal Revenue Service (IRS) and the Office of Financial Stability (OFS), component entities of the Department. The financial statements of IRS and OFS were audited by another auditor whose reports have been provided to us. Our opinion, insofar as it relates to the amounts included for IRS and OFS, is based solely on the reports of the other auditor. In connection with our fiscal year 2012 audit, we also considered the Department’s internal control over financial reporting and tested the Department’s compliance with certain provisions of applicable laws, regulations, contracts, and grant agreements that could have a direct and material effect on these consolidated financial statements. This report includes our consideration of the results of the other auditor's testing of internal control over financial reporting and compliance and other matters for IRS and OFS that are reported on separately by the other auditor. However, this report, insofar as it relates to the results of the other auditor, is based solely on the reports of the other auditor. Summary As stated in our opinion on the consolidated financial statements, based on our audits and the reports of the other auditor, we concluded that the Department’s consolidated financial statements as of and for the years ended September 30, 2012 and 2011, are presented fairly, in all material respects, in conformity with U.S. generally accepted accounting principles. As discussed in our Opinion on the Financial Statements: • The Department is a participant in significant legislation and transactions whose purpose is
to assist in stabilizing the financial markets. The consolidated financial statements do not include the assets, liabilities, or results of operations of commercial entities in which the Department has a significant equity interest. The value of certain investments, loans, commitments, and asset guarantees is based on estimates that are inherently subject to
KPMG LLP is a Delaware limited liability partnership, the U.S. member firm of KPMG International Cooperative
(“KPMG International”), a Swiss entity.
KPMG LLP Suite 12000 1801 K Street, NW Washington, DC 20006
U .S. Department of the Treasury November 15, 2012 Page 2 of 10
substantial uncertainty. As such, there will be differences between the net estimated value of these investments, loans, commitments, and asset guarantees at September 30, 2012, and the amounts that will ultimately be realized from these assets or be required to pay to settle these commitments and guarantees.
• The Department changed the accounting for certain debt related budgetary transactions in fiscal year 2012.
• The Department changed its presentation for reporting the Combined Statement of Budgetary Resources in fiscal year 2012.
Our, and the other auditor’s, consideration of internal control over financial reporting resulted in identifying certain deficiencies that we consider to be a material weakness and other deficiencies that we consider to be a significant deficiency, as defined in the Internal Control Over Financial Reporting section of this report, as follows: A. Material Weakness in Internal Control Over Financial Reporting at the IRS (Repeat
Condition)
B. Significant Deficiency in Internal Control in Information Systems Controls at the Bureau of the Fiscal Service (Repeat Condition)
The results of our tests, and the tests performed by the other auditor, of compliance with certain provisions of laws, regulations, contracts, and grant agreements disclosed the following instance of noncompliance and other matter that are required to be reported under Government Auditing Standards, issued by the Comptroller General of the United States, and Office of Management and Budget (OMB) Bulletin No. 07-04, Audit Requirements for Federal Financial Statements, as amended. C. Noncompliance with Federal Financial Management Improvement Act of 1996 (Repeat
Condition)
D. Other Matter of Potential Violation of the Anti-Deficiency Act (Repeat Condition) The following sections discuss our opinion on the Department’s consolidated financial statements; our, and the other auditor’s, consideration of the Department’s internal control over financial reporting; our, and the other auditor’s tests of the Department’s compliance with certain provisions of applicable laws, regulations, contracts, and grant agreements; and management’s and our responsibilities.
U .S. Department of the Treasury November 15, 2012 Page 3 of 10
Opinion on the Financial Statements We have audited the accompanying consolidated balance sheets of the U.S. Department of the Treasury as of September 30, 2012 and 2011, and the related consolidated statements of net cost and changes in net position, the combined statements of budgetary resources, and statements of custodial activity for the years then ended. We did not audit the amounts included in the consolidated financial statements related to IRS, a component entity of the Department, which consist of total assets of $46.8 billion and $43.3 billion, net cost of operations of $12.8 billion and $13.0 billion before applicable eliminating entries, budgetary resources of $13.2 billion and $13.5 billion, and custodial revenues of $2,528 billion and $2,415 billion, as of and for the years ended September 30, 2012 and September 30, 2011, respectively. The IRS financial statements were audited by another auditor whose report dated November 5, 2012 has been furnished to us, and our opinion, insofar as it relates to the amounts included for IRS, is based solely on the report of the other auditor. We did not audit the amounts included in the consolidated financial statements related to OFS, a component entity of the Department, which consist of total assets of $116.7 billion and $164.2 billion, net cost of (income from) operations of ($7.7) billion and $9.5 billion before applicable eliminating entries, and budgetary resources of $67.8 billion and $103.0 billion, as of and for the years ended September 30, 2012 and September 30, 2011, respectively. The OFS financial statements were audited by another auditor whose report dated November 5, 2012 has been furnished to us, and our opinion, insofar as it relates to the amounts included for OFS, is based solely on the report of the other auditor. In our opinion, based on our audits, and the reports of the other auditor, the consolidated financial statements referred to above present fairly, in all material respects, the financial position of the U.S. Department of the Treasury as of September 30, 2012 and 2011, and its net costs, changes in net position, budgetary resources, and custodial activity for the years then ended, in conformity with U.S. generally accepted accounting principles. As discussed in Notes 7, 8, 11 and 26, the Department is a participant in significant legislation and transactions whose purpose is to assist in stabilizing the financial markets. Also as discussed in note 1A, the consolidated financial statements do not include the assets, liabilities, or results of operations of commercial entities in which the Department has a significant equity interest as it has determined that none of these entities meet the criteria for inclusion as a federal entity and are therefore not included in the consolidated financial statements. Furthermore, as discussed in notes 1V, 7, 8, and 11, the value of certain investments, loans, commitments, and asset guarantees is based on estimates. These estimates are inherently subject to substantial uncertainty arising from the likelihood of future changes in general economic, regulatory, and market conditions. In addition, there are significant uncertainties related to the amounts that the Department will realize from its investments. As such, there will be differences between the net estimated value of these investments, loans, commitments, and asset guarantees at September 30, 2012, and the amounts that will ultimately be realized from these assets or be required to pay to
U.S. Department of the Treasury November 15, 2012 Page 4 of 10
settle these commitments and guarantees. Such differences may be material and will also affect the ultimate cost of these programs. As discussed in Note 22 to the consolidated financial statements, the Department changed the accounting for certain debt related budgetary transactions based on guidance from OMB. As discussed in Note 1B to the consolidated financial statements, the Department changed its presentation for reporting the Combined Statement of Budgetary Resources in fiscal year 2012, based on new reporting requirements under OMB Circular No. A-136, Financial Reporting Requirements. As a result, the Department’s Combined Statement of Budgetary Resources for fiscal year 2011 has been reclassified to conform to the current year presentation. U.S. generally accepted accounting principles require that the information in the Management’s Discussion and Analysis, and Required Supplemental Information sections be presented to supplement the basic consolidated financial statements. Such information, although not a part of the basic consolidated financial statements, is required by the Federal Accounting Standards Advisory Board who considers it to be an essential part of financial reporting for placing the basic consolidated financial statements in an appropriate operational, economic, or historical context. We have applied certain limited procedures to the required supplementary information in accordance with auditing standards generally accepted in the United States of America, which consisted of inquiries of management about the methods of preparing the information and comparing the information for consistency with management’s responses to our inquiries, the basic consolidated financial statements, and other knowledge we obtained during our audits of the basic consolidated financial statements. We do not express an opinion or provide any assurance on the information because the limited procedures do not provide us with sufficient evidence to express an opinion or provide any assurance. Our audits were conducted for the purpose of forming an opinion on the basic consolidated financial statements as a whole. The information in the Message from the Secretary of the Treasury, the Message from the Acting Assistant Secretary for Management and the Deputy Chief Financial Officer, and Other Accompanying Information section is presented for the purposes of additional analysis and is not a required part of the basic consolidated financial statements. Such information has not been subjected to the auditing procedures applied in the audits of the basic consolidated financial statements, and accordingly, we do not express an opinion or provide any assurance on them. Internal Control Over Financial Reporting Our consideration of internal control over financial reporting was for the limited purpose described in the Responsibilities section of this report and was not designed to identify all deficiencies in internal control over financial reporting that might be deficiencies, significant deficiencies, or material weaknesses and therefore, there can be no assurance that all deficiencies, significant deficiencies, or material weaknesses have been identified.
U.S. Department of the Treasury November 15, 2012 Page 5 of 10
A deficiency in internal control exists when the design or operation of a control does not allow management or employees, in the normal course of performing their assigned functions, to prevent, or detect and correct misstatements on a timely basis. A material weakness is a deficiency, or a combination of deficiencies, in internal control such that there is a reasonable possibility that a material misstatement of the entity’s financial statements will not be prevented, or detected and corrected on a timely basis. A significant deficiency is a deficiency, or a combination of deficiencies, in internal control that is less severe than a material weakness, yet important enough to merit attention by those charged with governance. In our fiscal year 2012 audit, the other auditor identified deficiencies in internal control over financial reporting that we consider to be a material weakness and we identified other deficiencies that we consider to be a significant deficiency that are described below. A. Material Weakness in Internal Control Over Financial Reporting at the IRS (Repeat
Condition) IRS needs to establish internal controls for financial reporting and systems in accordance with OMB Circular A-123, Management’s Responsibility for Internal Control to ensure reliable and timely financial information is obtained, maintained, and reported. IRS continued to make progress in addressing its deficiencies in internal control over financial reporting. However, a material weakness in internal control over unpaid tax assessments and significant deficiency in internal control over financial reporting systems continued to exist in fiscal year 2012 and are collectively considered a material weakness at the Department level. The other auditor performed an audit of IRS’s internal control over financial reporting for the purpose of providing an opinion on the effectiveness of internal controls. Because of the material weakness, the other auditor’s opinion on IRS’s internal control over financial reporting stated that IRS did not maintain effective internal control over financial reporting as of September 30, 2012, and thus did not provide reasonable assurance that losses and misstatements that were material in relation to the IRS’s financial statements would be prevented or detected and corrected on a timely basis. The deficiencies are summarized as follows: • Internal control deficiencies continued to exist that caused errors in unpaid tax assessment
amounts. Specifically, the IRS was unable to 1) rely on its general ledger system for tax transactions and underlying subsidiary records to report federal taxes receivable, compliance assessments, and write-offs in accordance with federal accounting standards without significant compensating procedures, 2) trace reported balances for taxes receivable from its general ledger to underlying source documents, and 3) effectively prevent or timely detect and correct errors in taxpayer accounts.
• Internal control deficiencies over financial reporting systems continued to exist, including 1) access control weaknesses and database software issues related to its procurement system, and 2) inadequate database security for various systems. In addition, IRS had not performed sufficient monitoring of internal control over its financial reporting system. Furthermore,
U.S. Department of the Treasury November 15, 2012 Page 6 of 10
IRS did not always set sufficiently restrictive security-related parameters and users’ rights and privileges for certain operating environments, including a key financial application; allowed inappropriate and unlogged access to system files; and did not effectively manage certain privileged accounts on servers. Finally, IRS did not effectively implement all aspects of its information security program framework, and did not update the security standards policy for IRS’s main tax processing environment, to include current software versions and control capabilities.
Additional details related to the material weakness identified above have been provided separately to IRS management by the auditor of the IRS’s financial statements. Recommendation The other auditor separately provided IRS management with recommendations to address the above material weakness. We recommend that the Acting Assistant Secretary for Management (ASM) and Deputy Chief Financial Officer (DCFO) ensure that the IRS takes corrective action to improve controls over financial reporting. B. Significant Deficiency in Internal Control in Information Systems Controls at the
Bureau of the Fiscal Service (Repeat Condition) The Bureau of the Fiscal Service (BFS) was established on October 7, 2012, by consolidating the Financial Management Service and the Bureau of the Public Debt. BFS relies on an extensive array of information technology (IT) systems to perform its primary mission. Effective information system controls and security programs over its financial systems is essential to protecting information resources in accordance with OMB Circular No. A-130, Management of Federal Information Resources. BFS made progress in several areas in its efforts to address prior year deficiencies in its information systems controls. Despite these improvements, our tests revealed that the necessary policies and procedures to detect and correct control and functionality weaknesses have not been consistently documented, implemented, or enforced. Specifically, deficiencies continue to exist in the areas of 1) security management program, 2) access to computer resources (i.e., data, equipment, and facilities), 3) changes to information system resources and system configurations, 4) segregation of duties, and 5) contingency plans. These deficiencies could compromise BFS’s ability to ensure security over sensitive financial data and reliability of the financial systems. Recommendation We separately provided BFS management with recommendations to address the above significant deficiency. We recommend that the ASM and DCFO ensure that BFS takes corrective action to improve controls over its information system controls. Exhibit I presents the status of the prior year findings. We noted certain additional matters that we will report to management of the Department in a separate letter.
U.S. Department of the Treasury November 15, 2012 Page 7 of 10
Compliance and Other Matter The results of our tests of FFMIA, and the tests performed by the other auditor, disclosed instances, described below, where the Department’s financial management systems did not substantially comply with the (1) federal financial management systems requirements, and (2) applicable Federal accounting standards. The results of our tests of FFMIA, and the tests performed by the other auditor, disclosed no instances in which the Department’s financial management systems did not substantially comply with the United States Government Standard General Ledger at the transaction level. C. Noncompliance with Federal Financial Management Improvement Act of 1996 (Repeat
Condition) The Department’s financial management systems did not substantially comply with the following FFMIA requirements: 1. Federal Financial Management Systems Requirements As discussed in finding A. Material Weakness in Internal Control Over Financial Reporting at the IRS (Repeat Condition), the Department continues to have deficiencies in the IRS’s automated systems for tax-related transactions. 2. Federal Accounting Standards As discussed in finding A. Material Weakness in Internal Control Over Financial Reporting at the IRS (Repeat Condition), the Department has a material weakness related to the IRS that affected the Department’s ability to prepare its financial statements in accordance with federal accounting standards. Specifically, IRS automated systems for tax-related transactions did not support the net federal taxes receivable amount on the consolidated balance sheet and required supplementary information disclosures for uncollected taxes – compliance assessments and write-offs – as required by Statement of Federal Financial Accounting Standards No. 7, Accounting for Revenue and Other Financing Sources and Concepts for Reconciling Budgetary and Financial Accounting. Recommendation The other auditor separately provided IRS management with recommendations to address the above noncompliance with FFMIA. We recommend that the ASM and DCFO ensure that the IRS implements its remediation plan outlining actions to be taken to resolve noncompliance with the FFMIA requirements and the resources and responsible organizational units for such planned actions. Many of the IRS’s planned actions are long term in nature and are tied to IRS’s systems modernization efforts. The results of certain of our tests, and the tests performed by the other auditor, of compliance as described in the Responsibilities section of this report, exclusive of those referred to in the Federal Financial Management Improvement Act of 1996 (FFMIA), disclosed the following
U.S. Department of the Treasury November 15, 2012 Page 8 of 10
other matter that is required to be reported herein under Government Auditing Standards or OMB Bulletin No. 07-04. D. Other Matter of Potential Violation of the Anti-Deficiency Act (Repeat Condition) As stated in our prior year auditors’ report, the Department informed us of an instance of a potential violation of the Anti-Deficiency Act related to voluntary services provided to the Departmental Offices in the prior year. The Department is reviewing this matter to determine whether or not the matter is a violation of the Anti-Deficiency Act. The results of our other tests, and the tests performed by the other auditor, of compliance as described in the Responsibilities section of this report, exclusive of those referred to in FFMIA,
disclosed no instances of noncompliance or other matters that are required to be reported herein under Government Auditing Standards or OMB Bulletin No. 07-04. Department’s Response to Internal Control and Compliance Findings The Department indicated in a separate letter immediately following this report that it concurs with the findings presented in our report. Further, the Department responded that it will take corrective action, as necessary, to ensure the respective component management within the Department address the matters presented. We did not audit the Department’s response and, accordingly, we express no opinion on it.
* * * * * * * Responsibilities Management’s Responsibilities. Management is responsible for the consolidated financial statements; establishing and maintaining effective internal control over financial reporting; and complying with laws, regulations, contracts, and grant agreements applicable to the Department. Auditors’ Responsibilities. Our responsibility is to express an opinion on the fiscal year 2012 and 2011 consolidated financial statements of the Department based on our audits. We conducted our audits in accordance with auditing standards generally accepted in the United States of America; the standards applicable to financial audits contained in Government Auditing Standards, issued by the Comptroller General of the United States; and OMB Bulletin No. 07-04, as amended. Those standards and OMB Bulletin No. 07-04 require that we plan and perform the audits to obtain reasonable assurance about whether the consolidated financial statements are free of material misstatement. An audit includes consideration of internal control over financial reporting as a basis for designing audit procedures that are appropriate in the circumstances, but not for the purpose of expressing an opinion on the effectiveness of the Department’s internal control over financial reporting. Accordingly, we express no such opinion.
U.S. Department of the Treasury November 15, 2012 Page 9 of 10
An audit also includes: • Examining, on a test basis, evidence supporting the amounts and disclosures in the
consolidated financial statements; • Assessing the accounting principles used and significant estimates made by management;
and • Evaluating the overall consolidated financial statement presentation. We believe that our audits, and the reports of the other auditor related to the amounts included for IRS and OFS, provide a reasonable basis for our opinion. In planning and performing our fiscal year 2012 audit, we considered the Department’s internal control over financial reporting, by obtaining an understanding of the design effectiveness of the Department’s internal control, determining whether internal controls had been placed in operation, assessing control risk, and performing tests of controls as a basis for designing our auditing procedures for the purpose of expressing our opinion on the consolidated financial statements, but not for the purpose of expressing an opinion on the effectiveness of the Department’s internal control over financial reporting. Accordingly, we do not express an opinion on the effectiveness of the Department’s internal control over financial reporting. We did not test all controls relevant to operating objectives as broadly defined by the Federal Managers’ Financial Integrity Act of 1982. As part of obtaining reasonable assurance about whether the Department’s fiscal year 2012 consolidated financial statements are free of material misstatement, we performed tests of the Department’s compliance with certain provisions of laws, regulations, contracts, and grant agreements, noncompliance with which could have a direct and material effect on the determination of the consolidated financial statement amounts, and certain provisions of other laws and regulations specified in OMB Bulletin No. 07-04, including the provisions referred to in Section 803(a) of FFMIA. We limited our tests of compliance to the provisions described in the preceding sentence, and we did not test compliance with all laws, regulations, contracts, and grant agreements applicable to the Department. However, providing an opinion on compliance with laws, regulations, contracts, and grant agreements was not an objective of our audit and, accordingly, we do not express such an opinion.
______________________________
This report is intended solely for the information and use of the Department’s management, the Department’s Office of Inspector General, OMB, the U.S. Government Accountability Office, and the U.S. Congress and is not intended to be and should not be used by anyone other than these specified parties.
November 15, 2012
U.S. Department of the Treasury November 15, 2012 Page 10 of 10
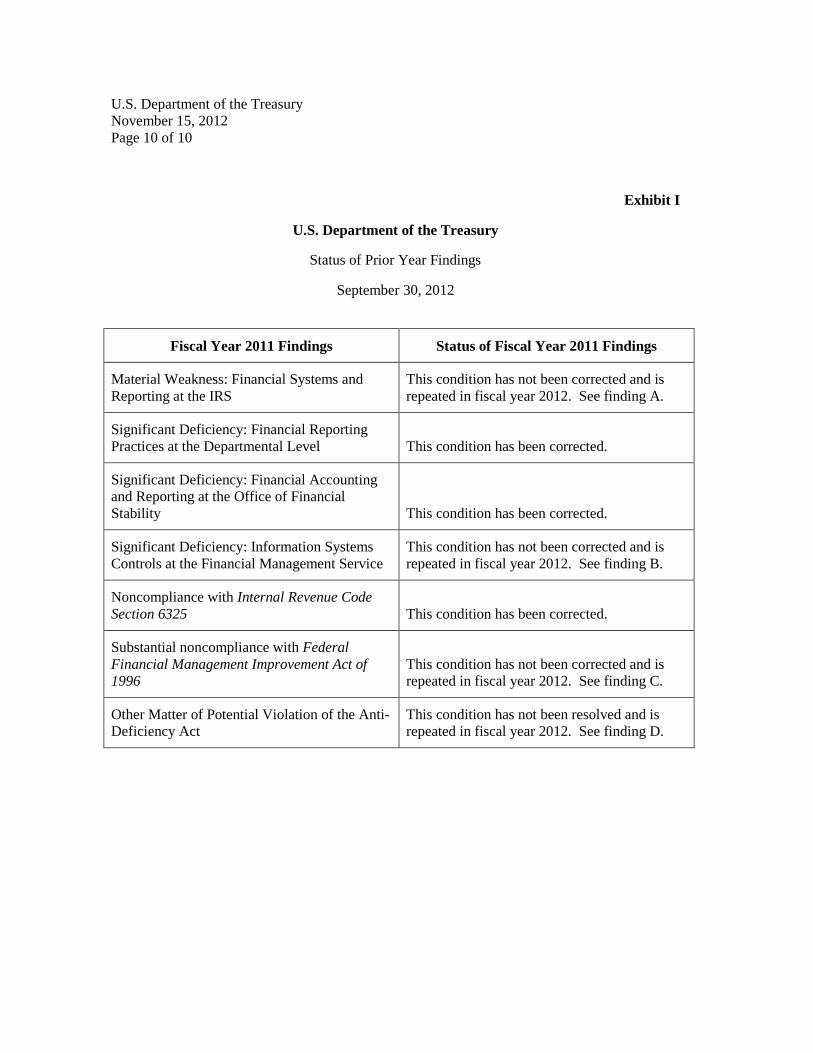
Exhibit I
U.S. Department of the Treasury
Status of Prior Year Findings
September 30, 2012
Fiscal Year 2011 Findings Status of Fiscal Year 2011 Findings
Material Weakness: Financial Systems and Reporting at the IRS
This condition has not been corrected and is repeated in fiscal year 2012. See finding A.
Significant Deficiency: Financial Reporting Practices at the Departmental Level This condition has been corrected.
Significant Deficiency: Financial Accounting and Reporting at the Office of Financial Stability This condition has been corrected.
Significant Deficiency: Information Systems Controls at the Financial Management Service
This condition has not been corrected and is repeated in fiscal year 2012. See finding B.
Noncompliance with Internal Revenue Code Section 6325 This condition has been corrected.
Substantial noncompliance with Federal Financial Management Improvement Act of 1996
This condition has not been corrected and is repeated in fiscal year 2012. See finding C.
Other Matter of Potential Violation of the Anti-Deficiency Act
This condition has not been resolved and is repeated in fiscal year 2012. See finding D.
U.S. Department of the Treasury | Fiscal Year 2012
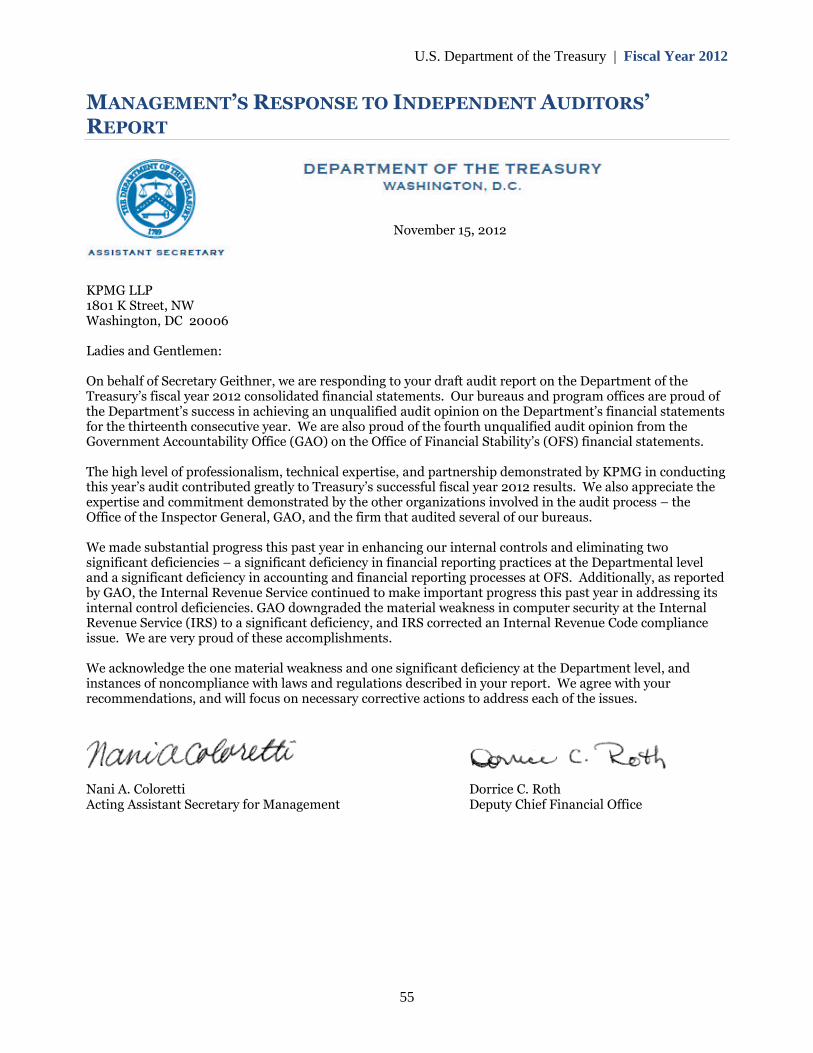
MANAGEMENT’S RESPONSE TO INDEPENDENT AUDITORS’REPORT
November 15, 2012
KPMG LLP1801 K Street, NWWashington, DC 20006
Ladies and Gentlemen:
On behalf of Secretary Geithner, we are responding to your draft audit report on the Department of theTreasury’s fiscal year 2012 consolidated financial statements. Our bureaus and program offices are proud ofthe Department’s success in achieving an unqualified audit opinion on the Department’s financial statementsfor the thirteenth consecutive year. We are also proud of the fourth unqualified audit opinion from theGovernment Accountability Office (GAO) on the Office of Financial Stability’s (OFS) financial statements.
The high level of professionalism, technical expertise, and partnership demonstrated by KPMG in conductingthis year’s audit contributed greatly to Treasury’s successful fiscal year 2012 results. We also appreciate theexpertise and commitment demonstrated by the other organizations involved in the audit process – theOffice of the Inspector General, GAO, and the firm that audited several of our bureaus.
We made substantial progress this past year in enhancing our internal controls and eliminating twosignificant deficiencies – a significant deficiency in financial reporting practices at the Departmental leveland a significant deficiency in accounting and financial reporting processes at OFS. Additionally, as reportedby GAO, the Internal Revenue Service continued to make important progress this past year in addressing itsinternal control deficiencies. GAO downgraded the material weakness in computer security at the InternalRevenue Service (IRS) to a significant deficiency, and IRS corrected an Internal Revenue Code complianceissue. We are very proud of these accomplishments.
We acknowledge the one material weakness and one significant deficiency at the Department level, andinstances of noncompliance with laws and regulations described in your report. We agree with yourrecommendations, and will focus on necessary corrective actions to address each of the issues.
Nani A. ColorettiActing Assistant Secretary for Management
Dorrice C. RothDeputy Chief Financial Office
55
U.S. Department of the Treasury | Fiscal Year 2012
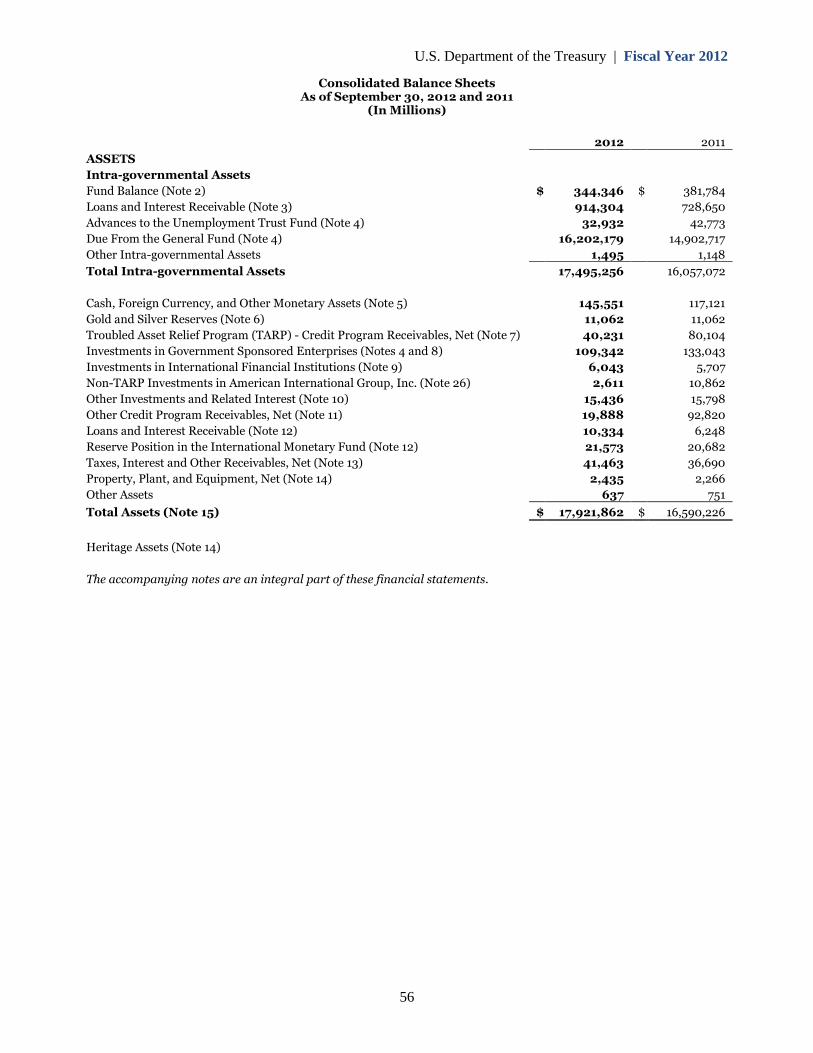
Consolidated Balance SheetsAs of September 30, 2012 and 2011
(In Millions)
ASSETS
2012 2011
Intra-governmental Assets
Fund Balance (Note 2) $ 344,346 $ 381,784
Loans and Interest Receivable (Note 3) 914,304 728,650
Advances to the Unemployment Trust Fund (Note 4) 32,932 42,773
Due From the General Fund (Note 4) 16,202,179 14,902,717
Other Intra-governmental Assets 1,495 1,148
Total Intra-governmental Assets 17,495,256 16,057,072
Cash, Foreign Currency, and Other Monetary Assets (Note 5) 145,551 117,121
Gold and Silver Reserves (Note 6) 11,062 11,062
Troubled Asset Relief Program (TARP) - Credit Program Receivables, Net (Note 7) 40,231 80,104
Investments in Government Sponsored Enterprises (Notes 4 and 8) 109,342 133,043
Investments in International Financial Institutions (Note 9) 6,043 5,707
Non-TARP Investments in American International Group, Inc. (Note 26) 2,611 10,862
Other Investments and Related Interest (Note 10) 15,436 15,798
Other Credit Program Receivables, Net (Note 11) 19,888 92,820
Loans and Interest Receivable (Note 12) 10,334 6,248
Reserve Position in the International Monetary Fund (Note 12) 21,573 20,682
Taxes, Interest and Other Receivables, Net (Note 13) 41,463 36,690
Property, Plant, and Equipment, Net (Note 14) 2,435 2,266
Other Assets 637 751
Total Assets (Note 15) $ 17,921,862 $ 16,590,226
Heritage Assets (Note 14)
The accompanying notes are an integral part of these financial statements.
56
U.S. Department of the Treasury | Fiscal Year 2012
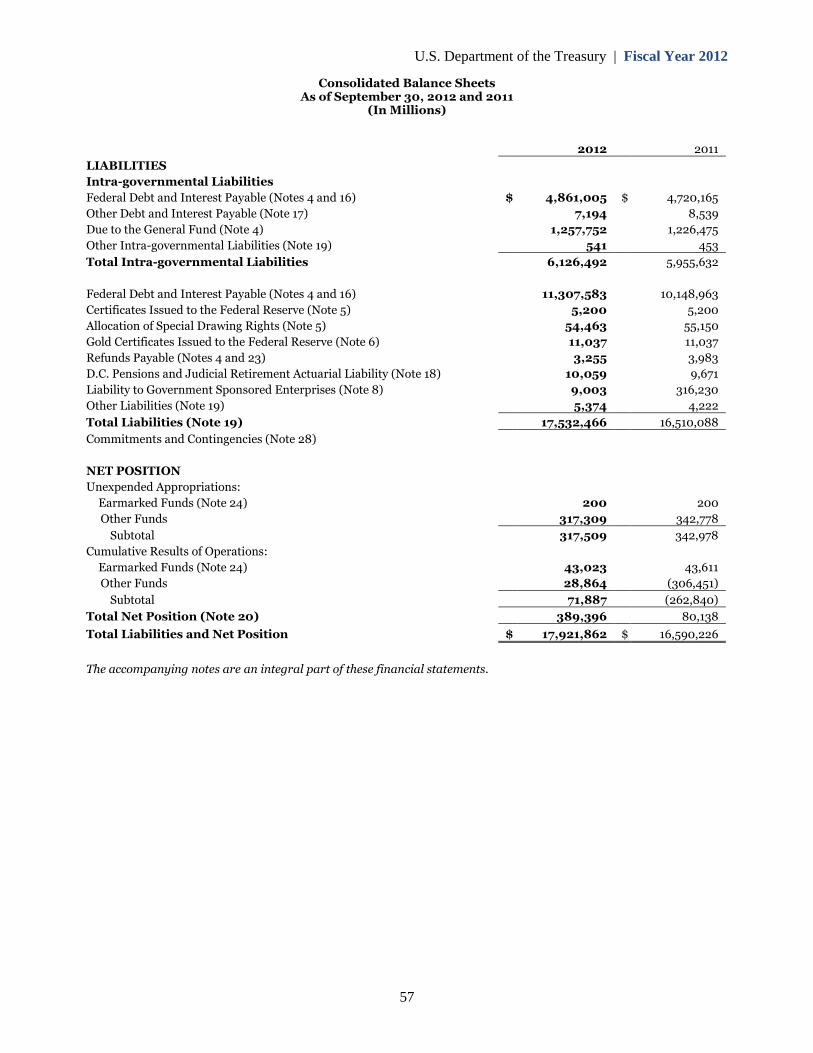
Consolidated Balance SheetsAs of September 30, 2012 and 2011
(In Millions)
LIABILITIES
2012 2011
Intra-governmental Liabilities
Federal Debt and Interest Payable (Notes 4 and 16) $ 4,861,005 $ 4,720,165
Other Debt and Interest Payable (Note 17) 7,194 8,539
Due to the General Fund (Note 4) 1,257,752 1,226,475
Other Intra-governmental Liabilities (Note 19) 541 453
Total Intra-governmental Liabilities 6,126,492 5,955,632
Federal Debt and Interest Payable (Notes 4 and 16) 11,307,583 10,148,963
Certificates Issued to the Federal Reserve (Note 5) 5,200 5,200
Allocation of Special Drawing Rights (Note 5) 54,463 55,150
Gold Certificates Issued to the Federal Reserve (Note 6) 11,037 11,037
Refunds Payable (Notes 4 and 23) 3,255 3,983
D.C. Pensions and Judicial Retirement Actuarial Liability (Note 18) 10,059 9,671
Liability to Government Sponsored Enterprises (Note 8) 9,003 316,230
Other Liabilities (Note 19) 5,374 4,222
Total Liabilities (Note 19) 17,532,466 16,510,088
Commitments and Contingencies (Note 28)
NET POSITION
Unexpended Appropriations:
Earmarked Funds (Note 24) 200 200
Other Funds 317,309 342,778
Subtotal 317,509 342,978
Cumulative Results of Operations:
Earmarked Funds (Note 24) 43,023 43,611
Other Funds 28,864 (306,451)
Subtotal 71,887 (262,840)
Total Net Position (Note 20)
Total Liabilities and Net Position $
389,396 80,138
17,921,862 $ 16,590,226
The accompanying notes are an integral part of these financial statements.
57
U.S. Department of the Treasury | Fiscal Year 2012
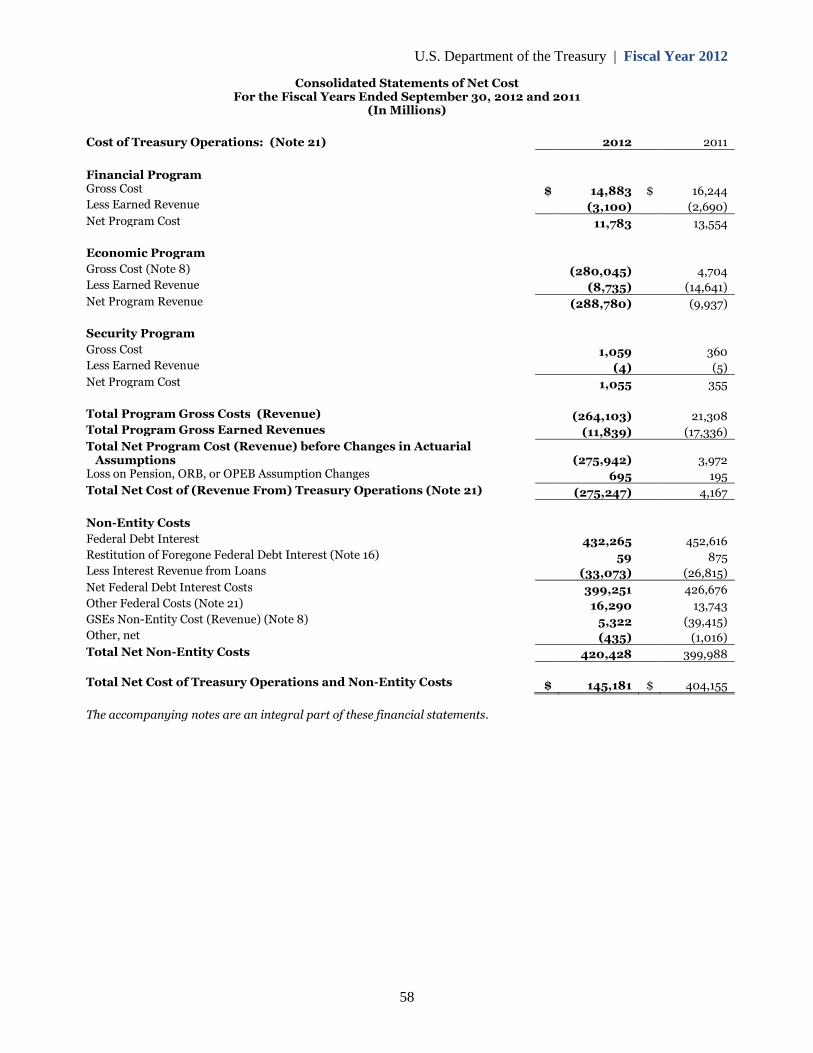
Consolidated Statements of Net Cost For the Fiscal Years Ended September 30, 2012 and 2011
(In Millions)
Cost of Treasury Operations: (Note 21) 2012 2011
Financial Program Gross Cost
Less Earned Revenue
Net Program Cost
$ 14,883
(3,100)
11,783
$ 16,244
(2,690)
13,554
Economic Program
Gross Cost (Note 8)
Less Earned Revenue
Net Program Revenue
(280,045)
(8,735)
(288,780)
4,704
(14,641)
(9,937)
Security Program
Gross Cost
Less Earned Revenue
Net Program Cost
1,059
(4)
1,055
360
(5)
355
Total Program Gross Costs (Revenue)
Total Program Gross Earned Revenues
Total Net Program Cost (Revenue) before Changes in Actuarial Assumptions
Loss on Pension, ORB, or OPEB Assumption Changes
Total Net Cost of (Revenue From) Treasury Operations (Note 21)
(264,103)
(11,839)
(275,942)
695
(275,247)
21,308
(17,336)
3,972
195
4,167
Non-Entity Costs
Federal Debt Interest
Restitution of Foregone Federal Debt Interest (Note 16)
Less Interest Revenue from Loans
Net Federal Debt Interest Costs
Other Federal Costs (Note 21)
GSEs Non-Entity Cost (Revenue) (Note 8)
Other, net
Total Net Non-Entity Costs
432,265
59
(33,073)
399,251
16,290
5,322
(435)
420,428
452,616
875
(26,815)
426,676
13,743
(39,415)
(1,016)
399,988
Total Net Cost of Treasury Operations and Non-Entity Costs $ 145,181 $ 404,155
The accompanying notes are an integral part of these financial statements.
58
U.S. Department of the Treasury | Fiscal Year 2012
59
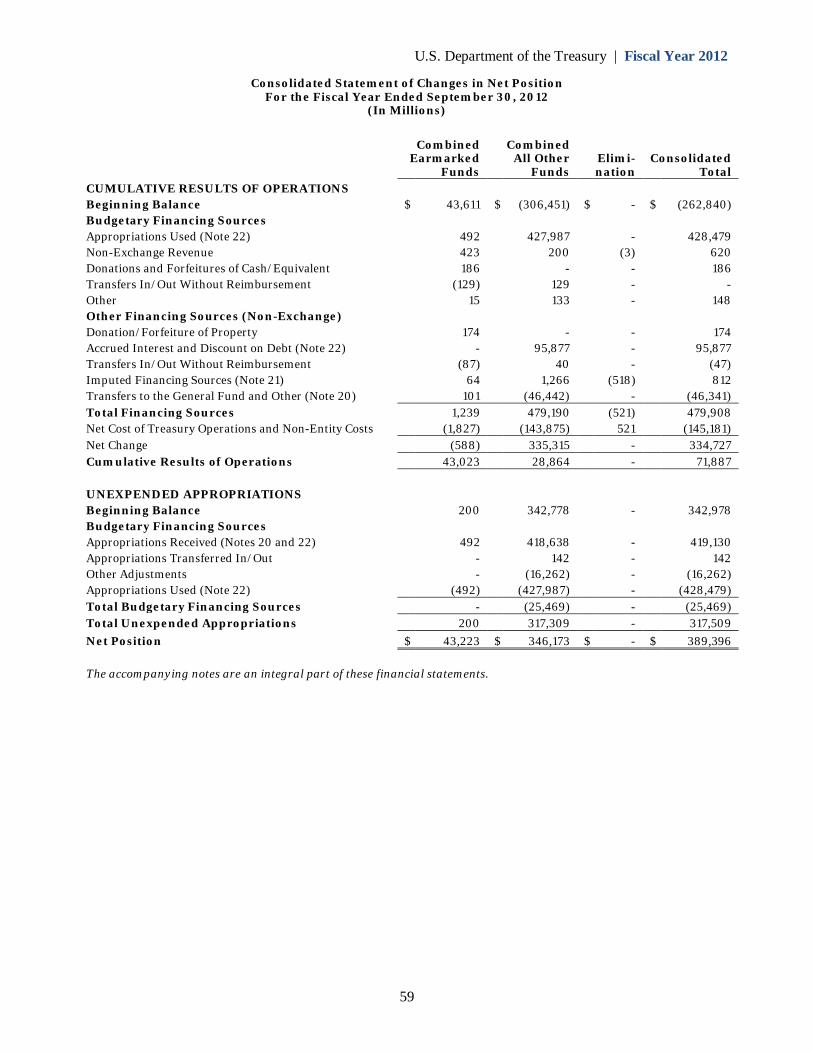
Consolidated Statement of Changes in Net Position For the Fiscal Year Ended September 30, 2012
(In Millions)
Combined Earmarked
Funds
Combined All Other
Funds Elimi-nation
Consolidated Total
CUMULATIVE RESULTS OF OPERATIONS Beginning Balance $ 43,611 $ (306,451) $ - $ (262,840) Budgetary Financing Sources
Appropriations Used (Note 22)
492
427,987
-
428,479 Non-Exchange Revenue
423
200
(3)
620
Donations and Forfeitures of Cash/Equivalent
186
-
-
186 Transfers In/Out Without Reimbursement
(129)
129
-
-
Other
15
133
-
148 Other Financing Sources (Non-Exchange)
Donation/Forfeiture of Property
174
-
-
174 Accrued Interest and Discount on Debt (Note 22)
-
95,877
-
95,877
Transfers In/Out Without Reimbursement
(87)
40
-
(47) Imputed Financing Sources (Note 21)
64
1,266
(518)
812
Transfers to the General Fund and Other (Note 20) 101 (46,442) - (46,341) Total Financing Sources
1,239
479,190
(521)
479,908
Net Cost of Treasury Operations and Non-Entity Costs (1,827) (143,875) 521 (145,181) Net Change (588) 335,315 - 334,727 Cumulative Results of Operations 43,023 28,864 - 71,887 UNEXPENDED APPROPRIATIONS
Beginning Balance
200
342,778
-
342,978 Budgetary Financing Sources
Appropriations Received (Notes 20 and 22)
492
418,638
-
419,130 Appropriations Transferred In/Out
-
142
-
142
Other Adjustments
-
(16,262)
-
(16,262) Appropriations Used (Note 22) (492) (427,987) - (428,479) Total Budgetary Financing Sources - (25,469) -
(25,469)
Total Unexpended Appropriations 200 317,309 - 317,509 Net Position $ 43,223 $ 346,173 $ - $ 389,396 The accompanying notes are an integral part of these financial statements.
U.S. Department of the Treasury | Fiscal Year 2012
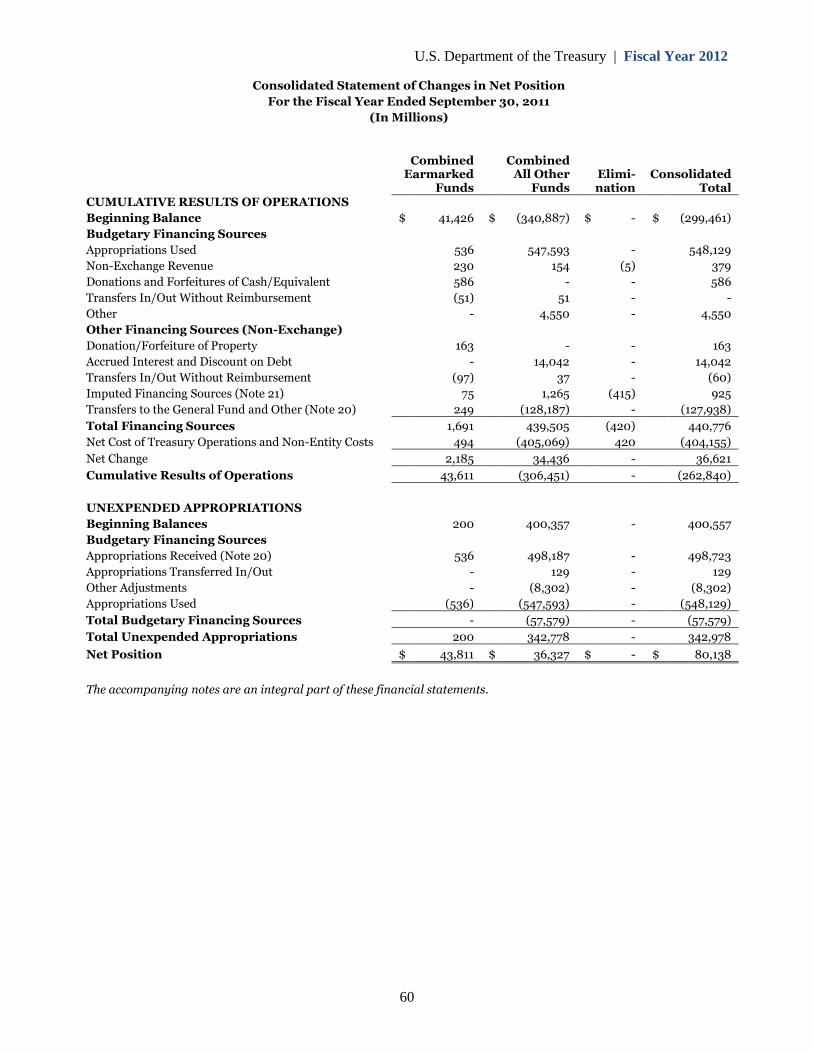
Consolidated Statement of Changes in Net Position
For the Fiscal Year Ended September 30, 2011
(In Millions)
Combined CombinedEarmarked All Other Elimi- Consolidated
Funds FundsCUMULATIVE RESULTS OF OPERATIONS
nation Total
Beginning Balance $ 41,426 $ (340,887) $ - $ (299,461)
Budgetary Financing Sources
Appropriations Used 536 547,593 - 548,129
Non-Exchange Revenue 230 154 (5) 379
Donations and Forfeitures of Cash/Equivalent 586 - - 586
Transfers In/Out Without Reimbursement (51) 51 - -
Other - 4,550 - 4,550
Other Financing Sources (Non-Exchange)
Donation/Forfeiture of Property 163 - - 163
Accrued Interest and Discount on Debt - 14,042 - 14,042
Transfers In/Out Without Reimbursement (97) 37 - (60)
Imputed Financing Sources (Note 21) 75 1,265 (415) 925
Transfers to the General Fund and Other (Note 20) 249 (128,187) - (127,938)
Total Financing Sources 1,691 439,505 (420) 440,776
Net Cost of Treasury Operations and Non-Entity Costs 494 (405,069) 420 (404,155)
Net Change 2,185 34,436 - 36,621
Cumulative Results of Operations 43,611 (306,451) - (262,840)
UNEXPENDED APPROPRIATIONS
Beginning Balances 200 400,357 - 400,557
Budgetary Financing Sources
Appropriations Received (Note 20) 536 498,187 - 498,723
Appropriations Transferred In/Out - 129 - 129
Other Adjustments - (8,302) - (8,302)
Appropriations Used (536) (547,593) - (548,129)
Total Budgetary Financing Sources - (57,579) - (57,579)
Total Unexpended Appropriations 200 342,778
Net Position $ 43,811 $ 36,327
- 342,978
$ - $ 80,138
The accompanying notes are an integral part of these financial statements.
60
U.S. Department of the Treasury | Fiscal Year 2012
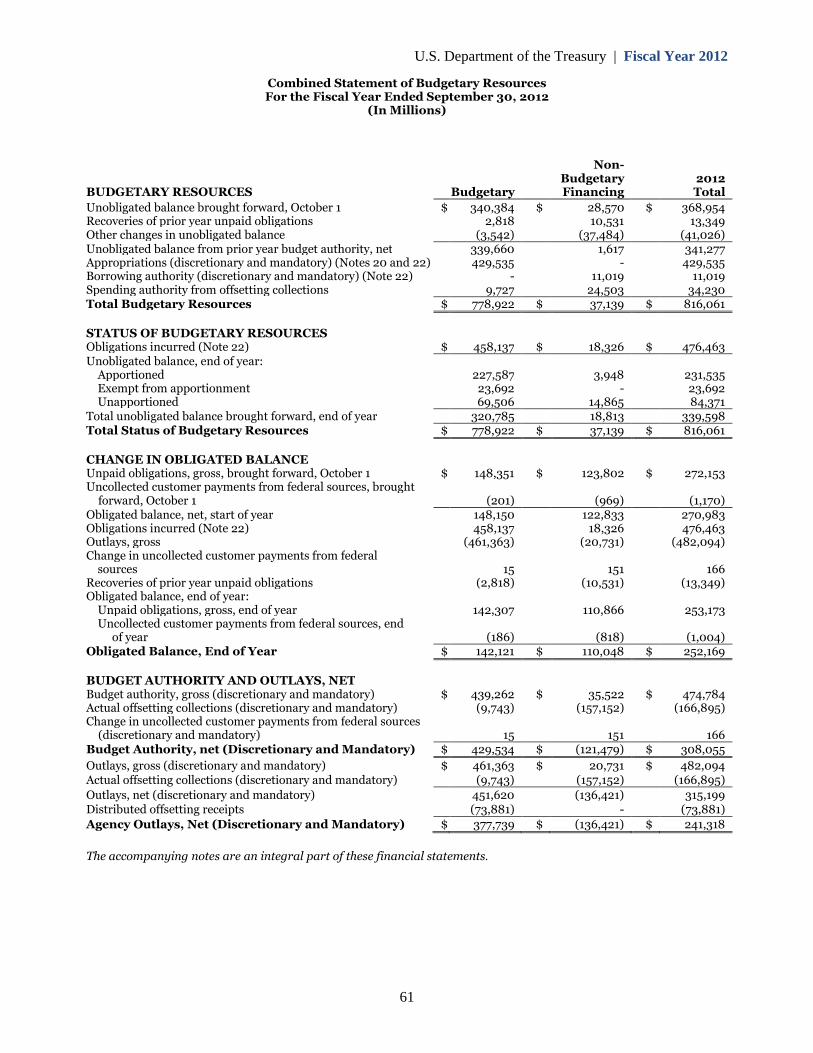
Combined Statement of Budgetary ResourcesFor the Fiscal Year Ended September 30, 2012
(In Millions)
Non-Budgetary 2012
BUDGETARY RESOURCES Budgetary Financing Total
Unobligated balance brought forward, October 1 $ 340,384 $ 28,570 $ 368,954Recoveries of prior year unpaid obligations 2,818 10,531 13,349Other changes in unobligated balance (3,542) (37,484) (41,026)Unobligated balance from prior year budget authority, net 339,660 1,617 341,277Appropriations (discretionary and mandatory) (Notes 20 and 22) 429,535 - 429,535Borrowing authority (discretionary and mandatory) (Note 22) - 11,019 11,019Spending authority from offsetting collections 9,727 24,503 34,230Total Budgetary Resources $ 778,922 $ 37,139 $ 816,061
STATUS OF BUDGETARY RESOURCESObligations incurred (Note 22) $ 458,137 $ 18,326 $ 476,463Unobligated balance, end of year:
Apportioned 227,587 3,948 231,535Exempt from apportionment 23,692 - 23,692Unapportioned 69,506 14,865 84,371
Total unobligated balance brought forward, end of year 320,785 18,813 339,598Total Status of Budgetary Resources $ 778,922 $ 37,139 $ 816,061
CHANGE IN OBLIGATED BALANCEUnpaid obligations, gross, brought forward, October 1 $ 148,351 $ 123,802 $ 272,153Uncollected customer payments from federal sources, brought
forward, October 1 (201) (969) (1,170)Obligated balance, net, start of year 148,150 122,833 270,983Obligations incurred (Note 22) 458,137 18,326 476,463Outlays, gross (461,363) (20,731) (482,094)Change in uncollected customer payments from federal
sources 15 151 166Recoveries of prior year unpaid obligations (2,818) (10,531) (13,349)Obligated balance, end of year:
Unpaid obligations, gross, end of year 142,307 110,866 253,173Uncollected customer payments from federal sources, end
of year (186) (818) (1,004)Obligated Balance, End of Year $ 142,121 $ 110,048 $ 252,169
BUDGET AUTHORITY AND OUTLAYS, NETBudget authority, gross (discretionary and mandatory) $ 439,262 $ 35,522 $ 474,784Actual offsetting collections (discretionary and mandatory) (9,743) (157,152) (166,895)Change in uncollected customer payments from federal sources
(discretionary and mandatory) 15 151 166Budget Authority, net (Discretionary and Mandatory) $ 429,534 $ (121,479) $ 308,055
Outlays, gross (discretionary and mandatory) $ 461,363 $ 20,731 $ 482,094Actual offsetting collections (discretionary and mandatory) (9,743) (157,152) (166,895)
Outlays, net (discretionary and mandatory) 451,620 (136,421) 315,199Distributed offsetting receipts (73,881)
Agency Outlays, Net (Discretionary and Mandatory) $ 377,739 $
- (73,881)
(136,421) $ 241,318
The accompanying notes are an integral part of these financial statements.
61
U.S. Department of the Treasury | Fiscal Year 2012
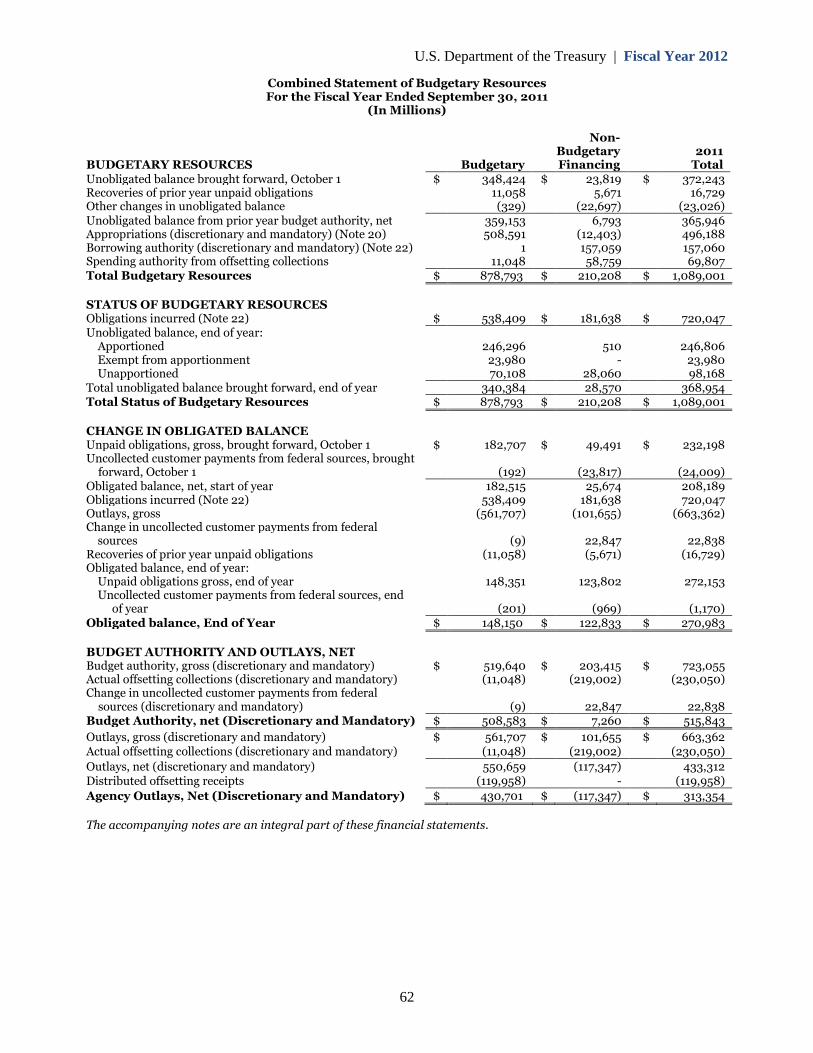
of Budgetary ResourcesCombined StatementFor the Fiscal Year Ended September 30, 2011
(In Millions)
Non-Budgetary 2011
BUDGETARY RESOURCES Budgetary Financing TotalUnobligated balance brought forward, October 1 $ 348,424 $ 23,819 $ 372,243Recoveries of prior year unpaid obligations 11,058 5,671 16,729Other changes in unobligated balance (329) (22,697) (23,026)Unobligated balance from prior year budget authority, net 359,153 6,793 365,946Appropriations (discretionary and mandatory) (Note 20) 508,591 (12,403) 496,188Borrowing authority (discretionary and mandatory) (Note 22) 1 157,059 157,060Spending authority from offsetting collections 11,048 58,759 69,807Total Budgetary Resources $ 878,793 $ 210,208 $ 1,089,001
STATUS OF BUDGETARY RESOURCESObligations incurred (Note 22) $ 538,409 $ 181,638 $ 720,047Unobligated balance, end of year:
Apportioned 246,296 510 246,806Exempt from apportionment 23,980 - 23,980Unapportioned 70,108 28,060 98,168
Total unobligated balance brought forward, end of year 340,384 28,570 368,954Total Status of Budgetary Resources $ 878,793 $ 210,208 $ 1,089,001
CHANGE IN OBLIGATED BALANCEUnpaid obligations, gross, brought forward, October 1 $ 182,707 $ 49,491 $ 232,198Uncollected customer payments from federal sources, brought
forward, October 1 (192) (23,817) (24,009)Obligated balance, net, start of year 182,515 25,674 208,189Obligations incurred (Note 22) 538,409 181,638 720,047Outlays, gross (561,707) (101,655) (663,362)Change in uncollected customer payments from federal
sources (9) 22,847 22,838Recoveries of prior year unpaid obligations (11,058) (5,671) (16,729)Obligated balance, end of year:
Unpaid obligations gross, end of year 148,351 123,802 272,153Uncollected customer payments from federal sources, end
of year (201) (969) (1,170)Obligated balance, End of Year $ 148,150 $ 122,833 $ 270,983
BUDGET AUTHORITY AND OUTLAYS, NETBudget authority, gross (discretionary and mandatory) $ 519,640 $ 203,415 $ 723,055Actual offsetting collections (discretionary and mandatory) (11,048) (219,002) (230,050)Change in uncollected customer payments from federal
sources (discretionary and mandatory) (9) 22,847 22,838Budget Authority, net (Discretionary and Mandatory) $ 508,583 $ 7,260 $ 515,843
Outlays, gross (discretionary and mandatory) $ 561,707 $ 101,655 $ 663,362Actual offsetting collections (discretionary and mandatory) (11,048) (219,002) (230,050)
Outlays, net (discretionary and mandatory) 550,659 (117,347) 433,312Distributed offsetting receipts (119,958)
Agency Outlays, Net (Discretionary and Mandatory) $ 430,701 $
- (119,958)
(117,347) $ 313,354
The accompanying notes are an integral part of these financial statements.
62
U.S. Department of the Treasury | Fiscal Year 2012
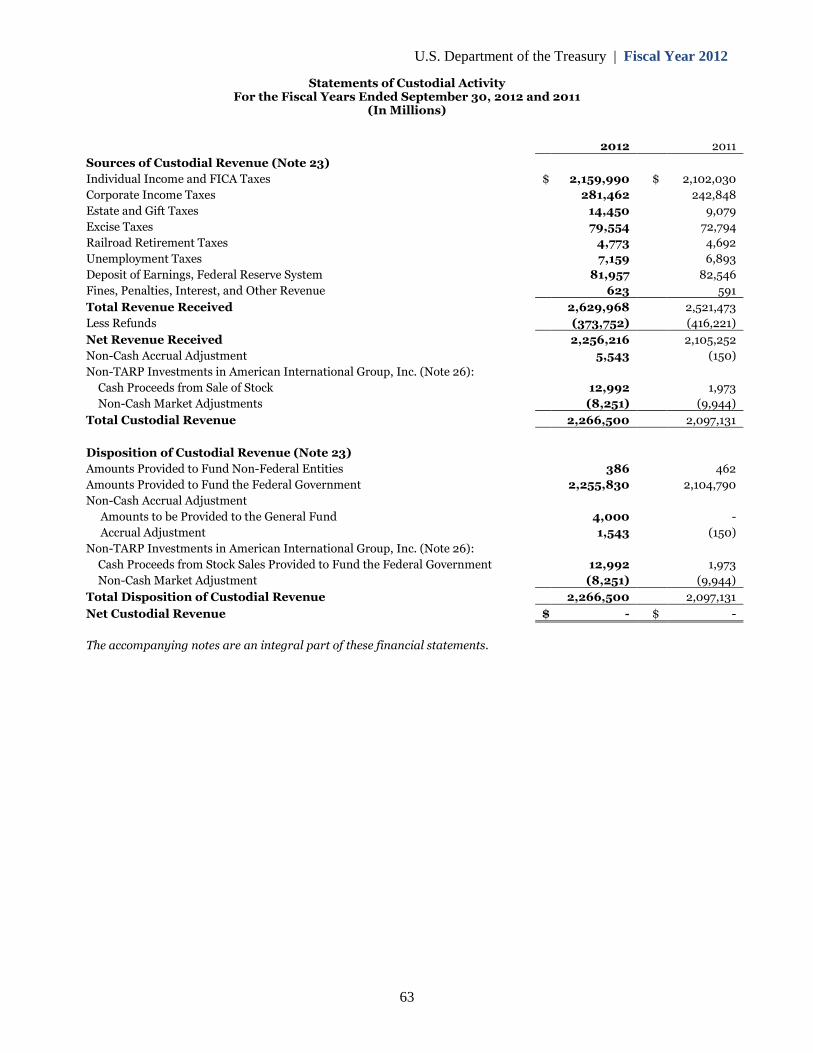
Statements of Custodial ActivityFor the Fiscal Years Ended September 30, 2012 and 2011
(In Millions)
2012
Sources of Custodial Revenue (Note 23)
2011
Individual Income and FICA Taxes $ 2,159,990 $ 2,102,030
Corporate Income Taxes 281,462 242,848
Estate and Gift Taxes 14,450 9,079
Excise Taxes 79,554 72,794
Railroad Retirement Taxes 4,773 4,692
Unemployment Taxes 7,159 6,893
Deposit of Earnings, Federal Reserve System 81,957 82,546
Fines, Penalties, Interest, and Other Revenue 623 591
Total Revenue Received 2,629,968 2,521,473
Less Refunds (373,752) (416,221)
Net Revenue Received 2,256,216 2,105,252
Non-Cash Accrual Adjustment 5,543 (150)
Non-TARP Investments in American International Group, Inc. (Note 26):
Cash Proceeds from Sale of Stock 12,992 1,973
Non-Cash Market Adjustments (8,251) (9,944)
Total Custodial Revenue 2,266,500 2,097,131
Disposition of Custodial Revenue (Note 23)
Amounts Provided to Fund Non-Federal Entities 386 462
Amounts Provided to Fund the Federal Government 2,255,830 2,104,790
Non-Cash Accrual Adjustment
Amounts to be Provided to the General Fund 4,000 -
Accrual Adjustment 1,543 (150)
Non-TARP Investments in American International Group, Inc. (Note 26):
Cash Proceeds from Stock Sales Provided to Fund the Federal Government 12,992 1,973
Non-Cash Market Adjustment (8,251) (9,944)
Total Disposition of Custodial Revenue 2,266,500
Net Custodial Revenue $ -
2,097,131
$ -
The accompanying notes are an integral part of these financial statements.
63
U.S. Department of the Treasury | Fiscal Year 2012
1. SUMMARY OF SIGNIFICANT ACCOUNTING POLICIES
A. REPORTING ENTITY
The accompanying financial statements include the operations of the United States (U.S.) Department of the Treasury
(Department), one of 24 CFO Act agencies of the Executive Branch of the U.S. Government, and certain custodial
activities managed on behalf of the entire U.S. Government. The following paragraphs describe the activities of the
reporting entity.
The Department was created by an Act (1 Stat.65) on September 2, 1789. Many subsequent acts affected the development
of the Department, delegating new duties to its charge and establishing the numerous bureaus and divisions that now
comprise the Department. As a major policy advisor to the President, the Secretary of the Treasury (Secretary) has
primary responsibility for formulating and managing the domestic and international tax and financial policies of the U.S.
Government.
Further, the Secretary is responsible for recommending and implementing United States domestic and international
economic and fiscal policy; governing the fiscal operations of the government; maintaining foreign assets control;
managing the federal debt; collecting income and excise taxes; representing the United States on international monetary,
trade, and investment issues; overseeing Departmental overseas operations; and directing the manufacture of coins,
currency, and other products for customer agencies and the public.
The Department’s reporting entities include Departmental Offices (DO) and eight operating bureaus. For financial
reporting purposes, DO is composed of: International Assistance Programs (IAP), Office of Inspector General (OIG),
Special Office of Inspector General for the Troubled Asset Relief Program (SIGTARP), Treasury Forfeiture Fund (TFF),
Exchange Stabilization Fund (ESF), Community Development Financial Institutions (CDFI) Fund, Office of D.C.
Pensions (DCP), Treasury Inspector General for Tax Administration (TIGTA), Federal Financing Bank (FFB), Office of
Financial Stability (OFS), Government Sponsored Enterprise (GSE) Program, Small Business Lending Fund (SBLF),
Office of Financial Research (OFR), and the DO policy offices.
As of September 30, 2012, the Department’s eight operating bureaus were: Bureau of Engraving and Printing (BEP);
Bureau of the Public Debt (BPD); Financial Crimes Enforcement Network (FinCEN); Financial Management Service
(FMS); Internal Revenue Service (IRS); United States Mint (Mint); Office of the Comptroller of the Currency (OCC); and
the Alcohol and, Tobacco Tax and Trade Bureau (TTB). Effective in October 2012, the BPD and FMS operating bureaus
merged to form one new operating bureau, Bureau of the Fiscal Service, thereby reducing the Department’s total number
of operating bureaus to seven. The President’s Budget for fiscal year 2013 requests Congressional enactment of a single
appropriation to fund the new bureau. The Department’s financial statements reflect the reporting of its own entity
activities comprising both the Department’s operating bureaus and DO that are consolidated with the Department, which
include appropriations it receives to conduct its operations and revenue generated from those operations. They also
reflect the reporting of certain non-entity (custodial) functions it performs on behalf of the U.S. Government and others.
Non-entity activities include collecting federal revenue, servicing the federal debt, disbursing certain federal funds, and
maintaining certain assets and liabilities for the U.S. Government, as well as for other federal entities. The Department’s
reporting entity does not include the General Fund of the U.S. Government (General Fund), which maintains receipt,
disbursement, and appropriation accounts for all federal agencies.
Following generally accepted accounting principles (GAAP) for federal entities, the Department has not consolidated into
its financial statements the assets, liabilities, or results of operations of any financial organization or commercial entity in
which it holds either a direct, indirect, or beneficial majority equity investment. Even though some of the equity
investments are significant, these entities meet the criteria of “bailed out” entities under paragraph 50 of the Statement of
64
U.S. Department of the Treasury | Fiscal Year 2012
Federal Financial Accounting Concepts (SFFAC) No. 2, Entity and Display which directs that such “bailout” investments
should not be consolidated into the Financial Reports of the U.S. Government, either in part or as a whole.
In addition, the Department has made loans and investments in certain special purpose vehicles (SPV) under the
American International Group, Inc. Investment Program, Public-Private Investment Program, and the Term Asset-
Backed Securities Loan Facility. SFFAC No. 2, paragraphs 43 and 44, reference indicative criteria such as ownership and
control over an SPV to carry out government powers and missions as criteria in the determination about whether the SPV
should be classified as a federal entity. The Department has concluded that the lack of control over the SPVs is the
primary basis for determining that none of the SPVs meet the criteria to be classified as a federal entity. As a result, the
assets, liabilities, and results of operations of the SPVs are not included in the Department’s financial statements. The
Department has recorded the loans and investments in private entities and investments in SPVs in accordance with credit
reform accounting, as discussed below. Additional disclosures regarding these SPV investments are included in Note 7.
B. BASIS OF ACCOUNTING AND PRESENTATION
The financial statements have been prepared from the accounting records of the Department in conformity with
accounting principles generally accepted in the United States for federal entities, and the Office of Management and
Budget (OMB) Circular No. A-136, Financial Reporting Requirements, as revised. Accounting principles generally
accepted for federal entities are the standards prescribed by the Federal Accounting Standards Advisory Board (FASAB).
FASAB is recognized by the American Institute of Certified Public Accountants as the official accounting standards-
setting body for the U.S. Government.
These financial statements consist of the Consolidated Balance Sheets, the Consolidated Statements of Net Cost, the
Consolidated Statements of Changes in Net Position, the Combined Statements of Budgetary Resources, and the
Statements of Custodial Activity. The statements and the related notes are prepared in a comparative form to present
both fiscal years 2012 and 2011 information.
To provide additional clarity to its financial statements, the Department has presented more line items on the
Consolidated Balance Sheets than are required by the guidance in OMB Circular No. A-136. The following summarizes
what the Department's additional balance sheet line items represent in accordance with the financial statement
guidelines of the OMB Circular No. A-136: (i) Advances to the Unemployment Trust Fund and Due from the General
Fund represent other intra-governmental assets; (ii) Gold and Silver Reserves and the Reserve Position in the
International Monetary Fund (IMF) represent other monetary assets; (iii) Loans and Interest Receivables represent other
assets; (iv) Due to the General Fund represent other intra-governmental liabilities; (v) Certificates issued to the Federal
Reserve, Allocation of Special Drawing Right, Gold Certificates Issued to the Federal Reserve, Refunds Payable, and
Liabilities to Government Sponsored Entities, DC Pensions and Judicial Retirement Actuarial Liability represent other
liabilities. For the Statement of Changes in Net Position, the Department has separately presented the Accrued Interest
and Discount on Debt and the Transfers to the General Fund, both line items which represent other non-exchange
financing sources per OMB Circular No. A-136 guidance.
Transactions and balances among the Department’s entities have been eliminated from the Consolidated Balance Sheets,
the Consolidated Statements of Net Cost, and the Consolidated Statements of Changes in Net Position. The Statements of
Budgetary Resources are presented on a combined basis; therefore, intra-departmental transactions and balances have
not been eliminated from these statements.
While these financial statements have been prepared from the accounting records of the Department in accordance with
the formats prescribed by OMB, these financial statements are in addition to the financial reports used to monitor and
control budgetary resources which are prepared from the same accounting records.
65
U.S. Department of the Treasury | Fiscal Year 2012
Intra-governmental assets and liabilities are those due from or to other federal entities. Intra-governmental earned
revenues are collections or accruals of revenue from other federal entities, and intra-governmental costs are payments or
accruals of expenditures to other federal entities.
The financial statements should be read with the realization that the Department is a component of the U.S. Government,
a sovereign entity and, accordingly, its liabilities not covered by budgetary resources cannot be liquidated without the
legislative enactment of an appropriation, and that the payment of all liabilities other than for contracts can be abrogated
by the sovereign entity. Liabilities represent the probable and measurable future outflow or other sacrifice of resources
as a result of past transactions or events. Liabilities represent the probable and measurable future outflow or other
sacrifice of resources as a result of past transactions or events. Liabilities covered by budgetary resources are those
liabilities for which Congress has appropriated funds or funding is otherwise available to pay amounts due. Liabilities
not covered by budgetary or other resources represent amounts owed in excess of available, congressionally appropriated
funds or other amounts, and there is no certainty that the appropriations will be enacted.
Certain fiscal year 2011 activity and balances on the financial statements and related notes to the financial statements
have been reclassified to conform to the presentation in the current year. Specifically, certain fiscal year 2011 activity on
the Consolidated Statements of Net Cost and related notes to the financial statements is reclassified to conform to the
presentation in the current fiscal year, the effects of which are immaterial. Furthermore, in fiscal year 2012, changes to
OMB Circular No. A-136 resulted in changes to the presentation of the Combined Statements of Budgetary Resources. All
fiscal year 2011 activity and balances reported on the Combined Statement of Budgetary Resources are reclassified to
conform to the presentation in the current year.
There are numerous acronyms used throughout the notes herein as well as other sections of this Agency Financial Report
(AFR). Refer to the “Glossary of Acronyms” located in Appendix E of this report for a complete listing of these acronyms
and their related definitions.
C. FUND BALANCE
The Fund Balance is the aggregate amount of the Department’s accounts with the U.S. Government’s central accounts
from which the Department is authorized to make expenditures and pay liabilities. It is an asset because it represents the
Department’s claim to the U.S. Government’s resources. Fund balance is not equivalent to unexpended appropriations
because it also includes non-appropriated revolving and enterprise funds, suspense accounts, and custodial funds such as
deposit funds, special funds, and trust funds.
D. LOANS AND INTEREST RECEIVABLE, INTRA-GOVERNMENTAL
Intra-governmental entity loans and interest receivable from other federal agencies represent loans and interest
receivable held by the Department, through FFB. No credit reform subsidy costs are recorded for loans purchased from
federal agencies or for guaranteed loans made to non-federal borrowers because the outstanding balances are guaranteed
(interest and principal) by those agencies. Intra-governmental non-entity loans and interest receivable from other
federal agencies represent loans issued by the Department, through BPD, to federal agencies on behalf of the U.S.
Government. The Department acts as an intermediary issuing these loans because the agencies receiving these loans will
lend these funds to third parties to carry out various programs of the U.S. Government. Because of the Department’s
intermediary role in issuing these loans, the Department does not record an allowance related to these intra-
governmental loans. Instead, loan loss allowances and subsidy costs are recognized by the ultimate lender, the federal
agency that issued the loans to the public.
66
U.S. Department of the Treasury | Fiscal Year 2012
E. ADVANCES TO THE UNEMPLOYMENT TRUST FUND
Advances are issued to the Department of Labor’s (DOL) Unemployment Trust Fund from the General Fund for states to
pay unemployment benefits. BPD accounts for the advances on behalf of the General Fund. As outlined in the United
States Code (USC) 42 USC §1323, these advances bear an interest rate that is computed as the average interest rate as of
the end of the calendar month preceding the issuance date of the advance for all interest-bearing obligations of the
United States that form the public debt, to the nearest lower one-eighth of one percent. Interest on the advances is due
on September 30th of each year. Advances are repaid by transfers from the Unemployment Trust Fund to the General
Fund when the Secretary, in consultation with the Secretary of Labor, determines that the balance in the Unemployment
Trust Fund is adequate to allow repayment.
F. CASH, FOREIGN CURRENCY, AND OTHER MONETARY ASSETS
Substantially all of the Department’s operating cash is non-entity government-wide cash held in depository institutions
and FRB accounts. Agencies can deposit funds that are submitted to them directly into either a Federal Reserve Treasury
General Account (TGA) or a local TGA depositary. The balances in these TGA accounts are transferred to the Federal
Reserve Bank of New York (FRBNY)’s TGA at the end of each day.
Operating cash of the U.S. Government represents balances from tax collections, customs duties, other revenue, federal
debt receipts, and other various receipts net of cash outflows for budget outlays and other payments held in the FRBs and
in foreign and domestic financial institutions. Outstanding checks are netted against operating cash until they are
cleared by the Federal Reserve System.
The FRBNY maintains the TGA which functions as the government’s checking account for deposits and disbursements of
public funds. Cash in the TGA is restricted for government-wide operations.
The Department’s foreign currency investments having original maturities of three months or less are classified as cash
equivalents. Special Drawing Rights (SDRs) holdings comprise most of the other monetary assets (refer below to “Special
Drawing Rights” accounting policy).
G. INVESTMENTS
Investments in GSEs
The Department holds senior preferred stock and warrants for the purchase of common stock of two GSEs, the Federal
National Mortgage Association (Fannie Mae) and the Federal Home Loan Mortgage Corporation (Freddie Mac). These
non-federal investment holdings are presented at their fair value as permitted by OMB Circular No. A-136. This circular
includes language that generally requires agencies to value non-federal investments at acquisition cost, but permits the
use of other measurement basis, such as fair value, in certain situations. Changes in the valuation of these investments
are recorded as non-entity exchange transactions on the Consolidated Statements of Net Cost. Dividends are also
recorded as non-entity exchange transactions and accrued when declared; therefore, no accrual is made for future
dividends.
The GSE Senior Preferred Stock Purchase Agreements (SPSPAs) requires the Department to increase its investment in
the GSEs’ senior preferred stock if, at the end of any quarter, the Federal Housing Finance Agency (FHFA), acting as the
conservator, determines that the liabilities of either GSE exceed its respective assets. As funding to the GSEs to pay their
excess liabilities is appropriated directly to the Department, such payments are treated as entity expenses and reflected as
such on the Consolidated Statements of Net Cost and Cumulative Results of Operations. These payments also result in an
increase to the non-entity investment in the GSEs’ senior preferred stock, with a corresponding increase in Due to the
General Fund, as the Department holds the investment on behalf of the General Fund.
67
U.S. Department of the Treasury | Fiscal Year 2012
Investments in International Financial Institutions
The Department, on behalf of the United States, invests in Multilateral Development Banks (MDBs) to support poverty
reduction, private sector development, transitions to market economies, and sustainable economic growth and
development, thereby advancing the United States’ economic, political, and commercial interests abroad. As a
participating member country, the Department, on behalf of the United States, provides a portion of the capital base of
the MDBs, through subscriptions to capital, which allows the MDBs to issue loans at market-based rates to middle
income developing countries. These paid-in capital investments are considered non-marketable equity investments
valued at cost on the Department’s Consolidated Balance Sheets.
In addition, the Department, on behalf of the United States, contributes funding to MDBs to finance grants and extend
credit to poor countries at below market-based interest rates. These U.S. contributions, also referred to as “concessional
window” contributions, are reported as an expense on the Department’s Consolidated Statements of Net Cost.
Non-TARP Investment in American International Group, Inc.
The Department holds American International Group, Inc. (AIG) common stock, a non-federal investment, on behalf of
the General Fund which are considered “available-for-sale” securities and recorded at fair value. Changes in the
valuation of these investments held are non-entity, non-exchange transactions reported on the Statements of Custodial
Activity. The revenue or loss associated with sales of these investments are non-entity, exchange transactions reported
on the Statements of Custodial Activity rather than on the Consolidated Statements of Net Cost as the Department does
not incur costs related to these investments.
Other Investments and Related Interest
ESF holds most of the Department’s foreign currency investments. Other foreign currency denominated assets and
investment securities are considered available-for-sale securities and recorded at fair value. These holdings are normally
invested in interest-bearing securities issued or held through foreign governments or monetary authorities. Interest on
investments, amortization of premiums, and accretion of discounts are recognized on an accrual basis. Premiums and
discounts are amortized or accreted over the life of the related investment security as an adjustment to yield using the
effective interest method.
H. CREDIT PROGRAM RECEIVABLES
The Department accounts for all of its TARP credit program receivables, including investments in common and preferred
stock and warrants of public companies, loans, and loan guarantees or guaranty-like insurance activities, under the
provisions of credit reform accounting (Note 7). In addition to its TARP programs, the Department accounts for all other
of its credit program receivables under the provisions of credit reform accounting, including the loans or equity securities
associated with the Department’s: GSE mortgage-backed securities (MBS) purchase program, state and local Housing
Finance Agency (HFA) Initiative programs, SBLF program, CDFI program, and certain portions of the Department’s
participation in the IMF (Note 11).
To account for the Department’s TARP and other credit program receivables, the Department applies the accounting
provisions of SFFAS No. 2, Accounting for Direct Loans and Loan Guarantees, as amended by SFFAS No. 18,
Amendments to Accounting Standards for Direct Loans and Loan Guarantees, and SFFAS No. 19, Technical
Amendments to Accounting Standards for Direct Loans and Loan Guarantees. SFFAS No. 2, as amended, requires
measurement of the asset or liability at the net present value of the estimated future cash flows. The cash flow estimates
for each credit program transaction reflect the actual structure of the instruments. For each of these instruments, the
Department estimates cash inflows and outflows related to the program over the estimated term of the instrument.
68
U.S. Department of the Treasury | Fiscal Year 2012
Further, each cash-flow estimate reflects the specific terms and conditions of the program, technical assumptions
regarding the underlying assets, risk of default or other losses, and other factors as appropriate. The measurement of
assets within these programs is primarily derived from inputs which generally represent market data and, when such data
is not available, management’s best estimate of how a market participant would assess the risk inherent in the asset.
SFFAS No. 2, as amended, was promulgated as a result of the Federal Credit Reform Act of 1990 (FCRA). The primary
purpose of the FCRA is to more accurately measure the cost of federal credit programs, and to place the cost of such
credit programs on a basis equivalent with other federal spending. The FCRA requires that the ultimate costs of a credit
program be calculated and the budgetary resources obtained before the direct loan obligations are incurred. To
accomplish this, the Department first predicts or estimates the future performance of direct and guaranteed loans when
preparing its annual budget. The data used for these budgetary estimates are reestimated at the fiscal year-end to reflect
changes in actual loan performance and actual interest rates in effect when the loans were issued. The reestimated data
reflect adjustments for market risks, asset performance, and other key variables and economic factors. The reestimated
data are then used to report the cost of the loans disbursed under the direct or guaranteed loan program as a “Program
Cost” in the Department’s Consolidated Statements of Net Cost.
Cash flows associated with the Department’s credit programs generally include disbursements, repayments, repurchases,
fees, recoveries, interest, dividends, proceeds from sales of instruments, borrowings from Treasury, negative subsidy, and
the subsidy cost received from the program accounts. Security-level data and assumptions used as the basis for cash flow
model forecasts and program performance are drawn from widely available market sources, as well as information
published by investees. Key inputs to the cash flow forecasts include:
Security characteristics such as unpaid principal balance, coupon rate, weighted-average loan age, issued bond
balance, credit rating, maturity date, principal and interest payment schedules, priority of payments, and
performance of underlying collateral
Department actions as well as changes in legislation
Forecast prepayment rates and default rates
Forecast dividend payments
Expected escrow conversion and return rates
Default and recovery reports published by Moody’s and Standard and Poor’s
Other third-party market sources
The recorded subsidy cost associated with each of the Department’s credit programs represents the difference between
the Department’s projected costs of the program and the future cash flows anticipated to be received by the Department.
The subsidy allowance specifically takes into consideration projected repayments and defaults and the projected cost of
borrowings. The allowance is amortized to reflect the difference between projected and actual financing costs.
The Department’s actions, as well as changes in legislation, may impact estimated future cash flows and related subsidy
costs. The cost or cost savings of a modification is recognized in subsidy costs when the terms of a program are modified.
Workouts are actions taken to maximize repayments of existing credit programs, and the expected effects on cash flows
are included in the original estimate and reestimates of the subsidy cost. Subsidy costs are also impacted by reestimates
which may occur as a result of updates to the original program subsidy cost estimates to reflect actual cash flows
experience, as well as changes in forecasts of estimated future cash flows associated with the credit program.
I. TAXES, INTEREST, AND OTHER RECEIVABLES, NET
Federal taxes receivable, net, and the corresponding liability due to the General Fund, are not accrued until related tax
returns are filed or assessments are made by the IRS and agreed to by either the taxpayer or the court. Additionally, the
69
U.S. Department of the Treasury | Fiscal Year 2012
prepayments are netted against liabilities. Accruals are made to reflect penalties and interest on taxes receivable through
the balance sheet date.
Taxes receivable consist of unpaid assessments (taxes and associated penalties and interest) due from taxpayers. The
existence of a receivable is supported by a taxpayer agreement, such as filing of a tax return without sufficient payment,
or a court ruling in favor of the IRS. The allowance reflects an estimate of the portion of total taxes receivable deemed to
be uncollectible.
Compliance assessments are unpaid assessments which neither the taxpayer nor a court has affirmed the taxpayer owes
to the U.S. Government. Examples include assessments resulting from an IRS audit or examination in which the
taxpayer does not agree with the results. Compliance assessment write-offs consist of unpaid assessments for which the
IRS does not expect further collections due to factors such as taxpayers’ bankruptcy, insolvency, or death. Compliance
assessment and related write-offs are not reported on the balance sheet. Statutory provisions require the accounts to be
maintained until the statute for collection expires.
J. PROPERTY, PLANT, AND EQUIPMENT, NET
General
Property, plant, and equipment (PP&E) is composed of capital assets used in providing goods or services. It also includes
assets acquired through capital leases, which are initially recorded at the amount recognized as a liability for the capital
lease at its inception. PP&E is stated at full cost, including costs related to acquisition, delivery, and installation, less
accumulated depreciation. Major alterations and renovations, including leasehold and land improvements, are
capitalized, while maintenance and repair costs are charged to expense as incurred. Costs for construction projects are
recorded as construction-in-progress until completed, and are valued at actual (direct) cost plus applied overhead and
other indirect costs.
Internal-use software encompasses software design, development, and testing of projects adding significant new
functionality and long-term benefits. Costs for developing internal-use software are accumulated in work in development
until a project is placed into service, and testing and final acceptance are successfully completed. Once completed, the
costs are transferred to depreciable property.
The Department leases land and buildings from the General Services Administration (GSA) to conduct most of its
operations. Such leases do not meet capital lease requirements for financial reporting purposes. GSA charges a standard
level user fee which approximates commercial rental rates for similar properties.
The Department’s bureaus are diverse both in size and in operating environment. Accordingly, the Department’s
capitalization policy provides minimum capitalization thresholds which range from $25,000 to $50,000 for all property
categories except for internal-use software thresholds which range from $50,000 to $250,000. The Department also
uses a capitalization threshold range for bulk purchases: $250,000 to $500,000 for non-manufacturing bureaus and
$25,000 to $50,000 for manufacturing bureaus. Bureaus determine the individual items that comprise bulk purchases
based on Departmental guidance. In addition, the Department’s bureaus may expense bulk purchases if they conclude
that total period costs would not be materially distorted and the cost of capitalization is not economically feasible.
Depreciation is expensed on a straight-line basis over the estimated useful life of the asset with the exception of leasehold
improvements and capital leases. Leasehold improvements are depreciated over the term of the lease or the useful life of
the improvement, whichever is shorter. Capital leases are depreciated over the estimated life of the asset or term of the
lease, whichever is shorter. Service life ranges (2 to 50 years) are wide due to the Department’s diversity of PP&E. Land
and land improvements, construction in progress, and internal-use software in development are not depreciated.
70
U.S. Department of the Treasury | Fiscal Year 2012
Heritage Assets
Multi-use heritage assets are assets of historical significance for which the predominant use is general government
operations. All acquisition, reconstruction, and betterment costs for the Treasury buildings are capitalized as general
PP&E and depreciated over their service life.
K. FEDERAL DEBT AND INTEREST PAYABLE
Debt and associated interest are reported on the accrual basis of accounting. Interest costs are recorded as expenses
when incurred, instead of when paid. Certain Treasury securities are issued at a discount or premium. These discounts
and premiums are amortized over the term of the security using an interest method for all long-term securities and the
straight-line method for short-term securities. The Department also issues Treasury Inflation-Protected Securities
(TIPS). The principal for TIPS is adjusted daily over the life of the security based on the Consumer Price Index for all
Urban Consumers, a widely used measurement of inflation.
L. COMMITMENTS AND CONTINGENCIES
The Department, through FFB, makes loan commitments with federal agencies, or private sector borrowers whose loans
are guaranteed by federal agencies, to extend credit for their own use (refer to the accounting policy above entitled
“Loans and Interest Receivable, Intra-governmental”). The Department establishes loan commitments when the
Department and other parties fully execute promissory notes in which the Department becomes obligated to issue such
loans immediately or at some future date. The Department reduces loan commitments when the Department issues the
loans or when the commitments expire. Most obligations of the Department give a borrower the contractual right to a
loan or loans immediately or at some point in the future within an agreed upon timeframe.
In accordance with SFFAS No. 5, Accounting for Liabilities of the Federal Government, the Department recognizes
material contingent liabilities when the following criteria are met:
A past event or exchange transaction has occurred
A future cash outflow is probable
A future cash outflow is measurable
The estimated liability recorded by the Department is either a specific amount or a range of amounts. If some amount
within the range is a better estimate than any other amount within the range, that amount is recognized. If no amount
within the range is a better estimate than any other amount, the minimum amount in the range is recognized, and the
range and a description of the nature of the contingency are disclosed. The Department records a contingent liability
related to the GSE SPSPA program (Note 8), and also follows this policy for loss contingencies that may arise from
claims, assessments, litigations, fines, penalties, and other sources.
If one or more, but not all, of the above criteria for recognition are met, and there is a reasonable possibility of loss, the
Department will disclose, if material, the nature of the contingent liability, along with a range of possible loss, if
estimable, and a description of the nature of the contingency.
M. SPECIAL DRAWING RIGHTS
The SDR is an international reserve asset created by the IMF to supplement its member countries’ official reserves.
Under its Articles of Agreement, the IMF may allocate SDRs to member countries in proportion to their IMF quotas.
Pursuant to the Special Drawing Rights Act of 1968, as amended, the ESF holds all SDRs allocated to or otherwise
acquired by the United States.
71
U.S. Department of the Treasury | Fiscal Year 2012
Allocations and Holdings
The Department records the SDR holdings as part of “Cash, Foreign Currency, and Other Monetary Assets,” and the SDR
allocations as the “Allocation of Special Drawing Rights” liability when the IMF allocates SDRs to the Department. The
liabilities represent the amount that is payable in the event of liquidation of, or withdrawal by the United States from, the
SDR department of the IMF or cancellation of the SDRs.
SDR holdings increase primarily as a result of IMF SDR allocations. SDR transactions are recorded as incurred. They
include acquisitions and sales of SDRs, interest received on SDR holdings, interest charges on SDRs allocations, and
valuation adjustments. The U.S. Government receives remuneration in SDRs from the IMF based on claims on the IMF
as represented by the U.S. Reserve Position. The remuneration is credited to the ESF which transfers to either the TGA
account or a specified financing account an equivalent amount of dollars plus nominal interest. The allocations and
holdings are revalued monthly based on the SDR valuation rate as calculated by the IMF.
Certificates Issued to the Federal Reserve
The Special Drawing Rights Act of 1968 authorizes the Secretary to issue certificates, not to exceed the value of SDR
holdings, to the FRB in return for dollar amounts equal to the face value of certificates issued. The certificates may be
issued to finance the acquisition of SDRs from other countries or to provide U.S. dollar resources to finance other ESF
operations. Certificates issued are to be redeemed by the Department at such times and in such amounts as the Secretary
may determine, and do not bear interest. Certificates issued to the FRB are reported at their face value which
approximates their carrying value since, under the terms of the agreement, there is no set repayment date and no interest
accrued while certificates remain outstanding.
N. REFUNDS PAYABLE
Refunds payable arise in the normal course of tax administration when it is determined that taxpayers have paid more
than the actual taxes that owe. Amounts that the Department has concluded to be valid refunds owed to taxpayers are
recorded as a liability entitled “Refunds Payable” on the Consolidated Balance Sheets, with a corresponding receivable
from the General Fund. This receivable is included on the Consolidated Balance Sheets within the line entitled “Due from
the General Fund.”
O. FEDERAL EMPLOYEE BENEFITS PAYABLE – FECA ACTUARIAL LIABILITY
The Federal Employees’ Compensation Act (FECA) provides income and medical cost protection to covered federal
civilian employees injured on the job, and employees who have incurred a work-related injury or occupational disease.
The FECA program is administered by the DOL which pays valid claims and subsequently seeks reimbursements from
the Department for these paid claims. Generally, the Department reimburses the DOL within two to three years once
funds are appropriated. The FECA liability consists of two components. The first component is based on actual claims
paid by the DOL but not yet reimbursed by the Department. The second component is the estimated liability for future
workers compensation as a result of past events. Both components are reported in “Other Liabilities” on the
Consolidated Balance Sheets. These future workers’ compensation estimates are generated by applying actuarial
procedures developed to estimate the liability for FECA benefits. The actuarial liability estimates for FECA benefits
include the expected liability for death, disability, medical, and miscellaneous costs for approved compensation cases.
P. ANNUAL, SICK, AND OTHER LEAVE
Annual and compensatory leave earned by the Department’s employees, but not yet used, is reported as an accrued
liability. The accrued balance is adjusted annually to reflect current pay rates. Any portion of the accrued leave for which
funding is not available is recorded as an unfunded liability as reported in “Other Liabilities” on the Consolidated Balance
72
U.S. Department of the Treasury | Fiscal Year 2012
Sheets. Sick and other leave are expensed as taken, and the Department does not record a liability for such amounts
because employees do not vest in sick and other leave benefits.
Q. PENSION COSTS, OTHER RETIREMENT BENEFITS, AND OTHER POST-EMPLOYMENT BENEFITS
The Department recognizes the full costs of its employees’ pension benefits, including recognizing imputed costs for the
difference between the estimated service cost and the contributions made by the Department. However, the assets and
liabilities associated with these benefits are recognized by the Office of Personnel Management (OPM) rather than the
Department.
Most employees of the Department hired prior to January 1, 1984, participate in the Civil Service Retirement System
(CSRS), to which the Department contributes seven percent of pay. On January 1, 1987, the Federal Employees’
Retirement System (FERS) went into effect pursuant to Public Law (P.L.) 99-335. Employees hired after December 31,
1983 are automatically covered by FERS and Social Security. A primary feature of FERS is that it offers a savings plan to
which the Department automatically contributes one percent of base pay and matches any employee contributions up to
an additional four percent of base pay. For most employees hired after December 31, 1983, the Department also
contributes the employer’s matching share for Social Security. For the FERS basic benefit, the Department contributes
11.2 percent for regular FERS employees.
Similar to federal retirement plans, OPM, rather than the Department, reports the assets and liability for future payments
to retired employees who participate in the Federal Employees Health Benefits Program (FEHBP) and Federal
Employees Group Life Insurance (FEGLI) Program. The Department reports the full cost of providing other retirement
benefits (ORB). The Department also recognizes an expense and a liability for other post-employment benefits (OPEB),
which includes all types of benefits, provided to former or inactive (but not retired) employees, their beneficiaries, and
covered dependents. Additionally, one of the Department’s bureaus, OCC, separately sponsors a defined life insurance
benefit plan for current and retired employees, and is the administrator for a private defined benefit retirement plan, the
Pentegra Defined Benefit Plan (PDBP), that provides certain health and life insurance benefits for certain of its retired
employees who meet eligibility requirements.
R. REVENUE AND FINANCING SOURCES
The Department’s activities are financed either through exchange revenue it receives from others or through non-
exchange revenue and financing sources (such as appropriations provided by the Congress and penalties, fines, and
certain user fees collected). User fees primarily include collections from the public for the IRS costs to process
installment agreements and accompanying photocopy and reproduction charges. Exchange revenues are recognized
when earned; i.e., goods have been delivered or services have been rendered. Revenue from reimbursable agreements is
recognized when the services are provided. Non-exchange revenues are recognized when received by the respective
collecting bureau. Appropriations used are recognized as financing sources when related expenses are incurred or assets
are purchased.
The Department also incurs certain costs that are paid in total or in part by other federal entities, such as pension costs,
the FEHBP, and any un-reimbursed payments made from the Treasury Judgment Fund on behalf of the Department.
These subsidized costs are recognized on the Consolidated Statement of Net Cost, and the imputed financing for these
costs is recognized on the Consolidated Statement of Changes in Net Position. As a result, there is no effect on net
position. Other non-exchange financing sources, such as donations and transfers of assets without reimbursements, are
also recognized for the period in which they occurred on the Consolidated Statements of Changes in Net Position.
The Department recognizes revenue it receives from disposition of forfeited property as non-exchange revenue on the
Consolidated Statements of Changes in Net Position. The costs related to the Forfeiture Fund program are reported on
73
U.S. Department of the Treasury | Fiscal Year 2012
the Consolidated Statements of Net Cost. The Treasury Forfeiture Fund is the special fund account for depositing non-
tax forfeiture proceeds received pursuant to laws enforced or administered by law enforcement bureaus that participate
in the Treasury Forfeiture Fund. Forfeited property balances are reported in “Other Assets” on the Consolidated Balance
Sheets.
S. CUSTODIAL REVENUES AND COLLECTIONS
Non-entity revenue reported on the Department’s Statements of Custodial Activity includes cash collected by the
Department, primarily from taxes. It does not include revenue collected by other federal agencies, such as user fees and
other receipts, which are remitted for general operating purposes of the U.S. Government or are earmarked for certain
trust funds. The Statements of Custodial Activity are presented on the “modified accrual basis.” The Department
recognizes revenues as cash is collected, and records a “non-cash accrual adjustment” representing the net increase or
decrease during the reporting period in net revenue-related assets and liabilities, mainly taxes receivable. The
Department also records as revenues non-cash market valuation changes related to the U.S. Government’s holdings in
American International Group, Inc. (Note 26).
T. PERMANENT AND INDEFINITE APPROPRIATIONS
Permanent and indefinite appropriations are used to disburse tax refunds, income tax credits, and child tax credits.
These appropriations are not subject to budgetary ceilings established by Congress. Therefore, refunds payable at year
end are not subject to funding restrictions. Refund payment funding is recognized as appropriations are used.
Permanent indefinite authority for refund activity is not stated as a specific amount and is available for an indefinite
period of time. Although funded through appropriations, refund activity, in most instances, is reported as a custodial
activity of the Department, since refunds are, in substance, a custodial revenue-related activity resulting from taxpayer
overpayments of their tax liabilities.
The Department also has two permanent and indefinite appropriations related to debt activity. One is used to pay
interest on the public debt securities; the other is used to redeem securities that are matured, called, or eligible for early
redemption. These accounts are not annual appropriations and do not have refunds. Debt activity appropriations are
related to the Department’s liability and are reported on the Department’s Consolidated Balance Sheet. Permanent
indefinite authority for debt activity is available for an indefinite period of time.
The Department also has permanent and indefinite appropriations to fund increases in the projected subsidy costs of
credit programs as determined by the reestimation process required by the FCRA. The Department’s renewable energy
project is also covered by permanent indefinite appropriations.
Additionally, the Department has other permanent and indefinite appropriations to make certain payments on behalf of
the U.S. Government. These appropriations are provided to make payments to the FRB for fiscal services provided, and
to the financial institutions for services provided as financial agents of the U.S. Government. They also include
appropriations provided to make other disbursements on behalf of the U.S. Government, including payments made to
various parties as a result of certain claims and judgments rendered against the United States.
U. INCOME TAXES
As an agency of the U.S. Government, the Department is exempt from all income taxes imposed by any governing body,
whether it is a federal, state, commonwealth, local, or foreign government.
V. USE OF ESTIMATES
The Department has made certain estimates and assumptions relating to the reporting of assets, liabilities, revenues,
expenses, and the disclosure of contingent liabilities to prepare its financial statements. Actual results may differ from
74
U.S. Department of the Treasury | Fiscal Year 2012
these estimates. It is possible that the results of operations, cash flows or the financial position of the Department could
be materially affected in future periods by adverse changes in the outlook for the key assumptions underlying
management’s estimates. Significant transactions subject to estimates include loan and credit program receivables,
investments in GSEs and other non-federal securities and related impairment, tax receivables, loan guarantees,
depreciation, liability for liquidity commitment to GSEs, imputed costs, actuarial liabilities, cost and earned revenue
allocations, contingent legal liabilities, and credit reform subsidy costs.
The Department accounts for all of its TARP and non-TARP credit program receivables in accordance with credit reform
accounting (refer to the accounting policy above entitled “Credit Program Receivables,” and Notes 7 and 11). These
receivables are derived using credit reform modeling which is subject to the use of estimates. The Department recognizes
the sensitivity of credit reform modeling to slight changes in certain model assumptions, and uses regular review of
model factors, statistical modeling, and annual reestimates to reflect the most accurate cost of the credit programs to the
U.S. Government. The purpose of reestimates is to update original program subsidy cost estimates to reflect actual cash
flow experience as well as changes in forecasts of future cash flows. Forecasts of future cash flows are updated based on
actual program performance to date, additional information about the portfolio, additional publicly available relevant
historical market data on securities performance, revised expectations for future economic conditions, and enhancements
to cash flow projection methods.
The forecasted cash flows used to determine these credit program amounts are sensitive to slight changes in model
assumptions, such as general economic conditions, specific stock price volatility of the entities in which the Department
has an equity interest, estimates of expected default, and prepayment rates. Forecasts of financial results have inherent
uncertainty. The TARP Credit Program Receivables, Net line item on the Consolidated Balance Sheets is reflective of
relatively illiquid, troubled assets whose values are particularly sensitive to future economic conditions and other
assumptions. Additional discussion related to sensitivity analysis can be found in the Management’s Discussion and
Analysis section of this AFR.
The liabilities to the GSEs related to the SPSPA is a contingent liquidity commitment, predicated on the future
occurrence of an excess of liabilities and minimum capital reserve amounts, as defined, over the assets of either GSE at
the end of any reporting quarter, and are probable liabilities of the Department. The Department performs annual
valuations, as of September 30, on the preferred stock and warrants in an attempt to provide a “sufficiently reliable”
estimate of the outstanding commitments in order for the Department to record the remaining liability in accordance
with SFFAS No. 5.
The valuations incorporate various forecasts, projections and cash flow analyses to develop an estimate of probable
liability. Any changes in valuation, including impairment, are recorded and disclosed in accordance with SFFAS No. 7,
Accounting for Revenue and Other Financing Sources. Since the valuation is an annual process, the change in valuation
of the preferred stock and warrants are deemed usual and recurring. The GSEs contingent liability is assessed annually
and recorded at the gross estimated amount, without considering the increase in preferred stock liquidity preference,
future dividend payments, or future commitment fees, due to the uncertainties involved. Note 8 includes a detailed
discussion of the results of the valuation and the liability recorded.
Estimation of such complex and long-duration contingencies is subject to uncertainty, and it is possible that new
developments will adversely impact ultimate amounts required to be funded by the Department under agreements
between the Department and each GSE (Note 8). Specifically, the occurrence of future shareholder deficits, which
ultimately determines the Department’s liabilities to the GSEs, is most sensitive to future changes in the housing price
index.
75
U.S. Department of the Treasury | Fiscal Year 2012
W. OTHER-THAN-TEMPORARY IMPAIRMENTS
A decline in the market value (either due to credit, price or currency) of any investment below cost that is deemed to be
other-than-temporary is accounted for as an impairment and the carrying value is reduced to fair value for financial
reporting purposes. To determine whether an impairment is other-than-temporary, the Department considers whether it
has the ability and intent to hold the investment until a market price recovery, and considers whether evidence indicating
the cost of the investment is recoverable outweighs evidence to the contrary.
X. CREDIT, MARKET AND FOREIGN CURRENCY RISK
Credit risk is the potential, no matter how remote, for financial loss from a failure of a borrower or counterparty to
perform in accordance with underlying contractual obligations. The Department takes on possible credit risk when it
makes direct loans or credits to foreign entities or becomes exposed to institutions which engage in financial transactions
with foreign countries (Note 10). The following programs of the Department entail credit risk: monetary assets held;
committed but undisbursed direct loans; liquidity commitment to the GSEs; GSE obligations obtained under the HFA
Initiative (the NIBP and TCLP); investments, loans, and other credit programs of the TARP; programs including the
CDFI Fund, SBLF, and certain portions of the Department’s participation in the IMF; and the Terrorism Risk Insurance
Program.
Except for the Terrorism Risk Insurance Program, the Department’s activities focus on the underlying problems in the
credit markets, and the ongoing instability in those markets exposes the Department to potential costs and losses. The
extent of the risk assumed by the Department is described in more detail in the notes to the financial statements and,
where applicable, is factored into credit reform models and reflected in fair value measurements (Notes 7, 8, and 11).
Given the history of the Department with respect to such exposure and the financial policies in place in the U.S.
Government and other institutions in which the United States participates, the Department’s expectation of credit losses
is nominal.
For Emergency Economic Stabilization Act (EESA) programs, the statute requires that budgetary costs of the troubled
assets and guarantees of troubled assets be calculated by adjusting the discount rate for market risks. Within the TARP
programs, the Department has invested in many assets that would traditionally be held by private investors and their
valuation would inherently include market risk. Accordingly, for all TARP direct loans, equity investments, and other
credit programs, the Department calculates a Market Risk Adjusted Discount Rate (MRADR). Therefore, the
Department’s cost estimates for the TARP programs are adjusted for unexpected loss and the estimated risk of expected
cash flows. Under SFFAS No. 2, including market risk in the cash flow estimates is consistent with the type of assets
being valued. The inclusion of the MRADR is the mechanism for deriving a fair value of the assets. As directed by
Congress, a MRADR is also used in the credit reform model for certain portions of the Department’s participation in the
IMF.
The Department faces certain risks and uncertainties as a result of holding securities denominated in foreign currency.
The price of holdings of such securities may widely fluctuate as a result of volatility in foreign currency markets and
changes in real and perceived credit of the Department’s counterparties.
Y. EARMARKED FUNDS
The Department accounts for revenues and other financing sources for earmarked funds separately from other funds.
Earmarked funds are financed by specifically identified revenues, often supplemented by other financing sources, which
remain available over time. These specifically identified revenues and other financing sources are required by statute to
be used for designated activities or purposes. SFFAS No. 27, Identifying and Reporting Earmarked Funds, defines the
following three criteria for determining an earmarked fund: (i) a statute committing the U.S. Government to use
76
U.S. Department of the Treasury | Fiscal Year 2012
specifically identified revenues and other financing sources not used in the current period for future use to finance the
designated activities, benefits, or purposes; (ii) explicit authority for the earmarked fund to retain revenues and other
financing sources not used in the current period for future use to finance the designated activities, benefits, or purposes;
and (iii) a requirement to account for and report on the receipt, use, and retention of the revenues and other financing
sources that distinguished the earmarked fund from the U.S. Government’s general revenues.
Z. ALLOCATION TRANSFERS
The Department is a party to allocation transfers with other federal agencies as both a transferring (parent) entity and/or
a receiving (child) entity. Allocation transfers are legal delegations by one department of its authority to obligate budget
authority and outlay funds to another department. A separate fund account (allocation account) is created in the U.S.
Treasury as a subset of the parent fund account for tracking and reporting purposes. All allocation transfers of balances
are credited to this account, and subsequent obligations and outlays incurred by the child entity are charged to this
allocation account as they execute the delegated activity on behalf of the parent. Parent federal agencies report both the
proprietary and budgetary activity and the child agency does not report any financial activity related to budget authority
allocated from the parent federal agency to the child federal agency.
The Department allocates funds, as the parent, to the Department of Energy. Also, the Department receives allocation
transfers, as the child, from the Agency for International Development, General Services Administration, and
Department of Transportation.
OMB allows certain exceptions to allocation reporting for certain funds. Accordingly, the Department has reported
certain funds, including the Agency for International Development and Executive Office of the President funds, for which
the Department is the child in the allocation transfer but, in compliance with OMB guidance (Circular No. A-136, II.4.2,
question 5, for three exceptions), will report all activities relative to these allocation transfers in the Department’s
financial statements.
AA. FIDUCIARY ACTIVITIES
Fiduciary activities are the collection or receipt, and the management, protection, accounting, investment, and
disposition by the U.S. Government of cash or other assets in which non-Federal individuals or entities have an
ownership interest that the U.S. Government must uphold. Fiduciary cash and other assets are not assets of the U.S.
Government. These activities are not reported in the Department’s consolidated financial statements, but instead are
reported in Note 27.
AB. RELATED PARTIES AND OTHER ENTITIES
The primary “related parties” with whom the Department conducts business are other federal agencies, mainly through
the normal lending activities of the BPD and the FFB. These activities are disclosed in the consolidated financial
statements. Additionally, the Secretary serves on the FHFA Oversight Board, and consults with the Director of FHFA on
matters involving Fannie Mae and Freddie Mac. This provides the Department a voice in the FHFA’s actions as the
conservator for Fannie Mae and Freddie Mac. The Department has no transactions with FHFA, but rather transacts
directly with the GSEs. The Department also utilizes the services of the FRBs to execute a variety of transactions on
behalf of the BPD and the ESF. Because of the magnitude and variety of services provided, the following provides an
overview of the FRBs’ purpose, governance, and the various services provided on behalf of the Department.
77
U.S. Department of the Treasury | Fiscal Year 2012
Federal Reserve System
The Federal Reserve System (FR System) was created by Congress under the Federal Reserve Act of 1913. The FR System
consists of the Federal Reserve Board of Governors (Board), the Federal Open Market Committee (FOMC), and the FRBs.
Collectively, the FR System serves as the nation’s central bank and is responsible for formulating and conducting
monetary policy, issuing and distributing currency (Federal Reserve Notes), supervising and regulating financial
institutions, providing nationwide payments systems (including large-dollar transfers of funds, automated clearinghouse
(ACH) operations, and check collection), providing certain financial services to federal agencies and fiscal principals, and
serving as the U.S. Government’s bank. Monetary policy includes actions undertaken by the FR System that influence the
availability and cost of money and credit as a means of helping to promote national economic goals. The FR System also
conducts operations in foreign markets in order to counter disorderly conditions in exchange markets or to meet other
needs specified by the FOMC to carry out its central bank responsibilities. The FR System is not included in the federal
budget. It is considered an independent central bank, and its decisions are not ratified by the executive branch of the
U.S. Government.
The Department interacts with the FRBs in a variety of ways, including the following:
The FRBs serve as the Department’s fiscal agent and depositary, executing banking and other financial transactions
on the Department’s behalf. The Department reimburses the FRBs for these services, the cost of which is included on
the Consolidated Statements of Net Costs
The FRBs hold Treasury and other federal securities in the FRBs’ System Open Market Account (SOMA) for the
purpose of conducting monetary policy (Note 16)
The FRBs hold gold certificates issued by the Department in which the certificates are collateralized by gold (Note 6)
The FRBs hold SDR certificates issued by the Department which are collateralized by SDRs (Notes 5 and 12)
The FRBs are required by Board policy to transfer their excess earnings to the Department on behalf of the U.S.
Government (Notes 13 and 23)
The Department also consults with the FR System on matters affecting the economy and certain financial stability
activities (Notes 7, 11 and 26). The above financial activities involving the Department are accounted for and disclosed in
the Department’s consolidated financial statements. In accordance with SFFAC No. 2, Entity and Display, the FR
Systems’ assets, liabilities, and operations are not consolidated into the Department’s financial statements.
Federal Reserve System Structure
The Board is an independent organization governed by seven members who are appointed by the President and
confirmed by the Senate. The full term of a Board member is 14 years, and the appointments are staggered so that one
term expires on January 31 of each even-numbered year. The Board has a number of supervisory and regulatory
responsibilities for institutions including, among others, state-chartered banks that are members of the FR System, bank
holding companies, and savings and loan holding companies. In addition, the Board has general supervisory
responsibilities for the 12 FRBs, and issues currency (Federal Reserve Notes) to the FRBs for distribution.
The FOMC is comprised of the seven Board members and five of the 12 FRB presidents, and is charged with formulating
and conducting monetary policy primarily through open market operations (the purchase and sale of certain securities in
the open market), the principal tool of national monetary policy. These operations affect the amount of reserve balances
available to depository institutions, thereby influencing overall monetary and credit conditions. The 12 FRBs are
chartered under the Federal Reserve Act, which requires each member bank to own the capital stock of its FRB.
Supervision and control of each FRB is exercised by a board of directors, of which three are appointed by the Board of
Governors of the FR System, and six are elected by their member banks.
78
U.S. Department of the Treasury | Fiscal Year 2012
The FRBs participate in formulating and conducting monetary policy, distribute currency and coin, and serve as fiscal
agents for the Department, other federal agencies and fiscal principals. Additionally, the FRBs provide short-term loans
to depository institutions and loans to participants in programs or facilities with broad-based eligibility in unusual and
crucial circumstances when approved by the Board.
Federal Reserve System Assets and Liabilities
The FRBs hold Treasury and other securities in the SOMA for the purpose of conducting monetary policy. Treasury
securities held by the FRBs totaled $1.6 trillion and $1.7 trillion at September 30, 2012 and 2011, respectively (Note 16).
These assets are generally subject to the same market (principally interest-rate) and credit risks as other financial
instruments. In the open market, the FR System purchases and sells Treasury securities as a mechanism for controlling
the money supply.
The FRBs have deposit liabilities with Treasury and depository institutions. The FRBs issue Federal Reserve Notes, the
circulating currency of the United States, which are collateralized by the Treasury securities and other assets held by the
FRBs.
Financial and other information concerning the FR System, including financial statements for the Board and the FRBs,
may be obtained at http://www.federalreserve.gov.
FRB Residual Earnings Transferred to the Department
FRBs generate income, from interest earned on securities, reimbursable services provided to federal agencies, and the
provision of priced services to depository institutions as specified by the Monetary Control Act of 1980. Although the
FRBs generate earnings from carrying out open market operations (via the earnings on securities held in the SOMA
account), their execution of these operations is for the purpose of accomplishing monetary policy rather than generating
earnings. Each FRB is required by Board policy to transfer to the Department its residual (or excess) earnings, after
providing for the cost of operations, payment of dividends, and reservation of an amount necessary to equate surplus
with paid-in capital. These residual earnings may vary due to, among other things, changes in the SOMA balance levels
that may occur in conducting monetary policy. In the event of losses, or a substantial increase in capital, an FRB will
suspend its payments to the U.S. Treasury until such losses or increases in capital are recovered through subsequent
earnings. The FRB residual earnings of $82.0 billion and $82.5 billion for fiscal years ended September 30, 2012 and
2011, respectively, are reported as custodial revenues on the Department’s Statements of Custodial Activity. They
constituted three percent of the Department’s total custodial revenues collected in fiscal years 2012 and 2011. “Taxes,
Interest and Other Receivables, Net” includes a receivable for FRB’s residual earnings which represents the earnings due
to the U.S. Treasury as of September 30, but not collected by the U.S. Treasury until after the end of the month (Note 13).
2. FUND BALANCE
As of September 30, 2012 and 2011, fund balance consisted of the following (in millions):
2012 2011
Appropriated Funds $ 315,690 $ 344,913Revolving Funds 26,698 35,464Special Funds 976 721Clearing Funds 681 392Deposit Funds 163 170
Other Funds (principally Receipt, Trust, and Suspense Funds) 138 124
Total Fund Balance $ 344,346 $ 381,784
Appropriated funds consist of amounts appropriated annually by Congress to fund the operations of the Department.
79
U.S. Department of the Treasury | Fiscal Year 2012
Revolving funds are used for continuing cycles of business-like activity in which the fund charges for the sale of products
or services and uses the proceeds to finance its spending, usually without requirement for annual appropriations. A
public enterprise revolving fund is an account that is authorized by law to be credited with offsetting collections from the
public, and those monies are used to finance operations. Also included in revolving funds are the working capital fund
and financing funds. The working capital fund is a fee-for-service fund established to support operations of components
within the Department. The financing funds relate to credit reform activities.
Special funds include funds designated for specific purposes, including the disbursement of non-entity monies received
in connection with the Presidential Election Campaign. Clearing funds represent reconciling differences with the
Department’s balances as reported in the U.S. Government’s central accounts. These fund accounts temporarily hold
unidentifiable general, special, or trust fund collections that belong to the U.S. Government until they are classified to the
proper receipt or expenditure account by the federal entity. Deposit funds represent seized cash, and other amounts
received as an advance that are not accompanied by an order.
STATUS OF FUND BALANCE
As of September 30, 2012 and 2011, the status of the fund balance consisted of the following (in millions):
2012 2011
Unobligated Balance – Available $ 255,227 $ 270,786
Unobligated Balance - Not Available 84,371 98,168
Unpaid Obligations 252,169 270,983
Subtotal 591,767 639,937
Adjustment for Borrowing Authority (109,930) (123,844)
Adjustment for ESF (103,763) (105,026)
Adjustment for IMF (32,093) (27,065)
Adjustment for Intra-Treasury Investments (7,251) (7,024)
Adjustment for Non-Budgetary Funds 973 674
Adjustment for Authority Unavailable for Obligations 3,706 3,721
Other Adjustments 937 411
Total Status of Fund Balance $ 344,346 $ 381,784
Portions of the Unobligated Balance Not Available, as shown on the Combined Statement of Budgetary Resources,
include amounts appropriated in prior fiscal years that are not available to fund new obligations. However, such amounts
may be used for upward and downward adjustments for existing obligations in future years. The Unpaid Obligations
represent amounts designated for payment of goods and services ordered but not received or goods and services received
but for which payment has not yet been made.
Since the following line items do not post to budgetary status accounts, the following adjustments are required to
reconcile the budgetary status to the non-budgetary Fund Balance as reported on the Consolidated Balance Sheets:
Adjustments for Borrowing Authority – Borrowing authority is in budgetary status but not in the Fund Balance
Adjustments for ESF – ESF investments and related balances that meet the criteria for reporting as part of budgetary
resources are reported on the Statement of Budgetary Resources; however, they are not a component of the Fund
Balance as they represent invested funds
Adjustments for IMF – IMF related balances that meet the criteria for reporting as part of budgetary resources;
however, they are not a component of the Fund Balance as they represent other monetary assets
Adjustments for Intra-Treasury Investments – Budgetary resources include investments, however, the money has
been moved from the Fund Balance asset account to Investments
80
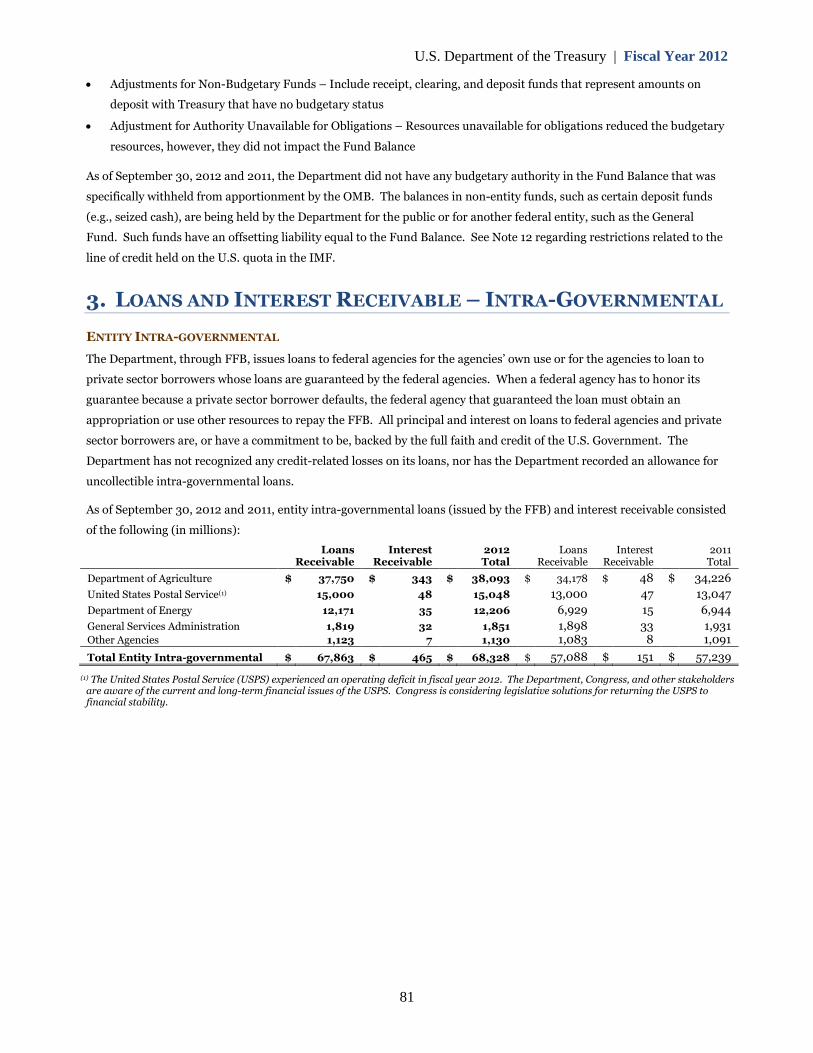
U.S. Department of the Treasury | Fiscal Year 2012
Adjustments for Non-Budgetary Funds – Include receipt, clearing, and deposit funds that represent amounts on
deposit with Treasury that have no budgetary status
Adjustment for Authority Unavailable for Obligations – Resources unavailable for obligations reduced the budgetary
resources, however, they did not impact the Fund Balance
As of September 30, 2012 and 2011, the Department did not have any budgetary authority in the Fund Balance that was
specifically withheld from apportionment by the OMB. The balances in non-entity funds, such as certain deposit funds
(e.g., seized cash), are being held by the Department for the public or for another federal entity, such as the General
Fund. Such funds have an offsetting liability equal to the Fund Balance. See Note 12 regarding restrictions related to the
line of credit held on the U.S. quota in the IMF.
3. LOANS AND INTEREST RECEIVABLE – INTRA-GOVERNMENTAL
ENTITY INTRA-GOVERNMENTAL
The Department, through FFB, issues loans to federal agencies for the agencies’ own use or for the agencies to loan to
private sector borrowers whose loans are guaranteed by the federal agencies. When a federal agency has to honor its
guarantee because a private sector borrower defaults, the federal agency that guaranteed the loan must obtain an
appropriation or use other resources to repay the FFB. All principal and interest on loans to federal agencies and private
sector borrowers are, or have a commitment to be, backed by the full faith and credit of the U.S. Government. The
Department has not recognized any credit-related losses on its loans, nor has the Department recorded an allowance for
uncollectible intra-governmental loans.
As of September 30, 2012 and 2011, entity intra-governmental loans (issued by the FFB) and interest receivable consisted
of the following (in millions):
LoansReceivable
InterestReceivable
2012Total
LoansReceivable
InterestReceivable
2011Total
Department of Agriculture $ 37,750 $ 343 $ 38,093 $ 34,178 $ 48 $ 34,226
United States Postal Service(1) 15,000 48 15,048 13,000 47 13,047
Department of Energy 12,171 35 12,206 6,929 15 6,944
General Services Administration 1,819 32 1,851 1,898 33 1,931Other Agencies 1,123 7 1,130 1,083 8 1,091
Total Entity Intra-governmental $ 67,863 $ 465 $ 68,328 $ 57,088 $ 151 $ 57,239
(1) The United States Postal Service (USPS) experienced an operating deficit in fiscal year 2012. The Department, Congress, and other stakeholdersare aware of the current and long-term financial issues of the USPS. Congress is considering legislative solutions for returning the USPS tofinancial stability.
81
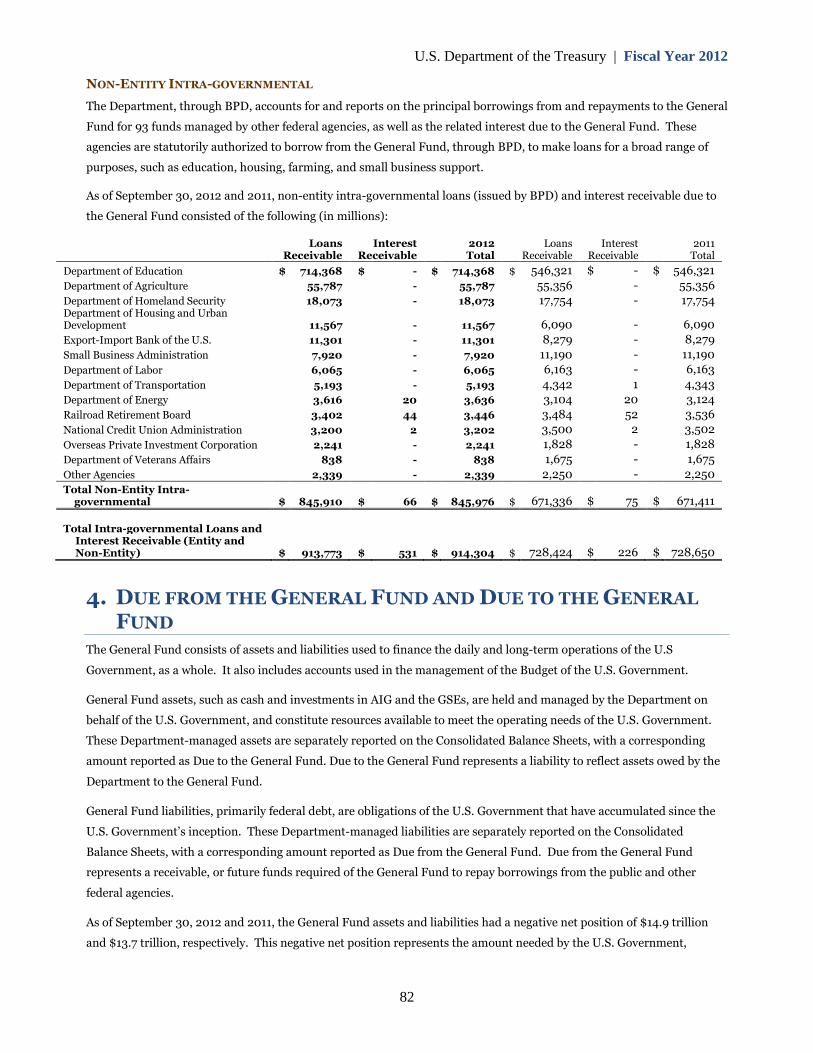
U.S. Department of the Treasury | Fiscal Year 2012
NON-ENTITY INTRA-GOVERNMENTAL
The Department, through BPD, accounts for and reports on the principal borrowings from and repayments to the General
Fund for 93 funds managed by other federal agencies, as well as the related interest due to the General Fund. These
agencies are statutorily authorized to borrow from the General Fund, through BPD, to make loans for a broad range of
purposes, such as education, housing, farming, and small business support.
As of September 30, 2012 and 2011, non-entity intra-governmental loans (issued by BPD) and interest receivable due to
the General Fund consisted of the following (in millions):
LoansReceivable
InterestReceivable
2012Total
LoansReceivable
InterestReceivable
2011Total
Department of Education
Department of Agriculture
Department of Homeland SecurityDepartment of Housing and UrbanDevelopment
Export-Import Bank of the U.S.
Small Business Administration
Department of Labor
Department of Transportation
Department of Energy
Railroad Retirement Board
National Credit Union Administration
Overseas Private Investment Corporation
Department of Veterans Affairs
Other Agencies
$ 714,368
55,787
18,073
11,567
11,301
7,920
6,065
5,193
3,616
3,402
3,200
2,241
838
2,339
$ -
-
-
-
-
-
-
-
20
44
2
-
-
-
$ 714,368
55,787
18,073
11,567
11,301
7,920
6,065
5,193
3,636
3,446
3,202
2,241
838
2,339
$ 546,321
55,356
17,754
6,090
8,279
11,1906,163
4,342
3,104
3,4843,500
1,828
1,675
2,250
$ -
-
-
-
-
--
1
20
522
-
-
-
$ 546,321
55,356
17,754
6,090
8,279
11,1906,163
4,343
3,124
3,5363,502
1,828
1,675
2,250
Total Non-Entity Intra-governmental $ 845,910 $ 66 $ 845,976 $ 671,336 $ 75 $ 671,411
Total Intra-governmental Loans andInterest Receivable (Entity andNon-Entity) $ 913,773 $ 531 $ 914,304 $ 728,424 $ 226 $ 728,650
4. DUE FROM THE GENERAL FUND AND DUE TO THE GENERAL
FUND
The General Fund consists of assets and liabilities used to finance the daily and long-term operations of the U.S
Government, as a whole. It also includes accounts used in the management of the Budget of the U.S. Government.
General Fund assets, such as cash and investments in AIG and the GSEs, are held and managed by the Department on
behalf of the U.S. Government, and constitute resources available to meet the operating needs of the U.S. Government.
These Department-managed assets are separately reported on the Consolidated Balance Sheets, with a corresponding
amount reported as Due to the General Fund. Due to the General Fund represents a liability to reflect assets owed by the
Department to the General Fund.
General Fund liabilities, primarily federal debt, are obligations of the U.S. Government that have accumulated since the
U.S. Government’s inception. These Department-managed liabilities are separately reported on the Consolidated
Balance Sheets, with a corresponding amount reported as Due from the General Fund. Due from the General Fund
represents a receivable, or future funds required of the General Fund to repay borrowings from the public and other
federal agencies.
As of September 30, 2012 and 2011, the General Fund assets and liabilities had a negative net position of $14.9 trillion
and $13.7 trillion, respectively. This negative net position represents the amount needed by the U.S. Government,
82
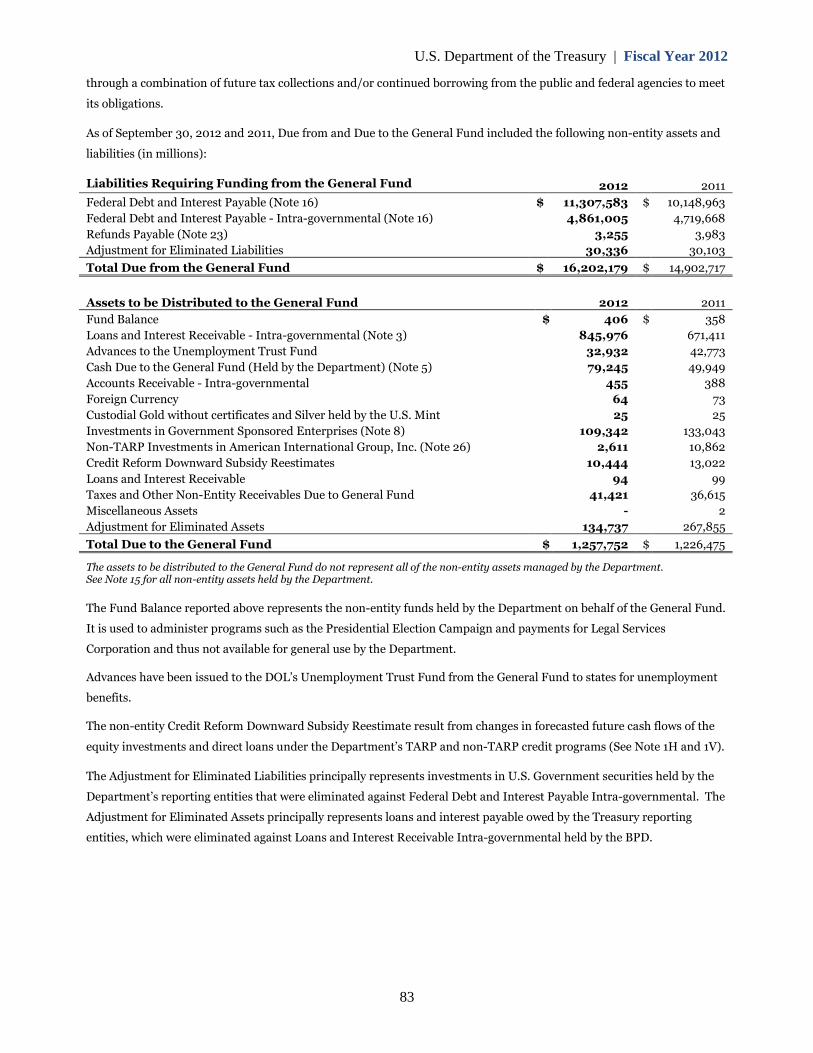
U.S. Department of the Treasury | Fiscal Year 2012
through a combination of future tax collections and/or continued borrowing from the public and federal agencies to meet
its obligations.
As of September 30, 2012 and 2011, Due from and Due to the General Fund included the following non-entity assets and
liabilities (in millions):
Liabilities Requiring Funding from the General Fund 2012 2011
Federal Debt and Interest Payable (Note 16)
Federal Debt and Interest Payable - Intra-governmental (Note 16)
Refunds Payable (Note 23)
Adjustment for Eliminated Liabilities
$ 11,307,583
4,861,005
3,255
30,336
$ 10,148,963
4,719,668
3,983
30,103
Total Due from the General Fund $ 16,202,179 $ 14,902,717
Assets to be Distributed to the General Fund 2012 2011
Fund Balance
Loans and Interest Receivable - Intra-governmental (Note 3)
Advances to the Unemployment Trust Fund
Cash Due to the General Fund (Held by the Department) (Note 5)
Accounts Receivable - Intra-governmental
Foreign Currency
Custodial Gold without certificates and Silver held by the U.S. Mint
Investments in Government Sponsored Enterprises (Note 8)
Non-TARP Investments in American International Group, Inc. (Note 26)
Credit Reform Downward Subsidy Reestimates
Loans and Interest Receivable
Taxes and Other Non-Entity Receivables Due to General Fund
Miscellaneous Assets
Adjustment for Eliminated Assets
$ 406
845,976
32,932
79,245
455
64
25
109,342
2,611
10,444
94
41,421
-
134,737
$ 358
671,411
42,773
49,949
388
73
25
133,043
10,862
13,022
99
36,615
2
267,855
Total Due to the General Fund $ 1,257,752 $ 1,226,475
The assets to be distributed to the General Fund do not represent all of the non-entity assets managed by the Department.See Note 15 for all non-entity assets held by the Department.
The Fund Balance reported above represents the non-entity funds held by the Department on behalf of the General Fund.
It is used to administer programs such as the Presidential Election Campaign and payments for Legal Services
Corporation and thus not available for general use by the Department.
Advances have been issued to the DOL’s Unemployment Trust Fund from the General Fund to states for unemployment
benefits.
The non-entity Credit Reform Downward Subsidy Reestimate result from changes in forecasted future cash flows of the
equity investments and direct loans under the Department’s TARP and non-TARP credit programs (See Note 1H and 1V).
The Adjustment for Eliminated Liabilities principally represents investments in U.S. Government securities held by the
Department’s reporting entities that were eliminated against Federal Debt and Interest Payable Intra-governmental. The
Adjustment for Eliminated Assets principally represents loans and interest payable owed by the Treasury reporting
entities, which were eliminated against Loans and Interest Receivable Intra-governmental held by the BPD.
83
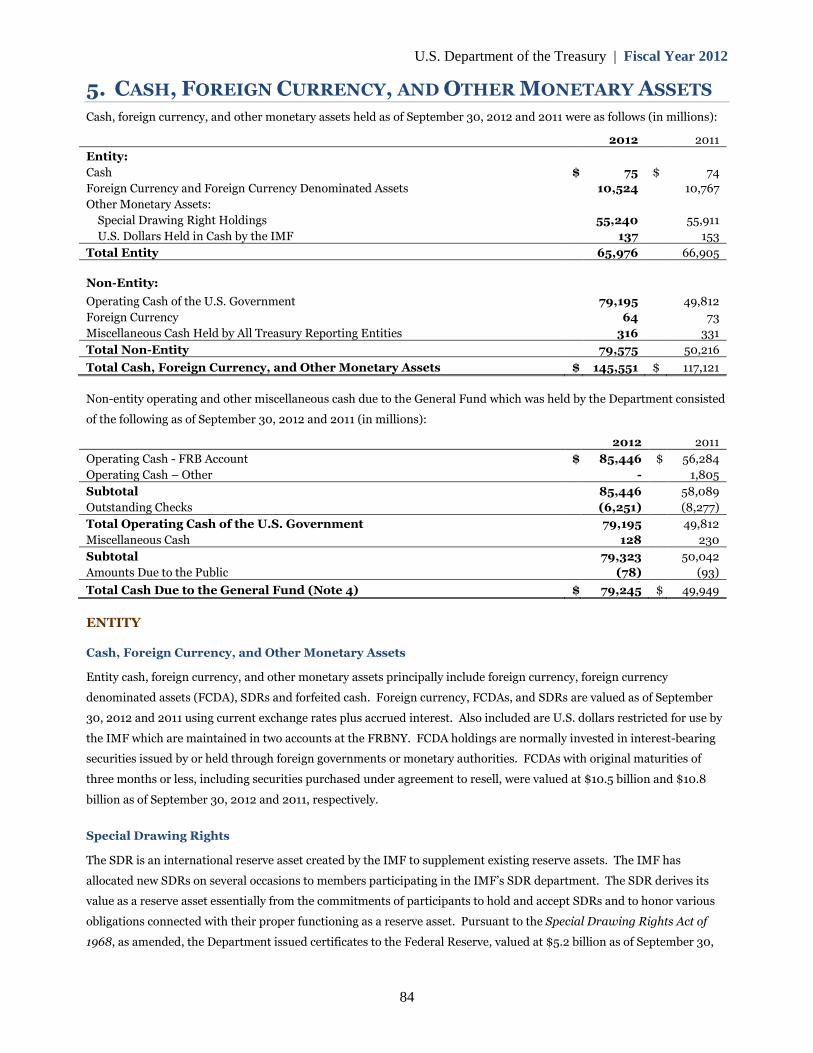
U.S. Department of the Treasury | Fiscal Year 2012
5. CASH, FOREIGN CURRENCY, AND OTHER MONETARY ASSETS
Cash, foreign currency, and other monetary assets held as of September 30, 2012 and 2011 were as follows (in millions):
2012 2011
Entity:
Cash
Foreign Currency and Foreign Currency Denominated Assets
Other Monetary Assets:
Special Drawing Right Holdings
U.S. Dollars Held in Cash by the IMF
$ 75
10,524
55,240
137
$ 74
10,767
55,911
153
Total Entity 65,976 66,905
Non-Entity:
Operating Cash of the U.S. Government
Foreign Currency
Miscellaneous Cash Held by All Treasury Reporting Entities
79,195
64
316
49,812
73
331
Total Non-Entity 79,575 50,216
Total Cash, Foreign Currency, and Other Monetary Assets $ 145,551 $ 117,121
Non-entity operating and other miscellaneous cash due to the General Fund which was held by the Department consisted
of the following as of September 30, 2012 and 2011 (in millions):
2012 2011
Operating Cash - FRB Account
Operating Cash – Other
$ 85,446
-
$ 56,284
1,805
Subtotal
Outstanding Checks
85,446
(6,251)
58,089
(8,277)
Total Operating Cash of the U.S. Government
Miscellaneous Cash
79,195
128
49,812
230
Subtotal
Amounts Due to the Public
79,323
(78)
50,042
(93)
Total Cash Due to the General Fund (Note 4) $ 79,245 $ 49,949
ENTITY
Cash, Foreign Currency, and Other Monetary Assets
Entity cash, foreign currency, and other monetary assets principally include foreign currency, foreign currency
denominated assets (FCDA), SDRs and forfeited cash. Foreign currency, FCDAs, and SDRs are valued as of September
30, 2012 and 2011 using current exchange rates plus accrued interest. Also included are U.S. dollars restricted for use by
the IMF which are maintained in two accounts at the FRBNY. FCDA holdings are normally invested in interest-bearing
securities issued by or held through foreign governments or monetary authorities. FCDAs with original maturities of
three months or less, including securities purchased under agreement to resell, were valued at $10.5 billion and $10.8
billion as of September 30, 2012 and 2011, respectively.
Special Drawing Rights
The SDR is an international reserve asset created by the IMF to supplement existing reserve assets. The IMF has
allocated new SDRs on several occasions to members participating in the IMF’s SDR department. The SDR derives its
value as a reserve asset essentially from the commitments of participants to hold and accept SDRs and to honor various
obligations connected with their proper functioning as a reserve asset. Pursuant to the Special Drawing Rights Act of
1968, as amended, the Department issued certificates to the Federal Reserve, valued at $5.2 billion as of September 30,
84
U.S. Department of the Treasury | Fiscal Year 2012
2012 and 2011, to finance its acquisition of SDRs from other countries or to provide U.S. dollar resources for financing
other ESF operations.
On a daily basis, the IMF calculates the value of the SDR using the market value in terms of the U.S. dollar from weighted
amounts of each of four freely usable currencies, as defined by the IMF. These currencies are the U.S. dollar, the
European euro, the Japanese yen, and the British pound sterling. The Department’s SDR holdings (assets resulting from
various SDR-related activities including remuneration on the U.S. reserve position) and allocations from the IMF
(liabilities of the United States coming due only in the event of a liquidation of, or United States withdrawal from, the
SDR department of the IMF, or cancellation of SDRs) are revalued monthly based on the SDR valuation rate calculated
by the IMF, resulting in the recognition of unrealized gains or losses on revaluation.
Pursuant to the IMF Articles of Agreement, SDRs allocated to or otherwise acquired by the United States are permanent
resources unless:
cancelled by the Board of Governors pursuant to an 85.0 percent majority decision of the total voting power of
IMF members;
the SDR department of the IMF is liquidated;
the IMF is liquidated; or
the United States chooses to withdraw from the IMF or terminate its participation in the SDR department
Except for the payment of interest and charges on SDR allocations to the United States, the payment of the Department’s
commitment related to SDR allocations is conditional on events listed above, in which the United States has a substantial
or controlling voice. Allocations of SDRs were made in 1970, 1971, 1972, 1979, 1980, 1981, and 2009. The United States
has received no SDR allocations since 2009.
As of September 30, 2012 and 2011, the total amount of SDR holdings of the United States was the equivalent of $55.2
billion and $55.9 billion, respectively. As of September 30, 2012 and 2011, the total value of SDR allocations to the
United States was the equivalent of $54.5 billion and $55.1 billion, respectively.
Securities Purchased Under Agreement to Resell
The FRBNY, on behalf of the ESF, enters into transactions to purchase foreign-currency-denominated government-debt
securities under agreements to resell for which the accepted collateral is the debt instruments, denominated in Euros,
and issued or guaranteed in full by European governments. These agreements are subject to daily margining
requirements.
NON-ENTITY
Cash, Foreign Currency, and Other Monetary Assets
Non-entity cash, foreign currency, and other monetary assets principally include the Operating Cash of the U.S.
Government which is managed by the Department. Also included is foreign currency maintained by various U.S.
disbursing offices. It also includes miscellaneous cash such as seized monetary instruments, undistributed cash, and
offers in compromises which are maintained as a result of the Department’s tax collecting responsibilities.
The Operating Cash of the U.S. Government represents balances from tax collections, other revenues, federal debt
receipts, and other receipts, net of checks outstanding, which are held in the FRBs and in foreign and domestic financial
institutions.
Operating Cash of the U.S. Government is either insured by the FDIC (for balances up to $250,000 as of September 30,
2012 and 2011), or collateralized by securities pledged by the depository institutions and held by the FRB.
85
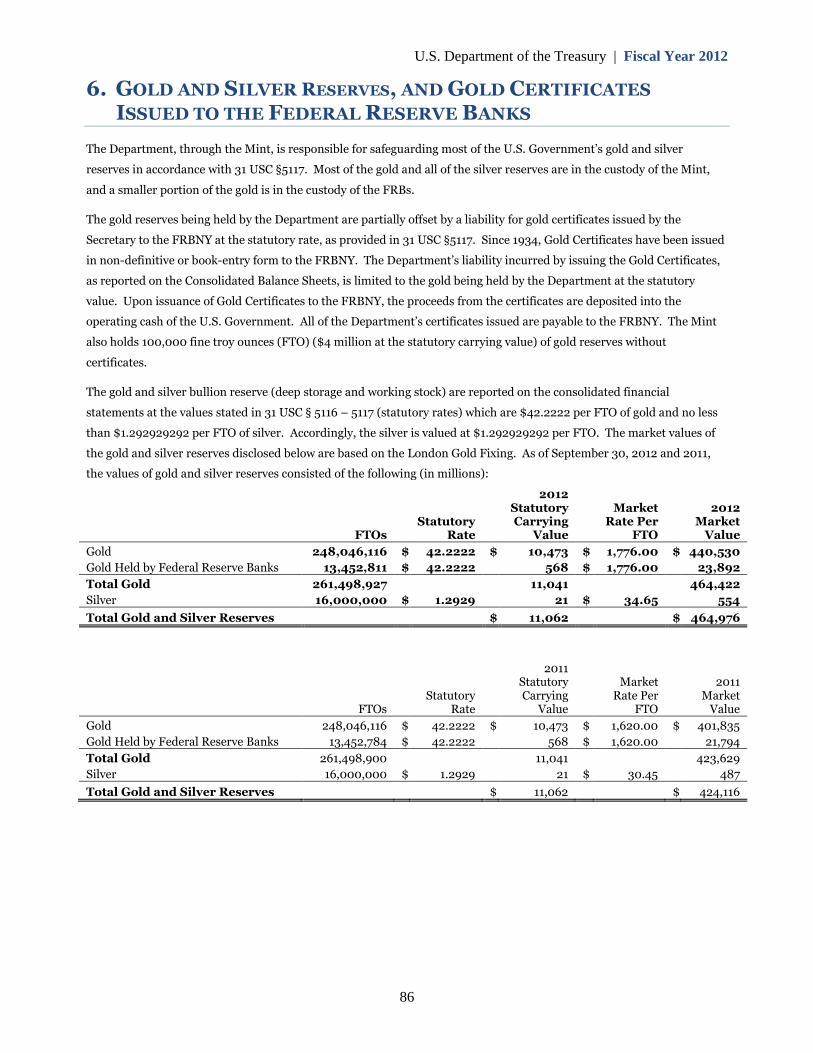
U.S. Department of the Treasury | Fiscal Year 2012
6. GOLD AND SILVER RESERVES, AND GOLD CERTIFICATES
ISSUED TO THE FEDERAL RESERVE BANKS
The Department, through the Mint, is responsible for safeguarding most of the U.S. Government’s gold and silver
reserves in accordance with 31 USC §5117. Most of the gold and all of the silver reserves are in the custody of the Mint,
and a smaller portion of the gold is in the custody of the FRBs.
The gold reserves being held by the Department are partially offset by a liability for gold certificates issued by the
Secretary to the FRBNY at the statutory rate, as provided in 31 USC §5117. Since 1934, Gold Certificates have been issued
in non-definitive or book-entry form to the FRBNY. The Department’s liability incurred by issuing the Gold Certificates,
as reported on the Consolidated Balance Sheets, is limited to the gold being held by the Department at the statutory
value. Upon issuance of Gold Certificates to the FRBNY, the proceeds from the certificates are deposited into the
operating cash of the U.S. Government. All of the Department’s certificates issued are payable to the FRBNY. The Mint
also holds 100,000 fine troy ounces (FTO) ($4 million at the statutory carrying value) of gold reserves without
certificates.
The gold and silver bullion reserve (deep storage and working stock) are reported on the consolidated financial
statements at the values stated in 31 USC § 5116 – 5117 (statutory rates) which are $42.2222 per FTO of gold and no less
than $1.292929292 per FTO of silver. Accordingly, the silver is valued at $1.292929292 per FTO. The market values of
the gold and silver reserves disclosed below are based on the London Gold Fixing. As of September 30, 2012 and 2011,
the values of gold and silver reserves consisted of the following (in millions):
FTOsStatutory
Rate
2012StatutoryCarrying
Value
MarketRate Per
FTO
2012Market
Value
Gold 248,046,116 $ 42.2222 $ 10,473 $ 1,776.00 $ 440,530
Gold Held by Federal Reserve Banks 13,452,811 $ 42.2222 568 $ 1,776.00 23,892
Total Gold 261,498,927 11,041 464,422
Silver 16,000,000 $ 1.2929 21 $ 34.65 554
Total Gold and Silver Reserves $ 11,062 $ 464,976
FTOsStatutory
Rate
2011StatutoryCarrying
Value
MarketRate Per
FTO
2011Market
Value
Gold 248,046,116 $ 42.2222 $ 10,473 $ 1,620.00 $ 401,835
Gold Held by Federal Reserve Banks 13,452,784 $ 42.2222 568 $ 1,620.00 21,794
Total Gold 261,498,900 11,041 423,629
Silver 16,000,000 $ 1.2929 21 $ 30.45 487
Total Gold and Silver Reserves $ 11,062 $ 424,116
86
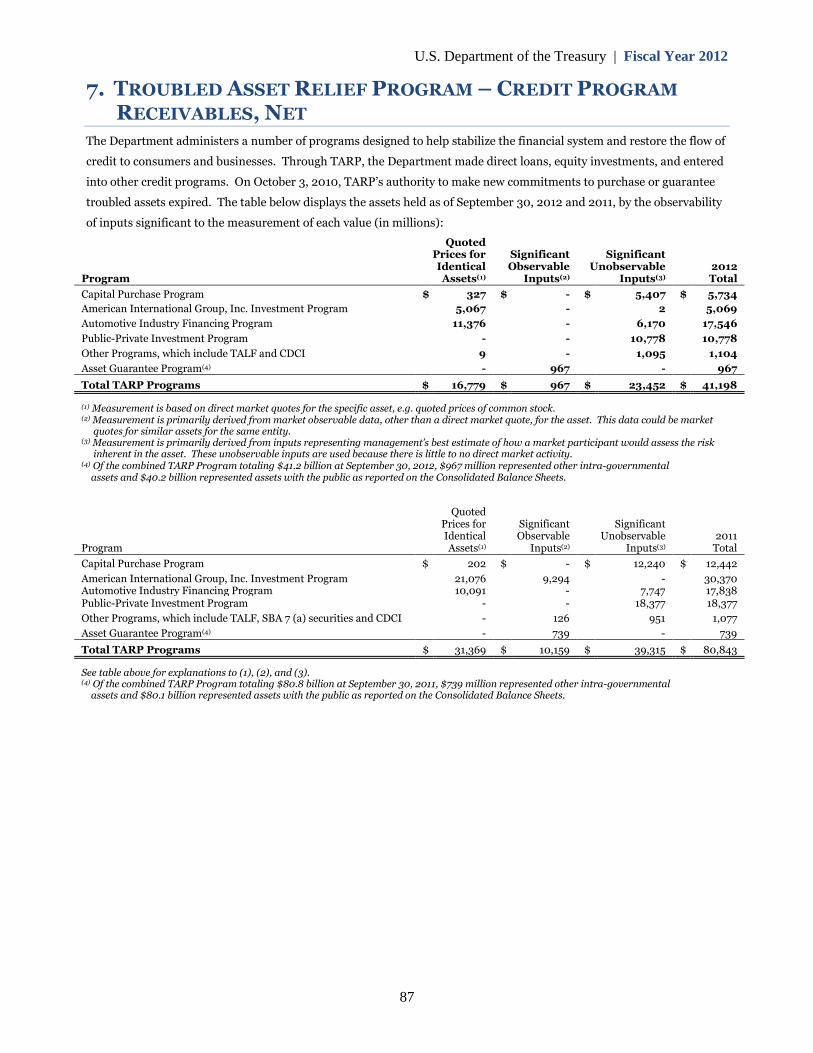
U.S. Department of the Treasury | Fiscal Year 2012
7. TROUBLED ASSET RELIEF PROGRAM – CREDIT PROGRAM
RECEIVABLES, NET
The Department administers a number of programs designed to help stabilize the financial system and restore the flow of
credit to consumers and businesses. Through TARP, the Department made direct loans, equity investments, and entered
into other credit programs. On October 3, 2010, TARP’s authority to make new commitments to purchase or guarantee
troubled assets expired. The table below displays the assets held as of September 30, 2012 and 2011, by the observability
of inputs significant to the measurement of each value (in millions):
Quoted
Program
Prices forIdenticalAssets(1)
SignificantObservable
Inputs(2)
SignificantUnobservable
Inputs(3)
2012Total
Capital Purchase Program
American International Group, Inc. Investment Program
Automotive Industry Financing Program
Public-Private Investment Program
Other Programs, which include TALF and CDCI
Asset Guarantee Program(4)
$ 327
5,067
11,376
-
9
-
$ -
-
-
-
-
967
$ 5,407
2
6,170
10,778
1,095
-
$ 5,734
5,069
17,546
10,778
1,104
967
Total TARP Programs $ 16,779 $ 967 $ 23,452 $ 41,198
(1) Measurement is based on direct market quotes for the specific asset, e.g. quoted prices of common stock.(2) Measurement is primarily derived from market observable data, other than a direct market quote, for the asset. This data could be market
quotes for similar assets for the same entity.(3) Measurement is primarily derived from inputs representing management’s best estimate of how a market participant would assess the risk
inherent in the asset. These unobservable inputs are used because there is little to no direct market activity.(4) Of the combined TARP Program totaling $41.2 billion at September 30, 2012, $967 million represented other intra-governmental
assets and $40.2 billion represented assets with the public as reported on the Consolidated Balance Sheets.
QuotedPrices for Significant SignificantIdentical Observable Unobservable 2011
Program Assets(1) Inputs(2) Inputs(3) Total
Capital Purchase Program $ 202 $ - $ 12,240 $ 12,442
American International Group, Inc. Investment Program 21,076 9,294 - 30,370Automotive Industry Financing Program 10,091 - 7,747 17,838Public-Private Investment Program - - 18,377 18,377
Other Programs, which include TALF, SBA 7 (a) securities and CDCI - 126 951 1,077
Asset Guarantee Program(4) - 739 - 739
Total TARP Programs $ 31,369 $ 10,159 $ 39,315 $ 80,843
See table above for explanations to (1), (2), and (3).(4) Of the combined TARP Program totaling $80.8 billion at September 30, 2011, $739 million represented other intra-governmental
assets and $80.1 billion represented assets with the public as reported on the Consolidated Balance Sheets.
87
U.S. Department of the Treasury | Fiscal Year 2012
DIRECT LOAN AND EQUITY INVESTMENT PROGRAMS
Capital Purchase Program
TARP began implementing programs in fiscal year 2009, commencing with the Capital Purchase Program (CPP) which
was designed to help stabilize the financial system by assisting in building the capital base of certain viable U.S. financial
institutions to increase the capacity of those institutions to lend to businesses and consumers and support the economy.
Under this program, the Department invested a total of $204.9 billion and purchased senior perpetual preferred stock
and subordinate debentures from qualifying U.S. controlled banks, savings associations, and certain bank and savings
and loan holding companies (Qualified Financial Institution or QFI). Additionally, the Department exercised warrants
received from non-public QFIs resulting in additional holdings of senior preferred stock (or subordinated debentures as
appropriate). The senior preferred stock has a stated dividend rate ranging from 5.0 percent to 9.0 percent. The
dividends are cumulative for bank holding companies and subsidiaries of bank holding companies, and non-cumulative
for others, and payable when and if declared by the institution’s board of directors. QFIs that are Sub-chapter S
corporations (public and non-public) issued subordinated debentures that have a maturity of 30 years, and interest rates
ranging from 7.7 percent to 13.8 percent. QFIs, subject to regulatory approval, may repay the Department’s investment at
any time. For fiscal years 2012 and 2011, repayments and sales of CPP investments totaled $8.2 billion and $30.2 billion,
respectively.
In addition to the senior preferred stock, the Department received warrants from public QFIs to purchase a number of
shares of common stock. The warrants have a ten-year term, and the Department may exercise any warrants held in
whole or in part at any time.
As part of the management of the investments in CPP, the Department entered into certain agreements to exchange
and/or convert existing investments. In fiscal year 2009, the Department entered into an exchange agreement with
Citigroup under which the Department exchanged $25.0 billion of its investment in Citigroup senior preferred stock for
7.7 billion shares of Citigroup common stock, at $3.25 per share. Between April 2010 and January 2011, the Department
had sold all of its Citigroup common stock held, generating cash proceeds of $31.9 billion, resulting in proceeds in excess
of cost of $6.9 billion (cash proceeds from sales of Citigroup common stock and warrants in fiscal year 2011 were $15.8
billion, which exceeded cost by $3.9 billion).
The Department entered into other transactions with various financial institutions which generally are in poor financial
condition with a high likelihood of failure. The changes in cost associated with these transactions are considered
workouts rather than modifications, in accordance with SFFAS No. 2, and are captured in the year-end reestimates.
Of the $8.2 billion in CPP investment repayments and sales during fiscal year 2012, net proceeds of $1.3 billion resulted
from auction sales which stemmed from the Department’s decision in fiscal year 2012 to sell certain CPP investments to
the public in auction sales. Total repayments and sales resulted in net proceeds less than cost of $285 million in fiscal
year 2012. Because these auction sales were not considered in the formulation estimate for the CPP program, a
modification was recorded, increasing the cost of the program by $973 million. During fiscal year 2011, certain financial
institutions participating in CPP became eligible to exchange their TARP-held stock investments to preferred stock in the
SBLF program (Note 11). Because this refinance was not considered in the formulation estimate for the CPP program, a
modification was recorded in fiscal year 2011, resulting in a subsidy cost reduction of $1.0 billion.
The estimated value of the CPP preferred equity investments is based on the net present values of the expected dividend
payments and proceeds from repurchases and sales. The model assumes a probabilistic evolution of each institution’s
asset-to-liability ratio (based on the estimated fair value of the institution’s assets against its liabilities). Historical
volatility is used to scale the likely evolution of each institution’s asset-to-liability ratio. Inputs to the model include
88
U.S. Department of the Treasury | Fiscal Year 2012
institution specific accounting data obtained from regulatory filings, an institution’s stock price volatility, historical bank
failure information, as well as market prices of comparable securities trading in the market. The market risk adjustment
is obtained through a calibration process to the market value of certain trading securities of financial institutions within
the TARP programs or other comparable financial institutions. The Department estimates the values and projects the
cash flows of warrants using an option-pricing approach based on the current stock price and its volatility. Investments
in common stock which are exchange traded are valued at the quoted market price as of fiscal year end.
American International Group, Inc. Investment Program
The Department provided assistance to systemically significant financial institutions on a case by case basis in order to
help provide stability to those institutions that were critical to a functioning financial system and were at substantial risk
of failure, as well as to help prevent broader disruption to financial markets. In fiscal year 2009, the Department
invested in AIG which (after being restructured in the same fiscal year) consisted of $41.6 billion of AIG’s non-cumulative
10.0 percent Series E preferred stock. Additionally, the Department made available to AIG a $29.8 billion equity capital
facility and received AIG’s non-cumulative 10.0 percent Series F preferred stock under which AIG drew $27.8 billion. In
January 2011, the Department (in combination with AIG and the FRBNY) restructured the AIG investments in which it
converted the $41.6 billion of Series E preferred stock and $27.8 billion of the Series F equity capital facility into a $20.3
billion interest in AIG SPVs, and 1.1 billion shares of AIG common stock. The remaining $2.0 billion of undrawn Series F
capital facility was converted to a new equity capital facility that was subsequently cancelled in fiscal year 2011.
Additionally, the credit facility between FRBNY and AIG was terminated, and the Department (not TARP) on behalf of
the General Fund separately received 563 million shares of AIG common stock (Note 26). Upon completion of the
restructuring, the Department (including TARP) held a combined total of 1.7 billion shares of AIG common stock, or 92.1
percent of AIG’s common stock equity.
Since the January 2011 restructuring, the Department (including TARP) has sold shares of the AIG common stock in the
open market. During fiscal year 2012, the Department (including TARP) sold 1.2 billion shares of AIG common stock for
$38.2 billion, of which the General Fund and TARP received $13.0 billion and $25.2 billion, respectively. In fiscal year
2011, the Department (including TARP) sold 200 million shares of AIG common stock for $5.8 billion, of which the
General Fund and TARP received $2.0 billion and $3.8 billion, respectively. For the TARP shares sold, the proceeds were
less than the Department’s cost by $9.9 billion and $1.9 billion for fiscal years 2012 and 2011, respectively. AIG common
shares sold by the General Fund were provided at no cost to the Department. At September 30, 2012 and 2011, the
Department owned 234 million shares and 1.5 billion shares of AIG common stock, respectively, with a fair value totaling
approximately $7.7 billion and $31.9 billion, or 15.9 percent and 76.9 percent of AIG’s outstanding common stock,
respectively. Of this total, TARP owned 154 million shares and 960 million shares, at September 30, 2012 and 2011,
respectively, or 10.5 percent ($5.1 billion fair value) and 50.8 percent ($21.1 billion fair value) of AIG’s outstanding
common stock, respectively. The fair value of the AIG common stock was based on the New York Stock Exchange (NYSE)
quoted market price as of September 30, 2012 and 2011.
In fiscal year 2012, the Department received $9.6 billion in distributions from the AIG SPVs, which fully repaid the
remaining investment balance of $9.3 billion. The Department recorded proceeds in excess of cost of $127 million plus
investment income of $191 million. In fiscal year 2011, the Department received $11.5 billion in distributions from the
AIG SPVs, reduced its AIG SPV outstanding balance by $11.2 billion to $9.3 billion, and received investment income of
$246 million, and recorded capitalized dividend income of $204 million. The SPVs were valued at their liquidation
preference since the value of the underlying assets within the SPVs greatly exceeded the liquidation preference.
89
U.S. Department of the Treasury | Fiscal Year 2012
Automotive Industry Financing Program
The Automotive Industry Financing Program (AIFP) was designed to help prevent a significant disruption of the
American automotive industry, which could have had a negative effect on the economy of the United States.
General Motors Company and General Motors Corporation
In fiscal year 2009, the Department provided $49.5 billion to General Motors Corporation (Old GM) through various
loan agreements including the initial loan for general and working capital purposes and the final loan for debtor in
possession (DIP) financing while Old GM was in bankruptcy. During fiscal year 2009, the Department and a newly
created General Motors Company (New GM) extinguished substantially all but $7.1 billion of these initial financing
arrangements, and the Department received $2.1 billion in 9.0 percent cumulative perpetual preferred stock and 60.8
percent of the common equity interest in New GM. Additionally, New GM assumed $7.1 billion of the original DIP loan
which it fully repaid to the Department by the end of fiscal year 2010.
During fiscal year 2011, New GM repurchased its preferred stock for 102.0 percent of its liquidation amount, or $2.1
billion. As part of an initial public offering by New GM in fiscal year 2011, the Department sold approximately 412
million shares of its common stock for $13.5 billion. The sale resulted in net proceeds less than cost of $4.4 billion. At
September 30, 2012 and 2011, the Department held 500 million shares of the common stock of New GM, which
represented approximately 32.0 percent of New GM’s common stock outstanding. The fair value of the New GM
common shares held as of September 30, 2012 and 2011 was $11.4 billion and $10.1 billion, respectively, based on the
NYSE quoted market price.
Chrysler Group LLC and Chrysler Holding LLC
In fiscal year 2009, the Department invested $5.9 billion in Chrysler Holding LLC (Old Chrysler), consisting of $4.0
billion for general and working capital purposes (the general purpose loan) and $1.9 billion in DIP financing while Old
Chrysler was in bankruptcy. Upon entering bankruptcy, a portion of Old Chrysler was sold to a newly created entity,
Chrysler Group LLC (New Chrysler). In fiscal year 2010, under the terms of a bankruptcy agreement, the initial financing
to Old Chrysler was replaced by financing to New Chrysler in which the Department funded a $4.6 billion loan to New
Chrysler, with a commitment to fund it an additional $2.1 billion. Also, New Chrysler assumed $500 million of the Old
Chrysler general purpose loan. In fiscal year 2011, New Chrysler repaid the $5.1 billion loan principal ($4.6 billion
funded and $500 million assumed from Old Chrysler) and interest due on the loan, and the Department terminated New
Chrysler’s ability to draw on the remaining available $2.1 billion loan commitment. Total net proceeds received relating
to the fiscal year 2011 transactions were $896 million less than the Department’s cost. As a result of these transactions,
the Department had no remaining interest in New Chrysler as of September 30, 2012 and 2011. The Department
continues to hold a right to receive proceeds from a bankruptcy liquidation trust, but no significant cash flows are
expected.
Ally Financial Inc. (formerly known as GMAC Inc.)
The Department invested a total of $16.3 billion in GMAC Inc. between December 2008 and December 2009 to help
support its ability to originate new loans to GM and Chrysler dealers and consumers, and to help address GMAC’s capital
needs. In May 2010, GMAC changed its corporate name to Ally Financial, Inc. (Ally). As a result of original investments,
exchanges, conversions and warrant exercises, as of September 30, 2012 and 2011, the Department held 981,971 shares of
Ally common stock, representing 73.8 percent of Ally’s outstanding common stock. The Department also held 119 million
shares of Ally Series F-2 Mandatorily Convertible Preferred Securities, with a $50 per share liquidation preference and a
stated dividend rate of 9.0 percent, and are convertible into at least 513,000 shares of Ally common stock at Ally’s option
subject to approval of the FRB and consent by the Department, or pursuant to an order by the FRB compelling such
90
U.S. Department of the Treasury | Fiscal Year 2012
conversion. The Series F-2 security is also convertible at the option of the Department upon certain specified corporate
events. Absent any optional conversion, any Series F-2 remaining preferred shares will automatically convert to Ally
common stock after seven years from the issuance date. When combined with the Ally common stock currently owned,
conversion of the Series F-2 preferred stock into common stock would represent 81.0 percent ownership of Ally common
stock held by the Department. In fiscal years 2012 and 2011, the Department received $534 million and $839 million in
dividends from Ally, respectively.
Prior to September 30, 2011, the Department held 2.7 million shares of 8.0 percent cumulative Trust Preferred Securities
(TruPS) with a $1,000 per share liquidation preference. During fiscal year 2011, the agreement between Ally and the
Department regarding its TruPS was amended to facilitate the Department’s sale of these securities on the open market.
Because this amendment to agreement terms was not considered in the formulation subsidy cost estimate for the
program, the Department recorded a modification resulting in a subsidy cost reduction of $174 million. In March 2011,
the Department sold its TruPS for $2.7 billion, resulting in proceeds in excess of cost of $127 million.
As of September 30, 2012 and 2011, for investments in Ally’s common equity and mandatorily convertible preferred
stock, which are valued on an “if-converted” basis, the Department used certain valuation multiples such as price-to
earnings, price-to-tangible book value, and asset manager valuations to estimate the value of the shares. The multiples
were based on those of comparable publicly-traded entities. The adjustment for market risk is incorporated in the data
points the Department uses to determine the measurement for Ally as all points rely on market data.
Public-Private Investment Program
The Public-Private Investment Program (PPIP) is part of the Department’s efforts to help restart the financial securities
market and provide liquidity for legacy securities. Under this program, the Department (as a limited partner) made
equity investments in and loans to nine investment vehicles (referred to as Public-Private Investment Funds or “PPIFs”)
established by private investment managers between September and December 2009. The equity investments were used
to match private capital and equal 49.9 percent of the total equity invested. The loans bear interest at 1-Month LIBOR,
plus 1.0 percent, payable monthly. The maturity date of each loan is the earlier of ten years or the termination of the
PPIF. Each PPIF terminates in eight years from its commencement, if not previously terminated, or extended with two
one-year extensions subject to the Department’s approval. The loan agreements are subject to certain financial
covenants and require cash flows from purchased securities received by the PPIFs to be distributed in accordance with a
priority of payments schedule (waterfall) designed to help protect the interests of secured parties. As a condition of its
investment, the Department also received a warrant from each of the PPIFs entitling the Department to 2.5 percent of
investment proceeds otherwise allocable to the non-Department partners after the PPIFs return 100.0 percent of the
non-Department partners’ capital contributions. Additionally, the PPIFs pay a management fee to the fund manager
from the Department’s share of investment proceeds.
The PPIFs may invest, under certain conditions, in commercial mortgage-backed securities (CMBS) and non-agency
residential mortgage-backed securities (RMBS) issued prior to January 1, 2009, for a term of three years. The three-year
investment period for the remaining PPIFs ends December 2012. The PPIFs are also permitted to invest in certain
temporary securities, including bank deposits, U.S. Treasury securities, and certain money market mutual funds. As of
September 30, 2012, the PPIFs’ portfolios were comprised of approximately 74.0 percent RMBS and 26.0 percent CMBS,
compared to 79.0 percent and 21.0 percent, respectively, as of September 30, 2011.
At September 30, 2012 and 2011, the Department had equity investments in PPIFs outstanding of $4.1 billion and $5.5
billion, and loans outstanding of $5.7 billion and $10.4 billion, for an aggregate total of $9.8 billion and $15.9 billion,
respectively. As of September 30, 2012 and 2011, the Department had legal commitments to disburse up to $3.1 billion
91
U.S. Department of the Treasury | Fiscal Year 2012
92
and $4.3 billion, respectively, for additional investments and loans to the remaining PPIFs. During fiscal year 2012, the
Department disbursed $245 million as an equity investment and $803 million as loans to PPIFs, as compared to $1.1
billion of equity investments and $2.3 billion as loans in fiscal year 2011. In addition, the Department received $5.7
billion and $1.0 billion in loan principal and interest repayments from the PPIFs in fiscal years 2012 and 2011,
respectively. Also during fiscal year 2012, the Department received $3.2 billion in equity distributions, comprised of $1.3
billion of investment income, $223 million of proceeds in excess of cost, and a $1.7 billion reduction of the gross
investment outstanding. In fiscal year 2011, the Department received $735 million in equity distributions, comprised of
$306 million of investment income, $91 million of proceeds in excess of cost, and a $338 million reduction of the gross
investment outstanding.
The Department estimates cash flows to the PPIFs by simulating the performance of the collateral supporting the assets
held by the PPIF. Inputs used to simulate the cash flows, which consider market risks, include unemployment forecasts,
home price appreciation/depreciation forecasts, the current term structure of interest rates, historical pool performance,
and estimates of the net income and value of commercial real estate supporting the CMBS. The simulated cash flows are
then run through a financial model that defines distributions of the RMBS/CMBS to determine the estimated cash flows
to the PPIF. Once determined, these cash flows are run through the waterfall of the PPIF to determine the expected cash
flows to the Department through both the equity investments and loans.
Other Direct Loan and Equity Investment Programs
The Department initiated other programs intended to help unlock the flow of credit to consumers and small businesses.
Three programs were established to help accomplish this: the Term Asset-Backed Securities Loan Facility (TALF); the
Small Business Administration (SBA) 7(a) Securities Purchase Program, and the Community Development Capital
Initiative (CDCI). Each program is discussed in more detail below and included in the “Other Programs” column of the
table within this note.
Term Asset-Backed Securities Loan Facility
The TALF was created by the FRB to provide low-cost funding to investors in certain classes of Asset Backed Securities
(ABS). The Department agreed to participate in the program by providing liquidity and credit protection to the FRB.
Under the TALF, the FRBNY, as implementer of the TALF program, originated loans on a non-recourse basis to
purchasers of certain AAA rated ABS secured by consumer and commercial loans and CMBS. The FRBNY ceased issuing
new loans on June 30, 2010. Approximately $1.5 billion and $11.3 billion of loans due to the FRBNY remained
outstanding as of September 30, 2012 and 2011, respectively.
As part of the program, the FRBNY created the TALF, LLC, an SPV that agreed to purchase from the FRBNY any
collateral it has seized due to borrower default. The TALF, LLC would fund purchases from the accumulation of monthly
fees paid by FRBNY as compensation for the agreement. Only if the TALF, LLC had insufficient funds to purchase the
collateral did the Department commit to invest up to $20.0 billion in non-recourse subordinated notes issued by the
TALF, LLC. This commitment was reduced to $4.3 billion in fiscal year 2010, and further reduced in fiscal year 2012 to
$1.4 billion, in consultation with the FRBNY.
The Department disbursed $100 million upon creation of the TALF, LLC, and the remainder can be drawn to purchase
collateral in the event the fees are not sufficient to cover purchases. The subordinated notes bear interest at 1-Month
LIBOR plus 3.0 percent, and mature ten years from the closing date, subject to extension. As of September 30, 2012 and
2011, no TALF loans were in default and consequently no collateral was purchased by the TALF, LLC.
U.S. Department of the Treasury | Fiscal Year 2012
93
In valuing the TALF loan, the Department model derives the cash flows to the SPV, and ultimately the Department, by
simulating the performance of underlying collateral. Loss probabilities on the underlying collateral are calculated based
on analysis of historical loan loss and charge-off experience by credit sector and subsector. Impaired TALF-eligible
securities are projected to be purchased by the SPV, which could require additional Department funding. Simulation
outcomes consisting of a range of loss scenarios are probability-weighted to generate the expected net present value of
future cash flows.
SBA 7(a) Securities Purchase Program
In March 2010, the Department began purchasing securities backed by SBA 7(a) loans (7(a) Securities) as part of the
Unlocking Credit for Small Business Initiative. The program was created to provide additional liquidity to the market so
that banks are able to make more small business loans. Under this program, the Department had purchased 7(a)
securities collateralized with 7(a) loans that are guaranteed by the full faith and credit of the U.S. Government. In May
2011, the Department began selling its securities to investors; sales were completed and the program closed in January
2012. Over the course of the program, the Department had invested a total of $367 million (excluding purchased accrued
interest), and received $376 million in sales proceeds and in principal and interest payments. As of September 30, 2012,
the Department held no investment in SBA 7(a) securities, and held $128 million of these securities at September 30,
2011. During fiscal year 2012 and 2011, the Department had received $127 million and $247 million, respectively, in sales
proceeds, and in principal and interest payments on the securities. The valuation of SBA 7(a) securities was based on the
discounted estimated cash-flows of the securities.
Community Development Capital Initiative
In fiscal year 2010, the CDCI was created to provide additional low cost capital in Community Development Financial
Institutions (CDFIs) to encourage more lending to small businesses. Under the terms of the program, the Department
purchased senior preferred stock (or subordinated debt) from eligible CDFIs with an initial dividend rate of 2.0 percent
that will increase to 9.0 percent after eight years.
CDFIs participating in the CPP, subject to certain criteria, were eligible to exchange, through September 30, 2010, their
CPP preferred shares (subordinated debt) then held by the Department for CDCI preferred shares (subordinated debt).
These exchanges were treated as disbursements from CDCI and repayments to CPP. The Department had invested a total
of $570 million ($363 million as a result of exchanges from CPP) in 84 institutions under the CDCI. In fiscal year 2012,
the Department received $3 million in repayments. No repayments were received in fiscal year 2011. The Department
received $11 million in dividends and interest from its CDCI investments during both fiscal years 2012 and 2011. The
Department valued the CDCI preferred stock investments in a manner broadly analogous to the methodology used to
value the preferred stock securities within the CPP program.
OTHER CREDIT PROGRAMS
Asset Guarantee Program
The Asset Guarantee Program (AGP) provided guarantees for assets held by systemically significant financial institutions
that faced a risk of losing market confidence due in large part to a portfolio of distressed or illiquid assets. Section 102 of
the EESA required the Secretary to establish the AGP to guarantee troubled assets originated or issued prior to March 14,
2008, including MBS, and established the Troubled Assets Insurance Financing Fund (TAIFF).
In January 2009, the Department entered into a guarantee agreement with Citigroup under which the Department, the
Federal Deposit Insurance Corporation (FDIC), and the FRBNY (collectively the USG Parties) provided protection
against the possibility of large losses on an asset pool of approximately $301.0 billion of loans and securities backed by
U.S. Department of the Treasury | Fiscal Year 2012
94
residential and commercial real estate and other such assets, which remained on Citigroup’s balance sheet. The
Department’s portion of the guarantee was limited to $5.0 billion. As a premium for the guarantee, Citigroup issued $7.0
billion of cumulative perpetual preferred stock (subsequently converted to Trust Preferred Securities with similar terms)
with an 8.0 percent stated dividend rate and a warrant for the purchase of Citigroup common stock, of which $4.0 billion
of the preferred stock and the warrant were issued to the Department, and $3.0 billion of the preferred stock was issued
to the FDIC.
In fiscal year 2010, the USG Parties and Citigroup agreed to terminate the guarantee agreement; accordingly, Citigroup
cancelled $1.8 billion of the preferred stock previously issued to the Department. In fiscal year 2011, the Department sold
its remaining Citigroup TruPS it held for $2.2 billion, and sold the warrants for $67 million. In connection with the
termination of the guarantee agreement, FDIC agreed to transfer to the Department $800 million of TruPS holdings plus
dividends, subject to Citigroup’s payment of certain debt guaranteed by the FDIC. This TruPS related receivable from the
FDIC was valued at $967 million and $739 million at September 30, 2012 and 2011, respectively. The Department
expects to receive a cash transfer of dividends and interest, along with the TruPS from FDIC, as scheduled, on December
31, 2012. The Department valued the AGP preferred stock investments in a manner broadly analogous to the
methodology used to value the preferred stock securities within the CPP program.
FHA-Refinance Program
In fiscal year 2010, the Department entered into a loss-sharing agreement with the FHA to support a program in which
FHA guarantees refinancing of borrowers whose homes are worth less than the remaining amounts owed under their
mortgage loans. In fiscal year 2011, the Department established a $50 million account, held by a commercial bank as its
agent, from which any required reimbursements for losses will be paid to third-party claimants, including banks or other
investors. FHA disbursed $234 million and $73 million of loans during fiscal year 2012 and 2011, respectively. At
September 30, 2012 and 2011, 1,774 and 334 loans that FHA had guaranteed with a total value of $307 million and $73
million, respectively, had been refinanced under the program. At September 30, 2012 and 2011, the Department’s
maximum exposure related to the FHA guarantee totaled $41 million and $6 million, respectively. The Department’s
guarantee resulted in the Department incurring a $7 million and $1 million liability as of September 30, 2012 and 2011,
respectively.
Based on credit reform accounting, the liability was derived as the present value of the future cash outflows for the
Department’s share of losses incurred on any defaults of the disbursed loans. The budget subsidy rates for the program,
entirely for defaults, excluding modifications and reestimates, were set at 4.0 percent and 1.26 percent for loans
guaranteed in fiscal years 2012 and 2011, respectively. As of September 30, 2012 and 2011, the Department recorded
subsidy cost of $9 million and $1 million, respectively, for projected losses due to defaults. The program recorded a $3
million downward reestimate for the year ended September 30, 2012, due to a reduction in market risks and lower than
projected defaults. As of September 30, 2012, no claims were paid under the program.
SUBSIDY COST
During fiscal year 2012, a modification occurred in the CPP. During fiscal year 2011, modifications occurred within AIFP
(see Ally Financial Inc.) and CPP. See the detailed discussion above for modifications related to each program.
Modification cost (income) for the fiscal years ended September 30, 2012 and 2011, totaled $973 million and $1.2 billion,
respectively.
Changes in subsidy cost due to reestimates from year to year are mainly due to improved market conditions. Net
downward reestimates for the fiscal years ended September 30, 2012 and 2011, totaled $11.9 billion and $11.6 billion,
respectively.
U.S. Department of the Treasury | Fiscal Year 2012
95
During fiscal year 2012, there were significant AIG sales of common stock which impacted the subsidy cost. The AIG
Investment Program had a decrease in subsidy cost resulting from a downward reestimate of $9.2 billion. The
Department calculated a $9.2 billion downward reestimate relating primarily to sales in fiscal year 2012 of 806 million
shares of AIG common stock at prices higher than September 30, 2011, and increase in revaluing the remaining portfolio.
SUMMARY TABLES
The following tables provide the net composition, subsidy cost, modifications and reestimates, a reconciliation of subsidy
cost allowances, and subsidy by component for each TARP direct loan, equity investment or other credit programs for the
fiscal years ended September 30, 2012 and 2011. There were no budget subsidy rates for fiscal year 2012 and 2011, except
for the FHA- Refinance Program as previously disclosed in this note. All of the disbursements were from loans or
investments obligated in prior years.
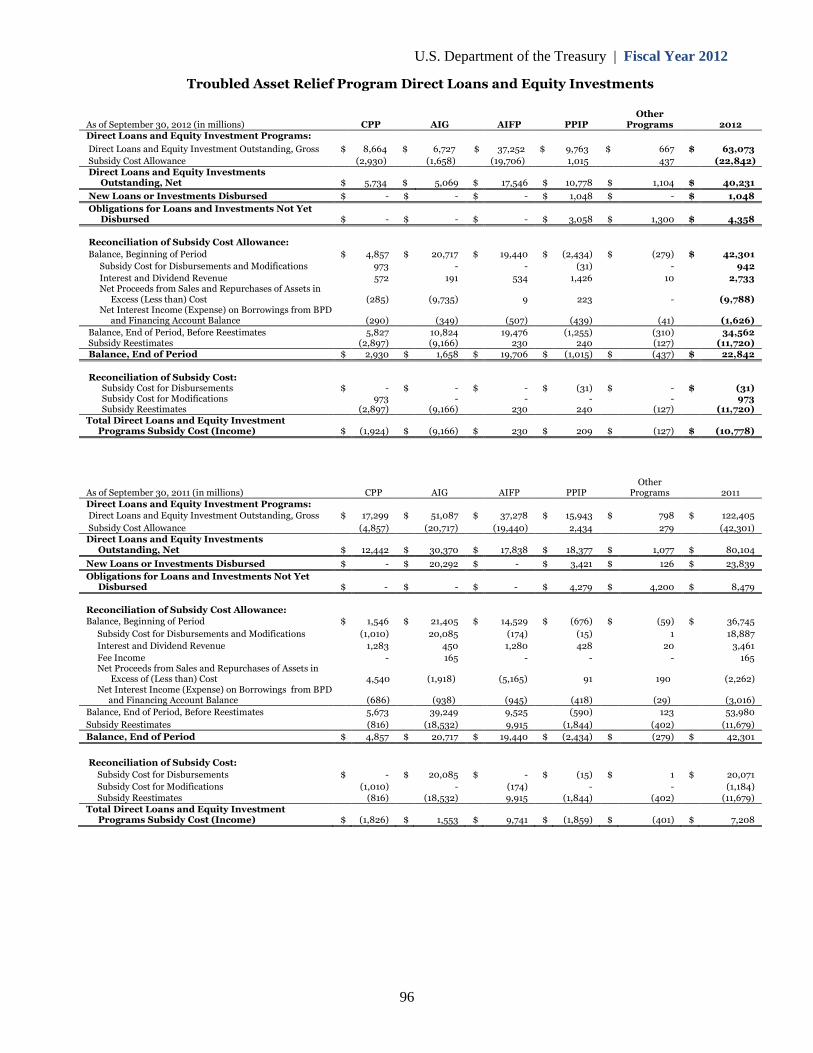
U.S. Department of the Treasury | Fiscal Year 2012
Troubled Asset Relief Program Direct Loans and Equity Investments
OtherAs of September 30, 2012 (in millions) CPP AIG AIFP PPIP Programs 2012Direct Loans and Equity Investment Programs:
Direct Loans and Equity Investment Outstanding, Gross $ 8,664 $ 6,727 $ 37,252 $ 9,763 $ 667 $ 63,073
Subsidy Cost Allowance (2,930) (1,658) (19,706) 1,015 437 (22,842)Direct Loans and Equity Investments
Outstanding, Net $ 5,734 $ 5,069 $ 17,546 $ 10,778 $ 1,104 $ 40,231
New Loans or Investments Disbursed $ - $ - $ - $ 1,048 $ - $ 1,048
Obligations for Loans and Investments Not YetDisbursed $ - $ - $ - $ 3,058 $ 1,300 $ 4,358
Reconciliation of Subsidy Cost Allowance:
Balance, Beginning of Period $ 4,857 $ 20,717 $ 19,440 $ (2,434) $ (279) $ 42,301
Subsidy Cost for Disbursements and Modifications 973 - - (31) - 942
Interest and Dividend Revenue 572 191 534 1,426 10 2,733Net Proceeds from Sales and Repurchases of Assets in
Excess (Less than) CostNet Interest Income (Expense) on Borrowings from BPD
and Financing Account Balance
(285)
(290)
(9,735)
(349)
9
(507)
223
(439)
-
(41)
(9,788)
(1,626)
Balance, End of Period, Before ReestimatesSubsidy Reestimates
5,827(2,897)
10,824(9,166)
19,476230
(1,255)240
(310)(127)
34,562(11,720)
Balance, End of Period $ 2,930 $ 1,658 $ 19,706 $ (1,015) $ (437) $ 22,842
Reconciliation of Subsidy Cost:Subsidy Cost for DisbursementsSubsidy Cost for ModificationsSubsidy Reestimates
$ -973
(2,897)
$ --
(9,166)
$ --
230
$ (31)-
240
$ --
(127)
$ (31)973
(11,720)Total Direct Loans and Equity Investment
Programs Subsidy Cost (Income) $ (1,924) $ (9,166) $ 230 $ 209 $ (127) $ (10,778)
OtherAs of September 30, 2011 (in millions) CPP AIG AIFP PPIP Programs 2011Direct Loans and Equity Investment Programs:Direct Loans and Equity Investment Outstanding, Gross $ 17,299 $ 51,087 $ 37,278 $ 15,943 $ 798 $ 122,405
Subsidy Cost Allowance (4,857) (20,717) (19,440) 2,434 279 (42,301)Direct Loans and Equity Investments
Outstanding, Net $ 12,442 $ 30,370 $ 17,838 $ 18,377 $ 1,077 $ 80,104
New Loans or Investments Disbursed $ - $ 20,292 $ - $ 3,421 $ 126 $ 23,839
Obligations for Loans and Investments Not YetDisbursed $ - $ - $ - $ 4,279 $ 4,200 $ 8,479
Reconciliation of Subsidy Cost Allowance:Balance, Beginning of Period $ 1,546 $ 21,405 $ 14,529 $ (676) $ (59) $ 36,745
Subsidy Cost for Disbursements and Modifications (1,010) 20,085 (174) (15) 1 18,887
Interest and Dividend Revenue 1,283 450 1,280 428 20 3,461
Fee Income - 165 - - - 165Net Proceeds from Sales and Repurchases of Assets in
Excess of (Less than) CostNet Interest Income (Expense) on Borrowings from BPD
and Financing Account Balance
4,540
(686)
(1,918)
(938)
(5,165)
(945)
91
(418)
190
(29)
(2,262)
(3,016)
Balance, End of Period, Before Reestimates 5,673 39,249 9,525 (590) 123 53,980
Subsidy Reestimates (816) (18,532) 9,915 (1,844) (402) (11,679)
Balance, End of Period $ 4,857 $ 20,717 $ 19,440 $ (2,434) $ (279) $ 42,301
Reconciliation of Subsidy Cost:
Subsidy Cost for Disbursements $ - $ 20,085 $ - $ (15) $ 1 $ 20,071
Subsidy Cost for Modifications (1,010) - (174) - - (1,184)Subsidy Reestimates (816) (18,532) 9,915 (1,844) (402) (11,679)
Total Direct Loans and Equity InvestmentPrograms Subsidy Cost (Income) $ (1,826) $ 1,553 $ 9,741 $ (1,859) $ (401) $ 7,208
96
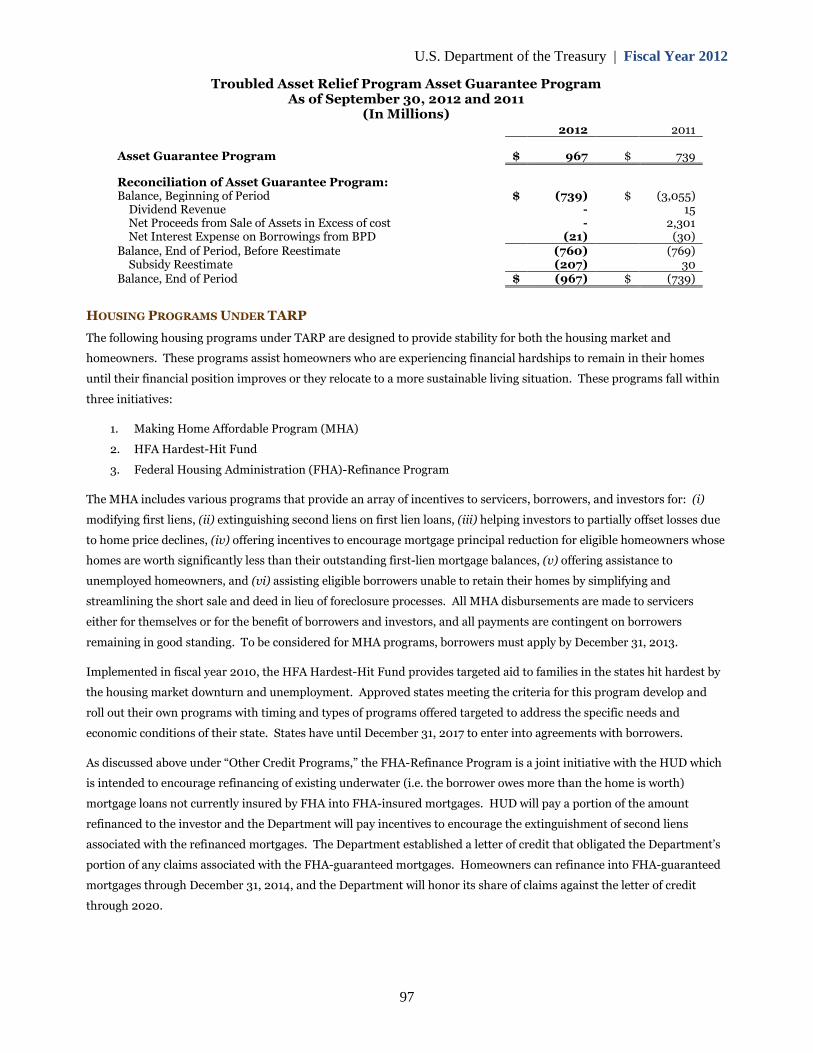
U.S. Department of the Treasury | Fiscal Year 2012
Troubled Asset Relief Program Asset Guarantee Program As of September 30, 2012 and 2011
(In Millions)
Asset Guarantee Program
2012 2011
$ 967 $ 739
Reconciliation of Asset Guarantee Program: Balance, Beginning of Period $ (739) $ (3,055)
Dividend Revenue - 15 Net Proceeds from Sale of Assets in Excess of cost - 2,301 Net Interest Expense on Borrowings from BPD (21) (30)
Balance, End of Period, Before Reestimate (760) (769) Subsidy Reestimate
Balance, End of Period (207) 30
$ (967) $ (739)
HOUSING PROGRAMS UNDER TARP
The following housing programs under TARP are designed to provide stability for both the housing market and
homeowners. These programs assist homeowners who are experiencing financial hardships to remain in their homes
until their financial position improves or they relocate to a more sustainable living situation. These programs fall within
three initiatives:
1. Making Home Affordable Program (MHA)
2. HFA Hardest-Hit Fund
3. Federal Housing Administration (FHA)-Refinance Program
The MHA includes various programs that provide an array of incentives to servicers, borrowers, and investors for: (i)
modifying first liens, (ii) extinguishing second liens on first lien loans, (iii) helping investors to partially offset losses due
to home price declines, (iv) offering incentives to encourage mortgage principal reduction for eligible homeowners whose
homes are worth significantly less than their outstanding first-lien mortgage balances, (v) offering assistance to
unemployed homeowners, and (vi) assisting eligible borrowers unable to retain their homes by simplifying and
streamlining the short sale and deed in lieu of foreclosure processes. All MHA disbursements are made to servicers
either for themselves or for the benefit of borrowers and investors, and all payments are contingent on borrowers
remaining in good standing. To be considered for MHA programs, borrowers must apply by December 31, 2013.
Implemented in fiscal year 2010, the HFA Hardest-Hit Fund provides targeted aid to families in the states hit hardest by
the housing market downturn and unemployment. Approved states meeting the criteria for this program develop and
roll out their own programs with timing and types of programs offered targeted to address the specific needs and
economic conditions of their state. States have until December 31, 2017 to enter into agreements with borrowers.
As discussed above under “Other Credit Programs,” the FHA-Refinance Program is a joint initiative with the HUD which
is intended to encourage refinancing of existing underwater (i.e. the borrower owes more than the home is worth)
mortgage loans not currently insured by FHA into FHA-insured mortgages. HUD will pay a portion of the amount
refinanced to the investor and the Department will pay incentives to encourage the extinguishment of second liens
associated with the refinanced mortgages. The Department established a letter of credit that obligated the Department’s
portion of any claims associated with the FHA-guaranteed mortgages. Homeowners can refinance into FHA-guaranteed
mortgages through December 31, 2014, and the Department will honor its share of claims against the letter of credit
through 2020.
97
U.S. Department of the Treasury | Fiscal Year 2012
98
As of September 30, 2012 and 2011, the Department had committed up to $45.6 billion for these programs. For fiscal
year 2012 and 2011, payments made from the Housing Programs under TARP totaled $3.1 billion and $1.9 billion,
respectively.
8. INVESTMENTS IN GOVERNMENT SPONSORED ENTERPRISES
Congress established Fannie Mae and Freddie Mac as GSEs to support the supply of mortgage loans. A key function of
the GSEs is to package purchased mortgages into securities, which are subsequently sold to investors.
Leading up to the financial crisis, increasingly difficult conditions in the housing market challenged the soundness and
profitability of the GSEs, thereby undermining the entire housing market. This led Congress to pass the Housing and
Economic Recovery Act (HERA) (P.L. 110-289). This Act created the new FHFA, with enhanced regulatory authority over
the GSEs, and provided the Secretary with certain authorities intended to ensure the financial stability of the GSEs, if
necessary. On September 7, 2008, FHFA placed the GSEs under conservatorship, and the Department entered into a
Senior Preferred Stock Purchase Agreement (SPSPA) with each GSE. These actions were taken to preserve the GSEs’
assets, ensure a sound and solvent financial condition, and mitigate systemic risks that contributed to current market
instability. The SPSPAs were amended in August 2012 (the amended SPSPAs) which changed, among other things, the
basis by which quarterly dividends are paid by the GSEs to the U.S. Government. The dividend change in the amended
SPSPAs is effective commencing with the quarter ending March 31, 2013.
The actions taken by the Department thus far are temporary, as defined by section 1117 of HERA, and are intended to
provide financial stability. The purpose of the Department’s actions is to maintain the solvency of the GSEs so they can
continue to fulfill their vital roles in the home mortgage market while the Administration and Congress determine what
structural changes should be made. The FHFA director may terminate the conservatorship if safe and solvent conditions
can be established. Draws under the SPSPAs are designed to ensure that the GSEs maintain positive net worth as a result
of any net losses from operations, and also meet taxpayer dividend requirements under the SPSPAs. The SPSPAs were
structured to ensure any draws result in an increased nominal investment as further discussed below.
Under the SPSPAs, the Department initially received from each GSE: (i) 1,000,000 shares of non-voting variable
liquidation preference senior preferred stock with a liquidation preference value of $1,000 per share, and (ii) a non-
transferrable warrant for the purchase, at a nominal cost, of 79.9 percent of common stock on a fully-diluted basis. The
warrants expire on September 7, 2028. Through December 31, 2012, the senior preferred stock accrues dividends at 10.0
percent per year, payable quarterly. Under the amended SPSPAs, the quarterly dividend payment will change from a
10.0 percent per annum fixed rate dividend to an amount equivalent to the GSE’s positive net worth above a capital
reserve amount. The capital reserve amount is initially set at $3.0 billion for calendar year 2013, and declines by $600
million at the beginning of each calendar year thereafter until it reaches zero by calendar year 2018. The GSEs will not
pay a quarterly dividend if their positive net worth is not above the required capital reserve threshold; in such cases, the
Department may be required to provide funding pursuant to the amended SPSPAs.
Cash dividends of $18.4 billion and $15.6 billion were received during fiscal years ended September 30, 2012 and 2011,
respectively. In addition, beginning in fiscal year 2011, the GSEs were scheduled to begin paying the Department a
“Periodic Commitment Fee” (PCF) on a quarterly basis, payable in cash or via an increase to the liquidation preference.
This fee may be waived by the Department for up to one year at a time if warranted by adverse mortgage market
conditions. The Department waived the PCF payments for calendar years 2012 and 2011 given that the imposition of the
PCF at that time would not fulfill its intended purpose of generating increased compensation to the American taxpayer.
Commencing January 1, 2013, the PCF will no longer be required pursuant to the amended SPSPAs.
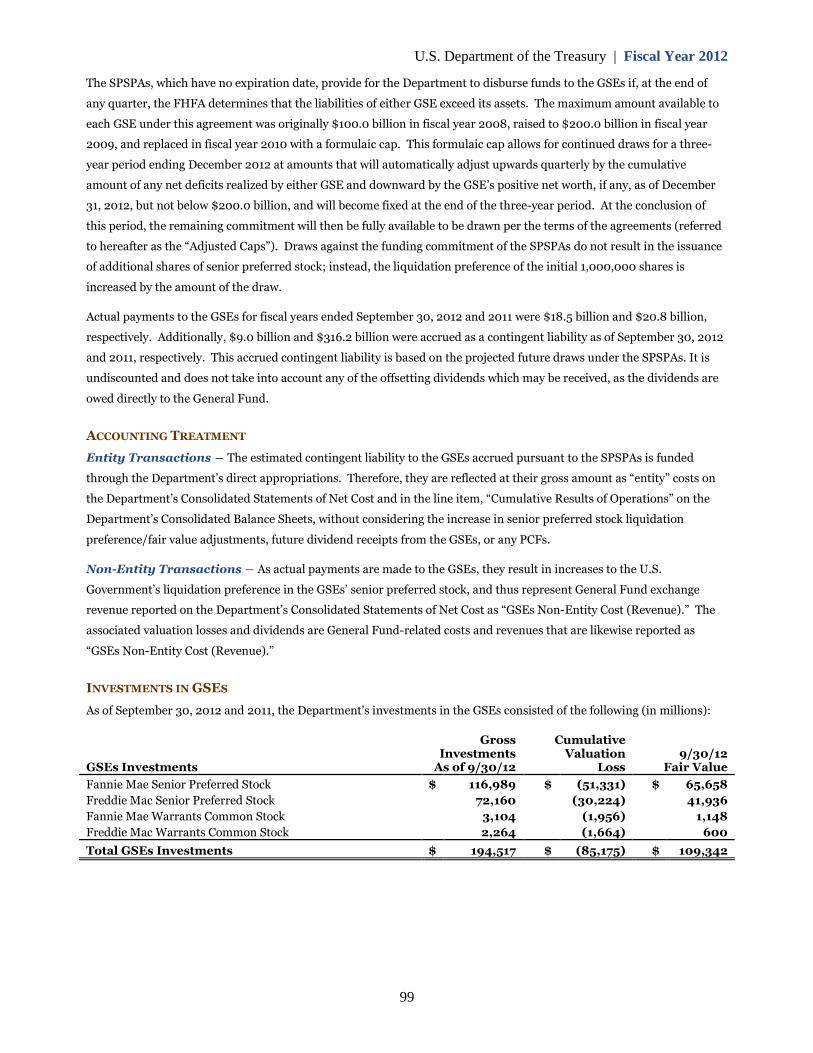
U.S. Department of the Treasury | Fiscal Year 2012
99
The SPSPAs, which have no expiration date, provide for the Department to disburse funds to the GSEs if, at the end of
any quarter, the FHFA determines that the liabilities of either GSE exceed its assets. The maximum amount available to
each GSE under this agreement was originally $100.0 billion in fiscal year 2008, raised to $200.0 billion in fiscal year
2009, and replaced in fiscal year 2010 with a formulaic cap. This formulaic cap allows for continued draws for a three-
year period ending December 2012 at amounts that will automatically adjust upwards quarterly by the cumulative
amount of any net deficits realized by either GSE and downward by the GSE’s positive net worth, if any, as of December
31, 2012, but not below $200.0 billion, and will become fixed at the end of the three-year period. At the conclusion of
this period, the remaining commitment will then be fully available to be drawn per the terms of the agreements (referred
to hereafter as the “Adjusted Caps”). Draws against the funding commitment of the SPSPAs do not result in the issuance
of additional shares of senior preferred stock; instead, the liquidation preference of the initial 1,000,000 shares is
increased by the amount of the draw.
Actual payments to the GSEs for fiscal years ended September 30, 2012 and 2011 were $18.5 billion and $20.8 billion,
respectively. Additionally, $9.0 billion and $316.2 billion were accrued as a contingent liability as of September 30, 2012
and 2011, respectively. This accrued contingent liability is based on the projected future draws under the SPSPAs. It is
undiscounted and does not take into account any of the offsetting dividends which may be received, as the dividends are
owed directly to the General Fund.
ACCOUNTING TREATMENT
Entity Transactions ― The estimated contingent liability to the GSEs accrued pursuant to the SPSPAs is funded
through the Department’s direct appropriations. Therefore, they are reflected at their gross amount as “entity” costs on
the Department’s Consolidated Statements of Net Cost and in the line item, “Cumulative Results of Operations” on the
Department’s Consolidated Balance Sheets, without considering the increase in senior preferred stock liquidation
preference/fair value adjustments, future dividend receipts from the GSEs, or any PCFs.
Non-Entity Transactions ― As actual payments are made to the GSEs, they result in increases to the U.S.
Government’s liquidation preference in the GSEs’ senior preferred stock, and thus represent General Fund exchange
revenue reported on the Department’s Consolidated Statements of Net Cost as “GSEs Non-Entity Cost (Revenue).” The
associated valuation losses and dividends are General Fund-related costs and revenues that are likewise reported as
“GSEs Non-Entity Cost (Revenue).”
INVESTMENTS IN GSES
As of September 30, 2012 and 2011, the Department’s investments in the GSEs consisted of the following (in millions):
GSEs Investments
GrossInvestments
As of 9/30/12
CumulativeValuation
Loss9/30/12
Fair Value
Fannie Mae Senior Preferred Stock $ 116,989 $ (51,331) $ 65,658
Freddie Mac Senior Preferred Stock 72,160 (30,224) 41,936
Fannie Mae Warrants Common Stock 3,104 (1,956) 1,148
Freddie Mac Warrants Common Stock 2,264 (1,664) 600
Total GSEs Investments $ 194,517 $ (85,175) $ 109,342
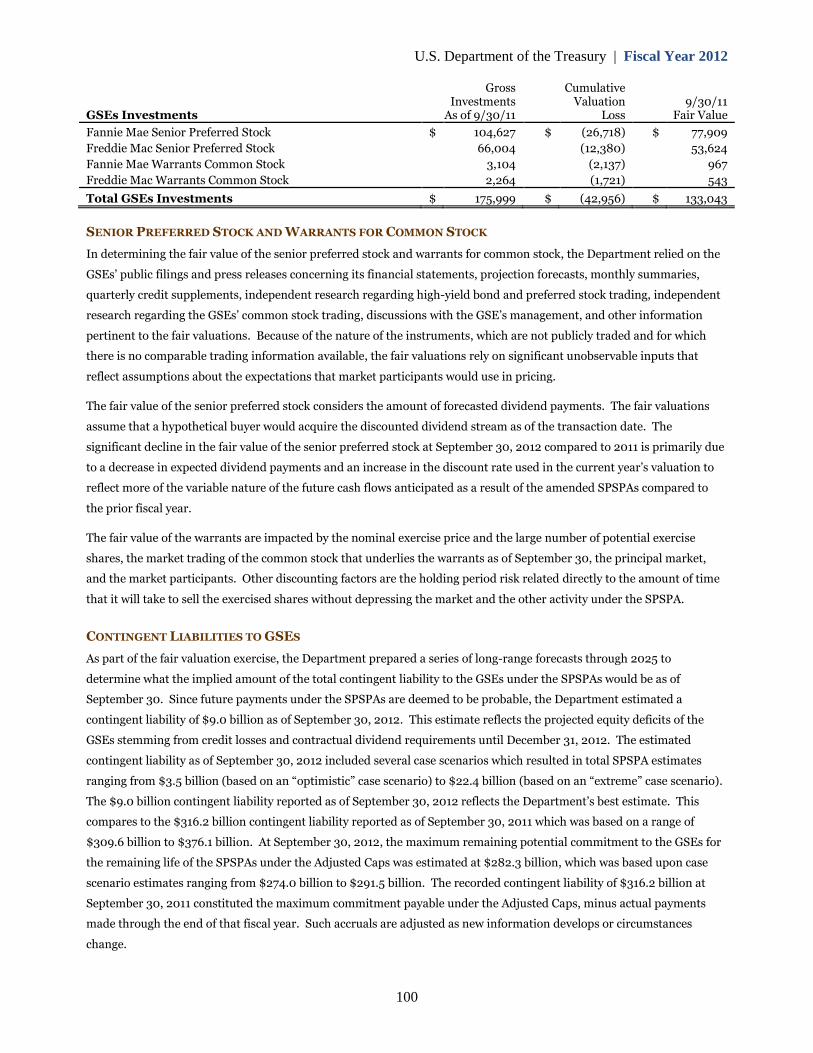
U.S. Department of the Treasury | Fiscal Year 2012
Gross CumulativeInvestments Valuation 9/30/11
GSEs Investments As of 9/30/11 Loss Fair Value
Fannie Mae Senior Preferred Stock $ 104,627 $ (26,718) $ 77,909
Freddie Mac Senior Preferred Stock 66,004 (12,380) 53,624
Fannie Mae Warrants Common Stock 3,104 (2,137) 967
Freddie Mac Warrants Common Stock 2,264 (1,721) 543
Total GSEs Investments $ 175,999 $ (42,956) $ 133,043
SENIOR PREFERRED STOCK AND WARRANTS FOR COMMON STOCK
In determining the fair value of the senior preferred stock and warrants for common stock, the Department relied on the
GSEs’ public filings and press releases concerning its financial statements, projection forecasts, monthly summaries,
quarterly credit supplements, independent research regarding high-yield bond and preferred stock trading, independent
research regarding the GSEs’ common stock trading, discussions with the GSE’s management, and other information
pertinent to the fair valuations. Because of the nature of the instruments, which are not publicly traded and for which
there is no comparable trading information available, the fair valuations rely on significant unobservable inputs that
reflect assumptions about the expectations that market participants would use in pricing.
The fair value of the senior preferred stock considers the amount of forecasted dividend payments. The fair valuations
assume that a hypothetical buyer would acquire the discounted dividend stream as of the transaction date. The
significant decline in the fair value of the senior preferred stock at September 30, 2012 compared to 2011 is primarily due
to a decrease in expected dividend payments and an increase in the discount rate used in the current year’s valuation to
reflect more of the variable nature of the future cash flows anticipated as a result of the amended SPSPAs compared to
the prior fiscal year.
The fair value of the warrants are impacted by the nominal exercise price and the large number of potential exercise
shares, the market trading of the common stock that underlies the warrants as of September 30, the principal market,
and the market participants. Other discounting factors are the holding period risk related directly to the amount of time
that it will take to sell the exercised shares without depressing the market and the other activity under the SPSPA.
CONTINGENT LIABILITIES TO GSES
As part of the fair valuation exercise, the Department prepared a series of long-range forecasts through 2025 to
determine what the implied amount of the total contingent liability to the GSEs under the SPSPAs would be as of
September 30. Since future payments under the SPSPAs are deemed to be probable, the Department estimated a
contingent liability of $9.0 billion as of September 30, 2012. This estimate reflects the projected equity deficits of the
GSEs stemming from credit losses and contractual dividend requirements until December 31, 2012. The estimated
contingent liability as of September 30, 2012 included several case scenarios which resulted in total SPSPA estimates
ranging from $3.5 billion (based on an “optimistic” case scenario) to $22.4 billion (based on an “extreme” case scenario).
The $9.0 billion contingent liability reported as of September 30, 2012 reflects the Department’s best estimate. This
compares to the $316.2 billion contingent liability reported as of September 30, 2011 which was based on a range of
$309.6 billion to $376.1 billion. At September 30, 2012, the maximum remaining potential commitment to the GSEs for
the remaining life of the SPSPAs under the Adjusted Caps was estimated at $282.3 billion, which was based upon case
scenario estimates ranging from $274.0 billion to $291.5 billion. The recorded contingent liability of $316.2 billion at
September 30, 2011 constituted the maximum commitment payable under the Adjusted Caps, minus actual payments
made through the end of that fiscal year. Such accruals are adjusted as new information develops or circumstances
change.
100
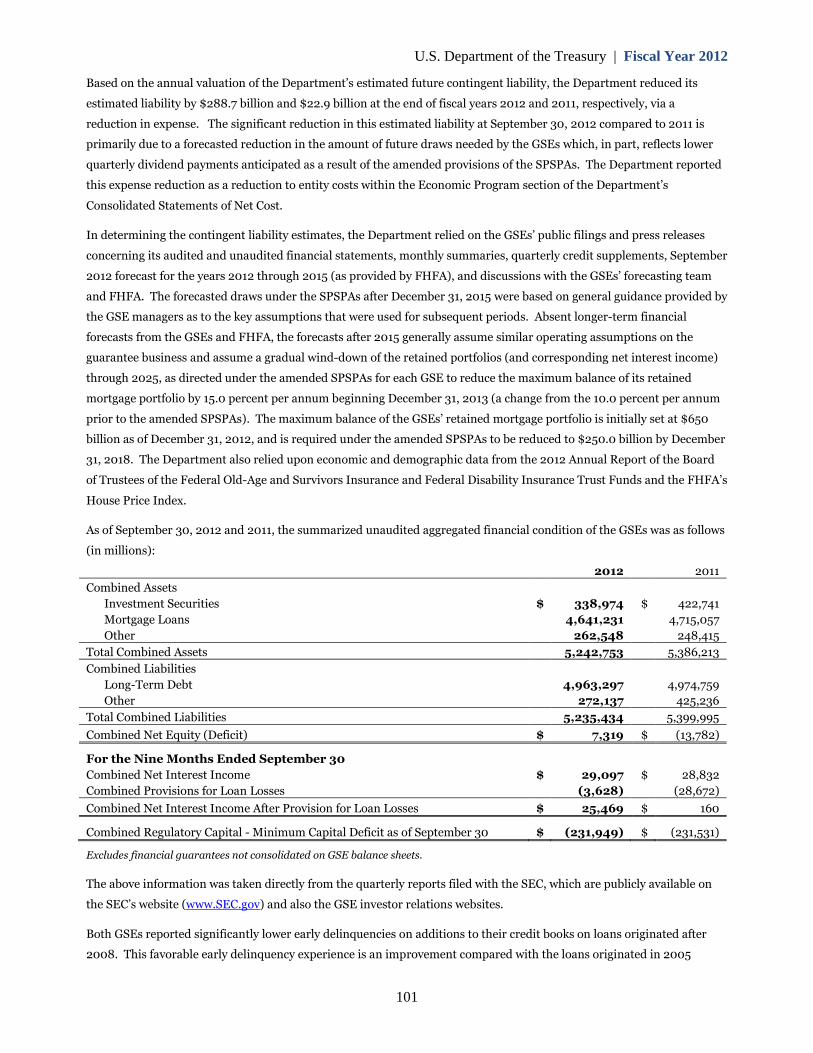
U.S. Department of the Treasury | Fiscal Year 2012
101
Based on the annual valuation of the Department’s estimated future contingent liability, the Department reduced its
estimated liability by $288.7 billion and $22.9 billion at the end of fiscal years 2012 and 2011, respectively, via a
reduction in expense. The significant reduction in this estimated liability at September 30, 2012 compared to 2011 is
primarily due to a forecasted reduction in the amount of future draws needed by the GSEs which, in part, reflects lower
quarterly dividend payments anticipated as a result of the amended provisions of the SPSPAs. The Department reported
this expense reduction as a reduction to entity costs within the Economic Program section of the Department’s
Consolidated Statements of Net Cost.
In determining the contingent liability estimates, the Department relied on the GSEs’ public filings and press releases
concerning its audited and unaudited financial statements, monthly summaries, quarterly credit supplements, September
2012 forecast for the years 2012 through 2015 (as provided by FHFA), and discussions with the GSEs’ forecasting team
and FHFA. The forecasted draws under the SPSPAs after December 31, 2015 were based on general guidance provided by
the GSE managers as to the key assumptions that were used for subsequent periods. Absent longer-term financial
forecasts from the GSEs and FHFA, the forecasts after 2015 generally assume similar operating assumptions on the
guarantee business and assume a gradual wind-down of the retained portfolios (and corresponding net interest income)
through 2025, as directed under the amended SPSPAs for each GSE to reduce the maximum balance of its retained
mortgage portfolio by 15.0 percent per annum beginning December 31, 2013 (a change from the 10.0 percent per annum
prior to the amended SPSPAs). The maximum balance of the GSEs’ retained mortgage portfolio is initially set at $650
billion as of December 31, 2012, and is required under the amended SPSPAs to be reduced to $250.0 billion by December
31, 2018. The Department also relied upon economic and demographic data from the 2012 Annual Report of the Board
of Trustees of the Federal Old-Age and Survivors Insurance and Federal Disability Insurance Trust Funds and the FHFA’s
House Price Index.
As of September 30, 2012 and 2011, the summarized unaudited aggregated financial condition of the GSEs was as follows
(in millions):
2012 2011
Combined Assets
Investment Securities $ 338,974 $ 422,741
Mortgage Loans 4,641,231 4,715,057
Other 262,548 248,415
Total Combined Assets 5,242,753 5,386,213
Combined Liabilities
Long-Term Debt 4,963,297 4,974,759
Other 272,137 425,236
Total Combined Liabilities 5,235,434 5,399,995
Combined Net Equity (Deficit) $ 7,319 $ (13,782)
For the Nine Months Ended September 30
Combined Net Interest Income $ 29,097 $ 28,832
Combined Provisions for Loan Losses (3,628) (28,672)
Combined Net Interest Income After Provision for Loan Losses $ 25,469 $ 160
Combined Regulatory Capital - Minimum Capital Deficit as of September 30 $ (231,949) $ (231,531)
Excludes financial guarantees not consolidated on GSE balance sheets.
The above information was taken directly from the quarterly reports filed with the SEC, which are publicly available on
the SEC’s website (www.SEC.gov) and also the GSE investor relations websites.
Both GSEs reported significantly lower early delinquencies on additions to their credit books on loans originated after
2008. This favorable early delinquency experience is an improvement compared with the loans originated in 2005
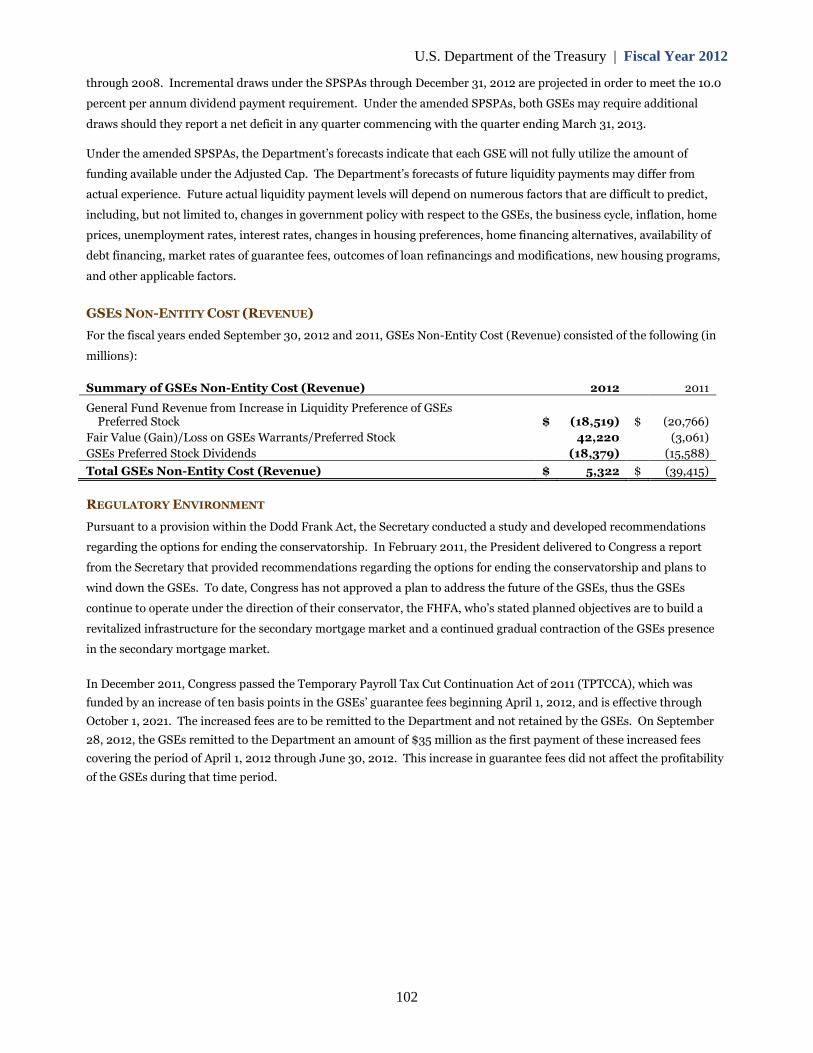
U.S. Department of the Treasury | Fiscal Year 2012
through 2008. Incremental draws under the SPSPAs through December 31, 2012 are projected in order to meet the 10.0
percent per annum dividend payment requirement. Under the amended SPSPAs, both GSEs may require additional
draws should they report a net deficit in any quarter commencing with the quarter ending March 31, 2013.
Under the amended SPSPAs, the Department’s forecasts indicate that each GSE will not fully utilize the amount of
funding available under the Adjusted Cap. The Department’s forecasts of future liquidity payments may differ from
actual experience. Future actual liquidity payment levels will depend on numerous factors that are difficult to predict,
including, but not limited to, changes in government policy with respect to the GSEs, the business cycle, inflation, home
prices, unemployment rates, interest rates, changes in housing preferences, home financing alternatives, availability of
debt financing, market rates of guarantee fees, outcomes of loan refinancings and modifications, new housing programs,
and other applicable factors.
GSES NON-ENTITY COST (REVENUE)
For the fiscal years ended September 30, 2012 and 2011, GSEs Non-Entity Cost (Revenue) consisted of the following (in
millions):
Summary of GSEs Non-Entity Cost (Revenue) 2012 2011
General Fund Revenue from Increase in Liquidity Preference of GSEsPreferred Stock $ (18,519) $ (20,766)
Fair Value (Gain)/Loss on GSEs Warrants/Preferred Stock 42,220 (3,061)
GSEs Preferred Stock Dividends (18,379) (15,588)
Total GSEs Non-Entity Cost (Revenue) $ 5,322 $ (39,415)
REGULATORY ENVIRONMENT
Pursuant to a provision within the Dodd Frank Act, the Secretary conducted a study and developed recommendations
regarding the options for ending the conservatorship. In February 2011, the President delivered to Congress a report
from the Secretary that provided recommendations regarding the options for ending the conservatorship and plans to
wind down the GSEs. To date, Congress has not approved a plan to address the future of the GSEs, thus the GSEs
continue to operate under the direction of their conservator, the FHFA, who’s stated planned objectives are to build a
revitalized infrastructure for the secondary mortgage market and a continued gradual contraction of the GSEs presence
in the secondary mortgage market.
In December 2011, Congress passed the Temporary Payroll Tax Cut Continuation Act of 2011 (TPTCCA), which was
funded by an increase of ten basis points in the GSEs’ guarantee fees beginning April 1, 2012, and is effective through
October 1, 2021. The increased fees are to be remitted to the Department and not retained by the GSEs. On September
28, 2012, the GSEs remitted to the Department an amount of $35 million as the first payment of these increased fees
covering the period of April 1, 2012 through June 30, 2012. This increase in guarantee fees did not affect the profitability
of the GSEs during that time period.
102
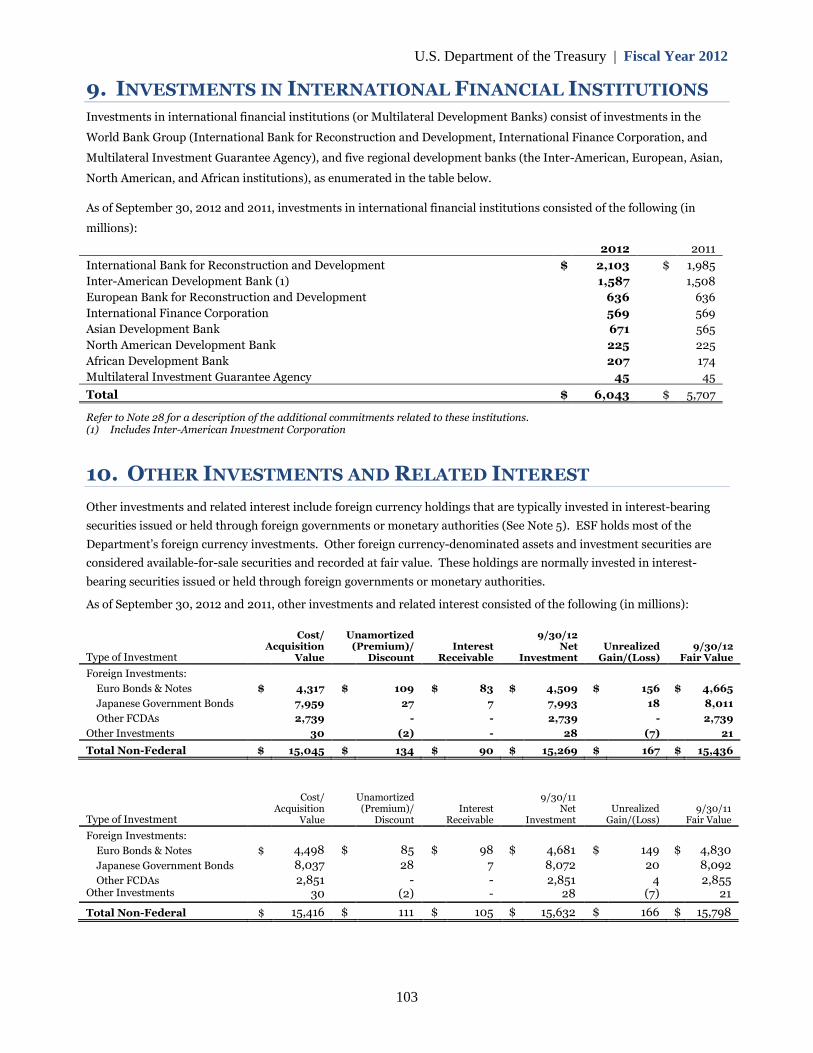
U.S. Department of the Treasury | Fiscal Year 2012
9. INVESTMENTS IN INTERNATIONAL FINANCIAL INSTITUTIONS
Investments in international financial institutions (or Multilateral Development Banks) consist of investments in the
World Bank Group (International Bank for Reconstruction and Development, International Finance Corporation, and
Multilateral Investment Guarantee Agency), and five regional development banks (the Inter-American, European, Asian,
North American, and African institutions), as enumerated in the table below.
As of September 30, 2012 and 2011, investments in international financial institutions consisted of the following (in
millions):
2012 2011
International Bank for Reconstruction and Development $ 2,103 $ 1,985
Inter-American Development Bank (1) 1,587 1,508
European Bank for Reconstruction and Development 636 636
International Finance Corporation 569 569
Asian Development Bank 671 565
North American Development Bank 225 225
African Development Bank 207 174
Multilateral Investment Guarantee Agency 45 45
Total $ 6,043 $ 5,707
Refer to Note 28 for a description of the additional commitments related to these institutions.(1) Includes Inter-American Investment Corporation
10. OTHER INVESTMENTS AND RELATED INTEREST
Other investments and related interest include foreign currency holdings that are typically invested in interest-bearing
securities issued or held through foreign governments or monetary authorities (See Note 5). ESF holds most of the
Department’s foreign currency investments. Other foreign currency-denominated assets and investment securities are
considered available-for-sale securities and recorded at fair value. These holdings are normally invested in interest-
bearing securities issued or held through foreign governments or monetary authorities.
As of September 30, 2012 and 2011, other investments and related interest consisted of the following (in millions):
Cost/ Unamortized 9/30/12Acquisition (Premium)/ Interest Net Unrealized 9/30/12
Type of Investment Value Discount Receivable Investment Gain/(Loss) Fair Value
Foreign Investments:
Euro Bonds & Notes $ 4,317 $ 109 $ 83 $ 4,509 $ 156 $ 4,665
Japanese Government Bonds 7,959 27 7 7,993 18 8,011
Other FCDAs 2,739 - - 2,739 - 2,739
Other Investments 30 (2) - 28 (7) 21
Total Non-Federal $ 15,045 $ 134 $ 90 $ 15,269 $ 167 $ 15,436
Cost/ Unamortized 9/30/11Acquisition (Premium)/ Interest Net Unrealized 9/30/11
Type of Investment Value Discount Receivable Investment Gain/(Loss) Fair Value
Foreign Investments:
Euro Bonds & Notes $ 4,498 $ 85 $ 98 $ 4,681 $ 149 $ 4,830
Japanese Government Bonds 8,037 28 7 8,072 20 8,092
Other FCDAs 2,851 - - 2,851 4 2,855Other Investments 30 (2) - 28 (7) 21
Total Non-Federal $ 15,416 $ 111 $ 105 $ 15,632 $ 166 $ 15,798
103
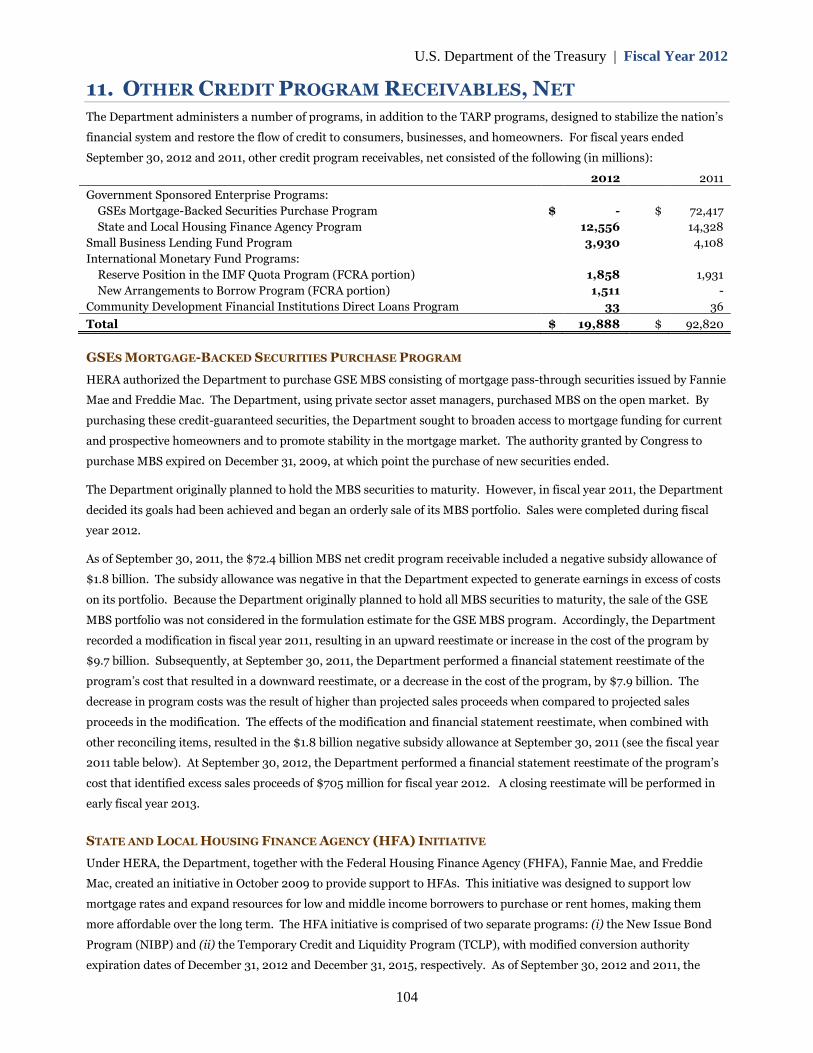
U.S. Department of the Treasury | Fiscal Year 2012
11. OTHER CREDIT PROGRAM RECEIVABLES, NET
The Department administers a number of programs, in addition to the TARP programs, designed to stabilize the nation’s
financial system and restore the flow of credit to consumers, businesses, and homeowners. For fiscal years ended
September 30, 2012 and 2011, other credit program receivables, net consisted of the following (in millions):
2012 2011
Government Sponsored Enterprise Programs:
GSEs Mortgage-Backed Securities Purchase Program $ - $ 72,417
State and Local Housing Finance Agency Program 12,556 14,328
Small Business Lending Fund Program 3,930 4,108
International Monetary Fund Programs:
Reserve Position in the IMF Quota Program (FCRA portion) 1,858 1,931
New Arrangements to Borrow Program (FCRA portion) 1,511 -
Community Development Financial Institutions Direct Loans Program 33 36
Total $ 19,888 $ 92,820
GSES MORTGAGE-BACKED SECURITIES PURCHASE PROGRAM
HERA authorized the Department to purchase GSE MBS consisting of mortgage pass-through securities issued by Fannie
Mae and Freddie Mac. The Department, using private sector asset managers, purchased MBS on the open market. By
purchasing these credit-guaranteed securities, the Department sought to broaden access to mortgage funding for current
and prospective homeowners and to promote stability in the mortgage market. The authority granted by Congress to
purchase MBS expired on December 31, 2009, at which point the purchase of new securities ended.
The Department originally planned to hold the MBS securities to maturity. However, in fiscal year 2011, the Department
decided its goals had been achieved and began an orderly sale of its MBS portfolio. Sales were completed during fiscal
year 2012.
As of September 30, 2011, the $72.4 billion MBS net credit program receivable included a negative subsidy allowance of
$1.8 billion. The subsidy allowance was negative in that the Department expected to generate earnings in excess of costs
on its portfolio. Because the Department originally planned to hold all MBS securities to maturity, the sale of the GSE
MBS portfolio was not considered in the formulation estimate for the GSE MBS program. Accordingly, the Department
recorded a modification in fiscal year 2011, resulting in an upward reestimate or increase in the cost of the program by
$9.7 billion. Subsequently, at September 30, 2011, the Department performed a financial statement reestimate of the
program’s cost that resulted in a downward reestimate, or a decrease in the cost of the program, by $7.9 billion. The
decrease in program costs was the result of higher than projected sales proceeds when compared to projected sales
proceeds in the modification. The effects of the modification and financial statement reestimate, when combined with
other reconciling items, resulted in the $1.8 billion negative subsidy allowance at September 30, 2011 (see the fiscal year
2011 table below). At September 30, 2012, the Department performed a financial statement reestimate of the program’s
cost that identified excess sales proceeds of $705 million for fiscal year 2012. A closing reestimate will be performed in
early fiscal year 2013.
STATE AND LOCAL HOUSING FINANCE AGENCY (HFA) INITIATIVE
Under HERA, the Department, together with the Federal Housing Finance Agency (FHFA), Fannie Mae, and Freddie
Mac, created an initiative in October 2009 to provide support to HFAs. This initiative was designed to support low
mortgage rates and expand resources for low and middle income borrowers to purchase or rent homes, making them
more affordable over the long term. The HFA initiative is comprised of two separate programs: (i) the New Issue Bond
Program (NIBP) and (ii) the Temporary Credit and Liquidity Program (TCLP), with modified conversion authority
expiration dates of December 31, 2012 and December 31, 2015, respectively. As of September 30, 2012 and 2011, the
104
U.S. Department of the Treasury | Fiscal Year 2012
HFA net credit program receivable of $12.6 billion and $14.3 billion, respectively, included a positive subsidy allowance
of $1.1 billion and $815 million, respectively, which reflects the Department’s projection that the HFA program will result
in a net cost to the Department after accounting for repayments, interest, and fees.
Under the terms of the NIBP, the Department purchased securities of Fannie Mae and Freddie Mac backed by new
mortgage revenue bonds issued by HFAs. As of September 30, 2012 and 2011, the NIBP gross credit program receivable
was $13.7 billion and $15.1 billion, respectively. The Department performed a financial statement reestimate of the NIBP
program’s cost as of September 30, 2012. This reestimate increased the cost of the program by $588 million. The
upward reestimate in fiscal year 2012 was primarily driven by lower projected prepayment rates and lower than expected
market interest rates which reduced coupon rates for the HFA bonds converted from escrow in fiscal year 2012. The drop
in prepayment rates increases the cost of the program since the HFA bonds carry a lower weighted average coupon than
the funding cost of the program. The reestimate performed at September 30, 2011 increased the cost of the program by
$9 million. This upward reestimate was driven by lower market interest rates used to calculate the coupon rates on the
expected release of escrowed NIBP funds between September 30, 2011 and December 31, 2011.
Under the terms of the TCLP, the Department entered into participation interests with Fannie Mae and Freddie Mac,
supporting credit and liquidity facilities that the GSEs are providing to eight states as part of the program. Fannie Mae
and Freddie Mac provided replacement credit and liquidity facilities to HFAs to help reduce the costs of maintaining
existing financing and relieve financial strains on the HFAs. The Department agreed to support the GSE replacement
credit and liquidity facilities by purchasing GSE securities backed by HFA bonds tendered to the GSEs. As of September
30, 2012 and 2011, the liquidity facilities covered $3.9 billion and $6.6 billion, respectively, of single-family and multi-
family variable-rate demand obligations (VRDOs). As of September 30, 2012 and 2011, none of these bonds had been
tendered to the GSEs and, accordingly, the Department had not disbursed any funds. As such, the Department did not
perform September 30, 2012 or 2011 subsidy reestimates for TCLP.
SMALL BUSINESS LENDING FUND
On September 27, 2010, the Small Business Jobs Act of 2010 (P.L. 111-240) was enacted and, in part, created the SBLF
program. Pursuant to the Act, the Department provided capital to qualified community banks to encourage lending to
small businesses. As an incentive to participating banks to increase lending to small businesses, the dividend rate a bank
pays to the Department for SBLF funding will be reduced as the bank’s small business lending increases. The initial
dividend rate of 5.0 percent may be reduced to as low as 1.0 percent. If lending does not increase by the end of the first
two years, the rate will increase to 7.0 percent. The program provides an incentive for banks to repay loans within 4 ½
years. At that time, the rate will increase to 9.0 percent for all banks remaining in the program. The Department treats
these purchases of capital as direct loans in accordance with the requirements of FCRA. The Department’s authority to
provide new capital to SBLF participants expired on September 27, 2011, and accordingly, there were no new capital
disbursements in fiscal year 2012.
As of September 30, 2012 and 2011, SBLF net credit program receivable was $3.9 billion and $4.1 billion, respectively.
These amounts include a positive subsidy allowance of $50 million at September 30, 2012, indicating an increase in
program costs, and a negative subsidy allowance of $80 million at September 30, 2011, indicating expected earnings in
excess of costs.
The Department performed a financial statement reestimate of the program’s cost as of September 30, 2012 and 2011.
These reestimates resulted in an upward reestimate, or an increase in the cost of the program, of $105 million as of
September 30, 2012, and resulted in a downward reestimate, or a decrease in the cost of the program, of $372 million as
of September 30, 2011. Both the 2012 and 2011 reestimates were driven by changes in performance assumptions, actual
performance to-date, and actual program funding costs. The 2012 performance assumptions anticipate an increased cost
105
U.S. Department of the Treasury | Fiscal Year 2012
due to lower dividend rates, both actual and projected, paid by participating institutions relative to the dividend rates
projected as of September 30, 2011. These lower dividend rates are the result of continuing success by participating banks
in increasing small business lending.
INTERNATIONAL MONETARY FUND
In 2009, Congress passed the Supplemental Appropriations Act of 2009 which authorized an increase in the U.S. quota
in the IMF, as well as an increase in U.S. participation in the New Arrangements to Borrow (NAB), one of the IMF’s
supplemental borrowing arrangements (Note 12). For the first time, Congress subjected both program increases to
FCRA. Under FCRA, both program increases are treated as direct loans to the IMF. For U.S. budget and accounting
purposes, there are effectively two portions of the IMF quota and NAB programs. The IMF quota program comprises a
FCRA portion of $7.7 billion and a non-FCRA portion of $57.3 billion. The IMF NAB program comprises a FCRA portion
of $96.3 billion and a non-FCRA portion of $10.2 billion. The U.S. commitments to the IMF are denominated in SDRs
and, thus, the dollar amounts of these commitments fluctuate with the SDR valuation rate. These designations only
affect the manner in which the Department accounts for the use and repayment of these funds. The following is a
discussion of the FCRA portions of both the U.S. quota and NAB programs.
United States Quota
On March 25, 2011, the Department disbursed $2.0 billion (SDR 1.2 billion) to increase the reserve asset portion of the
U.S. quota. The undisbursed FCRA portion is reported as a letter of credit (Note 12). At September 30, 2012 and 2011,
the IMF program had a net credit program receivable of $1.9 billion, which included a positive subsidy allowance of $137
million and $64 million, respectively, which reflects the Department’s projection that the program will result in a net cost
to the Department after accounting for repayments, interest, and fees. The Department performed a financial statement
reestimate of the program’s cost as of September 30, 2012 and 2011. The reestimate resulted in an increase in program
costs (an upward reestimate) of $67 million and $15 million for fiscal years 2012 and 2011, respectively, primarily due to
a fluctuation in the valuation of the SDR rate since the calculation of the fiscal year 2011 reestimate.
New Arrangements To Borrow
On April 12, 2012, the Department made its initial FCRA disbursement to the NAB of $629 million. As of September 30,
2012, disbursements for fiscal year 2012 totaled $1.5 billion. The program had a negative subsidy allowance of $21
million as of September 30, 2012.
The Department performed a financial statement reestimate of the program’s cost as of September 30, 2012. This
reestimate resulted in a decrease in the cost of the program (a downward reestimate) of $25 million primarily due to a
fluctuation in the valuation of the SDR rate since the timing of the disbursements in April and August 2012.
SUMMARY TABLES
The following tables provide the net composition of the Department’s portfolio, subsidy cost, modifications and
reestimates, a reconciliation of subsidy cost allowances, budget subsidy rates, and the components of the subsidy for each
credit program for the fiscal years ended September 30, 2012 and 2011.
106
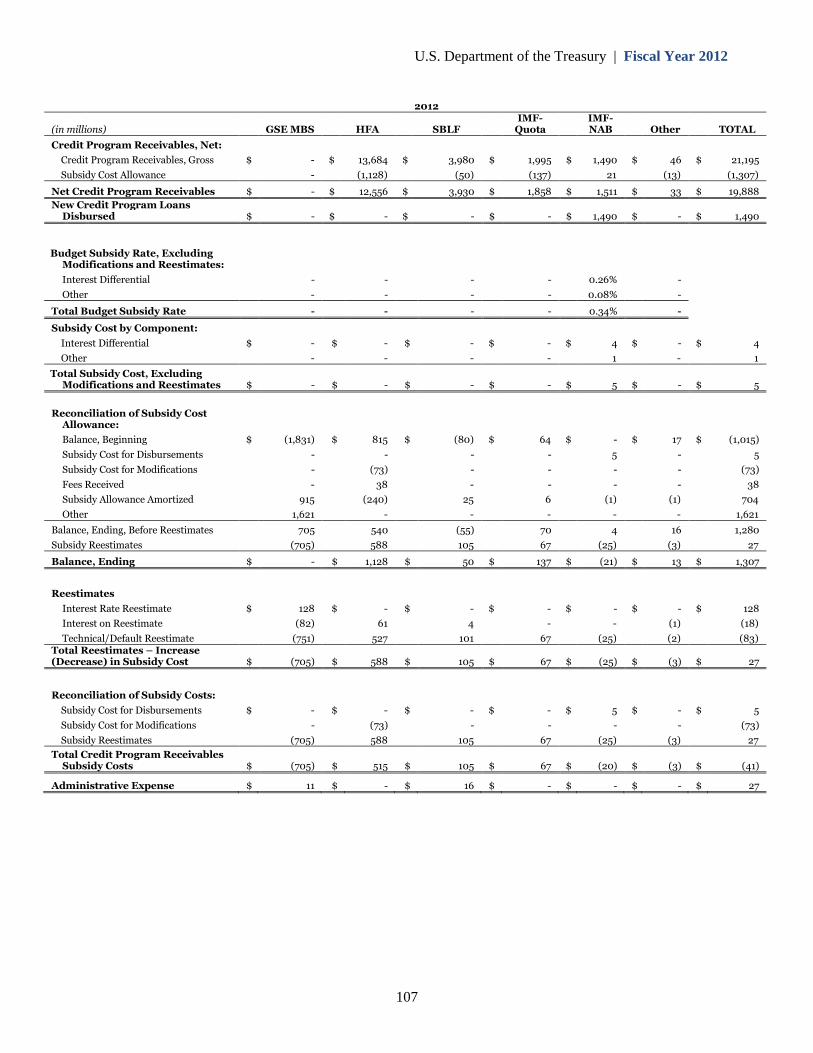
U.S. Department of the Treasury | Fiscal Year 2012
2012IMF- IMF-
(in millions) GSE MBS HFA SBLF Quota NAB Other TOTAL
Credit Program Receivables, Net:
Credit Program Receivables, Gross $ - $ 13,684 $ 3,980 $ 1,995 $ 1,490 $ 46 $ 21,195
Subsidy Cost Allowance - (1,128) (50) (137) 21 (13) (1,307)
Net Credit Program Receivables $ - $ 12,556 $ 3,930 $ 1,858 $ 1,511 $ 33 $ 19,888
New Credit Program LoansDisbursed $ - $ - $ - $ - $ 1,490 $ - $ 1,490
Budget Subsidy Rate, ExcludingModifications and Reestimates:
Interest Differential - - - - 0.26% -
Other - - - - 0.08% -
Total Budget Subsidy Rate - - - - 0.34% -
Subsidy Cost by Component:
Interest Differential $ - $ - $ - $ - $ 4 $ - $ 4
Other - - - - 1 - 1
Total Subsidy Cost, ExcludingModifications and Reestimates $ - $ - $ - $ - $ 5 $ - $ 5
Reconciliation of Subsidy CostAllowance:
Balance, Beginning $ (1,831) $ 815 $ (80) $ 64 $ - $ 17 $ (1,015)
Subsidy Cost for Disbursements - - - - 5 - 5
Subsidy Cost for Modifications - (73) - - - - (73)
Fees Received - 38 - - - - 38
Subsidy Allowance Amortized 915 (240) 25 6 (1) (1) 704
Other 1,621 - - - - - 1,621
Balance, Ending, Before Reestimates 705 540 (55) 70 4 16 1,280
Subsidy Reestimates (705) 588 105 67 (25) (3) 27
Balance, Ending $ - $ 1,128 $ 50 $ 137 $ (21) $ 13 $ 1,307
Reestimates
Interest Rate Reestimate $ 128 $ - $ - $ - $ - $ - $ 128
Interest on Reestimate (82) 61 4 - - (1) (18)
Technical/Default Reestimate (751) 527 101 67 (25) (2) (83)Total Reestimates – Increase(Decrease) in Subsidy Cost $ (705) $ 588 $ 105 $ 67 $ (25) $ (3) $ 27
Reconciliation of Subsidy Costs:
Subsidy Cost for Disbursements $ - $ - $ - $ - $ 5 $ - $ 5
Subsidy Cost for Modifications - (73) - - - - (73)
Subsidy Reestimates (705) 588 105 67 (25) (3) 27
Total Credit Program ReceivablesSubsidy Costs $ (705) $ 515 $ 105 $ 67 $ (20) $ (3) $ (41)
Administrative Expense $ 11 $ - $ 16 $ - $ - $ - $ 27
107
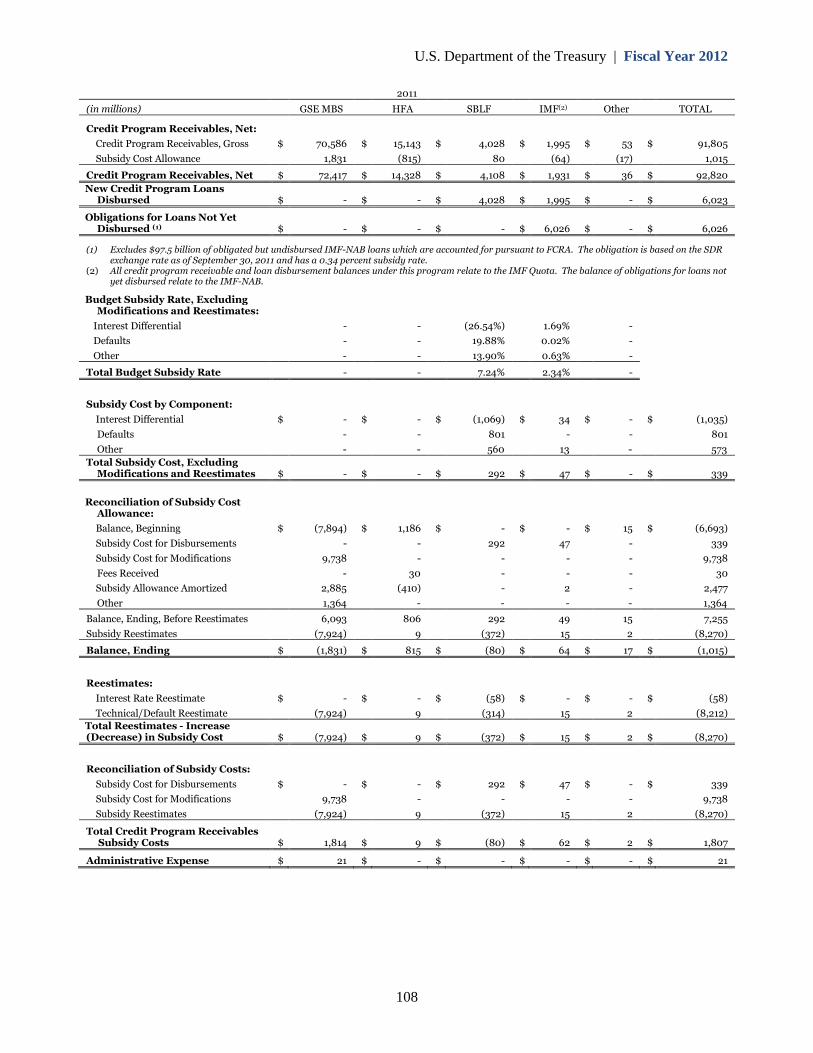
U.S. Department of the Treasury | Fiscal Year 2012
2011
(in millions) GSE MBS HFA SBLF IMF(2) Other TOTAL
Credit Program Receivables, Net:
Credit Program Receivables, Gross
Subsidy Cost Allowance
$ 70,586
1,831
$ 15,143
(815)
$ 4,028
80
$ 1,995
(64)
$ 53
(17)
$ 91,805
1,015
Credit Program Receivables, Net
New Credit Program Loans Disbursed
$
$
72,417
-
$
$
14,328
-
$
$
4,108
4,028
$
$
1,931
1,995
$
$
36
-
$
$
92,820
6,023
Obligations for Loans Not Yet Disbursed (1) $ - $ - $ - $ 6,026 $ - $ 6,026
(1) Excludes $97.5 billion of obligated b ut undisbursed IMF-NAB loans which are accounted for pursuant to FCRA. The obligation is based on the SDR exchange rate as of September 30, 2 011 and has a 0.34 percent subsidy rate.
(2) All credit program receivable and lo an disbursement balances under this program relate to the IMF Quota. The balance of obligations for loans not yet disbursed relate to the IMF-NAB .
Budget Subsidy Rate, Excluding Modifications and Reestimates:
Interest Differential - - (26.54%) 1.69% -
Defaults - - 19.88% 0.02% -
Other - - 13.90% 0.63% -
Total Budget Subsidy Rate - - 7.24% 2.34% -
Subsidy Cost by Component:
Interest Differential
Defaults
Other
Total Subsidy Cost, Excluding Modifications and Reestimates
$
$
-
-
-
-
$
$
-
-
-
-
$
$
(1,069)
801
560
292
$
$
34
-
13
47
$
$
-
-
-
-
$
$
(1,035)
801
573
339
Reconciliation of Subsidy Cost Allowance:
Balance, Beginning
Subsidy Cost for Disbursements
Subsidy Cost for Modifications
Fees Received
Subsidy Allowance Amortized
Other
Balance, Ending, Before Reestimates
Subsidy Reestimates
$ (7,894)
-
9,738
-
2,885
1,364
6,093
(7,924)
$ 1,186
-
-
30
(410)
-
806
9
$ -
292
-
-
-
-
292
(372)
$ -
47
-
-
2
-
49
15
$ 15
-
-
-
-
-
15
2
$ (6,693)
339
9,738
30
2,477
1,364
7,255
(8,270)
Balance, Ending
Reestimates:
Interest Rate Reestimate
Technical/Default Reestimate
Total Reestimates - Increase (Decrease) in Subsidy Cost
$
$
$
(1,831)
-
(7,924)
(7,924)
$
$
$
815
-
9
9
$
$
$
(80)
(58)
(314)
(372)
$
$
$
64
-
15
15
$
$
$
17 $ (1,015)
- $ (58)
2 (8,212)
2 $ (8,270)
Reconciliation of Subsidy Costs:
Subsidy Cost for Disbursements
Subsidy Cost for Modifications
Subsidy Reestimates
$ -
9,738
(7,924)
$ -
-
9
$ 292
-
(372)
$ 47
-
15
$ -
-
2
$ 339
9,738
(8,270)
Total Credit Program Receivables Subsidy Costs $ 1,814 $ 9 $ (80) $ 62 $ 2 $ 1,807
Administrative Expense $ 21 $ - $ - $ - $ - $ 21
108
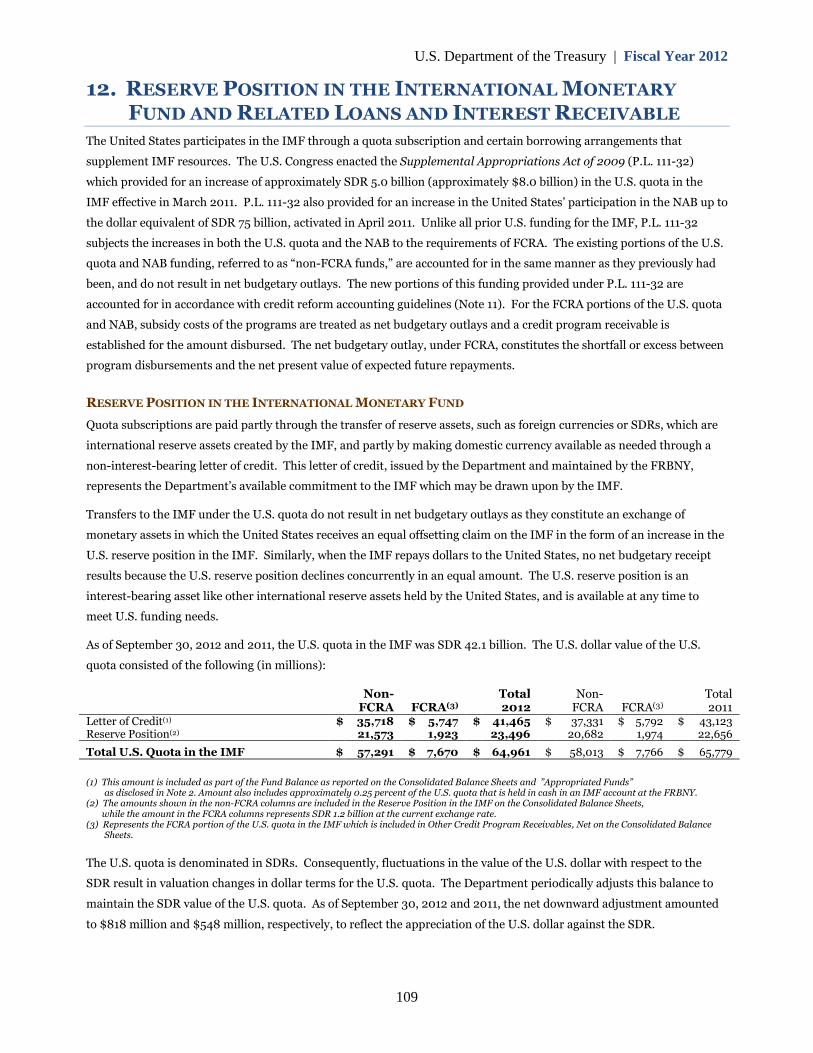
U.S. Department of the Treasury | Fiscal Year 2012
12. RESERVE POSITION IN THE INTERNATIONAL MONETARY
FUND AND RELATED LOANS AND INTEREST RECEIVABLE
The United States participates in the IMF through a quota subscription and certain borrowing arrangements that
supplement IMF resources. The U.S. Congress enacted the Supplemental Appropriations Act of 2009 (P.L. 111-32)
which provided for an increase of approximately SDR 5.0 billion (approximately $8.0 billion) in the U.S. quota in the
IMF effective in March 2011. P.L. 111-32 also provided for an increase in the United States’ participation in the NAB up to
the dollar equivalent of SDR 75 billion, activated in April 2011. Unlike all prior U.S. funding for the IMF, P.L. 111-32
subjects the increases in both the U.S. quota and the NAB to the requirements of FCRA. The existing portions of the U.S.
quota and NAB funding, referred to as “non-FCRA funds,” are accounted for in the same manner as they previously had
been, and do not result in net budgetary outlays. The new portions of this funding provided under P.L. 111-32 are
accounted for in accordance with credit reform accounting guidelines (Note 11). For the FCRA portions of the U.S. quota
and NAB, subsidy costs of the programs are treated as net budgetary outlays and a credit program receivable is
established for the amount disbursed. The net budgetary outlay, under FCRA, constitutes the shortfall or excess between
program disbursements and the net present value of expected future repayments.
RESERVE POSITION IN THE INTERNATIONAL MONETARY FUND
Quota subscriptions are paid partly through the transfer of reserve assets, such as foreign currencies or SDRs, which are
international reserve assets created by the IMF, and partly by making domestic currency available as needed through a
non-interest-bearing letter of credit. This letter of credit, issued by the Department and maintained by the FRBNY,
represents the Department’s available commitment to the IMF which may be drawn upon by the IMF.
Transfers to the IMF under the U.S. quota do not result in net budgetary outlays as they constitute an exchange of
monetary assets in which the United States receives an equal offsetting claim on the IMF in the form of an increase in the
U.S. reserve position in the IMF. Similarly, when the IMF repays dollars to the United States, no net budgetary receipt
results because the U.S. reserve position declines concurrently in an equal amount. The U.S. reserve position is an
interest-bearing asset like other international reserve assets held by the United States, and is available at any time to
meet U.S. funding needs.
As of September 30, 2012 and 2011, the U.S. quota in the IMF was SDR 42.1 billion. The U.S. dollar value of the U.S.
quota consisted of the following (in millions):
Non- Total Non- TotalFCRA FCRA(3) 2012 FCRA FCRA(3) 2011
Letter of Credit(1) $ 35,718 $ 5,747 $ 41,465 $ 37,331 $ 5,792 $ 43,123Reserve Position(2) 21,573 1,923 23,496 20,682 1,974 22,656
Total U.S. Quota in the IMF $ 57,291 $ 7,670 $ 64,961 $ 58,013 $ 7,766 $ 65,779
(1) This amount is included as part of the Fund Balance as reported on the Consolidated Balance Sheets and ”Appropriated Funds”as disclosed in Note 2. Amount also includes approximately 0.25 percent of the U.S. quota that is held in cash in an IMF account at the FRBNY.
(2) The amounts shown in the non-FCRA columns are included in the Reserve Position in the IMF on the Consolidated Balance Sheets,while the amount in the FCRA columns represents SDR 1.2 billion at the current exchange rate.
(3) Represents the FCRA portion of the U.S. quota in the IMF which is included in Other Credit Program Receivables, Net on the Consolidated BalanceSheets.
The U.S. quota is denominated in SDRs. Consequently, fluctuations in the value of the U.S. dollar with respect to the
SDR result in valuation changes in dollar terms for the U.S. quota. The Department periodically adjusts this balance to
maintain the SDR value of the U.S. quota. As of September 30, 2012 and 2011, the net downward adjustment amounted
to $818 million and $548 million, respectively, to reflect the appreciation of the U.S. dollar against the SDR.
109
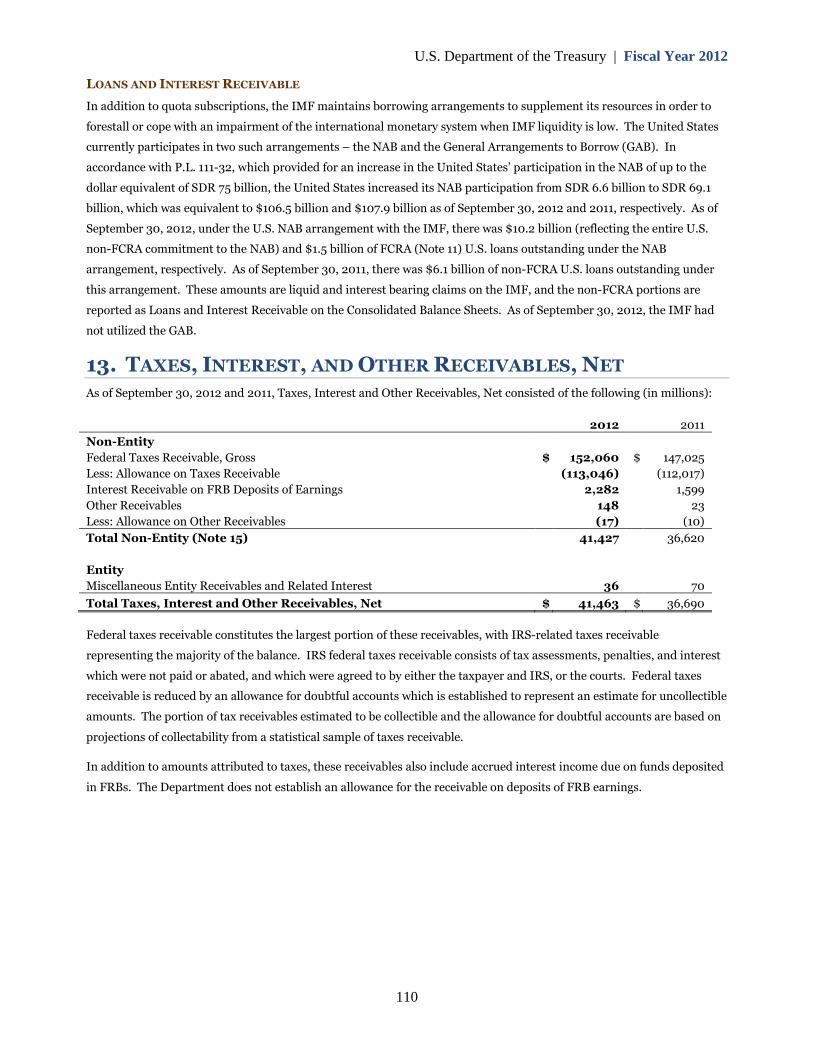
U.S. Department of the Treasury | Fiscal Year 2012
LOANS AND INTEREST RECEIVABLE
In addition to quota subscriptions, the IMF maintains borrowing arrangements to supplement its resources in order to
forestall or cope with an impairment of the international monetary system when IMF liquidity is low. The United States
currently participates in two such arrangements – the NAB and the General Arrangements to Borrow (GAB). In
accordance with P.L. 111-32, which provided for an increase in the United States’ participation in the NAB of up to the
dollar equivalent of SDR 75 billion, the United States increased its NAB participation from SDR 6.6 billion to SDR 69.1
billion, which was equivalent to $106.5 billion and $107.9 billion as of September 30, 2012 and 2011, respectively. As of
September 30, 2012, under the U.S. NAB arrangement with the IMF, there was $10.2 billion (reflecting the entire U.S.
non-FCRA commitment to the NAB) and $1.5 billion of FCRA (Note 11) U.S. loans outstanding under the NAB
arrangement, respectively. As of September 30, 2011, there was $6.1 billion of non-FCRA U.S. loans outstanding under
this arrangement. These amounts are liquid and interest bearing claims on the IMF, and the non-FCRA portions are
reported as Loans and Interest Receivable on the Consolidated Balance Sheets. As of September 30, 2012, the IMF had
not utilized the GAB.
13. TAXES, INTEREST, AND OTHER RECEIVABLES, NET
As of September 30, 2012 and 2011, Taxes, Interest and Other Receivables, Net consisted of the following (in millions):
2012 2011
Non-Entity
Federal Taxes Receivable, Gross $ 152,060 $ 147,025
Less: Allowance on Taxes Receivable (113,046) (112,017)
Interest Receivable on FRB Deposits of Earnings 2,282 1,599
Other Receivables 148 23
Less: Allowance on Other Receivables (17) (10)
Total Non-Entity (Note 15) 41,427 36,620
Entity
Miscellaneous Entity Receivables and Related Interest 36 70
Total Taxes, Interest and Other Receivables, Net $ 41,463 $ 36,690
Federal taxes receivable constitutes the largest portion of these receivables, with IRS-related taxes receivable
representing the majority of the balance. IRS federal taxes receivable consists of tax assessments, penalties, and interest
which were not paid or abated, and which were agreed to by either the taxpayer and IRS, or the courts. Federal taxes
receivable is reduced by an allowance for doubtful accounts which is established to represent an estimate for uncollectible
amounts. The portion of tax receivables estimated to be collectible and the allowance for doubtful accounts are based on
projections of collectability from a statistical sample of taxes receivable.
In addition to amounts attributed to taxes, these receivables also include accrued interest income due on funds deposited
in FRBs. The Department does not establish an allowance for the receivable on deposits of FRB earnings.
110
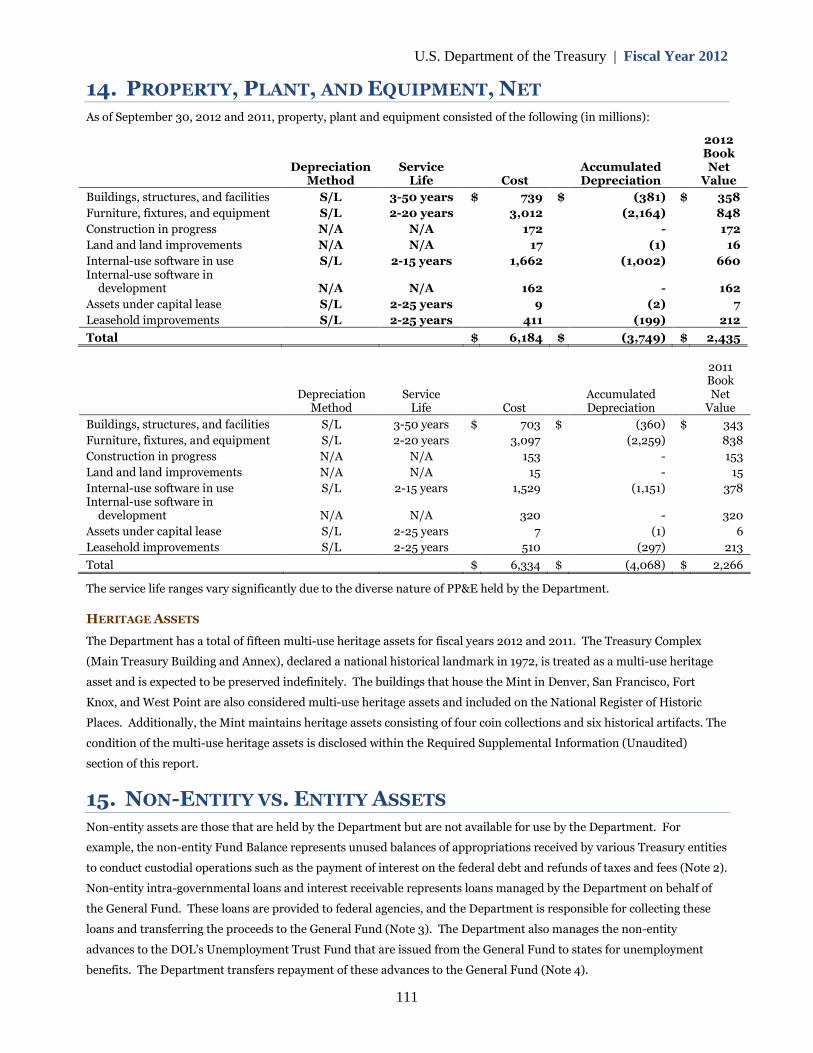
U.S. Department of the Treasury | Fiscal Year 2012
14. PROPERTY, PLANT, AND EQUIPMENT, NET
As of September 30, 2012 and 2011, property, plant and equipment consisted of the following (in millions):
2012Book
Depreciation Service Accumulated NetMethod Life Cost Depreciation Value
Buildings, structures, and facilities S/L 3-50 years $ 739 $ (381) $ 358
Furniture, fixtures, and equipment S/L 2-20 years 3,012 (2,164) 848
Construction in progress N/A N/A 172 - 172
Land and land improvements N/A N/A 17 (1) 16
Internal-use software in use S/L 2-15 years 1,662 (1,002) 660Internal-use software in
development N/A N/A 162 - 162
Assets under capital lease S/L 2-25 years 9 (2) 7
Leasehold improvements S/L 2-25 years 411 (199) 212
Total $ 6,184 $ (3,749) $ 2,435
2011Book
Depreciation Service Accumulated NetMethod Life Cost Depreciation Value
Buildings, structures, and facilities S/L 3-50 years $ 703 $ (360) $ 343
Furniture, fixtures, and equipment S/L 2-20 years 3,097 (2,259) 838
Construction in progress N/A N/A 153 - 153
Land and land improvements N/A N/A 15 - 15
Internal-use software in use S/L 2-15 years 1,529 (1,151) 378Internal-use software in
development N/A N/A 320 - 320
Assets under capital lease S/L 2-25 years 7 (1) 6
Leasehold improvements S/L 2-25 years 510 (297) 213
Total $ 6,334 $ (4,068) $ 2,266
The service life ranges vary significantly due to the diverse nature of PP&E held by the Department.
HERITAGE ASSETS
The Department has a total of fifteen multi-use heritage assets for fiscal years 2012 and 2011. The Treasury Complex
(Main Treasury Building and Annex), declared a national historical landmark in 1972, is treated as a multi-use heritage
asset and is expected to be preserved indefinitely. The buildings that house the Mint in Denver, San Francisco, Fort
Knox, and West Point are also considered multi-use heritage assets and included on the National Register of Historic
Places. Additionally, the Mint maintains heritage assets consisting of four coin collections and six historical artifacts. The
condition of the multi-use heritage assets is disclosed within the Required Supplemental Information (Unaudited)
section of this report.
15. NON-ENTITY VS. ENTITY ASSETS
Non-entity assets are those that are held by the Department but are not available for use by the Department. For
example, the non-entity Fund Balance represents unused balances of appropriations received by various Treasury entities
to conduct custodial operations such as the payment of interest on the federal debt and refunds of taxes and fees (Note 2).
Non-entity intra-governmental loans and interest receivable represents loans managed by the Department on behalf of
the General Fund. These loans are provided to federal agencies, and the Department is responsible for collecting these
loans and transferring the proceeds to the General Fund (Note 3). The Department also manages the non-entity
advances to the DOL’s Unemployment Trust Fund that are issued from the General Fund to states for unemployment
benefits. The Department transfers repayment of these advances to the General Fund (Note 4).
111
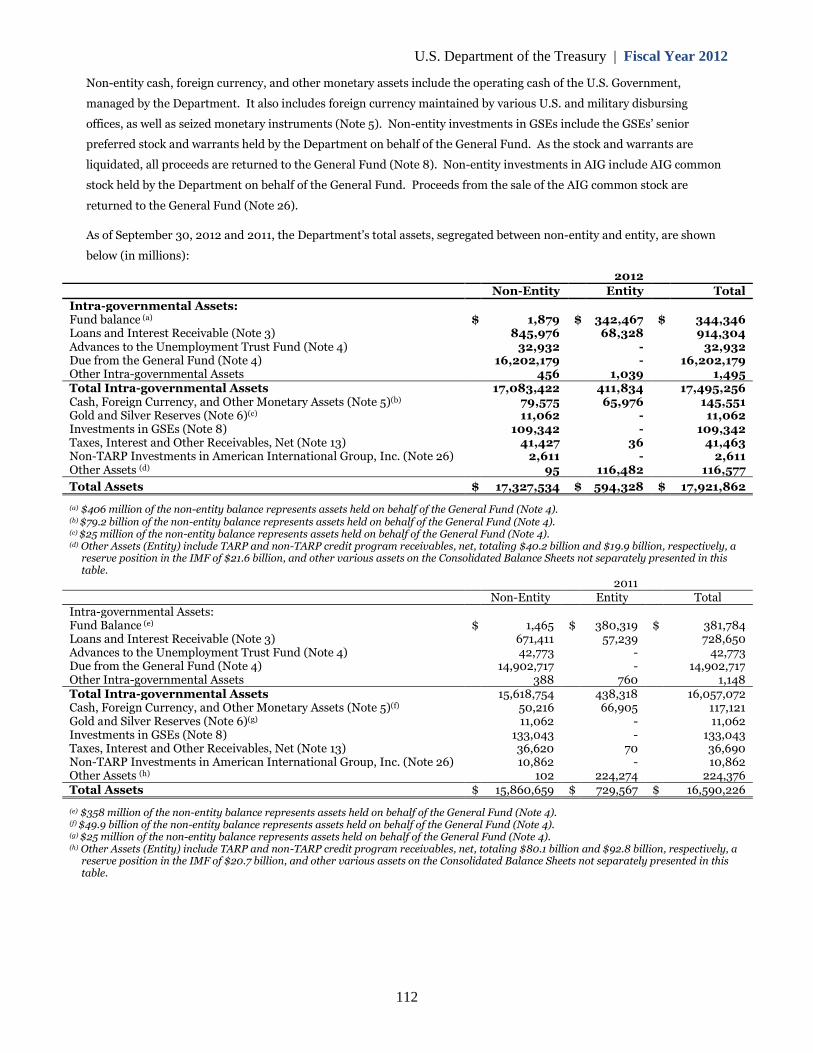
U.S. Department of the Treasury | Fiscal Year 2012
Non-entity cash, foreign currency, and other monetary assets include the operating cash of the U.S. Government,
managed by the Department. It also includes foreign currency maintained by various U.S. and military disbursing
offices, as well as seized monetary instruments (Note 5). Non-entity investments in GSEs include the GSEs’ senior
preferred stock and warrants held by the Department on behalf of the General Fund. As the stock and warrants are
liquidated, all proceeds are returned to the General Fund (Note 8). Non-entity investments in AIG include AIG common
stock held by the Department on behalf of the General Fund. Proceeds from the sale of the AIG common stock are
returned to the General Fund (Note 26).
As of September 30, 2012 and 2011, the Department’s total assets, segregated between non-entity and entity, are shown
below (in millions):
2012Non-Entity Entity Total
Intra-governmental Assets:Fund balance (a) $ 1,879 $ 342,467 $ 344,346Loans and Interest Receivable (Note 3) 845,976 68,328 914,304Advances to the Unemployment Trust Fund (Note 4) 32,932 - 32,932Due from the General Fund (Note 4) 16,202,179 - 16,202,179Other Intra-governmental Assets 456 1,039 1,495Total Intra-governmental Assets 17,083,422 411,834 17,495,256Cash, Foreign Currency, and Other Monetary Assets (Note 5)(b) 79,575 65,976 145,551Gold and Silver Reserves (Note 6)(c) 11,062 - 11,062Investments in GSEs (Note 8) 109,342 - 109,342Taxes, Interest and Other Receivables, Net (Note 13) 41,427 36 41,463Non-TARP Investments in American International Group, Inc. (Note 26) 2,611 - 2,611Other Assets (d) 95 116,482 116,577
Total Assets $ 17,327,534 $ 594,328 $ 17,921,862
(a) $406 million of the non-entity balance represents assets held on behalf of the General Fund (Note 4).(b) $79.2 billion of the non-entity balance represents assets held on behalf of the General Fund (Note 4).(c) $25 million of the non-entity balance represents assets held on behalf of the General Fund (Note 4).(d) Other Assets (Entity) include TARP and non-TARP credit program receivables, net, totaling $40.2 billion and $19.9 billion, respectively, a
reserve position in the IMF of $21.6 billion, and other various assets on the Consolidated Balance Sheets not separately presented in thistable.
2011Non-Entity Entity Total
Intra-governmental Assets:Fund Balance (e) $ 1,465 $ 380,319 $ 381,784Loans and Interest Receivable (Note 3) 671,411 57,239 728,650Advances to the Unemployment Trust Fund (Note 4) 42,773 - 42,773Due from the General Fund (Note 4) 14,902,717 - 14,902,717Other Intra-governmental Assets 388 760 1,148Total Intra-governmental Assets 15,618,754 438,318 16,057,072Cash, Foreign Currency, and Other Monetary Assets (Note 5)(f) 50,216 66,905 117,121Gold and Silver Reserves (Note 6)(g) 11,062 - 11,062Investments in GSEs (Note 8) 133,043 - 133,043Taxes, Interest and Other Receivables, Net (Note 13) 36,620 70 36,690Non-TARP Investments in American International Group, Inc. (Note 26) 10,862 - 10,862Other Assets (h) 102 224,274 224,376Total Assets $ 15,860,659 $ 729,567 $ 16,590,226
(e) $358 million of the non-entity balance represents assets held on behalf of the General Fund (Note 4).(f) $49.9 billion of the non-entity balance represents assets held on behalf of the General Fund (Note 4).(g) $25 million of the non-entity balance represents assets held on behalf of the General Fund (Note 4).(h) Other Assets (Entity) include TARP and non-TARP credit program receivables, net, totaling $80.1 billion and $92.8 billion, respectively, a
reserve position in the IMF of $20.7 billion, and other various assets on the Consolidated Balance Sheets not separately presented in thistable.
112
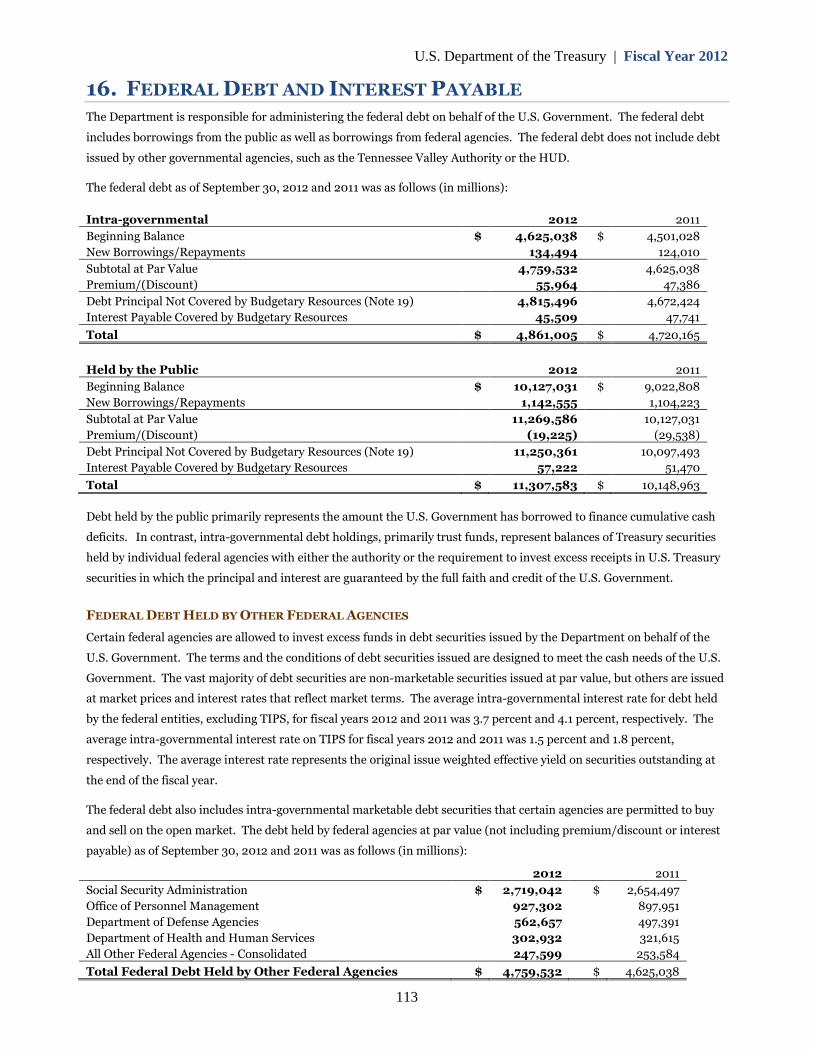
U.S. Department of the Treasury | Fiscal Year 2012
16. FEDERAL DEBT AND INTEREST PAYABLE
The Department is responsible for administering the federal debt on behalf of the U.S. Government. The federal debt
includes borrowings from the public as well as borrowings from federal agencies. The federal debt does not include debt
issued by other governmental agencies, such as the Tennessee Valley Authority or the HUD.
The federal debt as of September 30, 2012 and 2011 was as follows (in millions):
Intra-governmental 2012 2011
Beginning Balance $ 4,625,038 $ 4,501,028
New Borrowings/Repayments 134,494 124,010
Subtotal at Par Value 4,759,532 4,625,038
Premium/(Discount) 55,964 47,386
Debt Principal Not Covered by Budgetary Resources (Note 19) 4,815,496 4,672,424
Interest Payable Covered by Budgetary Resources 45,509 47,741
Total $ 4,861,005 $ 4,720,165
Held by the Public 2012 2011
Beginning Balance $ 10,127,031 $ 9,022,808
New Borrowings/Repayments 1,142,555 1,104,223
Subtotal at Par Value 11,269,586 10,127,031
Premium/(Discount) (19,225) (29,538)
Debt Principal Not Covered by Budgetary Resources (Note 19) 11,250,361 10,097,493
Interest Payable Covered by Budgetary Resources 57,222 51,470
Total $ 11,307,583 $ 10,148,963
Debt held by the public primarily represents the amount the U.S. Government has borrowed to finance cumulative cash
deficits. In contrast, intra-governmental debt holdings, primarily trust funds, represent balances of Treasury securities
held by individual federal agencies with either the authority or the requirement to invest excess receipts in U.S. Treasury
securities in which the principal and interest are guaranteed by the full faith and credit of the U.S. Government.
FEDERAL DEBT HELD BY OTHER FEDERAL AGENCIES
Certain federal agencies are allowed to invest excess funds in debt securities issued by the Department on behalf of the
U.S. Government. The terms and the conditions of debt securities issued are designed to meet the cash needs of the U.S.
Government. The vast majority of debt securities are non-marketable securities issued at par value, but others are issued
at market prices and interest rates that reflect market terms. The average intra-governmental interest rate for debt held
by the federal entities, excluding TIPS, for fiscal years 2012 and 2011 was 3.7 percent and 4.1 percent, respectively. The
average intra-governmental interest rate on TIPS for fiscal years 2012 and 2011 was 1.5 percent and 1.8 percent,
respectively. The average interest rate represents the original issue weighted effective yield on securities outstanding at
the end of the fiscal year.
The federal debt also includes intra-governmental marketable debt securities that certain agencies are permitted to buy
and sell on the open market. The debt held by federal agencies at par value (not including premium/discount or interest
payable) as of September 30, 2012 and 2011 was as follows (in millions):
2012 2011
Social Security Administration $ 2,719,042 $ 2,654,497
Office of Personnel Management 927,302 897,951
Department of Defense Agencies 562,657 497,391
Department of Health and Human Services 302,932 321,615
All Other Federal Agencies - Consolidated 247,599 253,584
Total Federal Debt Held by Other Federal Agencies $ 4,759,532 $ 4,625,038
113

U.S. Department of the Treasury | Fiscal Year 2012
FEDERAL DEBT HELD BY THE PUBLIC
Federal debt held by the public at par value (not including premium/discount or interest payable) as of September 30,
2012 and 2011 consisted of the following (in millions):
AverageInterest
(at par value)
Marketable:
Term Rates 2012
Treasury Bills 1 Year or Less 0.1% $ 1,613,026
Treasury Notes Over 1 Year - 10 Years 2.0% 7,114,961
Treasury Bonds Over 10 Years 5.4% 1,194,715
Treasury Inflation-Protected Security (TIPS)
Total Marketable
5 Years or More 1.4% 807,469
10,730,171
Non-Marketable On Demand to Over 10 Years
Total Federal Debt Held by the Public
2.1% 539,415
$ 11,269,586
AverageInterest
(at par value)
Marketable:
Term Rates 2011
Treasury Bills 1 Year or Less 0.1% $ 1,475,557
Treasury Notes Over 1 Year - 10 Years 2.3% 6,406,983
Treasury Bonds Over 10 Years 5.8% 1,016,407
Treasury Inflation-Protected Security (TIPS)
Total Marketable
5 Years or More 1.9% 705,352
9,604,299Non-Marketable On Demand to Over 10 Years
Total Federal Debt Held by the Public
2.8% 522,732
$ 10,127,031
The Department issues marketable bills at a discount or at par, and pays the par amount of the security upon maturity.
The average interest rate on Treasury bills represents the original issue effective yield on securities outstanding at year
end. Treasury bills are issued with a term of one year or less.
The Department issues marketable notes and bonds as long-term securities that pay semi-annual interest based on the
securities’ stated interest rates. These securities are issued at either par value or at an amount that reflects a discount or a
premium. The average interest rate on marketable notes and bonds represents the stated interest rate adjusted by any
discount or premium on securities outstanding at year-end. Treasury notes are issued with a term of over one year to ten
years, and Treasury bonds are issued with a term of more than ten years. The Department also issues TIPS that have
interest and redemption payments tied to the Consumer Price Index for all Urban Consumers, a widely used
measurement of inflation. TIPS are issued with a term of five years or more. At maturity, TIPS are redeemed at the
inflation-adjusted principal amount, or the original par value, whichever is greater. TIPS pay a semi-annual fixed rate of
interest applied to the inflation-adjusted principal. The average interest rate on TIPS represents the stated interest rate
on principal plus inflation, adjusted by any discount or premium on securities outstanding as of the end of the fiscal year.
The inflation-adjusted TIPS principal balance of federal debt held by the public included inflation of $77.9 billion and
$76.1 billion as of September 30, 2012 and 2011, respectively.
During fiscal year 2012, the Department issued bills, notes, bonds, and TIPS to meet the borrowing needs of the U.S.
Government. Treasury bills outstanding increased by $ 137.5 billion; whereas, Treasury notes, bonds, and TIPS
outstanding increased by $708.0 billion, $178.3 billion, and $102.1 billion, respectively, in fiscal year 2012.
September 30, 2012 occurred on a Sunday and, therefore, debt repayments on matured securities occurred on Monday,
October 1, 2012. Accordingly, $53.0 billion of marketable Treasury notes and $36 million of non-marketable securities,
matured but not repaid, are included in the balance of the total debt held by the public.
114
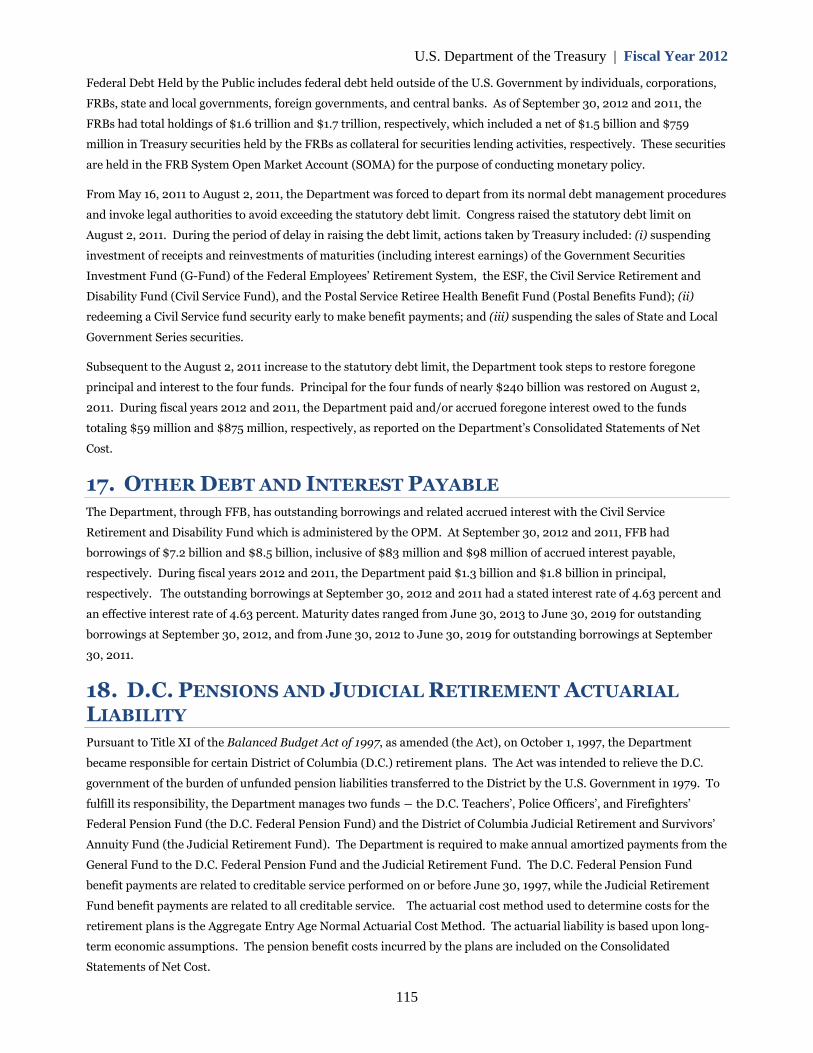
U.S. Department of the Treasury | Fiscal Year 2012
115
Federal Debt Held by the Public includes federal debt held outside of the U.S. Government by individuals, corporations,
FRBs, state and local governments, foreign governments, and central banks. As of September 30, 2012 and 2011, the
FRBs had total holdings of $1.6 trillion and $1.7 trillion, respectively, which included a net of $1.5 billion and $759
million in Treasury securities held by the FRBs as collateral for securities lending activities, respectively. These securities
are held in the FRB System Open Market Account (SOMA) for the purpose of conducting monetary policy.
From May 16, 2011 to August 2, 2011, the Department was forced to depart from its normal debt management procedures
and invoke legal authorities to avoid exceeding the statutory debt limit. Congress raised the statutory debt limit on
August 2, 2011. During the period of delay in raising the debt limit, actions taken by Treasury included: (i) suspending
investment of receipts and reinvestments of maturities (including interest earnings) of the Government Securities
Investment Fund (G-Fund) of the Federal Employees’ Retirement System, the ESF, the Civil Service Retirement and
Disability Fund (Civil Service Fund), and the Postal Service Retiree Health Benefit Fund (Postal Benefits Fund); (ii)
redeeming a Civil Service fund security early to make benefit payments; and (iii) suspending the sales of State and Local
Government Series securities.
Subsequent to the August 2, 2011 increase to the statutory debt limit, the Department took steps to restore foregone
principal and interest to the four funds. Principal for the four funds of nearly $240 billion was restored on August 2,
2011. During fiscal years 2012 and 2011, the Department paid and/or accrued foregone interest owed to the funds
totaling $59 million and $875 million, respectively, as reported on the Department’s Consolidated Statements of Net
Cost.
17. OTHER DEBT AND INTEREST PAYABLE
The Department, through FFB, has outstanding borrowings and related accrued interest with the Civil Service
Retirement and Disability Fund which is administered by the OPM. At September 30, 2012 and 2011, FFB had
borrowings of $7.2 billion and $8.5 billion, inclusive of $83 million and $98 million of accrued interest payable,
respectively. During fiscal years 2012 and 2011, the Department paid $1.3 billion and $1.8 billion in principal,
respectively. The outstanding borrowings at September 30, 2012 and 2011 had a stated interest rate of 4.63 percent and
an effective interest rate of 4.63 percent. Maturity dates ranged from June 30, 2013 to June 30, 2019 for outstanding
borrowings at September 30, 2012, and from June 30, 2012 to June 30, 2019 for outstanding borrowings at September
30, 2011.
18. D.C. PENSIONS AND JUDICIAL RETIREMENT ACTUARIAL
LIABILITY
Pursuant to Title XI of the Balanced Budget Act of 1997, as amended (the Act), on October 1, 1997, the Department
became responsible for certain District of Columbia (D.C.) retirement plans. The Act was intended to relieve the D.C.
government of the burden of unfunded pension liabilities transferred to the District by the U.S. Government in 1979. To
fulfill its responsibility, the Department manages two funds ― the D.C. Teachers’, Police Officers’, and Firefighters’
Federal Pension Fund (the D.C. Federal Pension Fund) and the District of Columbia Judicial Retirement and Survivors’
Annuity Fund (the Judicial Retirement Fund). The Department is required to make annual amortized payments from the
General Fund to the D.C. Federal Pension Fund and the Judicial Retirement Fund. The D.C. Federal Pension Fund
benefit payments are related to creditable service performed on or before June 30, 1997, while the Judicial Retirement
Fund benefit payments are related to all creditable service. The actuarial cost method used to determine costs for the
retirement plans is the Aggregate Entry Age Normal Actuarial Cost Method. The actuarial liability is based upon long-
term economic assumptions. The pension benefit costs incurred by the plans are included on the Consolidated
Statements of Net Cost.
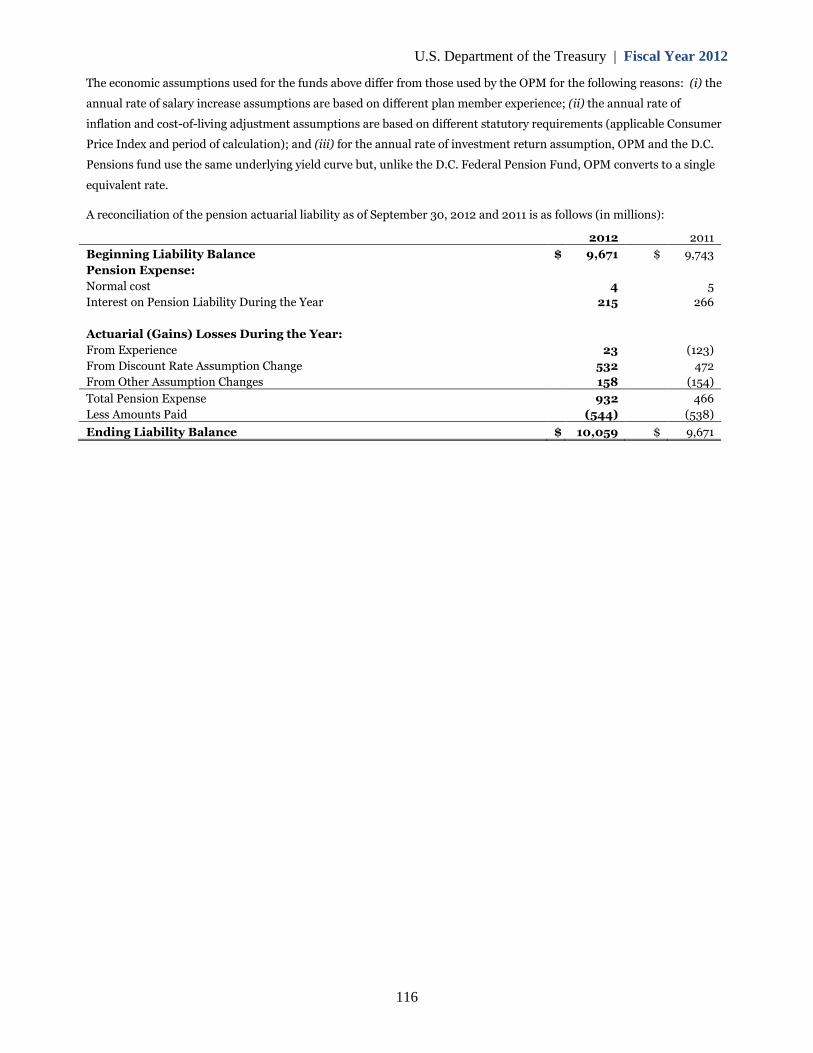
U.S. Department of the Treasury | Fiscal Year 2012
The economic assumptions used for the funds above differ from those used by the OPM for the following reasons: (i) the
annual rate of salary increase assumptions are based on different plan member experience; (ii) the annual rate of
inflation and cost-of-living adjustment assumptions are based on different statutory requirements (applicable Consumer
Price Index and period of calculation); and (iii) for the annual rate of investment return assumption, OPM and the D.C.
Pensions fund use the same underlying yield curve but, unlike the D.C. Federal Pension Fund, OPM converts to a single
equivalent rate.
A reconciliation of the pension actuarial liability as of September 30, 2012 and 2011 is as follows (in millions):
2012 2011
Beginning Liability Balance $ 9,671 $ 9,743
Pension Expense:
Normal cost 4 5
Interest on Pension Liability During the Year 215 266
Actuarial (Gains) Losses During the Year:
From Experience 23 (123)
From Discount Rate Assumption Change 532 472
From Other Assumption Changes 158 (154)
Total Pension Expense 932 466
Less Amounts Paid (544) (538)
Ending Liability Balance $ 10,059 $ 9,671
116
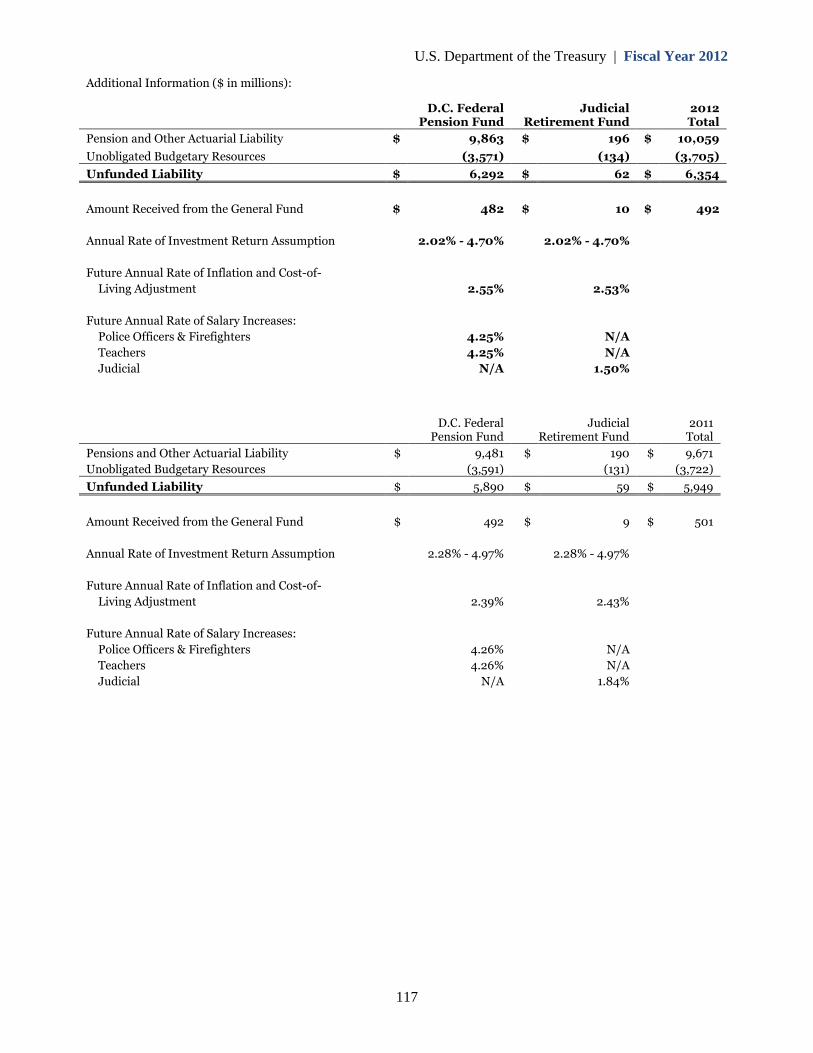
U.S. Department of the Treasury | Fiscal Year 2012
Additional Information ($ in millions):
D.C. FederalPension Fund
JudicialRetirement Fund
2012Total
Pension and Other Actuarial Liability $ 9,863 $ 196 $ 10,059
Unobligated Budgetary Resources (3,571) (134) (3,705)
Unfunded Liability $ 6,292 $ 62 $ 6,354
Amount Received from the General Fund $ 482 $ 10 $ 492
Annual Rate of Investment Return Assumption 2.02% - 4.70% 2.02% - 4.70%
Future Annual Rate of Inflation and Cost-of-
Living Adjustment 2.55% 2.53%
Future Annual Rate of Salary Increases:
Police Officers & Firefighters
Teachers
Judicial
4.25%
4.25%
N/A
N/A
N/A
1.50%
D.C. FederalPension Fund
JudicialRetirement Fund
2011Total
Pensions and Other Actuarial Liability
Unobligated Budgetary Resources
$ 9,481
(3,591)
$ 190
(131)
$ 9,671
(3,722)
Unfunded Liability $ 5,890 $ 59 $ 5,949
Amount Received from the General Fund $ 492 $ 9 $ 501
Annual Rate of Investment Return Assumption 2.28% - 4.97% 2.28% - 4.97%
Future Annual Rate of Inflation and Cost-of-
Living Adjustment 2.39% 2.43%
Future Annual Rate of Salary Increases:
Police Officers & Firefighters
Teachers
Judicial
4.26%
4.26%
N/A
N/A
N/A
1.84%
117
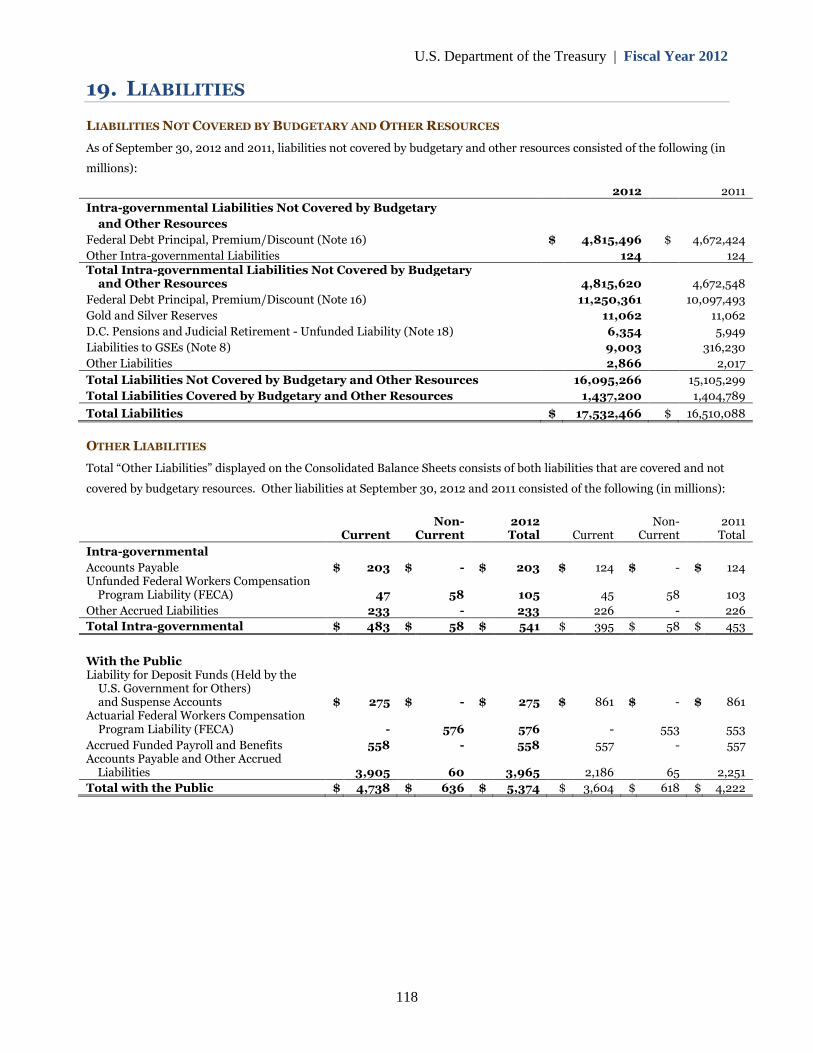
U.S. Department of the Treasury | Fiscal Year 2012
19. LIABILITIES
LIABILITIES NOT COVERED BY BUDGETARY AND OTHER RESOURCES
As of September 30, 2012 and 2011, liabilities not covered by budgetary and other resources consisted of the following (in
millions):
2012 2011
Intra-governmental Liabilities Not Covered by Budgetary
and Other Resources
Federal Debt Principal, Premium/Discount (Note 16) $ 4,815,496 $ 4,672,424
Other Intra-governmental Liabilities 124 124Total Intra-governmental Liabilities Not Covered by Budgetary
and Other Resources 4,815,620 4,672,548
Federal Debt Principal, Premium/Discount (Note 16) 11,250,361 10,097,493
Gold and Silver Reserves 11,062 11,062
D.C. Pensions and Judicial Retirement - Unfunded Liability (Note 18) 6,354 5,949
Liabilities to GSEs (Note 8) 9,003 316,230
Other Liabilities 2,866 2,017
Total Liabilities Not Covered by Budgetary and Other Resources 16,095,266 15,105,299
Total Liabilities Covered by Budgetary and Other Resources 1,437,200 1,404,789
Total Liabilities $ 17,532,466 $ 16,510,088
OTHER LIABILITIES
Total “Other Liabilities” displayed on the Consolidated Balance Sheets consists of both liabilities that are covered and not
covered by budgetary resources. Other liabilities at September 30, 2012 and 2011 consisted of the following (in millions):
Non- 2012 Non- 2011Current Current Total Current Current Total
Intra-governmental
Accounts Payable $ 203 $ - $ 203 $ 124 $ - $ 124Unfunded Federal Workers Compensation
Program Liability (FECA) 47 58 105 45 58 103
Other Accrued Liabilities 233 - 233 226 - 226
Total Intra-governmental $ 483 $ 58 $ 541 $ 395 $ 58 $ 453
With the PublicLiability for Deposit Funds (Held by the
U.S. Government for Others)and Suspense Accounts $ 275 $ - $ 275 $ 861 $ - $ 861
Actuarial Federal Workers CompensationProgram Liability (FECA) - 576 576 - 553 553
Accrued Funded Payroll and Benefits 558 - 558 557 - 557Accounts Payable and Other Accrued
Liabilities 3,905 60 3,965 2,186 65 2,251
Total with the Public $ 4,738 $ 636 $ 5,374 $ 3,604 $ 618 $ 4,222
118
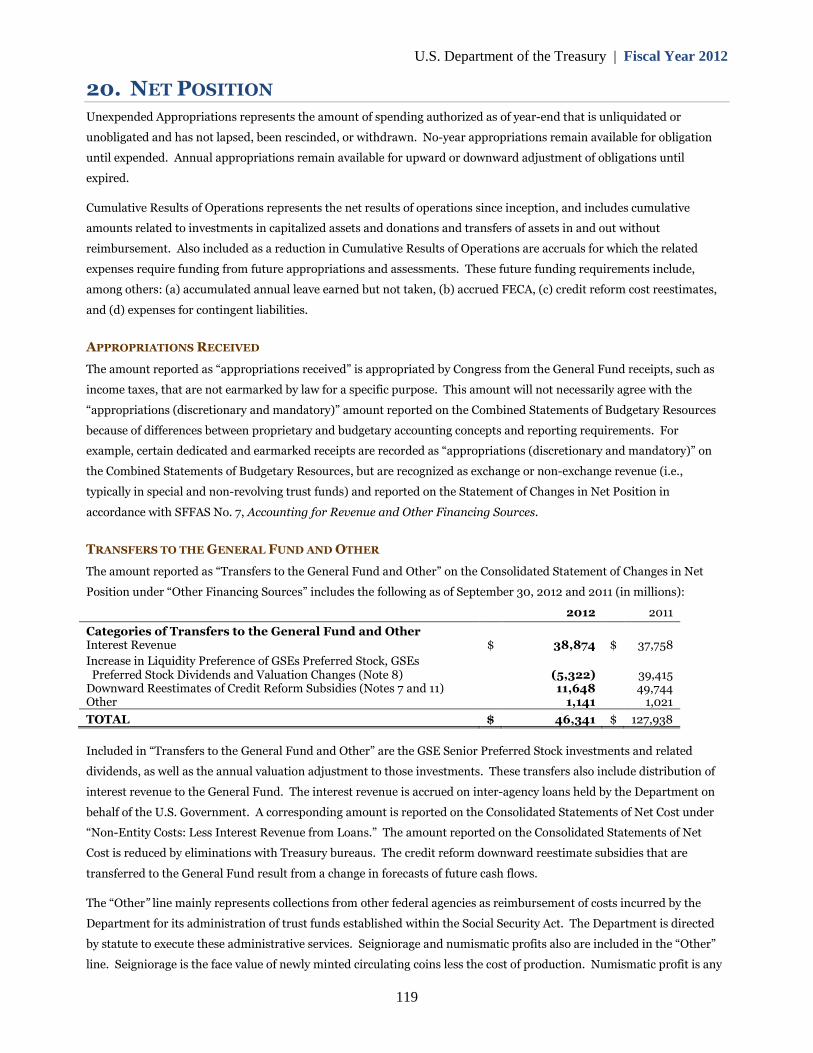
U.S. Department of the Treasury | Fiscal Year 2012
20. NET POSITION
Unexpended Appropriations represents the amount of spending authorized as of year-end that is unliquidated or
unobligated and has not lapsed, been rescinded, or withdrawn. No-year appropriations remain available for obligation
until expended. Annual appropriations remain available for upward or downward adjustment of obligations until
expired.
Cumulative Results of Operations represents the net results of operations since inception, and includes cumulative
amounts related to investments in capitalized assets and donations and transfers of assets in and out without
reimbursement. Also included as a reduction in Cumulative Results of Operations are accruals for which the related
expenses require funding from future appropriations and assessments. These future funding requirements include,
among others: (a) accumulated annual leave earned but not taken, (b) accrued FECA, (c) credit reform cost reestimates,
and (d) expenses for contingent liabilities.
APPROPRIATIONS RECEIVED
The amount reported as “appropriations received” is appropriated by Congress from the General Fund receipts, such as
income taxes, that are not earmarked by law for a specific purpose. This amount will not necessarily agree with the
“appropriations (discretionary and mandatory)” amount reported on the Combined Statements of Budgetary Resources
because of differences between proprietary and budgetary accounting concepts and reporting requirements. For
example, certain dedicated and earmarked receipts are recorded as “appropriations (discretionary and mandatory)” on
the Combined Statements of Budgetary Resources, but are recognized as exchange or non-exchange revenue (i.e.,
typically in special and non-revolving trust funds) and reported on the Statement of Changes in Net Position in
accordance with SFFAS No. 7, Accounting for Revenue and Other Financing Sources.
TRANSFERS TO THE GENERAL FUND AND OTHER
The amount reported as “Transfers to the General Fund and Other” on the Consolidated Statement of Changes in Net
Position under “Other Financing Sources” includes the following as of September 30, 2012 and 2011 (in millions):
2012 2011
Categories of Transfers to the General Fund and OtherInterest Revenue $ 38,874 $ 37,758
Increase in Liquidity Preference of GSEs Preferred Stock, GSEsPreferred Stock Dividends and Valuation Changes (Note 8) (5,322) 39,415
Downward Reestimates of Credit Reform Subsidies (Notes 7 and 11) 11,648 49,744Other 1,141 1,021
TOTAL $ 46,341 $ 127,938
Included in “Transfers to the General Fund and Other” are the GSE Senior Preferred Stock investments and related
dividends, as well as the annual valuation adjustment to those investments. These transfers also include distribution of
interest revenue to the General Fund. The interest revenue is accrued on inter-agency loans held by the Department on
behalf of the U.S. Government. A corresponding amount is reported on the Consolidated Statements of Net Cost under
“Non-Entity Costs: Less Interest Revenue from Loans.” The amount reported on the Consolidated Statements of Net
Cost is reduced by eliminations with Treasury bureaus. The credit reform downward reestimate subsidies that are
transferred to the General Fund result from a change in forecasts of future cash flows.
The “Other” line mainly represents collections from other federal agencies as reimbursement of costs incurred by the
Department for its administration of trust funds established within the Social Security Act. The Department is directed
by statute to execute these administrative services. Seigniorage and numismatic profits also are included in the “Other”
line. Seigniorage is the face value of newly minted circulating coins less the cost of production. Numismatic profit is any
119
U.S. Department of the Treasury | Fiscal Year 2012
profit on the sale of proof coins, uncirculated coins, commemorative coins, and related products and accessories. The
United States Mint is required to distribute seigniorage and numismatic profits in excess of operating expenses to the
General Fund. In any given year, the amount recognized as seigniorage may differ from the amount distributed to the
General Fund by an insignificant amount due to timing differences.
21. CONSOLIDATED STATEMENTS OF NET COST AND NET COSTS
OF TREASURY SUB-ORGANIZATIONS
The Department’s Consolidated Statements of Net Cost display information on a consolidated basis. The complexity of
the Department’s organizational structure and operations requires that supporting schedules for Net Cost be included in
the notes to the financial statements. These supporting schedules provide consolidating information, which fully displays
the costs of each sub-organization (DO and each operating bureau).
REPORTING ENTITY
The classification of sub-organizations has been determined in accordance with SFFAS No. 4, Managerial Cost
Accounting Concepts and Standards for the Federal Government which states that the predominant factor is the
reporting entity’s organization structure and existing responsibility components, such as bureaus, administrations,
offices, and divisions within a department.
Each sub-organization is responsible for accumulating costs. The assignment of the costs to Department-wide programs
is the result of using the following cost assignment methods: (1) direct costs, (2) cause and effect, and (3) cost allocation.
INTRA-DEPARTMENTAL COSTS/REVENUES
Intra-departmental costs/revenues resulting from the provision of goods and/or services on a reimbursable basis among
Departmental sub-organizations are reported as costs by providing sub-organizations and as revenues by receiving sub-
organizations. The Department recognized intra-departmental imputed costs on the Consolidated Statements of Net
Cost of $518 million and $415 million during fiscal years 2012 and 2011, respectively. Accordingly, such costs or
revenues are eliminated in the consolidation process.
INTRA-GOVERNMENTAL COSTS
Intra-governmental costs relate to the source of goods and services purchased by the Department and not to the
classification of the related intra-governmental revenue.
In certain cases, other federal agencies incur costs that are directly identifiable to the Department’s operations. In
accordance with SFFAS No. 30, Inter-Entity Cost Implementation Amending SFFAS No. 4, Managerial Cost Accounting
Standards and Concepts, the Department recognizes identified costs paid on behalf of the Department by other agencies
as an expense of the Department. The material imputed inter-departmental financing sources currently recognized by
the Department include the actual cost of future benefits for the federal pension plans that are paid by other federal
entities, the Federal Employees Health Benefits Program (FEHB), and any un-reimbursed contract dispute payments
made from the Treasury Judgment Fund on behalf of the Department. The funding for these costs is reflected as costs on
the Consolidated Statements of Net Cost, and as imputed financing sources on the Statements of Changes in Net Position.
Costs paid by other agencies on behalf of the Department were $812 million and $925 million for the fiscal years ended
September 30, 2012 and 2011, respectively.
120
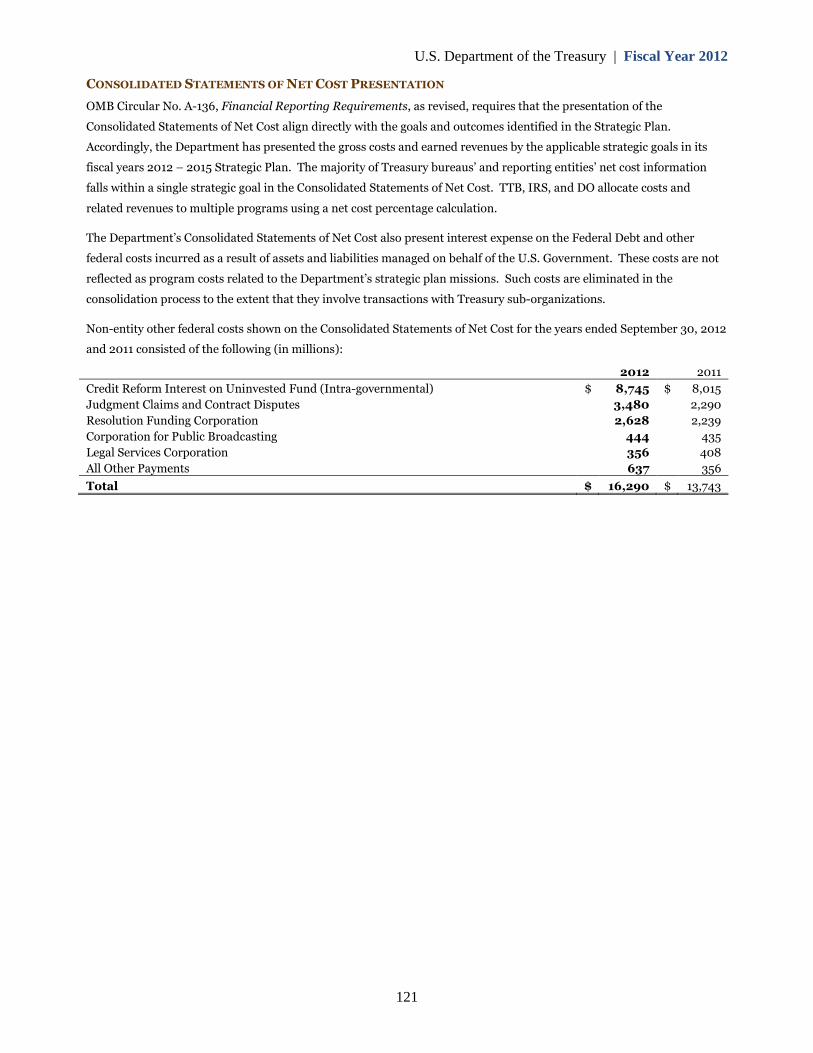
U.S. Department of the Treasury | Fiscal Year 2012
121
CONSOLIDATED STATEMENTS OF NET COST PRESENTATION
OMB Circular No. A-136, Financial Reporting Requirements, as revised, requires that the presentation of the
Consolidated Statements of Net Cost align directly with the goals and outcomes identified in the Strategic Plan.
Accordingly, the Department has presented the gross costs and earned revenues by the applicable strategic goals in its
fiscal years 2012 – 2015 Strategic Plan. The majority of Treasury bureaus’ and reporting entities’ net cost information
falls within a single strategic goal in the Consolidated Statements of Net Cost. TTB, IRS, and DO allocate costs and
related revenues to multiple programs using a net cost percentage calculation.
The Department’s Consolidated Statements of Net Cost also present interest expense on the Federal Debt and other
federal costs incurred as a result of assets and liabilities managed on behalf of the U.S. Government. These costs are not
reflected as program costs related to the Department’s strategic plan missions. Such costs are eliminated in the
consolidation process to the extent that they involve transactions with Treasury sub-organizations.
Non-entity other federal costs shown on the Consolidated Statements of Net Cost for the years ended September 30, 2012
and 2011 consisted of the following (in millions):
2012 2011
Credit Reform Interest on Uninvested Fund (Intra-governmental) $ 8,745 $ 8,015
Judgment Claims and Contract Disputes 3,480 2,290
Resolution Funding Corporation 2,628 2,239
Corporation for Public Broadcasting 444 435
Legal Services Corporation 356 408
All Other Payments 637 356
Total $ 16,290 $ 13,743
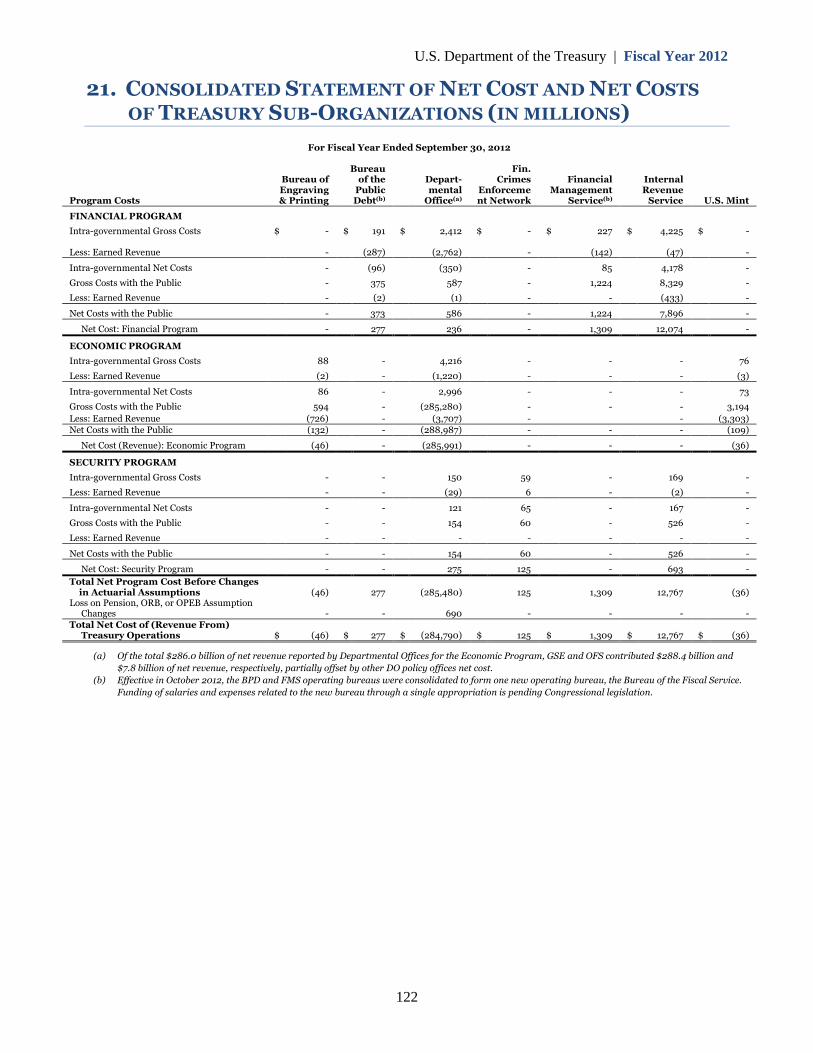
U.S. Department of the Treasury | Fiscal Year 2012
21. CONSOLIDATED STATEMENT OF NET COST AND NET COSTS
OF TREASURY SUB-ORGANIZATIONS (IN MILLIONS)
For Fiscal Year Ended September 30, 2012
Bureau Fin.
Program Costs
Bureau ofEngraving& Printing
of thePublicDebt(b)
Depart-mental
Office(a)
CrimesEnforcement Network
FinancialManagement
Service(b)
InternalRevenue
Service U.S. Mint
FINANCIAL PROGRAM
Intra-governmental Gross Costs $ - $ 191 $ 2,412 $ - $ 227 $ 4,225 $ -
Less: Earned Revenue - (287) (2,762) - (142) (47) -
Intra-governmental Net Costs - (96) (350) - 85 4,178 -
Gross Costs with the Public - 375 587 - 1,224 8,329 -
Less: Earned Revenue - (2) (1) - - (433) -
Net Costs with the Public - 373 586 - 1,224 7,896 -
Net Cost: Financial Program - 277 236 - 1,309 12,074 -
ECONOMIC PROGRAM
Intra-governmental Gross Costs 88 - 4,216 - - - 76
Less: Earned Revenue (2) - (1,220) - - - (3)
Intra-governmental Net Costs 86 - 2,996 - - - 73
Gross Costs with the Public 594 - (285,280) - - - 3,194
Less: Earned Revenue (726) - (3,707) - - (3,303)Net Costs with the Public (132) - (288,987) - - - (109)
Net Cost (Revenue): Economic Program (46) - (285,991) - - - (36)
SECURITY PROGRAM
Intra-governmental Gross Costs - - 150 59 - 169 -
Less: Earned Revenue - - (29) 6 - (2) -
Intra-governmental Net Costs - - 121 65 - 167 -
Gross Costs with the Public - - 154 60 - 526 -
Less: Earned Revenue - - - - - - -
Net Costs with the Public - - 154 60 - 526 -
Net Cost: Security Program - - 275 125 - 693 -
Total Net Program Cost Before Changesin Actuarial Assumptions
Loss on Pension, ORB, or OPEB AssumptionChanges
(46)
-
277
-
(285,480)
690
125
-
1,309
-
12,767
-
(36)
-Total Net Cost of (Revenue From)
Treasury Operations $ (46) $ 277 $ (284,790) $ 125 $ 1,309 $ 12,767 $ (36)
(a) Of the total $286.0 billion of net revenue reported by Departmental Offices for the Economic Program, GSE and OFS contributed $288.4 billion and
$7.8 billion of net revenue, respectively, partially offset by other DO policy offices net cost.
(b) Effective in October 2012, the BPD and FMS operating bureaus were consolidated to form one new operating bureau, the Bureau of the Fiscal Service.
Funding of salaries and expenses related to the new bureau through a single appropriation is pending Congressional legislation.
122
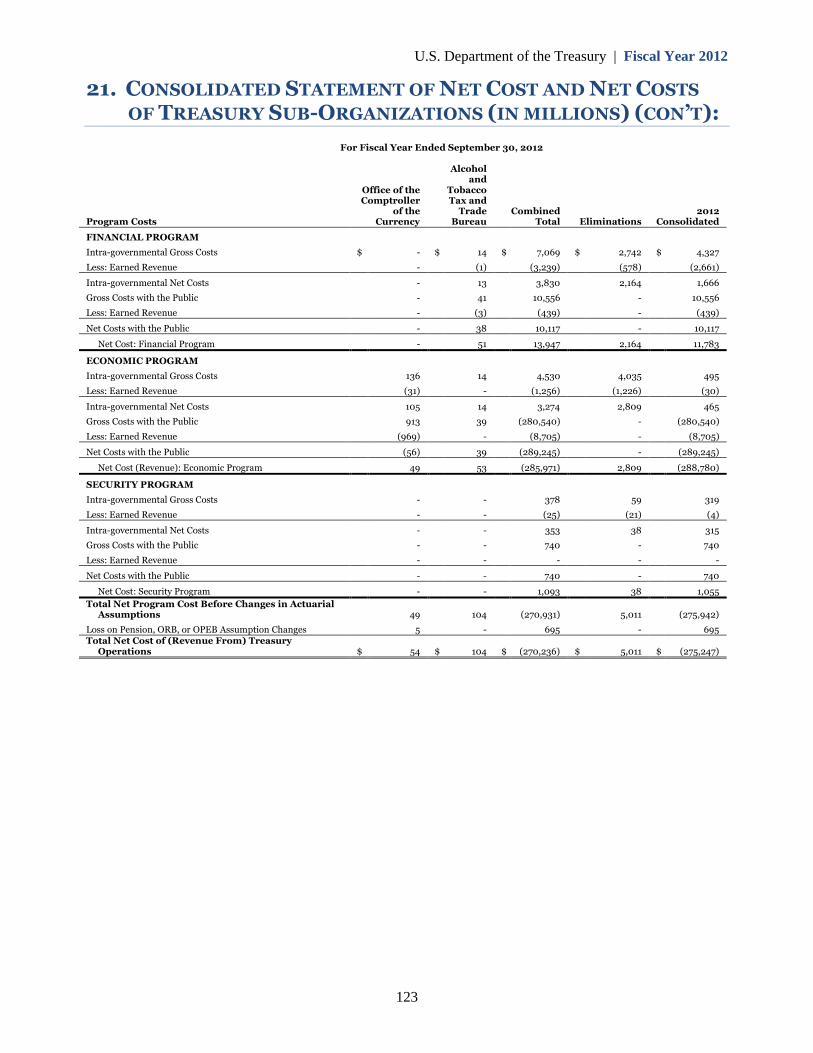
U.S. Department of the Treasury | Fiscal Year 2012
21. CONSOLIDATED STATEMENT OF NET COST AND NET COSTS
OF TREASURY SUB-ORGANIZATIONS (IN MILLIONS) (CON’T):
For Fiscal Year Ended September 30, 2012
Alcoholand
Office of the TobaccoComptroller
of theTax and
Trade Combined 2012Program Costs Currency Bureau Total Eliminations Consolidated
FINANCIAL PROGRAM
Intra-governmental Gross Costs $ - $ 14 $ 7,069 $ 2,742 $ 4,327
Less: Earned Revenue - (1) (3,239) (578) (2,661)
Intra-governmental Net Costs - 13 3,830 2,164 1,666
Gross Costs with the Public - 41 10,556 - 10,556
Less: Earned Revenue - (3) (439) - (439)
Net Costs with the Public - 38 10,117 - 10,117
Net Cost: Financial Program - 51 13,947 2,164 11,783
ECONOMIC PROGRAM
Intra-governmental Gross Costs 136 14 4,530 4,035 495
Less: Earned Revenue (31) - (1,256) (1,226) (30)
Intra-governmental Net Costs 105 14 3,274 2,809 465
Gross Costs with the Public 913 39 (280,540) - (280,540)
Less: Earned Revenue (969) - (8,705) - (8,705)
Net Costs with the Public (56) 39 (289,245) - (289,245)
Net Cost (Revenue): Economic Program 49 53 (285,971) 2,809 (288,780)
SECURITY PROGRAM
Intra-governmental Gross Costs - - 378 59 319
Less: Earned Revenue - - (25) (21) (4)
Intra-governmental Net Costs - - 353 38 315
Gross Costs with the Public - - 740 - 740
Less: Earned Revenue - - - - -
Net Costs with the Public - - 740 - 740
Net Cost: Security Program - - 1,093 38 1,055
Total Net Program Cost Before Changes in ActuarialAssumptions 49 104 (270,931) 5,011 (275,942)
Loss on Pension, ORB, or OPEB Assumption Changes 5 - 695 - 695Total Net Cost of (Revenue From) Treasury
Operations $ 54 $ 104 $ (270,236) $ 5,011 $ (275,247)
123
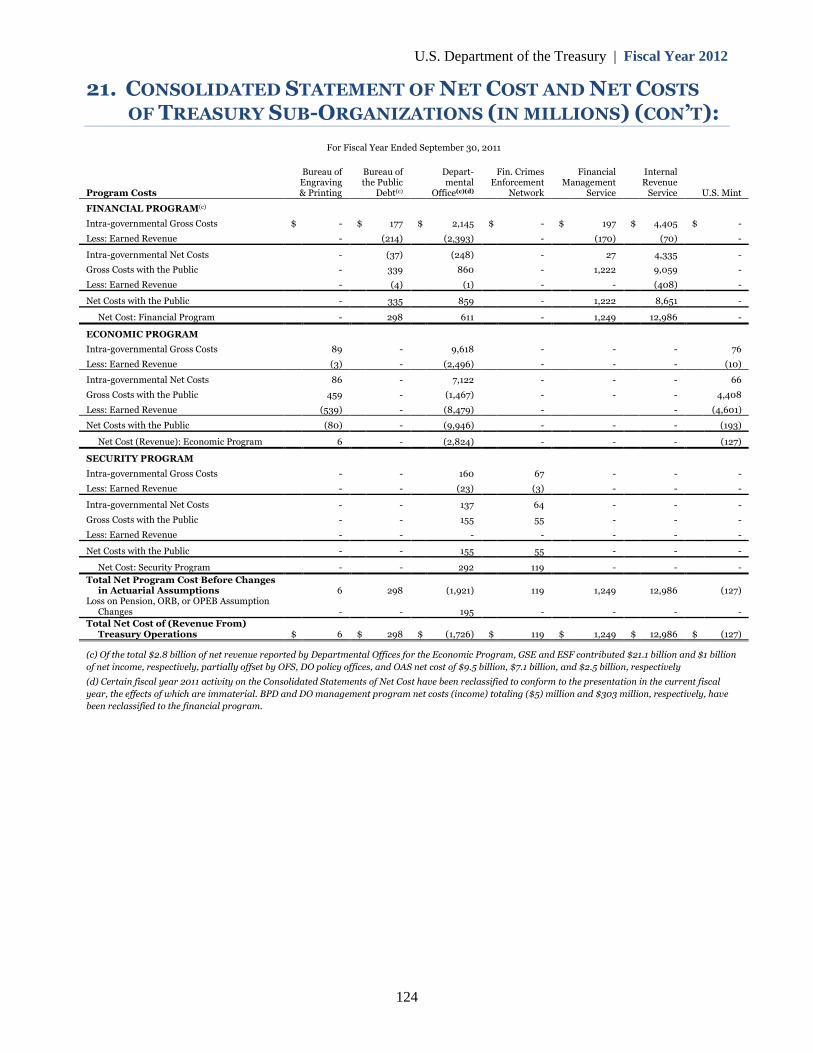
U.S. Department of the Treasury | Fiscal Year 2012
21. CONSOLIDATED STATEMENT OF NET COST AND NET COSTS
OF TREASURY SUB-ORGANIZATIONS (IN MILLIONS) (CON’T):
For Fiscal Year Ended September 30, 2011
Bureau of Bureau of Depart- Fin. Crimes Financial InternalEngraving the Public mental Enforcement Management Revenue
Program Costs & Printing Debt(c) Office(c)(d) Network Service Service U.S. Mint
FINANCIAL PROGRAM(c)
Intra-governmental Gross Costs $ - $ 177 $ 2,145 $ - $ 197 $ 4,405 $ -
Less: Earned Revenue - (214) (2,393) - (170) (70) -
Intra-governmental Net Costs - (37) (248) - 27 4,335 -
Gross Costs with the Public - 339 860 - 1,222 9,059 -
Less: Earned Revenue - (4) (1) - - (408) -
Net Costs with the Public - 335 859 - 1,222 8,651 -
Net Cost: Financial Program - 298 611 - 1,249 12,986 -
ECONOMIC PROGRAM
Intra-governmental Gross Costs 89 - 9,618 - - - 76
Less: Earned Revenue (3) - (2,496) - - - (10)
Intra-governmental Net Costs 86 - 7,122 - - - 66
Gross Costs with the Public 459 - (1,467) - - - 4,408
Less: Earned Revenue (539) - (8,479) - - (4,601)
Net Costs with the Public (80) - (9,946) - - - (193)
Net Cost (Revenue): Economic Program 6 - (2,824) - - - (127)
SECURITY PROGRAM
Intra-governmental Gross Costs - - 160 67 - - -
Less: Earned Revenue - - (23) (3) - - -
Intra-governmental Net Costs - - 137 64 - - -
Gross Costs with the Public - - 155 55 - - -
Less: Earned Revenue - - - - - - -
Net Costs with the Public - - 155 55 - - -
Net Cost: Security Program - - 292 119 - - -
Total Net Program Cost Before Changesin Actuarial Assumptions 6 298 (1,921) 119 1,249 12,986 (127)
Loss on Pension, ORB, or OPEB AssumptionChanges - - 195 - - - -
Total Net Cost of (Revenue From)Treasury Operations $ 6 $ 298 $ (1,726) $ 119 $ 1,249 $ 12,986 $ (127)
(c) Of the total $2.8 billion of net revenue reported by Departmental Offices for the Economic Program, GSE and ESF contributed $21.1 billion and $1 billion
of net income, respectively, partially offset by OFS, DO policy offices, and OAS net cost of $9.5 billion, $7.1 billion, and $2.5 billion, respectively
(d) Certain fiscal year 2011 activity on the Consolidated Statements of Net Cost have been reclassified to conform to the presentation in the current fiscal
year, the effects of which are immaterial. BPD and DO management program net costs (income) totaling ($5) million and $303 million, respectively, have
been reclassified to the financial program.
124
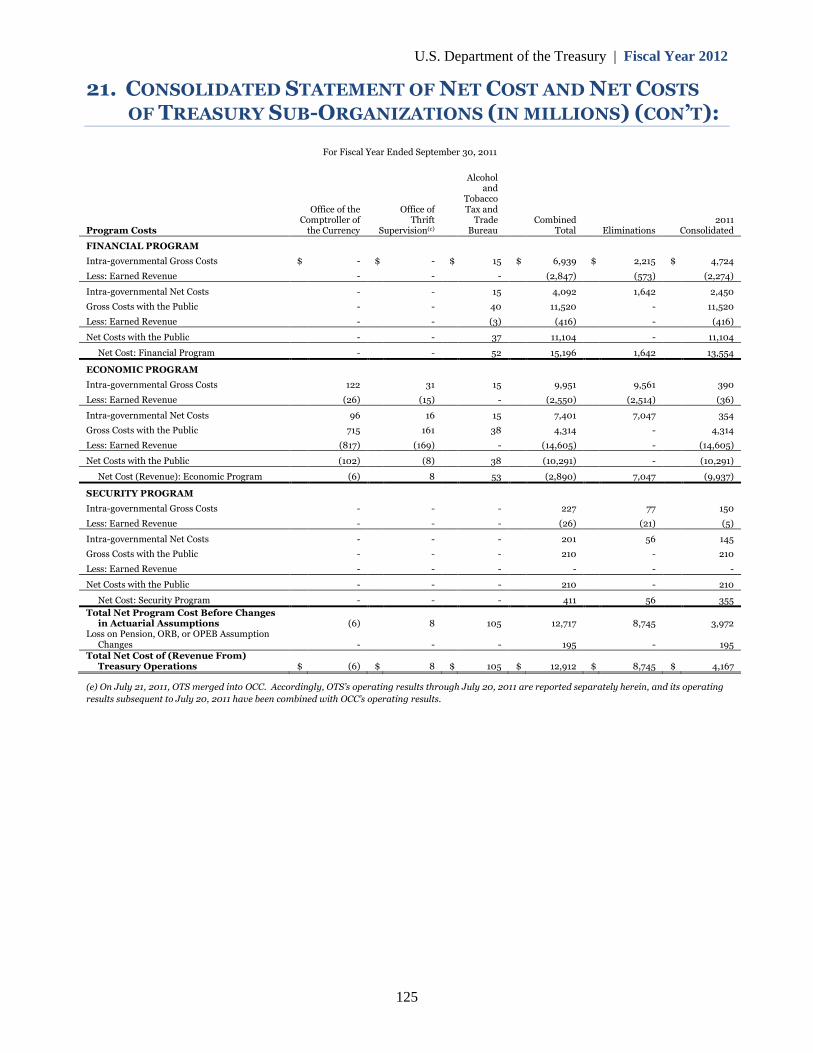
U.S. Department of the Treasury | Fiscal Year 2012
21. CONSOLIDATED STATEMENT OF NET COST AND NET COSTS
OF TREASURY SUB-ORGANIZATIONS (IN MILLIONS) (CON’T):
For Fiscal Year Ended September 30, 2011
Alcoholand
TobaccoOffice of the Office of Tax and
Program CostsComptroller of
the CurrencyThrift
Supervision(c)
TradeBureau
CombinedTotal Eliminations
2011Consolidated
FINANCIAL PROGRAM
Intra-governmental Gross Costs $ - $ - $ 15 $ 6,939 $ 2,215 $ 4,724
Less: Earned Revenue - - - (2,847) (573) (2,274)
Intra-governmental Net Costs - - 15 4,092 1,642 2,450
Gross Costs with the Public - - 40 11,520 - 11,520
Less: Earned Revenue - - (3) (416) - (416)
Net Costs with the Public - - 37 11,104 - 11,104
Net Cost: Financial Program - - 52 15,196 1,642 13,554
ECONOMIC PROGRAM
Intra-governmental Gross Costs 122 31 15 9,951 9,561 390
Less: Earned Revenue (26) (15) - (2,550) (2,514) (36)
Intra-governmental Net Costs 96 16 15 7,401 7,047 354
Gross Costs with the Public 715 161 38 4,314 - 4,314
Less: Earned Revenue (817) (169) - (14,605) - (14,605)
Net Costs with the Public (102) (8) 38 (10,291) - (10,291)
Net Cost (Revenue): Economic Program (6) 8 53 (2,890) 7,047 (9,937)
SECURITY PROGRAM
Intra-governmental Gross Costs - - - 227 77 150
Less: Earned Revenue - - - (26) (21) (5)
Intra-governmental Net Costs - - - 201 56 145
Gross Costs with the Public - - - 210 - 210
Less: Earned Revenue - - - - - -
Net Costs with the Public - - - 210 - 210
Net Cost: Security Program - - - 411 56 355
Total Net Program Cost Before Changesin Actuarial Assumptions
Loss on Pension, ORB, or OPEB AssumptionChanges
(6)
-
8
-
105
-
12,717
195
8,745
-
3,972
195Total Net Cost of (Revenue From)
Treasury Operations $ (6) $ 8 $ 105 $ 12,912 $ 8,745 $ 4,167
(e) On July 21, 2011, OTS merged into OCC. Accordingly, OTS’s operating results through July 20, 2011 are reported separately herein, and its operating
results subsequent to July 20, 2011 have been combined with OCC’s operating results.
125
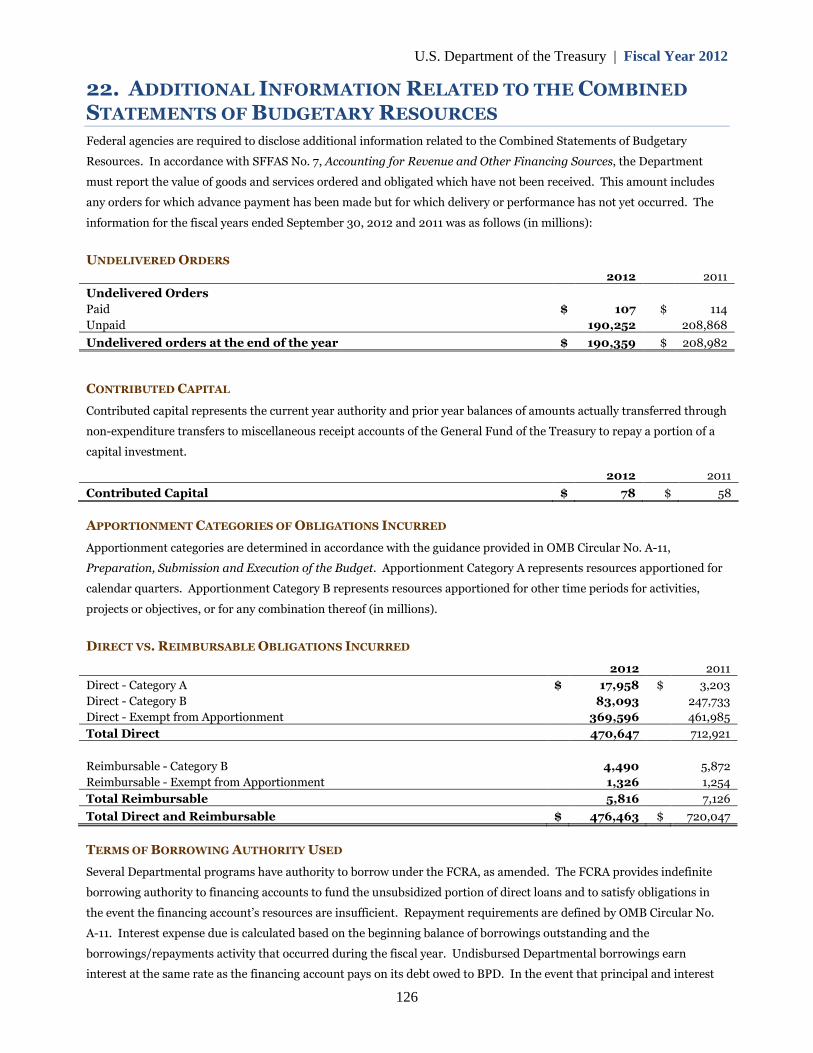
U.S. Department of the Treasury | Fiscal Year 2012
22. ADDITIONAL INFORMATION RELATED TO THE COMBINED
STATEMENTS OF BUDGETARY RESOURCES
Federal agencies are required to disclose additional information related to the Combined Statements of Budgetary
Resources. In accordance with SFFAS No. 7, Accounting for Revenue and Other Financing Sources, the Department
must report the value of goods and services ordered and obligated which have not been received. This amount includes
any orders for which advance payment has been made but for which delivery or performance has not yet occurred. The
information for the fiscal years ended September 30, 2012 and 2011 was as follows (in millions):
UNDELIVERED ORDERS
2012 2011
Undelivered Orders
Paid $ 107 $ 114
Unpaid 190,252 208,868
Undelivered orders at the end of the year $ 190,359 $ 208,982
CONTRIBUTED CAPITAL
Contributed capital represents the current year authority and prior year balances of amounts actually transferred through
non-expenditure transfers to miscellaneous receipt accounts of the General Fund of the Treasury to repay a portion of a
capital investment.
2012 2011
Contributed Capital $ 78 $ 58
APPORTIONMENT CATEGORIES OF OBLIGATIONS INCURRED
Apportionment categories are determined in accordance with the guidance provided in OMB Circular No. A-11,
Preparation, Submission and Execution of the Budget. Apportionment Category A represents resources apportioned for
calendar quarters. Apportionment Category B represents resources apportioned for other time periods for activities,
projects or objectives, or for any combination thereof (in millions).
DIRECT VS. REIMBURSABLE OBLIGATIONS INCURRED
2012 2011
Direct - Category A $ 17,958 $ 3,203
Direct - Category B 83,093 247,733
Direct - Exempt from Apportionment 369,596 461,985
Total Direct 470,647 712,921
Reimbursable - Category B 4,490 5,872
Reimbursable - Exempt from Apportionment 1,326 1,254
Total Reimbursable 5,816 7,126
Total Direct and Reimbursable $ 476,463 $ 720,047
TERMS OF BORROWING AUTHORITY USED
Several Departmental programs have authority to borrow under the FCRA, as amended. The FCRA provides indefinite
borrowing authority to financing accounts to fund the unsubsidized portion of direct loans and to satisfy obligations in
the event the financing account’s resources are insufficient. Repayment requirements are defined by OMB Circular No.
A-11. Interest expense due is calculated based on the beginning balance of borrowings outstanding and the
borrowings/repayments activity that occurred during the fiscal year. Undisbursed Departmental borrowings earn
interest at the same rate as the financing account pays on its debt owed to BPD. In the event that principal and interest
126
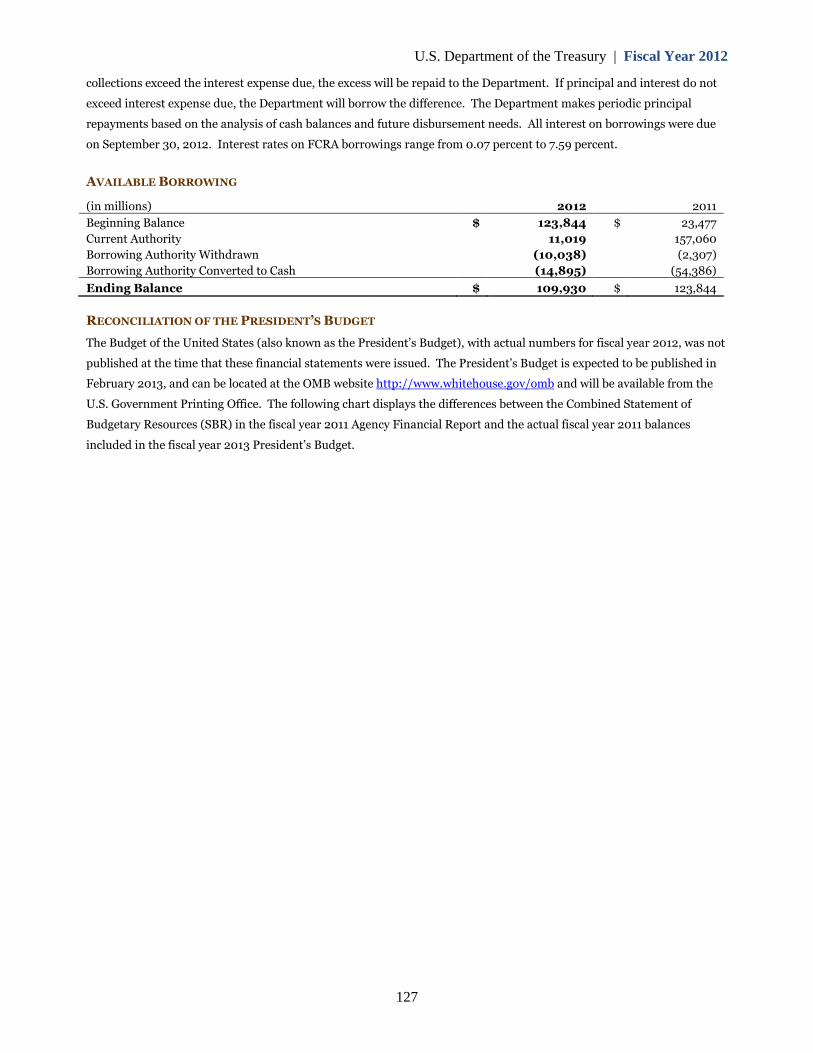
U.S. Department of the Treasury | Fiscal Year 2012
collections exceed the interest expense due, the excess will be repaid to the Department. If principal and interest do not
exceed interest expense due, the Department will borrow the difference. The Department makes periodic principal
repayments based on the analysis of cash balances and future disbursement needs. All interest on borrowings were due
on September 30, 2012. Interest rates on FCRA borrowings range from 0.07 percent to 7.59 percent.
AVAILABLE BORROWING
(in millions) 2012 2011
Beginning Balance $ 123,844 $ 23,477
Current Authority 11,019 157,060
Borrowing Authority Withdrawn (10,038) (2,307)
Borrowing Authority Converted to Cash (14,895) (54,386)
Ending Balance $ 109,930 $ 123,844
RECONCILIATION OF THE PRESIDENT’S BUDGET
The Budget of the United States (also known as the President’s Budget), with actual numbers for fiscal year 2012, was not
published at the time that these financial statements were issued. The President’s Budget is expected to be published in
February 2013, and can be located at the OMB website http://www.whitehouse.gov/omb and will be available from the
U.S. Government Printing Office. The following chart displays the differences between the Combined Statement of
Budgetary Resources (SBR) in the fiscal year 2011 Agency Financial Report and the actual fiscal year 2011 balances
included in the fiscal year 2013 President’s Budget.
127
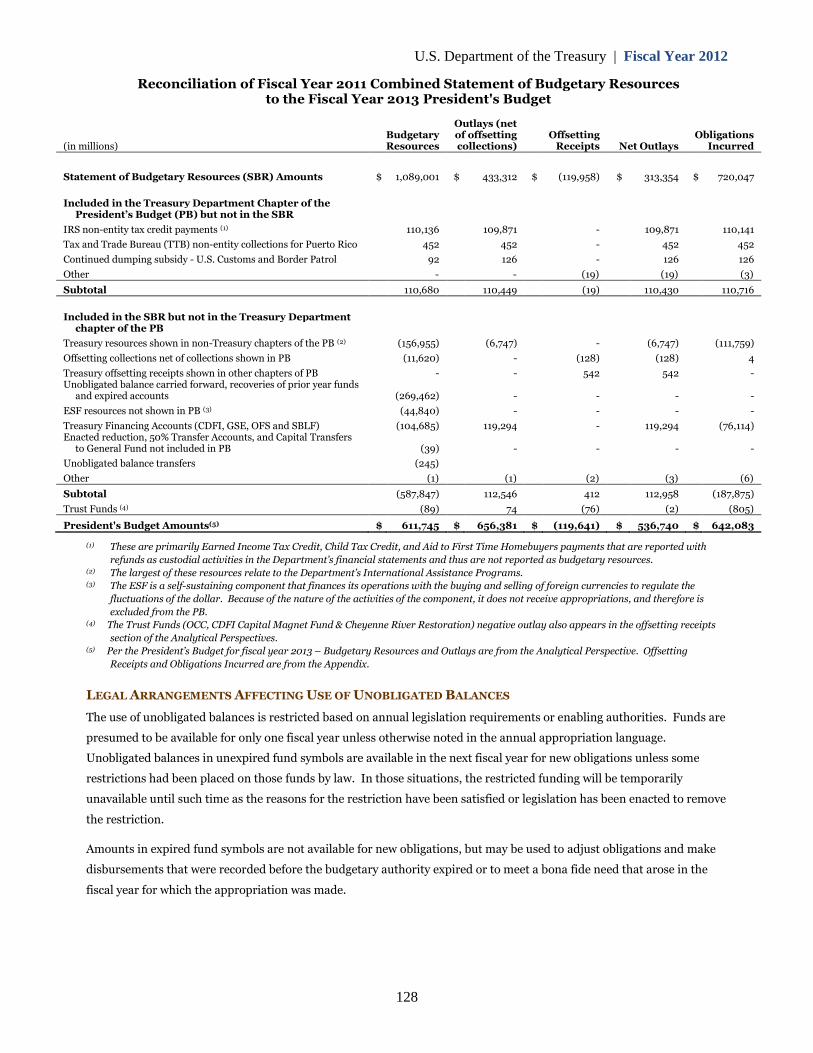
U.S. Department of the Treasury | Fiscal Year 2012
(in millions)
Reconciliation of Fiscal Year 2011 Combined Statement of Budgetary Resourcesto the Fiscal Year 2013 President's Budget
Outlays (netBudgetary of offsetting OffsettingResources collections) Receipts Net Outlays
ObligationsIncurred
Statement of Budgetary Resources (SBR) Amounts
Included in the Treasury Department Chapter of thePresident’s Budget (PB) but not in the SBR
IRS non-entity tax credit payments (1)
Tax and Trade Bureau (TTB) non-entity collections for Puerto Rico
Continued dumping subsidy - U.S. Customs and Border Patrol
Other
$ 1,089,001
110,136
452
92
-
$ 433,312
109,871
452
126
-
$ (119,958)
-
-
-
(19)
$ 313,354
109,871
452
126
(19)
$ 720,047
110,141
452
126
(3)
Subtotal 110,680 110,449 (19) 110,430 110,716
Included in the SBR but not in the Treasury Departmentchapter of the PB
Treasury resources shown in non-Treasury chapters of the PB (2)
Offsetting collections net of collections shown in PB
Treasury offsetting receipts shown in other chapters of PBUnobligated balance carried forward, recoveries of prior year funds
and expired accounts
ESF resources not shown in PB (3)
Treasury Financing Accounts (CDFI, GSE, OFS and SBLF)Enacted reduction, 50% Transfer Accounts, and Capital Transfers
to General Fund not included in PB
Unobligated balance transfers
Other
(156,955)
(11,620)
-
(269,462)
(44,840)
(104,685)
(39)
(245)
(1)
(6,747)
-
-
-
-
119,294
-
(1)
-
(128)
542
-
-
-
-
(2)
(6,747)
(128)
542
-
-
119,294
-
(3)
(111,759)
4
-
-
-
(76,114)
-
(6)
Subtotal
Trust Funds (4)
(587,847)
(89)
112,546
74
412
(76)
112,958
(2)
(187,875)
(805)
President's Budget Amounts(5) $ 611,745 $ 656,381 $ (119,641) $ 536,740 $ 642,083
(1) These are primarily Earned Income Tax Credit, Child Tax Credit, and Aid to First Time Homebuyers payments that are reported with
refunds as custodial activities in the Department’s financial statements and thus are not reported as budgetary resources.(2) The largest of these resources relate to the Department’s International Assistance Programs.(3) The ESF is a self-sustaining component that finances its operations with the buying and selling of foreign currencies to regulate the
fluctuations of the dollar. Because of the nature of the activities of the component, it does not receive appropriations, and therefore is
excluded from the PB.(4) The Trust Funds (OCC, CDFI Capital Magnet Fund & Cheyenne River Restoration) negative outlay also appears in the offsetting receipts
section of the Analytical Perspectives.(5) Per the President’s Budget for fiscal year 2013 – Budgetary Resources and Outlays are from the Analytical Perspective. Offsetting
Receipts and Obligations Incurred are from the Appendix.
LEGAL ARRANGEMENTS AFFECTING USE OF UNOBLIGATED BALANCES
The use of unobligated balances is restricted based on annual legislation requirements or enabling authorities. Funds are
presumed to be available for only one fiscal year unless otherwise noted in the annual appropriation language.
Unobligated balances in unexpired fund symbols are available in the next fiscal year for new obligations unless some
restrictions had been placed on those funds by law. In those situations, the restricted funding will be temporarily
unavailable until such time as the reasons for the restriction have been satisfied or legislation has been enacted to remove
the restriction.
Amounts in expired fund symbols are not available for new obligations, but may be used to adjust obligations and make
disbursements that were recorded before the budgetary authority expired or to meet a bona fide need that arose in the
fiscal year for which the appropriation was made.
128
U.S. Department of the Treasury | Fiscal Year 2012
CHANGE IN BUDGETARY ACCOUNTING
Effective July 31, 2012, the Department changed the budgetary accounting for certain market-based Treasury debt
securities purchased by the Department of Defense (DoD) Military Funds to recognize the budget activity for premiums
and discounts at the time of purchase rather than when the premium/discount is amortized over the term of the security
in accordance with guidance provided by the OMB. For those previously issued securities held by the DoD on July 31,
2012, the Department recorded the net unamortized premium totaling $75.1 billion as budget activity in the current fiscal
year presented in accordance with guidance provided by the OMB. This change in accounting is reported as a decrease in
both Obligations Incurred and Appropriations (discretionary and mandatory) on the Combined Statement of Budgetary
Resources for the fiscal year ended September 30, 2012. On the Consolidated Statement of Changes in Net Position for
the fiscal year ended September 30, 2012, this change in accounting is reported within the Cumulative Results of
Operations section as a decrease in Appropriations Used and a corresponding increase in Accrued Interest and Discount
on Debt, and within the Unexpended Appropriations section as a decrease in Appropriations Received and a
corresponding decrease in Appropriations Used.
129
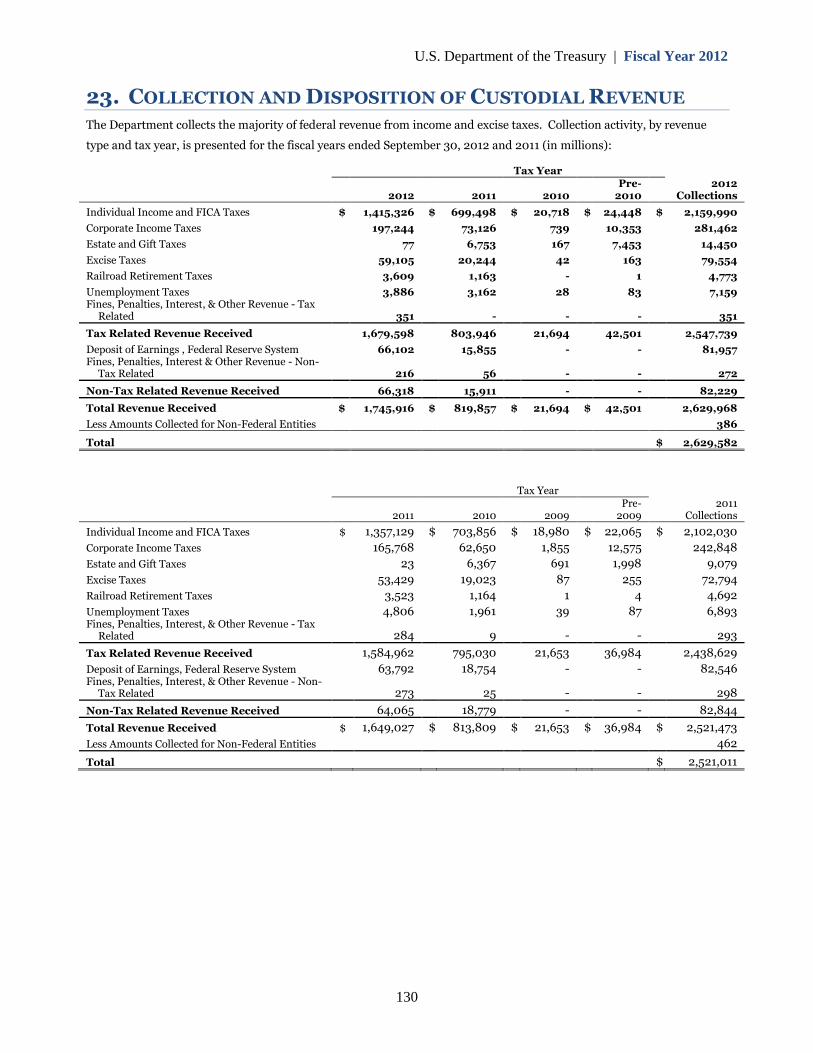
U.S. Department of the Treasury | Fiscal Year 2012
23. COLLECTION AND DISPOSITION OF CUSTODIAL REVENUE
The Department collects the majority of federal revenue from income and excise taxes. Collection activity, by revenue
type and tax year, is presented for the fiscal years ended September 30, 2012 and 2011 (in millions):
2012
Tax Year2012
Collections2011 2010Pre-
2010
Individual Income and FICA Taxes $ 1,415,326 $ 699,498 $ 20,718 $ 24,448 $ 2,159,990
Corporate Income Taxes 197,244 73,126 739 10,353 281,462
Estate and Gift Taxes 77 6,753 167 7,453 14,450
Excise Taxes 59,105 20,244 42 163 79,554
Railroad Retirement Taxes 3,609 1,163 - 1 4,773
Unemployment TaxesFines, Penalties, Interest, & Other Revenue - Tax
Related
3,886
351
3,162
-
28
-
83
-
7,159
351
Tax Related Revenue Received 1,679,598 803,946 21,694 42,501 2,547,739
Deposit of Earnings , Federal Reserve SystemFines, Penalties, Interest & Other Revenue - Non-
Tax Related
66,102
216
15,855
56
-
-
-
-
81,957
272
Non-Tax Related Revenue Received 66,318 15,911 - - 82,229
Total Revenue Received $ 1,745,916 $ 819,857 $ 21,694 $ 42,501 2,629,968
Less Amounts Collected for Non-Federal Entities 386
Total $ 2,629,582
2011
Tax Year2011
Collections2010 2009Pre-
2009
Individual Income and FICA Taxes
Corporate Income Taxes
Estate and Gift Taxes
Excise Taxes
Railroad Retirement Taxes
Unemployment TaxesFines, Penalties, Interest, & Other Revenue - Tax
Related
$ 1,357,129
165,768
23
53,429
3,523
4,806
284
$ 703,856
62,650
6,367
19,023
1,164
1,961
9
$ 18,980
1,855
691
87
1
39
-
$ 22,065
12,575
1,998
255
4
87
-
$ 2,102,030
242,848
9,079
72,794
4,692
6,893
293
Tax Related Revenue Received
Deposit of Earnings, Federal Reserve SystemFines, Penalties, Interest, & Other Revenue - Non-
Tax Related
1,584,962
63,792
273
795,030
18,754
25
21,653
-
-
36,984
-
-
2,438,629
82,546
298
Non-Tax Related Revenue Received 64,065 18,779 - - 82,844
Total Revenue Received
Less Amounts Collected for Non-Federal Entities
$ 1,649,027 $ 813,809 $ 21,653 $ 36,984 $ 2,521,473
462
Total $ 2,521,011
130
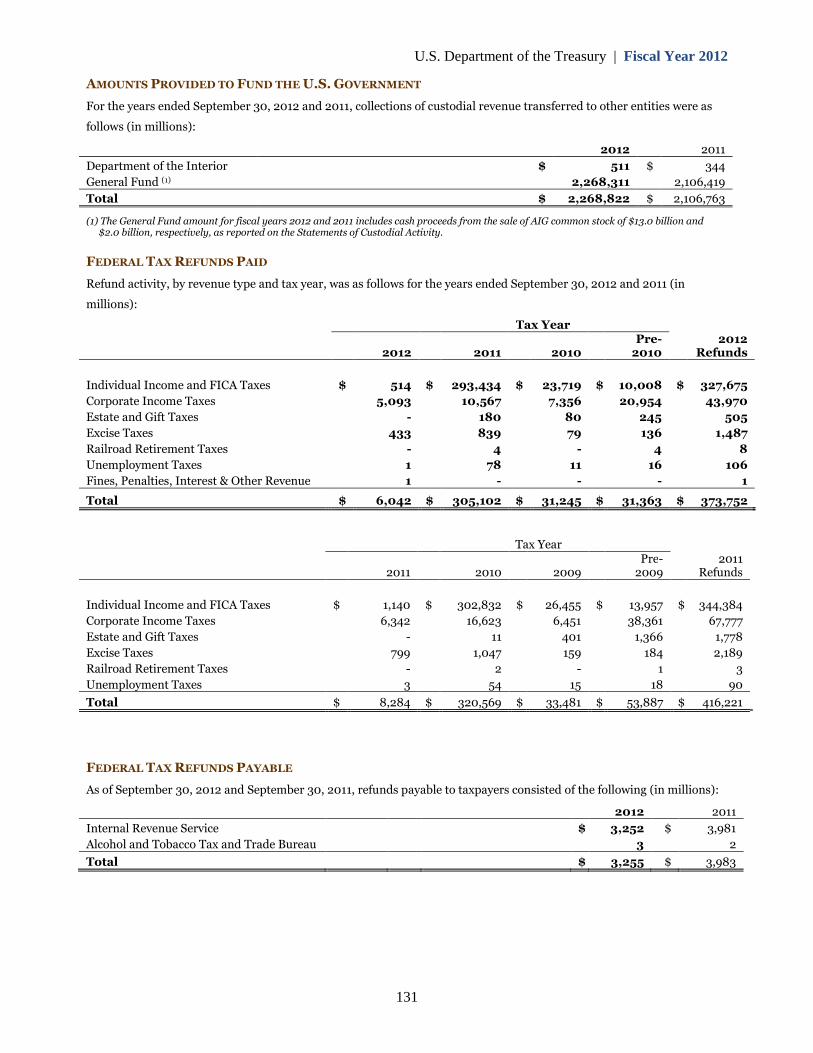
U.S. Department of the Treasury | Fiscal Year 2012
AMOUNTS PROVIDED TO FUND THE U.S. GOVERNMENT
For the years ended September 30, 2012 and 2011, collections of custodial revenue transferred to other entities were as
follows (in millions):
2012 2011
Department of the Interior $ 511 $ 344
General Fund (1) 2,268,311 2,106,419
Total $ 2,268,822 $ 2,106,763
(1) The General Fund amount for fiscal years 2012 and 2011 includes cash proceeds from the sale of AIG common stock of $13.0 billion and$2.0 billion, respectively, as reported on the Statements of Custodial Activity.
FEDERAL TAX REFUNDS PAID
Refund activity, by revenue type and tax year, was as follows for the years ended September 30, 2012 and 2011 (in
millions):
Tax Year2012Pre-
2012 2011 2010 2010 Refunds
Individual Income and FICA Taxes $ 514 $ 293,434 $ 23,719 $ 10,008 $ 327,675
Corporate Income Taxes 5,093 10,567 7,356 20,954 43,970
Estate and Gift Taxes - 180 80 245 505
Excise Taxes 433 839 79 136 1,487
Railroad Retirement Taxes - 4 - 4 8
Unemployment Taxes 1 78 11 16 106
Fines, Penalties, Interest & Other Revenue 1 - - - 1
Total $ 6,042 $ 305,102 $ 31,245 $ 31,363 $ 373,752
Tax Year2011Pre-
2011 2010 2009 2009 Refunds
Individual Income and FICA Taxes $ 1,140 $ 302,832 $ 26,455 $ 13,957 $ 344,384
Corporate Income Taxes 6,342 16,623 6,451 38,361 67,777
Estate and Gift Taxes - 11 401 1,366 1,778
Excise Taxes 799 1,047 159 184 2,189
Railroad Retirement Taxes - 2 - 1 3
Unemployment Taxes 3 54 15 18 90
Total $ 8,284 $ 320,569 $ 33,481 $ 53,887 $ 416,221
FEDERAL TAX REFUNDS PAYABLE
As of September 30, 2012 and September 30, 2011, refunds payable to taxpayers consisted of the following (in millions):
2012 2011
Internal Revenue Service $ 3,252 $ 3,981
Alcohol and Tobacco Tax and Trade Bureau 3 2
Total $ 3,255 $ 3,983
131
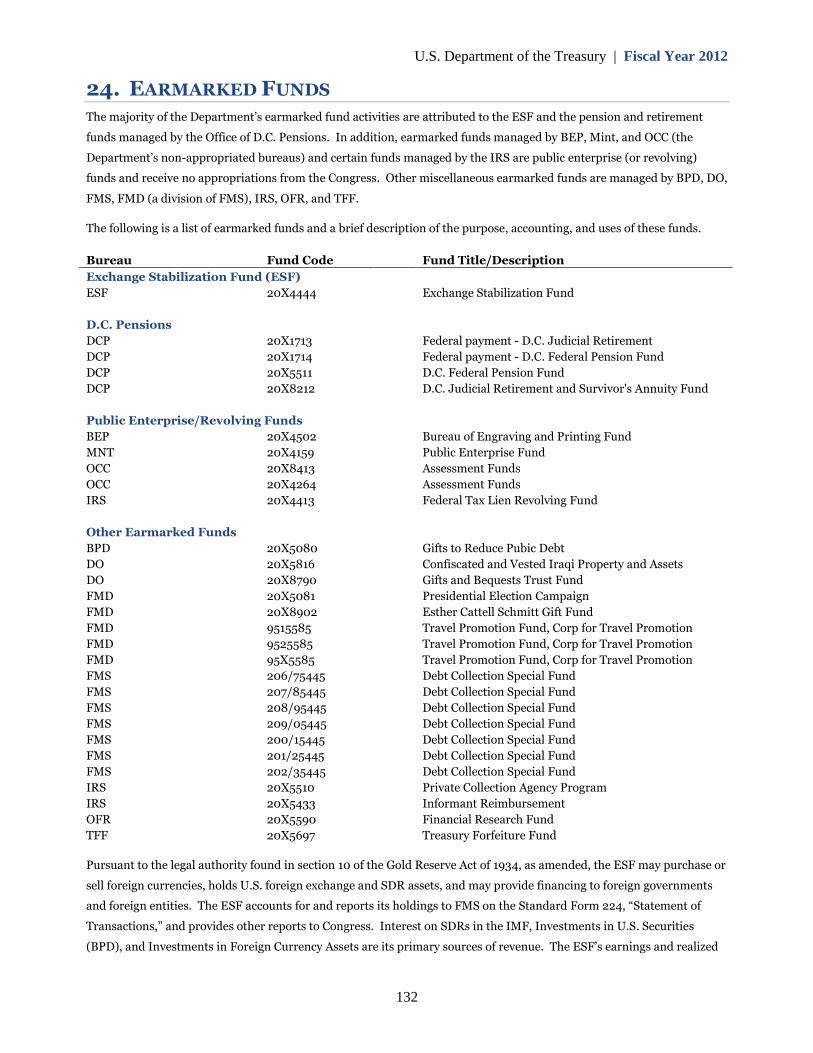
U.S. Department of the Treasury | Fiscal Year 2012
24. EARMARKED FUNDS
The majority of the Department’s earmarked fund activities are attributed to the ESF and the pension and retirement
funds managed by the Office of D.C. Pensions. In addition, earmarked funds managed by BEP, Mint, and OCC (the
Department’s non-appropriated bureaus) and certain funds managed by the IRS are public enterprise (or revolving)
funds and receive no appropriations from the Congress. Other miscellaneous earmarked funds are managed by BPD, DO,
FMS, FMD (a division of FMS), IRS, OFR, and TFF.
The following is a list of earmarked funds and a brief description of the purpose, accounting, and uses of these funds.
Bureau Fund Code Fund Title/Description
Exchange Stabilization Fund (ESF)
ESF 20X4444 Exchange Stabilization Fund
D.C. Pensions
DCP 20X1713 Federal payment - D.C. Judicial Retirement
DCP 20X1714 Federal payment - D.C. Federal Pension Fund
DCP 20X5511 D.C. Federal Pension Fund
DCP 20X8212 D.C. Judicial Retirement and Survivor's Annuity Fund
Public Enterprise/Revolving Funds
BEP 20X4502 Bureau of Engraving and Printing Fund
MNT 20X4159 Public Enterprise Fund
OCC 20X8413 Assessment Funds
OCC 20X4264 Assessment Funds
IRS 20X4413 Federal Tax Lien Revolving Fund
Other Earmarked Funds
BPD 20X5080 Gifts to Reduce Pubic Debt
DO 20X5816 Confiscated and Vested Iraqi Property and Assets
DO 20X8790 Gifts and Bequests Trust Fund
FMD 20X5081 Presidential Election Campaign
FMD 20X8902 Esther Cattell Schmitt Gift Fund
FMD 9515585 Travel Promotion Fund, Corp for Travel Promotion
FMD 9525585 Travel Promotion Fund, Corp for Travel Promotion
FMD 95X5585 Travel Promotion Fund, Corp for Travel Promotion
FMS 206/75445 Debt Collection Special Fund
FMS 207/85445 Debt Collection Special Fund
FMS 208/95445 Debt Collection Special Fund
FMS 209/05445 Debt Collection Special Fund
FMS 200/15445 Debt Collection Special Fund
FMS 201/25445 Debt Collection Special Fund
FMS 202/35445 Debt Collection Special Fund
IRS 20X5510 Private Collection Agency Program
IRS 20X5433 Informant Reimbursement
OFR 20X5590 Financial Research Fund
TFF 20X5697 Treasury Forfeiture Fund
Pursuant to the legal authority found in section 10 of the Gold Reserve Act of 1934, as amended, the ESF may purchase or
sell foreign currencies, holds U.S. foreign exchange and SDR assets, and may provide financing to foreign governments
and foreign entities. The ESF accounts for and reports its holdings to FMS on the Standard Form 224, “Statement of
Transactions,” and provides other reports to Congress. Interest on SDRs in the IMF, Investments in U.S. Securities
(BPD), and Investments in Foreign Currency Assets are its primary sources of revenue. The ESF’s earnings and realized
132
U.S. Department of the Treasury | Fiscal Year 2012
gains on foreign currency assets represent inflows of resources to the government, and the interest revenues earned from
U.S. Securities are the result of intra-Departmental flows.
D.C. Pension Funds provide annuity payments for retired D.C. teachers, police officers, judges, and firefighters. The
sources of revenues are through intra-governmental flows including annual appropriations and interest earnings from
investments, as well as inflows of resources to the government of employee contributions. All proceeds are earmarked.
Note 18 provides detailed information on various funds managed by DCP.
The BEP, Mint, OCC, and IRS operate “public enterprise/revolving funds” to account for their respective revenues and
expenses. 31 USC § 5142 established the revolving fund for BEP to account for revenue and expenses related to the
currency printing activities. P.L. 104-52 (31 USC § 5136) established the Public Enterprise Fund for the Mint to account
for all revenue and expenses related to the production and sale of numismatic products and circulating coinage.
Revenues and other financing sources at the Mint are mainly from the sale of numismatic and bullion products, and the
sale of circulating coins to the FRB system, and represent inflows of resources to the government. 12 USC § 481
established the Assessment Funds for OCC. Revenue and financing sources are from the bank examinations and
assessments for the oversight of the national banks, savings associations, and savings and loan holding companies. These
non-appropriated funds contribute to the inflows of resources to the government to specifically fund these entity’s
operations. 26 USC § 7810 established the Federal Tax Lien Revolving Fund to account for revenue and expenses from
the sale of property foreclosed upon by a holder of a lien. There are minimal transactions with other government
agencies.
There are other earmarked funds at several Treasury bureaus, such as donations to the Presidential Election Campaign
Fund, funds related to the debt collection program, gifts to reduce the public debt, and other enforcement related
activities. Public laws, the U.S. Code, and the Debt Collection Improvement Act established and authorized the use of
these funds. Sources of revenues and other financing sources include contributions, cash and property forfeited in
enforcement activities, public donations, and debt collection, representing inflows to the government.
INTRA-GOVERNMENTAL INVESTMENTS IN TREASURY SECURITIES
The U.S. Government does not set aside assets to pay future benefits or other expenditures associated with earmarked
funds. The Department’s bureaus and other federal agencies invest some of the earmarked funds that they collect from
the public, if they have the statutory authority to do so. The funds are invested in securities issued by BPD. The cash
collected by BPD is deposited in the General Fund, which uses the cash for general government purposes.
The investments provide Department bureaus and other federal agencies with authority to draw upon the General Fund
to make future benefit payments or other expenditures. When the Department bureaus or other federal agencies require
redemption of these securities to make expenditures, the government finances those redemptions out of accumulated
cash balances, by raising taxes or other receipts, by borrowing from the public or repaying less debt, or by curtailing other
expenditures. This is the same way that the government finances all other expenditures.
The securities are an asset to the Department bureaus and other federal agencies and a liability of the BPD. The General
Fund is liable to BPD. Because the Department bureaus and other federal agencies are parts of the U.S. Government,
these assets and liabilities offset each other from the standpoint of the government as a whole. For this reason, they do
not represent an asset or a liability in the U.S. Government-wide financial statements.
The balances related to the investments made by the Department bureaus are not displayed on the Department’s
financial statements because the bureaus are subcomponents of the Department. However, the General Fund remains
liable to BPD for the invested balances and BPD remains liable to the investing Department bureaus (See Note 4).
133
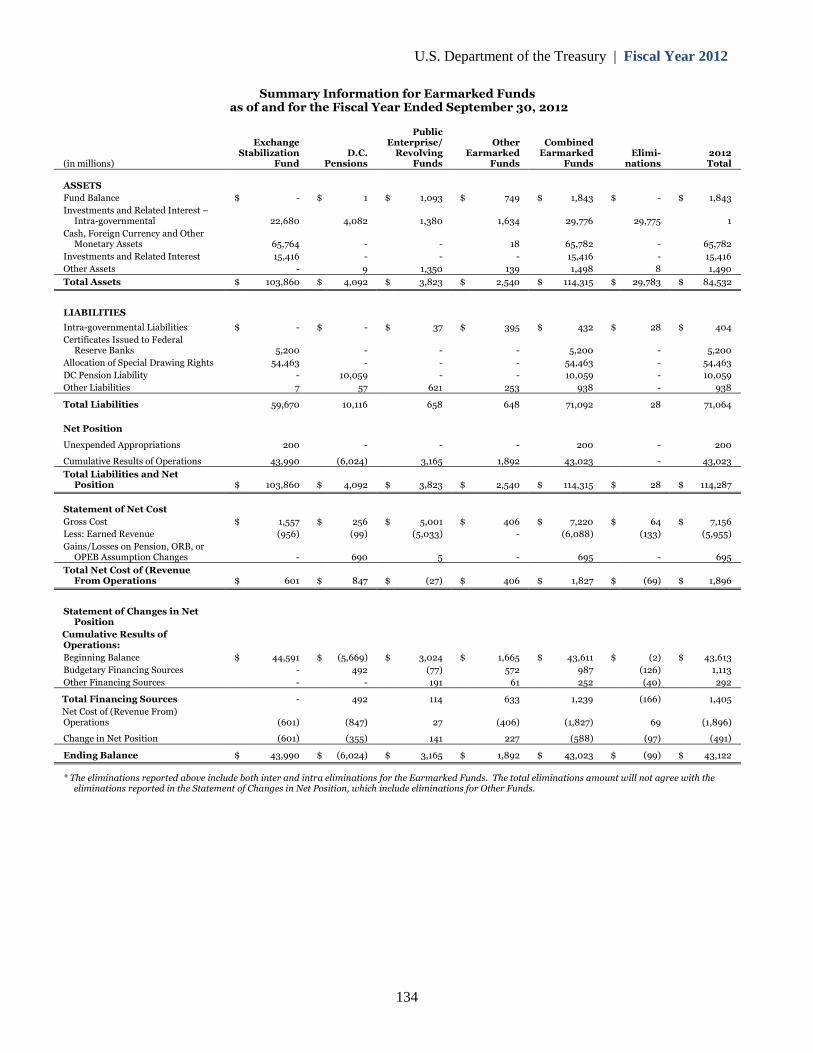
U.S. Department of the Treasury | Fiscal Year 2012
Summary Information for Earmarked Fundsas of and for the Fiscal Year Ended September 30, 2012
PublicExchange Enterprise/ Other Combined
Stabilization D.C. Revolving Earmarked Earmarked Elimi- 2012(in millions) Fund Pensions Funds Funds Funds nations Total
ASSETS
Fund Balance $ - $ 1 $ 1,093 $ 749 $ 1,843 $ - $ 1,843
Investments and Related Interest –Intra-governmental 22,680 4,082 1,380 1,634 29,776 29,775 1
Cash, Foreign Currency and OtherMonetary Assets 65,764 - - 18 65,782 - 65,782
Investments and Related Interest 15,416 - - - 15,416 - 15,416
Other Assets - 9 1,350 139 1,498 8 1,490
Total Assets $ 103,860 $ 4,092 $ 3,823 $ 2,540 $ 114,315 $ 29,783 $ 84,532
LIABILITIES
Intra-governmental Liabilities $ - $ - $ 37 $ 395 $ 432 $ 28 $ 404
Certificates Issued to FederalReserve Banks 5,200 - - - 5,200 - 5,200
Allocation of Special Drawing Rights 54,463 - - - 54,463 - 54,463
DC Pension Liability - 10,059 - - 10,059 - 10,059
Other Liabilities 7 57 621 253 938 - 938
Total Liabilities 59,670 10,116 658 648 71,092 28 71,064
Net Position
Unexpended Appropriations 200 - - - 200 - 200
Cumulative Results of Operations 43,990 (6,024) 3,165 1,892 43,023 - 43,023
Total Liabilities and NetPosition $ 103,860 $ 4,092 $ 3,823 $ 2,540 $ 114,315 $ 28 $ 114,287
Statement of Net Cost
Gross Cost $ 1,557 $ 256 $ 5,001 $ 406 $ 7,220 $ 64 $ 7,156
Less: Earned Revenue (956) (99) (5,033) - (6,088) (133) (5,955)
Gains/Losses on Pension, ORB, orOPEB Assumption Changes - 690 5 - 695 - 695
Total Net Cost of (RevenueFrom Operations $ 601 $ 847 $ (27) $ 406 $ 1,827 $ (69) $ 1,896
Statement of Changes in NetPosition
Cumulative Results ofOperations:
Beginning Balance $ 44,591 $ (5,669) $ 3,024 $ 1,665 $ 43,611 $ (2) $ 43,613
Budgetary Financing Sources - 492 (77) 572 987 (126) 1,113
Other Financing Sources - - 191 61 252 (40) 292
Total Financing Sources - 492 114 633 1,239 (166) 1,405
Net Cost of (Revenue From)Operations (601) (847) 27 (406) (1,827) 69 (1,896)
Change in Net Position (601) (355) 141 227 (588) (97) (491)
Ending Balance $ 43,990 $ (6,024) $ 3,165 $ 1,892 $ 43,023 $ (99) $ 43,122
* The eliminations reported above include both inter and intra eliminations for the Earmarked Funds. The total eliminations amount will not agree with theeliminations reported in the Statement of Changes in Net Position, which include eliminations for Other Funds.
134
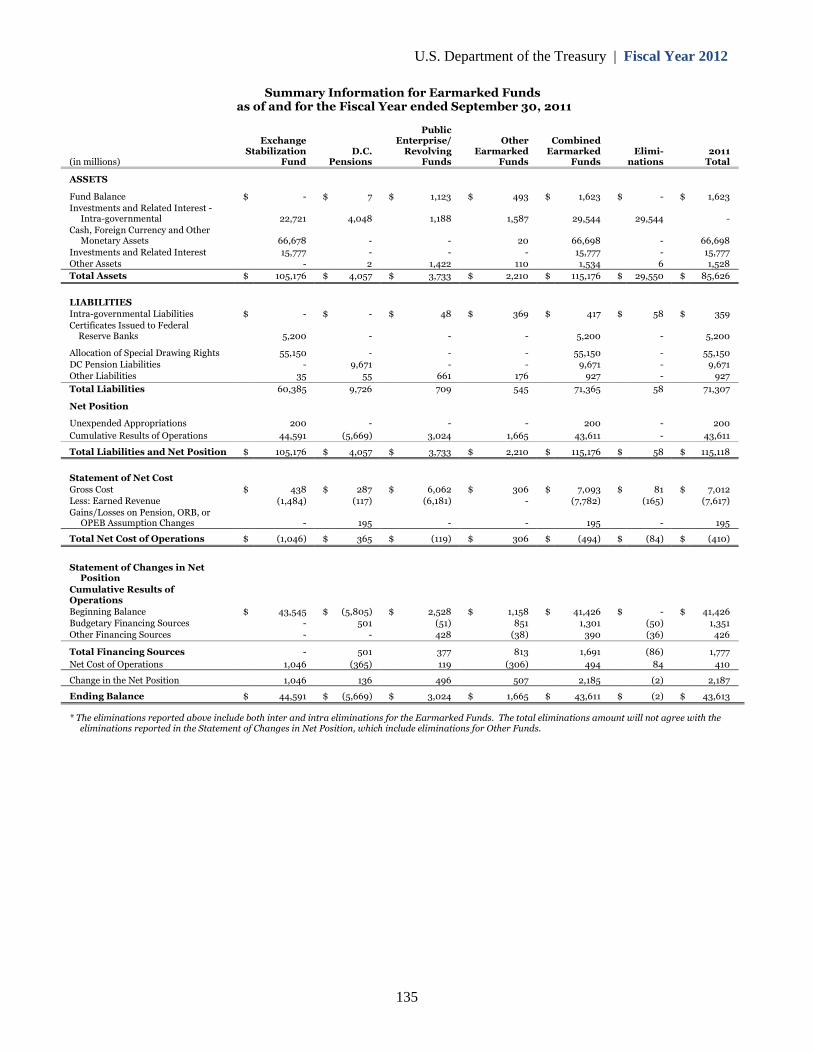
U.S. Department of the Treasury | Fiscal Year 2012
Summary Information for Earmarked Fundsas of and for the Fiscal Year ended September 30, 2011
PublicExchange Enterprise/ Other Combined
Stabilization D.C. Revolving Earmarked Earmarked Elimi- 2011(in millions) Fund Pensions Funds Funds Funds nations Total
ASSETS
Fund Balance $ - $ 7 $ 1,123 $ 493 $ 1,623 $ - $ 1,623Investments and Related Interest -
Intra-governmental 22,721 4,048 1,188 1,587 29,544 29,544 -Cash, Foreign Currency and Other
Monetary Assets 66,678 - - 20 66,698 - 66,698
Investments and Related Interest 15,777 - - - 15,777 - 15,777Other Assets - 2 1,422 110 1,534 6 1,528
Total Assets $ 105,176 $ 4,057 $ 3,733 $ 2,210 $ 115,176 $ 29,550 $ 85,626
LIABILITIESIntra-governmental Liabilities $ - $ - $ 48 $ 369 $ 417 $ 58 $ 359Certificates Issued to Federal
Reserve Banks 5,200 - - - 5,200 - 5,200
Allocation of Special Drawing Rights 55,150 - - - 55,150 - 55,150DC Pension Liabilities - 9,671 - - 9,671 - 9,671Other Liabilities 35 55 661 176 927 - 927
Total Liabilities 60,385 9,726 709 545 71,365 58 71,307
Net Position
Unexpended Appropriations 200 - - - 200 - 200
Cumulative Results of Operations 44,591 (5,669) 3,024 1,665 43,611 - 43,611
Total Liabilities and Net Position $ 105,176 $ 4,057 $ 3,733 $ 2,210 $ 115,176 $ 58 $ 115,118
Statement of Net CostGross Cost $ 438 $ 287 $ 6,062 $ 306 $ 7,093 $ 81 $ 7,012Less: Earned Revenue (1,484) (117) (6,181) - (7,782) (165) (7,617)Gains/Losses on Pension, ORB, or
OPEB Assumption Changes - 195 - - 195 - 195
Total Net Cost of Operations $ (1,046) $ 365 $ (119) $ 306 $ (494) $ (84) $ (410)
Statement of Changes in NetPosition
Cumulative Results ofOperationsBeginning Balance $ 43,545 $ (5,805) $ 2,528 $ 1,158 $ 41,426 $ - $ 41,426Budgetary Financing Sources - 501 (51) 851 1,301 (50) 1,351Other Financing Sources - - 428 (38) 390 (36) 426
Total Financing Sources - 501 377 813 1,691 (86) 1,777
Net Cost of Operations 1,046 (365) 119 (306) 494 84 410
Change in the Net Position 1,046 136 496 507 2,185 (2) 2,187
Ending Balance $ 44,591 $ (5,669) $ 3,024 $ 1,665 $ 43,611 $ (2) $ 43,613
* The eliminations reported above include both inter and intra eliminations for the Earmarked Funds. The total eliminations amount will not agree with theeliminations reported in the Statement of Changes in Net Position, which include eliminations for Other Funds.
135
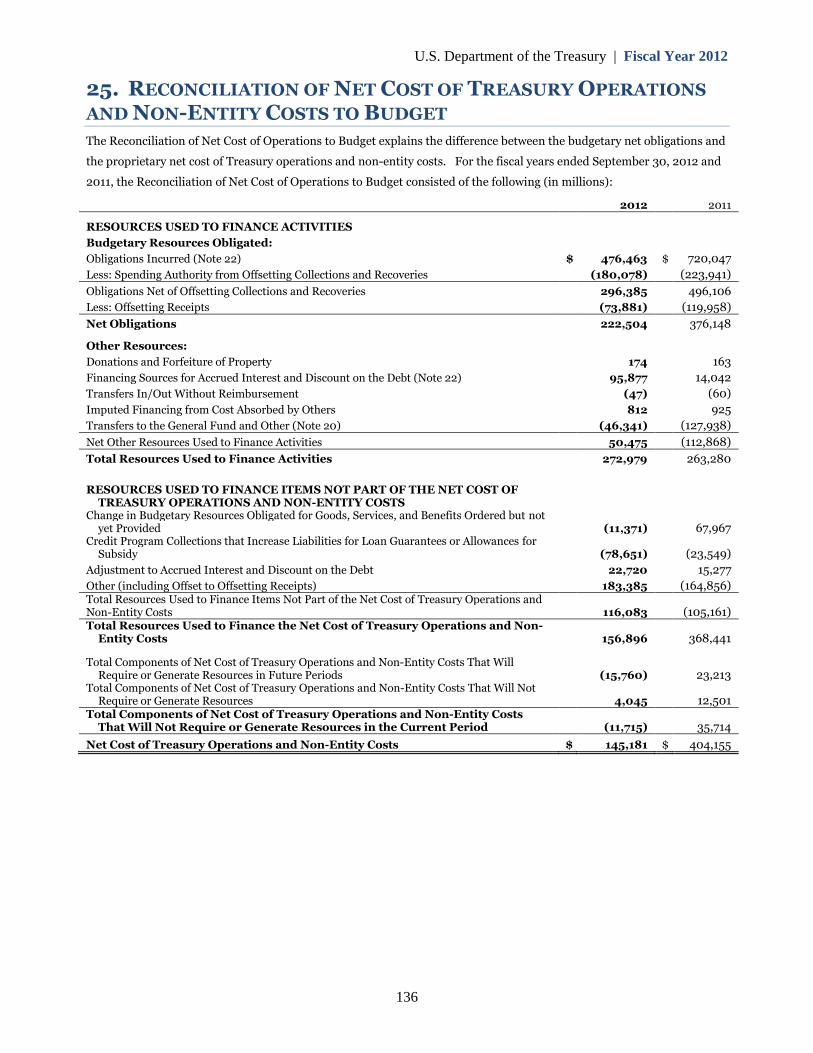
U.S. Department of the Treasury | Fiscal Year 2012
25. RECONCILIATION OF NET COST OF TREASURY OPERATIONS
AND NON-ENTITY COSTS TO BUDGET
The Reconciliation of Net Cost of Operations to Budget explains the difference between the budgetary net obligations and
the proprietary net cost of Treasury operations and non-entity costs. For the fiscal years ended September 30, 2012 and
2011, the Reconciliation of Net Cost of Operations to Budget consisted of the following (in millions):
2012 2011
RESOURCES USED TO FINANCE ACTIVITIES
Budgetary Resources Obligated:
Obligations Incurred (Note 22)
Less: Spending Authority from Offsetting Collections and Recoveries
$ 476,463
(180,078)
$ 720,047
(223,941)
Obligations Net of Offsetting Collections and Recoveries
Less: Offsetting Receipts
296,385
(73,881)
496,106
(119,958)
Net Obligations
Other Resources:
Donations and Forfeiture of Property
Financing Sources for Accrued Interest and Discount on the Debt (Note 22)
Transfers In/Out Without Reimbursement
Imputed Financing from Cost Absorbed by Others
Transfers to the General Fund and Other (Note 20)
222,504
174
95,877
(47)
812
(46,341)
376,148
163
14,042
(60)
925
(127,938)
Net Other Resources Used to Finance Activities 50,475 (112,868)
Total Resources Used to Finance Activities
RESOURCES USED TO FINANCE ITEMS NOT PART OF THE NET COST OFTREASURY OPERATIONS AND NON-ENTITY COSTS
Change in Budgetary Resources Obligated for Goods, Services, and Benefits Ordered but notyet Provided
Credit Program Collections that Increase Liabilities for Loan Guarantees or Allowances forSubsidy
Adjustment to Accrued Interest and Discount on the Debt
Other (including Offset to Offsetting Receipts)
272,979
(11,371)
(78,651)
22,720
183,385
263,280
67,967
(23,549)
15,277
(164,856)Total Resources Used to Finance Items Not Part of the Net Cost of Treasury Operations andNon-Entity Costs 116,083 (105,161)Total Resources Used to Finance the Net Cost of Treasury Operations and Non-
Entity Costs
Total Components of Net Cost of Treasury Operations and Non-Entity Costs That WillRequire or Generate Resources in Future Periods
Total Components of Net Cost of Treasury Operations and Non-Entity Costs That Will NotRequire or Generate Resources
156,896
(15,760)
4,045
368,441
23,213
12,501Total Components of Net Cost of Treasury Operations and Non-Entity Costs
That Will Not Require or Generate Resources in the Current Period (11,715) 35,714
Net Cost of Treasury Operations and Non-Entity Costs $ 145,181 $ 404,155
136
U.S. Department of the Treasury | Fiscal Year 2012
137
26. NON-TARP INVESTMENTS IN AMERICAN INTERNATIONAL
GROUP, INC.Under the initial terms of a capital facility agreement between the FRBNY and AIG, FRBNY established a trust (Trust)
and AIG issued into the Trust Series C Convertible Participating Serial Preferred Stock that was convertible into
approximately 77.9 percent of the issued and outstanding shares of AIG. Subsequent to this initial agreement, a reverse
stock split of AIG’s common stock increased this equity interest to 79.8 percent. The General Fund of the U.S.
Government was the sole beneficiary of the Trust. In connection with the establishment of the Trust, the Department, as
custodian of the General Fund, recorded a non-entity asset of $23.5 billion as of September 30, 2009, along with a
corresponding entry to custodial revenue for the same amount, to reflect the value of the General Fund’s beneficiary
interest holding in the Trust.
On September 30, 2010, the Department, the FRBNY, and AIG entered into an AIG Recapitalization Agreement for the
purpose of restructuring the U.S. Government’s holding in AIG. This restructuring was executed on January 14, 2011,
converting the Trust’s AIG preferred stock into 563 million shares of AIG common stock, and the Trust was dissolved
(refer to Note 7 for a discussion of the TARP-related transactions that occurred in connection with the January 14, 2011
restructuring). The Department intends to sell all of its General Fund and TARP holdings in AIG common stock together,
on a pro rata basis, in the open market over time. The General Fund will be the ultimate recipient of any future dividends
earned and proceeds realized from the liquidation of its holdings of AIG common stock. Accordingly, such dividends and
proceeds are deposited into the accounts of the General Fund. The conversion of the Trust’s preferred stock into AIG
common stock reduced the non-entity portion of the outstanding common stock ownership in AIG from 79.8 percent to
approximately 31 percent. In connection with the January 14, 2011 restructuring, the Department recorded a non-entity
asset of $25.5 billion to reflect the value of the General Fund’s 31 percent ownership in AIG’s common stock. This
transaction also included removing the previous asset, the General Fund’s sole beneficiary interest in the Trust, which
was dissolved as part of the recapitalization.
During fiscal year 2012, the Department sold 1.2 billion shares of AIG common stock held by the General Fund and TARP
(415 million and 806 million shares, respectively). The sale of the AIG common stock resulted in total gross cash
proceeds of $38.2 billion, of which the General Fund and the TARP received $13.0 billion and $25.2 billion, respectively,
for the fiscal year ended September 30, 2012 (refer to Note 7).
During fiscal year 2011, the Department sold in the open market 200 million shares of AIG common stock held by the
General Fund and TARP (68 million and 132 million shares, respectively). The sale of the AIG common stock resulted in
total gross cash proceeds of $5.8 billion, of which the General Fund and the TARP received $2.0 billion and $3.8 billion,
respectively, for the fiscal year ended September 30, 2011 (refer to Note 7).
After taking into consideration the sales of AIG common stock, the General Fund owned 80 million and 495 million
shares of AIG outstanding common stock as of September 30, 2012 and 2011, respectively. The carrying value of the
remaining non-entity investment held in AIG was $2.6 billion and $10.9 billion as of September 30, 2012 and 2011,
respectively, which represented the fair value of the common stock as of that date. The fair value of the non-entity assets
recorded as of September 30, 2012 and 2011 was based on the market value of AIG’s common stock which is actively
traded on the NYSE. The September 30, 2012 carrying value of the AIG investments held on behalf of the General Fund
declined by $8.3 billion from the end of the prior fiscal year due to sales of $13.0 billion, partially offset by a fair value
gain of $4.7 billion during fiscal year 2012. The September 30, 2011 carrying value declined by $9.9 billion from the end
of fiscal year 2010 due to sales of $2.0 billion and a fair value loss of $7.9 billion during fiscal year 2011. Accordingly, the
carrying value of the AIG common stock investment was adjusted by these amounts, and a corresponding amount was
reported as custodial expense on the Statements of Custodial Activity.
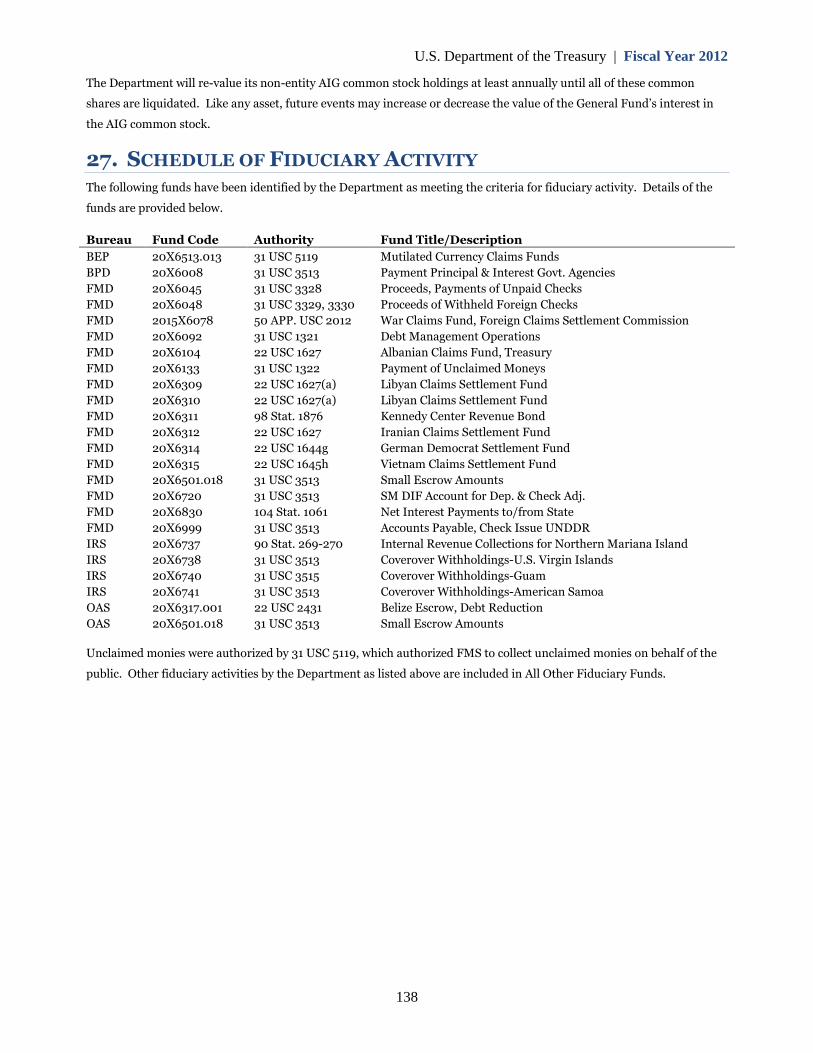
U.S. Department of the Treasury | Fiscal Year 2012
The Department will re-value its non-entity AIG common stock holdings at least annually until all of these common
shares are liquidated. Like any asset, future events may increase or decrease the value of the General Fund’s interest in
the AIG common stock.
27. SCHEDULE OF FIDUCIARY ACTIVITY
The following funds have been identified by the Department as meeting the criteria for fiduciary activity. Details of the
funds are provided below.
Bureau Fund Code Authority Fund Title/Description
BEP 20X6513.013 31 USC 5119 Mutilated Currency Claims Funds
BPD 20X6008 31 USC 3513 Payment Principal & Interest Govt. Agencies
FMD 20X6045 31 USC 3328 Proceeds, Payments of Unpaid Checks
FMD 20X6048 31 USC 3329, 3330 Proceeds of Withheld Foreign Checks
FMD 2015X6078 50 APP. USC 2012 War Claims Fund, Foreign Claims Settlement Commission
FMD 20X6092 31 USC 1321 Debt Management Operations
FMD 20X6104 22 USC 1627 Albanian Claims Fund, Treasury
FMD 20X6133 31 USC 1322 Payment of Unclaimed Moneys
FMD 20X6309 22 USC 1627(a) Libyan Claims Settlement Fund
FMD 20X6310 22 USC 1627(a) Libyan Claims Settlement Fund
FMD 20X6311 98 Stat. 1876 Kennedy Center Revenue Bond
FMD 20X6312 22 USC 1627 Iranian Claims Settlement Fund
FMD 20X6314 22 USC 1644g German Democrat Settlement Fund
FMD 20X6315 22 USC 1645h Vietnam Claims Settlement Fund
FMD 20X6501.018 31 USC 3513 Small Escrow Amounts
FMD 20X6720 31 USC 3513 SM DIF Account for Dep. & Check Adj.
FMD 20X6830 104 Stat. 1061 Net Interest Payments to/from State
FMD 20X6999 31 USC 3513 Accounts Payable, Check Issue UNDDR
IRS 20X6737 90 Stat. 269-270 Internal Revenue Collections for Northern Mariana Island
IRS 20X6738 31 USC 3513 Coverover Withholdings-U.S. Virgin Islands
IRS 20X6740 31 USC 3515 Coverover Withholdings-Guam
IRS 20X6741 31 USC 3513 Coverover Withholdings-American Samoa
OAS 20X6317.001 22 USC 2431 Belize Escrow, Debt Reduction
OAS 20X6501.018 31 USC 3513 Small Escrow Amounts
Unclaimed monies were authorized by 31 USC 5119, which authorized FMS to collect unclaimed monies on behalf of the
public. Other fiduciary activities by the Department as listed above are included in All Other Fiduciary Funds.
138
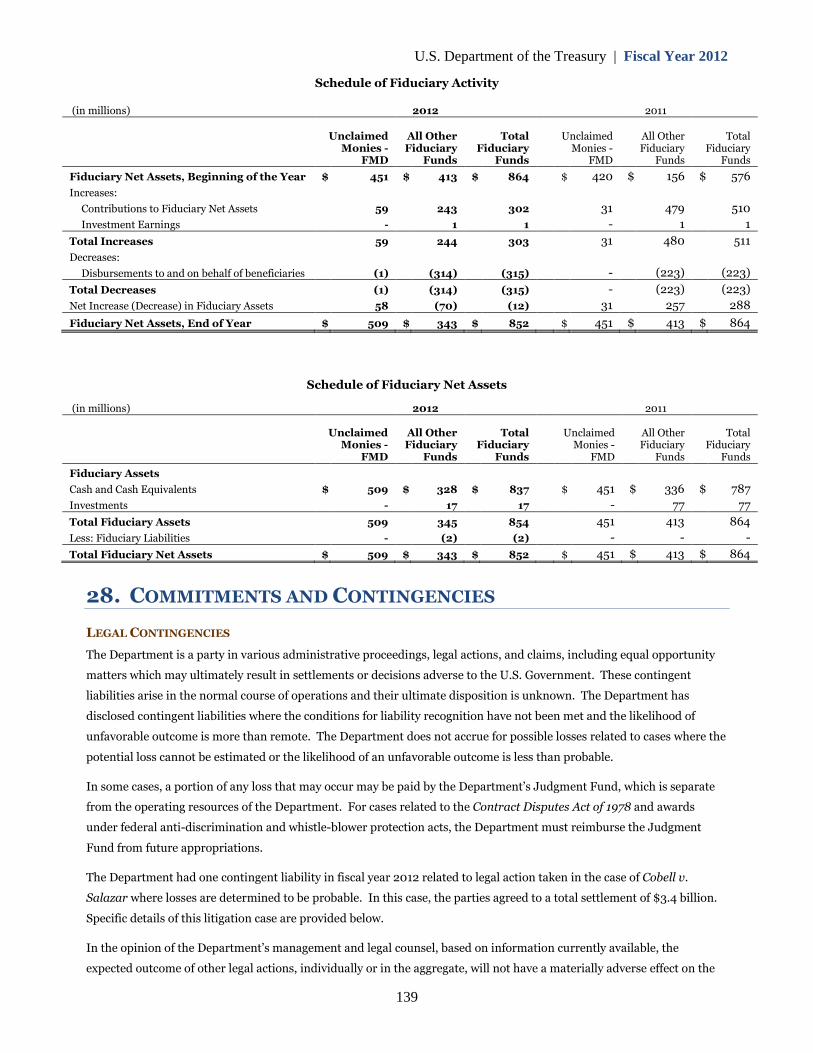
U.S. Department of the Treasury | Fiscal Year 2012
Schedule of Fiduciary Activity
(in millions) 2012 2011
UnclaimedMonies -
FMD
All OtherFiduciary
Funds
TotalFiduciary
Funds
UnclaimedMonies -
FMD
All OtherFiduciary
Funds
TotalFiduciary
Funds
Fiduciary Net Assets, Beginning of the Year $ 451 $ 413 $ 864 $ 420 $ 156 $ 576
Increases:
Contributions to Fiduciary Net Assets
Investment Earnings
59
-
243
1
302
1
31
-
479
1
510
1
Total Increases 59 244 303 31 480 511
Decreases:
Disbursements to and on behalf of beneficiaries (1) (314) (315) - (223) (223)
Total Decreases
Net Increase (Decrease) in Fiduciary Assets
(1)
58
(314)
(70)
(315)
(12)
-
31
(223)
257
(223)
288
Fiduciary Net Assets, End of Year $ 509 $ 343 $ 852 $ 451 $ 413 $ 864
Schedule of Fiduciary Net Assets
(in millions) 2012 2011
UnclaimedMonies -
FMD
All OtherFiduciary
Funds
TotalFiduciary
Funds
UnclaimedMonies -
FMD
All OtherFiduciary
Funds
TotalFiduciary
Funds
Fiduciary Assets
Cash and Cash Equivalents
Investments
$ 509
-
$ 328
17
$ 837
17
$ 451
-
$ 336
77
$ 787
77
Total Fiduciary Assets 509 345 854 451 413 864
Less: Fiduciary Liabilities - (2) (2) - - -
Total Fiduciary Net Assets $ 509 $ 343 $ 852 $ 451 $ 413 $ 864
28. COMMITMENTS AND CONTINGENCIES
LEGAL CONTINGENCIES
The Department is a party in various administrative proceedings, legal actions, and claims, including equal opportunity
matters which may ultimately result in settlements or decisions adverse to the U.S. Government. These contingent
liabilities arise in the normal course of operations and their ultimate disposition is unknown. The Department has
disclosed contingent liabilities where the conditions for liability recognition have not been met and the likelihood of
unfavorable outcome is more than remote. The Department does not accrue for possible losses related to cases where the
potential loss cannot be estimated or the likelihood of an unfavorable outcome is less than probable.
In some cases, a portion of any loss that may occur may be paid by the Department’s Judgment Fund, which is separate
from the operating resources of the Department. For cases related to the Contract Disputes Act of 1978 and awards
under federal anti-discrimination and whistle-blower protection acts, the Department must reimburse the Judgment
Fund from future appropriations.
The Department had one contingent liability in fiscal year 2012 related to legal action taken in the case of Cobell v.
Salazar where losses are determined to be probable. In this case, the parties agreed to a total settlement of $3.4 billion.
Specific details of this litigation case are provided below.
In the opinion of the Department’s management and legal counsel, based on information currently available, the
expected outcome of other legal actions, individually or in the aggregate, will not have a materially adverse effect on the
139
U.S. Department of the Treasury | Fiscal Year 2012
Department’s consolidated financial statements, except for the pending legal actions described below which may have a
materially adverse impact on the consolidated financial statements depending on the outcomes of the cases.
Pending Legal Actions
Cobell et al. v. Salazar et al. (formerly Cobell v. Kempthorne): Native Americans allege that the Department of the
Interior and the Department of the Treasury have breached trust obligations with respect to the management of the
plaintiffs’ individual Indian monies. In August 2008, the Federal District Court issued an opinion awarding $455
million to the plaintiffs. This decision was overturned in July 2009. The Appellate Court found that the U.S.
Government owes a cost-effective accounting, in scale with available funds.
In December 2009, the parties agreed to settle the plaintiff’s claims, as well as claims for mismanagement of assets and
land that were not asserted in the case, for $1.5 billion. The U.S. Government also agreed to pay an additional amount
of up to $1.9 billion to purchase certain land interests owned by Native Americans. The Department of the Interior,
jointly named in the case, accrued the entire $3.4 billion as a contingent liability in fiscal year 2011 upon President
Obama’s signing of legislation authorizing the settlement in December 2010. Accordingly, the Department of the
Treasury will not accrue any portion of this liability. Several class members appealed the settlement however, in May
2012, the Appellate Court upheld the District Court’s decision approving the settlement. Appellants filed petitions for
certiorari to the Supreme Court. Final approval of the settlement will not occur until the appeals from individuals
challenging the settlement have run their course.
Tribal Trust Fund Cases: Numerous cases have been filed in the U.S. District Courts in which Native American Tribes
seek a declaration that the United States has not provided the tribes with a full and complete accounting of their trust
funds, and seek an order requiring the U.S. Government to provide such an accounting. In addition, there are a
number of other related cases seeking damages in the U.S. Court of Federal Claims, which do not name the Department
as a defendant. During fiscal year 2012, a number of tribal trust fund cases settled for an aggregate settlement amount
totaling $754 million, which was paid from the Judgment Fund. The U.S. Government is currently in discussion with
counsel representing most of the remaining plaintiff tribes with tribal trust fund cases pending against the United
States about the feasibility of an out-of-court settlement. Plaintiff tribes in several of the pending cases have chosen to
pursue active litigation, rather than settlement discussion, and the U.S. Government is vigorously litigating those cases.
The Department is unable to determine the likelihood of an unfavorable outcome or an estimate of potential loss at this
time.
Amidax Trading Group v. S.W.I.F.T.: Plaintiffs allege that the Department’s Terrorist Finance Tracking Program has
involved unlawful disclosure of information by the Society for Worldwide Interbank Financial Telecommunications
(S.W.I.F.T.). Defendants include the Department of the Treasury as well as several Treasury officials. The case was
dismissed by the District Court in February 2009, and the plaintiff subsequently appealed that ruling to the Court of
Appeals for the Second Circuit. The parties completed the appellate briefing, and the oral argument occurred in July
2010. In December 2011, the Second Circuit ruled in favor of the defendants, affirming the District Court and, in July
2012, the Second Circuit denied the plaintiff’s petition for rehearing. It is unclear whether the plaintiff will file a
petition of certiorari with the Supreme Court, but the plaintiff has obtained an extension of the deadline, until
December 24, 2012, to seek Supreme Court review. The Department is unable to determine the likelihood of an
unfavorable outcome or an estimate of potential loss at this time.
James X. Bormes v. United States of America: The complaint alleges that the government willfully violated certain
provisions of the Fair and Accurate Credit Transaction Act (FACTA) P.L. 108-159 in that the transaction confirmation
received by the complainant from Pay.gov improperly included the expiration date of the credit card used for that
transaction. The complaint does not state the amount of damages sought on behalf of the class beyond asserting that
140
U.S. Department of the Treasury | Fiscal Year 2012
each class member would be entitled to $100 to $1,000 in statutory damages. In a letter sent to the Department of
Justice, the plaintiff proposed a fund of $30 million for just the Illinois class members.
In July 2009, the U.S. District Court for the Northern District of Illinois granted the U.S. Government’s motion to
dismiss this case for lack of an unequivocal waiver of sovereign immunity. In November 2010, the U.S. Court of
Appeals for the Federal Circuit reversed the District Court’s decision and directed that the case be remanded back to
the District Court for further proceedings. The U.S. Government’s petition for a rehearing of that decision was denied
by the Federal Circuit in March 2011. In January 2012, the U.S. Supreme Court granted the U.S. Government a writ of
certiorari concerning this decision. The case was argued on October 2, 2012, and a decision by the U.S. Supreme Court
is pending. The Department is unable to determine the likelihood of an unfavorable outcome or an estimate of
potential loss at this time.
Other Legal Actions: The Department is also involved in employment related legal actions (e.g., matters alleging
discrimination and other claims before the Equal Employment Opportunity Commission, Merit System Protection
Board, etc.) for which an unfavorable outcome is reasonably possible, but for which an estimate of potential loss cannot
be determined at this time. It is not expected that these cases will have a material adverse effect on the Department’s
financial position or results.
OTHER COMMITMENTS AND CONTINGENCIES
Loan Commitments
The Department, through FFB, makes loan commitments with federal agencies, or private sector borrowers whose loans
are guaranteed by federal agencies, to extend them credit for their own use (refer to Notes 1L and 3). As of September 30,
2012 and 2011, the Department had loan commitments totaling $86.2 billion and $95.5 billion, respectively.
Multilateral Development Banks
The Department, on behalf of the United States, has subscribed to capital for certain multilateral development banks
(MDBs), portions of which are callable under certain limited circumstances to meet the obligations of the respective
MDB. There has never been, nor is there anticipated, a call on the U.S. commitment for these subscriptions. As of
September 30, 2012 and 2011, U.S. callable capital in MDBs was as follows (in millions):
2012 2011
Inter-American Development Bank $ 32,786 $ 28,687
International Bank for Reconstruction and Development 31,805 29,966
Asian Development Bank 11,027 8,469
European Bank for Reconstruction and Development 3,055 1,803
African Development Bank 2,053 1,545
North American Development Bank 1,275 1,275
Multilateral Investment Guarantee Agency(1) 315 293
Total $ 82,316 $ 72,038
(1) Includes, for fiscal year 2012, commitments of $22 million for the undisbursed portion of the subscription to paid-in capital investments.
Amounts included in the above table do not include amounts for which the Department may be liable to pay if future
congressional action is taken to fund executed agreements between the Department and certain multilateral development
banks.
141
U.S. Department of the Treasury | Fiscal Year 2012
Terrorism Risk Insurance Program
The Terrorism Risk Insurance Act (TRIA), signed into law in November 2002, was enacted to address market
disruptions resulting from terrorist attacks on September 11, 2001. TRIA helps to ensure available and affordable
commercial property and casualty insurance for terrorism risk, and simultaneously allows private markets to stabilize.
The authority to pay claims under the Terrorism Risk Insurance Program (TRIA Program) is activated upon the
certification of an “act of terrorism” by the Secretary in concurrence with the Secretary of State and the Attorney General.
If a certified act of terrorism occurs, insurers may be eligible to receive reimbursement from the U.S. Government for
insured losses above a designated deductible amount. Insured losses above this amount will be shared between
insurance companies and the U.S. Government. TRIA also gives the Department authority to recoup federal payments
made under the TRIA Program through policyholder surcharges under certain circumstances, and contains provisions
designed to manage litigation arising from or relating to a certified act of terrorism. There were no claims under TRIA as
of September 30, 2012 or 2011.
Exchange Stabilization Agreement
In April 1994, the Department signed the North American Framework Agreement (NAFA), which includes the Exchange
Stabilization Agreement (ESA) with Mexico. The Department, through the ESF, has a standing swap line for $3.0 billion
with Mexico under the NAFA and its implementing ESA. The amounts and terms (including the assured source of
repayment) of any borrowing under NAFA and ESA will have to be negotiated and agreed to before any actual drawing
can occur. The ESA does provide sample clauses that state that transactions shall be exchange rate neutral for the ESF,
and shall bear interest based on a then current rate tied to U.S. Treasury bills. There were no drawings outstanding on
the ESF swap line as of September 30, 2012 and 2011. The Department renewed the ESA through December 14, 2012.
New Arrangements to Borrow
The Supplemental Appropriations Act of 2009 (P.L. 111-32) provided the authorization and appropriations for an
increase in the United States’ participation in the New Arrangements to Borrow (NAB). Because the U.S. financial
participation in the IMF is denominated in SDRs, P.L. 111-32 authorized and appropriated up to the dollar equivalent of
SDR 75 billion to implement this commitment. The United States agreed in May 2010 that its participation in the NAB
would increase from SDR 6.6 billion to SDR 69.1 billion, pursuant to IMF Executive Board Decision No. 14577-(10/35).
Total U.S. participation in the NAB of SDR 69.1 billion was equivalent to $106.5 billion and $107.9 billion as of
September 30, 2012 and 2011, respectively. Refer to Notes 11 and 12 for more information on the NAB.
Contingent Liability to GSEs
The SPSPA agreements between the Department and each GSE, which have no expiration date, provide for the
Department to disburse funds to the GSEs if, at the end of any quarter, the FHFA determines that the liabilities exceed its
assets. At September 30, 2012, the Department recorded a contingent liability of $9.0 billion with a projected maximum
remaining potential commitment to the GSEs of $282.3 billion. The recorded contingent liability of $316.2 billion at
September 30, 2011 constituted the maximum commitment payable at the end of that year. Such accruals are adjusted as
new information develops or circumstances change. Refer to Note 8 for a full description of the SPSPA agreements and
related contingent liability.
142
U.S. Department of the Treasury | Fiscal Year 2012
REQUIRED SUPPLEMENTAL INFORMATION (UNAUDITED – SEE
ACCOMPANYING AUDITORS’ REPORT)
INTRODUCTION
This section provides the Required Supplemental Information as prescribed by accounting standards.
OTHER CLAIMS FOR REFUNDS
The Department has estimated that $11.4 billion may be payable as other claims for tax refunds. This estimate represents
amounts (principal and interest) that may be paid for claims pending judicial review by the federal courts or internally,
by Appeals. The total estimated payout (including principal and interest) for claims pending judicial review by the
federal courts is $6.1 billion and by appeals is $5.3 billion.
The Department made an administrative determination to accept the position that certain medical residents who
received stipends be exempted from FICA taxes for periods before April 1, 2005. At September 30, 2012, the IRS
estimated unpaid refund claims of approximately $2.4 billion. In accordance with federal accounting standards, the
amounts of these claims have not been recorded as a liability in the consolidated financial statements because certain
administrative processes have not been completed as of September 30, 2012.
IRS FEDERAL TAXES RECEIVABLE, NET
In accordance with SFFAS No. 7, Accounting for Revenue and Other Financing Sources and Concepts for Reconciling
Budgetary and Financial Accounting, some unpaid tax assessments do not meet the criteria for financial statement
recognition. Under Internal Revenue Code Section 6201, the Department is authorized and required to make inquiries,
determinations, and assessments of all taxes which have not been duly paid (including interest, additions to the tax, and
assessable penalties) under the law. Unpaid assessments result from taxpayers filing returns without sufficient payment,
as well as from tax compliance programs such as examination, under-reporter, substitute for return, and combined
annual wage reporting. The Department also has authority to abate the paid or unpaid portion of an assessed tax,
interest, and penalty. Abatements occur for a number of reasons and are a normal part of the tax administration process.
Abatements may result in claims for refunds or a reduction of the unpaid assessed amount.
Under federal accounting standards, unpaid assessments require taxpayer or court agreement to be considered federal
taxes receivable. Assessments not agreed to by taxpayers or the courts are considered compliance assessments and are
not considered federal taxes receivable. Due to the lack of agreement, these compliance assessments are less likely to
have future collection potential than those unpaid assessments that are considered federal taxes receivable.
Assessments with little or no future collection potential are called write-offs. Write-offs principally consist of amounts
owed by deceased, bankrupt, or defunct taxpayers, including many failed financial institutions liquidated by the FDIC
and the former Resolution Trust Corporation (RTC). Write-offs have little or no future collection potential, but statutory
provisions require that these assessments be maintained until the statute for collection expires.
Although compliance assessments and write-offs are not considered receivables under federal accounting standards, they
represent legally enforceable claims of the U.S. Government.
143
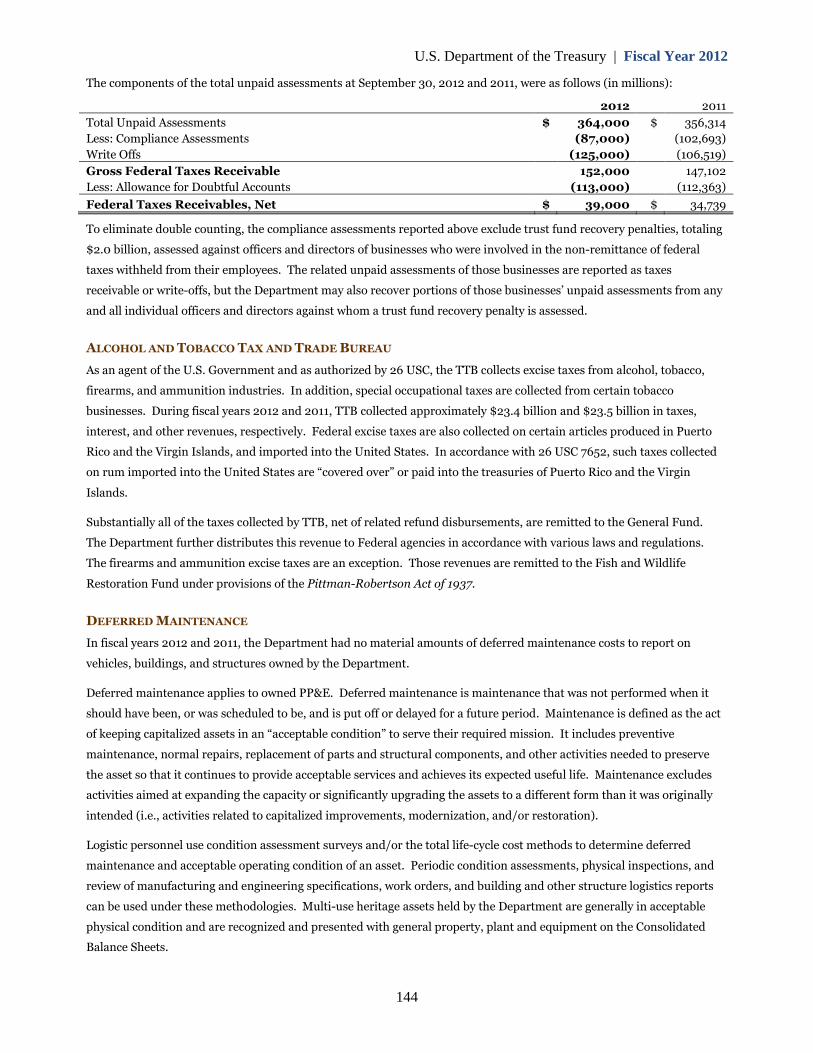
U.S. Department of the Treasury | Fiscal Year 2012
The components of the total unpaid assessments at September 30, 2012 and 2011, were as follows (in millions):
2012 2011
Total Unpaid Assessments $ 364,000 $ 356,314
Less: Compliance Assessments (87,000) (102,693)
Write Offs (125,000) (106,519)
Gross Federal Taxes Receivable 152,000 147,102
Less: Allowance for Doubtful Accounts (113,000) (112,363)
Federal Taxes Receivables, Net $ 39,000 $ 34,739
To eliminate double counting, the compliance assessments reported above exclude trust fund recovery penalties, totaling
$2.0 billion, assessed against officers and directors of businesses who were involved in the non-remittance of federal
taxes withheld from their employees. The related unpaid assessments of those businesses are reported as taxes
receivable or write-offs, but the Department may also recover portions of those businesses’ unpaid assessments from any
and all individual officers and directors against whom a trust fund recovery penalty is assessed.
ALCOHOL AND TOBACCO TAX AND TRADE BUREAU
As an agent of the U.S. Government and as authorized by 26 USC, the TTB collects excise taxes from alcohol, tobacco,
firearms, and ammunition industries. In addition, special occupational taxes are collected from certain tobacco
businesses. During fiscal years 2012 and 2011, TTB collected approximately $23.4 billion and $23.5 billion in taxes,
interest, and other revenues, respectively. Federal excise taxes are also collected on certain articles produced in Puerto
Rico and the Virgin Islands, and imported into the United States. In accordance with 26 USC 7652, such taxes collected
on rum imported into the United States are “covered over” or paid into the treasuries of Puerto Rico and the Virgin
Islands.
Substantially all of the taxes collected by TTB, net of related refund disbursements, are remitted to the General Fund.
The Department further distributes this revenue to Federal agencies in accordance with various laws and regulations.
The firearms and ammunition excise taxes are an exception. Those revenues are remitted to the Fish and Wildlife
Restoration Fund under provisions of the Pittman-Robertson Act of 1937.
DEFERRED MAINTENANCE
In fiscal years 2012 and 2011, the Department had no material amounts of deferred maintenance costs to report on
vehicles, buildings, and structures owned by the Department.
Deferred maintenance applies to owned PP&E. Deferred maintenance is maintenance that was not performed when it
should have been, or was scheduled to be, and is put off or delayed for a future period. Maintenance is defined as the act
of keeping capitalized assets in an “acceptable condition” to serve their required mission. It includes preventive
maintenance, normal repairs, replacement of parts and structural components, and other activities needed to preserve
the asset so that it continues to provide acceptable services and achieves its expected useful life. Maintenance excludes
activities aimed at expanding the capacity or significantly upgrading the assets to a different form than it was originally
intended (i.e., activities related to capitalized improvements, modernization, and/or restoration).
Logistic personnel use condition assessment surveys and/or the total life-cycle cost methods to determine deferred
maintenance and acceptable operating condition of an asset. Periodic condition assessments, physical inspections, and
review of manufacturing and engineering specifications, work orders, and building and other structure logistics reports
can be used under these methodologies. Multi-use heritage assets held by the Department are generally in acceptable
physical condition and are recognized and presented with general property, plant and equipment on the Consolidated
Balance Sheets.
144
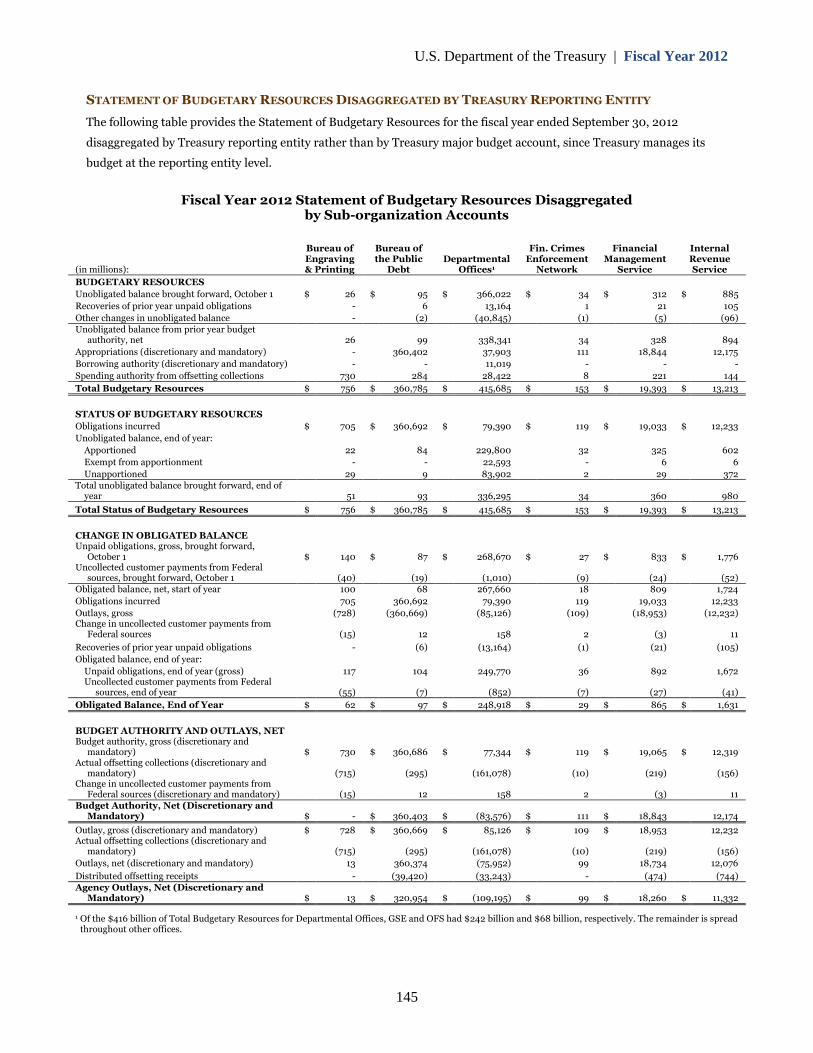
U.S. Department of the Treasury | Fiscal Year 2012
STATEMENT OF BUDGETARY RESOURCES DISAGGREGATED BY TREASURY REPORTING ENTITY
The following table provides the Statement of Budgetary Resources for the fiscal year ended September 30, 2012
disaggregated by Treasury reporting entity rather than by Treasury major budget account, since Treasury manages its
budget at the reporting entity level.
Fiscal Year 2012 Statement of Budgetary Resources Disaggregatedby Sub-organization Accounts
(in millions):
Bureau ofEngraving& Printing
Bureau ofthe Public
DebtDepartmental
Offices1
Fin. CrimesEnforcement
Network
FinancialManagement
Service
InternalRevenueService
BUDGETARY RESOURCES
Unobligated balance brought forward, October 1
Recoveries of prior year unpaid obligations
Other changes in unobligated balance
$ 26
-
-
$ 95
6
(2)
$ 366,022
13,164
(40,845)
$ 34
1
(1)
$ 312
21
(5)
$ 885
105
(96)Unobligated balance from prior year budget
authority, net
Appropriations (discretionary and mandatory)
Borrowing authority (discretionary and mandatory)
Spending authority from offsetting collections
26
-
-
730
99
360,402
-
284
338,341
37,903
11,019
28,422
34
111
-
8
328
18,844
-
221
894
12,175
-
144
Total Budgetary Resources $ 756 $ 360,785 $ 415,685 $ 153 $ 19,393 $ 13,213
STATUS OF BUDGETARY RESOURCES
Obligations incurred
Unobligated balance, end of year:
Apportioned
Exempt from apportionment
Unapportioned
$ 705
22
-
29
$ 360,692
84
-
9
$ 79,390
229,800
22,593
83,902
$ 119
32
-
2
$ 19,033
325
6
29
$ 12,233
602
6
372Total unobligated balance brought forward, end of
year 51 93 336,295 34 360 980
Total Status of Budgetary Resources $ 756 $ 360,785 $ 415,685 $ 153 $ 19,393 $ 13,213
CHANGE IN OBLIGATED BALANCEUnpaid obligations, gross, brought forward,
October 1Uncollected customer payments from Federal
sources, brought forward, October 1
$ 140
(40)
$ 87
(19)
$ 268,670
(1,010)
$ 27
(9)
$ 833
(24)
$ 1,776
(52)Obligated balance, net, start of year
Obligations incurred
Outlays, grossChange in uncollected customer payments from
Federal sources
Recoveries of prior year unpaid obligations
Obligated balance, end of year:
Unpaid obligations, end of year (gross)Uncollected customer payments from Federal
sources, end of year
100
705
(728)
(15)
-
117
(55)
68
360,692
(360,669)
12
(6)
104
(7)
267,660
79,390
(85,126)
158
(13,164)
249,770
(852)
18
119
(109)
2
(1)
36
(7)
809
19,033
(18,953)
(3)
(21)
892
(27)
1,724
12,233
(12,232)
11
(105)
1,672
(41)
Obligated Balance, End of Year $ 62 $ 97 $ 248,918 $ 29 $ 865 $ 1,631
BUDGET AUTHORITY AND OUTLAYS, NETBudget authority, gross (discretionary and
mandatory)Actual offsetting collections (discretionary and
mandatory)Change in uncollected customer payments from
Federal sources (discretionary and mandatory)
$ 730
(715)
(15)
$ 360,686
(295)
12
$ 77,344
(161,078)
158
$ 119
(10)
2
$ 19,065
(219)
(3)
$ 12,319
(156)
11Budget Authority, Net (Discretionary and
Mandatory) $ - $ 360,403 $ (83,576) $ 111 $ 18,843 12,174
Outlay, gross (discretionary and mandatory)Actual offsetting collections (discretionary and
mandatory)
Outlays, net (discretionary and mandatory)
Distributed offsetting receipts
$ 728
(715)
13
-
$ 360,669
(295)
360,374
(39,420)
$ 85,126
(161,078)
(75,952)
(33,243)
$ 109
(10)
99
-
$ 18,953
(219)
18,734
(474)
12,232
(156)
12,076
(744)Agency Outlays, Net (Discretionary and
Mandatory) $ 13 $ 320,954 $ (109,195) $ 99 $ 18,260 $ 11,332
1 Of the $416 billion of Total Budgetary Resources for Departmental Offices, GSE and OFS had $242 billion and $68 billion, respectively. The remainder is spreadthroughout other offices.
145
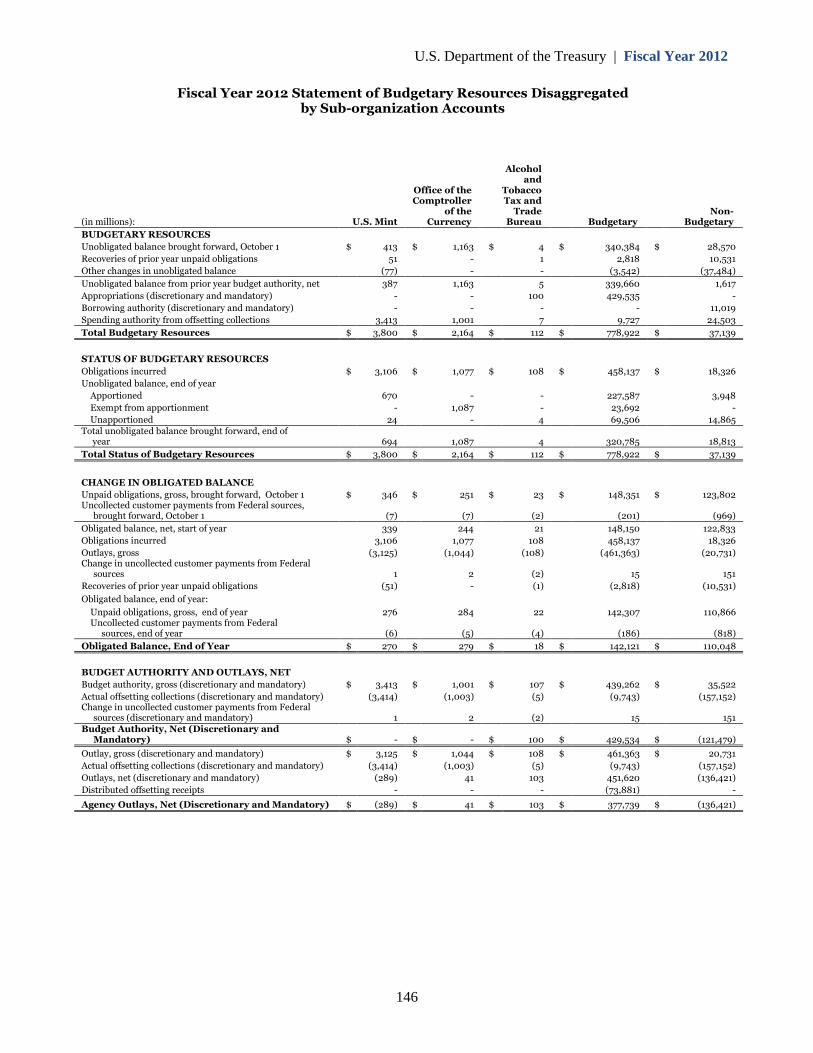
U.S. Department of the Treasury | Fiscal Year 2012
Fiscal Year 2012 Statement of Budgetary Resources Disaggregatedby Sub-organization Accounts
Alcoholand
Office of the TobaccoComptroller
of theTax and
Trade Non-(in millions): U.S. Mint Currency Bureau Budgetary Budgetary
BUDGETARY RESOURCES
Unobligated balance brought forward, October 1 $ 413 $ 1,163 $ 4 $ 340,384 $ 28,570
Recoveries of prior year unpaid obligations 51 - 1 2,818 10,531
Other changes in unobligated balance (77) - - (3,542) (37,484)
Unobligated balance from prior year budget authority, net 387 1,163 5 339,660 1,617
Appropriations (discretionary and mandatory) - - 100 429,535 -
Borrowing authority (discretionary and mandatory) - - - - 11,019
Spending authority from offsetting collections 3,413 1,001 7 9,727 24,503
Total Budgetary Resources $ 3,800 $ 2,164 $ 112 $ 778,922 $ 37,139
STATUS OF BUDGETARY RESOURCES
Obligations incurred $ 3,106 $ 1,077 $ 108 $ 458,137 $ 18,326
Unobligated balance, end of year
Apportioned 670 - - 227,587 3,948
Exempt from apportionment - 1,087 - 23,692 -
Unapportioned 24 - 4 69,506 14,865Total unobligated balance brought forward, end of
year 694 1,087 4 320,785 18,813
Total Status of Budgetary Resources $ 3,800 $ 2,164 $ 112 $ 778,922 $ 37,139
CHANGE IN OBLIGATED BALANCE
Unpaid obligations, gross, brought forward, October 1Uncollected customer payments from Federal sources,
brought forward, October 1
$ 346
(7)
$ 251
(7)
$ 23
(2)
$ 148,351
(201)
$ 123,802
(969)
Obligated balance, net, start of year 339 244 21 148,150 122,833
Obligations incurred 3,106 1,077 108 458,137 18,326
Outlays, grossChange in uncollected customer payments from Federal
sources
(3,125)
1
(1,044)
2
(108)
(2)
(461,363)
15
(20,731)
151
Recoveries of prior year unpaid obligations (51) - (1) (2,818) (10,531)
Obligated balance, end of year:
Unpaid obligations, gross, end of yearUncollected customer payments from Federal
sources, end of year
276
(6)
284
(5)
22
(4)
142,307
(186)
110,866
(818)
Obligated Balance, End of Year $ 270 $ 279 $ 18 $ 142,121 $ 110,048
BUDGET AUTHORITY AND OUTLAYS, NET
Budget authority, gross (discretionary and mandatory) $ 3,413 $ 1,001 $ 107 $ 439,262 $ 35,522
Actual offsetting collections (discretionary and mandatory)Change in uncollected customer payments from Federal
sources (discretionary and mandatory)
(3,414)
1
(1,003)
2
(5)
(2)
(9,743)
15
(157,152)
151Budget Authority, Net (Discretionary and
Mandatory) $ - $ - $ 100 $ 429,534 $ (121,479)
Outlay, gross (discretionary and mandatory) $ 3,125 $ 1,044 $ 108 $ 461,363 $ 20,731
Actual offsetting collections (discretionary and mandatory) (3,414) (1,003) (5) (9,743) (157,152)
Outlays, net (discretionary and mandatory) (289) 41 103 451,620 (136,421)
Distributed offsetting receipts - - - (73,881) -
Agency Outlays, Net (Discretionary and Mandatory) $ (289) $ 41 $ 103 $ 377,739 $ (136,421)
146