Embed Size (px)
Citation preview

The U.S. EPA’sGreat Lakes Legacy Act
A ht b l Ri Cl UAshtabula River Clean-UpMarch 2008

1995 PCB Sampling Locations

Summary of Sampling Results
• 545,000 cubic yards of impacted sediments
• Maximum PCB Concentration 660 ppm• Average PCB Concentration: 7.5 ppm
(throughout entire sediment column)• 25,000 pounds of PCBs present in
sediments

Baseline Sampling ProgramBaseline Sampling Program
• Sediment Chemistry– PCBs, HCB, HCBD, TOC, , ,
• Sediment Toxicity– 20-day for C. dilutus Survival and Growth
28 d f H t S i l d G th– 28-days for H. azteca Survival and Growth
• Water Chemistry– PCBs, TOCC , OC
• Whole Sediment Bioaccumulation– 28-day exposure of Lumbriculus variegatus;– Analyzed for: PCBs, % Lipids, % Moisture
• Caged Fish– 28-day exposure of young of the year catfish28 day exposure of young of the year catfish– Analyzed for: PCBs, % Lipids, % Moisture

PCB SWACPCB SWAC
Strong BrookSource

Baseline Sampling: Results and Lessons Learned
L L d• Lessons Learned– Always do a baseline assessment– Always collect recent data to assess potential
sourcesI ’ 2008 d h ill i l h– It’s 2008 and there are still violators out there (intentional and/or unintentional)
R lt• Results– Pre-Dredging PCB SWAC: 0.5 mg/kg

Project DetailsProject Details

Project Goals• Overarching Goals
– Reduce contaminant levels in fish– Restore use of river by boats
• 20% of boats damaged due to shallow depths in 2005Reduce number of tumors in fish– Reduce number of tumors in fish
– Restore valuable habitat• Specific Remedial Goalp
– 0.25 ppm PCBs Surface Weighted Average Concentration (SWAC) 10 years after the completion of dredgingof dredging
– 7.5 ppm PCB SWAC immediately following dredging– Dredge navigation channel below the federally
authorized depth

Re-Sedimentation and Recovery

Operations OverviewContainment Facility
Dredge Booster PumpWater Treatment
Dredging Operations Landside Booster PumpsLandside Booster Pumps

DredgingDredging

Dredging Cross Section

Summary of Dredging Processy g g• Required cut depths
A t t l t 11 f t– Average total cut = 11 feet– Range of cut depths = 2-18 feet
Target depth: 20 feet or Bedrock– Target depth: 20 feet or Bedrock– 545,000 cubic yards targeted for removal
• Two Hydraulic Cutterhead Dredges• Two Hydraulic Cutterhead Dredges– 12” Dredge for Production
8” Dredge for Clean Up Passes– 8 Dredge for Clean Up Passes• VicVac™ Suction attachment utilized for last pass
above bedrock in Upper Turning Basin– Operated Concurrently
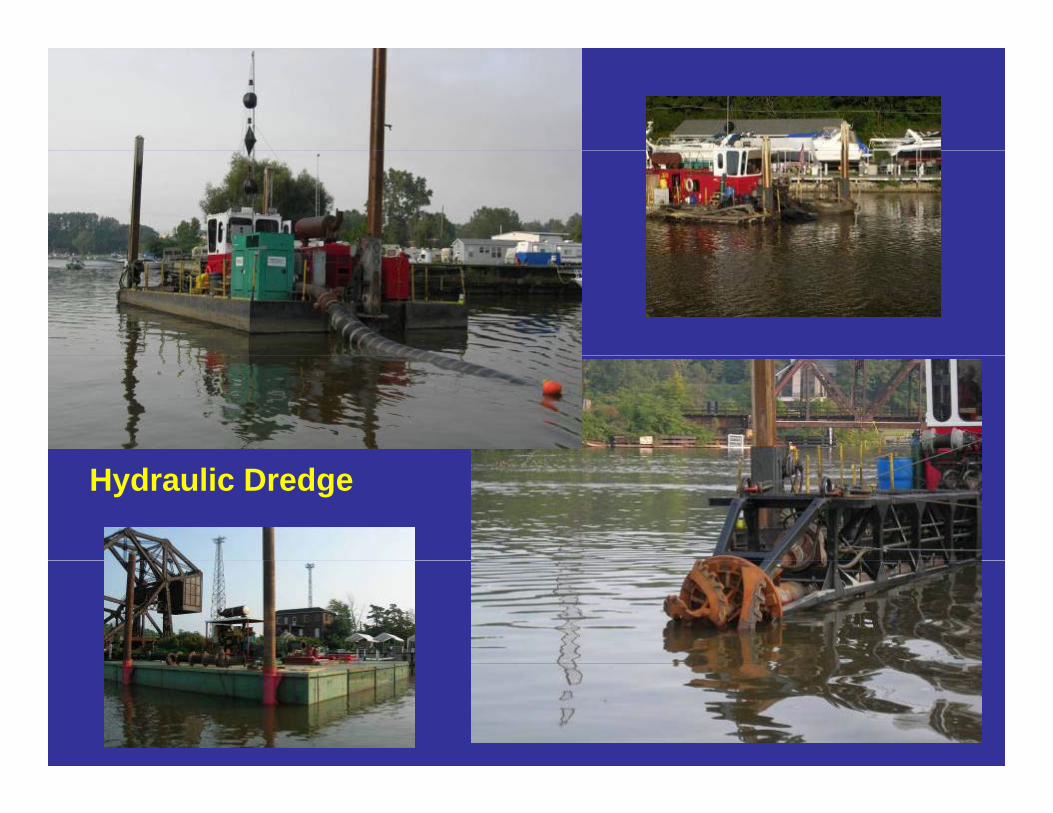
Hydraulic Dredge

Dredging Equipmentg g q pBiggest Challenge: Debris
Solution: Gatling Plate and Shear Bar
Solution: Root Knife Installed in Pumps

Dredging and Debris• Debris related shutdowns
Dredging and Debris
– 2006: 19% project downtime throughout the entire system, with the worst day averaging 4 h d hshutdowns per hour• installed revised gatling plate, and root knife in
dredge pump led to 7% project downtime and 1dredge pump led to 7% project downtime, and 1 cleanout every 2 hours.
– 2007: Installed wiper blade along with gatling p g g gplate, added root knives to all boosters
• 3% project downtime.

8” Dredge forCleanup OperationsCleanup Operations

VicVac™ Attachment

Residual Contamination and Cover Layery
Sand Cover Layer

Dredging Operation Detailsg g p• 12” Dredge Operating Independently
– GPM = 4 000– GPM = 4,000– Average % Solids = 8%-10%– Cy/day = 1 200 to 5 000 (dependent onCy/day 1,200 to 5,000 (dependent on
system uptime)– Average cut depth per pass = 5 ft faceg p p p
• 12” Dredge and 8” Dredge in Tandem– GPM = 3,500 + 1,000 = 4,500, , ,– Average % Solids = 8%– Cy/day = 1,200 to 5,000 (dependent on
system uptime)

Dredging Operation Detailsg g p
• 8” Dredge with VicVac™ Attachment– GPM = 1,000– Average % Solids = 2% to 4%g– Coverage = ½ acre/day– Average cut depth per pass = 6”-12”g p p p

Post-Dredging PCB Concentrationsg g
Goal 1: 7.5 ppm immediately following dredgingGoal 2: 0.25 ppm 10 years after dredging

Post-Dredging PCB Concentrationsg g
Goal 1: 7.5 ppm immediately following dredgingGoal 2: 0.25 ppm 10 years after dredging

Post Dredging SWACost edg g S C
• Goal: 7.5 ppm PCBs– Max. Concentration of 40 ppm
• Results: 2.5 ppm PCBsMax Concentration 33 ppm– Max. Concentration 33 ppm
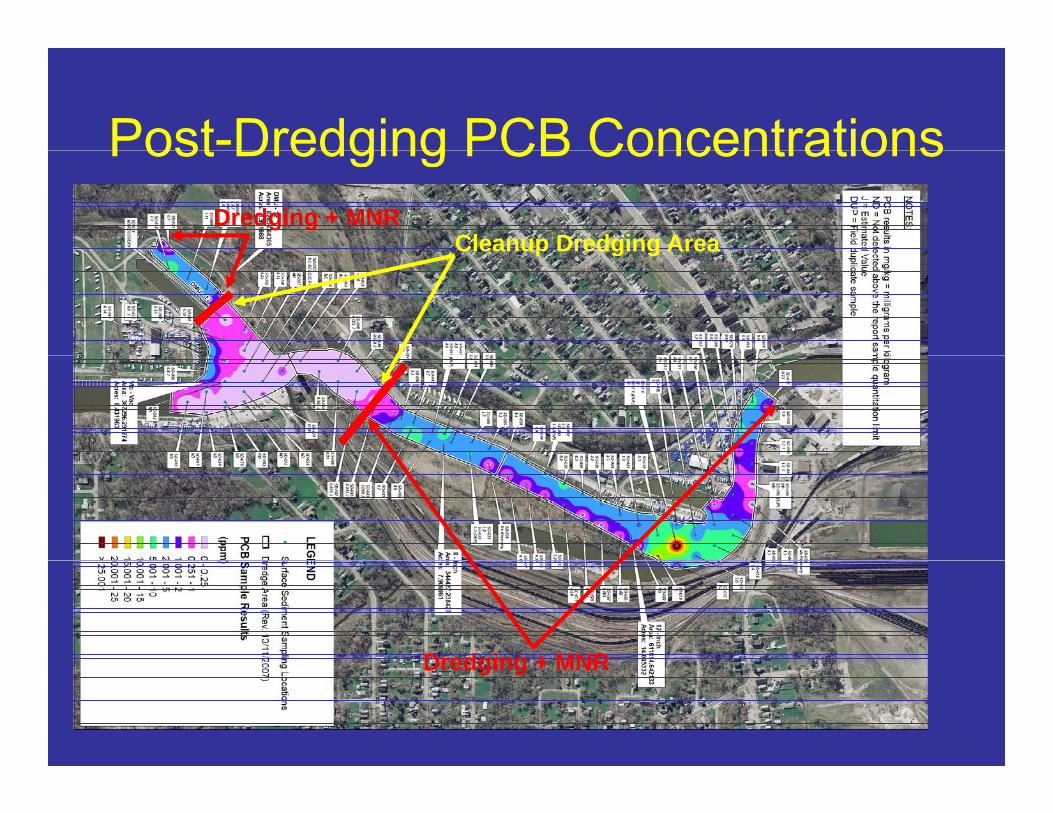
Post-Dredging PCB ConcentrationsPost Dredging PCB Concentrations
Cleanup Dredging AreaDredging + MNR
p g g
Dredging + MNRDredging + MNR

SWAC ComparisonCl D d i A MNR ACleanup Dredging Areas vs. MNR Areas
• MNR Areas– Goal: Dredge to prescribed depth, natural
sedimentation to complete remediationA i t A 18– Approximate Area = 18 acres
– # of Samples = 50Post Dredge PCB SWAC = 3 7 ppm– Post-Dredge PCB SWAC = 3.7 ppm
• Cleanup Dredging Areas with 8” DredgeGoal Remo e all sediment to bedrock– Goal: Remove all sediment to bedrock
– Approximate Area = 10 acres# of Samples = 21– # of Samples = 21
– Post-Dredge PCB SWAC = 0.1 ppm

Dredging: Lessons Learned• Innovations are improving results of
environmental dredging“N it i th th f i ti ”• “Necessity is the mother of invention”
• Use of wiper blades, gatling plate, and root knives reduced impact of debrisknives reduced impact of debris
• Need top notch team/Listen to the dredging expertsp
• Prescribe objectives, not methods• Continuous improvementp• Proper sampling leads to accurate volume
estimates• Set realistic cleanup goals

Transport, Dewatering, Disposal, Water Treatment

Double-Walled Pipeline

December 2005December 2005
CF with geotube bags laid out in preparation for sediment dewatering
August 2006August 2006

Summary of Dewatering & Water Treatment• Equipment
– Primary Treatment• Geotubes (primary removal)
– Anionic and cationic polymers
– Secondary TreatmentSecondary Treatment• Lamella Settlers/Polishing Bag Field
– Poly Aluminum Chloride (PAC)
– Polishing Treatment• Sand Filters• Carbon Filters• Carbon Filters
• CapacityDesigned for 5 000 gpm– Designed for 5,000 gpm
Summary of Water Treatment
• Discharge Limitsg– PCBs = 0.0001 ug/L (monthly average)– Hg = ND (at 0.16 ng/L)g ( g )
• Difficulty meeting this limit• Discharge concentration significantly less than
river water concentrations– TSS = 10 mg/L (monthly average)
• Daily maximum = 20 mg/L

Sediment Dewatering

Mountains of Bagsg

Polymer Quality Control

Sand and Carbon Filter Units
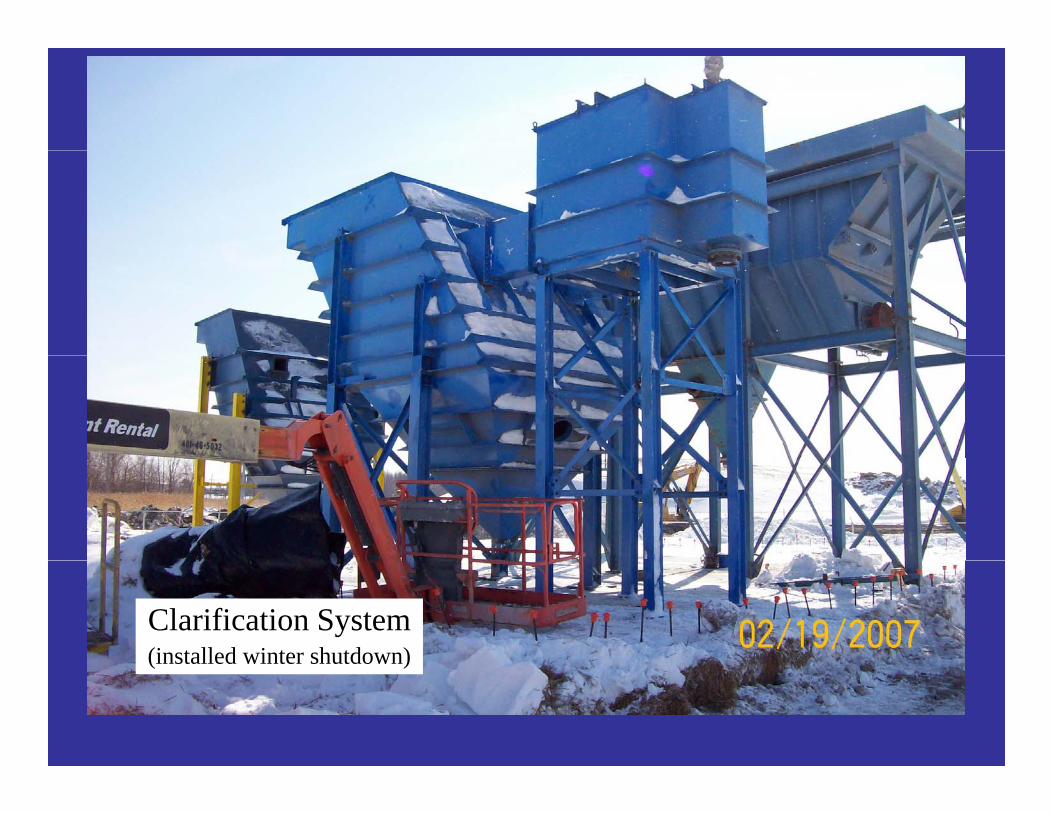
Clarification System(installed winter shutdown)(installed winter shutdown)

Polishing Bag FieldPolishing Bag Field

Dewatering: Lessons Learnedg• Chemistry, Chemistry, Chemistry• Accurate chemistry = better performance• Accurate chemistry = better performance
– Not enough polymer = Poor solids removal– Too much polymer = Plugged bags & Unhappy WTPToo much polymer Plugged bags & Unhappy WTP– Heterogeneity of Sediment Slurry (% solids)– Oil and Grease
• Minimal Breakages (9 bag failures)– Watch flow rates and pressures
• Adequate man power, lighting, training, and conditioning
• Safety/Managing bags for stability

Water Treatment: Lessons Learned• Getting the Chemistry Right
– Substantial problems if chemistry and dose ofSubstantial problems if chemistry and dose of polymer not accurately matched to sediment chemistryS di t t h t i– Sediments are not a homogeneous matrix
• Impacts from Oxidation of IronB f d/ ft t t t l t– Before and/or after treatment plant
• Need enough flexibility to incorporate changes to WTP as requiredto WTP as required– Equipment– SizeSize
• Oil Grease Impacts

Progress, Issues, and Modifications

2006 Progress• Dredging Commenced on September 9,
20062006– Average production <800 cy per day– 62,000 cubic yards dredged, y g– Winter shutdown on November 27, 2006
• Barrier to ConstructionBarrier to Construction– Polymer chemistry/dosing– Water treatment plant performancep p
• Exceedances of TSS limit– Debris

Winter 2006/2007 Modifications• Root knives installed on dredge and at each booster
pumpG• Installed Wipers on Gatling Plate
• Secondary treatment component added to WTP– Lamella settlers– Polish bag field
• Modifications to dewatering/water treatment chemistryCationic polymer added prior to dewatering– Cationic polymer added prior to dewatering
– ACH added to control soluble iron before primary treatment process
• 2nd 8” Dredge mobilized for cleanup operations• 2nd 8 Dredge mobilized for cleanup operations– Articulating dredge head– VicVac™ Attachment
12” D d d 8” D d f d i t i l 12” t t li– 12” Dredge and 8” Dredge feed into single 12” transport line

2007 Progress• Full-scale dredging commenced April 6,
20072007– Average production ~2,400 cy per day
(including cleanup passes) at ~63% project uptime
– 435,000 cubic yards dredged in 2007 D d i d d t O t b 14 2007– Dredging end date: October 14, 2007
• Residual Cover Placement– 2+ acres covered in 7 days
• Remedial work complete

Lessons Learned• Initial production ≠ Ultimate Production• 2007 performance improvements was• 2007 performance improvements was
possible because of lessons learned during 3 month production-scale “pilot” dredging in3 month production scale pilot dredging in 2006
• Adapt and improveAdapt and improve• Dredging and disposal is not cheap ($125
per cubic yard)per cubic yard)• Dredging and disposal is not easy, but it
can be accomplishedcan be accomplished

Questions?Questions?