Embed Size (px)
Citation preview
NHPF Background PaperApril 11, 2003
The U.S. Health Workforce:Definitions, Dollars, and DilemmasKaren Matherlee, Consultant
OVERVIEW — In the labor-intensive U.S. health care industry, the dollarsthat flow to members of the health workforce account in large part for thebillions that public and private insurers, as well as individual consumers, payfor health services each year. An understanding of what the workforce is, whatcoverage and payment procedures govern its members, and what policy con-cerns it raises is crucial to prudent management of public entitlement anddiscretionary health programs. This background paper provides a comprehen-sive view of the structure of the health workforce. It explores public and privateinsurance coverage and payment policies, as well as discretionary grant pro-grams, that govern it. The paper also looks at health workforce concerns: sup-plies of certain types of physicians, health workforce mix, challenges fromcomplementary and alternative medicine, shortages of nurses and pharmacists(and some other practitioners), maldistribution issues, and lack of diversity inresponse to demographic changes. It presents proposals that are on the table toreform the health workforce, at a time when it is demanding greater attentionfrom health policymakers.
2
NHPF Background Paper April 11, 2003
National Health Policy Forum2131 K Street NW, Suite 500Washington DC 20037
202/872-1390202/862-9837 [fax][email protected] [e-mail]www.nhpf.org [web]
Judith Miller JonesDirector
Judith D. MooreCo-Director
Michele BlackPublications Director
NHPF is a nonpartisan education andinformation exchange for federalhealth policymakers.
The U.S. Health Workforce:Definitions, Dollars, and Dilemmas
Health workforce issues have confounded public policymakers for gen-erations, in part because of lack of consensus on government’s role indetermining and regulating the structure and distribution of physicians,nurses, dentists, pharmacists, allied health professionals, and other healthworkers. Federal and state governments face significant challenges indrawing clear pictures of the national health workforce as well as indepicting regional and state profiles. This is due in part to varying defi-nitions, some narrow and some broad, of workforce composition and inpart to the multiplicity of data sources, such as the Department of La-bor, Department of Health and Human Services (DHHS), and numer-ous private organizations.
Public and private coverage and payment policies relating to members ofthe health workforce tend to be physician-based, radiating out to othertypes of practitioners. For example, allopathic and osteopathic physicians(those with M.D. and D.O. degrees, respectively) generally can bill theMedicare program directly, but the right to do so varies for other practi-tioners. In centering on physicians, the federal Medicare program seemsto set the tone for other payers—both Medicaid and private payers—although Medicare's coverage and payment streams can be difficult tofollow. This is mainly due to the program's subsets of Part A, Part B, andMedicare+Choice providers—facilities and practitioners—and variety ofpayment systems. For example, in Part B, there is a division between“direct billing” and “billing incident to physician services,” dependingupon who provides care to the Medicare beneficiary. Medicaid, with itsprovider-centered mandatory and optional services and its myriad con-tractual arrangements with private insurers and health plans, also pre-sents an intricate pathway for health workforce researchers to follow.
While federal payments to members of the health workforce for deliv-ery of services are significantly greater than the amounts spent onworkforce training, health professions financing cannot be ignored.Medicare graduate medical education (GME) funds, for the most part,have not been directed toward influencing health workforce policy. Dis-cretionary Public Health Service Act Title VII and VIII funds have, but inrelatively small amounts under the threat of reductions in their appro-priations from year to year. Medicaid GME tends to target specific healthworkforce goals in those states that provide it. Private payers have beeninconsistent, given the wide variation in coverage and payment policiesamong different health insurers and health plans and even differencesin contracts for the same insurer or plan.
3
NHPF Background Paper April 11, 2003
With its composition and behavior largely subject to marketplace condi-tions, the health workforce has changed significantly in recent years. Thenumber of practitioners other than physicians has grown rapidly, influ-encing patterns of care. Complementary and alternative medicine (CAM)has expanded significantly, taking a rising share of mostly consumerdollars. At the same time, marked shortages of certain health profes-sionals—most conspicuously, nurses and pharmacists—have occurred, put-ting pressure on an already maldistributed health workforce. Moreover,as the U.S. population has become ever more diverse, the health workforcereflects relatively small percentages of underrepresented minorities.
For those who believe that better planning and coordination of the healthworkforce is essential to a more effective health system—or even to therudiments of a health system—fragmentation and compartmentaliza-tion of various workforce segments make reform difficult. Policy changetends to come at a slow pace, affecting individual segments, such asprimary care physicians, categories of advanced practice nurses, or in-ternational medical graduates (IMGs). Nonetheless, some comprehen-sive proposals have been put on the table, waiting for a renewed com-mitment on the part of the administration and Congress to address healthworkforce policy.
DEFINITIONS: DESCRIPTION OFTHE HEALTH WORKFORCE
Attempts at Definition: From Limited to Broad
On the surface, the term “health workforce” seems simple enough. Itrefers to health professionals—for example, physicians, nurses, dentists,and pharmacists—who work in health service settings. Depending uponwho is counting, the term may also encompass health professionals whowork in other environments, such as educational institutions, researchorganizations, and government agencies. It may even include otherswho work in health care settings, such as administrators, public healthmonitors, medical records personnel, and laboratory assistants; this cat-egory may even include support workers who do not immediately cometo mind when one thinks of health care.
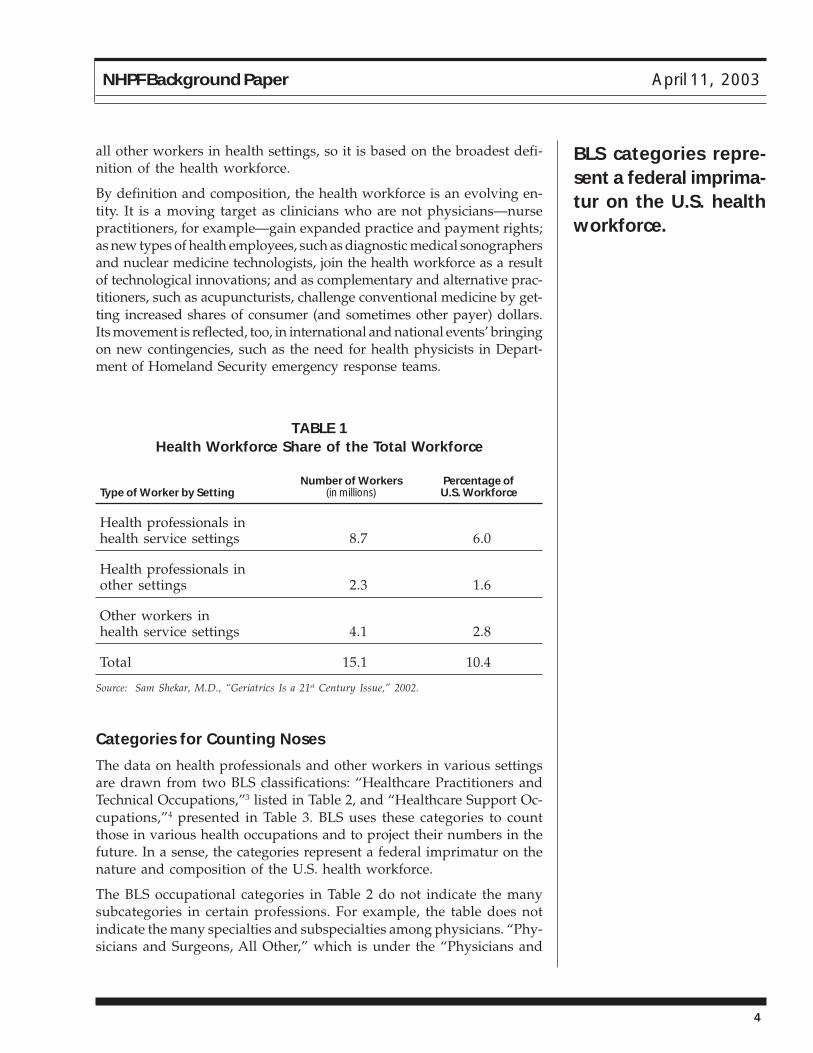
The three layers of definition are reflected in Bureau of Labor Statistics(BLS) data for fiscal year (FY) 2001 categorizing 15.1 million (10.4 per-cent) of the nation’s 145.6 million workers as health professionals orother health workers employed in health service or other settings.1 Thedata support the claim last year by DHHS Assistant Surgeon GeneralSam Shekar, M.D., that “more than one in ten Americans works in healthcare or is a health professional.”2 The DHHS totals and percentages—drawn from the BLS statistics—appear in Table 1. It is important to notethat the 15.1 million total includes not only health professionals but also
By definition and com-position, the healthworkforce is an evolv-ing entity.
4
NHPF Background Paper April 11, 2003
all other workers in health settings, so it is based on the broadest defi-nition of the health workforce.
By definition and composition, the health workforce is an evolving en-tity. It is a moving target as clinicians who are not physicians—nursepractitioners, for example—gain expanded practice and payment rights;as new types of health employees, such as diagnostic medical sonographersand nuclear medicine technologists, join the health workforce as a resultof technological innovations; and as complementary and alternative prac-titioners, such as acupuncturists, challenge conventional medicine by get-ting increased shares of consumer (and sometimes other payer) dollars.Its movement is reflected, too, in international and national events’ bringingon new contingencies, such as the need for health physicists in Depart-ment of Homeland Security emergency response teams.
TABLE 1Health Workforce Share of the Total Workforce
Number of Workers Percentage ofType of Worker by Setting (in millions) U.S. Workforce
Health professionals inhealth service settings 8.7 6.0
Health professionals inother settings 2.3 1.6
Other workers inhealth service settings 4.1 2.8
Total 15.1 10.4
Source: Sam Shekar, M.D., “Geriatrics Is a 21st Century Issue,” 2002.
Categories for Counting Noses
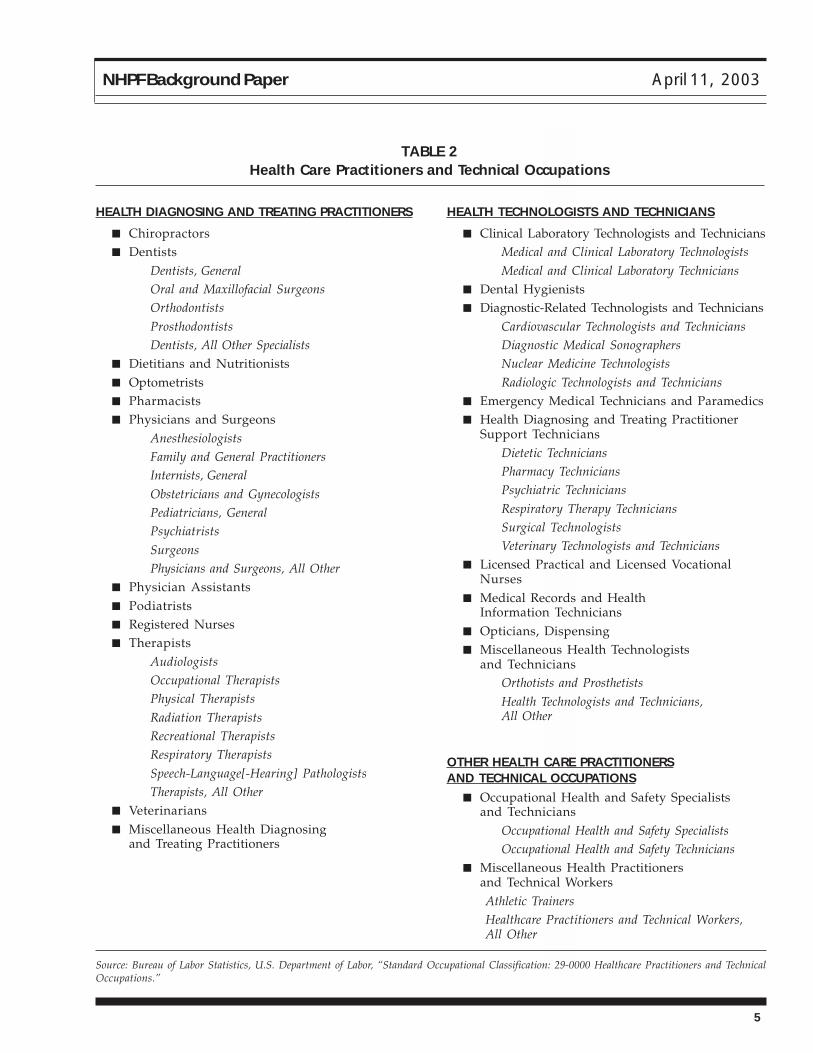
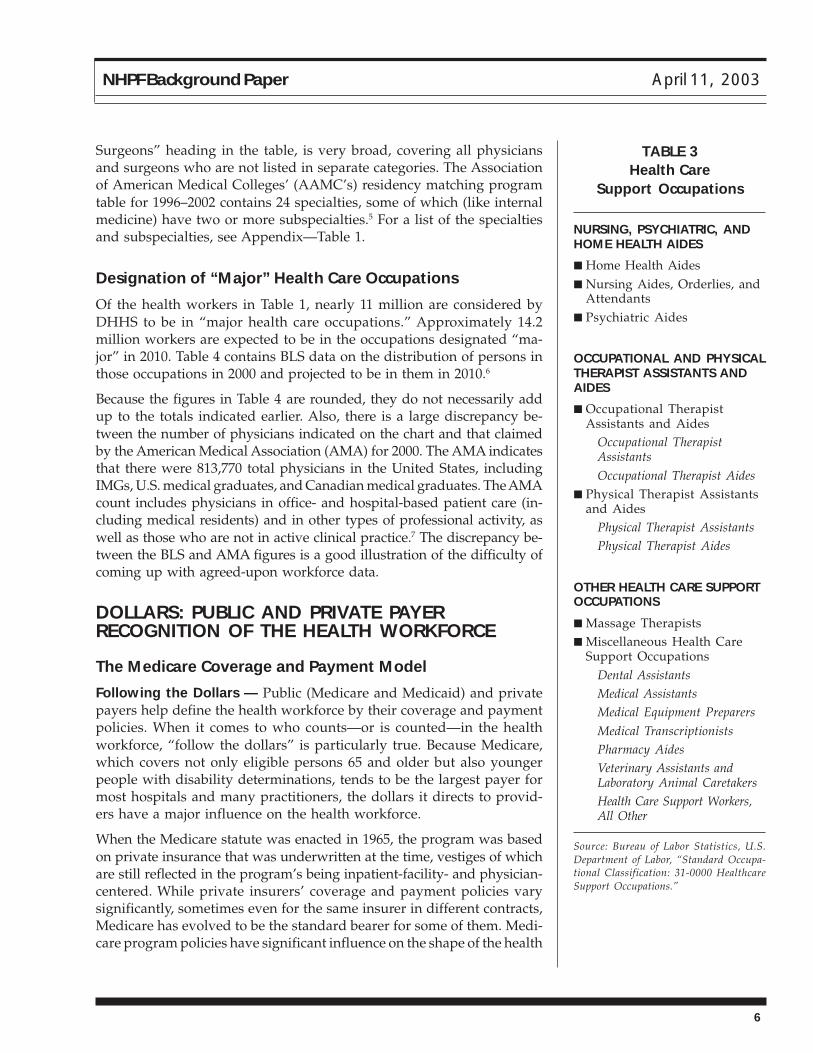
The data on health professionals and other workers in various settingsare drawn from two BLS classifications: “Healthcare Practitioners andTechnical Occupations,”3 listed in Table 2, and “Healthcare Support Oc-cupations,”4 presented in Table 3. BLS uses these categories to countthose in various health occupations and to project their numbers in thefuture. In a sense, the categories represent a federal imprimatur on thenature and composition of the U.S. health workforce.
The BLS occupational categories in Table 2 do not indicate the manysubcategories in certain professions. For example, the table does notindicate the many specialties and subspecialties among physicians. “Phy-sicians and Surgeons, All Other,” which is under the “Physicians and
BLS categories repre-sent a federal imprima-tur on the U.S. healthworkforce.
5
NHPF Background Paper April 11, 2003
TABLE 2Health Care Practitioners and Technical Occupations
HEALTH DIAGNOSING AND TREATING PRACTITIONERS
■ Chiropractors■ Dentists
Dentists, GeneralOral and Maxillofacial SurgeonsOrthodontistsProsthodontistsDentists, All Other Specialists
■ Dietitians and Nutritionists■ Optometrists■ Pharmacists■ Physicians and Surgeons
AnesthesiologistsFamily and General PractitionersInternists, GeneralObstetricians and GynecologistsPediatricians, GeneralPsychiatristsSurgeonsPhysicians and Surgeons, All Other
■ Physician Assistants■ Podiatrists■ Registered Nurses■ Therapists
AudiologistsOccupational TherapistsPhysical TherapistsRadiation TherapistsRecreational TherapistsRespiratory TherapistsSpeech-Language[-Hearing] PathologistsTherapists, All Other
■ Veterinarians■ Miscellaneous Health Diagnosing
and Treating Practitioners
Source: Bureau of Labor Statistics, U.S. Department of Labor, “Standard Occupational Classification: 29-0000 Healthcare Practitioners and TechnicalOccupations.”
HEALTH TECHNOLOGISTS AND TECHNICIANS
■ Clinical Laboratory Technologists and TechniciansMedical and Clinical Laboratory TechnologistsMedical and Clinical Laboratory Technicians
■ Dental Hygienists■ Diagnostic-Related Technologists and Technicians
Cardiovascular Technologists and TechniciansDiagnostic Medical SonographersNuclear Medicine TechnologistsRadiologic Technologists and Technicians
■ Emergency Medical Technicians and Paramedics■ Health Diagnosing and Treating Practitioner
Support TechniciansDietetic TechniciansPharmacy TechniciansPsychiatric TechniciansRespiratory Therapy TechniciansSurgical TechnologistsVeterinary Technologists and Technicians
■ Licensed Practical and Licensed VocationalNurses
■ Medical Records and HealthInformation Technicians
■ Opticians, Dispensing■ Miscellaneous Health Technologists
and TechniciansOrthotists and ProsthetistsHealth Technologists and Technicians,All Other
OTHER HEALTH CARE PRACTITIONERSAND TECHNICAL OCCUPATIONS
■ Occupational Health and Safety Specialistsand Technicians
Occupational Health and Safety SpecialistsOccupational Health and Safety Technicians
■ Miscellaneous Health Practitionersand Technical WorkersAthletic TrainersHealthcare Practitioners and Technical Workers,All Other
6
NHPF Background Paper April 11, 2003
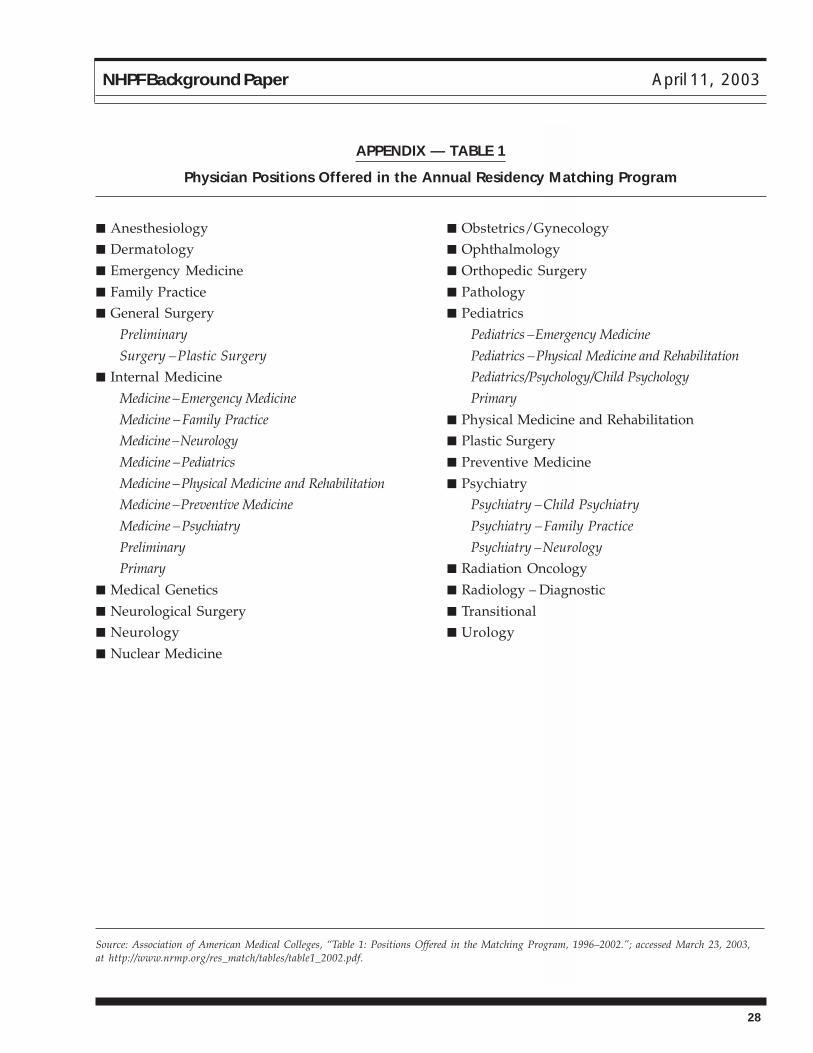
Surgeons” heading in the table, is very broad, covering all physiciansand surgeons who are not listed in separate categories. The Associationof American Medical Colleges’ (AAMC’s) residency matching programtable for 1996–2002 contains 24 specialties, some of which (like internalmedicine) have two or more subspecialties.5 For a list of the specialtiesand subspecialties, see Appendix—Table 1.
Designation of “Major” Health Care Occupations
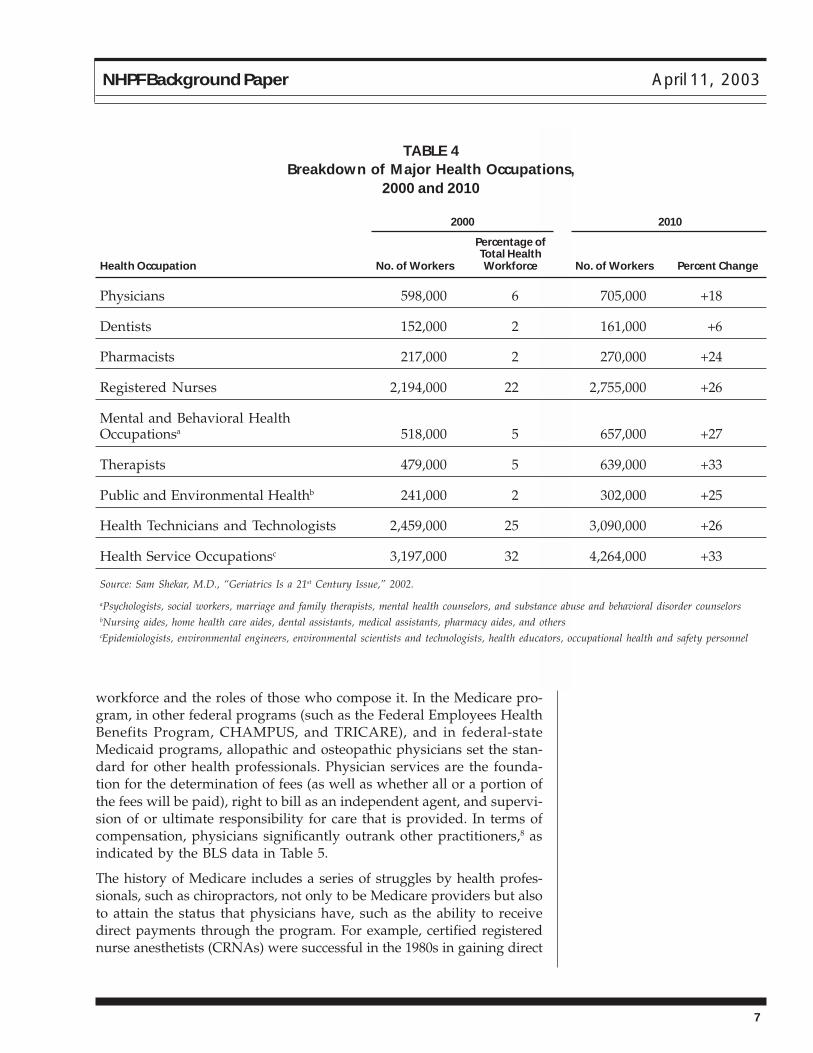
Of the health workers in Table 1, nearly 11 million are considered byDHHS to be in “major health care occupations.” Approximately 14.2million workers are expected to be in the occupations designated “ma-jor” in 2010. Table 4 contains BLS data on the distribution of persons inthose occupations in 2000 and projected to be in them in 2010.6
Because the figures in Table 4 are rounded, they do not necessarily addup to the totals indicated earlier. Also, there is a large discrepancy be-tween the number of physicians indicated on the chart and that claimedby the American Medical Association (AMA) for 2000. The AMA indicatesthat there were 813,770 total physicians in the United States, includingIMGs, U.S. medical graduates, and Canadian medical graduates. The AMAcount includes physicians in office- and hospital-based patient care (in-cluding medical residents) and in other types of professional activity, aswell as those who are not in active clinical practice.7 The discrepancy be-tween the BLS and AMA figures is a good illustration of the difficulty ofcoming up with agreed-upon workforce data.
DOLLARS: PUBLIC AND PRIVATE PAYERRECOGNITION OF THE HEALTH WORKFORCE
The Medicare Coverage and Payment Model
Following the Dollars — Public (Medicare and Medicaid) and privatepayers help define the health workforce by their coverage and paymentpolicies. When it comes to who counts—or is counted—in the healthworkforce, “follow the dollars” is particularly true. Because Medicare,which covers not only eligible persons 65 and older but also youngerpeople with disability determinations, tends to be the largest payer formost hospitals and many practitioners, the dollars it directs to provid-ers have a major influence on the health workforce.
When the Medicare statute was enacted in 1965, the program was basedon private insurance that was underwritten at the time, vestiges of whichare still reflected in the program’s being inpatient-facility- and physician-centered. While private insurers’ coverage and payment policies varysignificantly, sometimes even for the same insurer in different contracts,Medicare has evolved to be the standard bearer for some of them. Medi-care program policies have significant influence on the shape of the health
TABLE 3Health Care
Support Occupations
NURSING, PSYCHIATRIC, ANDHOME HEALTH AIDES
■ Home Health Aides■ Nursing Aides, Orderlies, and
Attendants■ Psychiatric Aides
OCCUPATIONAL AND PHYSICALTHERAPIST ASSISTANTS ANDAIDES
■ Occupational TherapistAssistants and Aides
Occupational TherapistAssistantsOccupational Therapist Aides
■ Physical Therapist Assistantsand Aides
Physical Therapist AssistantsPhysical Therapist Aides
OTHER HEALTH CARE SUPPORTOCCUPATIONS
■ Massage Therapists■ Miscellaneous Health Care
Support OccupationsDental AssistantsMedical AssistantsMedical Equipment PreparersMedical TranscriptionistsPharmacy AidesVeterinary Assistants andLaboratory Animal CaretakersHealth Care Support Workers,All Other
Source: Bureau of Labor Statistics, U.S.Department of Labor, “Standard Occupa-tional Classification: 31-0000 HealthcareSupport Occupations.”
7
NHPF Background Paper April 11, 2003
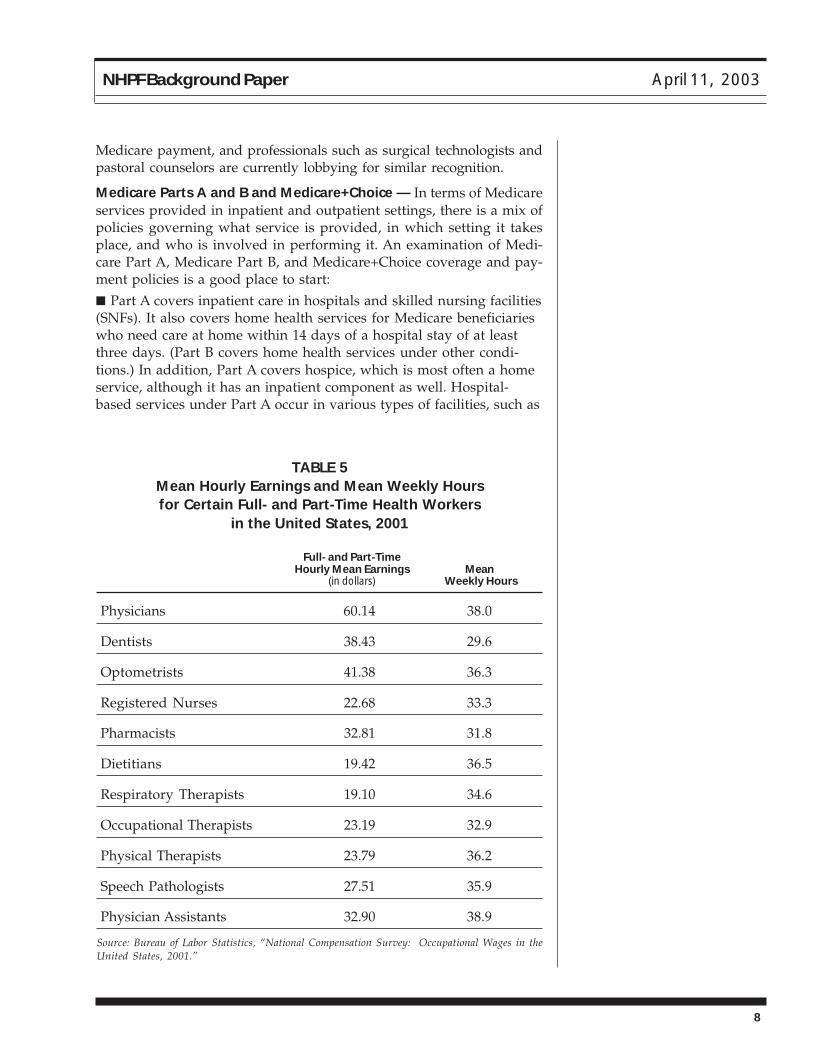
workforce and the roles of those who compose it. In the Medicare pro-gram, in other federal programs (such as the Federal Employees HealthBenefits Program, CHAMPUS, and TRICARE), and in federal-stateMedicaid programs, allopathic and osteopathic physicians set the stan-dard for other health professionals. Physician services are the founda-tion for the determination of fees (as well as whether all or a portion ofthe fees will be paid), right to bill as an independent agent, and supervi-sion of or ultimate responsibility for care that is provided. In terms ofcompensation, physicians significantly outrank other practitioners,8 asindicated by the BLS data in Table 5.
The history of Medicare includes a series of struggles by health profes-sionals, such as chiropractors, not only to be Medicare providers but alsoto attain the status that physicians have, such as the ability to receivedirect payments through the program. For example, certified registerednurse anesthetists (CRNAs) were successful in the 1980s in gaining direct
TABLE 4Breakdown of Major Health Occupations,
2000 and 2010
2000 2010
Percentage ofTotal Health
Health Occupation No. of Workers Workforce No. of Workers Percent Change
Physicians 598,000 6 705,000 +18
Dentists 152,000 2 161,000 +6
Pharmacists 217,000 2 270,000 +24
Registered Nurses 2,194,000 22 2,755,000 +26
Mental and Behavioral HealthOccupationsa 518,000 5 657,000 +27
Therapists 479,000 5 639,000 +33
Public and Environmental Healthb 241,000 2 302,000 +25
Health Technicians and Technologists 2,459,000 25 3,090,000 +26
Health Service Occupationsc 3,197,000 32 4,264,000 +33
Source: Sam Shekar, M.D., “Geriatrics Is a 21st Century Issue,” 2002.
aPsychologists, social workers, marriage and family therapists, mental health counselors, and substance abuse and behavioral disorder counselorsbNursing aides, home health care aides, dental assistants, medical assistants, pharmacy aides, and otherscEpidemiologists, environmental engineers, environmental scientists and technologists, health educators, occupational health and safety personnel
8
NHPF Background Paper April 11, 2003
Medicare payment, and professionals such as surgical technologists andpastoral counselors are currently lobbying for similar recognition.
Medicare Parts A and B and Medicare+Choice — In terms of Medicareservices provided in inpatient and outpatient settings, there is a mix ofpolicies governing what service is provided, in which setting it takesplace, and who is involved in performing it. An examination of Medi-care Part A, Medicare Part B, and Medicare+Choice coverage and pay-ment policies is a good place to start:
■ Part A covers inpatient care in hospitals and skilled nursing facilities(SNFs). It also covers home health services for Medicare beneficiarieswho need care at home within 14 days of a hospital stay of at leastthree days. (Part B covers home health services under other condi-tions.) In addition, Part A covers hospice, which is most often a homeservice, although it has an inpatient component as well. Hospital-based services under Part A occur in various types of facilities, such as
TABLE 5Mean Hourly Earnings and Mean Weekly Hoursfor Certain Full- and Part-Time Health Workers
in the United States, 2001
Full- and Part-TimeHourly Mean Earnings Mean
(in dollars) Weekly Hours
Physicians 60.14 38.0
Dentists 38.43 29.6
Optometrists 41.38 36.3
Registered Nurses 22.68 33.3
Pharmacists 32.81 31.8
Dietitians 19.42 36.5
Respiratory Therapists 19.10 34.6
Occupational Therapists 23.19 32.9
Physical Therapists 23.79 36.2
Speech Pathologists 27.51 35.9
Physician Assistants 32.90 38.9
Source: Bureau of Labor Statistics, “National Compensation Survey: Occupational Wages in theUnited States, 2001.”
9
NHPF Background Paper April 11, 2003
community and public hospitals, children’s hospitals, “specialty”hospitals (for example, freestanding and distinct-part psychiatric andmedical rehabilitation facilities), and critical-access hospitals. In tradi-tional Medicare, dental services are excluded from the program, asidefrom limited services provided in inpatient hospitals under Part A.9
■ Part B covers outpatient care: physician services, medical rehabilita-tion services (generally provided by occupational therapists [OTs],physical therapists [PTs], and speech-hearing-language pathologists, inaddition to specialty physicians), behavioral health services (includingthose offered by clinical psychologists and clinical social workers inaddition to psychiatrists), and, without a pre-hospitalization require-ment, home health care (intermittent skilled, home aide, and medicalequipment services). Ambulatory surgery and clinical laboratoryservices also fall under Part B, as do chiropractic care (limited tomanipulation of the spine to correct a sublaxation), nutritionists’services for Medicare beneficiaries with diabetes and kidney disease,and services of health professionals such as nurse practitioners (NPs)and physician assistants (PAs).10
■ Medicare+Choice, Medicare’s managed care program, requireshealth plans to offer Part A and Part B services and gives them theflexibility to add others, such as an outpatient prescription drug ordental benefit, perhaps at an additional premium.11 Because healthplans receive payments from the Medicare program for the provisionof bundled services to enrolled Medicare beneficiaries, they pay—on asalary or contractual basis—physicians and other practitioners for theservices they offer, so that the clinicians do not deal directly withMedicare carriers.
Billing: Direct and Incident to Physician’s Services — Certain practi-tioners can receive direct payments from Medicare and others cannot.Two Medicare Payment Advisory Commission (MedPAC) reports to Con-gress, Medicare Payment to Advanced Practice Nurses and Physician Assis-tants,12 and Medicare Coverage of Nonphysician Practitioners,13 both issued inJune 2002, offer descriptions of the coverage and payment policies.
Most Part A services—inpatient hospital care as well as SNF, inpatientmedical rehabilitation, Part A home health, and children’s hospital ser-vices—are under prospective payment systems, so that inpatient orga-nizations receive facility payments that help to finance their salaried em-ployees. Physicians and some other practitioners bill separately, underPart B, for the services they provide in settings covered under Part A.
Part B services are billed in two ways, depending upon the status of thepractitioners:14
■ Direct billing—Physicians bill directly under their own billingnumbers. Subject to a fee schedule oriented to resource-based practiceexpenses,15 they receive 100 percent of the physician fee. OTs, PTs, andclinical psychologists also can bill directly (under their own billing
Part B services are billedin two ways, dependingupon the status of thepractitioners.
10
NHPF Background Paper April 11, 2003
numbers) for services within their legal scopes of practice and receive100 percent of the physician fee. CRNAs also qualify for direct pay-ment—at 100 percent if they are not medically directed and at 50percent if they are, in which case the supervising anesthesiologist getsthe other half of the fee. NPs and clinical nurse specialists (CNSs)receive 75 percent of the physician fee when they provide serviceswithin their legal scopes of practice in hospitals and 85 percent of thefee schedule amount when they furnish such services in other settings.Certified nurse midwives (CNMs) receive 65 percent of the physicianfee. PAs receive 85 percent of the physician fee.
■ Billing incident to physician services—Physicians bill directly (undertheir billing numbers), at 100 percent of the fee schedule, for servicesthat are provided by other types of practitioners, even when thosepractitioners were the actual providers of the services. This occurswhen the practitioners—NPs, CNSs, CNMs, and PAs—are the physi-cians’ employees and under their direct supervision. Other stipulationsthat govern billing incident to physician services include initiation of thecourse of treatment by the physician and his or her presence in theoffice or clinic while the services are provided.
As MedPAC points out in its two reports, several health disciplines arepetitioning Congress for separate reimbursement from Medicare. Theyinclude orthopedic physician assistants (OPAs), who are licensed in threestates; surgical technologists (as first assistants in surgery), who arelicensed in one state; marriage and family therapists, who are licensedor certified in 44 states; licensed professional clinical counselors or li-censed mental health counselors, who are recognized in 45 states andthe District of Columbia; and pastoral counselors, who are licensed orcertified in 6 states but licensed under another counseling discipline in37 states. State laws determine scopes of practice for such practitioners.16
The Role of Medicare GME — Medicare GME funding, which goes toteaching hospitals, is under Part A. It has two parts: direct and indirect.Direct GME funds cover allopathic, osteopathic, podiatric, and dentalresidents’ salaries and fringe benefits, allocated hospital overhead con-nected with training programs, and other costs (such as teaching physi-cians’ supervisory costs).
Indirect GME dollars, added to inpatient prospective payment diagno-sis-related group rates, recognize the added costs teaching hospitalsincur as a result of their teaching programs. Indirect medical educationpayments began in FY 1984, as part of the new inpatient prospectivepayment system (PPS). Add-ons to the diagnosis-related-group ratesupon which the inpatient PPS operates, indirect payments are currentlypaid at the rate of 5.5 percent per 0.1 IRB.
There are some nursing and allied health expenditures in the MedicareGME program, but they are modest amounts (approximately $300 mil-lion), given estimated Medicare GME outlays of $7.8 billion in 2000. The
Several health disci-plines are petitioningCongress for separatereimbursement fromMedicare.
11
NHPF Background Paper April 11, 2003
number of physician residents per teaching hospital was capped effec-tive the start of each hospital’s 1996 fiscal year.
Medicaid Coverage and Payment Policies
As a federal-state entitlement program for certain persons and fami-lies with low incomes and resources, Medicaid allows states a greatdeal of flexibility to administer their own plans. However, the federalgovernment, in return for matching funds, has certain requirements.For example, “a state’s Medicaid program must offer medical assistancefor certain basic services to most categorically needy populations.” Theservices include the following:
inpatient hospital services; outpatient hospital services; prenatal care;vaccines for children; physician services; nursing facility services forpersons aged 21 or older; family planning services and supplies; ruralhealth clinic services; home health care for persons eligible for skilled-nursing services; laboratory and x-ray services; pediatric and familyNP services; nurse-midwife services; federally qualified health centerservices and ambulatory services of an FQHC that would be availablein other settings; and early periodic screening, diagnostic, and treat-ment services for children under age 21.17
The federal government also provides matching funds for certain op-tional services. Following are some of the most common services amongthe 34 that are approved:
Diagnostic services, clinic services, intermediate-care facilities for thementally retarded, prescribed drugs and prosthetic devices, optometristservices and eyeglasses, nursing facility services for children under 21,transportation services, rehabilitation and PT services, and home andcommunity-based care to certain persons with chronic impairments.18
Under federal-state Medicaid arrangements, states are responsible forpurchasing health services and paying health providers under their Med-icaid programs, although the trend has been for them to contract withhealth plans under managed care arrangements. Some states also haveundertaken initiatives to give different types of practitioners incentivesto select certain specialty areas and practice locations. Given individualstates’ considerable leeway in administration of their Medicaid programs,there is a great deal of variation from state to state on practitioners’legal scopes of practice and payment rates. As with Medicare, physi-cians set the standard.
Currently, all state Medicaid programs cover medical services providedby NPs, CNMs, or PAs in their fee-for-service or managed care planseither at the same rate or a lower rate than that paid to physicians. Pay-ment for NPs ranges from a low of 60 percent of the physician fee inArizona to 100 percent in at least 19 states. For CNMs, payments rangefrom a low of 70 percent of the physician fee schedule in Illinois andNew Jersey to 100 percent in 26 other states. Reimbursement rates for
Some states have Med-icaid GME programsthat direct training sup-port to certain types ofpractitioners.
12
NHPF Background Paper April 11, 2003
PAs range from 75 percent of the physician fee in Kentucky and NorthDakota to 100 percent in 32 states. Four states require a physician on sitewhen a PA provides a service before Medicaid will pay for that service.19
Some states also have Medicaid GME programs that direct training sup-port to certain types of practitioners, such as primary-care physicians ornurses. As indicated by Tim Henderson, director of the National Con-ference of State Legislatures’ Institute for Primary Care and WorkforceAnalysis, they include the following:■ Georgia, which uses intergovernmental transfers to draw downadditional federal matching funds to help support the clinical trainingof medical residents affiliated with Area Health Education Centers(AHECs), which focus on rural and underserved communities.
■ Michigan, which has a primary care pool directed at training enter-ing physicians in the fields of general practice, family practice, preven-tive medicine, obstetrics, and geriatrics, and also has initiatives forthird- and fourth-year dental students and for psychiatric residents incommunity mental health settings.
■ Tennessee, which has a program to provide primary care medicaltraining in community sites.
■ Utah, which has developed a Medicare GME pool for medical,dental, and podiatric graduate training.
■ Minnesota, which has a trust fund to support medical, dental,advanced practice nursing, and pharmacy training programs, amongother activities.
■ New York, which has a funding pool designed to reduce its numberof medical residents, increase its emphasis on primary care, andincrease its numbers of underrepresented minorities and practitionerstrained in ambulatory settings.20
Separate from Medicaid, Arkansas, Colorado, and Texas use state ap-propriations to address certain health workforce goals. Arkansas andColorado support family practice residencies, while Texas has programsfor family practice, general internal medicine, and general pediatrics.21
Three of 40 states that appropriate general funds for family medicinetraining, they are singled out because of special innovations in using thefunds to address state workforce needs.
Federal Discretionary Health Professions Funds
In addition to the federal Medicare GME entitlement funds spent onhealth professions training, there are discretionary health professionsfunds that are subject to the congressional authorization and appropria-tions processes. Two of them are Titles VII and VIII of the Public HealthService Act. Title VII covers medical, dental, and allied health and TitleVIII includes general and advanced practice nursing. The following arekey initiatives in the two titles:
Titles VII and VIII of thePublic Health ServiceAct provide discretion-ary health professionsfunds.
13
NHPF Background Paper April 11, 2003
■ Minority and Disadvantaged Health Professions—To increase minor-ity representation in the health professions in order to improve healthcare access to indigent populations and to areas that are medicallyunderserved. Provides support to health professions schools and schol-arships to disadvantaged and minority students who attend a healthprofessions or nursing school. Includes Centers of Excellence programs,the Health Careers Opportunity Program, the Scholarship for Disadvan-taged Students program, and the Faculty Loan Repayment Program.
■ Primary Care Medicine and Dentistry—To promote the training ofprimary-care practitioners, including general pediatricians, generalistsin internal medicine, family physicians, dentists, and PAs.
■ Interdisciplinary, Community-Based Linkages—To provide clinicaltraining opportunities to health professions and nursing students inspecific areas. Includes the AHEC program; the Health Education andTraining Center program, which centers on the border between theUnited States and Mexico; and the Geriatrics Health ProfessionsProgram, which supports geriatric faculty fellowships, entry of geriat-ric physicians into academic medicine, and geriatric training in healthprofessions schools and facilities.
■ Quentin N. Burdick Program for Rural Interdisciplinary Training—To improve access to rural health care by strengthening the distribu-tion, diversity, and quality of health care practitioners through col-laboration among academic institutions, rural health care agencies,and health care providers.
■ National Center for Health Workforce Analysis—To collect andanalyze health professions data, assist state and local workforceplanning efforts, conduct workforce issues analyses, evaluate healthprofessions training programs, and develop tools for and conductresearch on the health workforce. Includes not only the nationalcenter, the only federal effort that focuses on health workforce supplyand demand and related issues, but also—through cost-sharingagreements with DHHS’ Health Resources and Services Administra-tion (HRSA)—the Regional Centers for Health Workforce Studies atthe University of California at San Francisco, State University of NewYork at Albany, University of Illinois at Chicago, University of Wash-ington, and University of Texas.
■ Public Health Workforce Development—To offer support to preven-tive medicine residencies and dental public health, public healthtraining centers, public health traineeships, and health administrationtraineeships and special projects.
■ Nurse Education Act/Nursing Workforce Development—To fundnursing schools to train advanced practice nurses, including primarycare and non-primary-care NPs, CNMs, CNNs, public health nurses,nurse administrators, and CRNAs. Also to provide workforce diver-sity grants to increase nursing education opportunities for disadvan-taged students, including underrepresented minorities.
There are also signifi-cant discretionary fundsfor the health profes-sions in the VA budget.
14
NHPF Background Paper April 11, 2003
■ Student Financial Assistance—To provide loans to needy anddisadvantaged medical and nursing students.22
There are also significant discretionary funds for the health professions inthe Department of Veterans Affairs (VA) and Department of Defense (DoD)budgets. The VA is the largest single provider of clinical health services inthe nation and is second only to CMS (which administers Medicare GME)in funding health professions education. Approximately 76,000 trainees(medical, dental, and other residents and clinical psychology interns, aswell as nursing, OT, PT, and many other health professionals) receivetraining at the VA’s approximately 140 medical centers and 800 outpatientclinics each year. Of the 100,000 physician residents trained in the UnitedStates each year, 28,000 rotate through the VA. The air force, army, andnavy within DoD also have health professions programs. The navy, forexample, offers approximately 900 training positions through more than50 in-service residency and fellowship programs.
Private Payers’ Policies
Because of the variation from one private insurer or health plan to an-other and among different contracts for a given payer, private coverageand payment policies relating to members of the health workforce tendto be all over the map. With physicians setting the standard, some pay-ers follow the Medicare model, some recognize and pay practitionersother than physicians anywhere from 100 percent to a lesser amount ofthe physician fee, and some simply do not recognize practitioners whoare not physicians.
Health insurance options provided to employees by employers or of-fered on Web sites such as www.eHealthInsurance.com tend to havephysician directories available (for health maintenance organization andpreferred provider plans) and make reference to “eligible providers.”Providers who are not physicians are often subject to physician referral,with restrictions detailed in the definitions and exclusions of the plan.For example, in one plan, “health care practitioner” is defined in thefollowing way: “means only a licensed physician, PA, NP, PT, OT, speechtherapist, chiropractor or mental health provider acting within the scopeof his or her license.”23
The same plan defines “home health aide,” “nurse,” “physician,” and“therapist,” as follows:
Home Health Aide: A person whose main function is to provide post-hospital health aide services. If state or local licensing or certification isrequired, the person must be licensed or certified as a home health aidewhere the service is performed. If licensing or certification is not required,any person who meets the minimum training qualifications recognizedby the National Home Caring Council, National League of Nursing, orCenter for Medicare and Medicaid Services will be considered a home
Private coverage andpayment policies relat-ing to members of thehealth workforce tendto be all over the map.
15
NHPF Background Paper April 11, 2003
health aide, provided that [he or she is] employed through a licensed orMedicare-certified home health care agency.
Nurse: For the purposes of the Post-Hospital Benefit, a professional nurselegally designated ‘RN’ (registered nurse) or ‘LPN’ (licensed practicalnurse) who, where licensing is required, holds a valid license from thestate in which the nursing service is performed. ‘LPN’ shall include alicensed vocational nurse (‘LVN’) and any other similarly designatednurse in those jurisdictions in which a professional nurse is designatedas other than an ‘LPN’ and for whom licensing is required.
Physician: A licensed doctor of medicine or osteopathy acting withinthe scope of his or her license.
Therapist: A licensed PT, OT, or speech therapist who is acting withinthe scope of his or her license where the services are performed.24
Many states have enacted laws mandating that private payers coverservices provided by practitioners other than physicians, such as NPs,CNMs, and CRNAs. Moreover, some states “have enacted ‘any willingprovider’ laws and other states are considering them. These laws gen-erally prohibit health care plans from denying access to any licensedprovider whose training and scope of practice” include the services cov-ered by the health plan and who “is willing to meet the terms and con-ditions of the plan.” In addition, any-willing-provider bills have beenintroduced in Congress, but none has been enacted.25 By a unanimousvote, the Supreme Court on April 2 of this year ruled that states mayrequire managed care plans to accept all doctors, hospitals, and otherproviders into their networks, as long as the providers agree to theinsurer's terms of service (Kentucky Association of Health Plans v. Miller).
DILEMMAS: SOME HEALTH WORKFORCECHALLENGESHealth care policy has seesawed over the years between governmentregulation (or attempts to regulate) the size, composition, and distribu-tion of the health workforce and market-oriented approaches of supplyand demand. Efforts to shape the health workforce have focused mainlyon supplies of physicians and nurses, not only through Medicare GMEand state Medicaid and other support but also through provisions ofTitles VII and VIII.
The strongest attempt to regulate the health workforce—in this case,physicians—came during the Clinton administration, in the ill-fated 1994Health Security Act proposal. The proposal would have placed “strictlimits on the number of physicians permitted to enter GME programs,controlled entry into each specialty, and effectively shut the door to allbut a few IMGs.”26
While the debate continues about the extent to which the federal gov-ernment should inject itself into workforce issues, rapid changes in the
The strongest attemptto regulate the healthworkforce came duringthe Clinton administra-tion.
16
NHPF Background Paper April 11, 2003
mix of health professionals and other workers, challenges from CAM,and shifting demographics are having significant effects on the natureof the health workforce.
Composition of the Physician Workforce
Discussion over the supply of and demand for physicians has been on-going since a Graduate Medical Education National Advisory Commit-tee (GMENAC) report issued in 1981 indicated that the United Stateshad produced too many physicians. While the discussion of whetherthis country is educating too many or too few physicians is still goingon, there are several issues to be considered:■ The respective numbers and proportion of primary care and specialtyphysicians, estimated to be at 274,653 general-care specialists and 52,294in primary care subspecialties, and 486,823 in other specialties in 2000by the AMA.27 In 1994, HRSA’s Council on Graduate Medical Educationcalled for half of the physician workforce to be primary care practitio-ners. HRSA, among others, has directed much of its effort to increasingthe supply of such practitioners, especially physicians in family practice.Others have argued that there is a growing shortage of specialists,particularly “anesthesiologists, gerontologists, cardiologists,pulmonologists, urologists, oncologists, gastroenterologists, hematolo-gists and a variety of intensive care physicians.”28
■ The number of IMGs in Medicare GME-supported residencytraining programs, who made up 5,000 of 22,000 first-year residentsat last count.29
■ The participation of physicians in medical research, as reflected by a25 percent decline in physician scientists on medical school facultiesover the past two decades.30
Rapid Changes in the Health Workforce Mix
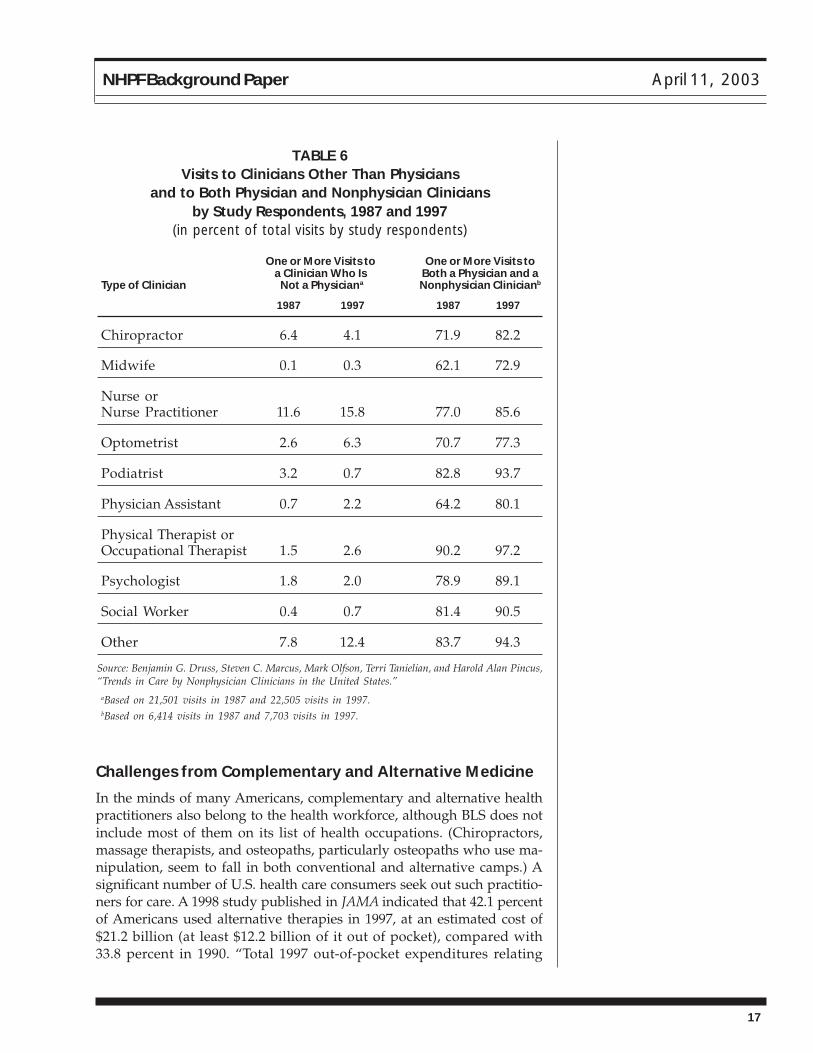
This country’s health workforce experienced a couple of significant shiftsduring the 1990s. First, the number of practitioners other than physi-cians grew rapidly, “with the number of graduates of training programsfor nonphysicians more than doubling between 1992 and 1997.” Second,state legislatures approved laws to expand “the allowable scope of prac-tice for these providers; in 1997 alone, 37 states enacted 83 such laws.”Finally, managed care experienced dramatic growth, with a byproductbeing movement of care “from physicians to nonphysician clinicians as ameans of cost containment.”31
A study of trends in care between 1987 and 1997, published this Januaryin the New England Journal of Medicine, shows definite practice shifts forphysicians, chiropractors, midwives, nurses or NPs, optometrists, po-diatrists, PAs, PTs or OTs, psychologists, social workers, and others. Asshown in Table 6, the number of visits to both physicians andnonphysicians during an office or clinic encounter increased significantly.32
The number of prac-titioners other thanphysicians grew rap-idly during the 1990s.
17
NHPF Background Paper April 11, 2003
Challenges from Complementary and Alternative Medicine
In the minds of many Americans, complementary and alternative healthpractitioners also belong to the health workforce, although BLS does notinclude most of them on its list of health occupations. (Chiropractors,massage therapists, and osteopaths, particularly osteopaths who use ma-nipulation, seem to fall in both conventional and alternative camps.) Asignificant number of U.S. health care consumers seek out such practitio-ners for care. A 1998 study published in JAMA indicated that 42.1 percentof Americans used alternative therapies in 1997, at an estimated cost of$21.2 billion (at least $12.2 billion of it out of pocket), compared with33.8 percent in 1990. “Total 1997 out-of-pocket expenditures relating
TABLE 6Visits to Clinicians Other Than Physicians
and to Both Physician and Nonphysician Cliniciansby Study Respondents, 1987 and 1997
(in percent of total visits by study respondents)
One or More Visits to One or More Visits toa Clinician Who Is Both a Physician and a
Type of Clinician Not a Physiciana Nonphysician Clinicianb
1987 1997 1987 1997
Chiropractor 6.4 4.1 71.9 82.2
Midwife 0.1 0.3 62.1 72.9
Nurse orNurse Practitioner 11.6 15.8 77.0 85.6
Optometrist 2.6 6.3 70.7 77.3
Podiatrist 3.2 0.7 82.8 93.7
Physician Assistant 0.7 2.2 64.2 80.1
Physical Therapist orOccupational Therapist 1.5 2.6 90.2 97.2
Psychologist 1.8 2.0 78.9 89.1
Social Worker 0.4 0.7 81.4 90.5
Other 7.8 12.4 83.7 94.3
Source: Benjamin G. Druss, Steven C. Marcus, Mark Olfson, Terri Tanielian, and Harold Alan Pincus,“Trends in Care by Nonphysician Clinicians in the United States.”
aBased on 21,501 visits in 1987 and 22,505 visits in 1997.bBased on 6,414 visits in 1987 and 7,703 visits in 1997.
18
NHPF Background Paper April 11, 2003
to alternative therapies were conservatively estimated at $27 billion,which is comparable with the projected 1997 out-of-pocket expendituresfor all U.S. physician services.”33 It is likely that the percentage and dol-lars have increased significantly since then.
According to the National Center for Complementary and AlternativeMedicine (NCCAM), CAM is “a group of diverse medical and healthcare systems, practices, and products that are not presently consideredto be part of conventional medicine.” NCCAM, established as an inde-pendent component of the National Institutes of Health by Congress in1999, identifies the major types as follows:■ Alternative medical systems (practitioners of homeopathic medi-cine, naturopathic medicine, traditional Chinese medicine [includingacupuncture], and Ayurveda).■ Mind-body interventions (practitioners who use techniques involv-ing “meditation, prayer, mental healing, and creative art, music, ordance therapies”).■ Biologically based therapies (practitioners who work with “dietarysupplements, herbal products, and the use of other so-called ‘natural’but as yet scientifically unproven therapies”).■ Manipulative and body-based methods (practitioners of chiropracticor osteopathic manipulation and massage).
■ Energy therapies (practitioners of biofield therapies, including “qigong, Reiki, and therapeutic touch,” and bioelectromagnetic-basedtherapies, “such as pulsed fields, magnetic fields, or alternatingcurrent or direct current fields”).34
As some CAM therapies move into conventional medicine, receivingrecognition from both public and private payers, they pose a challengeto conventional medicine and public and private coverage and paymentpolicies that govern it.
Shortages of Certain Members of the Health Workforce
Nurses — Shortages of certain health professionals—most prominently,nurses and pharmacists—have caused some to call on federal and stategovernments to take regulatory approaches to increase supplies andothers to appeal to the health industry to make changes in workingconditions, wages, and career opportunities. Addressing the shortageof nurses, Julie Sochalski provides these statistics in the September/October 2002 Health Affairs:
Nursing in the United States is at a critical juncture, competing withenticing high-tech industries for a diminishing pool of new labor whiletrying to meet the demands placed by an aging population and in-creasing treatment complexity on the health care system. Updated esti-mates from the Bureau of Health Professions of DHHS show a nationalshortfall of 110,700 RN full-time equivalents in 2000. Furthermore, BLS
Nursing shortages inthe nation’s hospitalsare particularly acute.
19
NHPF Background Paper April 11, 2003
identifies nursing as one of the top 20 occupations to be affected bybaby-boomer retirements, with employers needing to replace an esti-mated 331,000 RNs between 1998 and 2008. These conditions are col-liding with a 30-year gradual decline in nursing as a career.35
Nursing shortages in the nation’s hospitals are particularly acute. Thereasons, according to a group of researchers, are “the result of an im-posing combination of factors”:
Rising demand for RNs driven by increasing admissions and sicker pa-tients requiring more intensive nursing care; lack of good RN substitutes;a less-than-satisfactory working climate for many RNs; inflation-adjustedearnings that have fallen in all but two years since 1993; decliningenrollment in nursing education programs each year since 1995; and astrong economy in the late 1990s that allowed some married RNs toreduce time spent in the workforce. In addition, evidence suggests thatRN shortages in hospital intensive-care units and operating rooms areattributable in part to demographic changes in the RN workforce.36
Pharmacists — As pharmaceuticals replace other therapies in varioussegments of health care, there is “increased demand for pharmacists,the third-largest health professional group and the sole profession spe-cifically trained to deliver pharmaceutical services.” Demands on phar-macists have grown from dispensing medications to performing certainclinical functions, as reflected in upgrading of educational requirementsin 2004. The doctor of pharmacy (Pharm.D.) degree will replace thebaccalaureate degree as the required entry-level credential.37
According to a 2000 study by HRSA, vacancy rates stood at “7 percentin community pharmacies, 9 percent in hospitals, 11 percent in publichospitals, and up to 18 percent in federal facilities.” Although the activepharmacy workforce increased by 24,400 pharmacists between 1991 and2000, to a total of 196,000 pharmacists in practice in 2000, prescriptiondrug use increased by 46 percent from 1992 to 2000. While pharmacistsincreased their workloads significantly, that was not enough to fill in thegap, in part because of greater administrative and billing burdens. BLSprojected 216,865 pharmacy jobs in all industries in 2000. One result of thedemand for pharmacists has been the growth of pharmacy techniciansand assistants, who increased from 123,000 in 1996 to 247,000 in 2000.38
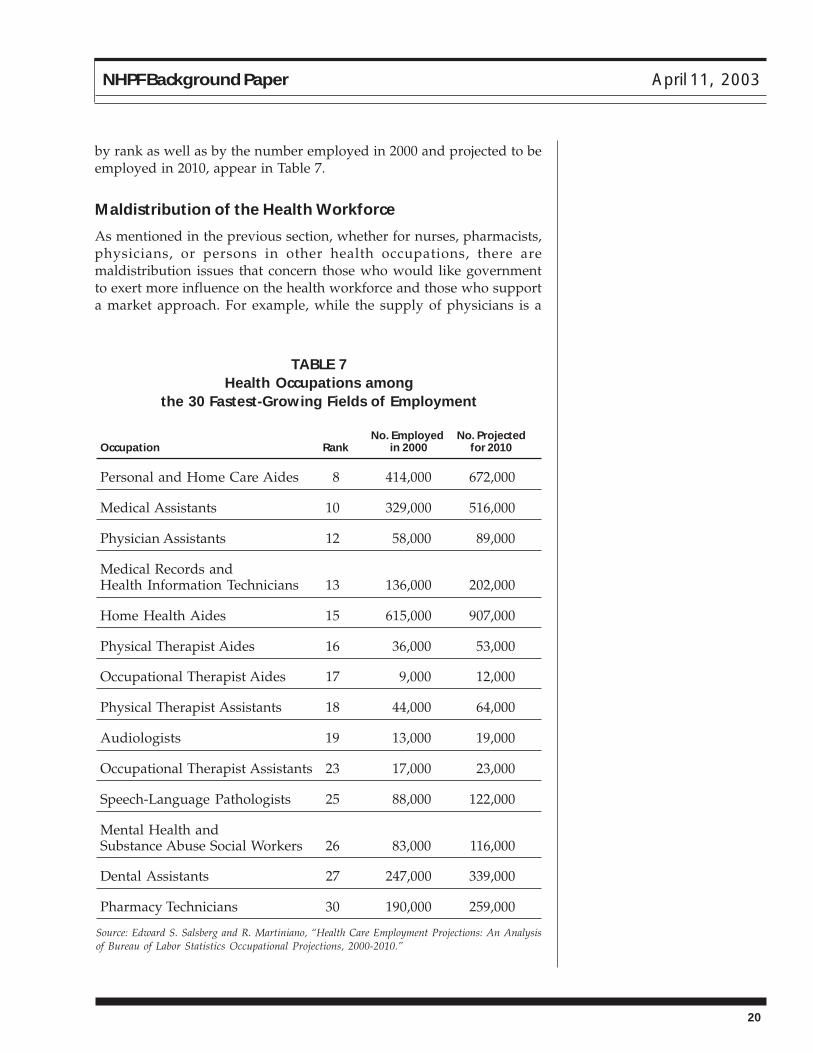
Others — There are also questions about supply and distribution pat-terns in other health care occupations, with the question of shortagessometimes subject to debate. When it comes to health professions otherthan nurses, pharmacists, and physicians, growth may be telling, as re-flected in an analysis of BLS occupational projections by Edward Salsbergand R. Martiniano of the Center for Health Workforce Studies, StateUniversity of New York at Albany.39 Their analysis indicates that 15 ofthe BLS-designated health occupations in Tables 2 and 3 rank among the30 fields of employment in the United States that are predicted to be thefastest growing in this decade. The 15 health occupations, designated
There is “increaseddemand for pharma-cists, the third-largesthealth professionalgroup.”
20
NHPF Background Paper April 11, 2003
by rank as well as by the number employed in 2000 and projected to beemployed in 2010, appear in Table 7.
Maldistribution of the Health Workforce
As mentioned in the previous section, whether for nurses, pharmacists,physicians, or persons in other health occupations, there aremaldistribution issues that concern those who would like governmentto exert more influence on the health workforce and those who supporta market approach. For example, while the supply of physicians is a
TABLE 7Health Occupations among
the 30 Fastest-Growing Fields of Employment
No. Employed No. ProjectedOccupation Rank in 2000 for 2010
Personal and Home Care Aides 8 414,000 672,000
Medical Assistants 10 329,000 516,000
Physician Assistants 12 58,000 89,000
Medical Records andHealth Information Technicians 13 136,000 202,000
Home Health Aides 15 615,000 907,000
Physical Therapist Aides 16 36,000 53,000
Occupational Therapist Aides 17 9,000 12,000
Physical Therapist Assistants 18 44,000 64,000
Audiologists 19 13,000 19,000
Occupational Therapist Assistants 23 17,000 23,000
Speech-Language Pathologists 25 88,000 122,000
Mental Health andSubstance Abuse Social Workers 26 83,000 116,000
Dental Assistants 27 247,000 339,000
Pharmacy Technicians 30 190,000 259,000
Source: Edward S. Salsberg and R. Martiniano, “Health Care Employment Projections: An Analysisof Bureau of Labor Statistics Occupational Projections, 2000-2010.”
21
NHPF Background Paper April 11, 2003
matter of debate (see “Composition of the Physician Workforce” above),there seems to be little doubt that there is maldistribution of physiciansamong urban, suburban, rural, and frontier areas in the United States.Data show that the number of active allopathic nonfederal physicians inmetropolitan areas grew by 74 percent and by 61 percent innonmetropolitan areas between 1980 and 2000.40
Given freedom of choice among clinicians to practice wherever theyplease (unless they have scholarship or loan obligations that mandateservice in particular locales), maldistribution is a recurrent problem.DHHS has several ways of tracking shortage areas. The designationsare as follows:
■ Health Professional Shortage Area (HPSA)—An area that hasshortages of primary medical, dental, or mental health serviceswhether by geography (urban or rural), population group, or medicalor other public facilities.■ Medically Underserved Area (MUA)—A county or group of con-tiguous counties, a group of county or civil divisions, or a group ofurban census tracts characterized by a shortage of personal healthservices for residents.■ Medically Underserved Population (MUP)—A group of people whoface economic, cultural, or linguistic barriers to the delivery of healthcare.
According to HRSA, more than 34 federal programs depend upon theshortage designations to determine eligibility or give funding prefer-ence and approximately 20 percent of the U.S. population is located inprimary medical care HPSAs.41 Examples of initiatives designed to bringproviders to shortage areas include the following:■ National Health Service Corps—Recruits and retains health profes-sionals (primary care physicians, NPs, PAs, CNMs, dentists, dentalhygienists, clinical or counseling psychologists, clinical social workers,marriage and family therapists, psychiatric nurse specialists, andlicensed professional counselors) to deliver care in underservedcommunities. Has scholarship and loan repayment programs.
■ Rural Health Clinics—Provide health care in rural areas designatedto be short of personal health services or primary health providers.Must employ an NP or PA; have arrangements with a physician toprovide medical direction, guidance, and supervision; and have anagreement with a Medicare-certified hospital for referral and admis-sion of patients.■ Community Health Centers—Provide preventive and primaryhealth services in medically underserved areas. Provided services to9.6 million people in 2000, with care given by physicians, NPs, PAs,dentists, and dental hygienists.■ AHECs—Address the health workforce needs of medicallyunderserved communities. Multi-institutional, multidisciplinary
The health workforcehas not kept pace withthe United States’ racialand ethnic mix.
22
NHPF Background Paper April 11, 2003
community-based programs initially funded through federal grantsbut eventually self-sustaining. Work mainly with primary care fieldsof family medicine, internal medicine, pediatrics, and obstetrics/gynecology as well as nursing, dentistry, public health, and the alliedhealth professions.
Lack of Diversity in Response to Demographic Changes
While the population of the United States has shifted dramatically in termsof its racial and ethnic mix, the health workforce has not kept pace. Thereare “at least four practical reasons [that] can be put forth for attaininggreater diversity in the workforce,” according to Jordan J. Cohen, Bar-bara A. Gabriel, and Charles Terrell, in the September/October 2002 HealthAffairs, “(1) advancing cultural competency, (2) increasing access to highquality health care services, (3) strengthening the medical research agenda,and (4) ensuring optimal management of the health care system.”42
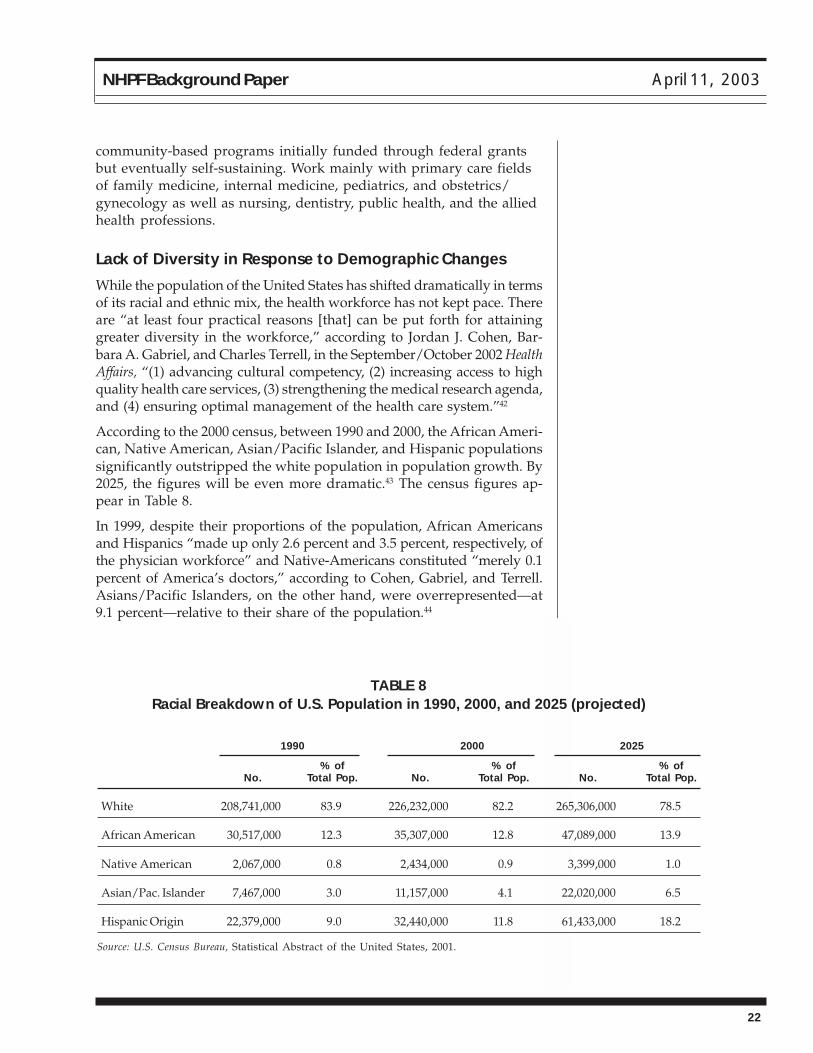
According to the 2000 census, between 1990 and 2000, the African Ameri-can, Native American, Asian/Pacific Islander, and Hispanic populationssignificantly outstripped the white population in population growth. By2025, the figures will be even more dramatic.43 The census figures ap-pear in Table 8.
In 1999, despite their proportions of the population, African Americansand Hispanics “made up only 2.6 percent and 3.5 percent, respectively, ofthe physician workforce” and Native-Americans constituted “merely 0.1percent of America’s doctors,” according to Cohen, Gabriel, and Terrell.Asians/Pacific Islanders, on the other hand, were overrepresented—at9.1 percent—relative to their share of the population.44
TABLE 8Racial Breakdown of U.S. Population in 1990, 2000, and 2025 (projected)
1990 2000 2025
% of % of % ofNo. Total Pop. No. Total Pop. No. Total Pop.
White 208,741,000 83.9 226,232,000 82.2 265,306,000 78.5
African American 30,517,000 12.3 35,307,000 12.8 47,089,000 13.9
Native American 2,067,000 0.8 2,434,000 0.9 3,399,000 1.0
Asian/Pac. Islander 7,467,000 3.0 11,157,000 4.1 22,020,000 6.5
Hispanic Origin 22,379,000 9.0 32,440,000 11.8 61,433,000 18.2
Source: U.S. Census Bureau, Statistical Abstract of the United States, 2001.
23
NHPF Background Paper April 11, 2003
The March 2000 National Sample Survey of Registered Nurses indicatedthat 12.3 percent—compared with 10.3 percent in 1996—were in one ormore identified ethnic and racial groups and 1.1 percent did not reporttheir backgrounds. The breakdown was as follows: “Black/AfricanAmerican (non-Hispanic), 4.9 percent; Native American, 0.5 percent;Asian, 3.5 percent; Native Hawaiian/Pacific Islander, 0.2 percent; His-panic, 2.0 percent; and of two or more racial backgrounds, 1.2 percent.”45
Minorities are more likely to pursue higher degrees in nursing, how-ever, according to Sochalski. Drawing on the 2000 National Sample Sur-vey of Registered Nurses, she reports that “52 percent of minority nurseswho graduated before 1996 had at least a B.S.N. degree, compared with42 percent of white nurses. Among new nurses (those graduating be-tween 1996 and 2000), 41 percent of minority nurses and 42 percent ofwhite nurses had a BSN or higher degree.”46
Other health professions also reflect lack of diversity, with dentistry be-ing quite prominent. “Dentistry contains 6.8 percent underrepresentedminorities [African Americans, Native Americans, and Hispanics], com-pared with 8.5 percent of physicians and 24.8 percent of the population,”write Elizabeth Mertz and Edward O’Neil, drawing on American DentalAssociation data. “First-year dental students in 1999 were 34 percent non-white” and just 10.2 percent were underrepresented minorities.47
The term “underrepresented minorities,” which is used by DHHS forprograms to increase the diversity of the health workforce, is very im-portant. Whereas the Census Bureau defines minorities as “blacks,”“American Indians, Eskimos, and Aleutians,” “Asian, Pacific Islanders,”and “Hispanic origin,” HRSA uses “underrepresented minorities,” whichincludes all the categories except “Asian, Pacific Islanders.” That is be-cause, as already indicated, Asian/Pacific Islanders are over- rather thanunderrepresented in the health professions, as opposed to members ofthe other categories. This highlights the importance of definitions inhealth workforce policy.
SOME RESPONSES: PROPOSALS FOR CHANGEGiven the strength of the individual lobbies for workforce participantsand the reluctance of Congress and all but the Clinton administration tomake sweeping changes, government responses to shaping of the healthworkforce have been marginal. Organizations such as the AAMC haveresisted significant changes in Medicare GME, and the AMA and spe-cific physician specialty academies and colleges have worked to pre-serve physician prerogatives. At the same time, organizations repre-senting nurses and allied health professionals, such as OTs, PTs, andspeech pathologists, have struggled to strengthen their members’ par-ticipation in public programs.
24
NHPF Background Paper April 11, 2003
Omnibus reconciliation measures going back more than 20 years containprovisions affecting both the Medicare GME provisions in the SocialSecurity Amendments of 1983 (part of the Social Security Act) and TitlesVII and VII of the Public Health Service Act. In terms of their impact onthe health workforce, they more often than not are budget- rather thanpractice-directed. An example is the steady erosion—for the purpose ofbudget savings—of the Medicare indirect medical education add-on sinceit went into effect in FY 1984. Another example is President Bush’s FY2004 HRSA budget, which reduces and even zeros out certain healthprofessions programs, putting pressure on interest groups with affectedmembers to lobby Congress to save the programs.
As with much of health policy, calls for change tend to represent tinker-ing at the edges, although some public policy and health industry lead-ers have urged or are urging more comprehensive reforms. Examplesinclude the following:
■ Development of an all-payer health services trust fund or pool—drawing from both public and private sources—to fund health profes-sions education.
■ Use of Medicare GME policy to train specific kinds of physicians(for example, primary-care doctors, certain types of specialists, or U.S.as opposed to IMG residents) or to increase or limit the numbers ofphysicians produced.■ Proactive approaches to address the heavy debt that physicians andsome other clinicians build up during educational and training, debtthat influences their choice of career practice.■ Incentives to encourage greater coordination and collaborationamong and even integration of members of the health workforce.
■ Interdisciplinary approaches to foster teamwork among physicians,nurses, and other members of the health workforce.
■ Recognition in coverage and payment policies of the significant shiftaway from inpatient to outpatient services in the past few decadesand the importance of training in ambulatory settings.
■ Greater acknowledgment of practitioners other than physicians andof certain alternative practitioners in public coverage and paymentpolicies.
■ Programs targeting shortages of certain practitioners, such asnurses and pharmacists.
■ Proactive or even coercive programs to address maldistribution ofpractitioners in frontier, rural, and even inner-city areas.
■ Initiatives to increase the number of underrepresented minorities inmedicine, nursing, the allied health professions, and other healthoccupations.
Given rising federal and state budget deficits, there seems to be littlemomentum for assertive workforce approaches. Even plugging-the-gap
Calls for change inhealth workforce policytend to represent tink-ering at the edges.
25
NHPF Background Paper April 11, 2003
initiatives, such as addressing nursing shortfalls, are lagging. The onlycomprehensive funding proposal on the table is the health services trustfund or pool that would draw from both public and private sources toachieve “public good” workforce goals. No consensus exists, however,on what those goals are: To support the missions of academic healthcenters, which have the medical and other schools that train health pro-fessionals? To assure the production of certain types of physicians?Nurses? Other personnel?
In an introduction to Health Affairs’ September/October 2002 special is-sue on health workforce issues, Editor John Iglehart writes that the1981 GMENAC report indicating that the United States had producedtoo many physicians, “coupled with the pro-market, anti-planning men-tality of the incoming Reagan administration, led to a long lapse of gov-ernmental and academic attention to physician workforce policy issues.Now, the subject of the health care workforce is making its way back onthe public policy agenda, fueled mostly by serious concern over a short-age of nurses.” Extending his concern to “countless other issues involv-ing dentists, pharmacists, and other health professionals; cross-profes-sions concerns about insufficient diversity; the impact of informatics;and the adequacy of providers trained to care for the growing elderlypopulation,” Iglehart entitles his preface “The Woeful Neglect of HealthCare Workforce Issues.”
Many thanks to those who provided thoughtful assistance in the drafting of thispaper: Atul Grover, M.D., and Marcia Starbecker, M.S.N., of DHHS; F. LawrenceClare, M.D., a retired DHHS employee who now is a private consultant; TimHenderson of the National Conference of State Legislatures; and Gloria Holland,Ph.D., of the Department of Veterans Affairs. The Forum, however, bears finalresponsibility for the content of the paper.
ENDNOTES1. The Bureau of Labor Statistics issues employment projections every two years.
2. Sam Shekar, M.D., “Geriatrics Is a 21st Century Issue,” PowerPoint presentation at TheAging of America: Implications for the Health Workforce (A Symposium for Health Profes-sionals and Health Researchers), January 13, 2002, Center for Health Workforce Studies,State University of New York at Albany, 9; accessed February 12, 2003, at http://chws.albany.edu/aging.
3. Bureau of Labor Statistics, U.S. Department of Labor, “Standard Occupational Classifi-cation: 29-0000 Healthcare Practitioners and Technical Occupations”; accessed March 7,2003, at http://www.bls.gov/soc/soc_j0a0.htm.
4. Bureau of Labor Statistics, U.S. Department of Labor, “Standard Occupational Classifi-cation: 31-0000 Healthcare Support Occupations”; accessed March 7, 2003, at http://www.bls.gov/soc/soc_k0a0.htm.
26
NHPF Background Paper April 11, 2003
5. Association of American Medical Colleges, “Table 1: Positions Offered in the MatchingProgram, 1996–2002”; accessed March 23, 2003, at http://www.nrmp.org/res_match/tables/table1_2002.pdf.
6. Shekar, “Geriatrics.”
7. American Medical Association (AMA), “Physician Statistics Now: Table”; accessed March23, 2003, at http://www.ama-assn.org/ama/pub/category/2688.html.
8. Bureau of Labor Statistics, “National Compensation Survey: Occupational Wages in theUnited States, 2001”; accessed April 3, 2003, at http://www.bls.gov/ncs/ocs/sp/ncb10449.pdf, 5.
9. Centers for Medicare and Medicaid Services (CMS), Medicare and You 2003, CMS 10050(Baltimore, Md.: Department of Health and Human Services, January 2003), 7.; available athttp://www.medicare.gov/publications/pubs/pdf/10050.pdf.
10. CMS, Medicare and You, 9.
11. CMS, Medicare and You, 37–40.
12. Medicare Payment Advisory Commission (MedPAC), Report to the Congress: MedicarePayment to Advanced Practice Nurses and Physician Assistants (Washington, D.C.: MedPAC,June 2002).
13. Medicare Payment Advisory Commission MedPAC), Report to the Congress: MedicareCoverage of Nonphysician Practitioners (Washington, D.C.: MedPAC, June 2002).
14. MedPAC, Payment to Advanced Practice Nurses and Physician Assistants, 6–7.
15. The fee schedule has been used since 1992. It is based on the physician’s work in provid-ing services, as well as practice and malpractice expenses. Depending upon the nature of theservice, a relative value unit (RVU) is assigned to each factor. The RVUs are added and thetotal is multiplied by a geographic factor and a conversion factor for budget neutrality.
16. See MedPAC, Payment to Advanced Practice Nurses and Physician Assistants, 13-15, for adiscussion of OPAs. See MedPAC, Coverage of Nonphysician Practitioners, 8, 15–18, for discus-sions of the other practitioners.
17. Centers for Medicare and Medicaid Services (CMS), “Medicaid: A Brief Summary”;accessed March 23, 2003, at http://www.cms.hhs.gov/publications/overview-medicare-medicaid/default4.asp, 5.
18. CMS, “Medicaid,” 5.
19. MedPAC, Payment to Advanced Practice Nurses and Physician Assistants, 11.
20. Tim Henderson, National Conference of State Legislatures, personal communication,March 31, 2003.
21. Henderson, personal communication.
22. American Dental Education Association, “Titles VII and VIII Health Professions andNursing Education Training Programs”; accessed March 14, 2002, at http://www.adea.org/CPPA_Materials/Factsheets/2002T7-8.pdf.
23. American Association of Retired Persons (AARP), “AARP Medical Advantage Plan:Your How-To Guide,” BA9522, Washington, D.C., 2003, 10. (This is a plan insured by UnitedHealthCare Insurance Company for people who are 50 and older but not yet eligible forMedicare.)
24. AARP, “Medical Advantage Plan,” 10-11.
25. American College of Physicians-American Society of Internal Medicine, “Position Paper:Expanding Roles of Nurse Practitioners and Physician Assistants,” January 22, 2000; ac-cessed March 12, 2003, at http://www.acponline.org/hpp/pospaper/expand_roles.pdf.
26. Kevin Grumbach, “Fighting Hand to Hand over Physician Workforce Policy,” HealthAffairs, 21, no. 5 (September/October 2002): 13.
27
NHPF Background Paper April 11, 2003
27. AMA, “Physician Statistics Now.”
28. Jay Greene, “Emerging Specialist Shortage Triggers Workforce Review,” amednews.com, 1;accessed April 3, 2003, at http://www.ama-assn.org/sci-pubs/amnews/pick_01/prsa0122.htm.
29. Fitzhugh Mullan, “The Case for More U.S. Medical Students,” New England Journal ofMedicine, 343, no. 3 (July 20, 2000): 213–17.
30. Eric G. Neilson, “The Role of Medical School Admissions Committees in the Decline ofPhysician-Scientists,” Journal of Clinical Investigation, 111, no. 6 (March 2003): 765.
31. Benjamin G. Druss, Steven C. Marcus, Mark Olfson, Terri Tanielian, and Harold AlanPincus, “Trends in Care by Nonphysician Clinicians in the United States,” New EnglandJournal of Medicine, 348, no. 2 (January 9, 2003): 131. The researchers used data from twosurveys, the 1987 National Medical Expenditure Survey and the 1997 Medical ExpenditurePanel Survey.
32. Druss et al., “Trends in Care,” 134.
33. David M. Eisenberg, Roger B. Davis, Susan L. Ettner, Scott Appel, Sonja Wilkey, MariaVan Rompay, and Ronald C. Kessler, “Trends in Alternative Medicine Use in the UnitedStates, 1990–1997,” JAMA, 280, no. 18 (November 11, 1998): 1569–75.
34. National Center for Complementary and Alternative Medicine, “What Is Complemen-tary and Alternative Medicine (CAM)?”; accessed March 10, 2003, at http://nccam.nih.gov/health/whatiscam.
35. Julie Sochalski, “Nursing Shortage Redux: Turning the Corner on an Enduring Problem,”Health Affairs, 21, no. 5 (September/October 2002): 157.
36. Peter I. Buerhaus, Jack Needleman, Soeren Mattke, and Maureen Stewart, “StrengtheningHospital Nursing,” Health Affairs, 21, no. 5 (September/October 2002): 123–24.
37. Judith A. Cooksey, Katherine K. Knapp, Surrey M. Walton, and James M. Cultice, “Chal-lenges to the Pharmacist Profession from Escalating Pharmaceutical Demand,” Health Af-fairs, 21, no. 5 (September/October 2002): 182–186.
38. Cooksey et al., “Challenges,” 182–185.
39. Edward S. Salsberg and R. Martiniano, “Health Care Employment Projections: An Analysisof Bureau of Labor Statistics Occupational Projections, 2000-2010,” Center for HealthWorkforce Studies, School of Public Health, State University of New York at Albany, Rensselaer,N.Y., 7.
40. Edward S. Salsberg and Gaetano J. Forte, “Trends in the Physician Workforce, 1980-2000,” Health Affairs, 21, no. 5 (September/October 2002): 169.
41. Health Resources and Services Administration, “Health Professional Shortage Areas”;accessed March 14, 2003, at http://bhpr.hrsa.gov/shortage/index.htm.
42. Jordan J. Cohen, Barbara A. Gabriel, and Charles Terrell, “The Case for Diversity in theHealth Care Workforce,” Health Affairs, 21, no. 5 (September/October 2002): 91.
43. U.S. Census Bureau, “Section 1: Population,” Statistical Abstract of the United States, 2001,Table 10, 13; accessed March 10, 2003, at http://www.census.gov/prod/2002pubs/01statab/pop.pdf.
44. Cohen, Gabriel, and Terrell, “Case for Diversity,” 99.
45. Division of Nursing, Bureau of Health Professions, “The Registered Nurse Population:National Sample Survey of Registered Nurses—March 2000; Preliminary Findings—Febru-ary 2001,” NurseWeek, 3–4; accessed March 17, 2003, at http://www.nurseweek.com/nursingshortage/rnsurvey.asp.
46. Sochalski, “Nursing Shortage,” 162–63.
47. Elizabeth Mertz and Edward O’Neil, “The Growing Challenge of Providing Oral HealthCare Services to All Americans,” Health Affairs, 21, no. 5 (September/October 2002): 68.
28
NHPF Background Paper April 11, 2003
APPENDIX — TABLE 1
Physician Positions Offered in the Annual Residency Matching Program
■ Anesthesiology■ Dermatology
■ Emergency Medicine
■ Family Practice■ General Surgery
Preliminary
Surgery – Plastic Surgery
■ Internal Medicine
Medicine – Emergency Medicine
Medicine – Family Practice
Medicine – Neurology
Medicine – Pediatrics
Medicine – Physical Medicine and Rehabilitation
Medicine – Preventive Medicine
Medicine – Psychiatry
Preliminary
Primary
■ Medical Genetics
■ Neurological Surgery■ Neurology
■ Nuclear Medicine
■ Obstetrics/Gynecology■ Ophthalmology
■ Orthopedic Surgery
■ Pathology■ Pediatrics
Pediatrics – Emergency Medicine
Pediatrics – Physical Medicine and Rehabilitation
Pediatrics/Psychology/Child Psychology
Primary
■ Physical Medicine and Rehabilitation■ Plastic Surgery
■ Preventive Medicine
■ PsychiatryPsychiatry – Child Psychiatry
Psychiatry – Family Practice
Psychiatry – Neurology
■ Radiation Oncology
■ Radiology – Diagnostic
■ Transitional■ Urology
Source: Association of American Medical Colleges, “Table 1: Positions Offered in the Matching Program, 1996–2002.”; accessed March 23, 2003,at http://www.nrmp.org/res_match/tables/table1_2002.pdf.