Embed Size (px)
Citation preview
CSIS_______________________________ Center for Strategic and International Studies
1800 K Street N.W. Washington, DC 20006
(202) 775-3270 [email protected]
The US, the Gulf, and the Middle East: Energy Dependence, Demographics, and the
Forces Shaping Internal Stability
Anthony H. Cordesman
Arleigh A. Burke Chair in Strategy
December 9, 2002
Middle Eastern Oil, Import Dependence, Demographics and Economics 12/10/02 Page 2
The latest flap over the possible Saudi funding of terrorism has led to new talk about reducing our dependence on imported oil. Well, everyone is entitled to his or her own opinions, but no one is entitled to their own facts. The Bush Administration, the Congress, and the press have said some remarkably silly things in recent months about US dependence on oil imports and the Middle East. They have implied that US domestic energy efforts can make a near and mid-term impact on our dependence on oil imports when it can’t. There have been truly silly articles about Russia displacing Saudi Arabia as an enduring oil power. There have been many articles that ignore the fact that US energy forecasts already call for major increases in energy efficiency and conservation, the use of renewables, and other energy sources.
The facts seem to be very different. There is one aspect of energy over which there is virtually no debate. All of our projections of energy supply indicate that we face the need to project the world’s key sources of oil exports for decades to come. After nearly three decades of intense effort to find commercial viable proven oil reserves outside the Middle East, current estimates indicate that the Middle Eastern and North African Arab states have between 68% and 70% of the world’s reserves – a percentage nearly 10% higher than in the 1970s, when this exploration effort began. The Gulf alone has 65% of the world’s proven reserves.
Russia – a high cost producer with an inefficient oil production infrastructure – may be able to sustain high levels of production for a while, but the Department of energy currently estimates that it only has 4.6% of the world’s proven oil reserves and always has to sell at the maximum it can produce. It the US gets oil from Russia, the end result is simply to make some other customer buy their oil from another exporter. The supply of oil is still the same and global competition ensures that the US pays the same world price for Russian oil as everyone else pays for oil all over the world.
There are no massive supplies of oil in other parts of the FSU. The entire reserves of the Caspian and Central Asian states only add another 2.3%. The US has only 2.9%.i In contrast Saudi Arabia alone has at least 25% and probably well over 30% Iran, Iraq, Kuwait, and the UAE each have some 8-11%. All can produce new oil at only 20-30% of the cost of either Russia or the Caspian states.ii
Talking about the size of future imports and exports is more uncertain. There are many private projections of energy based on politics, lobbying, ideology, and pure guesswork. However, only OPEC, the International Energy Agency, and the Energy Information Agency (EIA) of the US Department of Energy have the ability to create large scale data bases on energy reserves, flow, and consumption, and model them with real credibility. All three of these sources roughly agree about future trends and based their estimates on models and data that have proved roughly correct over more than a decade. There are no certainties in energy, but to the extent there are facts, they are contained in the work done by these sources.
If one looks at the EIA projections, which are the authoritative source for US government analysis, one gets a very different “fact-based” view of the future from the ones in the Bush Administration’s policy statements, Congressional debates, and carelessly researched news articles. The noise surrounding the Bush energy policy issued in 2001 and the resulting Congressional debate over the 2002 energy bill disguises the fact that even if all the additional US
Copyright Anthony H. Cordesman, all rights reserved.
Middle Eastern Oil, Import Dependence, Demographics and Economics 12/10/02 Page 3
production of oil and all other forms of energy called for in such policies was actually achieved, it would have virtually no impact on dependence on US strategic dependence on oil exports.
The Bush energy policy documents issued in 2001 never addressed the foreign side of energy supply and consumption, and never included any meaningful quantified forecasts of the impact of its policy. However, the Department of Energy’s Energy Information Agency (DOE EIA) has issued quantified forecast since that time.iii Even though these forecasts do call for significant additional energy efficiency and conservation, and increases in other fuels and renewables, they still call for US direct imports of oil to increase from roughly 9.2 MMBD in 2002 to a best estimate of 26 MMBD in 2020 (a 183% increase over less than two decades), and to a range from 25 to 29 MMBD.
Yet, such estimates grossly understate our true dependence on oil imports. The US now imports around $1.2 trillion worth of goods and services a year.iv Many are manufactured goods from Europe and Asia that are critically dependent on imported oil. We have no estimate of such indirect energy imports in any of our energy plans, but it is clear that they would add at least another 1 MMBD to our import level – far more oil than either the Bush energy policy or Congressional variation on this policy in the 2002 energy bill – would save in terms of energy imports. Our imports and true level of oil import dependence will also increase through 2020.
Moreover, we are critically dependent on “globalism” in terms of the ability of other nations to buy our exports and invest in our economy. Not only must we compete for oil imports at market prices in a world market – an issue that makes where our oil imports come from in any given period largely irrelevant. Our vital strategic interests depend on the global availability of oil at moderate prices, not on our own imports.
If the world economy is to keep growing a moderate average rate during the next two decades, the EIA indicates that total Middle Eastern oil production capacity must increase from 29 MMBD in 2002 to 51 MMBD by 2020 – a more than 75% increase. Total Gulf capacity must rise from 24 MMBD to 43 MMBD – a nearly 80% increase. Saudi capacity alone must increase from 11.4 to 22.1 MMBD – a 93% increase.v
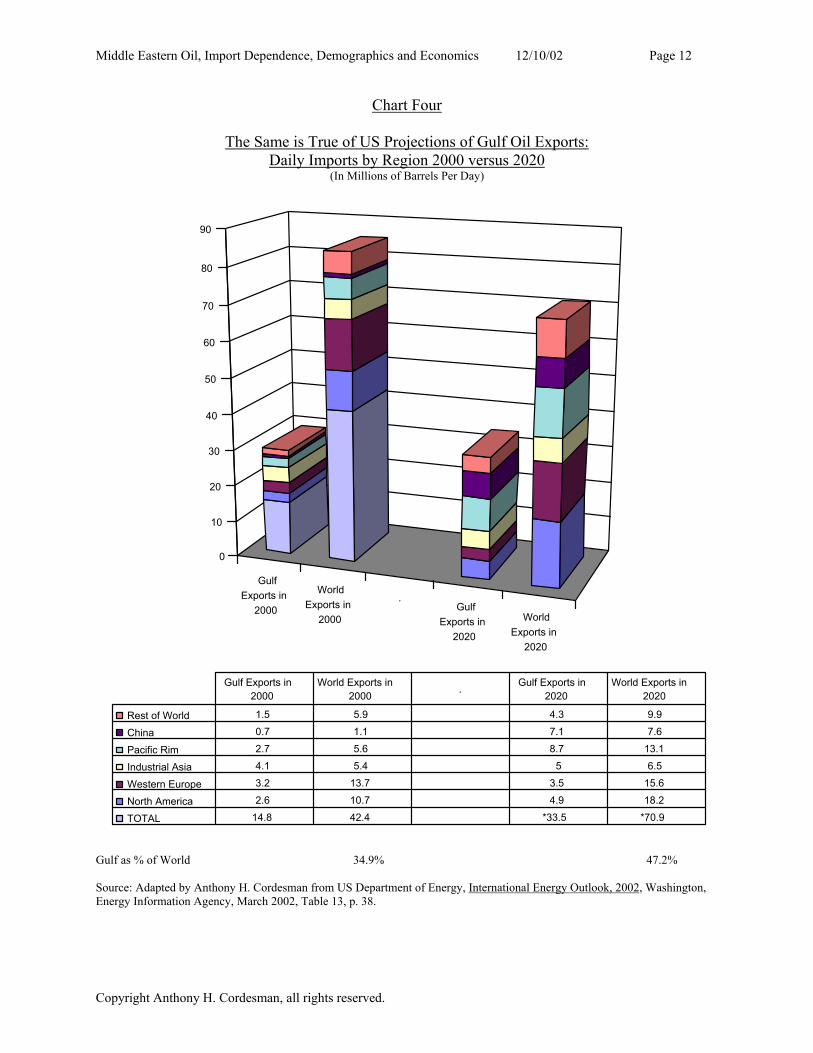
World demand for oil exports will continue to steadily increase in spite of major projected increases in gas, renewables, other fuels, and energy efficiency and conservation. Total petroleum exports are projected to increase from 42.4 to 70.9 MMBD (a 67% increase), and exports from the Gulf from 14.8 MMBD to 33.5 MMBD (a 126% increase). While the US and other industrialized nations will consume part of this increase, most will be vital to the growth of less developed nations. The EIA projected that industrialized states will need another 6.2 MMBD by 2020, but that developing nations will need an increase of 17 MMBD. China alone will need 7.2 MMBD.
A similar analysis by the International Energy Agency, of the OECD, estimates that global demand for oil increased from 2,450 million tons of oil equivalent (Mtoe) in 1971 to 3,604 Mtoe in 2000 – a nearly 50% increase. Rising demand in the developing world is projected to increase demand to 4,,272 Mtoe in 2010 (a 19 percent increase), and 5,769 Mtoe in 2030 (a 60 percent increase). This will occur in spite of massive increases in the consumption of coal, gas, hydro, and renewables and an average decline in energy intensity (the amount of energy needed for a given amount of economic output) will drop by an average of 1.2% per year.vi This is a growth from 75 MMBD in 2000 to 89 MMBD in 2010 and 120 MMBD in 2030. The IEA estimates that more than 60% of the increase will go to developing countries, many of which are trading partners of the US and effectively reexport oil in the form of finished goods. This will require a global
Copyright Anthony H. Cordesman, all rights reserved.
Middle Eastern Oil, Import Dependence, Demographics and Economics 12/10/02 Page 4
increase in the intraregional aspects of oil exports from 45% to 58%, almost all of the increase coming from Middle Eastern oil exporters. Some 30% of the total increase in oil demand, however, will go to OECD countries and be critical to the economic growth of the US and its industrialized allies in the West.
The punchline is simple. When we talk about Iraq, the Middle East, the Gulf, our strategic interests, and the world’s economy, the fact is that all of our projections of energy supply indicate that we will be dependent on the world’s key source of oil exports for decades to come. We can’t make this going away with fantasies about other energy resources, by political discussions of domestic energy policy that ignore the realities of what such polices can or cannot hope to accomplish, or by exaggerating the role of smaller oil powers. We have one vital strategic interest in the Middle East: energy exports. Barring a technological miracle, that dependence will continue for decades. We cannot ignore today’s threat from Iraq, and even if we are successful in going to war with Saddam. We will still have to prepare for a major regional contingency in the Middle East.
Anthony H. Cordesman holds the Arleigh A. Burke Chair in Strategy at the Center for Strategic and International Studies. He is a former official at the Department of Energy and the author of Iraq’s Military Forces: A Net Assessment, CSIS, 2002).
Copyright Anthony H. Cordesman, all rights reserved.
Middle Eastern Oil, Import Dependence, Demographics and Economics 12/10/02 Page 5
Key Data on Energy Estimates, Demographics, and Regional Tensions
Chart One ........................................................................................................................................ 7 Middle Eastern Oil Reserves Continue to Dominate Total World Reserves.................................. 7 Table One........................................................................................................................................ 8 Comparative Oil Reserves and Production Levels of the Gulf States – Part One .......................... 8 Comparative Reserves .................................................................................................................... 8 Table Two ....................................................................................................................................... 9 Comparative Oil Reserves and Production Levels of the Gulf States Comparative Production and
Production Capacity................................................................................................................ 9 Chart Two ..................................................................................................................................... 10 The US Projects Massive Increases in Gulf Oil Production Capacity in Order to Meet Global
Demand: 2000-2020.............................................................................................................. 10 Chart Three ................................................................................................................................... 11 The Increase by Gulf Country Illustrates the Level of Increasing Dependence on Key Gulf
Exporters: 2000-2020............................................................................................................ 11 Chart Four ..................................................................................................................................... 12 The Same is True of US Projections of Gulf Oil Exports: ........................................................... 12 Daily Imports by Region 2000 versus 2020 ................................................................................. 12 Chart Five...................................................................................................................................... 13 The Net Result is Massive Increases in US and Other Industrialized Nation .............................. 13 Energy Dependence on Imported Oil ........................................................................................... 13 Chart Six ....................................................................................................................................... 14 Beyond Market Forces: Oil is a Conflict-Driven Business: ......................................................... 14 Politics, War, and the Trends in the Price of Saudi Arabia Light Crude: 1970-1999 .................. 14 Adapted by Anthony H. Cordesman from Cambridge Energy Associates, World Oil Trends,
1998, Cambridge, Mass., 1998, pp. 26 ................................................................................ 14 Chart Seven................................................................................................................................... 15 “Oil Crash” to “Oil Boom” in 1992-2001: Even in Peacetime, Oil Revenues are Unpredictable
and Have Massive Regional Macroeconomic Impacts......................................................... 15 Chart Eight .................................................................................................................................... 16 Saudi Arabia As a Case Study: The Oil Boom is Long Over....................................................... 16 Chart Nine..................................................................................................................................... 17 Iraq As a Case Study: Oil Wealth is Now Far More Relative ...................................................... 17 Chart Ten ...................................................................................................................................... 18 All Middle Eastern Exporters: The “Oil Boom” Is Over Throughout the Region ....................... 18 Chart Eleven.................................................................................................................................. 19 GDP Growth of the Other Gulf and MENA States Lagged Behind East Asia and Middle Income
States, During the 1980s and 1990s...................................................................................... 19 Chart Twelve................................................................................................................................. 20 Pressures on the Saudi Budget: The Impact of the Recent “Oil Crash” and “Oil Boom”............ 20 Chart Thirteen ............................................................................................................................... 21 Living in a Crowded Desert: Massive Ongoing Population Growth in the Total Middle East and
Mahgreb ................................................................................................................................ 21 Chart Fourteen .............................................................................................................................. 22
Copyright Anthony H. Cordesman, all rights reserved.
Middle Eastern Oil, Import Dependence, Demographics and Economics 12/10/02 Page 6
Living in a Crowded Desert: Massive Ongoing Population Growth in the Total Middle East: UN versus Census Bureau Estimates........................................................................................... 22
Chart Fifteen ................................................................................................................................. 23 Living in a Crowded Desert: Massive Ongoing Population Growth in the Total Middle East and
a Continuing “Youth Explosion” .......................................................................................... 23 Chart Sixteen................................................................................................................................. 24 Living in a Crowded Desert: Massive Ongoing Population Growth in the Total Middle East and
a Continuing “Youth Explosion” .......................................................................................... 24 Chart Seventeen ............................................................................................................................ 25 Living in a Crowded Desert: Massive Ongoing Population Growth in the Total Mahgreb and a
Continuing “Youth Explosion”............................................................................................. 25 Chart Eighteen .............................................................................................................................. 26 Living in a Crowded Desert: Population Growth in Key Gulf Countries..................................... 26 Chart Nineteen .............................................................................................................................. 27 Case Examples: Population Growth and the Youth Explosion in Iraq......................................... 27 Chart Twenty-One ........................................................................................................................ 28 Case Examples: Population Growth and the “Youth Explosion” in Saudi Arabia...................... 28 Chart Twenty-Two........................................................................................................................ 29 The Impact of Demographics on Wealth in a Key Gulf State: ..................................................... 29 Saudi Annual Growth in GDP and GNP Per Capita: 1966-1999 ................................................. 29 (In Percent).................................................................................................................................... 29 Chart Twenty-Three...................................................................................................................... 30 Massive On-Going Pressures for Social Change: Massive Urbanization and Sharp Decline in the
Role of Agriculture ............................................................................................................... 30 Chart Twenty-Four........................................................................................................................ 31 The Challenge to Come: Growth in the Saudi Labor Force: 2000 versus 2025 ........................... 31 Chart Twenty-Five ........................................................................................................................ 32 Over-Dependence on Non-Productive Government Jobs Has a Cost: Estimated Comparative
Direct and Disguised Unemployment Rate in the Middle East; A Rough Estimate ............ 32
Copyright Anthony H. Cordesman, all rights reserved.
Middle Eastern Oil, Import Dependence, Demographics and Economics 12/10/02 Page 7
Chart One
Middle Eastern Oil Reserves Continue to Dominate Total World Reserves (In Billions of Barrels)
Source: BP Amoco, Statistical Review of World Energy, 2002, June 2002, www.bpamoco.com/alive.
Copyright Anthony H. Cordesman, all rights reserved.
Middle Eastern Oil, Import Dependence, Demographics and Economics 12/10/02 Page 8
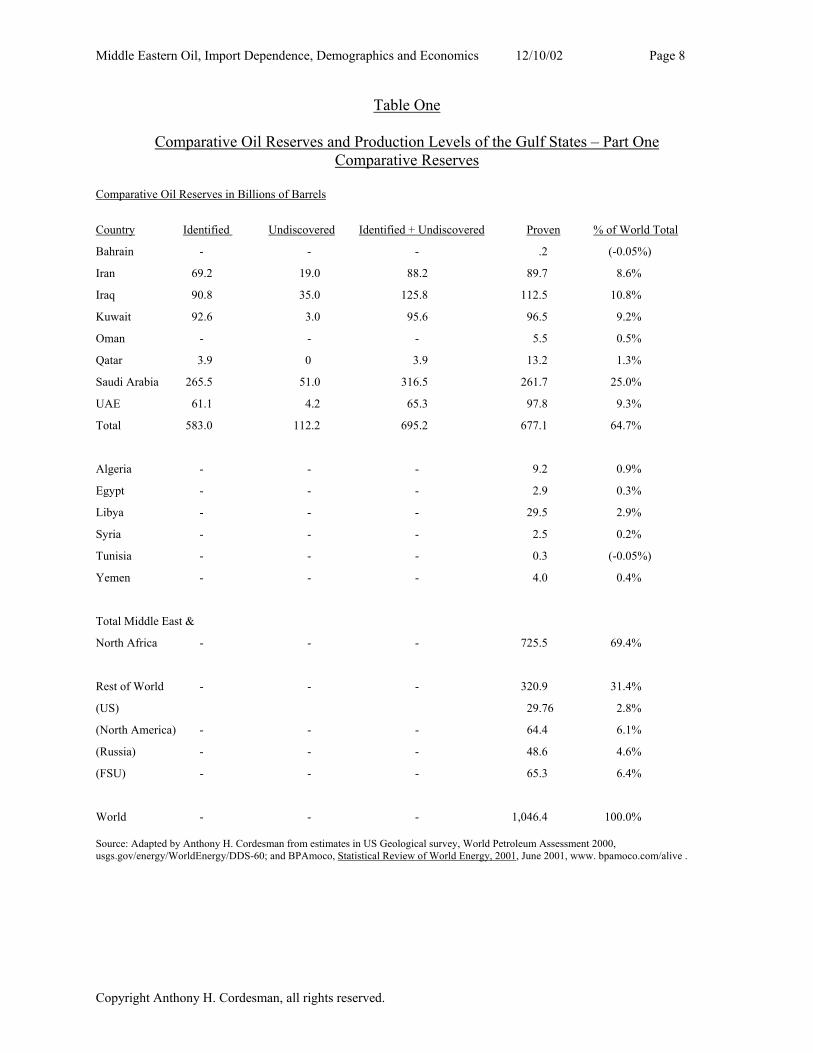
Table One
Comparative Oil Reserves and Production Levels of the Gulf States – Part One Comparative Reserves
Comparative Oil Reserves in Billions of Barrels
Country Identified Undiscovered Identified + Undiscovered Proven % of World Total
Bahrain - - - .2 (-0.05%)
Iran 69.2 19.0 88.2 89.7 8.6%
Iraq 90.8 35.0 125.8 112.5 10.8%
Kuwait 92.6 3.0 95.6 96.5 9.2%
Oman - - - 5.5 0.5%
Qatar 3.9 0 3.9 13.2 1.3%
Saudi Arabia 265.5 51.0 316.5 261.7 25.0%
UAE 61.1 4.2 65.3 97.8 9.3%
Total 583.0 112.2 695.2 677.1 64.7%
Algeria - - - 9.2 0.9%
Egypt - - - 2.9 0.3%
Libya - - - 29.5 2.9%
Syria - - - 2.5 0.2%
Tunisia - - - 0.3 (-0.05%)
Yemen - - - 4.0 0.4%
Total Middle East &
North Africa - - - 725.5 69.4%
Rest of World - - - 320.9 31.4%
(US) 29.76 2.8%
(North America) - - - 64.4 6.1%
(Russia) - - - 48.6 4.6%
(FSU) - - - 65.3 6.4%
World - - - 1,046.4 100.0% Source: Adapted by Anthony H. Cordesman from estimates in US Geological survey, World Petroleum Assessment 2000, usgs.gov/energy/WorldEnergy/DDS-60; and BPAmoco, Statistical Review of World Energy, 2001, June 2001, www. bpamoco.com/alive .
Copyright Anthony H. Cordesman, all rights reserved.
Middle Eastern Oil, Import Dependence, Demographics and Economics 12/10/02 Page 9
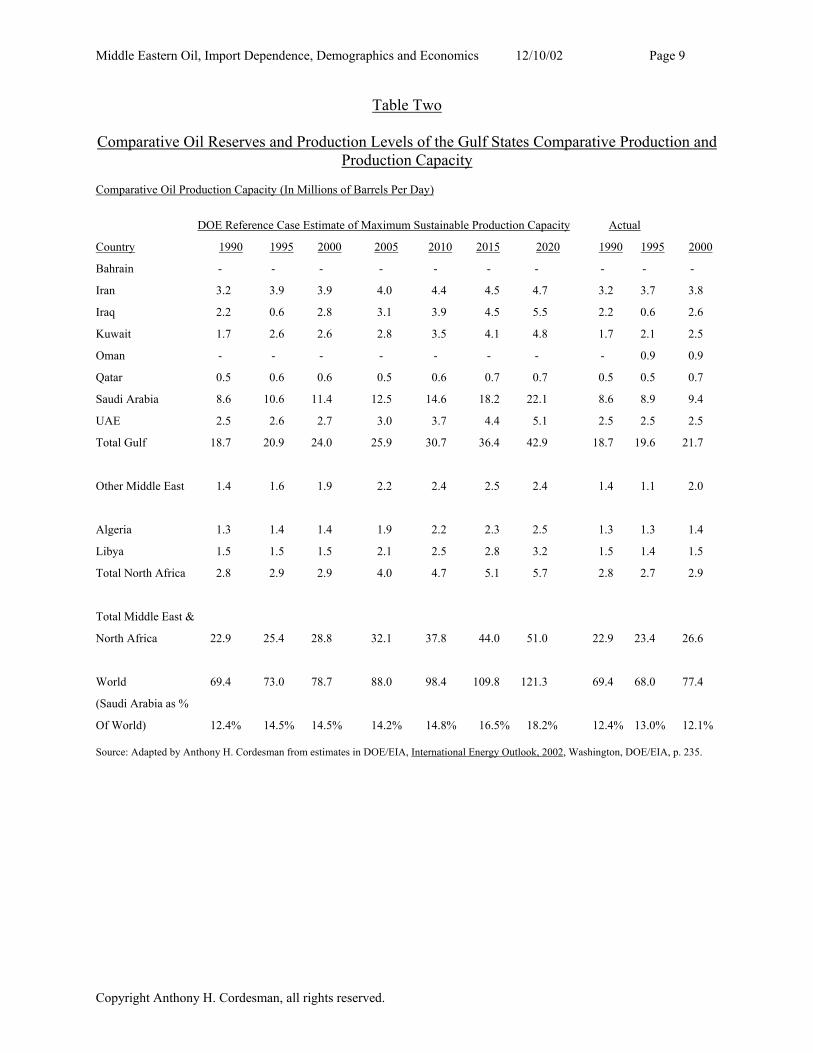
Table Two
Comparative Oil Reserves and Production Levels of the Gulf States Comparative Production and Production Capacity
Comparative Oil Production Capacity (In Millions of Barrels Per Day)
DOE Reference Case Estimate of Maximum Sustainable Production Capacity Actual
Country 1990 1995 2000 2005 2010 2015 2020 1990 1995 2000
Bahrain - - - - - - - - - -
Iran 3.2 3.9 3.9 4.0 4.4 4.5 4.7 3.2 3.7 3.8
Iraq 2.2 0.6 2.8 3.1 3.9 4.5 5.5 2.2 0.6 2.6
Kuwait 1.7 2.6 2.6 2.8 3.5 4.1 4.8 1.7 2.1 2.5
Oman - - - - - - - - 0.9 0.9
Qatar 0.5 0.6 0.6 0.5 0.6 0.7 0.7 0.5 0.5 0.7
Saudi Arabia 8.6 10.6 11.4 12.5 14.6 18.2 22.1 8.6 8.9 9.4
UAE 2.5 2.6 2.7 3.0 3.7 4.4 5.1 2.5 2.5 2.5
Total Gulf 18.7 20.9 24.0 25.9 30.7 36.4 42.9 18.7 19.6 21.7
Other Middle East 1.4 1.6 1.9 2.2 2.4 2.5 2.4 1.4 1.1 2.0
Algeria 1.3 1.4 1.4 1.9 2.2 2.3 2.5 1.3 1.3 1.4
Libya 1.5 1.5 1.5 2.1 2.5 2.8 3.2 1.5 1.4 1.5
Total North Africa 2.8 2.9 2.9 4.0 4.7 5.1 5.7 2.8 2.7 2.9
Total Middle East &
North Africa 22.9 25.4 28.8 32.1 37.8 44.0 51.0 22.9 23.4 26.6
World 69.4 73.0 78.7 88.0 98.4 109.8 121.3 69.4 68.0 77.4
(Saudi Arabia as %
Of World) 12.4% 14.5% 14.5% 14.2% 14.8% 16.5% 18.2% 12.4% 13.0% 12.1% Source: Adapted by Anthony H. Cordesman from estimates in DOE/EIA, International Energy Outlook, 2002, Washington, DOE/EIA, p. 235.
Copyright Anthony H. Cordesman, all rights reserved.
Middle Eastern Oil, Import Dependence, Demographics and Economics 12/10/02 Page 10
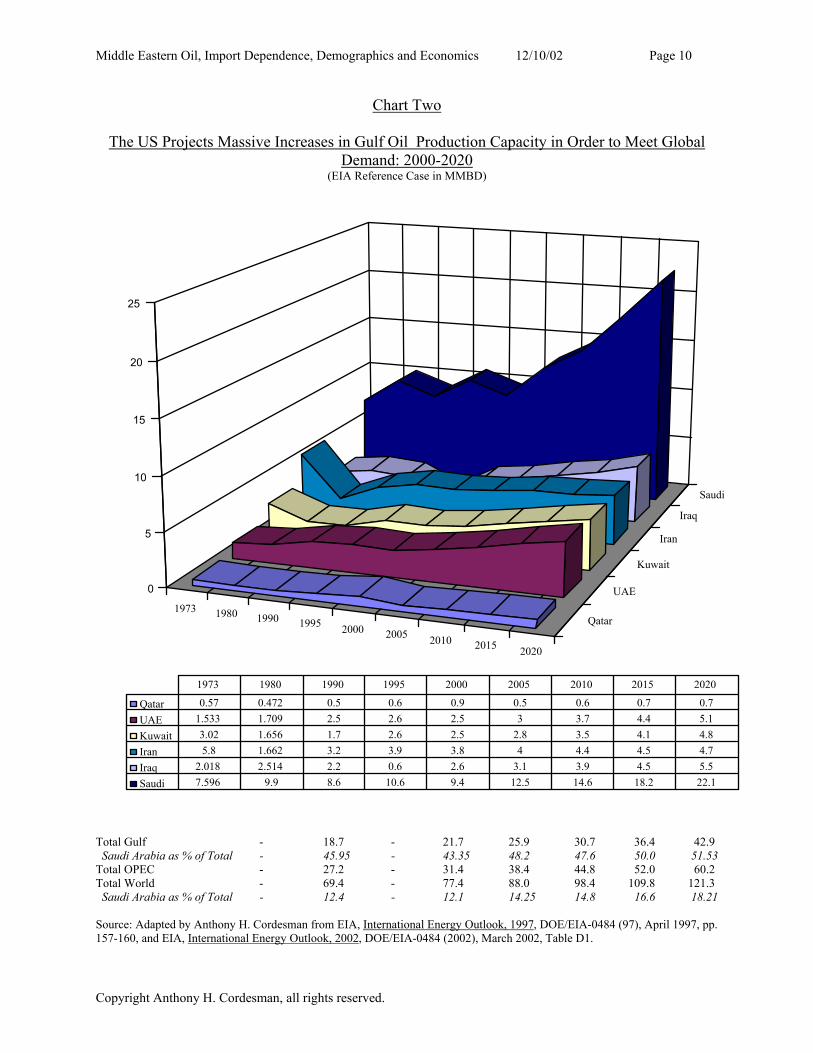
Chart Two
The US Projects Massive Increases in Gulf Oil Production Capacity in Order to Meet Global Demand: 2000-2020
(EIA Reference Case in MMBD)
1973 1980 1990 1995 2000 2005 2010 2015 2020
Qatar
UAE
Kuwait
Iran
Iraq
Saudi
0
5
10
15
20
25
Qatar 0.57 0.472 0.5 0.6 0.9 0.5 0.6 0.7 0.7UAE 1.533 1.709 2.5 2.6 2.5 3 3.7 4.4 5.1Kuwait 3.02 1.656 1.7 2.6 2.5 2.8 3.5 4.1 4.8Iran 5.8 1.662 3.2 3.9 3.8 4 4.4 4.5 4.7Iraq 2.018 2.514 2.2 0.6 2.6 3.1 3.9 4.5 5.5Saudi 7.596 9.9 8.6 10.6 9.4 12.5 14.6 18.2 22.1
1973 1980 1990 1995 2000 2005 2010 2015 2020
Total Gulf - 18.7 - 21.7 25.9 30.7 36.4 42.9 Saudi Arabia as % of Total - 45.95 - 43.35 48.2 47.6 50.0 51.53 Total OPEC - 27.2 - 31.4 38.4 44.8 52.0 60.2 Total World - 69.4 - 77.4 88.0 98.4 109.8 121.3 Saudi Arabia as % of Total - 12.4 - 12.1 14.25 14.8 16.6 18.21 Source: Adapted by Anthony H. Cordesman from EIA, International Energy Outlook, 1997, DOE/EIA-0484 (97), April 1997, pp. 157-160, and EIA, International Energy Outlook, 2002, DOE/EIA-0484 (2002), March 2002, Table D1.
Copyright Anthony H. Cordesman, all rights reserved.
Middle Eastern Oil, Import Dependence, Demographics and Economics 12/10/02 Page 11
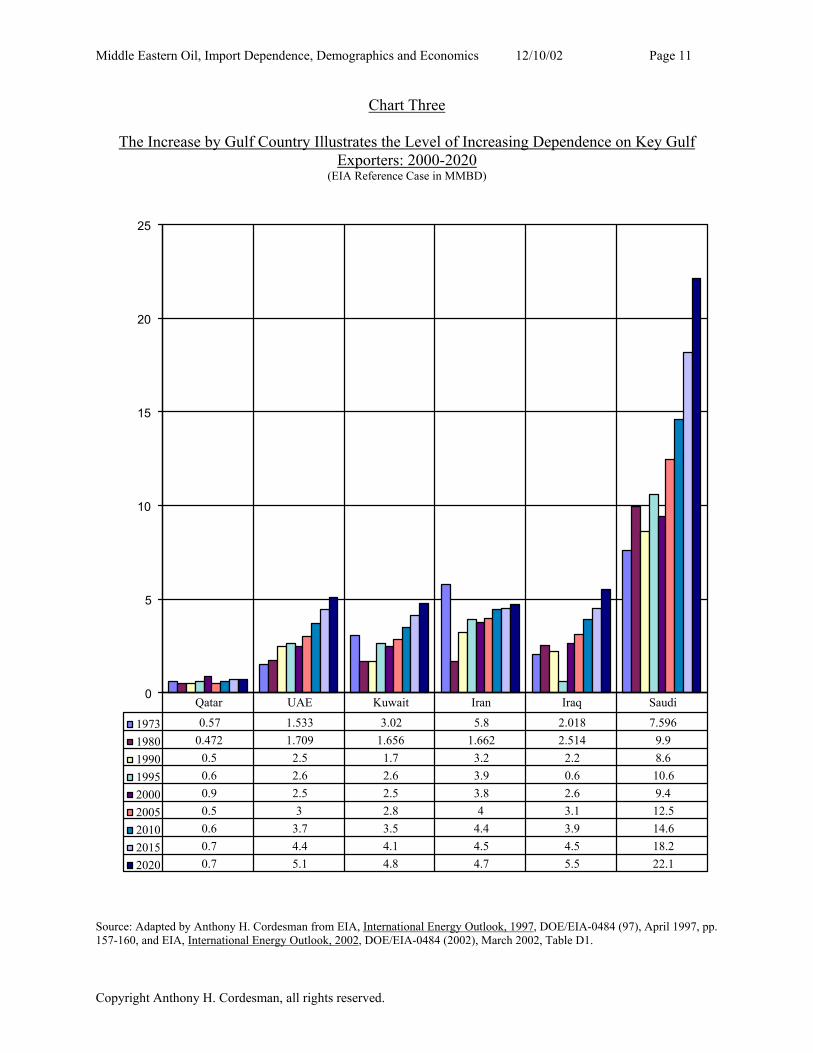
Chart Three
The Increase by Gulf Country Illustrates the Level of Increasing Dependence on Key Gulf Exporters: 2000-2020
(EIA Reference Case in MMBD)
0
5
10
15
20
25
1973 0.57 1.533 3.02 5.8 2.018 7.5961980 0.472 1.709 1.656 1.662 2.514 9.91990 0.5 2.5 1.7 3.2 2.2 8.61995 0.6 2.6 2.6 3.9 0.6 10.62000 0.9 2.5 2.5 3.8 2.6 9.42005 0.5 3 2.8 4 3.1 12.52010 0.6 3.7 3.5 4.4 3.9 14.62015 0.7 4.4 4.1 4.5 4.5 18.22020 0.7 5.1 4.8 4.7 5.5 22.1
Qatar UAE Kuwait Iran Iraq Saudi
Source: Adapted by Anthony H. Cordesman from EIA, International Energy Outlook, 1997, DOE/EIA-0484 (97), April 1997, pp. 157-160, and EIA, International Energy Outlook, 2002, DOE/EIA-0484 (2002), March 2002, Table D1.
Copyright Anthony H. Cordesman, all rights reserved.
Middle Eastern Oil, Import Dependence, Demographics and Economics 12/10/02 Page 12
Chart Four
The Same is True of US Projections of Gulf Oil Exports: Daily Imports by Region 2000 versus 2020
(In Millions of Barrels Per Day)
GulfExports in
2000
WorldExports in
2000
.Gulf
Exports in2020
WorldExports in
2020
0
10
20
30
40
50
60
70
80
90
Rest of World 1.5 5.9 4.3 9.9
China 0.7 1.1 7.1 7.6
Pacific Rim 2.7 5.6 8.7 13.1
Industrial Asia 4.1 5.4 5 6.5
Western Europe 3.2 13.7 3.5 15.6
North America 2.6 10.7 4.9 18.2
TOTAL 14.8 42.4 *33.5 *70.9
Gulf Exports in 2000
World Exports in 2000 . Gulf Exports in
2020World Exports in
2020
Gulf as % of World 34.9% 47.2% Source: Adapted by Anthony H. Cordesman from US Department of Energy, International Energy Outlook, 2002, Washington, Energy Information Agency, March 2002, Table 13, p. 38.
Copyright Anthony H. Cordesman, all rights reserved.
Middle Eastern Oil, Import Dependence, Demographics and Economics 12/10/02 Page 13
Chart Five
The Net Result is Massive Increases in US and Other Industrialized Nation Energy Dependence on Imported Oil
(in Millions of Barrels)
Source: DOE/EIA, International Energy Outlook, June 2002, www.bpamoco.com/alive.
Copyright Anthony H. Cordesman, all rights reserved.
Middle Eastern Oil, Import Dependence, Demographics and Economics 12/10/02 Page 14
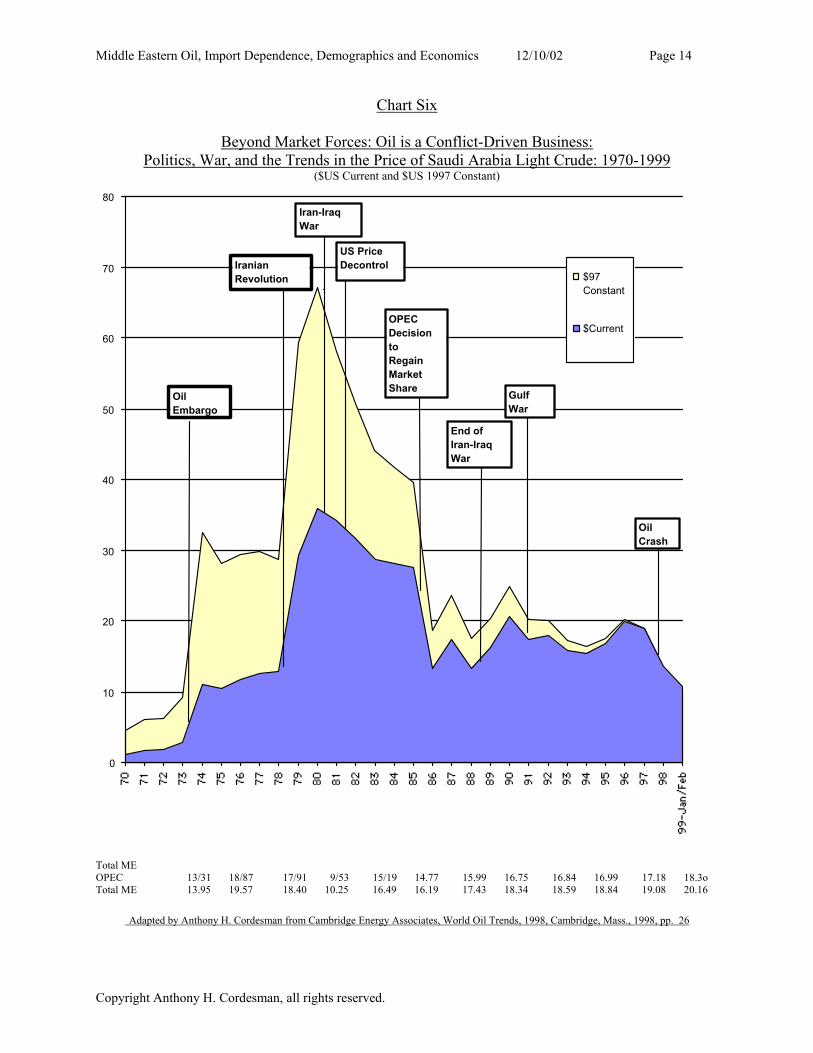
Chart Six
Beyond Market Forces: Oil is a Conflict-Driven Business: Politics, War, and the Trends in the Price of Saudi Arabia Light Crude: 1970-1999
($US Current and $US 1997 Constant)
0
10
20
30
40
50
60
70
80
$97Constant
$Current
Oil Embargo
IranianRevolution
End of Iran-Iraq War
Iran-Iraq War
Gulf War
OilCrash
US PriceDecontrol
OPEC Decision toRegain Market Share
Total ME OPEC 13/31 18/87 17/91 9/53 15/19 14.77 15.99 16.75 16.84 16.99 17.18 18.3o Total ME 13.95 19.57 18.40 10.25 16.49 16.19 17.43 18.34 18.59 18.84 19.08 20.16
Adapted by Anthony H. Cordesman from Cambridge Energy Associates, World Oil Trends, 1998, Cambridge, Mass., 1998, pp. 26
Copyright Anthony H. Cordesman, all rights reserved.
Middle Eastern Oil, Import Dependence, Demographics and Economics 12/10/02 Page 15
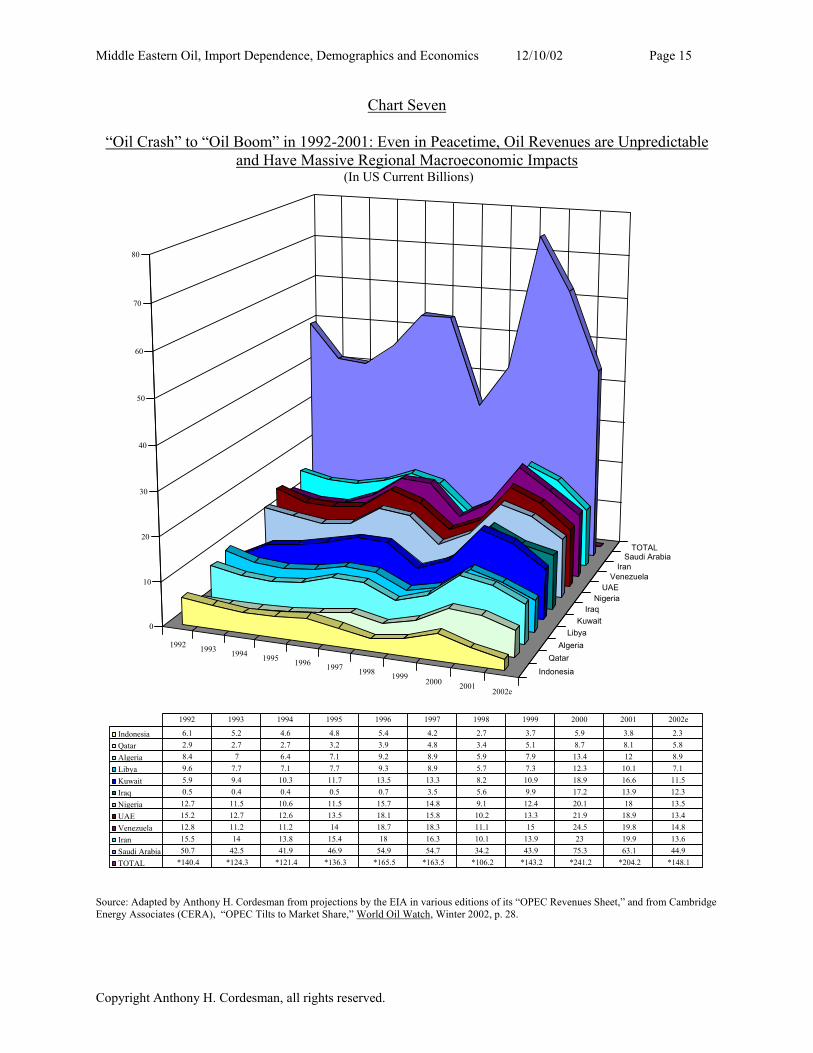
Chart Seven
“Oil Crash” to “Oil Boom” in 1992-2001: Even in Peacetime, Oil Revenues are Unpredictable and Have Massive Regional Macroeconomic Impacts
(In US Current Billions)
1992 1993 1994 1995 1996 1997 1998 19992000 2001
2002e
IndonesiaQatar
AlgeriaLibya
KuwaitIraq
NigeriaUAE
VenezuelaIran
Saudi ArabiaTOTAL
TOTALVenezuela
UAE
Libya
0
10
20
30
40
50
60
70
80
Indonesia 6.1 5.2 4.6 4.8 5.4 4.2 2.7 3.7 5.9 3.8 2.3Qatar 2.9 2.7 2.7 3.2 3.9 4.8 3.4 5.1 8.7 8.1 5.8Algeria 8.4 7 6.4 7.1 9.2 8.9 5.9 7.9 13.4 12 8.9Libya 9.6 7.7 7.1 7.7 9.3 8.9 5.7 7.3 12.3 10.1 7.1Kuwait 5.9 9.4 10.3 11.7 13.5 13.3 8.2 10.9 18.9 16.6 11.5Iraq 0.5 0.4 0.4 0.5 0.7 3.5 5.6 9.9 17.2 13.9 12.3Nigeria 12.7 11.5 10.6 11.5 15.7 14.8 9.1 12.4 20.1 18 13.5UAE 15.2 12.7 12.6 13.5 18.1 15.8 10.2 13.3 21.9 18.9 13.4Venezuela 12.8 11.2 11.2 14 18.7 18.3 11.1 15 24.5 19.8 14.8Iran 15.5 14 13.8 15.4 18 16.3 10.1 13.9 23 19.9 13.6Saudi Arabia 50.7 42.5 41.9 46.9 54.9 54.7 34.2 43.9 75.3 63.1 44.9TOTAL *140.4 *124.3 *121.4 *136.3 *165.5 *163.5 *106.2 *143.2 *241.2 *204.2 *148.1
1992 1993 1994 1995 1996 1997 1998 1999 2000 2001 2002e
Source: Adapted by Anthony H. Cordesman from projections by the EIA in various editions of its “OPEC Revenues Sheet,” and from Cambridge Energy Associates (CERA), “OPEC Tilts to Market Share,” World Oil Watch, Winter 2002, p. 28.
Copyright Anthony H. Cordesman, all rights reserved.
Middle Eastern Oil, Import Dependence, Demographics and Economics 12/10/02 Page 16
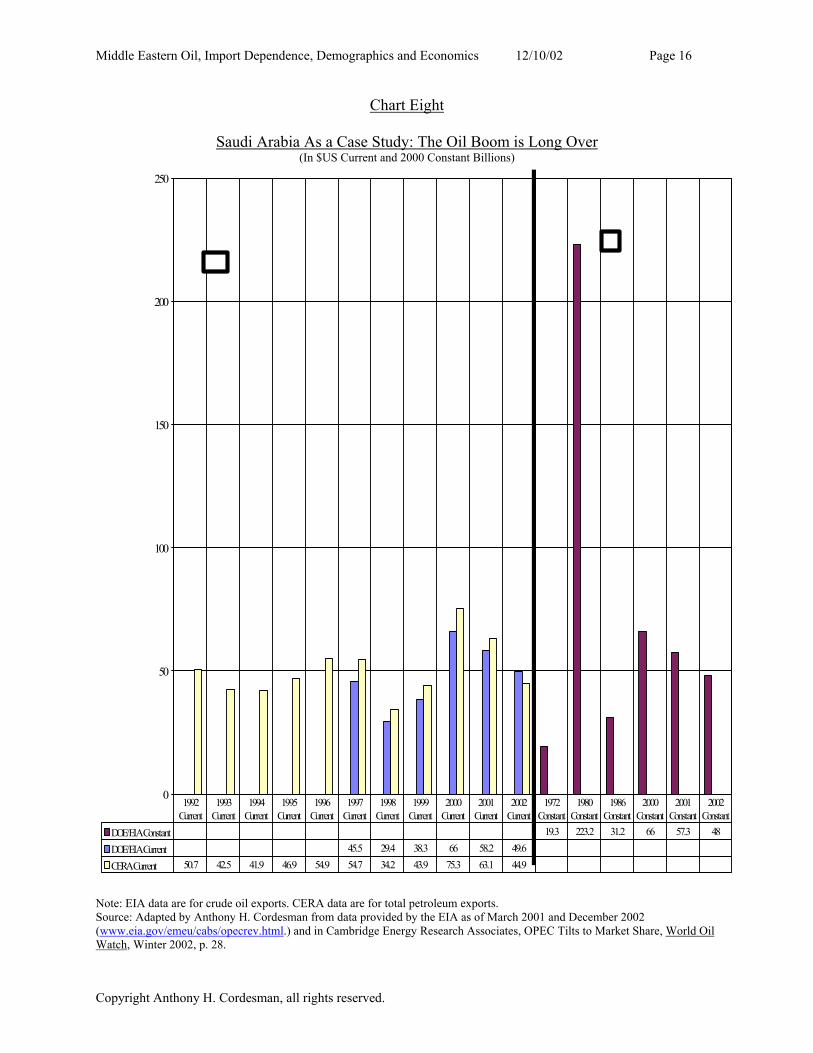
Chart Eight
Saudi Arabia As a Case Study: The Oil Boom is Long Over (In $US Current and 2000 Constant Billions)
0
50
100
150
200
250
DOE/EIA Constant 19.3 223.2 31.2 66 57.3 48
DOE/EIA Current 45.5 29.4 38.3 66 58.2 49.6
CERA Current 50.7 42.5 41.9 46.9 54.9 54.7 34.2 43.9 75.3 63.1 44.9
1992 Current
1993 Current
1994 Current
1995 Current
1996 Current
1997 Current
1998 Current
1999 Current
2000 Current
2001 Current
2002 Current
1972 Constant
1980 Constant
1986 Constant
2000 Constant
2001 Constant
2002 Constant
Note: EIA data are for crude oil exports. CERA data are for total petroleum exports. Source: Adapted by Anthony H. Cordesman from data provided by the EIA as of March 2001 and December 2002 (www.eia.gov/emeu/cabs/opecrev.html.) and in Cambridge Energy Research Associates, OPEC Tilts to Market Share, World Oil Watch, Winter 2002, p. 28.
Copyright Anthony H. Cordesman, all rights reserved.
Middle Eastern Oil, Import Dependence, Demographics and Economics 12/10/02 Page 17
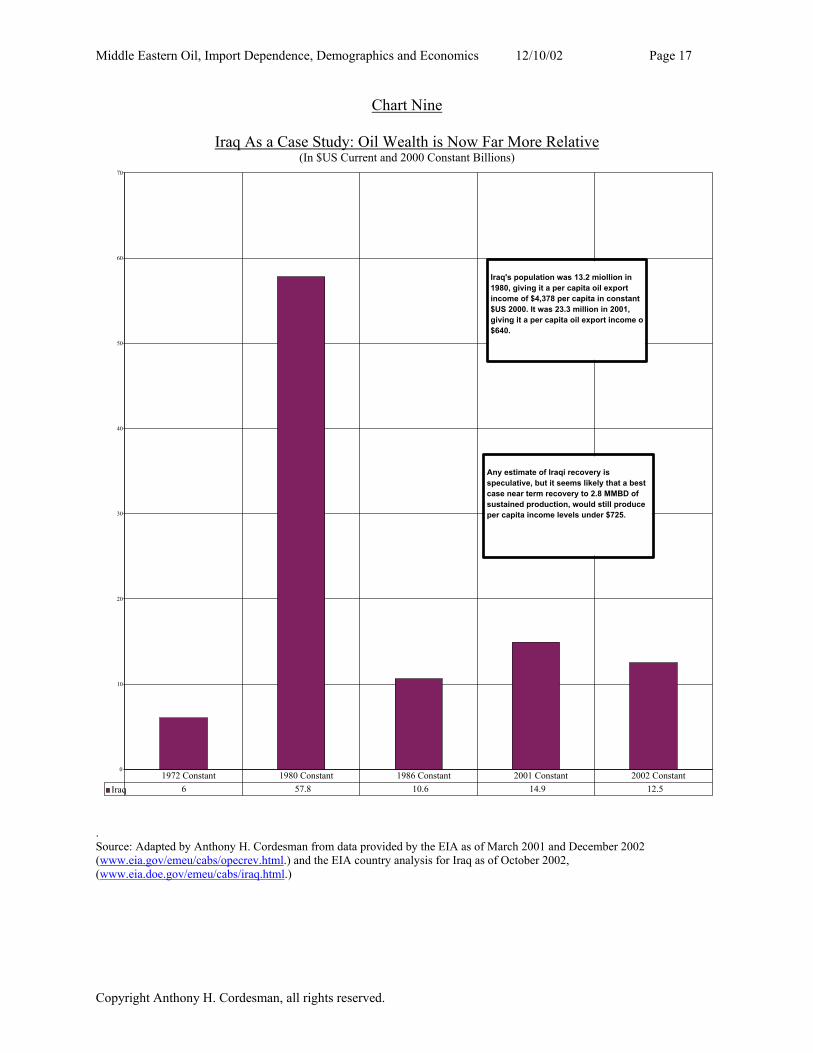
Chart Nine
Iraq As a Case Study: Oil Wealth is Now Far More Relative (In $US Current and 2000 Constant Billions)
0
10
20
30
40
50
60
70
Iraq 6 57.8 10.6 14.9 12.51972 Constant 1980 Constant 1986 Constant 2001 Constant 2002 Constant
Iraq's population was 13.2 miollion in 1980, giving it a per capita oil export income of $4,378 per capita in constant $US 2000. It was 23.3 million in 2001, giving it a per capita oil export income o$640.
Any estimate of Iraqi recovery is speculative, but it seems likely that a best case near term recovery to 2.8 MMBD of sustained production, would still produce per capita income levels under $725.
. Source: Adapted by Anthony H. Cordesman from data provided by the EIA as of March 2001 and December 2002 (www.eia.gov/emeu/cabs/opecrev.html.) and the EIA country analysis for Iraq as of October 2002, (www.eia.doe.gov/emeu/cabs/iraq.html.)
Copyright Anthony H. Cordesman, all rights reserved.
Middle Eastern Oil, Import Dependence, Demographics and Economics 12/10/02 Page 18
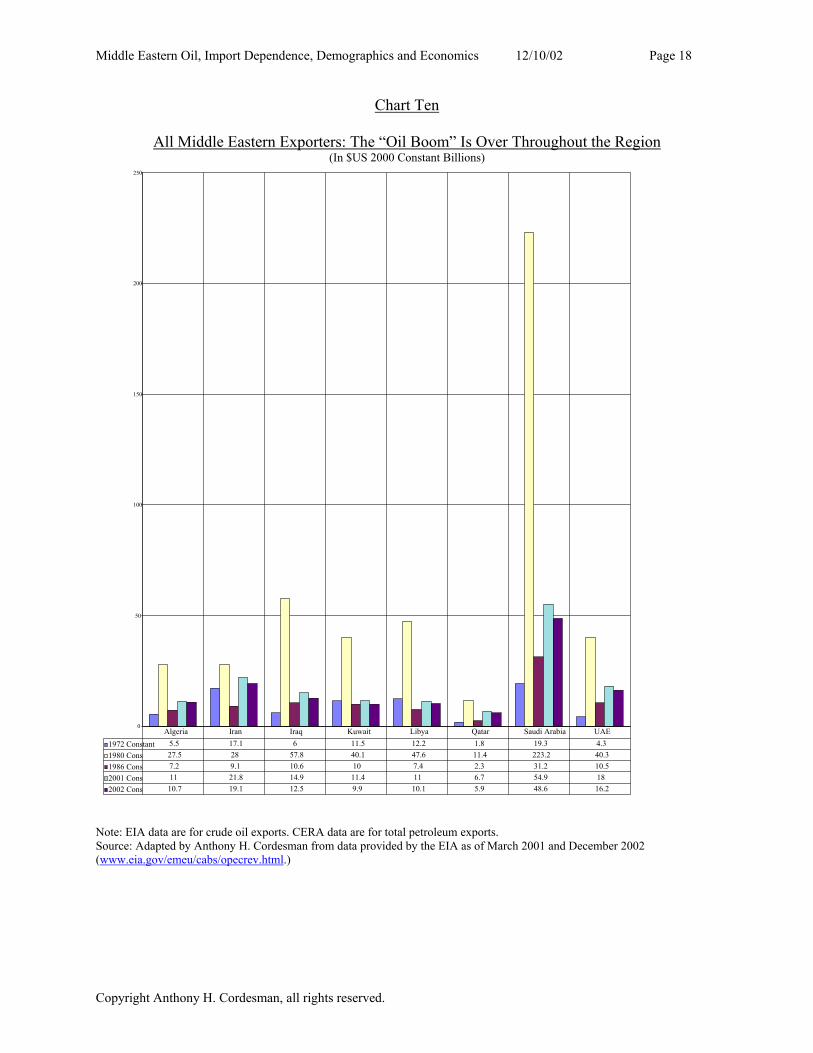
Chart Ten
All Middle Eastern Exporters: The “Oil Boom” Is Over Throughout the Region (In $US 2000 Constant Billions)
0
50
100
150
200
250
1972 Constant 5.5 17.1 6 11.5 12.2 1.8 19.3 4.31980 Cons 27.5 28 57.8 40.1 47.6 11.4 223.2 40.31986 Cons 7.2 9.1 10.6 10 7.4 2.3 31.2 10.52001 Cons 11 21.8 14.9 11.4 11 6.7 54.9 182002 Cons 10.7 19.1 12.5 9.9 10.1 5.9 48.6 16.2
Algeria Iran Iraq Kuwait Libya Qatar Saudi Arabia UAE
Note: EIA data are for crude oil exports. CERA data are for total petroleum exports. Source: Adapted by Anthony H. Cordesman from data provided by the EIA as of March 2001 and December 2002 (www.eia.gov/emeu/cabs/opecrev.html.)
Copyright Anthony H. Cordesman, all rights reserved.
Middle Eastern Oil, Import Dependence, Demographics and Economics 12/10/02 Page 19
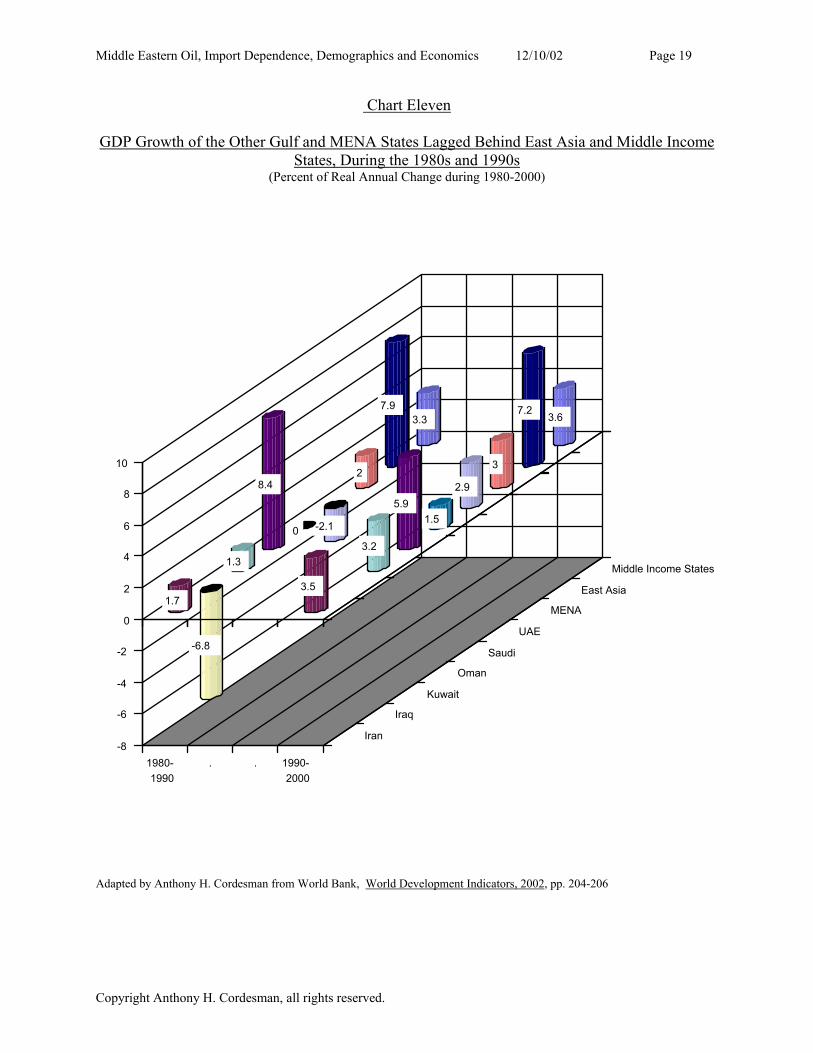
Chart Eleven
GDP Growth of the Other Gulf and MENA States Lagged Behind East Asia and Middle Income States, During the 1980s and 1990s
(Percent of Real Annual Change during 1980-2000)
3.3 3.67.9 7.2
23
-2.1
2.9
01.5
8.4
5.9
1.33.2
-6.8
1.73.5
-8
-6
-4
-2
0
2
4
6
8
10
1980-1990
. . 1990-2000
Iran
Iraq
Kuwait
Oman
Saudi
UAE
MENA
East Asia
Middle Income States
Adapted by Anthony H. Cordesman from World Bank, World Development Indicators, 2002, pp. 204-206
Copyright Anthony H. Cordesman, all rights reserved.
Middle Eastern Oil, Import Dependence, Demographics and Economics 12/10/02 Page 20
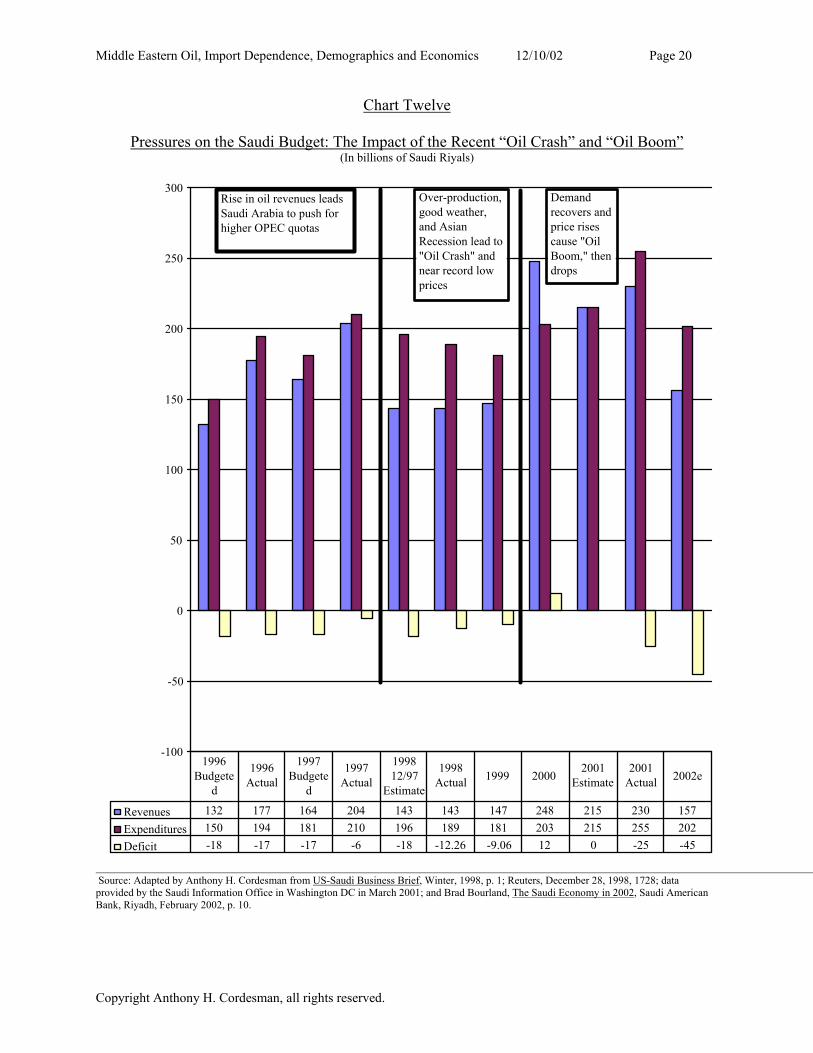
Chart Twelve
Pressures on the Saudi Budget: The Impact of the Recent “Oil Crash” and “Oil Boom” (In billions of Saudi Riyals)
-100
-50
0
50
100
150
200
250
300
Revenues 132 177 164 204 143 143 147 248 215 230 157Expenditures 150 194 181 210 196 189 181 203 215 255 202Deficit -18 -17 -17 -6 -18 -12.26 -9.06 12 0 -25 -45
1996 Budgete
d
1996 Actual
1997 Budgete
d
1997 Actual
1998 12/97
Estimate
1998 Actual 1999 2000
2001 Estimate
2001 Actual 2002e
Rise in oil revenues leads Saudi Arabia to push for higher OPEC quotas
Over-production, good weather, and Asian Recession lead to "Oil Crash" and near record low prices
Demand recovers and price rises cause "Oil Boom," then drops
Source: Adapted by Anthony H. Cordesman from US-Saudi Business Brief, Winter, 1998, p. 1; Reuters, December 28, 1998, 1728; data provided by the Saudi Information Office in Washington DC in March 2001; and Brad Bourland, The Saudi Economy in 2002, Saudi American Bank, Riyadh, February 2002, p. 10.
Copyright Anthony H. Cordesman, all rights reserved.
Middle Eastern Oil, Import Dependence, Demographics and Economics 12/10/02 Page 21
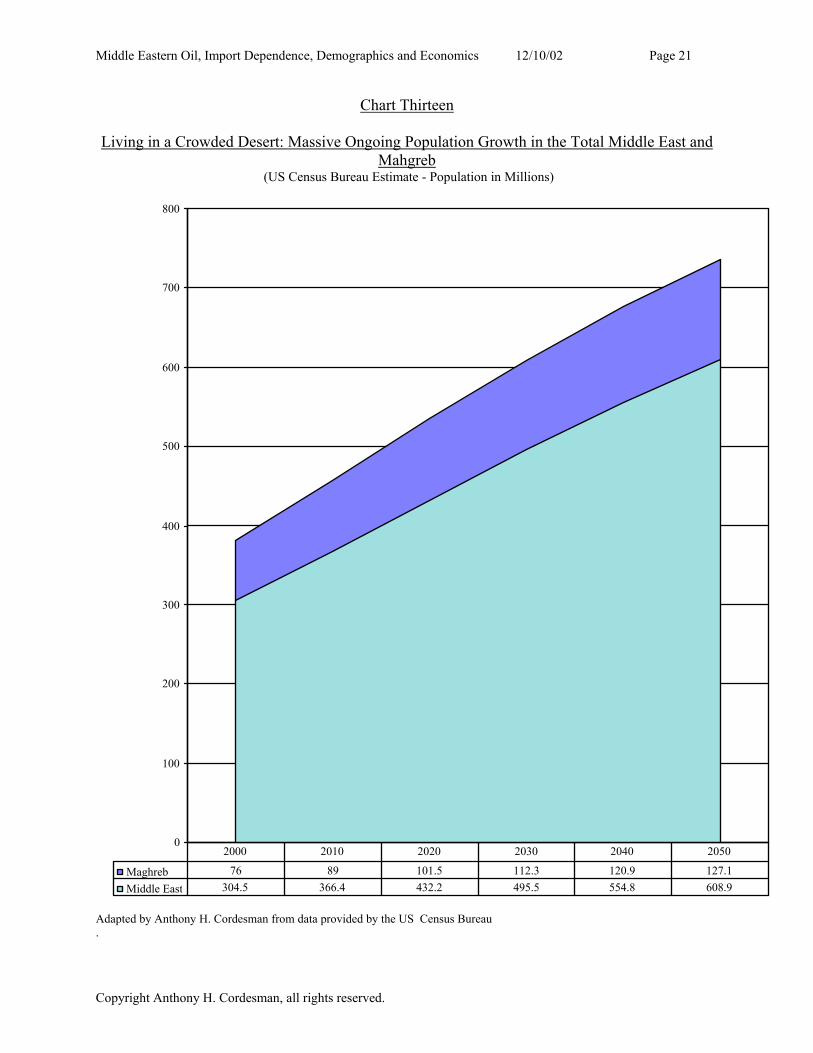
Chart Thirteen
Living in a Crowded Desert: Massive Ongoing Population Growth in the Total Middle East and Mahgreb
(US Census Bureau Estimate - Population in Millions)
0
100
200
300
400
500
600
700
800
Maghreb 76 89 101.5 112.3 120.9 127.1Middle East 304.5 366.4 432.2 495.5 554.8 608.9
2000 2010 2020 2030 2040 2050
Adapted by Anthony H. Cordesman from data provided by the US Census Bureau .
Copyright Anthony H. Cordesman, all rights reserved.
Middle Eastern Oil, Import Dependence, Demographics and Economics 12/10/02 Page 22
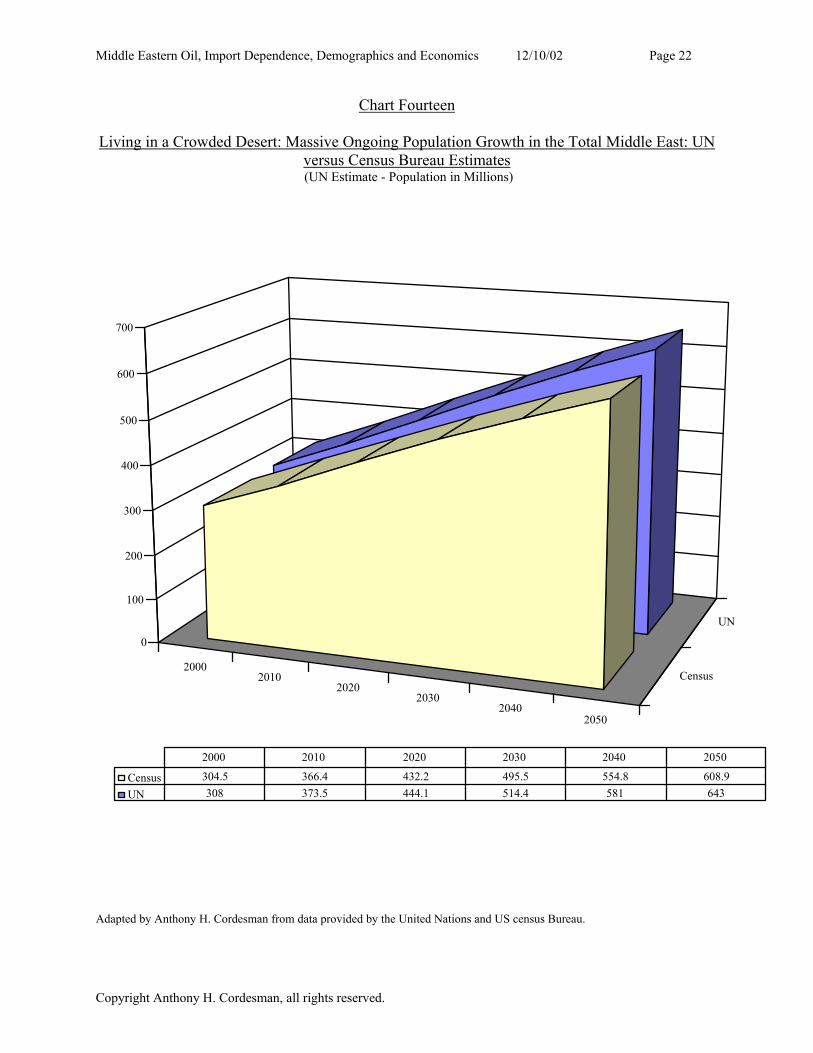
Chart Fourteen
Living in a Crowded Desert: Massive Ongoing Population Growth in the Total Middle East: UN versus Census Bureau Estimates (UN Estimate - Population in Millions)
20002010
20202030
20402050
Census
UN
0
100
200
300
400
500
600
700
Census 304.5 366.4 432.2 495.5 554.8 608.9UN 308 373.5 444.1 514.4 581 643
2000 2010 2020 2030 2040 2050
Adapted by Anthony H. Cordesman from data provided by the United Nations and US census Bureau.
Copyright Anthony H. Cordesman, all rights reserved.

Middle Eastern Oil, Import Dependence, Demographics and Economics 12/10/02 Page 23
Chart Fifteen
Living in a Crowded Desert: Massive Ongoing Population Growth in the Total Middle East and a Continuing “Youth Explosion” (UN Estimate - Population in Millions)
20002010
20202030
20402050
Age 15-19
Age 20-24
Under 20
Total
0
100
200
300
400
500
600
700
Age 15-19 34.2 37.7 39.9 43.5 46.9 48.2Age 20-24 28.8 36.2 38 41.2 45.7 47.2Under 20 147.6 157.8 171.1 183.9 192.2 199.3Total 308 373.5 444.1 514.4 581 643
2000 2010 2020 2030 2040 2050
Adapted by Anthony H. Cordesman from data provided by the United Nations. .
Copyright Anthony H. Cordesman, all rights reserved.
Middle Eastern Oil, Import Dependence, Demographics and Economics 12/10/02 Page 24
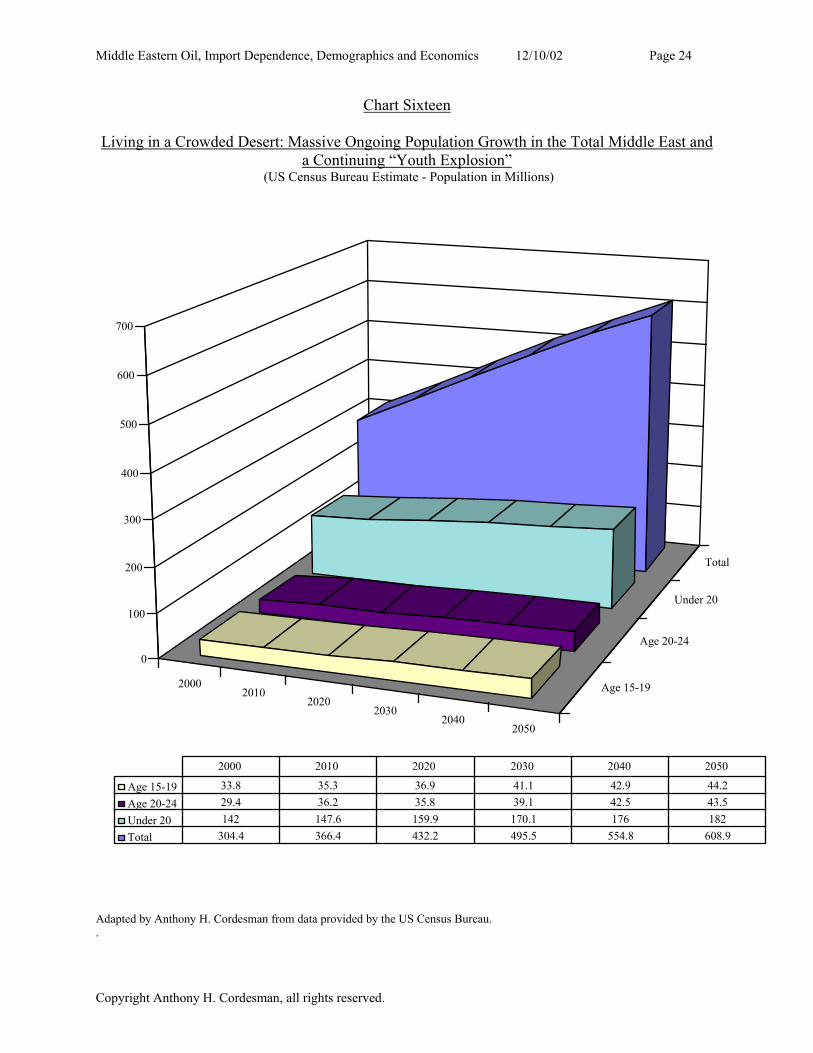
Chart Sixteen
Living in a Crowded Desert: Massive Ongoing Population Growth in the Total Middle East and a Continuing “Youth Explosion”
(US Census Bureau Estimate - Population in Millions)
20002010
20202030
20402050
Age 15-19
Age 20-24
Under 20
Total
0
100
200
300
400
500
600
700
Age 15-19 33.8 35.3 36.9 41.1 42.9 44.2Age 20-24 29.4 36.2 35.8 39.1 42.5 43.5Under 20 142 147.6 159.9 170.1 176 182Total 304.4 366.4 432.2 495.5 554.8 608.9
2000 2010 2020 2030 2040 2050
Adapted by Anthony H. Cordesman from data provided by the US Census Bureau. .
Copyright Anthony H. Cordesman, all rights reserved.
Middle Eastern Oil, Import Dependence, Demographics and Economics 12/10/02 Page 25
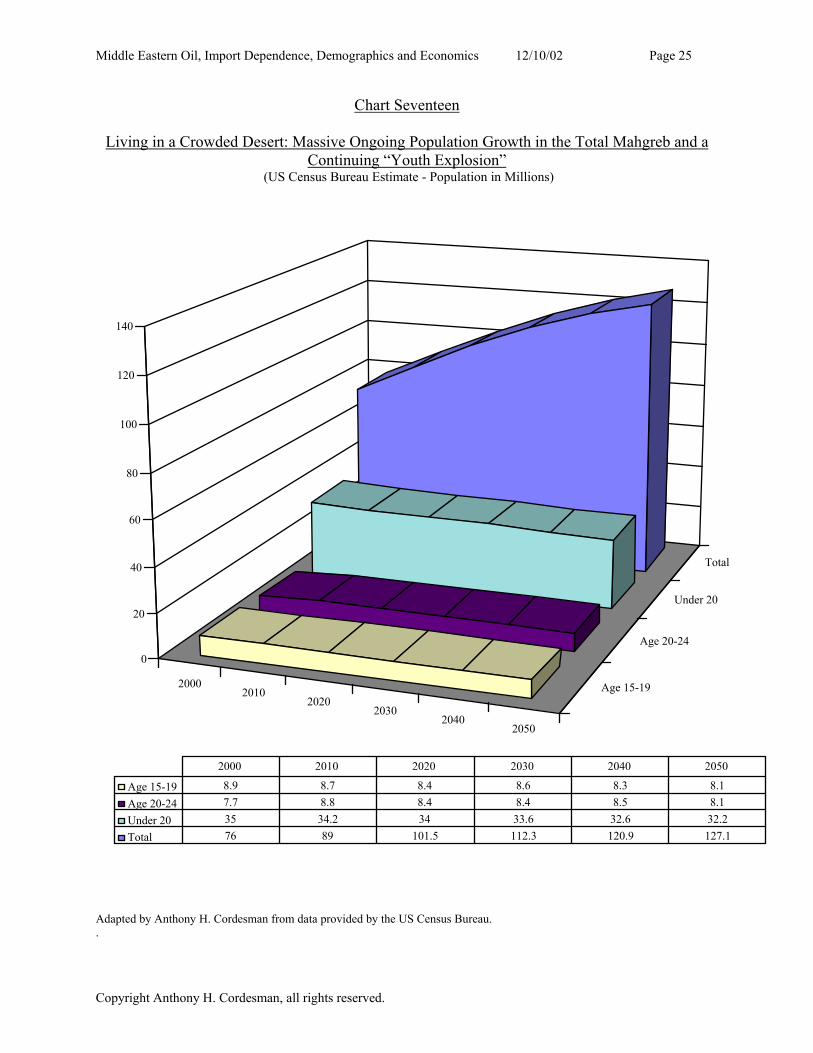
Chart Seventeen
Living in a Crowded Desert: Massive Ongoing Population Growth in the Total Mahgreb and a Continuing “Youth Explosion”
(US Census Bureau Estimate - Population in Millions)
20002010
20202030
20402050
Age 15-19
Age 20-24
Under 20
Total
0
20
40
60
80
100
120
140
Age 15-19 8.9 8.7 8.4 8.6 8.3 8.1Age 20-24 7.7 8.8 8.4 8.4 8.5 8.1Under 20 35 34.2 34 33.6 32.6 32.2Total 76 89 101.5 112.3 120.9 127.1
2000 2010 2020 2030 2040 2050
Adapted by Anthony H. Cordesman from data provided by the US Census Bureau. .
Copyright Anthony H. Cordesman, all rights reserved.
Middle Eastern Oil, Import Dependence, Demographics and Economics 12/10/02 Page 26
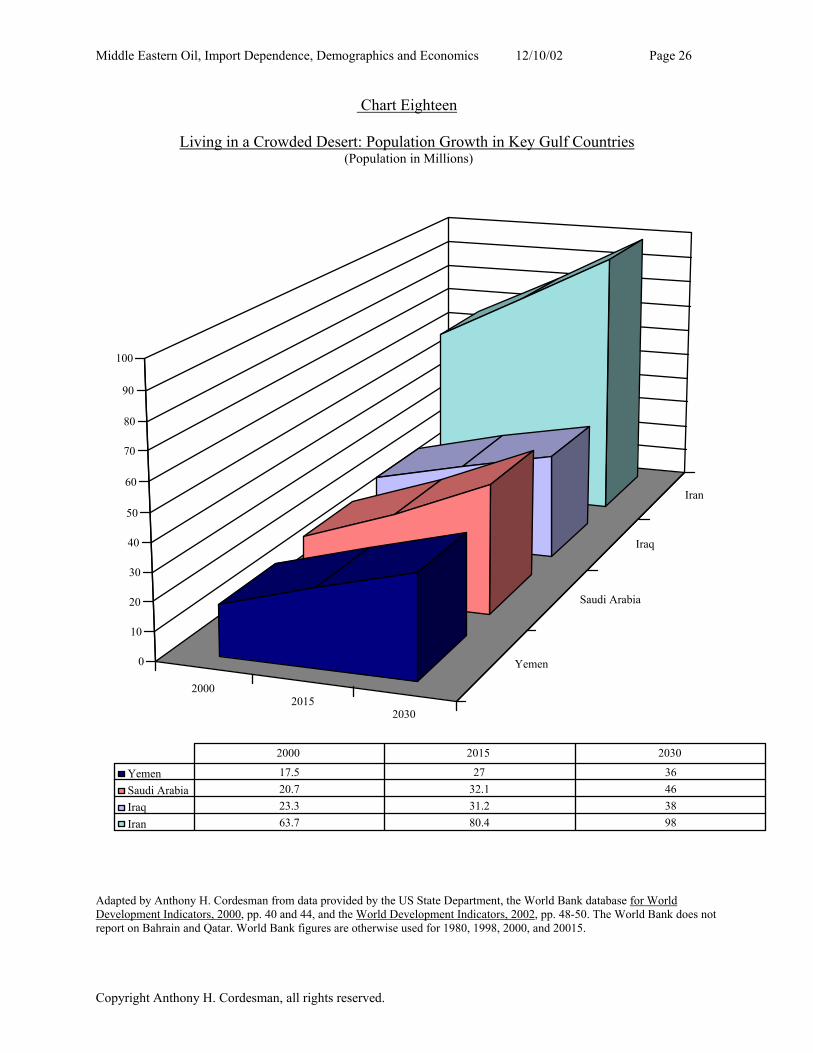
Chart Eighteen
Living in a Crowded Desert: Population Growth in Key Gulf Countries (Population in Millions)
20002015
2030
Yemen
Saudi Arabia
Iraq
Iran
0
10
20
30
40
50
60
70
80
90
100
Yemen 17.5 27 36Saudi Arabia 20.7 32.1 46Iraq 23.3 31.2 38Iran 63.7 80.4 98
2000 2015 2030
Adapted by Anthony H. Cordesman from data provided by the US State Department, the World Bank database for World Development Indicators, 2000, pp. 40 and 44, and the World Development Indicators, 2002, pp. 48-50. The World Bank does not report on Bahrain and Qatar. World Bank figures are otherwise used for 1980, 1998, 2000, and 20015.
Copyright Anthony H. Cordesman, all rights reserved.
Middle Eastern Oil, Import Dependence, Demographics and Economics 12/10/02 Page 27
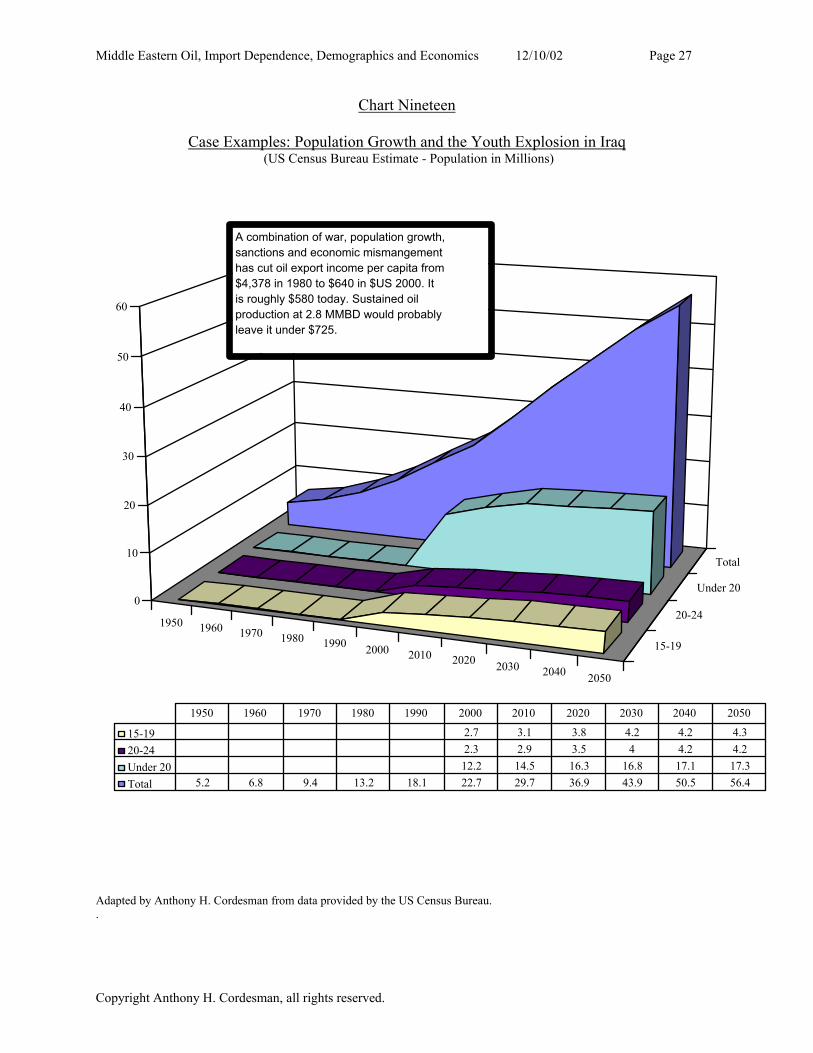
Chart Nineteen
Case Examples: Population Growth and the Youth Explosion in Iraq (US Census Bureau Estimate - Population in Millions)
1950 1960 1970 1980 1990 2000 2010 2020 2030 2040 2050
15-19
20-24
Under 20
Total
0
10
20
30
40
50
60
15-19 2.7 3.1 3.8 4.2 4.2 4.320-24 2.3 2.9 3.5 4 4.2 4.2Under 20 12.2 14.5 16.3 16.8 17.1 17.3Total 5.2 6.8 9.4 13.2 18.1 22.7 29.7 36.9 43.9 50.5 56.4
1950 1960 1970 1980 1990 2000 2010 2020 2030 2040 2050
A combination of war, population growth, sanctions and economic mismangement has cut oil export income per capita from $4,378 in 1980 to $640 in $US 2000. It is roughly $580 today. Sustained oil production at 2.8 MMBD would probably leave it under $725.
Adapted by Anthony H. Cordesman from data provided by the US Census Bureau. .
Copyright Anthony H. Cordesman, all rights reserved.
Middle Eastern Oil, Import Dependence, Demographics and Economics 12/10/02 Page 28
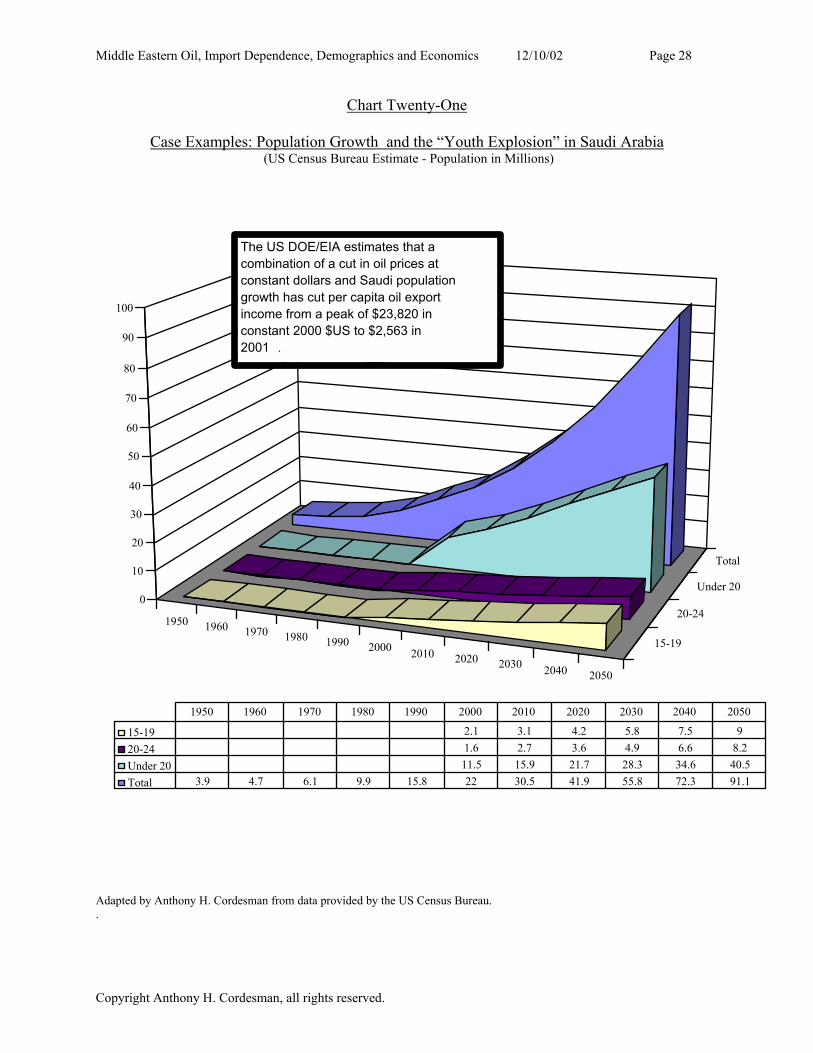
Chart Twenty-One
Case Examples: Population Growth and the “Youth Explosion” in Saudi Arabia (US Census Bureau Estimate - Population in Millions)
1950 1960 1970 1980 1990 2000 2010 2020 2030 2040 2050
15-19
20-24
Under 20
Total
0
10
20
30
40
50
60
70
80
90
100
15-19 2.1 3.1 4.2 5.8 7.5 920-24 1.6 2.7 3.6 4.9 6.6 8.2Under 20 11.5 15.9 21.7 28.3 34.6 40.5Total 3.9 4.7 6.1 9.9 15.8 22 30.5 41.9 55.8 72.3 91.1
1950 1960 1970 1980 1990 2000 2010 2020 2030 2040 2050
The US DOE/EIA estimates that a combination of a cut in oil prices at constant dollars and Saudi population growth has cut per capita oil export income from a peak of $23,820 in constant 2000 $US to $2,563 in 2001 .
Adapted by Anthony H. Cordesman from data provided by the US Census Bureau. .
Copyright Anthony H. Cordesman, all rights reserved.
Middle Eastern Oil, Import Dependence, Demographics and Economics 12/10/02 Page 29
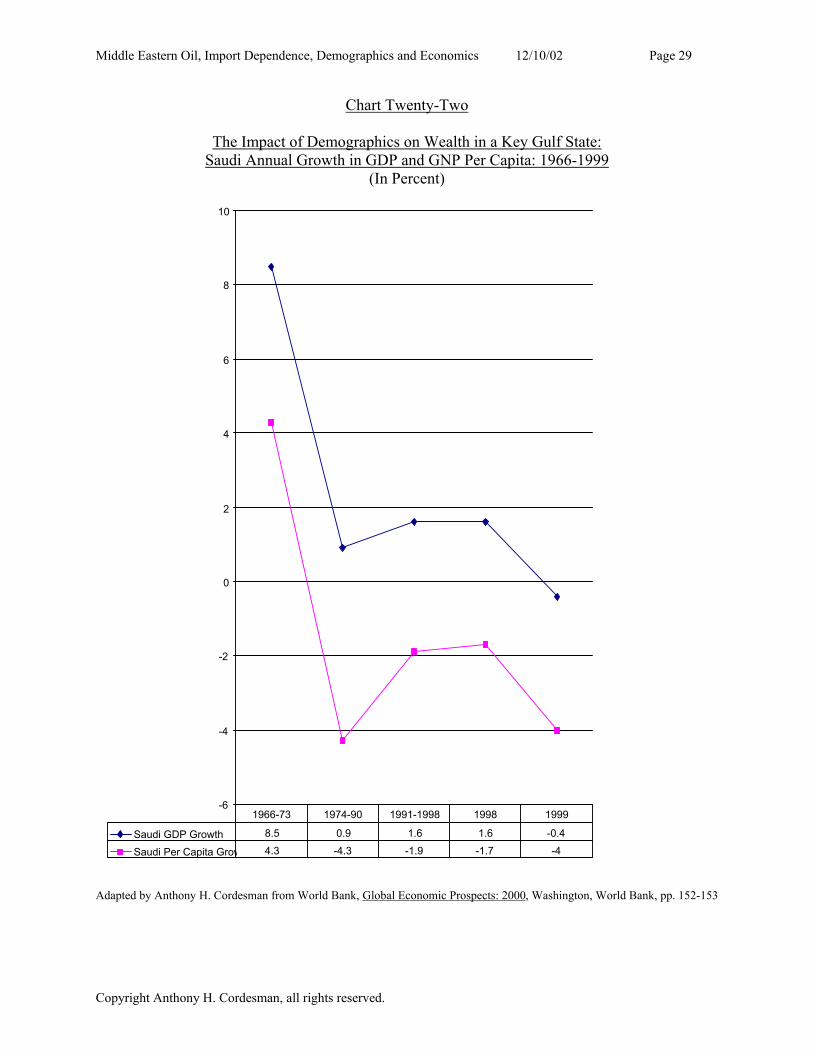
Chart Twenty-Two
The Impact of Demographics on Wealth in a Key Gulf State: Saudi Annual Growth in GDP and GNP Per Capita: 1966-1999
(In Percent)
-6
-4
-2
0
2
4
6
8
10
Saudi GDP Growth 8.5 0.9 1.6 1.6 -0.4
Saudi Per Capita Grow 4.3 -4.3 -1.9 -1.7 -4
1966-73 1974-90 1991-1998 1998 1999
Adapted by Anthony H. Cordesman from World Bank, Global Economic Prospects: 2000, Washington, World Bank, pp. 152-153
Copyright Anthony H. Cordesman, all rights reserved.
Middle Eastern Oil, Import Dependence, Demographics and Economics 12/10/02 Page 30
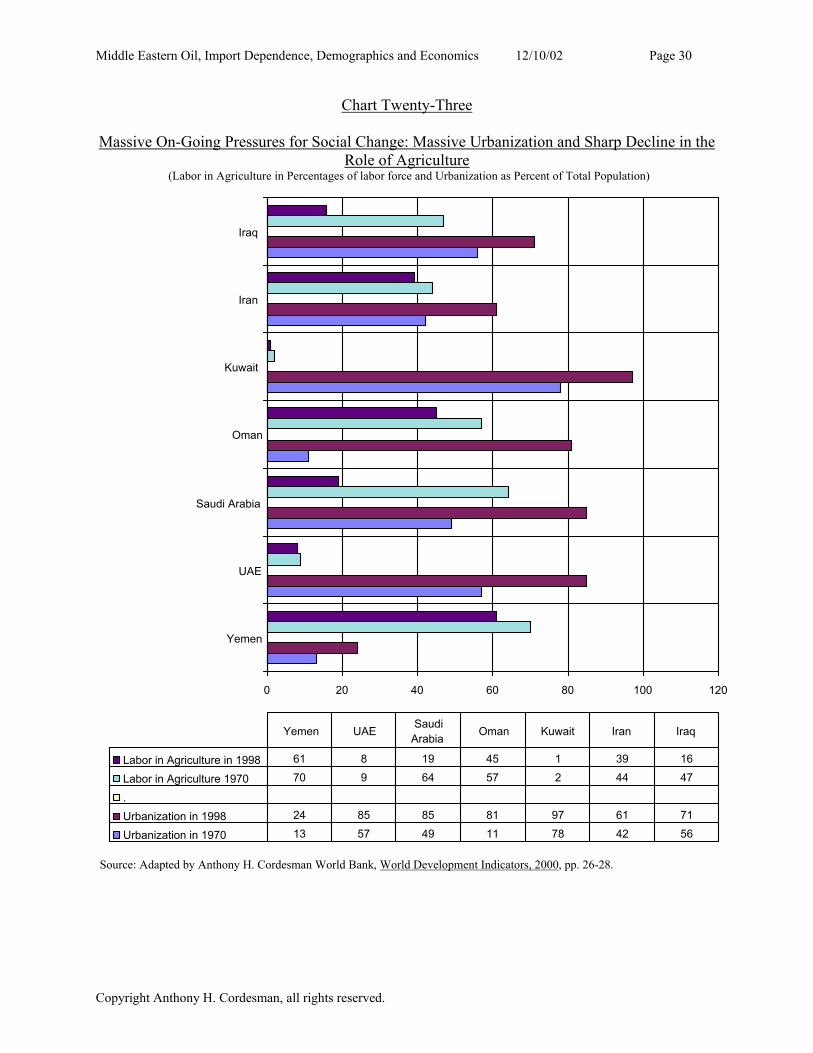
Chart Twenty-Three
Massive On-Going Pressures for Social Change: Massive Urbanization and Sharp Decline in the Role of Agriculture
(Labor in Agriculture in Percentages of labor force and Urbanization as Percent of Total Population)
0 20 40 60 80 100 120
Yemen
UAE
Saudi Arabia
Oman
Kuwait
Iran
Iraq
Labor in Agriculture in 1998 61 8 19 45 1 39 16
Labor in Agriculture 1970 70 9 64 57 2 44 47
.Urbanization in 1998 24 85 85 81 97 61 71
Urbanization in 1970 13 57 49 11 78 42 56
Yemen UAE Saudi Arabia Oman Kuwait Iran Iraq
Source: Adapted by Anthony H. Cordesman World Bank, World Development Indicators, 2000, pp. 26-28.
Copyright Anthony H. Cordesman, all rights reserved.
Middle Eastern Oil, Import Dependence, Demographics and Economics 12/10/02 Page 31
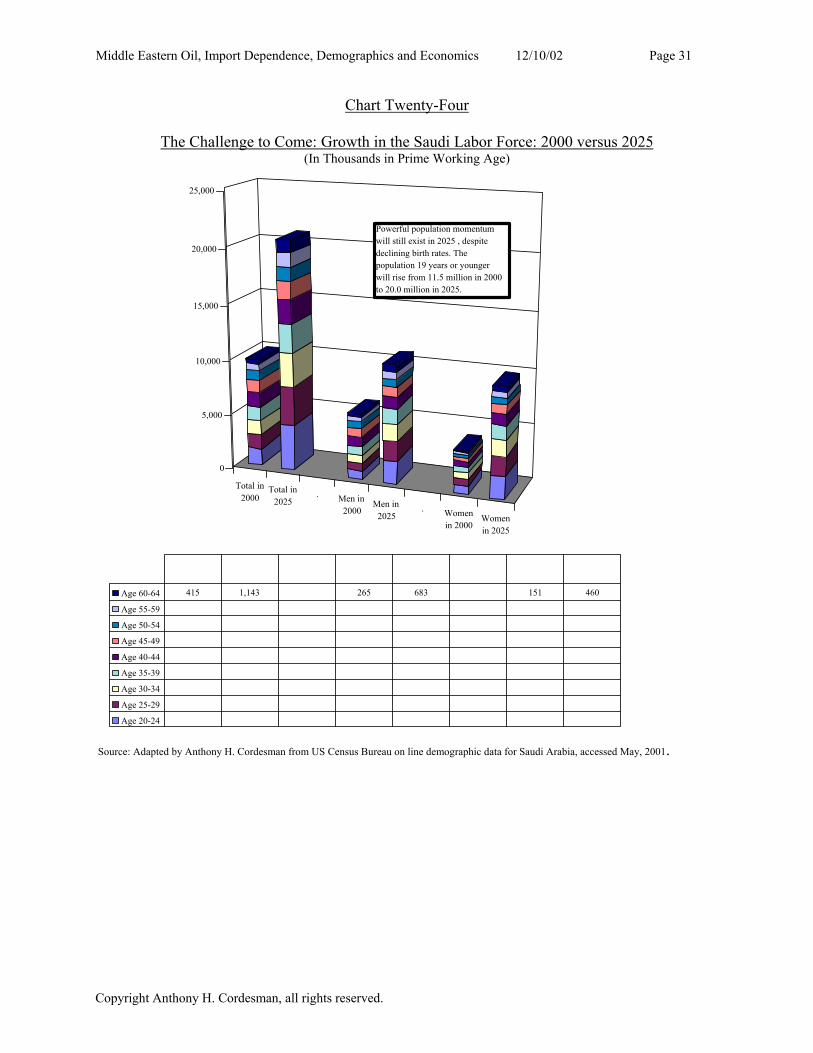
Chart Twenty-Four
The Challenge to Come: Growth in the Saudi Labor Force: 2000 versus 2025 (In Thousands in Prime Working Age)
Total in2000
Total in2025
. Men in2000
Men in2025
. Womenin 2000
Womenin 2025
0
5,000
10,000
15,000
20,000
25,000
Age 60-64 415 1,143 265 683 151 460
Age 55-59
Age 50-54
Age 45-49
Age 40-44
Age 35-39
Age 30-34
Age 25-29
Age 20-24
Powerful population momentum will still exist in 2025 , despite declining birth rates. The population 19 years or younger will rise from 11.5 million in 2000 to 20.0 million in 2025.
Source: Adapted by Anthony H. Cordesman from US Census Bureau on line demographic data for Saudi Arabia, accessed May, 2001.
Copyright Anthony H. Cordesman, all rights reserved.
Middle Eastern Oil, Import Dependence, Demographics and Economics 12/10/02 Page 32
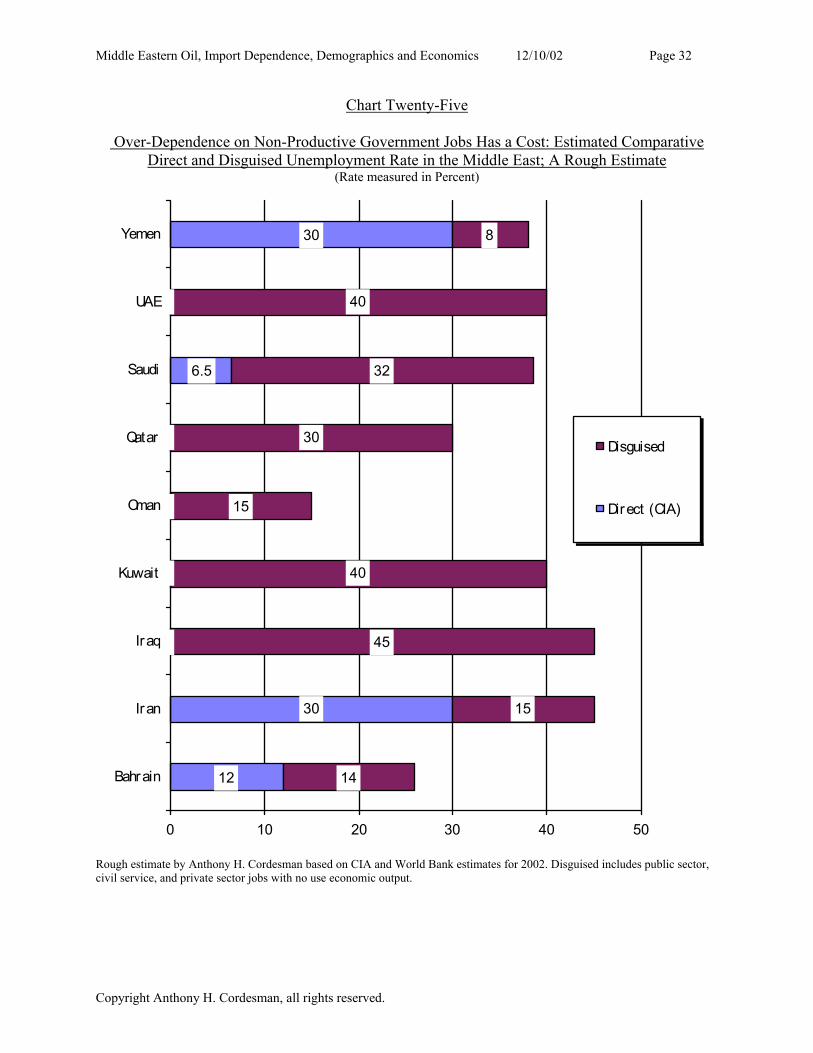
Chart Twenty-Five
Over-Dependence on Non-Productive Government Jobs Has a Cost: Estimated Comparative Direct and Disguised Unemployment Rate in the Middle East; A Rough Estimate
(Rate measured in Percent)
12
30
6.5
30
14
15
45
40
15
30
32
40
8
0 1 0 2 0 3 0 4 0 5 0
B a h r a i n
I r a n
I r a q
K u w a i t
O m a n
Q a t a r
S a u d i
U A E
Y e m e n
D i s g u i s e d
D i r e c t ( C I A )
Rough estimate by Anthony H. Cordesman based on CIA and World Bank estimates for 2002. Disguised includes public sector, civil service, and private sector jobs with no use economic output.
Copyright Anthony H. Cordesman, all rights reserved.
Middle Eastern Oil, Import Dependence, Demographics and Economics 12/10/02 Page 33
i These figures are based on the estimates in the BP Statistical Review of World Energy, June 2002.
iii See the DOE/EIA Annual Energy Outlook, 2002, and International Energy Outlook, 2002.iv CIA, World Factbook 2002.v These data, and the following figures, are based on the reference case projections by DOE EIA in International Energy Outlook, 2002.
ii BP Statistical Review of World Energy, June 2002
vi International Energy Agency, World Energy Outlook, Highlights, 2002, Paris, OECD/IEA, 2002, pp. 26-27, 32, 329
Copyright Anthony H. Cordesman, all rights reserved.