Embed Size (px)
Citation preview
The Use of Checks and Other Noncash Payment Instruments in the United States.
Geoffrey R. Gerdes and Jack K. Walton II, of the Board's Division of Reserve Bank Operations and Payment Systems, prepared this article. Thomas Guerin andAmin Rokni provided research assistance.
N O T E . Darrel Parke and Samuel Slowinski, of the Board's Division of Research and Statistics, provided valuable assistance with the production and interpretation of the statistical estimates. [end of note.]
Over the past several decades, the payments industry has undergone significant change. New electronic payment instruments have been introduced, and the means for making electronic payments have become increasingly available for use in everyday commerce. Further, the adaptation of technology has driven down the costs of processing electronic payments relative to check payments. Partial statistics and anec-dotal evidence suggest that consumers and businesses are increasingly using electronic payments. Neverthe-less, the paper check continues to be the most com-monly used type of noncash payment instrument in the U.S. economy. Checks' share in noncash pay-ments has been declining, however, and recent evi-dence suggests that the total number of checks paid has been declining as well.
To shed light on the use of checks and other noncash payment instruments in the United States, the Federal Reserve recently sponsored three related surveys collectively referred to as the Retail Pay-ments Research Project. The survey data were used to estimate the number and value of payments made in 2000 using checks and several types of electronic payment instruments as well as to study the character-istics of individual checks paid in 2000. The magni-tude and diversity of the samples also enabled a comparison of check use across type and size of depository institution and across geographic regions. In addition, the data provided a basis for looking at changes in noncash payments since 1979, when the Federal Reserve collected data on checks for an analysis of the check-clearing system, and since 1995, when the Federal Reserve collected data on checks for a report to the Congress on funds availabil-ity and check fraud. The surveys are described in detail in the appendix.
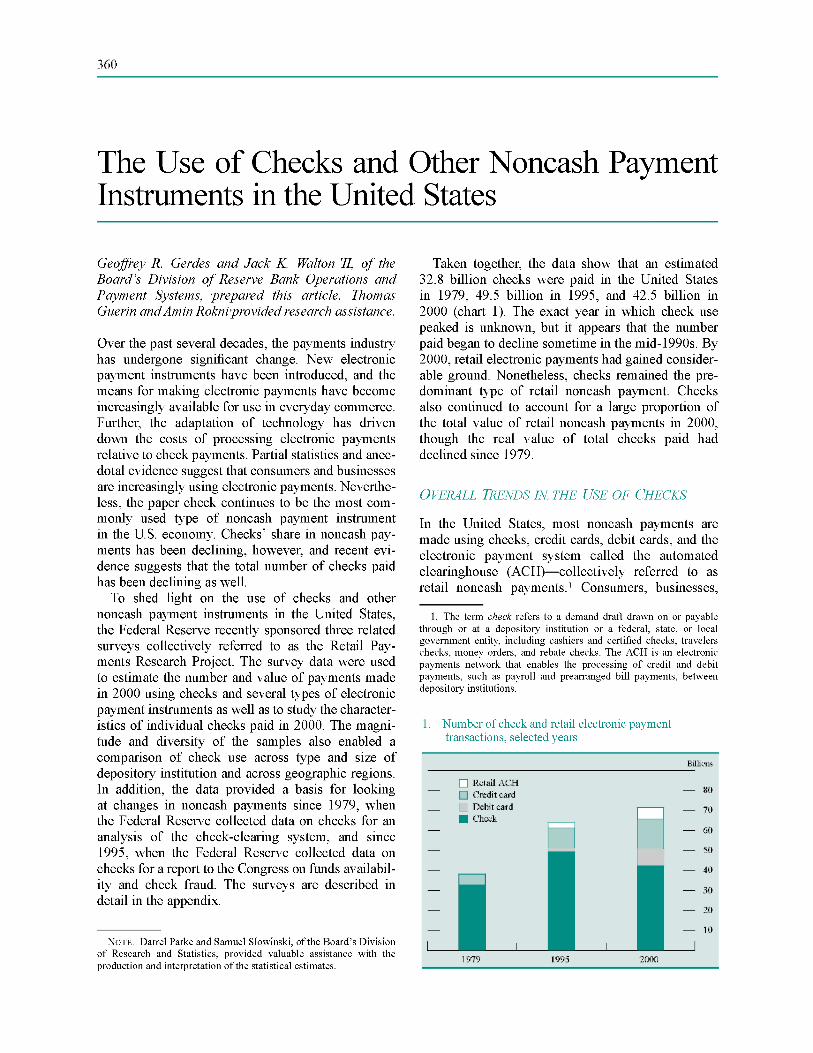
Taken together, the data show that an estimated 32.8 billion checks were paid in the United States in 1979, 49.5 billion in 1995, and 42.5 billion in 2000 (chart 1). The exact year in which check use peaked is unknown, but it appears that the number paid began to decline sometime in the mid-1990s. By 2000, retail electronic payments had gained consider-able ground. Nonetheless, checks remained the pre-dominant type of retail noncash payment. Checks also continued to account for a large proportion of the total value of retail noncash payments in 2000, though the real value of total checks paid had declined since 1979.
Chart 1. Number of check and retail electronic payment transactions, selected years.
[bar graph plotting four data: retail ACH, credit card, debit card, and check. In 1979 check was about 33 billion, credit card about 5 billion. In 1995, check was about 49 billion, debit card about 2 billion, credit card about 10 billion, retail ACH about 3 billion. In 2000, check was about 42 billion, debit card about 9 billion, credit card about 16 billion, retail ACH about 5 billion.]
OVERALL TRENDS IN THE USE OF CHECKS.
In the United States, most noncash payments are made using checks, credit cards, debit cards, and the electronic payment system called the automated clearinghouse (ACH)—collectively referred to as retail noncash payments.
[note: 1]. The term check refers to a demand draft drawn on or payable through or at a depository institution or a federal, state, or local government entity, including cashiers and certified checks, travelers checks, money orders, and rebate checks. The ACH is an electronic payments network that enables the processing of credit and debit payments, such as payroll and prearranged bill payments, between depository institutions. [end of note.]
Consumers, businesses,

and government entities made about 71.5 billion retail noncash payments in 2000 (table 1). The total value of these payments was about $46.6 trillion, approximately four and three-fourths times U.S. gross domestic product (GDP) for that year. Checks were the predominant type of retail noncash payment, accounting for 59.5 percent of these payments by number. By comparison, checks constituted 85.7 per-cent of retail noncash payments in 1979 (table 2). Although the number of check payments increased from 1979 to 2000, the number of checks as a share of retail noncash payments declined about 26 percent-age points.
Table 1. N u m b e r and va lue o f retail n o n c a s h paymen t s , 2 0 0 0
Type of payment
Number:
Billions of payments
Number:
Percent of total
Value:
Trillions of dollars
Value:
Percent of total
Check 42.5 59.5 39.3 84.4 Retail electronic
payments 28.9 40.5 7.3 15.6 Debit card 8.3 11.6 .3 .7 Credit card:
General-purpose 12.3 17.2 1.1 2.3 Credit card:Private-label 2.7 3.8 .2 .3
Retail ACH 5.6 7.9 5.7 12.2
Total 71.5 100.0 46.6 100.0
NOTE. In this and subsequent tables, components may not sum to totals, and calculations may not yield averages and percentages shown, because of rounding.
Note 1 about check: Includes checks paid by depository institutions, U.S. Treasury checks, and postal money orders.
Note 2about General purpose credit cards: Includes co-branded credit cards, charge cards, co-branded charge cards,
secured credit cards, travel and entertainment cards, commercial cards, and new payment technologies that route transactions through the card associations' networks.
Note 3 about private label credit cards: Includes retailer cards, oil company cards, third-party fleet cards, and cards issued by third-party receivable owners. Note 4 on retail ACH: Excludes ACH transactions classified as cash concentration and disburse-
ment, which, for purposes of this study, are not considered payments.
Table 2. N u m b e r and rate o f g r o w t h o f retail n o n c a s h paymen t s , selected yea r s
Type of payment Number (billions):
1979
Number (billions):
1995
Number (billions):
2000
Growth (percent, annual
rate): 1979-95
Growth (percent,
annua; rate): 1995-2000
Growth (percent annual rate): 1979-2000
Check 32.8 49.5 42.5 2.6 - 3 . 0 1.2 Retail electronic payments 5.5 14.7 28.9 6.3 14.6 8.2
Debit card .0 1.4 8.3 na
41.8 na
Credit card General-purpose 1.5 7.8 12.3 10.9 9.5 10.5 Private-label 3.8 2.6 2.7 - 2 . 3 .9 - 1 .6
Retail ACH .2 2.8 5.6 19.0 15.1 18.0
Total 38.3 64.2 71.5 3.3 2.2 3.0
NOTE. See table 1, notes 1-4. SOURCES. Federal Reserve; National Automated Clearing House Association; Nilson Report, selected issues; and ATM & Debit News, EFT Data Book, 2002 edition.
Growth in overall economic activity and popula-tion led to a general growth in payments, including cash payments, between 1979 and 2000. Such factors as technological change and increased availability
and acceptability of alternatives to cash influenced the proportion of payments made with retail noncash instruments. From 1979 to 2000, the number of retail noncash payments grew approximately 3 percent a year, about the same as the rate of growth of real GDP. Hence, both the number of retail noncash pay-ments and the amount of economic output roughly doubled over the period. Over the same period, the number of households increased from 78.8 million to 105.5 million, for an annual rate of growth of almost 1.5 percent.
The growth in retail noncash payments leading up to the mid-1990s may have resulted from a general increase in payments, an increase in the number of households with checking accounts, and the replace-ment of some cash payments by noncash payment alternatives.
[note: 2]. The proportion of households without a checking account fell from 18.7 percent in 1989 to 13.2 percent in 1998. See Arthur B. Kennickell, Martha Starr-McCluer, and Brian J. Surette, ' 'Recent Changes in U.S. Family Finances: Results from the 1998 Survey of Consumer Finances,'' Federal Reserve Bulletin, vol. 86 (January 2000), pp. 1-29. [end of note.]
About 9.2 billion more retail electronic payments were made in 1995 than in 1979. The number of checks also rose considerably over the period. In fact, about 16.7 billion more checks were paid in 1995. However, the number of checks paid as a share of all retail noncash payments declined, from 85.7 percent to 77.1 percent.
The decline in the number of checks as a share of retail noncash payments continued over the period 1995 to 2000, and the number of checks paid declined as well, from an estimated 49.5 billion in 1995 to 42.5 billion in 2000. (In comparison, the annual number of electronic payments increased 14.2 billion over the period.) Whether the number of checks paid in nearby years was higher or lower than in 1995 is unknown. However, these estimates suggest that the number of checks paid peaked during the mid-1990s.

The apparent decline in the number of checks paid between 1995 and 2000 was likely not driven by a change in the general level of economic activity. Both years were part of an economic expansion that began in the early 1990s and peaked in March 2001 (according to the National Bureau of Economic Research), and spending by consumers and busi-nesses, which make the predominant number of pay-ments in the economy, increased during the period. Instead, the decline in check use appears to have been related to increased use of electronic payments by consumers and businesses.
Although the number of checks paid appears to have declined during the latter part of the period, the number increased on net from 1979 to 2000. The value of checks paid, however, decreased—from an estimated $50.7 trillion in 1979 to $39.3 trillion in 2000 (both in 2000 dollars; table 3).
[note: 3]. All historical values reported in this article are given in 2000 dollars. Adjustments to historical values were made using the implicit price deflator for GDP. Given that prices have roughly doubled since 1979, $1 in 1979 was equivalent to about $2.05 in 2000. An estimate of the value of checks paid in 1995 could not be constructed. [end of note.]
The declines in overall check value and related measures (the estimated average value of a check, for example, declined from $1,544 in 1979 to $925 in 2000) pro-vide supporting evidence that electronic payments have replaced checks for at least some types of trans-actions. In addition, most large-value payments for settlement of financial market transactions that were once made by check are now made electronically, many using the large-value funds transfer systems (such as Fedwire and CHIPS). Such payments are discussed separately because they are not considered retail noncash payments.
VARIATIONS IN CHECK PAYMENTS ACROSS DEPOSITORY INSTITUTIONS.
Almost 15,000 depository institutions in the United States—commercial banks, credit unions, and sav-ings institutions—provide checking or share draft accounts. However, the distribution of transaction deposits and the number and value of checks paid are skewed toward a small number of very large institutions.4
[note: 4]. Depository institution subsidiaries of multibank holding compa-nies are treated as a single depository institution. Commercial banks include branches of foreign banks; checks paid by the latter group constitute a very small proportion of the total number and value of checks paid. Savings institutions include savings and loan institutions, cooperative banks, and savings banks. Transaction deposits are depos-its held in transaction accounts—types of accounts for which the number of payments is not restricted by regulation. Although pay-ments may be made from other types of depository institution accounts, such as savings accounts, such payments are limited by regulation to six per month. [end of note.]
Trends across Depository Institutions.
Credit unions and savings institutions generally did not offer checking accounts (or their equivalent) until the late 1970s. Since that time, transaction deposits at, and the number and value of checks paid by, these institutions have grown briskly.
Despite the overall decline in the number of checks paid between 1995 and 2000, the number paid by credit unions and savings institutions continued to grow (table 3).
Table 3. Number and value of checks paid, by type of institution, selected years
Year and type of institution Number (billions)
Value (trillions
of dollars)
Memo: Transaction
deposits (billions
of dollars)
1979: Commercial banks 31.4 n.a. 744
1979:Credit unions .3 n.a. 4 1979:Savings institutions .3 n.a. 4
1979:All depository institutions 32.0 49.6 752
1979:U.S. Treasury checks and postal money orders .8 1.1
. . .
1979:Total 32.8 50.7 . . .
1995: Commercial banks 42.0 n.a. 855
1995:Credit unions 3.5 n.a. 34 1995:Savings institutions 3.4 n . a . 64
1995:All depository institutions 48.9 n.a. 953
1995:U.S. Treasury checks and postal money orders .7 .6
. . .
1995:Total 49.5 n.a. . . .
2000: Commercial banks 33.3 36.6 602
2000: Credit unions 4.7 .9 51 2000: Savings institutions 4.0 1.6 62
2000: All depository institutions 42.0 39.0 715
2000: U.S. Treasury checks and postal money orders .5 .3
. . .
2000: Total 42.5 39.3 . . .
NOTE. All values are in 2000 dollars. n.a. Not available. . . . Not applicable.
These institutions together paid an estimated 14 percent of checks in 1995 but more than 20 percent in 2000. The 1.8 billion increase in the number of checks paid annually by these institutions, however, was more than offset by a dramatic decline of about 8.7 billion in the number paid annually by commercial banks.
[note: 5]. The increase in checks paid by credit unions is consistent with independent evidence from the Survey of Consumer Finances con-ducted periodically by the Federal Reserve: The share of households that reported using credit unions for checking accounts rose from 10.5 percent in 1989 to 17.4 percent in 1998. The share that reported using savings institutions for checking accounts declined, however, from 20.2 percent to 11.5 percent, perhaps suggesting that the increase

in c h e c k u s e at s a v i n g s ins t i tu t ions w a s d u e t o i n c r e a s e d u s e b y b u s i n e s s e s . T h e sha re t ha t r e p o r t e d u s i n g c o m m e r c i a l b a n k s i n c r e a s e d s l ight ly , f r o m 6 8 . 6 p e r c e n t t o 6 9 . 5 pe r cen t . S e e D e a n F. A m e l a n d M a r t h a S t a r r - M c C l u e r , " M a r k e t D e f i n i t i o n in B a n k i n g : R e c e n t E v i -d e n c e , ' ' Antitrust Bulletin, vol . 4 7 ( S p r i n g 2 0 0 2 ) , pp . 6 3 - 8 9 . [end of note.]
Differences across Depository Institutions in 2000.
The average value of checks paid in 2000 varied by type and size of depository institution, presumably because of the mix of business and consumer custom-ers served by different institutions. Large commercial banks and some large savings institutions serve cor-porations and other businesses as well as consumers. Because large corporations tend to make larger-value payments, the average value of checks paid by depository institutions that serve them tends to be larger. Community banks (small commercial banks and savings institutions) typically serve smaller busi-nesses and consumers, so the average value of checks they pay is smaller. Credit unions overall have the smallest average check value because they generally provide accounts only to consumers (table 4).
[note: 6]. I n s o m e cases , h o w e v e r , c r ed i t u n i o n a c c o u n t s a re u s e d f o r b u s i n e s s p u r p o s e s . In 1998, a b o u t 3 .8 p e r c e n t o f s m a l l b u s i n e s s e s u s e d a c red i t u n i o n f o r c h e c k i n g . See M a r i a n n e P. Bit ler , A l i c i a M . R o b b , a n d J o h n D. W o l k e n , ' ' F i n a n c i a l Se rv i ces U s e d b y S m a l l B u s i n e s s e s : E v i d e n c e f r o m t h e 1998 S u r v e y of S m a l l B u s i n e s s F i n a n c e s , ' ' Federal Reserve Bulletin ( A p r i l 2001 ) , vo l . 87, p p . 1 8 3 - 2 0 5 . [end of note.]
Table 4. Checks paid by and transaction deposits of depository institutions, by type and size of institution, 2000
Type and size of institution (transaction deposits in millions of dollars)
Number of
institu-tions
Checks paid: Number (billions)
Checks paid: Value
(trillions of
dollars)
Checks paid:
Average value
(dollars)
Checks paid:
Percent of
interbank checks
returned
Checks paid: Average
value of
interbank checks
returned (dollars)
Checks paid: Percent on-us
Transaction Deposits:
Amount (billions
of dollars)
Transaction Deposits:
Number-to-
deposits ratio
Transaction Deposits:
Value-to-
deposits ratio
Memo:
Number-to-
assets ratio
Memo:
Value-to-
assets ratio
Commercial banks 6,852 33.3 36.6 1,099 .79 859 34 602 55 60,682 53 58,256 250-60,000 170 23.6 29.6 1,254 .82 964 38 411 57 72,090 54 67,681 50-250 1,104 4.3 3.4 790 .72 646 26 99 43 34,106 48 37,897 0 -50 5,578 5.4 3.6 663 .75 595 26 93 58 38,523 53 35,386
Credit unions 6,551 4.7 .9 186 1.03 244 6 51 93 17,254 111 20,613 75-2,000 0 -75
106 6,445
1.2 3.5
.3
.6 208 178
.98 1.05
305 223
6 6
16 35
75 101
15,621 18,028
96 117
20,068 20,845
Savings institutions 1,293 4.0 1.6 389 .99 507 18 62 65 25,226 34 13,296 200-6,500 35 2.2 .9 413 1.22 533 14 30 72 29,567 36 14,752 0 -200 1,258 1.8 .7 360 .67 444 22 31 58 20,985 32 11,706
All institutions 14,696 42.0 39.0 928 .85 700 29 715 59 54,522 53 49,539
NOTE. Excludes U.S. Treasury checks and postal money orders, which are paid by the Federal Reserve Banks. Transaction deposit ranges may include amounts equal to the upper boundary but do not include amounts equal to the lower boundary. Institutions without transaction deposits are not included.
Number to deposits ratio: Number of checks paid per $1,000 of transaction deposits. Value to deposits ratio: Value of checks paid per $1,000 of transaction deposits. Number to assets ratio: Number of checks paid per $1,000,000 of assets. Value to assets ratio: Value of checks paid per $1,000,000 of assets.
The importance of check payments relative to other types of payments at individual depository institu-tions cannot be known precisely because data on the proportion of total payments made using checks at individual depository institutions are unavailable.
However, looking at the number and value of checks paid in terms of the value of an institution's trans-action deposits can give some indication of the importance—or intensity—of check use. Specifically, the relative intensity of check use can be approxi-mated as the number and value of checks paid per $1,000 of transaction deposits—the number-to-deposits ratio and value-to-deposits ratio respec-tively. In 2000, these ratios appear to have varied by type and size of depository institution (table 4). The largest commercial banks, for example, had the high-est value-to-deposits ratio among all categories of depository institutions, likely reflecting the high aver-age value of checks paid by these institutions. In contrast, these banks had a number-to-deposits ratio similar to those of the smallest banks and small savings institutions. Midsize banks had the lowest number-to-deposits ratio and a value-to-deposits ratio below the ratios for the largest and smallest banks. These results suggest that checks may be used less intensively at midsize commercial banks than at institutions in other categories.
The amount of transaction deposits held by a depository institution can be affected by both the willingness of account holders to hold idle balances and the institution's use of sweep accounts to reduce the balances their customers hold overnight in trans-action accounts.
[note: 7]. G e n e r a l l y , d e p o s i t o r y ins t i tu t ions u s e t w o t y p e s of s w e e p p ro -g r a m s . W h o l e s a l e s w e e p s , w h i c h h a v e b e e n o f f e r e d to b u s i n e s s cus -t o m e r s s i nce the 1970s , k e e p c u s t o m e r s ' n o n - e a r n i n g asse ts l o w , b y m o v i n g f u n d s b e t w e e n n o n - i n t e r e s t - e a r n i n g d e m a n d depos i t s , such as t r a n s a c t i o n depos i t s , a n d i n t e r e s t - e a r n i n g m o n e y m a r k e t m u t u a l f u n d s
or other financial instruments. Retail sweeps, which first appeared in 1994, move idle funds f rom transaction deposit accounts to special-purpose money market deposit accounts (MMDAs) and return them to transaction accounts only as needed to cover payments, limiting the number of withdrawals f rom the MMDAs to six per month in accor-dance with regulatory restrictions. This practice does not adversely affect the account holder but allows the depository institution to reduce its non-interest-earning assets. Both types of sweep programs reduce the amount of funds depository institutions must hold to meet their reserve requirements. See Cheryl L. Edwards, ' 'Open Market Operations in the 1990s,'' Federal Reserve Bulletin, vol. 83 (Novem-ber 1997), pp. 859-74, for a discussion of sweep programs. [end of note.]
The use of such deposits in measures of the relative intensity of check use may
exaggerate the intensity of check use at the largest institutions because such institutions also tend to use sweep accounts most extensively. An alternative approximation that may control for various effects on transaction deposits is the number and value of checks paid per $1 million of assets—the number-to-assets ratio and value-to-assets ratio respectively. While the number-to-assets ratio exhibits the same general U-shaped pattern as the number-to-deposits and value-to-deposits ratios, the value-to-assets ratio for commercial banks does not. Instead, the value-to-assets ratio increases as the size category of commer-cial banks increases.
Whether viewed in terms of transaction deposits or assets, credit unions stand out as the type of institu-tion at which checks are used the most intensively by number. The intensity of check use by both number and value declines as size increases, suggesting that check use is less intense at larger credit unions.
Without directly measuring the number and value of all payments initiated by depository institutions, approximating the intensity of check use is difficult because of the complexity of factors affecting the data. Nevertheless, the results presented here pro-vide preliminary evidence that the intensity of check use does vary by type and size of depository institution.
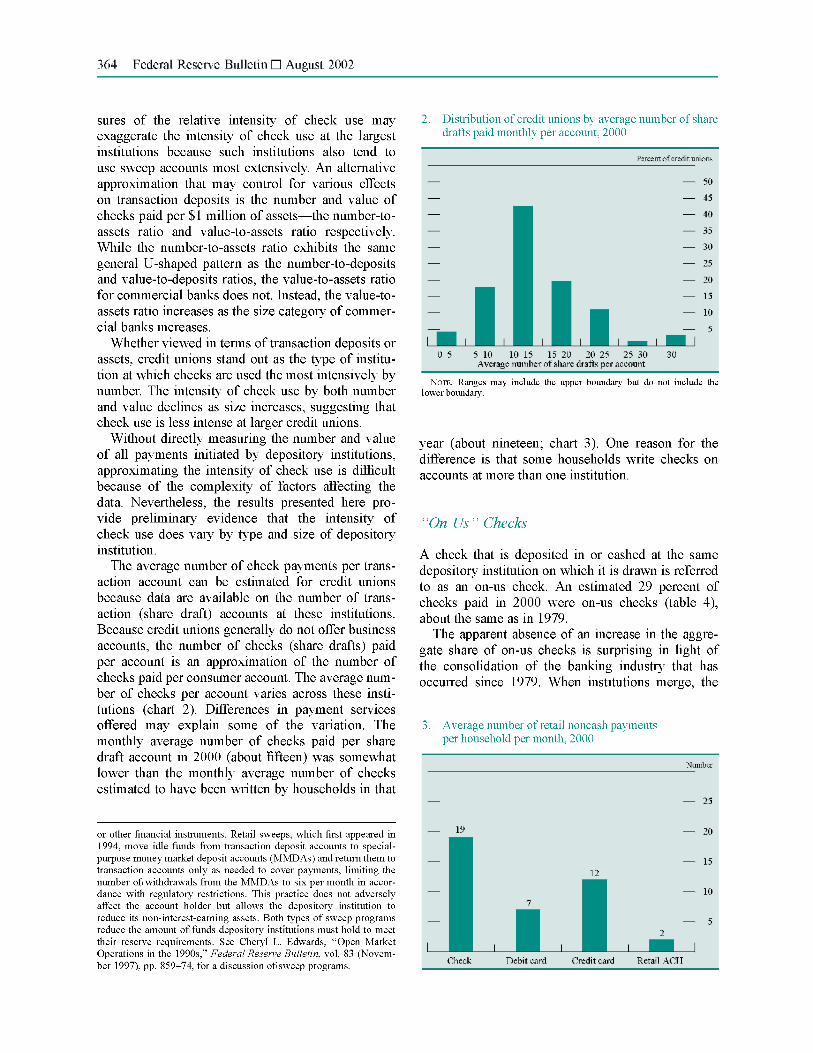
The average number of check payments per trans-action account can be estimated for credit unions because data are available on the number of trans-action (share draft) accounts at these institutions. Because credit unions generally do not offer business accounts, the number of checks (share drafts) paid per account is an approximation of the number of checks paid per consumer account. The average num-ber of checks per account varies across these insti-tutions (chart 2). Differences in payment services offered may explain some of the variation. The monthly average number of checks paid per share draft account in 2000 (about fifteen) was somewhat lower than the monthly average number of checks estimated to have been written by households in that
year (about nineteen; chart 3). One reason for the difference is that some households write checks on accounts at more than one institution.
Chart 2. Distribution of credit unions by average number of share drafts paid monthly per account, 2000
[bar graph. About 4.5% of credit unions had an average of 0 to 5 share drafts per account. About 18% of credit unions had an average of 5 to 10 share drafts per account. About 43% of credit unions had an average of 10 to 15 share drafts per account. About 20% of credit unions had an average of 15 to 20 drafts per account. About 11% of credit unions had an average of 20 to 25 share drafts per account, About 1.5% of credit unions had an average of 25 to 30 share drafts per account. About 4% of credit unions had over 30 share drafts per account.]
NOTE. Ranges may include the upper boundary but do not include the lower boundary.
Chart 3. Average number of retail noncash payments per household per month, 2000
[bar graph. checks had about 19 retail noncash payments per household per month. Debit card had about 7. Credit card had about 12. Retail ACH had about 2.]
"On Us " Checks.
A check that is deposited in or cashed at the same depository institution on which it is drawn is referred to as an on-us check. An estimated 29 percent of checks paid in 2000 were on-us checks (table 4), about the same as in 1979.
The apparent absence of an increase in the aggre-gate share of on-us checks is surprising in light of the consolidation of the banking industry that has occurred since 1979. When institutions merge, the

probability that a check written by a customer of one of the institutions will be an on-us check for the new institution generally increases; the increase is large if the institutions that merged tended to serve custom-ers that wrote checks to each other, though not so large if they tended to serve customers that did not. If the merger is between institutions in different geo-graphic areas, and assuming that most checks are local, the effect of the merger on the proportion of on-us checks is small. That the share of on-us checks remained virtually unchanged from 1979 to 2000 as extensive consolidation of depository institutions both within and across regions was taking place suggests that other, behavioral changes in check-writing offset the effects of consolidation. One such change likely was the way account holders obtain cash: In the 1970s, account holders commonly obtained cash by cashing checks at the counter of their own banks; since then, the use of ATMs to obtain cash has increased dramatically, reducing the use of checks for this purpose.
Several factors in addition to the effects of consoli-dation or banking concentration may affect the prob-ability that a check paid by a particular institution is an on-us check. These include the extent of branch-ing, the range of customers served, and the extent of business activity of account holders with nonlocal payment counterparties or financial institutions.
[note: 8]. A complete analysis of the effects of these factors is beyond the scope of this article; a simple cross-sectional regression of the share of on-us checks on the logarithm of transaction deposits and the number of own-bank branches revealed no significant relationship between the number of branches and the share of on-us checks. [end of note.]
A comparison of the proportions of on-us checks paid in 2000 reveals some patterns among depository insti-tutions of different types and sizes (table 4). Among commercial banks, the proportion of on-us checks was greater for larger institutions than for smaller institutions. Among credit unions, however, no rela-tionship between size and proportion of on-us checks was evident; as a group, credit unions had the small-est share of on-us checks, consistent with the finding that in 2000, the share of consumer checks for which the payee was also a consumer was relatively small (23 percent). The estimated proportion of on-us checks for small savings institutions was large rela-tive to the proportion for large savings institutions, possibly because of the types of communities the smaller institutions serve. In fact, many community banks reported a large share of on-us checks. The 1979 study also found a large share of on-us checks among community banks.
Returned Checks
Because an account has been closed, funds in the payer's account are insufficient, or another reason, some checks presented to a paying institution are returned unpaid to the collecting institution. An esti-mated 251 million interbank (non-on-us) checks were returned in 2000, about 0.85 percent of interbank checks paid, or 8.5 checks out of every 1,000 inter-bank checks paid (table 4).
[note: 9]. An on-us check would not be returned to another depository institution, as the payer and payee are using the same institution; an on-us check could be returned unpaid to the payee, however. The surveyed depository institutions reported only the number and value of checks returned to other institutions. The percentage of returned checks was computed as the number ofreturned checks divided by the difference between the number of checks paid and the number of on-us checks. (As a share of total checks paid, interbank returned checks accounted for an estimated 0.60 percent.) [end of note.]
This estimate is an upper bound on the number of returns, as some checks may be returned more than once, leading to some double counting.
[note: 10]. Technological advances in the processing of returned checks may have reduced the incidence of multiple returns of the same check by helping collecting banks re-present checks when there is a greater likelihood of sufficient funds in the account on which the check is drawn. [end of note.]
The estimated proportion of checks that are returned unpaid appears to vary by type and size of depository institution. Credit unions as a group had the highest return rate (10.3 checks returned for every 1,000 paid), suggesting that interbank checks written by consumers are returned more frequently than are those written by businesses. The estimated average value of a returned check in 2000 was $700.
VARIATIONS IN CHECK USE BY REGION AND DEGREE OF URBANIZATION.
The size and diversity of the sample of depository institutions were sufficient to estimate the number and value of checks paid in 2000 for four broad regions of the country—Northeast, South, Midwest, and West. The apparent variation among regions can be explained in part by population size and level of economic activity (table 5).
[note: 11]. Economic activity was measured by economic output, which was estimated as the sum of the gross products of the states making up the regions. Gross state product is a measure of state output similar to GDP. [end of note.]
Differences persist after controlling for those variables, however, an indica-tion that regional differences may be associated with other factors, such as the availability of and willing-ness to use payment instruments other than checks.
By number of checks paid per capita, the Midwest led the regions, followed by the South, West, and

Northeast. By value of checks paid per capita, the Northeast led, followed by the South, Midwest, and West. Thus, no region stood out as the greatest user of checks by both number and value. Nonetheless, some differences among regions appear to have been large. For example, the number of checks paid per capita was 27 percent higher in the Midwest than in the Northeast, and the value of checks paid per capita was 47 percent higher in the Northeast than in the West.
Table 5. Number and value of checks paid by depository institutions, by location of deposits, 2000
Location of deposits
Number of
institu-tions
Number: Total
(billions)
Number:
Per capita
Number:
Per $1,000
of output1
Number-to-
deposits ratio 2
Value: Total
(trillions of
dollars)
Value: Per capita
(thousands of
dollars)
Value:
Per $1,000
of output1
Value: Value-
to-deposits
ratio 3
Value: Average
per check
(dollars)
Memo: Trans-action
deposits (billions
of dollars)
By region: Northeast4 2,417 7.1 132.6 3.3 46.0 9.1 169.8 4,233 58,909 1,280 154
Northeast: Multiregion institutions 55 3.6 na na
40.2 7.0 na na
77,883 1,938 89 Northeast: Single-region institutions 2,362 3.5
na na 54.0 2.1
na na 32,763 606 65
By region: South5 4,841 15.3 152.8 4.7 61.9 14.6 145.8 4,467 59,096 955 247 South: Multiregion institutions 92 4.9
na na 59.6 5.7
na na 68,824 1,155 82
South: Single-region institutions 4,749 10.4 na na
63.1 9.0 na na
54,242 860 165
By region: Midwest 6 5,396 10.8 168.4 5.0 61.6 8.0 123.9 3,683 45,362 736 176 Midwest: Multiregion institutions 94 4.1
na na 51.9 4.4
na na 56,387 1,086 78
Midwest: Single-region institutions 5,302 6.8 na na
69.4 3.6 na na
36,570 527 98
By region: West 7 2,182 8.8 138.5 3.7 64.1 7.3 115.5 3,102 53,437 834 137 West: Multiregion institutions 72 4.2
na na 69.1 4.0
na na 65,235 944 61
West: Single-region institutions 2,110 4.6 na na
60.1 3.3 na na
43,959 732 76
By urbanization: Urban 10,173 33.3 145.3
na 57.6 33.0 144.2
na 57,215 992 578
By urbanization: Rural 5,970 8.7 167.0 na
63.8 6.0 114.0 na
43,575 683 137
NOTE. Includes only checks paid by commercial banks, savings institutions, and credit unions. Multiregion institutions are those that have deposits in more than one region; single-region institutions have deposits in only one region. Urban areas are those defined as metropolitan statistical areas or New England county metropolitan statistical areas; rural areas are those defined to be outside urban areas. Figures for the number of institutions do not sum to the total number of institutions because some institutions operate in more than one region or in both urban and rural areas.
note 1 per $1000 of output: Output is measured as the sum of the gross products of the states in the
region. Note 2 number to deposits ratio: See table 4, note 1. Note 3 value to deposits ratio: See table 4, note 2.
note 4 Northeast:. Includes Connecticut, Maine, Massachusetts, New Hampshire, New Jer-sey, New York, Pennsylvania, Rhode Island, and Vermont.
note 5 South: Includes Alabama, Arkansas, Delaware, District of Columbia, Florida, Georgia, Kentucky, Louisiana, Maryland, Mississippi, North Carolina, Okla-homa, South Carolina, Tennessee, Texas, Virginia, and West Virginia.
Note 6: Midwest: Includes Illinois, Indiana, Iowa, Kansas, Michigan, Minnesota, Missouri, Nebraska, North Dakota, Ohio, South Dakota, and Wisconsin.
Note 7 West: Includes Alaska, Arizona, California, Colorado, Hawaii, Idaho, Montana, Nevada, New Mexico, Oregon, Utah, Washington, and Wyoming.
SOURCES. Federal Reserve; and Department of Commerce, Bureau of Eco-nomic Analysis and Bureau of the Census.
The Northeast had the lowest number of checks per capita, the lowest number of checks per $1,000 of output, and the highest average check value. In addi-tion, the Northeast had the lowest number-to-deposits ratio. The smallest region as measured by area and population size, the Northeast includes New York State, which is home to a significant concentration of financial and corporate activity. This activity appears to have had a large effect on checks and deposits in the region. For example, average check value for the region was more than 20 percent lower when New York State was excluded from the calculation, bring-ing the average value for the rest of the Northeast closer to the average values for the other regions.
Interestingly, the average check value and value-to-deposits ratio for depository institutions operating only in the Northeast (single-region institutions) were considerably lower than for institutions operating in the Northeast and at least one other region (multi-region institutions). Among single-region institutions, those in the Northeast and Midwest had the lowest average check values and value-to-deposits ratios, suggesting that these institutions were used less fre-quently for paying larger-value business checks. Cor-respondingly, the very high average check value and value-to-deposits ratio for multiregion institutions operating in the Northeast suggest that these institu-tions were used more often than others for paying such larger-value business checks.
The Midwest, the region with the largest number of depository institutions per capita, had the highest number of checks per capita. The West had the small-est value of checks per capita and per $1,000 of output, possibly indicating that payers in the region, perhaps led by businesses, had a greater propensity to replace higher-value checks with electronic pay-ments. The South had the highest value of checks per $1,000 of output and a value-to-deposits ratio similar

to that for the Northeast, suggesting that checks were used by businesses more often in these two regions than in the other regions.
Almost 80 percent of checks were paid using trans-action deposits located in urban areas (table 5).
[note: 12]. Urban areas were defined as metropolitan statistical areas (MSAs) or New England county metropolitan statistical areas (NECMAs), and rural areas as all other areas. [end of note.]
On a per capita basis, however, the number of checks paid was more than 14 percent higher in rural areas, perhaps because of lesser availability of or willing-ness to use electronic payment alternatives. The aver-age value of rural checks was about 30 percent lower than that of urban checks.
DISTRIBUTION OF CHECK PAYMENTS BY PAYER, PAYEE, AND PURPOSE.
The share of checks written by consumers appears to have increased somewhat since the 1970s. According to the 2000 survey, consumers wrote about 58 per-cent of the sampled checks for which the payer could be classified, with business and government checks making up the rest.
[note: 13]. Approximately 11 percent of checks could not be classified into payer and payee categories. [end of note.]
Studies by the Bank Adminis-tration Institute and Arthur D. Little, Inc., in the early and mid-1970s that classified check payments by payer and payee found that consumers wrote about half of all checks.
[note: 14]. See L.M. Fenner and R.H. Long, "The Check Collection System: A Quantitative Description'' (Chicago: Bank Administration Institute, 1970), and Arthur D. Little, Inc., ' 'The Consequences of Electronic Funds Transfer: A Technology Assessment of Movement toward a Less Cash/Less Check Society,'' prepared for the National Science Foundation, Research Applied to the National Needs (RANN), under contract NSF-C844 (Government Printing Office, 1975). [end of note.]
The increase in the share written
by consumers and the corresponding decline in the share written by businesses and governments partly explain the decline in the real value of checks over time.
Checks can be classified according to the broad purpose of the payment—point-of-sale (POS) (gener-ally, in-person purchases of merchandise at such loca-tions as grocery and office-supply stores); income (payments to consumers by businesses and gov-ernments, including payroll, rebates, refunds, and dividends); remittance (payments of one-time or recurring bills); and casual (consumer-to-consumer payments). The value of checks paid in 2000 varied by purpose of payment (table 6). For example, nearly three-fourths of POS checks were for less than $100. In contrast, slightly fewer than half of casual-payment checks were for less than $100, and nearly as many were for $100 to $1,000.
Table 6. Distribution of check values, by payer, payee, and purpose, 2000 Percent
Check value (dollars) All checks Payer:
Consumer
Payer:
Business1
Payee:
Consumer
Payee:
Business1 Purpose: P O S 2
Purpose:
Remittance 3
Purpose:
Income 4 Purpose: Casual 5
0-100 48.1 64.0 25.3 32.2 55.8 72.1 51.8 21.7 48.6 100-1,000 38.7 30.5 50.6 52.4 32.1 21.7 36.0 59.6 41.0 1,000-2,500 6.3 3.0 11.2 8.9 5.2 2.9 5.9 11.1 5.6 2,500-10,000 5.3 2.1 9.5 5.6 4.8 2.7 4.3 6.6 4.2 More than 10,000 1.7 .4 3.4 .9 2.0 .7 2.1 1.1 .6
Total 100.0 100.0 100.0 100.0 100.0 100.0 100.0 100.0 100.0
NOTE. Check value ranges may include checks written for amounts equal to the upper boundary but do not include checks written for amounts equal to the lower boundary.
Note 1 Business: Includes state and local government checks, which constituted only a small percentage of checks paid by and to businesses.
Note 2; POS: Point-of-sale payments f rom any type of payer to either a business or a government payee.
Note 3 remittance: Payments f rom any type of payer to either a business or a government payee that did not occur at the point of sale.
Note 4 income: Payments to an individual f rom either a business or a government entity. Note 5 casual: Payments f rom one individual to another.
Comparison of the results from the 1970s with the results for 2000 shows that, combined, the share of checks written by consumers at the point of sale and for the payment of bills decreased about 13 percent over the period, with a proportionate increase in consumer-to-consumer check payments.
[note: 15]. In 1979, individuals wrote an estimated 50 percent of their checks to pay bills. Another 40 percent were written at the point of sale (of which 80 percent were written to make retail purchases and about 20 percent were written for cash), and about 10 percent were written to other consumers. In 2000, 36 percent of checks written by consumers that could be classified by purpose were for bill payment and 29 percent were written at the point of sale; an additional 13 percent were identified as either for bill payment or written at the point of sale. The remaining 23 percent were consumer-to-consumer payments. (Only 1.6 percent of checks written by consumers in 2000 could not be classified by purpose.) [end of note.]
Consum-ers apparently, over time, replaced checks written at the point of sale and for bill payment with electronic payments to a greater extent than they replaced

checks written to pay other consumers. In 2000, consumer-to-consumer payments accounted for about 23 percent of checks that could be classified as hav-ing been written by consumers.
The average value of checks written in 2000 was considerably greater than the average value of credit and debit card payments (table 7). In contrast, the average value of ACH payments, which are used more often for larger-value, recurring payments such as mortgages, credit card bills, and payroll, was somewhat higher than the average value of check payments.
Table 7. Average value of retail noncash payments, 2000
Type of payment Average value (dollars)
Percent of checks below average
Check 925 85 Debit card 42 29 Credit card:
General-purpose 87 44 Credit card: Private-label 59 36
Retail ACH 1,009 87
NOTE. See table 1, notes 1-4.
Despite the high average value of checks relative to debit and credit card payments, many checks in 2000 were for small amounts (table 7). About 29 per-cent were for less than the average value of debit card payments ($42), and 85 percent were for less than the average check value of $925. In comparison, approxi-mately 95 percent of checks written in 1979 were for less than the average check value that year of $1,544. The proportion of checks for less than $500 decreased from 85 percent in 1979 to 77 percent in 2000. However, the proportion of the highest-value checks (those above $500,000) also decreased. Thus, most of the decline in the average (and total) value of checks from 1979 to 2000 was due to the replacement of the highest-value checks with electronic payments.
ELECTRONIC PAYMENTS.
The number of retail electronic payments made in 1979 was small, accounting for about 15 percent of all retail noncash payments (table 2). Since then, the number made annually has grown at a high rate. Over the latter part of the period, the growth in electronic payments accelerated, nearly doubling between 1995 and 2000 and accounting for 40 percent of all retail noncash payments in 2000. Most of the growth was due to a dramatic increase in the number of debit card payments.
Payments by Households.
An estimate of the average number of check pay-ments made monthly by a household in 2000 can be estimated from data collected in the survey on check use. Because of the nature of the data from the electronic payments survey, however, a household average for retail electronic payments cannot be esti-mated without making assumptions. A large propor-tion of credit and debit card payments are likely made by households, although businesses also use credit
cards extensively, and a large proportion of ACH payments are undoubtedly made by businesses and governments. To estimate an upper bound for retail noncash electronic payments made by households, assume that households made all debit and credit card payments in 2000 and were the payers for half of all ACH payments.
[note: 16]. Data are not available to estimate precisely the share of retail ACH payments made by households, but research suggests that the share is about half. Of those household payments, about 40 percent are ACH debits—mainly prearranged payments (authorized by house-holds and initiated by business recipients) that households have tradi-tionally made by check, such as payments of recurring obligations to mortgage, insurance, and utility companies. The other 60 percent are ACH credits—mainly payroll payments from businesses to house-holds but also some payments by households. See Vantis Interna-tional, "Market Analysis and Segmentation for Direct Deposit and Direct Payment among Consumers, Businesses, and Financial Institu-tions' ' (1998). [end of note.]
Under these assumptions, the aver-age number of retail electronic payments per house-hold per month in 2000 would have been about twenty-one (chart 3), or slightly more than half the retail noncash payments per household per month in 2000. For purposes of comparison, assume that in 1979, households made all retail electronic payments but half of all check payments. Under these assump-tions, the average number of retail electronic pay-ments per household per month would have been about six, or about one-fourth of the retail noncash payments made per household per month in 1979; check payments would have accounted for the other three-fourths (about seventeen per household per month).
Although the number of checks written per house-hold increased from 1979 to 2000 (in part because the number of households with some type of checking account increased), electronic payments per house-hold as a proportion of retail noncash payments increased more than checks. The apparent increase in the share of retail electronic payments suggests that consumer checks have been replaced by electronic payments to some extent. The increase in the esti-mated number of checks written per household per month, however, suggests that further growth in elec-tronic payments could occur through the replacement of some consumer checks.

Payments by Businesses and Governments.
The use of electronic payments by businesses and governments has also increased since 1979. Many businesses have adopted direct deposit of payroll, for example. The proportion of payroll payments made via direct deposit rather than paper check increased from close to zero in 1979 to about 50 percent in 2000.
[note: 17]. National Automated Clearing House Association; and Vantis International, "Market Analysis and Segmentation for Direct Deposit and Direct Payment ' ' (1998). [end of note.]
Some businesses have also begun to experi-ment with programs for converting checks to elec-tronic payments at point-of-sale locations and for the processing of bill payments. In addition, a number of businesses are seeking ways to combine electronic payment processing with invoicing, which could reduce the number of check payments. The U.S. Department of the Treasury now makes most of its payments using the ACH (chart 4) (though federal government payments constituted only about 1.5 per-cent of all retail noncash payments in 2000).
[note: 18]. For more on federal government payments, see Paula V. Hillery and Stephen E. Thompson, ' 'The Federal Reserve Banks as Fiscal Agents and Depositories of the United States,' ' Federal Reserve Bulletin, vol. 86 (April 2000), pp. 251-59. [end of note.]
Chart 4. Number of retail payments initiated by the U.S. Treasury, 1979-2001
[graph plotting three lines: ACH payments, check payments, and total. In 1979 ACH payments were about 150 million, Check payments were about 725 million, total was about 875 million. They move in relatively straight lines, in 1989 ACH reaches about 450 million, check about 550 million, total about 1000 million. In 2000 ach was about 825 million, check about 250 million, total about 1075 million. In 2001 ach was about 900 million, check about 350 million, total about 1250 million.]
NOTE. The 2001 uptick in check payments was due to the midyear tax refund payment sent to almost 100 million taxpayers as prescribed by the Economic Growth and Tax Relief Reconciliation Act of 2001. The U.S. Treasury also makes a small number of payments using other mechanisms such as Fedwire.
Large-Value Payments.
In addition to the retail payments that are the focus of this article, some very large payments, includ-ing federal government and business payments once
made by check, are now made using large-value funds transfer systems. Increased use of these sys-tems helps explain the decline in the average value of checks from $1,544 in 1979 to $925 in 2000. Relative to retail noncash payments, payments made using these systems are few in number but tend to be large in value.
[note: 19]. Nonetheless, many payments made via the large-value funds transfer systems, such as Fedwire, are low in value compared with the average ($3.8 million). In fact, about one-fourth of Fedwire payments in 2000 were for amounts less than $4,000. The median Fedwire payment was $30,000, the 75th percentile was $183,000, and the 95th percentile was $5.1 million. [end of note.]
From 1979 to 1995, the rate of growth of large-value payments by number (table 8) was simi-lar to that for retail electronic payments (table 2). From 1995 to 2000, however, the number of retail electronic payments grew more than twice as fast as the number of payments processed by the large-value funds transfer systems.
Some payments made using large-value funds transfer systems replaced some larger-value business and government payments made by check, and this switch apparently had a significant effect on the real value of check payments over time. One large-scale change in business practices that motivated the replacement of some large-value checks was the switch to same-day funds for the settlement of trades between securities dealers in the U.S. equities mar-kets in 1996.
NONCASH PAYMENTS IN OTHER COUNTRIES.
A look at noncash payments in other countries pro-vides some perspective on the use of checks and electronic payments in the United States. Compared with other industrialized economies—Japan, the European Monetary Union (EMU), the United King-dom, and Canada—the number of noncash payments of any type per capita is considerably higher in the United States, as is the number of check payments per capita (chart 5). The number of electronic pay-ments per capita is also higher in the United States, though not substantially so. Detailed data (not shown) indicate that the number of electronic payments per capita in some countries of the EMU, such as Fin-land, Germany, and the Netherlands, is higher than in the United States (similarly, the use of electronic payments may be greater in some regions of the United States than in others).
The number of noncash payments per capita is higher in the United States than in the other econo-mies mainly because of the more extensive use of checks. Given the very low level of noncash pay-

ments per capita in some countries, it seems likely that cash is used more extensively in these countries than in the United States.
[note: 20]. S o m e researchers h a v e a rgued tha t in the 1980s and 1990s, t he n u m b e r o f p a y m e n t s by cash w a s lower in the U n i t e d States t h a n in o ther countr ies . See D i a n a H a n c o c k and D a v i d B. H u m p h r e y , ' ' P ay -m e n t Transac t ions , Ins t ruments , and Sys tems : A Survey, ' ' Journal of Banking & Finance, vol. 21 (1998) , pp . 1 5 7 3 - 6 2 4 . [end of note.]
If that is true, measures of the importance of checks as a share of noncash pay-ments may overstate the relative use of paper-based payment instruments in the United States. Without reliable measures of cash use, however, a compre-hensive comparison across countries of the extent to which electronic payments have replaced paper-based payments (mostly cash and checks) is not possible.
Table 8. Number, value, and rate of growth of large-value funds transfer payments, selected years
Item 1979 1995 2000
Growth (percent, annual
rate): 1979-95
Growth (percent, annual
rate):1995-2000
Growth (percent, annual
rate): 1979-2000
Number (millions) 45.9 126.9 168.1 6.6 5.8 6.4
Value (trillions of dollars) 186.6 581.5 671.9 7.4 2.9 6.3
NOTE. Includes Fedwire fund transfers and fund transfers processed by the Clearing House Inter-Bank Payment System (CHIPS).
SOURCES. Federal Reserve and CHIPS.
Chart 5. Number of noncash payments per capita in one year, selected economies
[bar graph plotting two data: checks and electronic payments. In Japan they have about 25 electronic payments and 2 checks. E.M.U. have about 100 electronic payments and 22 checks. U.K. has about 120 electronic payments and 50 checks. Canada has about 125 electonic payments and 50 checks. U.S. has about 130 electronic payments and about 150 checks.]
NOTE. Includes both retail payments and payments made using large-value funds transfer systems. Data for United States are for 2000; for France, 1998; for others, 1999. The European Monetary Union includes Austria, Belgium, Finland, France, Germany, Greece, Ireland, Italy, Luxemburg, Netherlands, Portugal, and Spain.
SOURCE. European Central Bank, "Blue Book: Payment and Securities Settlement Systems in the European Union"; Bank for International Settlements, "Statistics on Payment Systems in the Group of Ten Countries"; and Federal Reserve.
SUMMARY AND CONCLUSIONS.
Statistical estimates indicate that the number of checks paid in the United States rose from 32.8 bil-
lion in 1979 to 49.5 billion in 1995 but declined to 42.5 billion in 2000. These three estimates are highly suggestive, though not conclusive, evidence that the total number of checks paid per year peaked in the 1990s. Despite the apparent decline since 1995, the number of checks paid remained higher in 2000 than in 1979.
The estimated value of checks paid declined from $50.7 trillion in 1979 to $39.3 trillion in 2000, sug-gesting that electronic payments have increasingly replaced larger-value checks. Moreover, although the real value of transaction deposits declined slightly from 1979 to 2000, the decline was not as great as the decline in the value of checks paid, a further sugges-tion that electronic payments originated from trans-action deposits likely replaced check payments.
The number and value of checks paid vary among institutions in interesting ways. The average value of checks paid, as well as the intensity of check use, differs by type and size of institution, reflecting in part the types of customers served. Differences also exist according to geographic region. Generally, the per capita value of checks paid is highest in the Northeast, and the number of checks paid per capita is highest in the Midwest. In addition, the number of checks paid per capita apparently is greater in rural areas than in urban areas.
Although the number and value of checks may have begun to decline, it appears likely that checks will continue to play a significant role in the U.S. payment system, particularly when electronic pay-ments are not well suited for meeting consumer or business needs. U.S. authorities have generally relied on market forces to provide new payment products and services. In this environment, the fact that checks are still widely used suggests either that checks are an efficient means of payment for many purposes relative to alternatives or that barriers to innovation are inhibiting the development of alternatives. The Federal Reserve has emphasized the need for the public and private sectors to identify any such barri-ers and to work to reduce or eliminate them when doing so is in the public interest.

APPENDIX: DATA SOURCES AND METHODS OF ESTIMATION.
Described in this appendix are the surveys that pro-vided the data analyzed in this article. Also described are methods used to estimate the total number and value of checks for 2000, 1995, and 1979.
2000 Data.
The most recent data were collected through a set of three surveys sponsored by the Federal Reserve and known collectively as the Retail Payment Research Project.
[note: 21]. Global Concepts, Inc., and Westat assisted with the first and second surveys, and Dove Consulting assisted with the third. The preliminary results of the three surveys were announced in November 2001. A complete description of the project is available at the Federal Reserve Financial Services web site (www.frbservices.org) under the topic Key Initiatives. [end of note.]
The three surveys were
• Depository Institution Check Study—Survey of a stratified random sample of insured commercial banks, credit unions, and savings institutions in the United States to estimate the number and value of checks paid in 2000 from data for March and April 2001
[note: 22]. Almost all checks in the United States are written against insured transaction deposits held at these types of institutions. Deposi-tory institutions serve as paying banks for checks written by the customers of nondepository institutions, such as checks written against money market and mutual fund deposit accounts with check-writing privileges. [end of note.]
• Check Sample Study—Survey of individual checks submitted for collection by a stratified random sample of depository institutions during 2000 to characterize check payments in that year in terms of payer, payee, and purpose
• Electronic Payment Instruments Study—Survey of the universe of electronic payment networks, card issuers, and third-party processors to estimate the number and value of retail electronic payments originated in the United States in 2000. Covered in the survey were credit cards (both general-purpose and private-label cards), debit cards (both on-line cards, which are used by entering a personal identi-fication number, and signature-based cards, which generally involve signing a receipt), and ACH transactions.
The collection of data on electronic payments was straightforward because the processing of electronic payments is largely centralized. Credit and debit card
transactions are processed through a small number of networks, and payments flow through these net-works, even if the payer and payee are customers of the same bank. Because more than one network can process the same payment, double counting could have been an issue. To avoid this potential problem, the networks were asked to report only those pay-ments that were originated on their own network.
The check-clearing system is far less centralized than the electronic payments processing system. Checks are paid by several types of institutions— commercial banks, credit unions, savings institu-tions, and U.S. branches of foreign banks. To obtain payment for a check, the depository institution into which the check is first deposited, usually the payee's bank, must present it to the paying bank. Presentment commonly requires that the check be physically delivered to the paying bank to receive payment (though presentment can be made electronically if the paying bank agrees). Presentment can be done directly or through an intermediary such as a corre-spondent bank, a clearinghouse, or a Federal Reserve Bank. Although the number and value of checks collected by the Reserve Banks each year are known, the number and value of checks presented directly or through other intermediaries are unknown. Because such data are not included in reports filed by deposi-tory institutions, they must be estimated on the basis of surveys. Sample design and methods of estimation are described below.
Estimation of the Number and Value of Checks Paid.
The number and value of checks paid, the share of on-us checks, and the number and value of returned checks for 2000 were estimated using data from the Depository Institution Check Study. In this study, the surveyed depository institutions were instructed to report only those checks paid on behalf of their own customers and to exclude checks that they collected on behalf of other depository institutions. To account for checks written on money market and other accounts at brokerages, respondents were instructed to include in their figures the checks they settled on behalf of those nondepository institutions.
Sample design. Whether checks are written on tradi-tional checking accounts provided by depository institutions, on accounts provided at brokerages or other nondepository institutions, or are money orders, cashiers checks, rebate checks, or travelers checks,

they are generally paid by depository institutions. The population of depository institutions from which the sample was drawn encompassed commercial banks (including branches of foreign banks), credit unions, and savings institutions. Depository institu-tion subsidiaries of multibank holding companies were treated as a single institution. Depository institu-tions in the population that had transaction deposits at the close of business on September 30, 2000 (June 30, 2000, for credit unions), were grouped by type—commercial bank, credit union, or savings institution—and stratified by value of transaction deposits (excluding the transaction deposits of other banks and the U.S. government), as reported to fed-eral depository institution regulators.
The sampling procedure was designed to achieve 95 percent confidence intervals no larger than ±5 per-cent of the size of the estimates of total number and value of checks paid. Six strata were defined for commercial banks, five for credit unions, and three for savings institutions. The boundaries of the strata and the probability of selection for institutions in each stratum were set to maximize the precision of the estimates of the number and value of checks. Because transaction deposits are concentrated in the largest institutions, the probability of an institution's being sampled increased with the value of its trans-action deposits, although the probability of selection was the same for all the institutions in a given stra-tum. Using the assumption of a response rate of 65 percent or greater, 2,365 depository institutions were sampled. The probability of selection for the largest 533 commercial banks, 104 credit unions, and 40 savings institutions was 100 percent.
There were 1,256 valid responses for the number and value of checks; 1,011 valid responses for the share of on-us checks; and 1,036 valid responses for the number of returned checks. For the total number and value of checks, the overall response rate was about 53 percent. In part because response rates were higher for strata with larger depository institutions, the desired precision was achieved for the estimate of check number; it was not, however, for the estimate of check value.
Estimation. To improve the accuracy of the estimates, the strata used for estimation were updated using transaction deposit information for the population of depository institutions with transaction deposits at the close of business on March 31, 2001 (Decem-ber 31, 2000, for credit unions) (14,696 institutions). For the final estimation, commercial banks were grouped into seven strata, credit unions into six, and savings institutions into four.
Check figures were annualized by summing the figures for March and April 2001 and multiplying by six. For simplicity, these annualized figures were assumed valid for 2000, an assumption supported by data on Federal Reserve check collections: The num-ber of checks collected by the Federal Reserve Banks, which may track total checks for short intervals, declined slightly but was relatively flat between 2000 and 2001. The annualization factor implied by the number of checks collected by the Reserve Banks would have been slightly smaller than six because check collection volume in March and April tends to be higher than in other months.
Estimates of the number and value of checks were based on separate ratio estimators for each stratum using transaction deposits as the covariate. (Within a stratum, the amount of transaction deposits was highly correlated with the number and value of checks reported by the responding institutions.) The estimate of total number (or value) of checks paid by depository institutions was equal to the sum of the estimates for the strata. Data on the number (or value) of U.S. Treasury checks and postal money orders paid in 2000 were added to that estimate to obtain the estimated total for 2000.
The precision of the estimates is characterized by the 95 percent confidence intervals reported below. Confidence intervals were computed by multiplying ±1.96 by the sampling standard errors. The sampling standard errors reflect the variability within the sample data as well as the number of survey responses.
The estimates reported in this article for the num-ber of checks paid in 2000—42.5 billion (95 percent confidence interval of 40.9 billion to 44.1 billion)— and the value of checks paid in 2000—$39.3 trillion (95 percent confidence interval of $36.9 trillion to $41.8 trillion)—are revised from preliminary esti-mates released in November 2001.
[note: 23]. Revisions were based on the correction of several data errors identified during the preparation of this article. [end of note.]
Estimation of the Number and Value of Checks Paid by Location of Deposits.
Although the survey of depository institutions was not explicitly designed to facilitate a comparison of check use by geographic region, sufficient responses were received to make such a comparison possible. For each of four regions—Northeast, South, Mid-west, and West—separate estimates of the number

and value of checks paid were made for single-region institutions (those having deposits in only one region) and multiregion institutions (those having deposits in more than one region). For multiregion commercial banks and savings institutions, checks and transaction deposits were allocated to regions according to the proportion of the institution's total deposits in each of the regions. The allocation method assumed that within these institutions, the ratios of transaction deposits to total deposits, check number to transac-tion deposits, and check value to transaction deposits were constant. Information on the location of depos-its at credit unions and branches of foreign banks was unavailable, and data for these institutions were as-signed to the state in which the head office of the depository institution was located. Except for several of the largest credit unions (about ten), most of these institutions operate within the boundaries of a single state.
To produce the regional estimates, institutions were stratified first by region and then by type and size. For each region, the strata were constructed by sepa-rating institutions into multiregion and single-region, type, and size categories, with strata boundaries selected according to an approximation to Neyman allocation.
[note: 24]. The approximation method used was from Tore Dalenius and Joseph L. Hodges, "Minimum Variance Stratification,'' Journal of the American Statistical Association, vol. 54 (1959), pp. 88-101. [end of note.]
New ratio estimators were produced using these strata, following the procedure described in the preceding section.
[note: 25]. The national estimates obtained from aggregating these regional estimates for commercial banks and savings institutions were about the same as those obtained from the original study but were slightly more precise. The increased precision appears to have been a result of additional homogeneity among the institutions in the result-ing strata. [end of note.]
About 138 institutions had branches in more than one of the four regions. (These institutions paid about 40 percent of all checks and accounted for just over 40 percent of transaction deposits.) For each of these multiregion institutions, prior to estimation, transac-tion deposits and check data (number and value of checks) were allocated to regions in proportion to the location of their total deposits. Allocating transaction deposits according to total deposits assumes that, for the institutions in the sample, transaction deposits and checks are in the same proportion to total depos-its for every region. This allocation method appears reasonable for the construction of an aggregate regional estimate but may not hold true for some institutions. Whether large regional differentials in this proportion for some very large institutions would weaken or strengthen the apparent regional differ-ences reported here is unclear.
Estimates of urban and rural check use were con-structed using a method similar to that used to construct estimates by region. Urban areas were defined as metropolitan statistical areas (MSAs) and New England county metropolitan statistical areas (NECMAs), and rural areas as all other areas.
Characterization of Checks by Payer, Payee, and Purpose.
The survey of individual checks was intended to gather information about the shares of checks written by and received by businesses, consumers, and gov-ernments and the purposes of the payments. Data were collected on almost 30,000 checks from nearly 150 depository institutions.
A two-tiered sample design was used to collect a representative sample of checks. First, a stratified, random sample of depository institutions was gen-erated from the population of commercial banks, savings institutions, and credit unions. Then each selected institution was asked to retrieve a random sample of the checks it collected in 2000, using its internal records. The number of checks provided by an institution was in proportion to the amount of its transaction deposits. For each sampled check, the institution recorded certain objective characteristics useful in determining the type of payer and payee and the purpose of the payment. The institution also recorded a subjective assessment of the type of payer and payee—information that was used later to verify the validity of the categories assigned using the objective characteristics. To protect privacy, the insti-tutions did not provide information that could be used to specifically identify the payer or payee. For the reported figures, separate ratio estimates for the strata were summed to produce an estimate for the population.
1979 Data.
The 1979 data were collected in a survey conducted in that year by the Federal Reserve Bank of Atlanta and cosponsored by the Reserve Bank, the American Bankers Association, and the Bank Administration Institute.
[note: 26]. Federal Reserve Bank of Atlanta, "A Quantitative Description of the Check Collection System: A Report of Research Findings on the Check Collection System'' (1980). [end of note.]
The estimates of the number and value of checks for 1979 were produced from separate ratio estimates of the total number of checks reported by a stratified sample of 343 banks.

1995 Data.
The 1995 data were collected in a survey conducted in 1996 for a report to the Congress on funds avail-ability and check fraud.
[note: 27]. Board of Governors of the Federal Reserve System, ' ' Report to Congress on Funds Availability Schedules and Check Fraud at Deposi-tory Institutions'' (Board of Governors, 1996). [end of note.]
The estimate of number of checks paid was based on the sum of two figures requested in the survey questionnaire: number of checks paid during 1995 that had been received from other institutions and number of checks paid during 1995 that were on-us checks. The survey provided information on checks paid by a random sample of depository institutions. On the basis of 606 valid responses, Board staff produced, for this article, an estimate of the number of checks paid in 1995 for comparison with the estimates for 1979 and 2000. The definition of the amount of transaction deposits was the same as that used for the 2000 estimates.
Unlike the 2000 estimate, the population in this study was defined as individually chartered depository institutions.
For the estimation of the number of checks paid, the population of depository institutions was strati-fied using the value of transaction deposits in Decem-ber 1995, with optimal strata boundaries set using an approximation to Neyman allocation as described above. Seven strata were defined for commercial banks, three for credit unions, and three for savings institutions. The estimate of the total number of checks paid by depository institutions was equal to the sum of separate ratio estimates for the strata. The number of U.S. Treasury checks and postal money orders paid in 1995 was added to that estimate to obtain the estimate of the total for 1995. The estimate was 49.5 billion (95 percent confidence interval of 44.3 billion to 54.8 billion). The estimate for 1995 was higher than the 2000 estimate, and the difference was statistically significant, showing that the differ-ence is unlikely to be due to sampling error.


![Cambodian Law on Negotiable Instruments and Payment Transaction [2005]](https://img.pdfslide.net/doc/110x75/54faf3564a795956048b4e89/cambodian-law-on-negotiable-instruments-and-payment-transaction-2005.jpg)