Embed Size (px)
Citation preview
The use of Dredged Marine Sediment in theFormulation of Air-foamed Concretehamza elmoueden ( [email protected] )
IMT Lille DouaiMouhamadou Mouhamadou
IMT Lille DouaiAGNES ZAMBON
IMT Lille DouaiNOUR EDINE ABRIAK
IMT Lille DouaiMAHFOUD BENZERZOUR
IMT Lille Douai
Research Article
Keywords: Dredged sediment, Reuse, Foam concrete, Air void, Formulation
Posted Date: May 11th, 2021
DOI: https://doi.org/10.21203/rs.3.rs-336587/v1
License: This work is licensed under a Creative Commons Attribution 4.0 International License. Read Full License
1
The use of dredged marine sediment in the formulation of air-foamed concrete
Hamza EL MOUEDEN, Mouhamadou AMAR, Agnes ZAMBON, Mahfoud BENZERZOUR,
Nor-Edine ABRIAK
Univ. Lille, IMT Lille Douai, Univ. Artois, Yncrea Hauts de France, ULR 4515-LGCgE, Laboratoire
de Génie Civil et géo-Environnement, F-59000 Lille, France
Abstract
A large quantity of sediments is dredged continuously worldwide. They are generally dumped in landfill
areas which ensue in the increasing cost of the dredging operations and in soil-groundwater pollution.
The objective of this work is to study the beneficial reuse of dredged sediments in foam mortar and
particularly by studying the influence of the substitution of sand by dredged sediments. Air foam
mortars/concrtes is an alternative to ordinary concrete, which presents the advantages of lightweight and
low thermal conductivity. In this study, the density required ranges from 1200kg/m3 to 1600kg/m3 to
the development of foam concrete building blocks and slabs for load-bearing and non-load-bearing
structures. Twenty foam mortar mixes were prepared. Sediments were introduced by replacing 15%,
30%, and 50% mass of the sand. The foam percentage was introduced from 0% to 100% volume of
mortar. Workability, compressive strength, and flexural strength at the age of 7, 28, and 60 days were
monitored. The size distribution of foam bubbles and the effect of sediments on their stability is also
studied. The results demonstrate that sediment has a good general effect on foam concrete and this opens
up very promising new types of concretes. However, for a high substitution rate, a decrease in
performances is denoted.
Keywords
Dredged sediment, Reuse, Foam concrete, Air void, Formulation
2
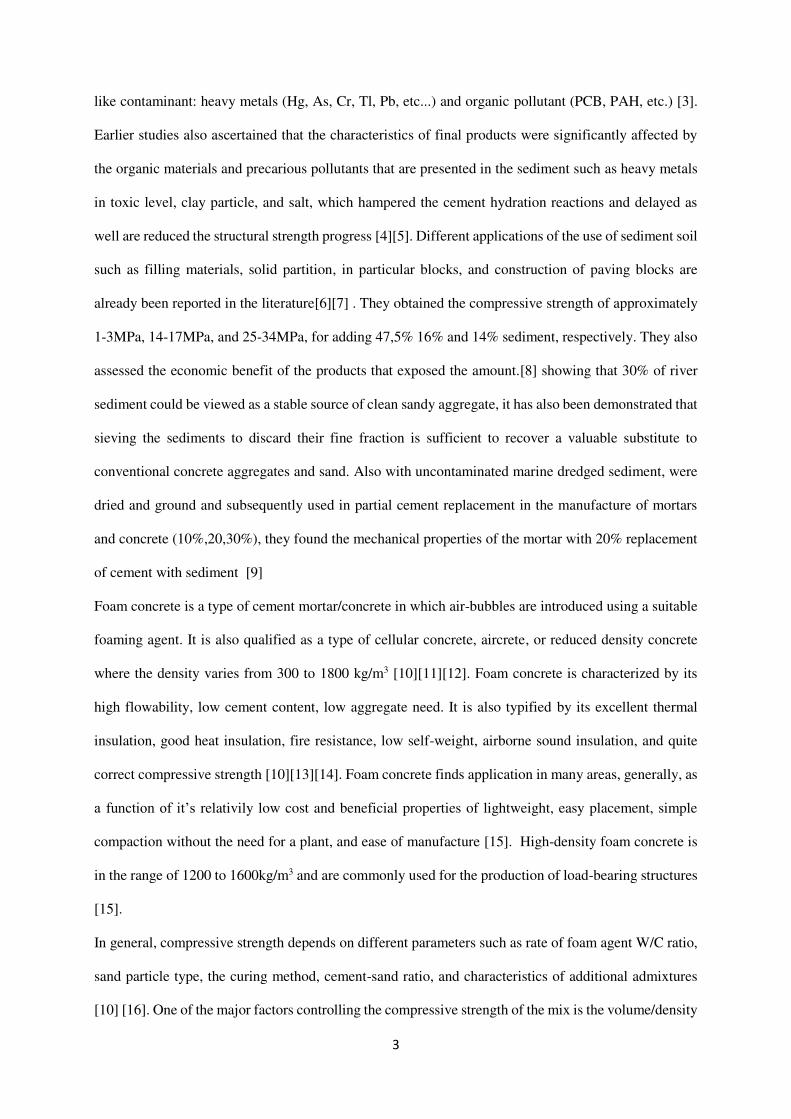
Graphical abstract
Statement of Novelty there are very limited studies, found in literature on the production of foam concrete with dredged marine
sediment. Consequently, a novel type of foam concrete was prepared in this study utilizing dredged
sediment as raw material, the effects of different ratios of substitution of sand by sediment, and addition
of foam was analyzed. The results demonstrate that sediment has a good general effect of foam concrete
and this opens up very promising new types of concretes. However, for a high substitution rate, a
decrease in performances is denoted.
Introduction
Each year, several hundred millions tons of sediment are dredged all over the world. These are
characterized by high water content and large volume [1]. In France, the river sediment extracted
represents 6 million m3 per year [2] and 50 million m3 marine sediments are dredged at the same time.
This accumulation gradually reduces the depth of rivers and becomes a real constraint for river transport.
The rivers Network of Nord-Pas de-Calais is a port that suffers from significant sedimentation, due to
the low flows and slopes that characterize its hydrographic network.
Recycling sediment into a building material is regarded as a prospective strategy in the context of an
economical and sustainable manner of safe disposal. Fluvial dredging sediments is mainly composed of
fine particles and have a specific physical and chemical characteristic compared with natural aggregates
3
like contaminant: heavy metals (Hg, As, Cr, Tl, Pb, etc...) and organic pollutant (PCB, PAH, etc.) [3].
Earlier studies also ascertained that the characteristics of final products were significantly affected by
the organic materials and precarious pollutants that are presented in the sediment such as heavy metals
in toxic level, clay particle, and salt, which hampered the cement hydration reactions and delayed as
well are reduced the structural strength progress [4][5]. Different applications of the use of sediment soil
such as filling materials, solid partition, in particular blocks, and construction of paving blocks are
already been reported in the literature[6][7] . They obtained the compressive strength of approximately
1-3MPa, 14-17MPa, and 25-34MPa, for adding 47,5% 16% and 14% sediment, respectively. They also
assessed the economic benefit of the products that exposed the amount.[8] showing that 30% of river
sediment could be viewed as a stable source of clean sandy aggregate, it has also been demonstrated that
sieving the sediments to discard their fine fraction is sufficient to recover a valuable substitute to
conventional concrete aggregates and sand. Also with uncontaminated marine dredged sediment, were
dried and ground and subsequently used in partial cement replacement in the manufacture of mortars
and concrete (10%,20,30%), they found the mechanical properties of the mortar with 20% replacement
of cement with sediment [9]
Foam concrete is a type of cement mortar/concrete in which air-bubbles are introduced using a suitable
foaming agent. It is also qualified as a type of cellular concrete, aircrete, or reduced density concrete
where the density varies from 300 to 1800 kg/m3 [10][11][12]. Foam concrete is characterized by its
high flowability, low cement content, low aggregate need. It is also typified by its excellent thermal
insulation, good heat insulation, fire resistance, low self-weight, airborne sound insulation, and quite
correct compressive strength [10][13][14]. Foam concrete finds application in many areas, generally, as
a function of it’s relativily low cost and beneficial properties of lightweight, easy placement, simple
compaction without the need for a plant, and ease of manufacture [15]. High-density foam concrete is
in the range of 1200 to 1600kg/m3 and are commonly used for the production of load-bearing structures
[15].
In general, compressive strength depends on different parameters such as rate of foam agent W/C ratio,
sand particle type, the curing method, cement-sand ratio, and characteristics of additional admixtures
[10] [16]. One of the major factors controlling the compressive strength of the mix is the volume/density
4
of foam agent by the number of air voids in the hardened foam concrete varies [17][18][19]. Typically,
three types of foaming agents are used for the production of foam concrete, namely synthetic, protein,
and organic-based foaming agents. It has been observed that for a protein-based foaming agent, the air
voids were smaller and more uniformed in size at higher foam concrete densities than synthetic-based
foaming agents [20]. Batool et al. [21] Observed that the mixes with a smaller range of air-void size
distribution exhibited greater conductivity and lesser density whereas a wider distribution of larger void
size resulted in a reduced conductivity. The performance of foamed concrete produced with different
foaming agents varies greatly because it is related to the stability of the foam which may be damaged
by drainage, coalescence, and ripening[22][23].
Use of different waste materials like bottom ash, waste glass, construction, and demolition waste, clay
brick... etc as a substitute for cement or aggregate in the production of foamed concrete highlights the
importance of this exercise towards environmental sustainability in this way, reliance on conventional
concrete making materials abstained from natural resources can be reduced while at the same time
minimizing the associated waste disposal issues[24][25][26][27][28]
It is worth to be mentioned that, there are very limited studies, fond in literature on the production of
foam concrete with dredged marine sediment. Consequently, a novel type of foam concrete was prepared
in this study utilizing dredged sediment as raw material, the effects of different ratios of substitution of
sand by sediment, and addition of foam was analyzed.
Experimental program
A cement CEM I 42,5 R is the one used in this study. In the mortar formulation, a CEN quartz sand was
used. The sediment used in this study was extracted from the port of Dunkirk in France. The water
absorption for sediment is determined according to NF EN 196-3. The raw sediment presented a
moisture content and after ambient air-dried, they were dried in an oven at 110 C° for 24h, and then it
wase passed to the 2mm sieve to remove large stones and pebbles. Water absorption of the sand is
determined according to EN 1097-6. The BET (Brunauer-Emmett-Teller) method and Blaine (NF EN
196-6 [24]) test is estimations of surface area and the fineness (NF EN ISO 18757 [25]) is measured
5
using a Micromeritics Autopore IV 9505 device. The organic fraction was also determined (XP P94-
047 [26]). The specific density of the materials was determined using a MICROMETRICS
AccuPyc1330 helium pycnometer. This test was performed in compliance with the European standard
NF EN 1097-7[27]. Bending and compressive strength was assessed using the three prismatic test
samples 4x4x16 cm (NF EN 196-1 [28]). Thermogravimetric analysis (TGA) was performed using
nitrogen gas in a controlled environment with the argon flow (75ml/min) at variable temperatures
ranging between 105
and 1100 C° at an increasing rate of 2 C°/min. Differential thermal analysis was also performed at
ambient air and variable temperature (0 - 1000 C°, at a range of 5k/min/1000).
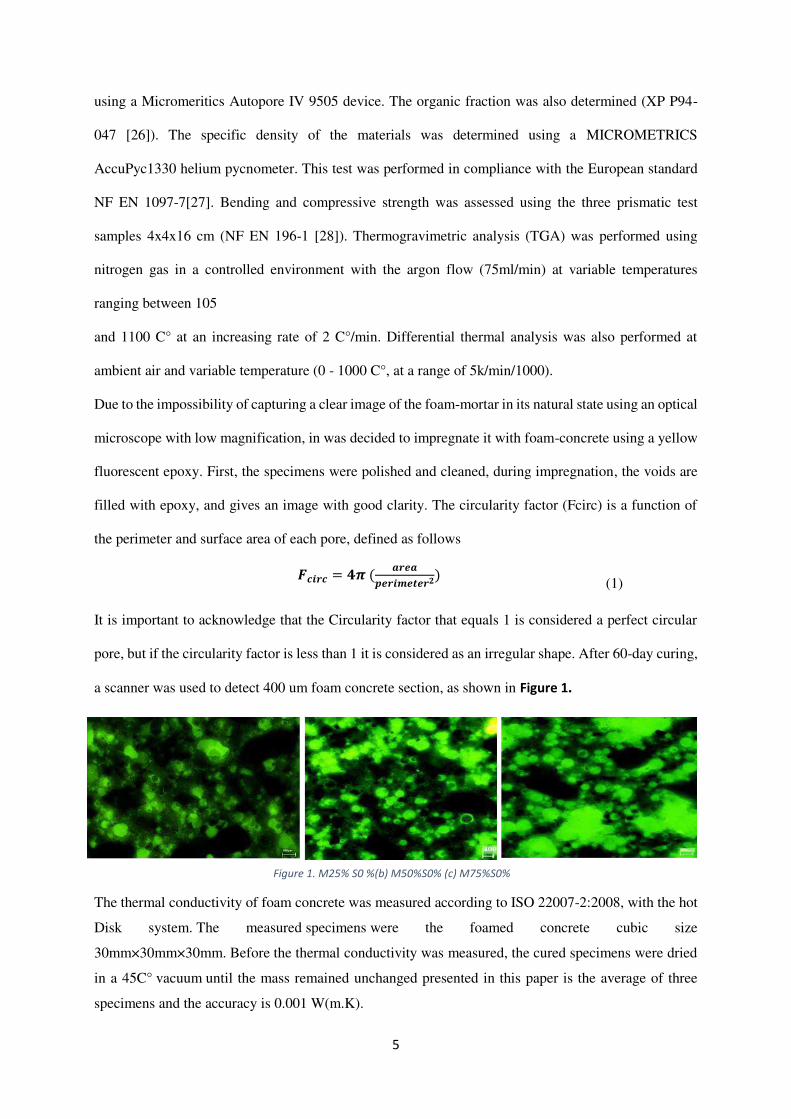
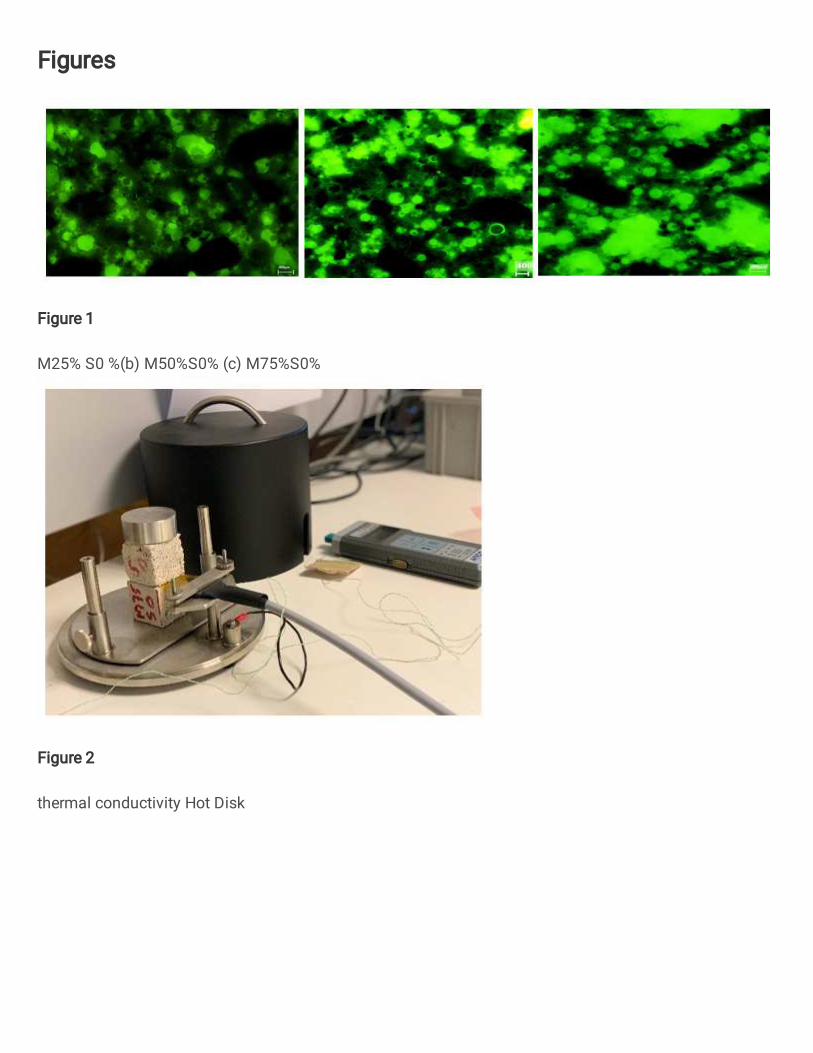
Due to the impossibility of capturing a clear image of the foam-mortar in its natural state using an optical
microscope with low magnification, in was decided to impregnate it with foam-concrete using a yellow
fluorescent epoxy. First, the specimens were polished and cleaned, during impregnation, the voids are
filled with epoxy, and gives an image with good clarity. The circularity factor (Fcirc) is a function of
the perimeter and surface area of each pore, defined as follows
𝑭𝒄𝒊𝒓𝒄 = 𝟒𝝅 ( 𝒂𝒓𝒆𝒂𝒑𝒆𝒓𝒊𝒎𝒆𝒕𝒆𝒓𝟐) (1)
It is important to acknowledge that the Circularity factor that equals 1 is considered a perfect circular
pore, but if the circularity factor is less than 1 it is considered as an irregular shape. After 60-day curing,
a scanner was used to detect 400 um foam concrete section, as shown in Figure 1.
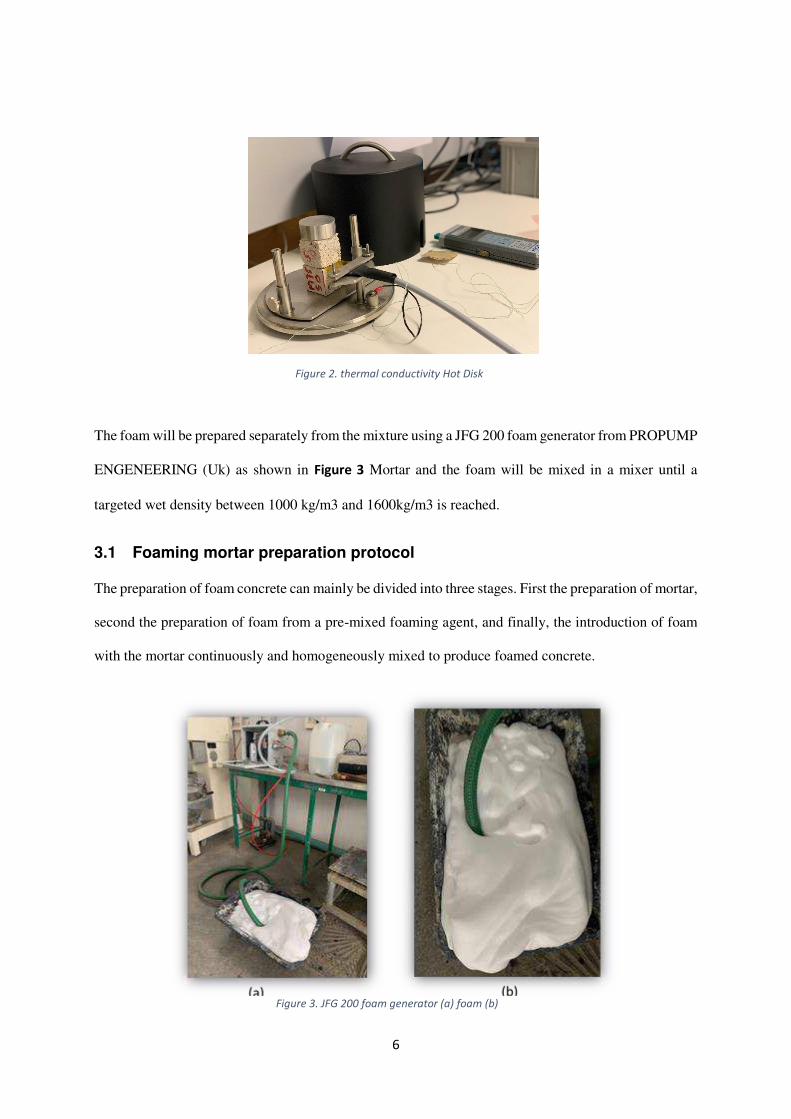
The thermal conductivity of foam concrete was measured according to ISO 22007-2:2008, with the hot
Disk system. The measured specimens were the foamed concrete cubic size
30mm×30mm×30mm. Before the thermal conductivity was measured, the cured specimens were dried
in a 45C° vacuum until the mass remained unchanged presented in this paper is the average of three
specimens and the accuracy is 0.001 W(m.K).
Figure 1. M25% S0 %(b) M50%S0% (c) M75%S0%
6
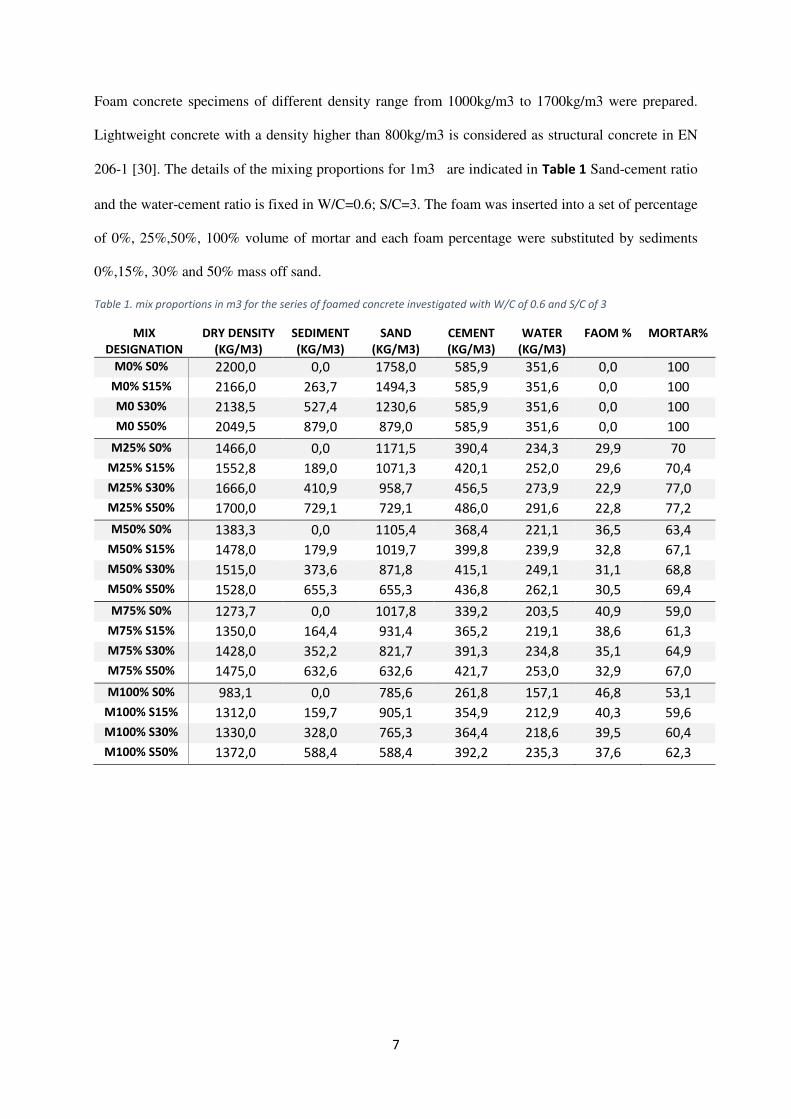
The foam will be prepared separately from the mixture using a JFG 200 foam generator from PROPUMP
ENGENEERING (Uk) as shown in Figure 3 Mortar and the foam will be mixed in a mixer until a
targeted wet density between 1000 kg/m3 and 1600kg/m3 is reached.
3.1 Foaming mortar preparation protocol
The preparation of foam concrete can mainly be divided into three stages. First the preparation of mortar,
second the preparation of foam from a pre-mixed foaming agent, and finally, the introduction of foam
with the mortar continuously and homogeneously mixed to produce foamed concrete.
Figure 3. JFG 200 foam generator (a) foam (b)
Figure 2. thermal conductivity Hot Disk
7
Foam concrete specimens of different density range from 1000kg/m3 to 1700kg/m3 were prepared.
Lightweight concrete with a density higher than 800kg/m3 is considered as structural concrete in EN
206-1 [30]. The details of the mixing proportions for 1m3 are indicated in Table 1 Sand-cement ratio
and the water-cement ratio is fixed in W/C=0.6; S/C=3. The foam was inserted into a set of percentage
of 0%, 25%,50%, 100% volume of mortar and each foam percentage were substituted by sediments
0%,15%, 30% and 50% mass off sand.
Table 1. mix proportions in m3 for the series of foamed concrete investigated with W/C of 0.6 and S/C of 3
MIX
DESIGNATION
DRY DENSITY
(KG/M3)
SEDIMENT
(KG/M3)
SAND
(KG/M3)
CEMENT
(KG/M3)
WATER
(KG/M3)
FAOM % MORTAR%
M0% S0% 2200,0 0,0 1758,0 585,9 351,6 0,0 100
M0% S15% 2166,0 263,7 1494,3 585,9 351,6 0,0 100
M0 S30% 2138,5 527,4 1230,6 585,9 351,6 0,0 100
M0 S50% 2049,5 879,0 879,0 585,9 351,6 0,0 100
M25% S0% 1466,0 0,0 1171,5 390,4 234,3 29,9 70
M25% S15% 1552,8 189,0 1071,3 420,1 252,0 29,6 70,4
M25% S30% 1666,0 410,9 958,7 456,5 273,9 22,9 77,0
M25% S50% 1700,0 729,1 729,1 486,0 291,6 22,8 77,2
M50% S0% 1383,3 0,0 1105,4 368,4 221,1 36,5 63,4
M50% S15% 1478,0 179,9 1019,7 399,8 239,9 32,8 67,1
M50% S30% 1515,0 373,6 871,8 415,1 249,1 31,1 68,8
M50% S50% 1528,0 655,3 655,3 436,8 262,1 30,5 69,4
M75% S0% 1273,7 0,0 1017,8 339,2 203,5 40,9 59,0
M75% S15% 1350,0 164,4 931,4 365,2 219,1 38,6 61,3
M75% S30% 1428,0 352,2 821,7 391,3 234,8 35,1 64,9
M75% S50% 1475,0 632,6 632,6 421,7 253,0 32,9 67,0
M100% S0% 983,1 0,0 785,6 261,8 157,1 46,8 53,1
M100% S15% 1312,0 159,7 905,1 354,9 212,9 40,3 59,6
M100% S30% 1330,0 328,0 765,3 364,4 218,6 39,5 60,4
M100% S50% 1372,0 588,4 588,4 392,2 235,3 37,6 62,3
8
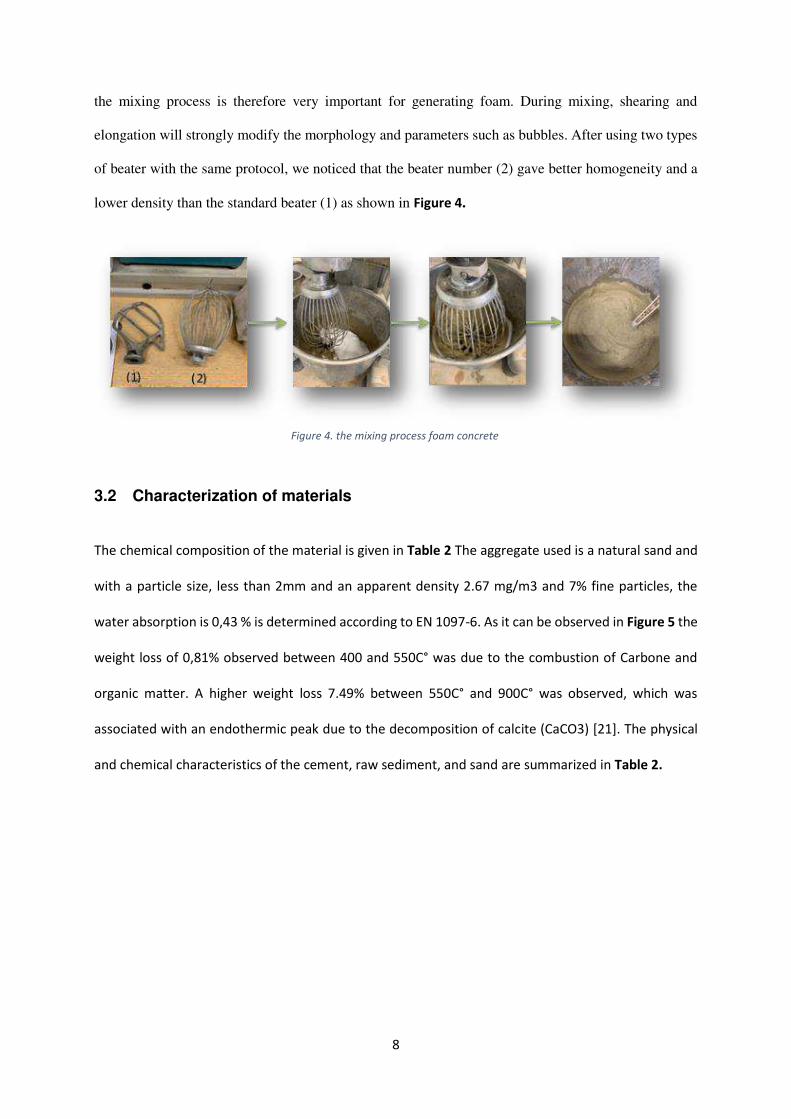
the mixing process is therefore very important for generating foam. During mixing, shearing and
elongation will strongly modify the morphology and parameters such as bubbles. After using two types
of beater with the same protocol, we noticed that the beater number (2) gave better homogeneity and a
lower density than the standard beater (1) as shown in Figure 4.
3.2 Characterization of materials
The chemical composition of the material is given in Table 2 The aggregate used is a natural sand and
with a particle size, less than 2mm and an apparent density 2.67 mg/m3 and 7% fine particles, the
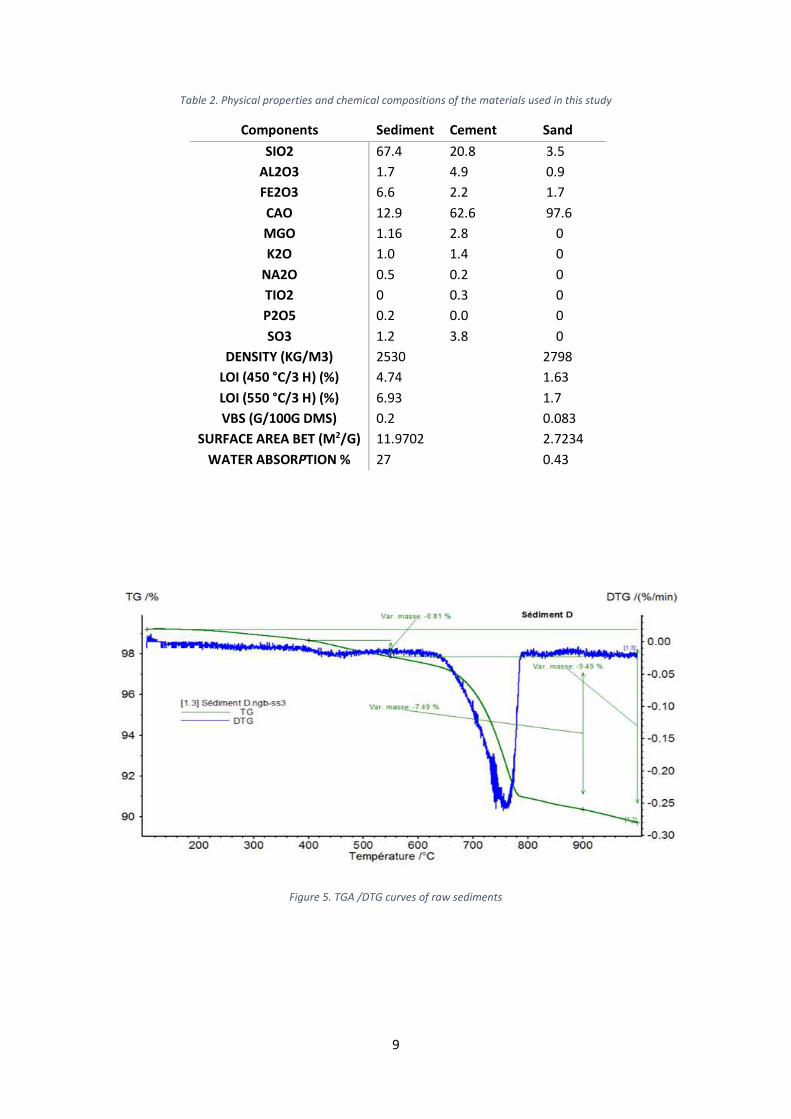
water absorption is 0,43 % is determined according to EN 1097-6. As it can be observed in Figure 5 the
weight loss of 0,81% observed between 400 and 550C° was due to the combustion of Carbone and
organic matter. A higher weight loss 7.49% between 550C° and 900C° was observed, which was
associated with an endothermic peak due to the decomposition of calcite (CaCO3) [21]. The physical
and chemical characteristics of the cement, raw sediment, and sand are summarized in Table 2.
Figure 4. the mixing process foam concrete
9
Table 2. Physical properties and chemical compositions of the materials used in this study
Figure 5. TGA /DTG curves of raw sediments
Components Sediment Cement Sand
SIO2 67.4 20.8 3.5
AL2O3 1.7 4.9 0.9
FE2O3 6.6 2.2 1.7
CAO 12.9 62.6 97.6
MGO 1.16 2.8 0
K2O 1.0 1.4 0
NA2O 0.5 0.2 0
TIO2 0 0.3 0
P2O5 0.2 0.0 0
SO3 1.2 3.8 0
DENSITY (KG/M3) 2530 2798
LOI (450 °C/3 H) (%) 4.74 1.63
LOI (550 °C/3 H) (%) 6.93 1.7
VBS (G/100G DMS) 0.2 0.083
SURFACE AREA BET (M2/G) 11.9702 2.7234
WATER ABSORPTION % 27 0.43
10
Results and discussions
4.1 Workability
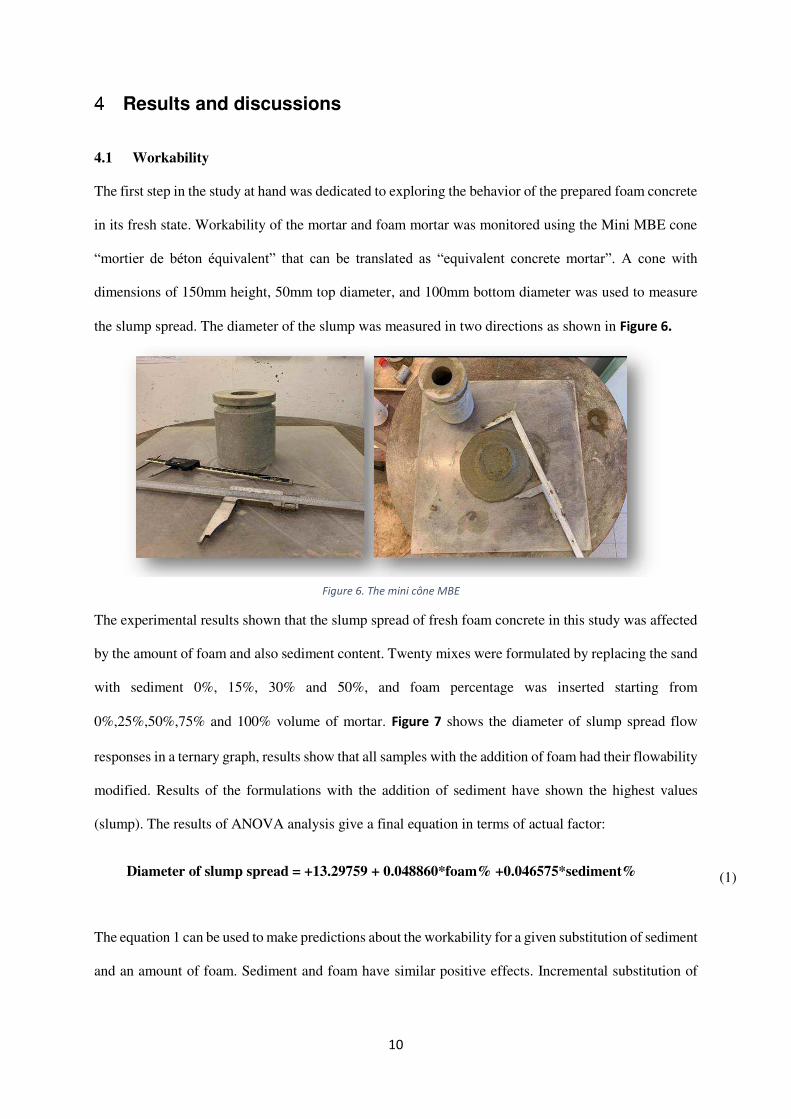
The first step in the study at hand was dedicated to exploring the behavior of the prepared foam concrete
in its fresh state. Workability of the mortar and foam mortar was monitored using the Mini MBE cone
“mortier de béton équivalent” that can be translated as “equivalent concrete mortar”. A cone with
dimensions of 150mm height, 50mm top diameter, and 100mm bottom diameter was used to measure
the slump spread. The diameter of the slump was measured in two directions as shown in Figure 6.
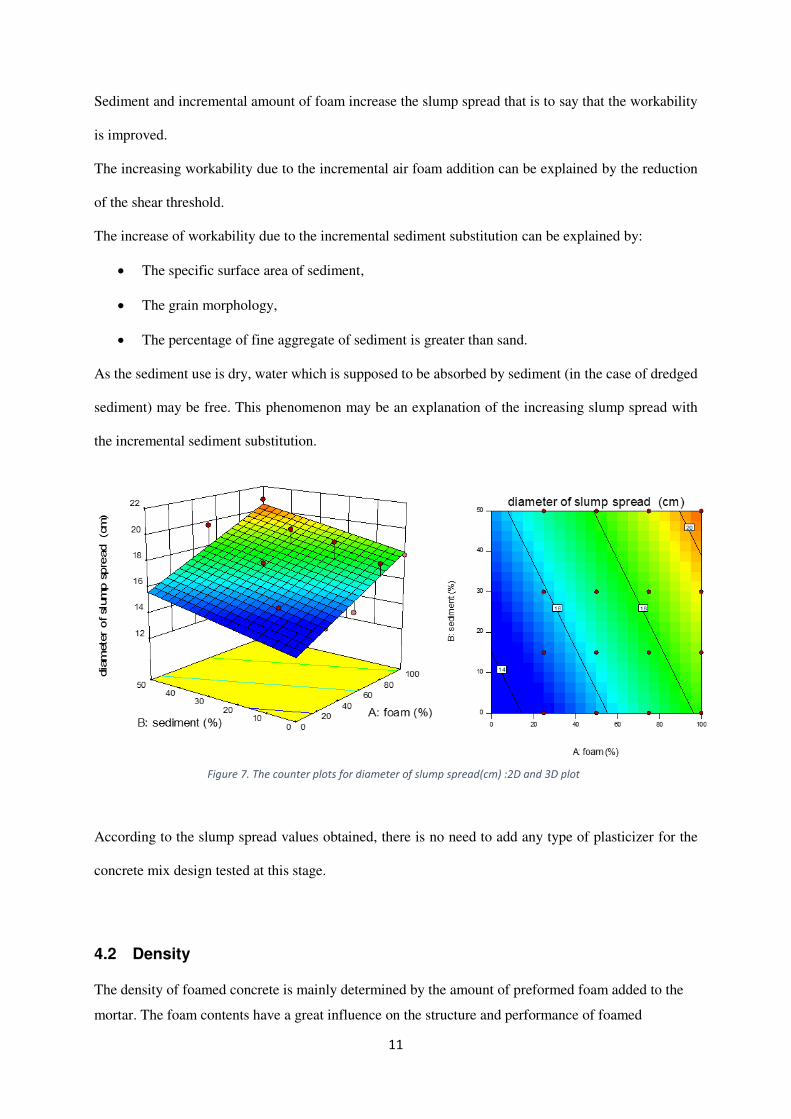
The experimental results shown that the slump spread of fresh foam concrete in this study was affected
by the amount of foam and also sediment content. Twenty mixes were formulated by replacing the sand
with sediment 0%, 15%, 30% and 50%, and foam percentage was inserted starting from
0%,25%,50%,75% and 100% volume of mortar. Figure 7 shows the diameter of slump spread flow
responses in a ternary graph, results show that all samples with the addition of foam had their flowability
modified. Results of the formulations with the addition of sediment have shown the highest values
(slump). The results of ANOVA analysis give a final equation in terms of actual factor:
Diameter of slump spread = +13.29759 + 0.048860*foam% +0.046575*sediment% (1)
The equation 1 can be used to make predictions about the workability for a given substitution of sediment
and an amount of foam. Sediment and foam have similar positive effects. Incremental substitution of
Figure 6. The mini cône MBE
11
Sediment and incremental amount of foam increase the slump spread that is to say that the workability
is improved.
The increasing workability due to the incremental air foam addition can be explained by the reduction
of the shear threshold.
The increase of workability due to the incremental sediment substitution can be explained by:
The specific surface area of sediment,
The grain morphology,
The percentage of fine aggregate of sediment is greater than sand.
As the sediment use is dry, water which is supposed to be absorbed by sediment (in the case of dredged
sediment) may be free. This phenomenon may be an explanation of the increasing slump spread with
the incremental sediment substitution.
According to the slump spread values obtained, there is no need to add any type of plasticizer for the
concrete mix design tested at this stage.
4.2 Density
The density of foamed concrete is mainly determined by the amount of preformed foam added to the
mortar. The foam contents have a great influence on the structure and performance of foamed
Figure 7. The counter plots for diameter of slump spread(cm) :2D and 3D plot
12
concrete. Too much foam can cause the slurry to fail to form. In order to explore the optimal dosage of
preformed foam, foam concrete samples with W/C 0,6and varying foam contents (25%,50%,75, and
100% by volume of mortar) were made, and also sediments were introduced by replacing 15%,30%
and 50% of masse of sand it should be noted that the use of the dosage of 100% foam it has been noted
that there were many merged pores in the foamed concrete. The merging of adjacent bubbles led to a
large pore size of the hardened foamed concrete. The increased merged porosity and pore size resulted
in a sharp reduction in the compressive strength of foamed concrete
A function modelling (build with ANOVA Analysis) experimental results to determine density with
mix design parameters:
1- Air foam percentage
2- Sediment substitution
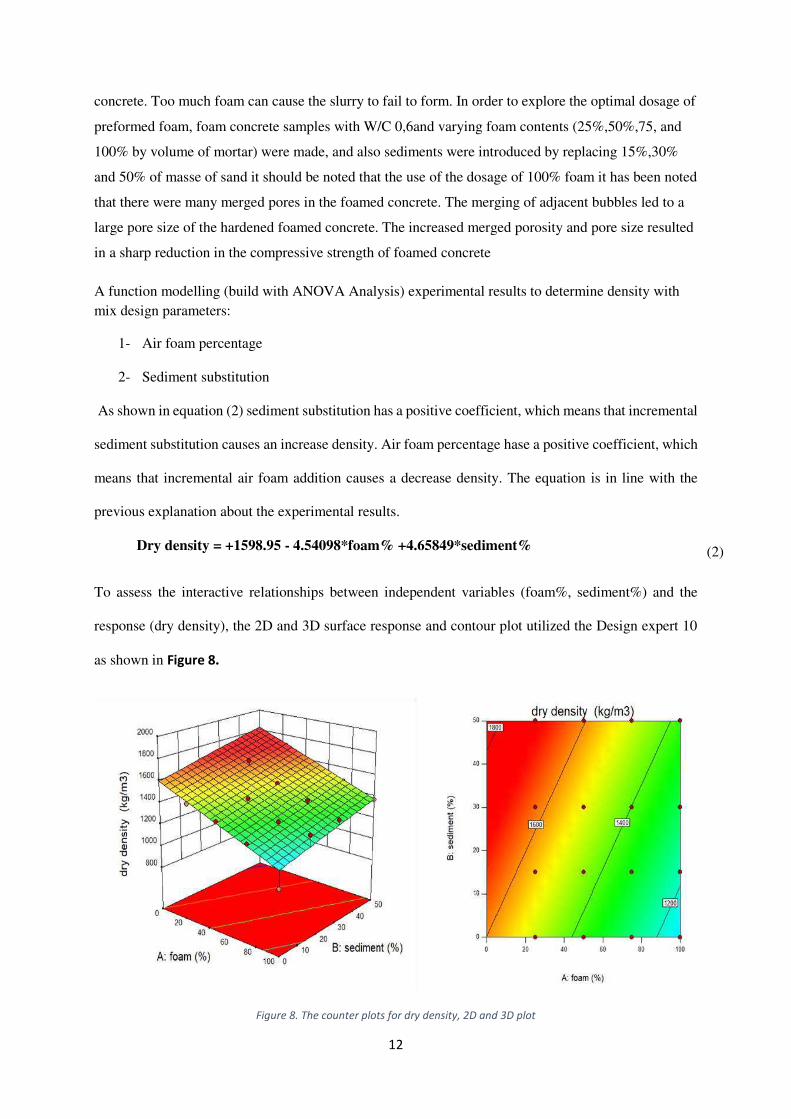
As shown in equation (2) sediment substitution has a positive coefficient, which means that incremental
sediment substitution causes an increase density. Air foam percentage hase a positive coefficient, which
means that incremental air foam addition causes a decrease density. The equation is in line with the
previous explanation about the experimental results.
Dry density = +1598.95 - 4.54098*foam% +4.65849*sediment% (2)
To assess the interactive relationships between independent variables (foam%, sediment%) and the
response (dry density), the 2D and 3D surface response and contour plot utilized the Design expert 10
as shown in Figure 8.
Figure 8. The counter plots for dry density, 2D and 3D plot
13
4.3 Compressive strength
The purpose of this study is to optimize mix design (sediment substitution and air foam
percentage) regarding density and compressive strength.
The following values are expected; densities and of 1000 and 1600 kg/m3 and compressive
strength between 3 and 7 MPa.
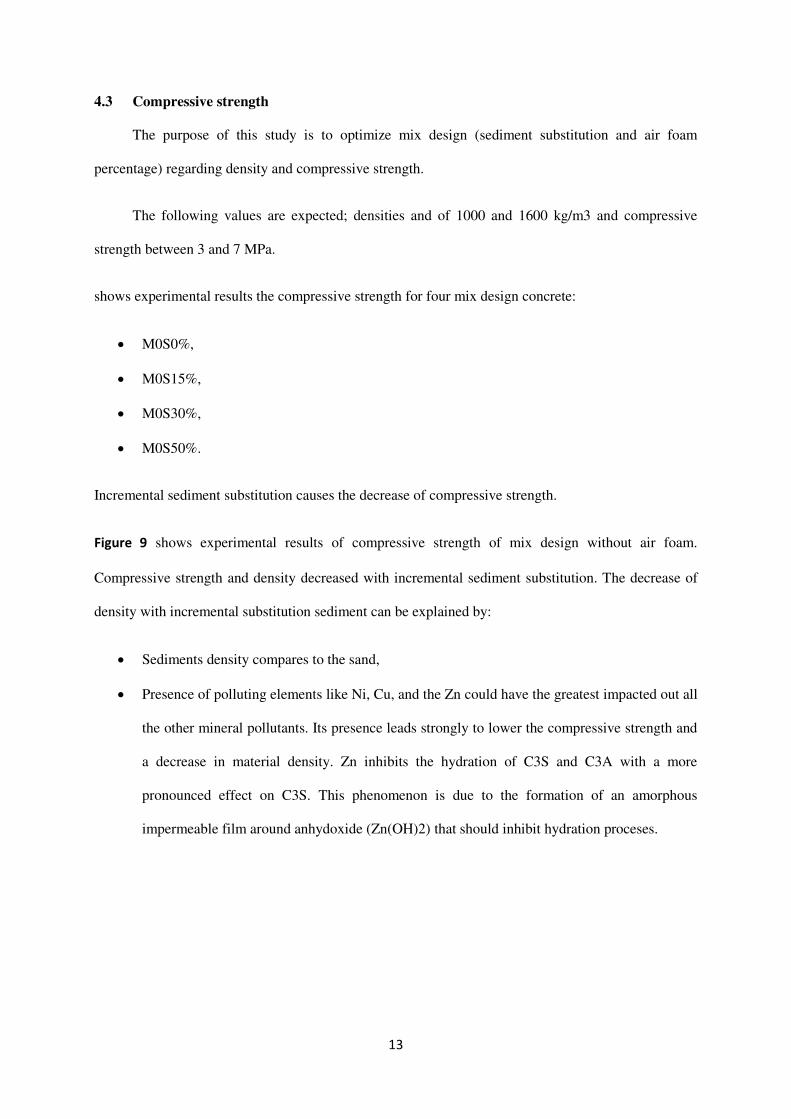
shows experimental results the compressive strength for four mix design concrete:
M0S0%,
M0S15%,
M0S30%,
M0S50%.
Incremental sediment substitution causes the decrease of compressive strength.
Figure 9 shows experimental results of compressive strength of mix design without air foam.
Compressive strength and density decreased with incremental sediment substitution. The decrease of
density with incremental substitution sediment can be explained by:
Sediments density compares to the sand,
Presence of polluting elements like Ni, Cu, and the Zn could have the greatest impacted out all
the other mineral pollutants. Its presence leads strongly to lower the compressive strength and
a decrease in material density. Zn inhibits the hydration of C3S and C3A with a more
pronounced effect on C3S. This phenomenon is due to the formation of an amorphous
impermeable film around anhydoxide (Zn(OH)2) that should inhibit hydration proceses.
14
Figure 9. compressive strength of the ordinary concrete with sediment
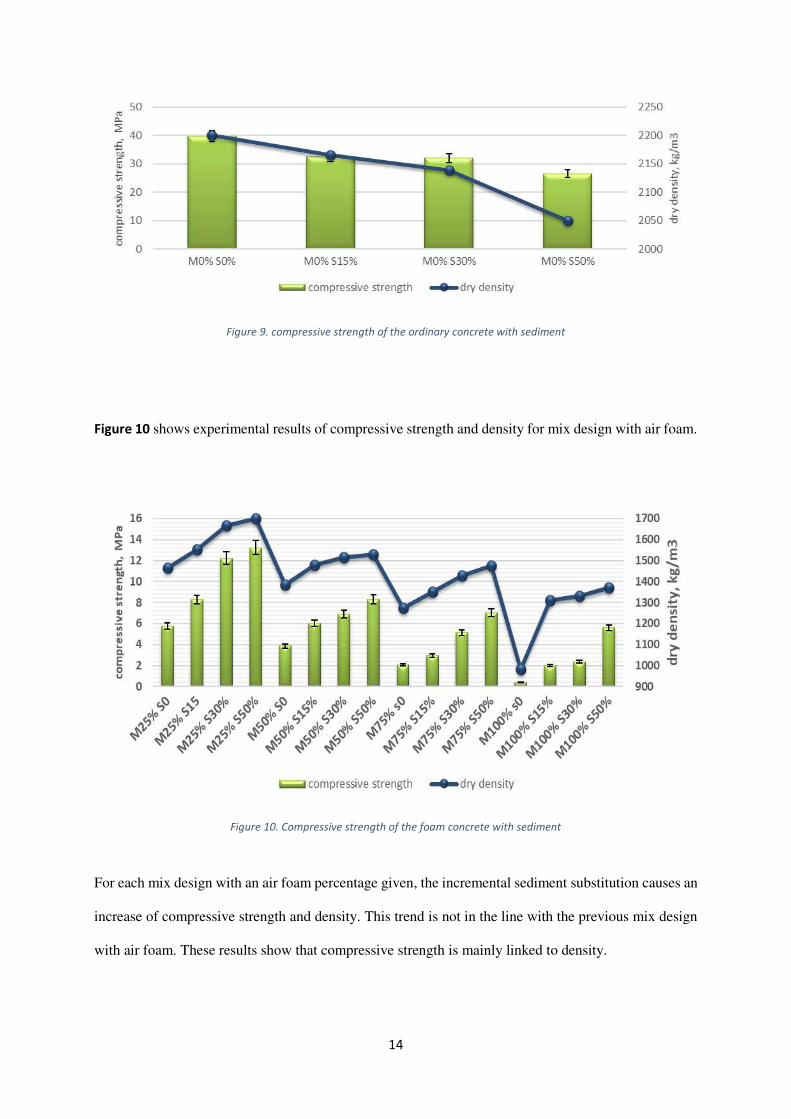
Figure 10 shows experimental results of compressive strength and density for mix design with air foam.
Figure 10. Compressive strength of the foam concrete with sediment
For each mix design with an air foam percentage given, the incremental sediment substitution causes an
increase of compressive strength and density. This trend is not in the line with the previous mix design
with air foam. These results show that compressive strength is mainly linked to density.
15
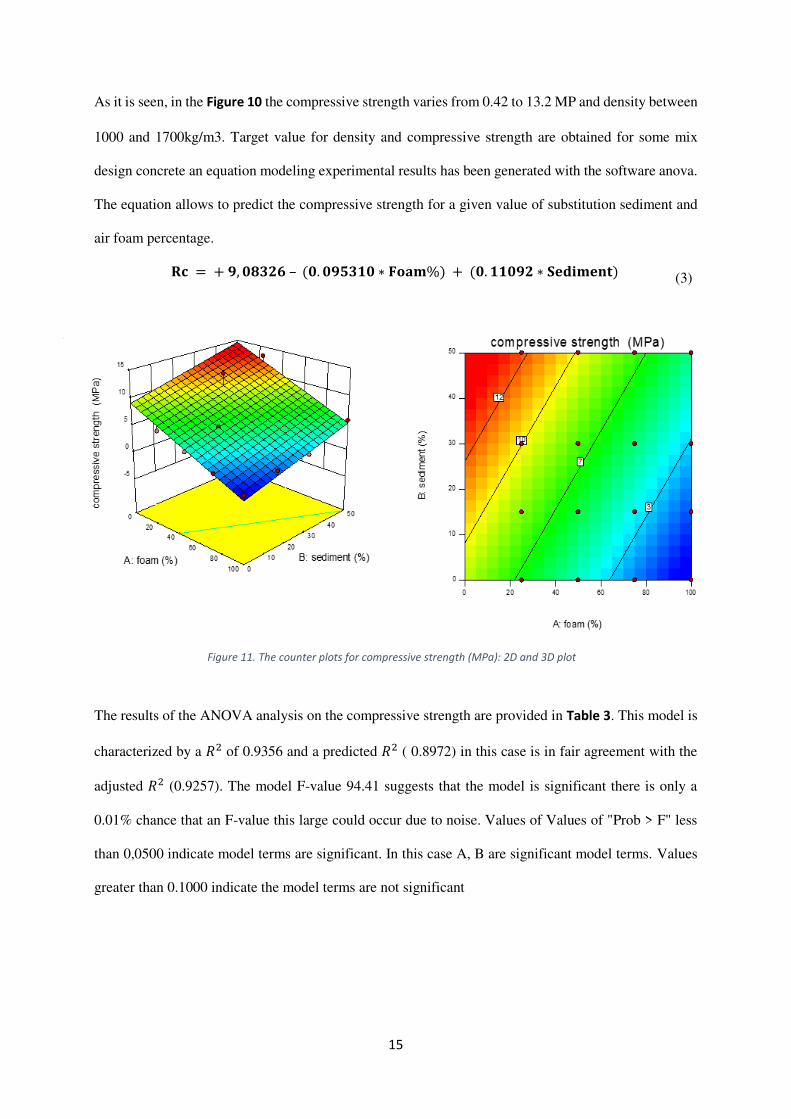
As it is seen, in the Figure 10 the compressive strength varies from 0.42 to 13.2 MP and density between
1000 and 1700kg/m3. Target value for density and compressive strength are obtained for some mix
design concrete an equation modeling experimental results has been generated with the software anova.
The equation allows to predict the compressive strength for a given value of substitution sediment and
air foam percentage.
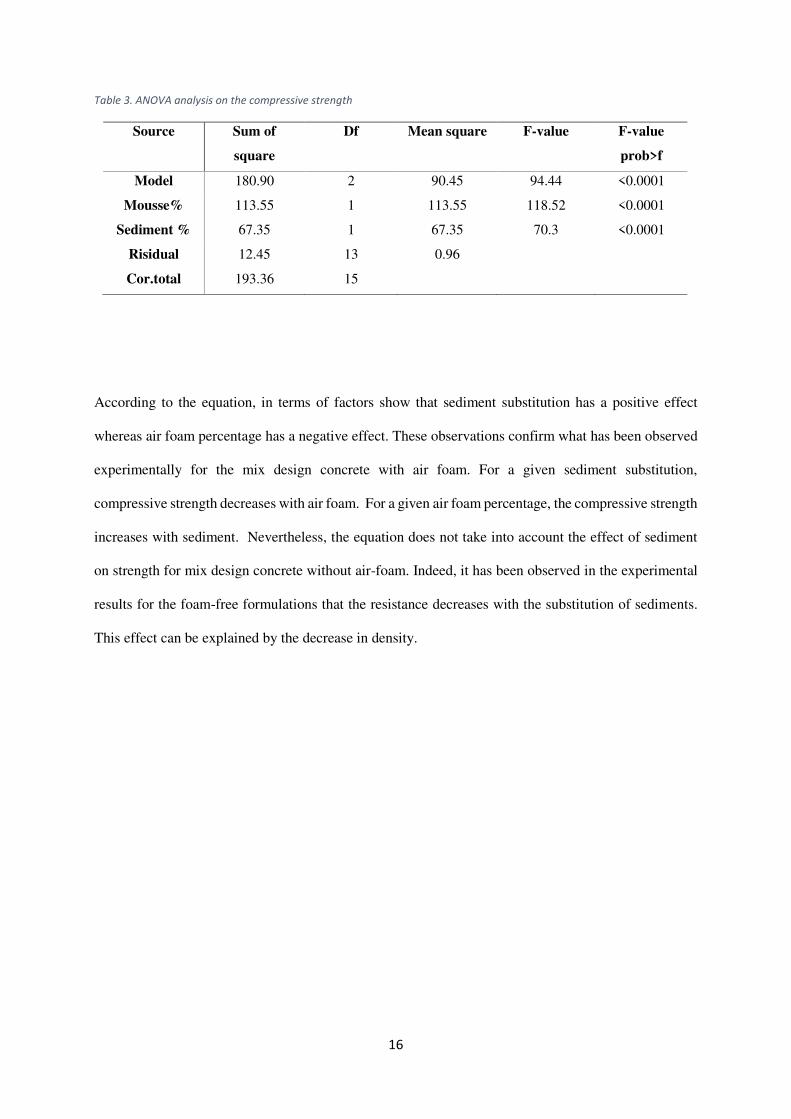
The results of the ANOVA analysis on the compressive strength are provided in Table 3. This model is
characterized by a 𝑅2 of 0.9356 and a predicted 𝑅2 ( 0.8972) in this case is in fair agreement with the
adjusted 𝑅2 (0.9257). The model F-value 94.41 suggests that the model is significant there is only a
0.01% chance that an F-value this large could occur due to noise. Values of Values of "Prob > F" less
than 0,0500 indicate model terms are significant. In this case A, B are significant model terms. Values
greater than 0.1000 indicate the model terms are not significant
𝐑𝐜 = + 𝟗, 𝟎𝟖𝟑𝟐𝟔 – (𝟎. 𝟎𝟗𝟓𝟑𝟏𝟎 ∗ 𝐅𝐨𝐚𝐦%) + (𝟎. 𝟏𝟏𝟎𝟗𝟐 ∗ 𝐒𝐞𝐝𝐢𝐦𝐞𝐧𝐭) (3)
Figure 11. The counter plots for compressive strength (MPa): 2D and 3D plot
16
Table 3. ANOVA analysis on the compressive strength
According to the equation, in terms of factors show that sediment substitution has a positive effect
whereas air foam percentage has a negative effect. These observations confirm what has been observed
experimentally for the mix design concrete with air foam. For a given sediment substitution,
compressive strength decreases with air foam. For a given air foam percentage, the compressive strength
increases with sediment. Nevertheless, the equation does not take into account the effect of sediment
on strength for mix design concrete without air-foam. Indeed, it has been observed in the experimental
results for the foam-free formulations that the resistance decreases with the substitution of sediments.
This effect can be explained by the decrease in density.
Source Sum of
square
Df Mean square F-value F-value
prob>f
Model 180.90 2 90.45 94.44 <0.0001
Mousse% 113.55 1 113.55 118.52 <0.0001
Sediment % 67.35 1 67.35 70.3 <0.0001
Risidual 12.45 13 0.96
Cor.total 193.36 15
17
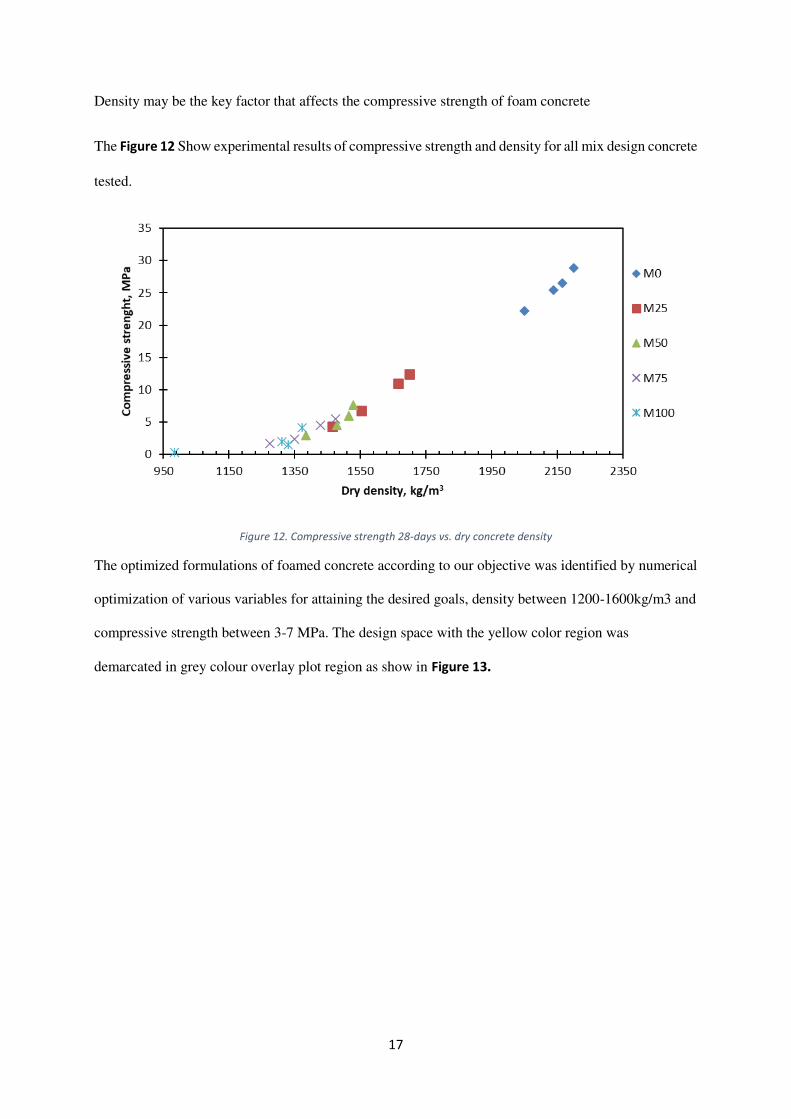
Density may be the key factor that affects the compressive strength of foam concrete
The Figure 12 Show experimental results of compressive strength and density for all mix design concrete
tested.
Figure 12. Compressive strength 28-days vs. dry concrete density
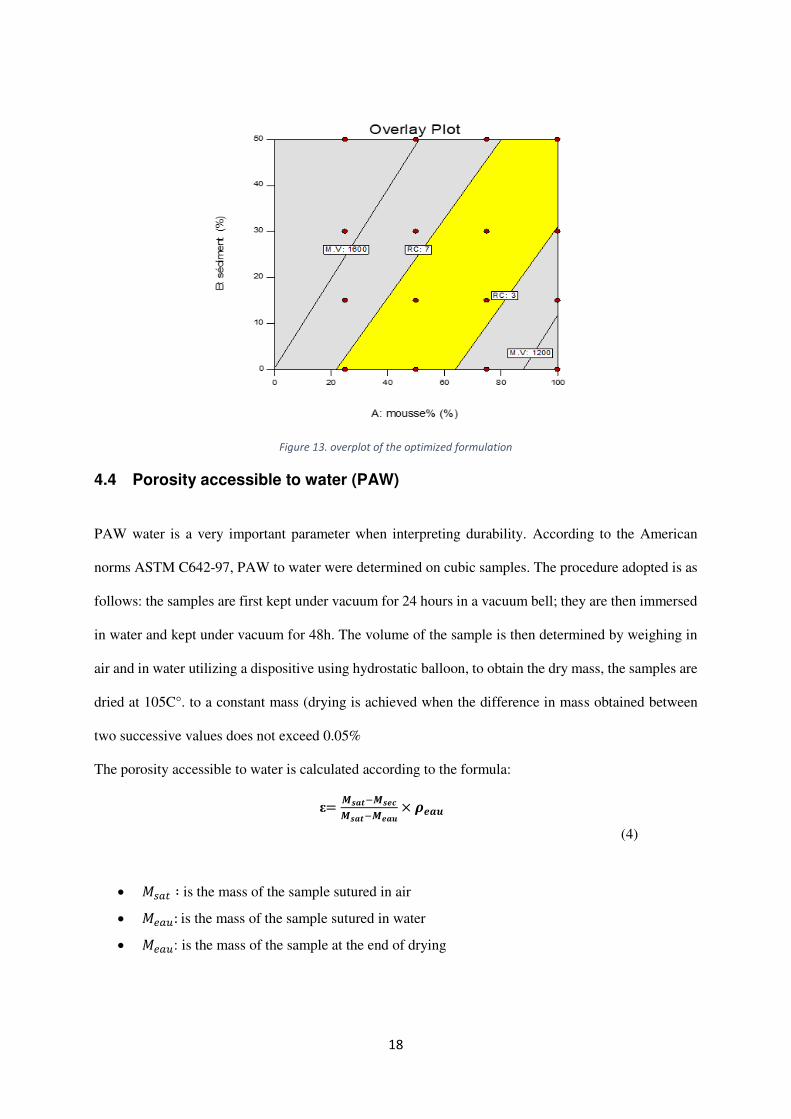
The optimized formulations of foamed concrete according to our objective was identified by numerical
optimization of various variables for attaining the desired goals, density between 1200-1600kg/m3 and
compressive strength between 3-7 MPa. The design space with the yellow color region was
demarcated in grey colour overlay plot region as show in Figure 13.
18
4.4 Porosity accessible to water (PAW)
PAW water is a very important parameter when interpreting durability. According to the American
norms ASTM C642-97, PAW to water were determined on cubic samples. The procedure adopted is as
follows: the samples are first kept under vacuum for 24 hours in a vacuum bell; they are then immersed
in water and kept under vacuum for 48h. The volume of the sample is then determined by weighing in
air and in water utilizing a dispositive using hydrostatic balloon, to obtain the dry mass, the samples are
dried at 105C°. to a constant mass (drying is achieved when the difference in mass obtained between
two successive values does not exceed 0.05%
The porosity accessible to water is calculated according to the formula:
ε= 𝑴𝒔𝒂𝒕−𝑴𝒔𝒆𝒄𝑴𝒔𝒂𝒕−𝑴𝒆𝒂𝒖 × 𝝆𝒆𝒂𝒖
(4)
𝑀𝑠𝑎𝑡 ∶ is the mass of the sample sutured in air
𝑀𝑒𝑎𝑢: is the mass of the sample sutured in water
𝑀𝑒𝑎𝑢: is the mass of the sample at the end of drying
Figure 13. overplot of the optimized formulation
19
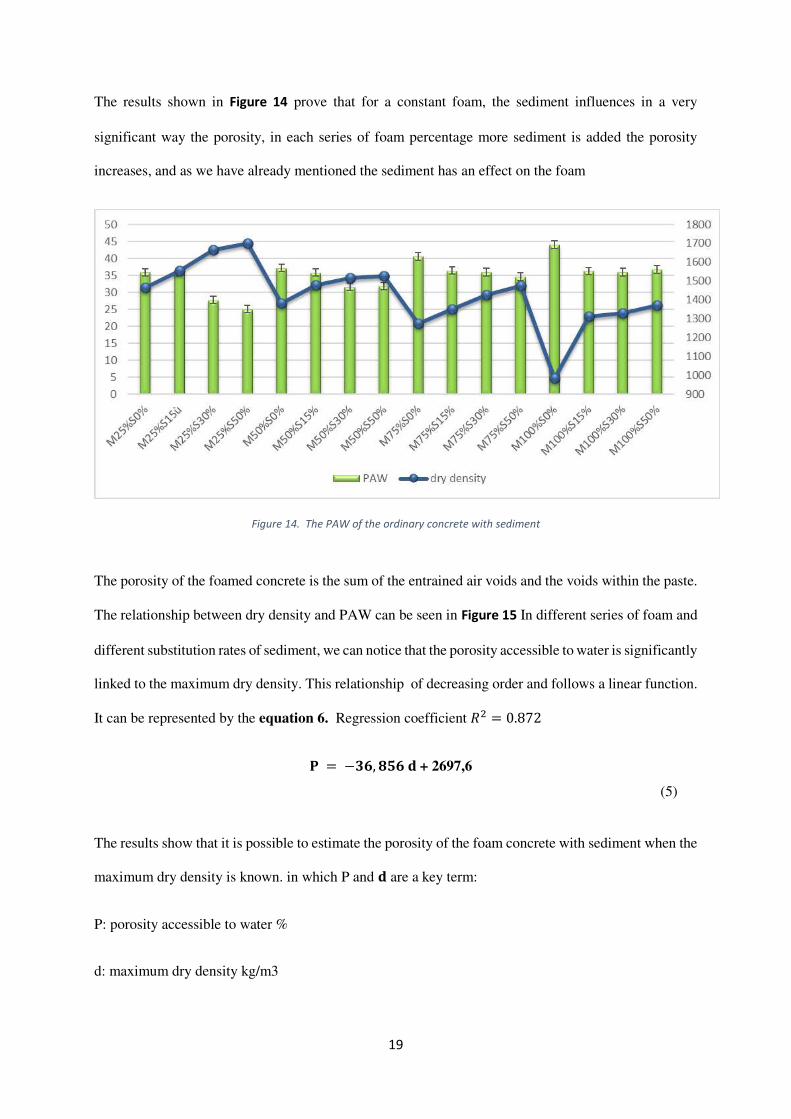
The results shown in Figure 14 prove that for a constant foam, the sediment influences in a very
significant way the porosity, in each series of foam percentage more sediment is added the porosity
increases, and as we have already mentioned the sediment has an effect on the foam
Figure 14. The PAW of the ordinary concrete with sediment
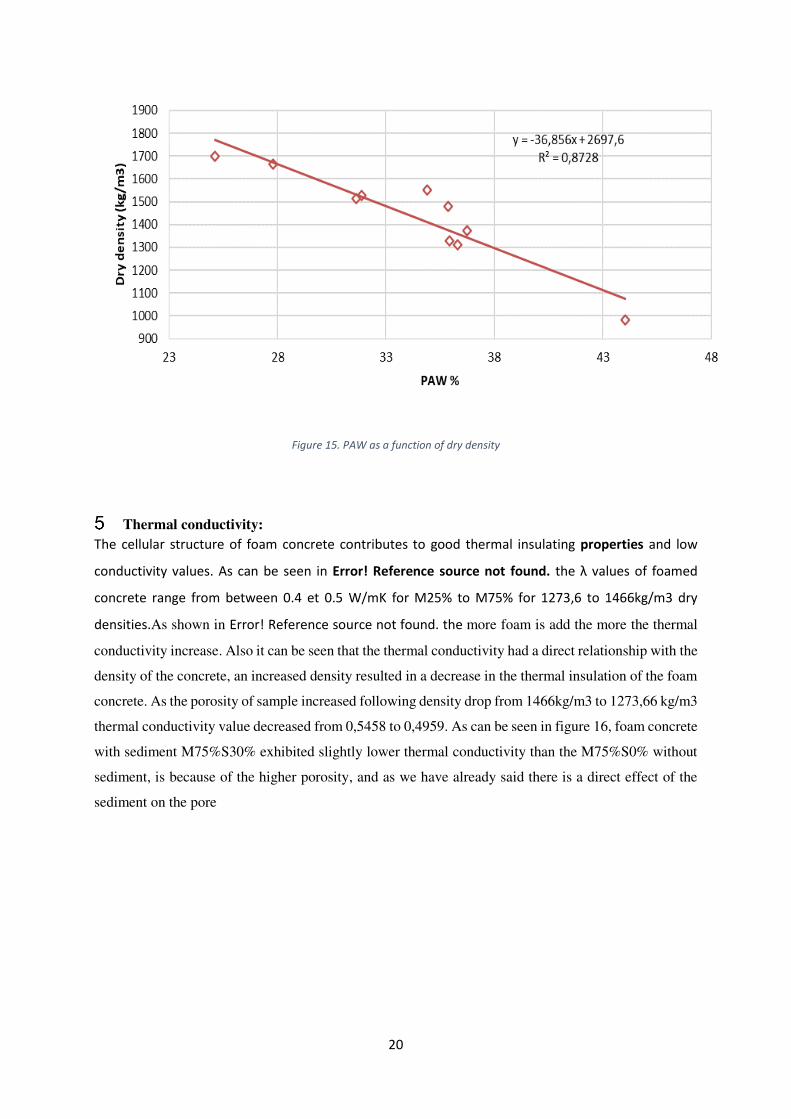
The porosity of the foamed concrete is the sum of the entrained air voids and the voids within the paste.
The relationship between dry density and PAW can be seen in Figure 15 In different series of foam and
different substitution rates of sediment, we can notice that the porosity accessible to water is significantly
linked to the maximum dry density. This relationship of decreasing order and follows a linear function.
It can be represented by the equation 6. Regression coefficient 𝑅2 = 0.872
𝐏 = −𝟑𝟔, 𝟖𝟓𝟔 𝐝 + 2697,6
(5)
The results show that it is possible to estimate the porosity of the foam concrete with sediment when the
maximum dry density is known. in which P and 𝐝 are a key term:
P: porosity accessible to water %
d: maximum dry density kg/m3
20
Figure 15. PAW as a function of dry density
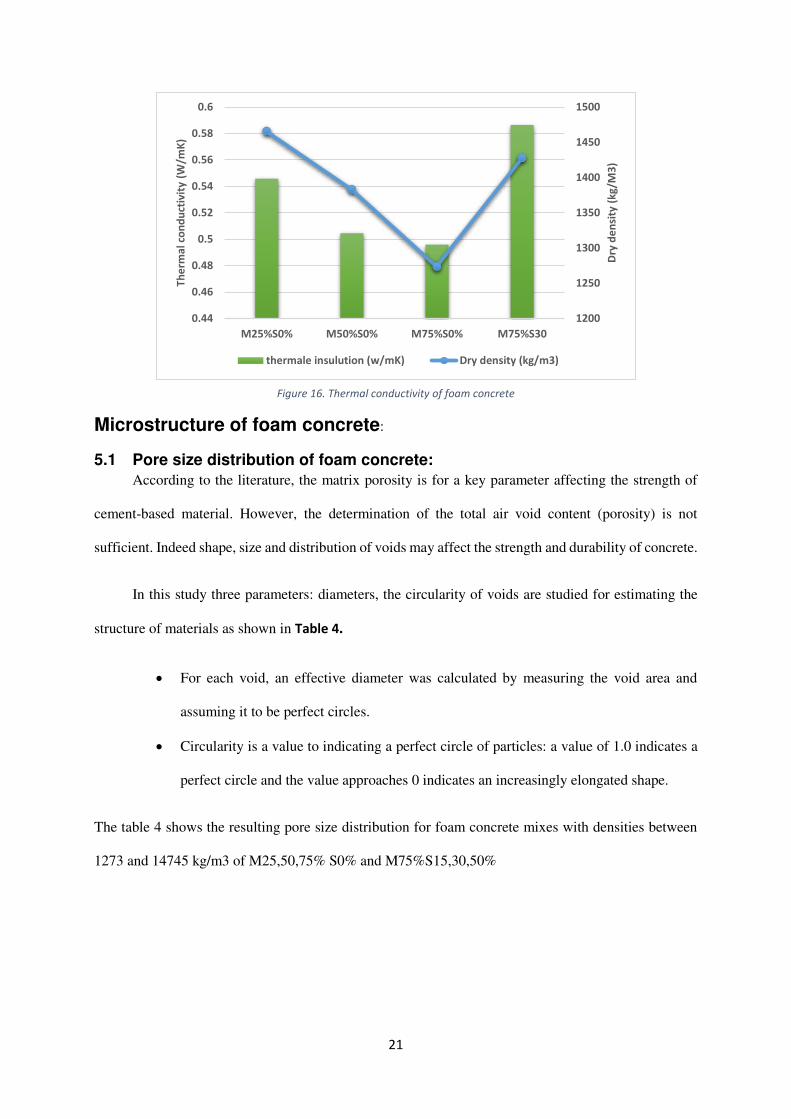
Thermal conductivity: The cellular structure of foam concrete contributes to good thermal insulating properties and low
conductivity values. As can be seen in Error! Reference source not found. the λ values of foamed
concrete range from between 0.4 et 0.5 W/mK for M25% to M75% for 1273,6 to 1466kg/m3 dry
densities.As shown in Error! Reference source not found. the more foam is add the more the thermal
conductivity increase. Also it can be seen that the thermal conductivity had a direct relationship with the
density of the concrete, an increased density resulted in a decrease in the thermal insulation of the foam
concrete. As the porosity of sample increased following density drop from 1466kg/m3 to 1273,66 kg/m3
thermal conductivity value decreased from 0,5458 to 0,4959. As can be seen in figure 16, foam concrete
with sediment M75%S30% exhibited slightly lower thermal conductivity than the M75%S0% without
sediment, is because of the higher porosity, and as we have already said there is a direct effect of the
sediment on the pore
21
Microstructure of foam concrete:
5.1 Pore size distribution of foam concrete:
According to the literature, the matrix porosity is for a key parameter affecting the strength of
cement-based material. However, the determination of the total air void content (porosity) is not
sufficient. Indeed shape, size and distribution of voids may affect the strength and durability of concrete.
In this study three parameters: diameters, the circularity of voids are studied for estimating the
structure of materials as shown in Table 4.
For each void, an effective diameter was calculated by measuring the void area and
assuming it to be perfect circles.
Circularity is a value to indicating a perfect circle of particles: a value of 1.0 indicates a
perfect circle and the value approaches 0 indicates an increasingly elongated shape.
The table 4 shows the resulting pore size distribution for foam concrete mixes with densities between
1273 and 14745 kg/m3 of M25,50,75% S0% and M75%S15,30,50%
1200
1250
1300
1350
1400
1450
1500
0.44
0.46
0.48
0.5
0.52
0.54
0.56
0.58
0.6
M25%S0% M50%S0% M75%S0% M75%S30
Dry
de
nsi
ty (
kg
/M3
)
Th
erm
al
con
du
ctiv
ity
(W
/mK
)
thermale insulution (w/mK) Dry density (kg/m3)
Figure 16. Thermal conductivity of foam concrete
22
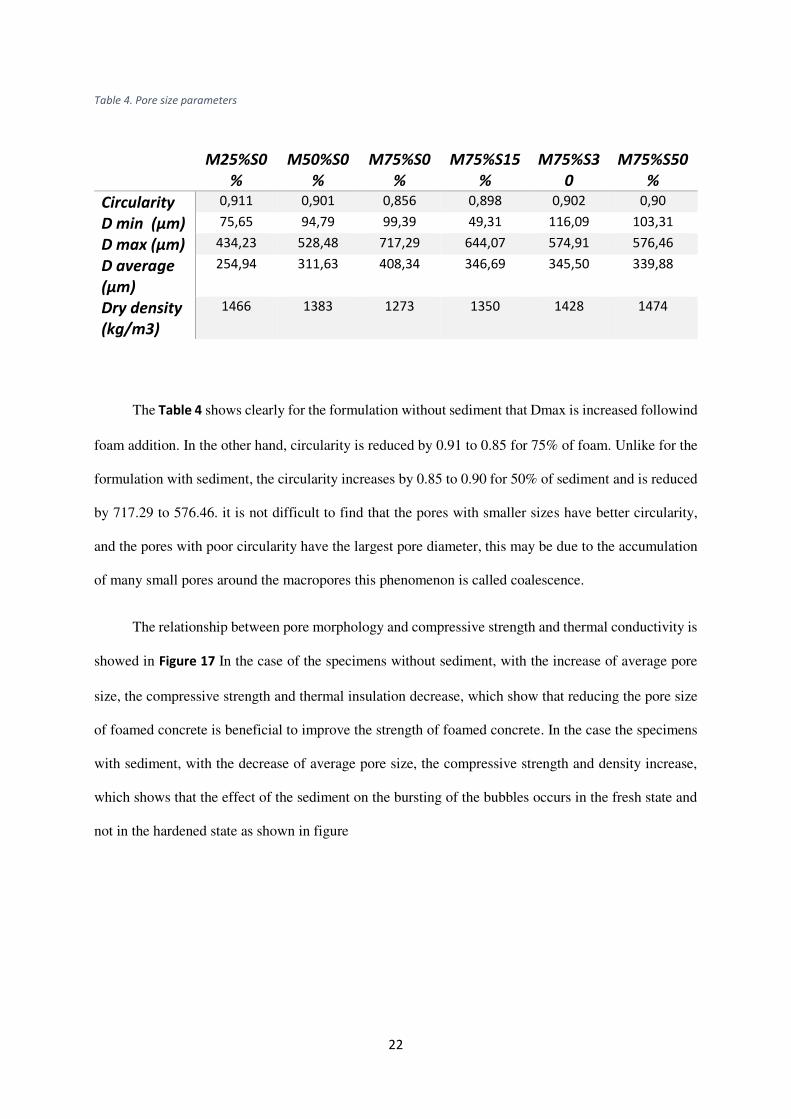
Table 4. Pore size parameters
M25%S0
%
M50%S0
%
M75%S0
%
M75%S15
%
M75%S3
0
M75%S50
%
Circularity 0,911 0,901 0,856 0,898 0,902 0,90
D min (µm) 75,65 94,79 99,39 49,31 116,09 103,31
D max (µm) 434,23 528,48 717,29 644,07 574,91 576,46
D average
(µm)
254,94 311,63 408,34 346,69 345,50 339,88
Dry density
(kg/m3)
1466 1383 1273 1350 1428 1474
The Table 4 shows clearly for the formulation without sediment that Dmax is increased followind
foam addition. In the other hand, circularity is reduced by 0.91 to 0.85 for 75% of foam. Unlike for the
formulation with sediment, the circularity increases by 0.85 to 0.90 for 50% of sediment and is reduced
by 717.29 to 576.46. it is not difficult to find that the pores with smaller sizes have better circularity,
and the pores with poor circularity have the largest pore diameter, this may be due to the accumulation
of many small pores around the macropores this phenomenon is called coalescence.
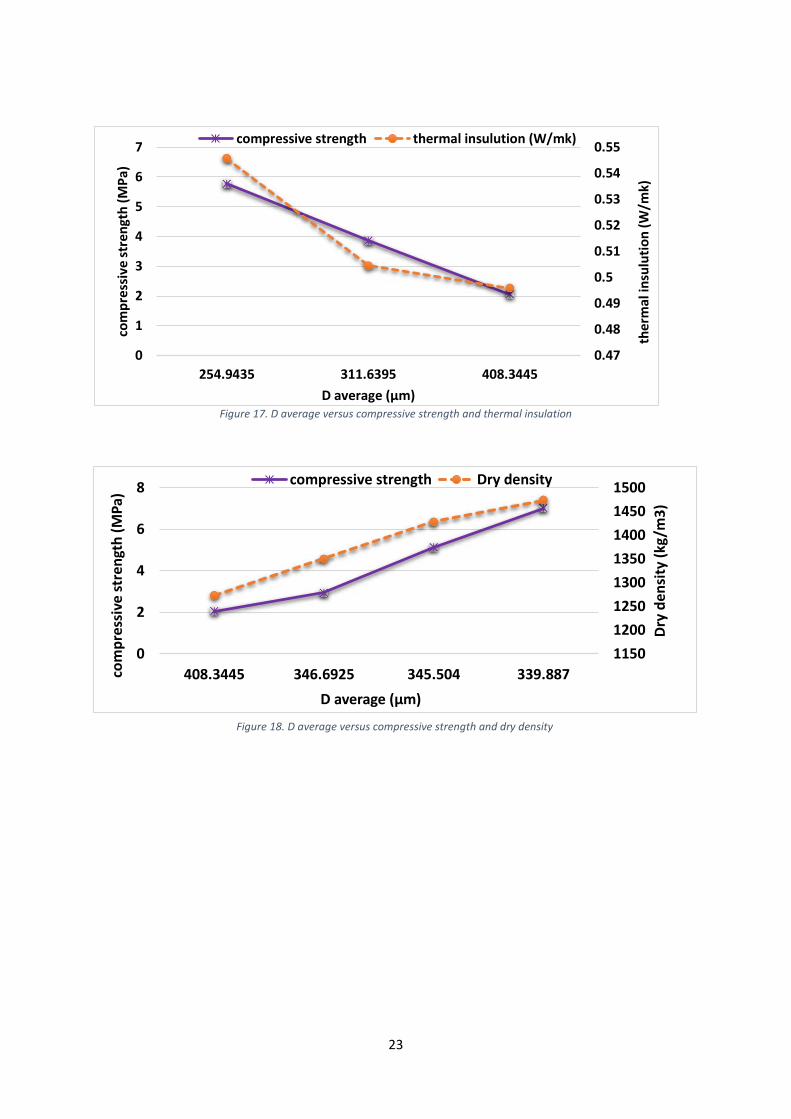
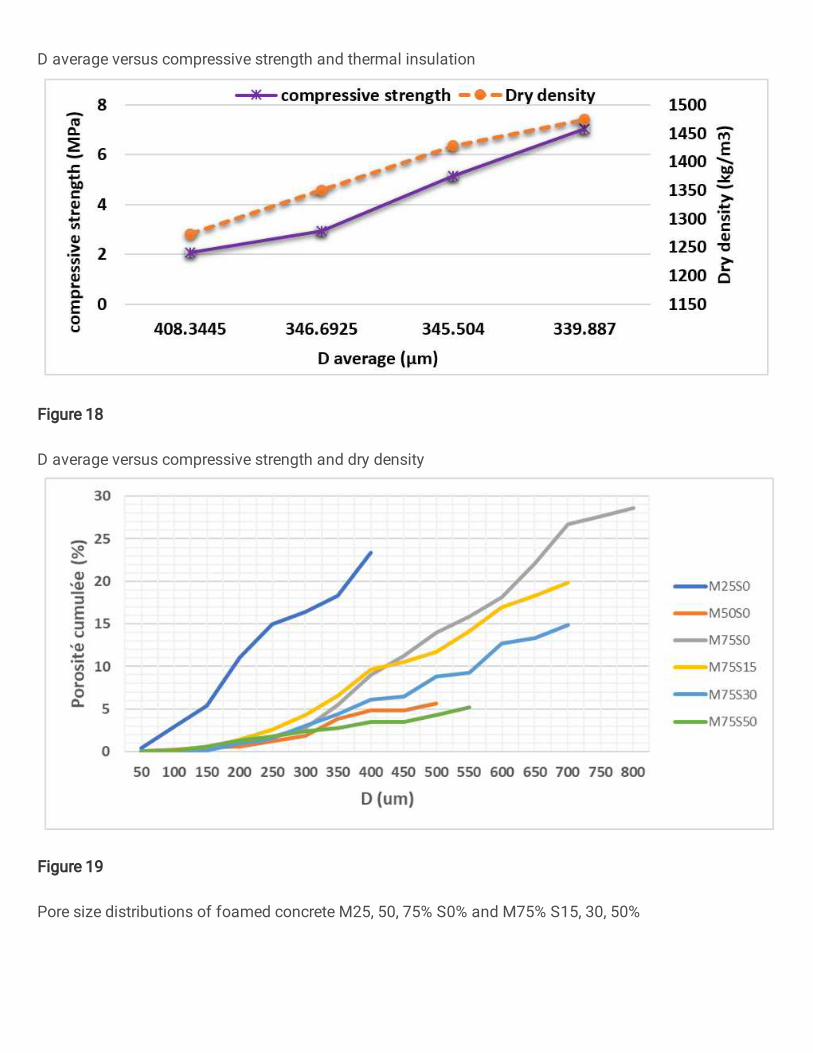
The relationship between pore morphology and compressive strength and thermal conductivity is
showed in Figure 17 In the case of the specimens without sediment, with the increase of average pore
size, the compressive strength and thermal insulation decrease, which show that reducing the pore size
of foamed concrete is beneficial to improve the strength of foamed concrete. In the case the specimens
with sediment, with the decrease of average pore size, the compressive strength and density increase,
which shows that the effect of the sediment on the bursting of the bubbles occurs in the fresh state and
not in the hardened state as shown in figure
23
Figure 17. D average versus compressive strength and thermal insulation
0.47
0.48
0.49
0.5
0.51
0.52
0.53
0.54
0.55
0
1
2
3
4
5
6
7
254.9435 311.6395 408.3445
the
rma
l in
sulu
tio
n (
W/m
k)
com
pre
ssiv
e s
tre
ng
th (
MP
a)
D average (µm)
compressive strength thermal insulution (W/mk)
1150
1200
1250
1300
1350
1400
1450
1500
0
2
4
6
8
408.3445 346.6925 345.504 339.887D
ry d
en
sity
(k
g/m
3)
com
pre
ssiv
e s
tre
ng
th (
MP
a)
D average (µm)
compressive strength Dry density
Figure 18. D average versus compressive strength and dry density
24
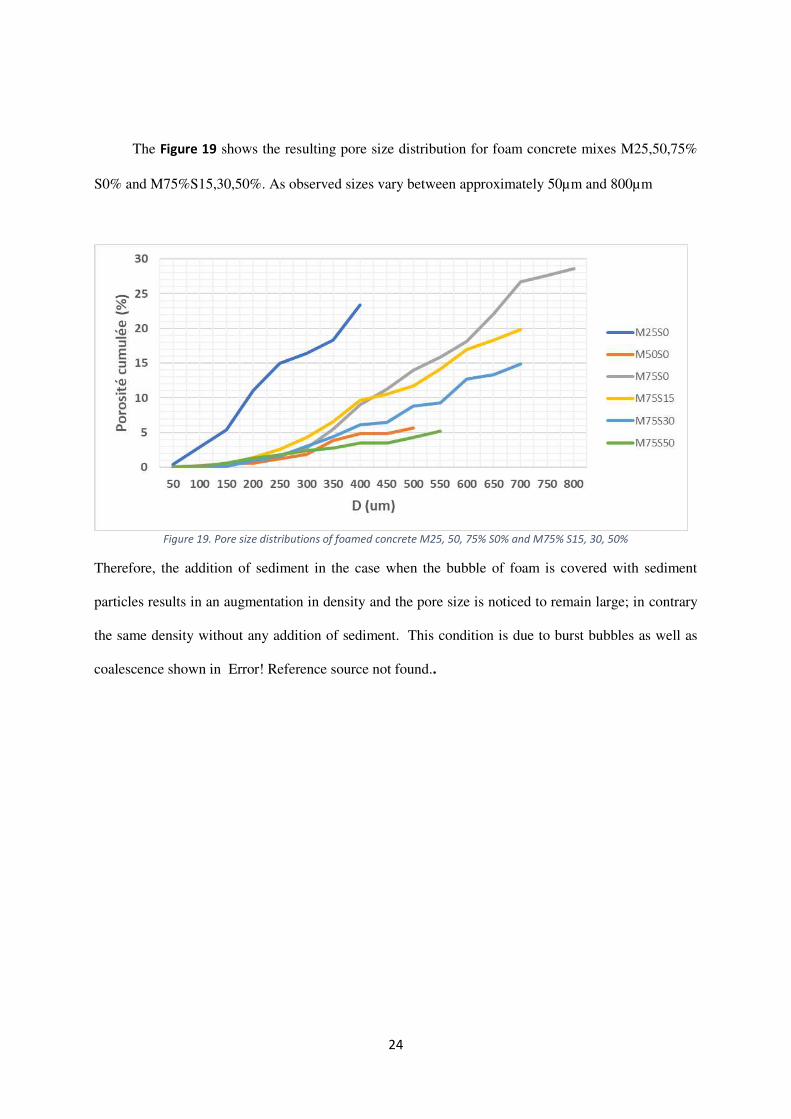
The Figure 19 shows the resulting pore size distribution for foam concrete mixes M25,50,75%
S0% and M75%S15,30,50%. As observed sizes vary between approximately 50µm and 800µm
Figure 19. Pore size distributions of foamed concrete M25, 50, 75% S0% and M75% S15, 30, 50%
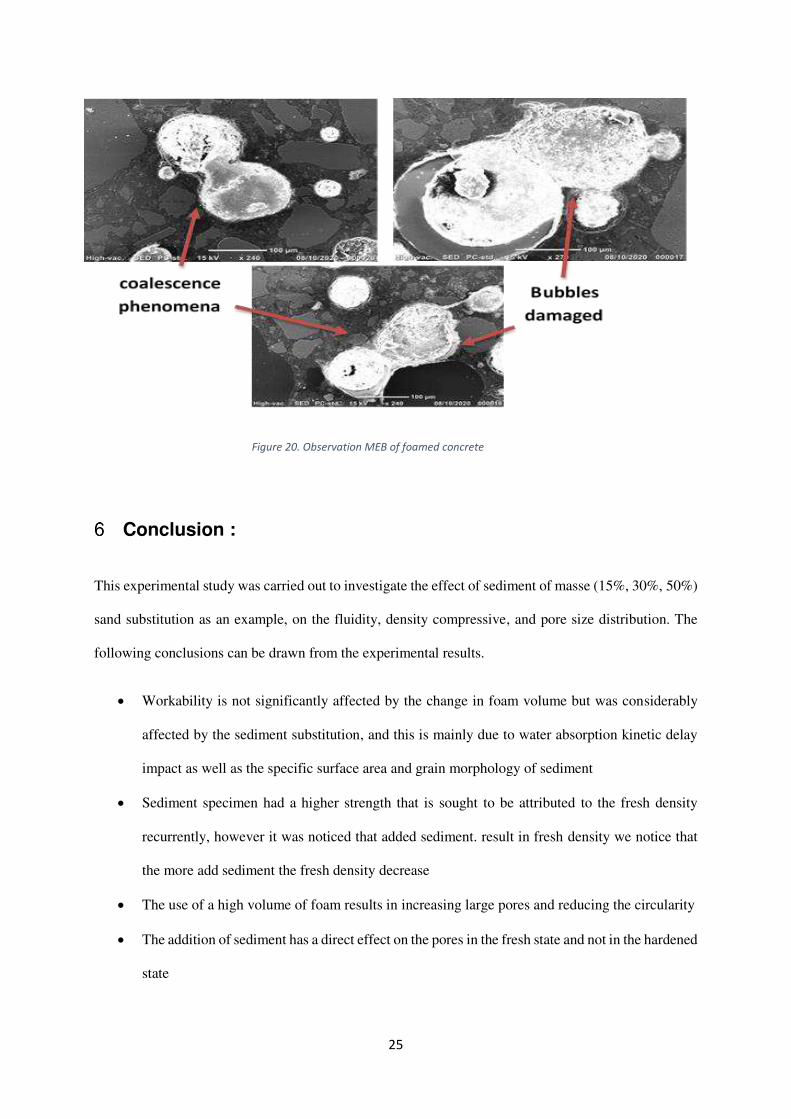
Therefore, the addition of sediment in the case when the bubble of foam is covered with sediment
particles results in an augmentation in density and the pore size is noticed to remain large; in contrary
the same density without any addition of sediment. This condition is due to burst bubbles as well as
coalescence shown in Error! Reference source not found..
25
Conclusion :
This experimental study was carried out to investigate the effect of sediment of masse (15%, 30%, 50%)
sand substitution as an example, on the fluidity, density compressive, and pore size distribution. The
following conclusions can be drawn from the experimental results.
Workability is not significantly affected by the change in foam volume but was considerably
affected by the sediment substitution, and this is mainly due to water absorption kinetic delay
impact as well as the specific surface area and grain morphology of sediment
Sediment specimen had a higher strength that is sought to be attributed to the fresh density
recurrently, however it was noticed that added sediment. result in fresh density we notice that
the more add sediment the fresh density decrease
The use of a high volume of foam results in increasing large pores and reducing the circularity
The addition of sediment has a direct effect on the pores in the fresh state and not in the hardened
state
Figure 20. Observation MEB of foamed concrete
26
Not only does porosity affect the mechanical properties of foam concrete, but other pore parameters
such as pores diameters and circularity, the space between bubbles, affect the mechanical properties, the
next research will refine this present study on theses effects.
27
Reference: [1] V. Dubois, N. E. Abriak, R. Zentar, and G. Ballivy, “The use of marine sediments as a pavement
base material,” Waste Manag., vol. 29, no. 2, pp. 774–782, 2009.
[2] P. Scordia, “Caractérisation et valorisation de sédiments fluviaux pollués et traités dans les matériaux routiers To cite this version : HAL Id : tel-00339371 Délivrée par,” 2008.
[3] E. Rozière, M. Samara, A. Loukili, and D. Damidot, “Valorisation of sediments in self-consolidating concrete: Mix-design and microstructure,” Constr. Build. Mater., vol. 81, pp. 1–10, 2015.
[4] L. Wang et al., “Transforming wood waste into water-resistant magnesia-phosphate cement
particleboard modified by alumina and red mud,” J. Clean. Prod., vol. 168, pp. 452–462, 2017.
[5] M. Liu, X. Liu, W. Wang, J. Guo, L. Zhang, and H. Zhang, “Effect of SiO2 and Al2O3 on
characteristics of lightweight aggregate made from sewage sludge and river sediment,” Ceram. Int., vol. 44, no. 4, pp. 4313–4319, 2018.
[6] H. Fang, “Impact of land use changes on catchment soil erosion and sediment yield in the northeastern China: A panel data model application,” Int. J. Sediment Res., vol. 35, no. 5, pp.
540–549, 2020.
[7] K. Khalifehei, G. Azizyan, M. Shafai-Bajestan, and K. wing Chau, “Stability of A-Jack concrete
block armors protecting the riverbeds,” Ain Shams Eng. J., no. xxxx, 2020.
[8] X. Yang et al., “Sustainable conversion of contaminated dredged river sediment into eco-
friendly foamed concrete,” J. Clean. Prod., vol. 252, p. 119799, 2020.
[9] Z. Zhao, M. Benzerzour, N. E. Abriak, D. Damidot, L. Courard, and D. Wang, “Use of uncontaminated marine sediments in mortar and concrete by partial substitution of cement,” Cem. Concr. Compos., vol. 93, no. June, pp. 155–162, 2018.
[10] K. Ramamurthy, E. K. Kunhanandan Nambiar, and G. Indu Siva Ranjani, “A classification of studies on properties of foam concrete,” Cem. Concr. Compos., vol. 31, no. 6, pp. 388–396,
2009.
[11] Y. H. M. Amran, N. Farzadnia, and A. A. A. Ali, “Properties and applications of foamed concrete; A review,” Constr. Build. Mater., vol. 101, pp. 990–1005, 2015.
[12] K. Wu, Z. Shao, and S. Qin, “A solution for squeezing deformation control in tunnels using foamed concrete: A review,” Constr. Build. Mater., vol. 257, p. 119539, 2020.
[13] T. Li, F. Huang, J. Zhu, J. Tang, and J. Liu, “Effect of foaming gas and cement type on the
thermal conductivity of foamed concrete,” Constr. Build. Mater., vol. 231, p. 117197, 2020.
[14] A. Raj, D. Sathyan, and K. M. Mini, “Physical and functional characteristics of foam concrete: A review,” Constr. Build. Mater., vol. 221, pp. 787–799, 2019.
[15] A. K. Sallal, “Use foam concrete in construction works,” Int. J. Res. Adv. Eng. Technol., no. 130
mm, pp. 2455–0876, 2018.
[16] M. A. Othuman Mydin, N. M. Zamzani, and A. N. A. Ghani, “Experimental data on compressive and flexural strengths of coir fibre reinforced foamed concrete at elevated temperatures,” Data Br., vol. 25, p. 104320, 2019.
28
[17] A. Just and B. Middendorf, “Microstructure of high-strength foam concrete,” Mater. Charact.,
vol. 60, no. 7, pp. 741–748, 2009.
[18] X. Chen, S. Wu, and J. Zhou, “Influence of porosity on compressive and tensile strength of cement mortar,” Constr. Build. Mater., vol. 40, pp. 869–874, 2013.
[19] T. T. Nguyen, H. H. Bui, T. D. Ngo, and G. D. Nguyen, “Experimental and numerical investigation of influence of air-voids on the compressive behaviour of foamed concrete,” Mater. Des., vol. 130, no. February, pp. 103–119, 2017.
[20] D. K. Panesar, “Cellular concrete properties and the effect of synthetic and protein foaming agents,” Constr. Build. Mater., vol. 44, pp. 575–584, 2013.
[21] F. Batool and V. Bindiganavile, “Air-void size distribution of cement based foam and its effect
on thermal conductivity,” Constr. Build. Mater., vol. 149, pp. 17–28, 2017.
[22] E. Kuzielová, L. Pach, and M. Palou, “Effect of activated foaming agent on the foam concrete properties,” Constr. Build. Mater., vol. 125, pp. 998–1004, 2016.
[23] A. Hajimohammadi, T. Ngo, and P. Mendis, “Enhancing the strength of pre-made foams for
foam concrete applications,” Cem. Concr. Compos., vol. 87, pp. 164–171, 2018.
[24] G. Krishnan and K. B. Anand, “Industrial waste utilization for foam concrete,” IOP Conf. Ser.
Mater. Sci. Eng., vol. 310, no. 1, 2018.
[25] R. Jones, L. Zheng, A. Yerramala, and K. Srinivasa Rao, “Use of recycled and secondary aggregates in foamed concretes,” Mag. Concr. Res., vol. 64, no. 6, pp. 513–525, 2012.
[26] T. J. Chandni and K. B. Anand, “Utilization of recycled waste as filler in foam concrete,” J. Build. Eng., vol. 19, no. November 2017, pp. 154–160, 2018.
[27] A. A. Aliabdo, A. E. M. Abd-Elmoaty, and H. H. Hassan, “Utilization of crushed clay brick in cellular concrete production,” Alexandria Eng. J., vol. 53, no. 1, pp. 119–130, 2014.
[28] Q. S. Khan, M. N. Sheikh, T. J. McCarthy, M. Robati, and M. Allen, “Experimental investigation on foam concrete without and with recycled glass powder: A sustainable solution for future
construction,” Constr. Build. Mater., vol. 201, pp. 369–379, 2019.
[29] M. Madrid, A. Orbe, E. Rojí, and J. Cuadrado, “The effects of by-products incorporated in low-
strength concrete for concrete masonry units,” Constr. Build. Mater., vol. 153, pp. 117–128,
2017.
[30] NF EN 206/CN, “Béton – Partie 1 : Spécification, performances, production et conformité, AFNOR.,” vol. 4, 2014.
Figures
Figure 1
M25% S0 %(b) M50%S0% (c) M75%S0%
Figure 2
thermal conductivity Hot Disk
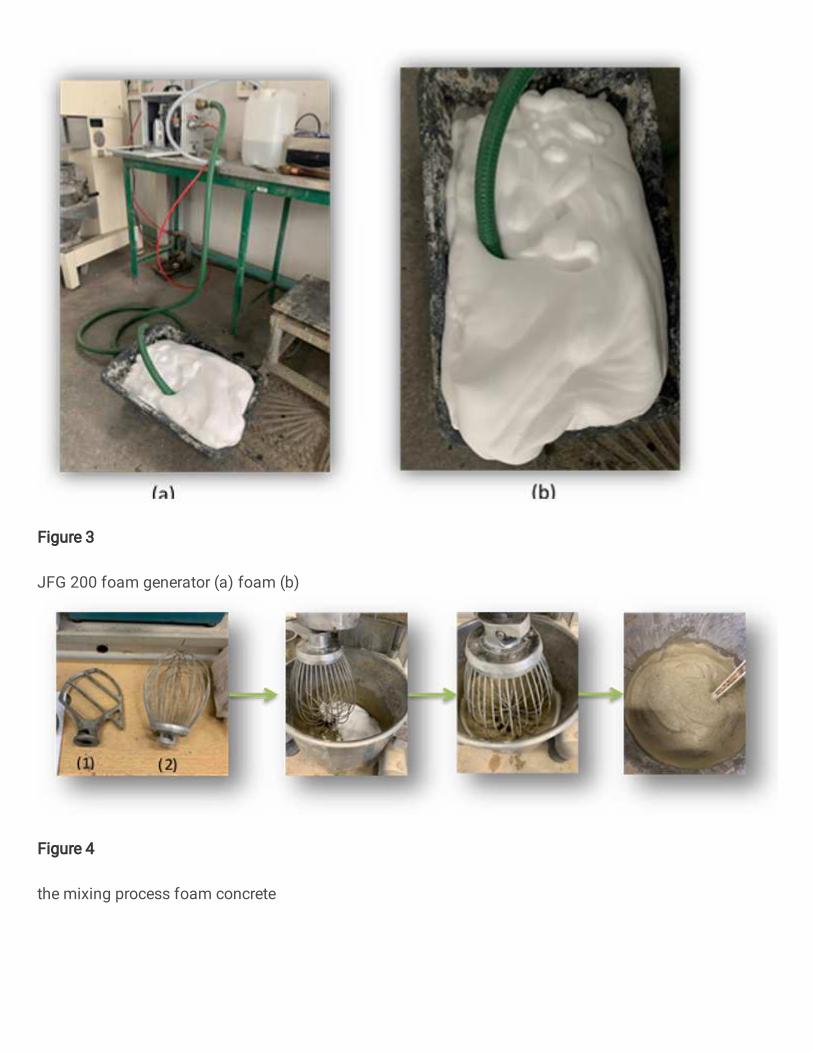
Figure 3
JFG 200 foam generator (a) foam (b)
Figure 4
the mixing process foam concrete
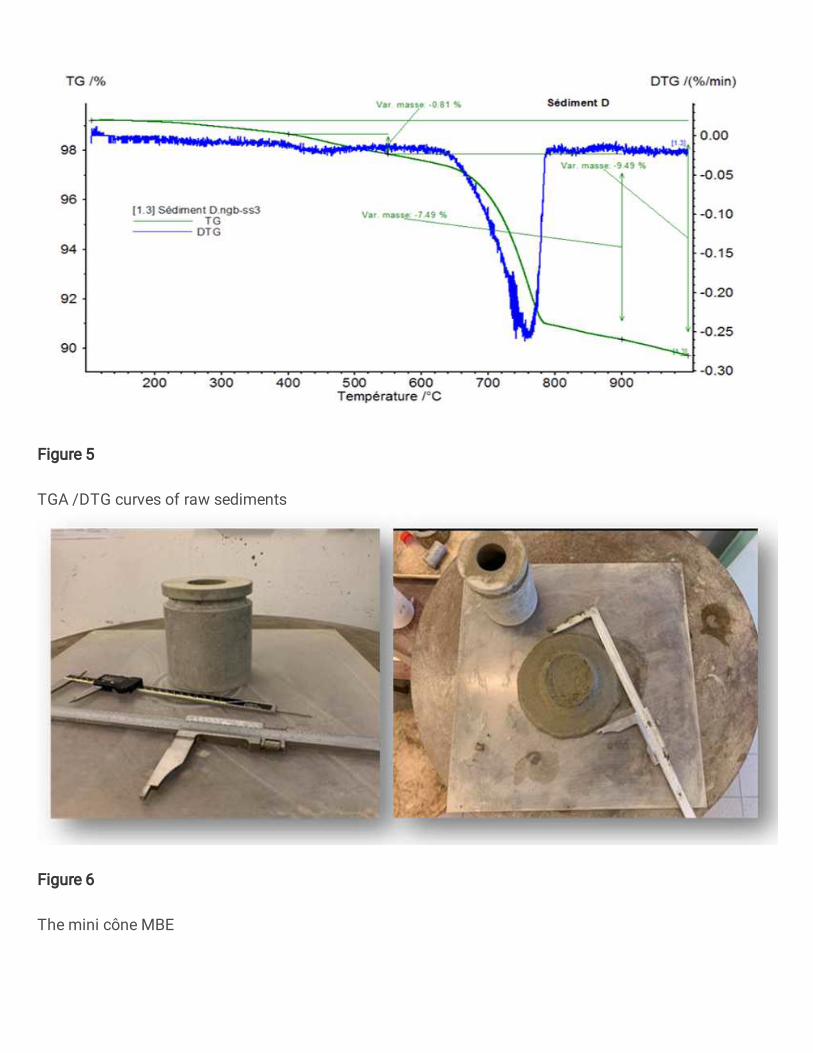
Figure 5
TGA /DTG curves of raw sediments
Figure 6
The mini cône MBE
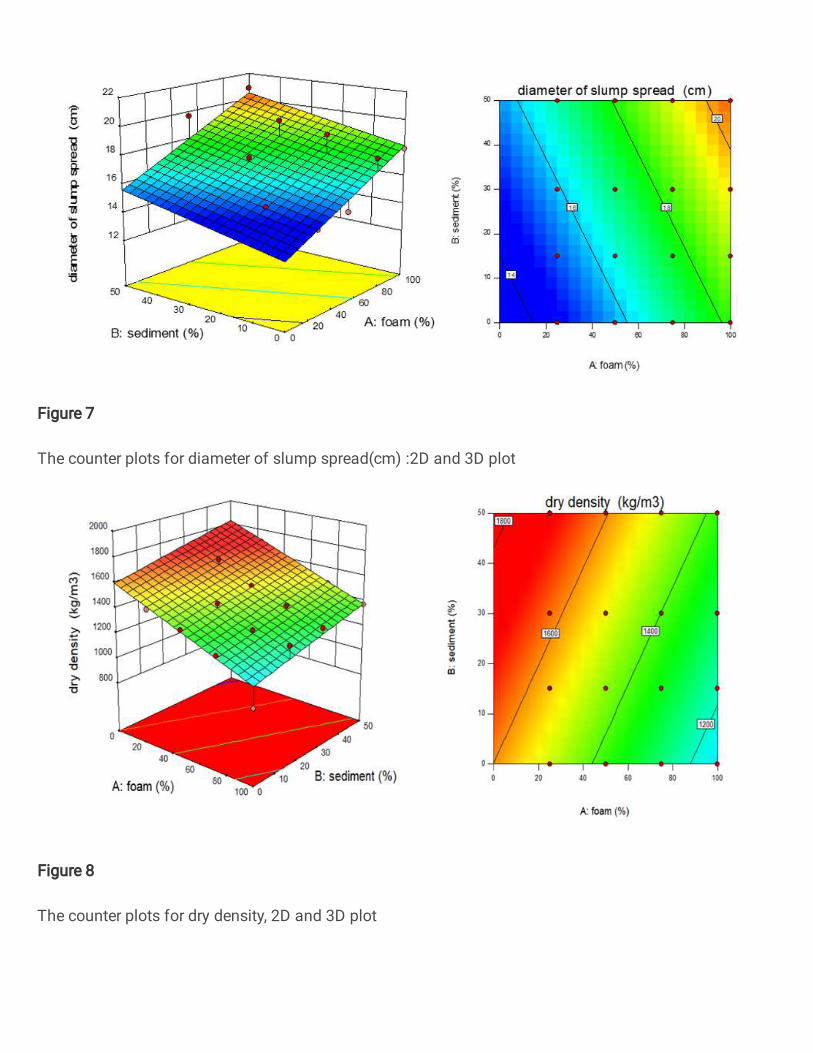
Figure 7
The counter plots for diameter of slump spread(cm) :2D and 3D plot
Figure 8
The counter plots for dry density, 2D and 3D plot
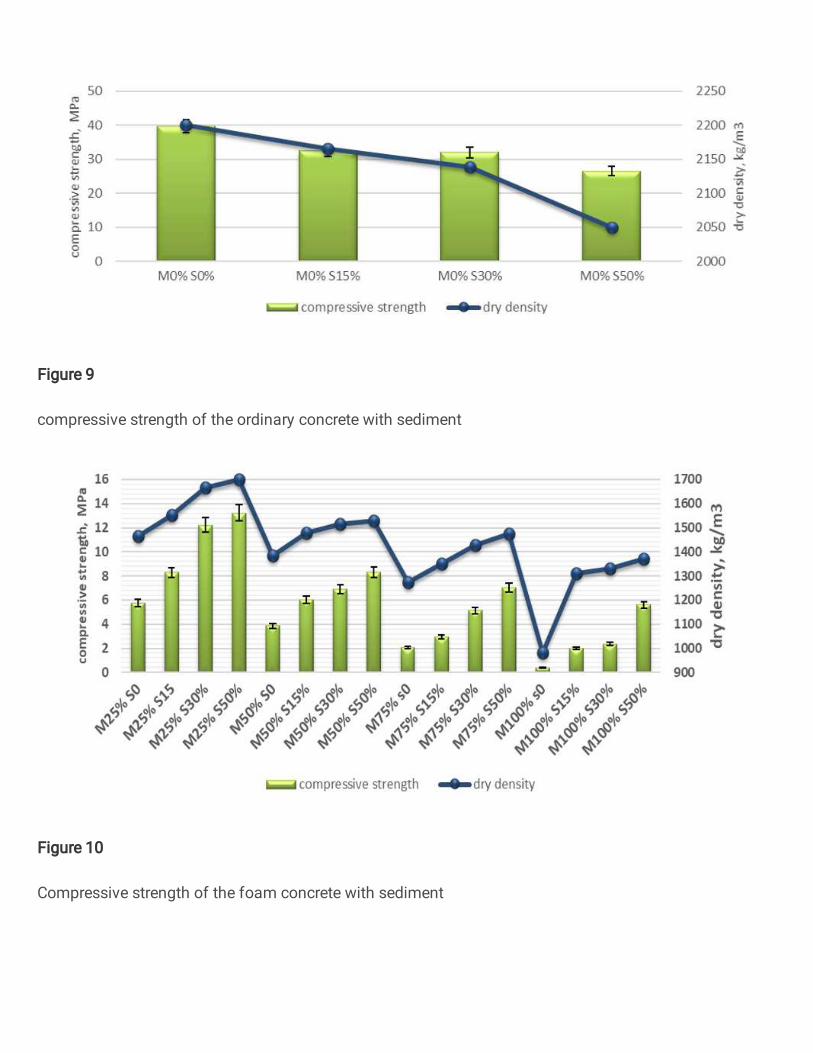
Figure 9
compressive strength of the ordinary concrete with sediment
Figure 10
Compressive strength of the foam concrete with sediment
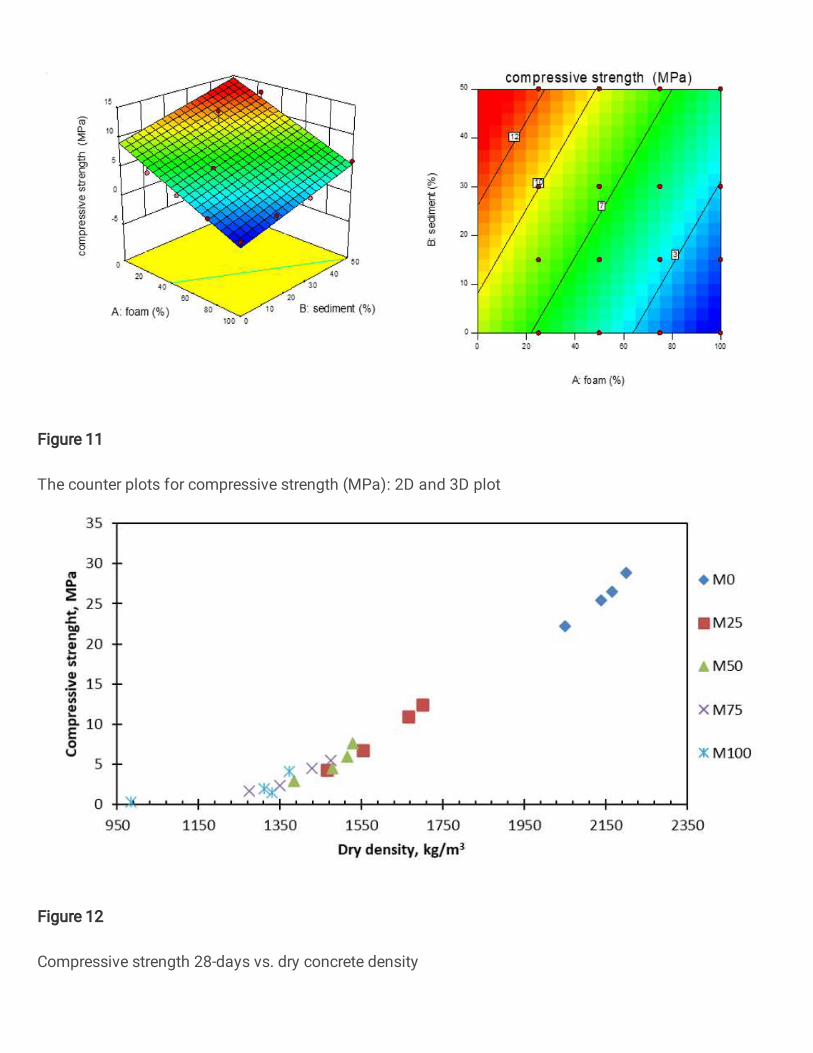
Figure 11
The counter plots for compressive strength (MPa): 2D and 3D plot
Figure 12
Compressive strength 28-days vs. dry concrete density
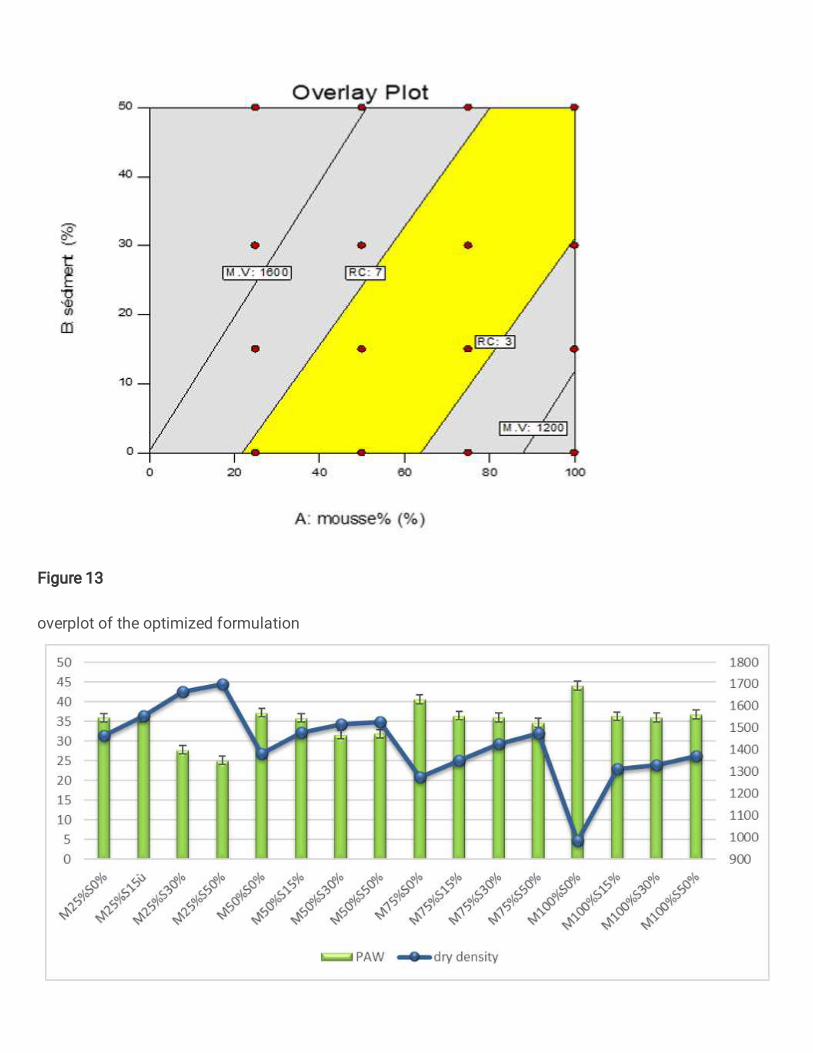
Figure 13
overplot of the optimized formulation
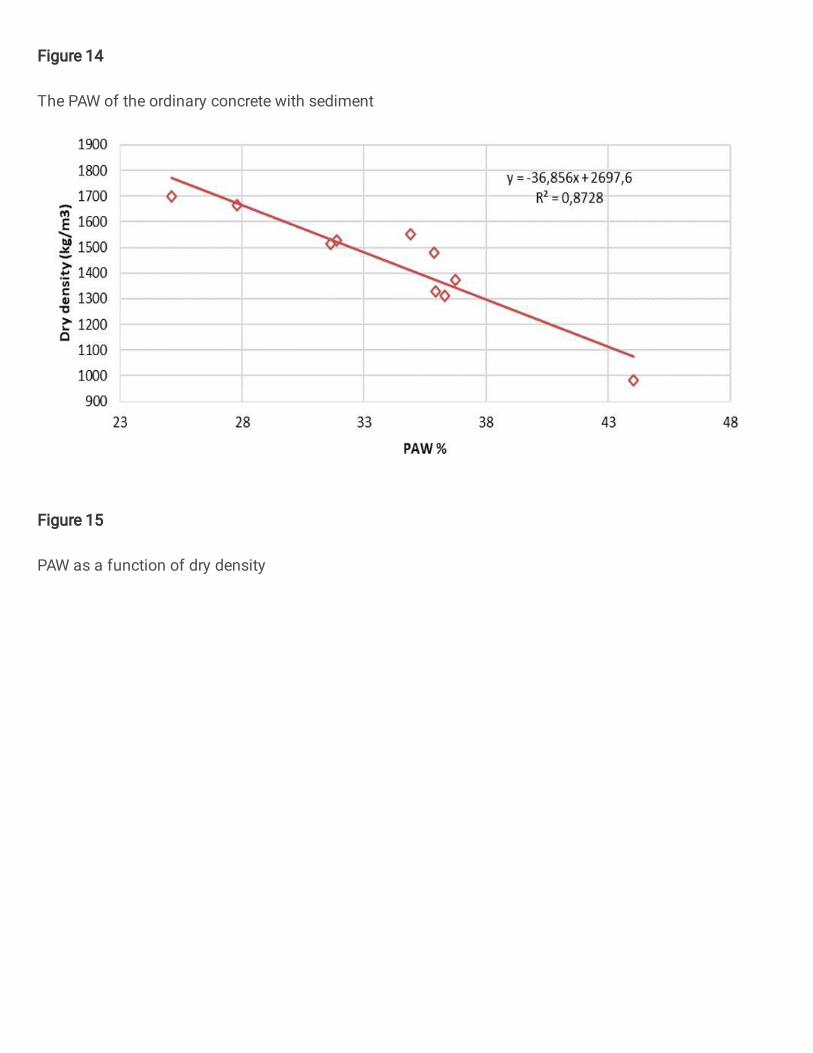
Figure 14
The PAW of the ordinary concrete with sediment
Figure 15
PAW as a function of dry density
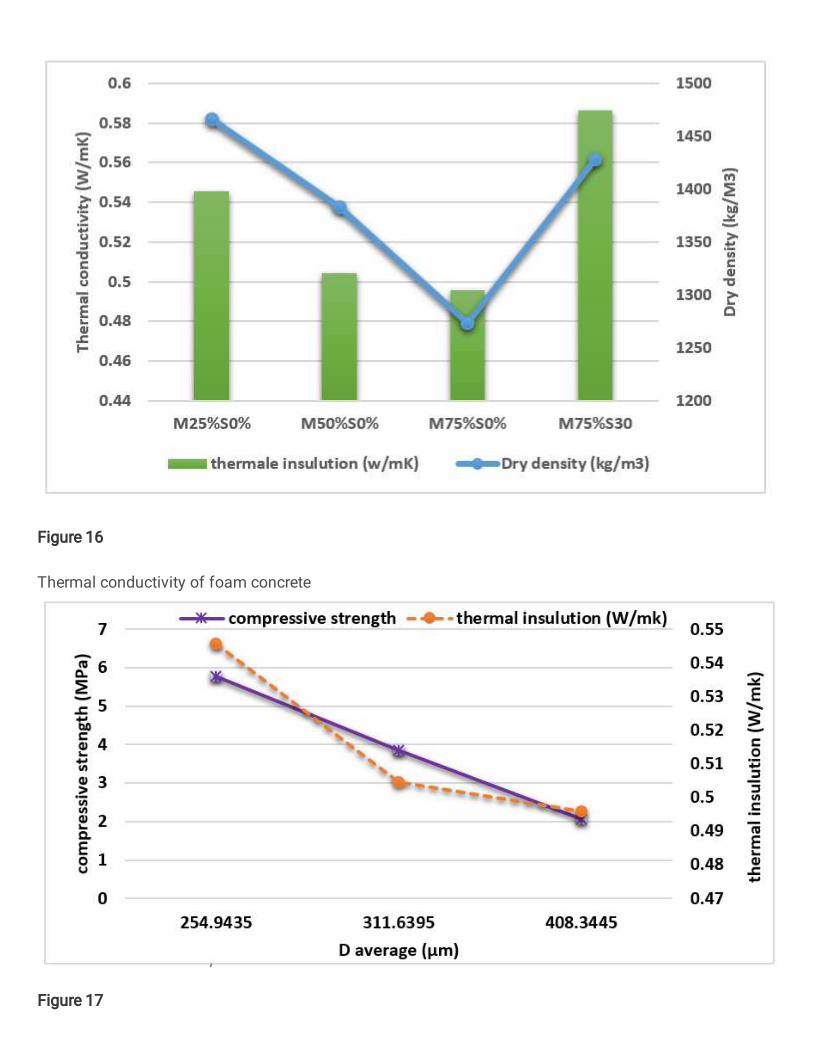
Figure 16
Thermal conductivity of foam concrete
Figure 17
D average versus compressive strength and thermal insulation
Figure 18
D average versus compressive strength and dry density
Figure 19
Pore size distributions of foamed concrete M25, 50, 75% S0% and M75% S15, 30, 50%
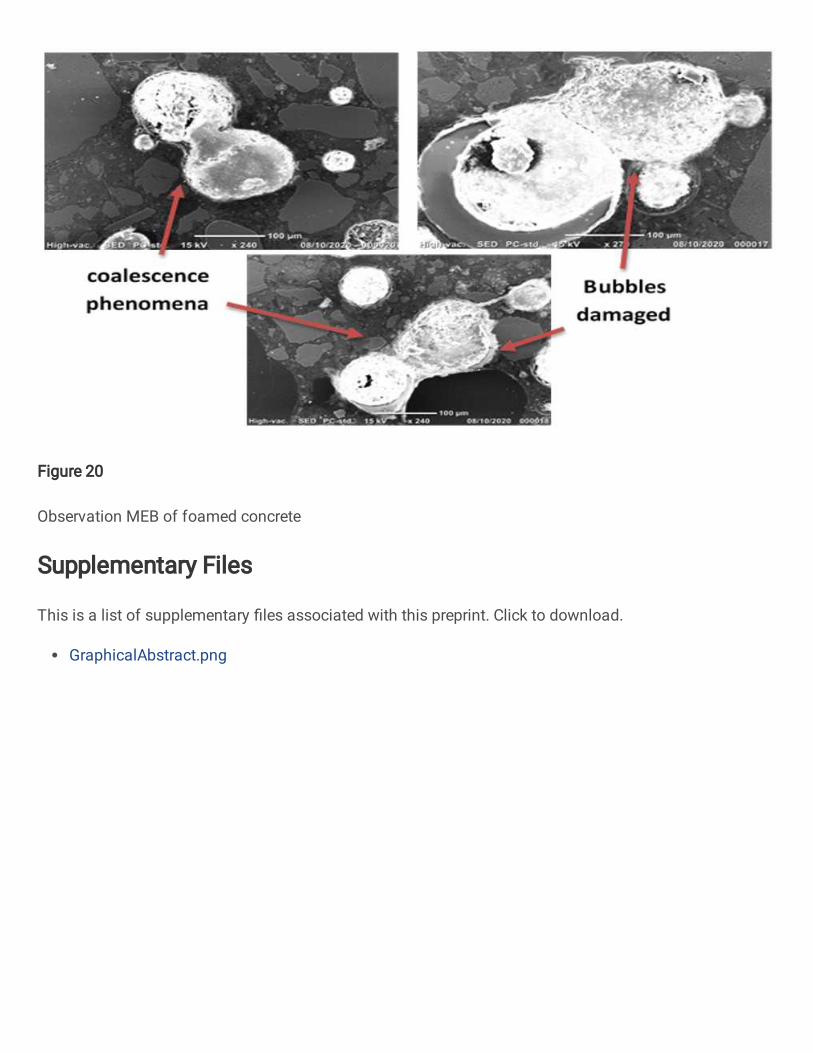
Figure 20
Observation MEB of foamed concrete
Supplementary Files
This is a list of supplementary �les associated with this preprint. Click to download.
GraphicalAbstract.png


![Figures - United States Environmental Protection … _studies2004...slurry simulation (M1S2) with sediment sample S2 and water sample [2a] Prepare dredged material slurry simulation](https://img.pdfslide.net/doc/110x75/5e785d6ef6ed39728b16dbf0/figures-united-states-environmental-protection-studies2004-slurry-simulation.jpg)