Embed Size (px)
Citation preview
The Use of Dynamic Spatio-Temporal AnalyticalTechniques to Resolve Emergent Crime Series
Dan Helms, Crime AnalystLas Vegas Metropolitan Police Department
Copyright 1999, Dan Helms, Crime Analyst - Las Vegas Metropolitan Police Department. All Rights Reserved.
Table of Contents
Abstract ..................................................... 1Introduction .............................................. 1Series Overview......................................... 1
Identifying Cases ................................... 3The Lead List ............................................ 3
Offender Physical Profile ...................... 3Offender Behavioral Profile .................. 4
Spatio-Temporal Distribution ................. 4Series Timeline ...................................... 4Spatial Correlation ................................. 5
Temporal Analysis .................................... 5Timeline and Tempo.............................. 5Time of Day/Day of Week .................... 6Hydrologic and Gravitic Modeling........ 6
Movement Analysis .................................. 8Sequence and Progression ..................... 8Circular and Linear Analysis ............... 10
Target Analysis ....................................... 11Non-Spatial Factors ............................. 11Spatial Factors ..................................... 11
Offender Identification .......................... 12Spatial Profiling ................................... 12Activity Space Analysis ....................... 13Hunting Ground Analysis .................... 14
Target Hardening ................................... 16Community Awareness ........................ 16Directed Patrol Activities .................... 17Decoy and Bait Operations .................. 17
Overview of DSTA in Action ................. 17Summary .............................................. 17Practice ................................................ 17
References................................................ 19Published Resources ............................ 19Internet Resources ............................... 19
Table of Illustrations
TablesExample Series Summary List ................ 1Circular/Linear Analysis Table ............... 9
ScreenshotsATAC Suspect Module ............................ 3
GraphsExample Bivariate Timeline .................... 4Example Spectral Density Graph ............ 4Example Hour/Weekday Surface (1) ...... 6Example Hour/Weekday Surface (2) ...... 6Example of Hydrologic/GraviticHour/Weekday Forecast .......................... 8Circular/Linear Analysis Graphs ............. 9
MapsExample Univariate Pin Map .................. 2Example Virtual Temporal Topology ..... 7Sequence Map with Distance Buffers ..... 8Example Composite Series Analysis ..... 10Example Spatial Profile Map ................ 12Example Activity Space Map ................ 13Example Movement Comparison Map .. 14Example Initial Hunting Ground Map... 15Example Final Forecast Map ................. 15Close-up of Example Forecast ............... 16
FormulaeDFT Basis Functions ............................... 4K-Test (Nearest Neighbor) ...................... 5Poisson Process (CSR) ............................ 5
The Use of Dynamic Spatio-Temporal Analytical Tech-niques to Resolve Emergent
Crime Series
By Dan Helms, Crime Analyst
Abstract
This paper explores the use of Dynamic Spatio-TemporalAnalysis � the study of movement to predict and interceptfuture cases of serial crimes � at the Las Vegas Metropoli-tan Police Department (LVMPD). The study will examine howoff-the-shelf GIS technology and time-tested techniquesdrawn from other disciplines, such as game-tracking andhydrological modeling, have been integrated into a tacticalmethodology which any Crime Analysis Unit can exploit.
Introduction
The use of modern Geographic Information Systems (GIS) inCrime Analysis is widespread, but implementation is still farfrom complete. Many agencies have limited access to thistechnology, while only a small fractioncapitalize on its fullpotential (Lavigne and Mamalian, 1999). Many law enforce-ment, national security, academic, and intelligence agenciesin the United States and elsewhere, have contributed substan-tially to the practical application of various types of point/pattern analysis techniques; others have developed usefulfield-interpolation techniques. One area within the disciplineof spatial analysis which has received comparably little at-tention is dynamic analysis. By Dynamic, we refer to the studyof the movement of events in time and space, rather than thestudy of the positions themselves. While point/pattern analy-sis focuses on locations and times, dy-namic analysis concentrates on the dis-tances, directions, and event intervals
The technique of Dynamic Spatio-Tem-poral Analysis (DSTA) has been devel-oped as an approach to understanding thedynamic relationship between eventswithin the context of Tactical CrimeAnalysis.
A few sentences differentiating the terms�Tactical,� �Strategic,� and �Administra-tive� with regard to the field of CrimeAnalysis may be in order. Administrativeanalysis describes that level of analysisat which administrative decision may be made; this includesdemographic research, police geography design, cost/benefit
analysis, and surveys. Strategic analysis, arguably the best-developed component of the discipline, refers to that level ofanalysis at which most statistical research is performed; pat-terns and trends in both police and criminal activity is con-sidered, and large projects initiated and monitored at this level.By Tactical analysis we refer to the level of individual crimi-nal or police events. This includes crime series, special events,police surges, and directed patrol operations. Although manycrime analysis units have developed considerable capabili-ties in this field, relatively few have adapted their GIS disci-plines to support this level of analysis in large degree. Thisstudy focuses strictly on Tactical Crime Analysis.
The method presented here is not dependent upon any par-ticular software package or combination of packages; somespecific examples will be mentioned; however, they are notspecifically recommended or required.
Each step in the analytical process presented here is recur-sive; that is, although presented in a particular sequence, find-ings made at one point in the process may require the analystto return to a previous stage and re-examine earlier results.
This outline is not intended to serve the academic or researchcommunities, to whom these techniques are already wellknown, but rather the crime analyst in the field for whom com-plex research methods and academic models are unavailable,unfamiliar, or mysterious.
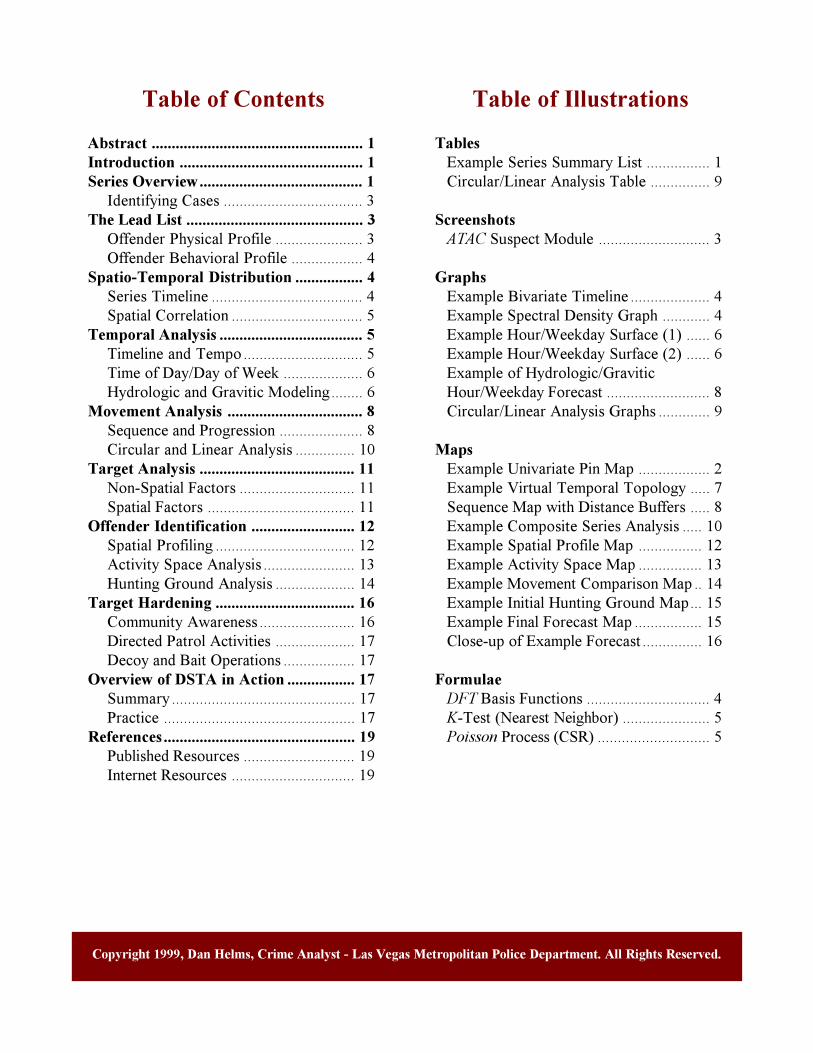
Series Overview
Not every group of cases is susceptible to successful DynamicSpatio-Temporal Analysis (DSTA). To maximize the benefitsof this process while minimizing spurious or misleading re-sults which might adversely affect law enforcement opera-tions and analytical credibility, discrimination should beemployed when attempting this technique in an operationalenvironment. Cases must be selected using clear criteria.
The principle criteria for selection is Series status. DSTA pre-sumes a Crime Series with a spatial targeting bias. The tech-niques provided here will likely be less effective or ineffec-tive on other types of events.
For the purposes of DSTA, a Crime Series is defined as agroup of criminal events which are known or suspected toshare a common causality. The most common type of com-mon causality is a single perpetrator; some crime series mayhave multiple perpetrators, but still qualify as having a singlecausality (gang and �mafia� crime, for example, may consti-tute crime series due to central coordination and strategy, eventhough each event may be attributed to a different perpetra-tor or set of perpetrators).
DSTA functions by systematically applying statistical math-ematical processes against the data relevant to the series in amethodical way. Therefore, it is necessary that the data besufficient in both quality and quantity.
The following general qualifiers should serve as a guidelinewhen selecting crime series for dynamic analysis:
� Known Events: No fewer than 10 known eventsshould constitute the series. If fewer than 10 casesare known or suspected to have occurred, the ana-lyst is advised that the processes outlined herein arelikely to be invalid or even misleading. Ideally, theseries should contain as many cases as possible; thevalidity of statistical analysis with less than 24 casesis severely impaired!
� Shared Traits: All cases in the series should shareany of the four following features:
1. Common Suspect Description(s)
2. Common Vehicle Description(s)
3. Common MO Method(s)
4. Common Victimology
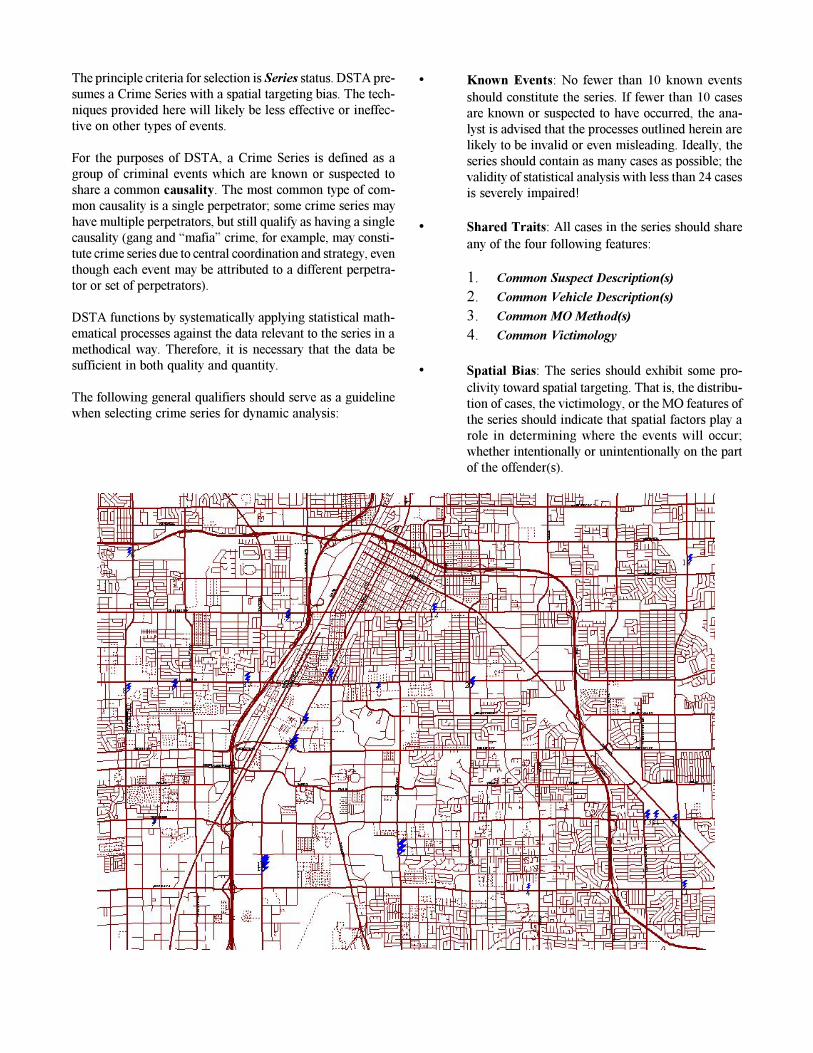
� Spatial Bias: The series should exhibit some pro-clivity toward spatial targeting. That is, the distribu-tion of cases, the victimology, or the MO features ofthe series should indicate that spatial factors play arole in determining where the events will occur;whether intentionally or unintentionally on the partof the offender(s).
� Satisfactory Documentation: The analyst must besatisfied that the events in the series constitute ascomplete and accurate a picture of the series as pos-sible. Unreported or misattributed cases will resultin erroneous and misleading findings. Cases withvery scanty details, insufficient MO or descriptiveinformation, or otherwise weak or faulty documen-tation, will likewise degrade the effectiveness of thismethodology.
Cases which meet these criteria might benefit from scrutinyusing DSTA. The next step is for the analyst to prepare histools and get his source data in order.
The analytical process has as its ultimate goal the eradicationof the series, hopefully resulting in the arrest of the perpetra-tor by supporting every possible facet of the police interven-tion process. This includes investigation, special operations,patrol response, and so forth. Therefore we may isolate threediscrete objectives which may be served by the Crime Ana-lyst:
1. Identify Suspect Lead List2. Increase Obstacles for Offender(s) � �Target
Hardening�3. Intercept Next Series Event
Let�s examine the steps undertaken by the Crime AnalysisUnit of the LVMPD to serve each of these objectives.
Identifying Cases:
Prior to analyzing the series, we must identify those caseswhich comprise it. Bair Software�s ATAC 9.0 is an excel-lent tool to identify and confirm the existence of a crime se-ries. In the first use of DSTA, approximately 20,000 crimereports were exported from the LVMPD�s RMS system intoATAC�s Access-based analysis database using a simple rela-tional SQL string sequence. These cases were then subjectedto iterative analysis against the cases presented by investiga-tors as known to constitute a series. The technique used byATAC is intellectually simple but functionally difficult toduplicate: Each field in a crime report is assigned a weightwhich indicates its relevance to the series. All fields in allrecords are compared with the suspicious record, and the de-gree of commonality is determined based on the weights as-signed by the analyst. If the degree of commonality breaks ananalyst-determined threshold, the case is marked as �Possi-bly Related� and may easily be reviewed for further analysis.
The Lead List
Offender Physical Profile:
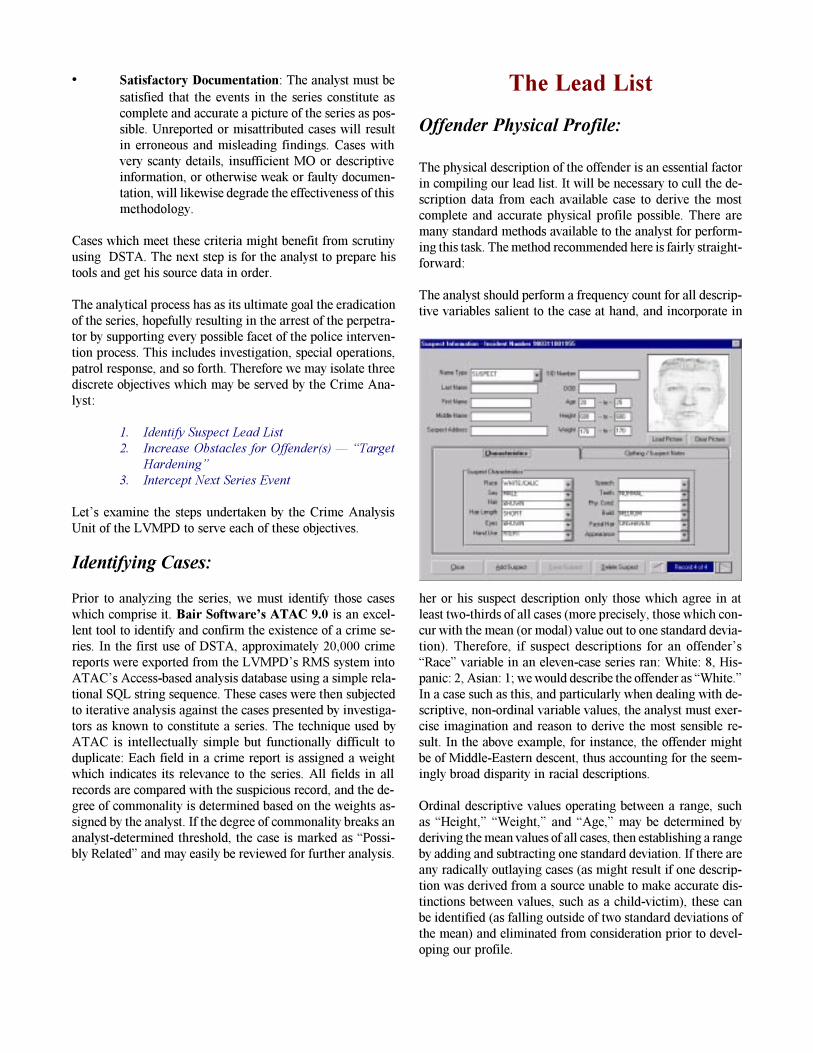
The physical description of the offender is an essential factorin compiling our lead list. It will be necessary to cull the de-scription data from each available case to derive the mostcomplete and accurate physical profile possible. There aremany standard methods available to the analyst for perform-ing this task. The method recommended here is fairly straight-forward:
The analyst should perform a frequency count for all descrip-tive variables salient to the case at hand, and incorporate in
her or his suspect description only those which agree in atleast two-thirds of all cases (more precisely, those which con-cur with the mean (or modal) value out to one standard devia-tion). Therefore, if suspect descriptions for an offender�s�Race� variable in an eleven-case series ran: White: 8, His-panic: 2, Asian: 1; we would describe the offender as �White.�In a case such as this, and particularly when dealing with de-scriptive, non-ordinal variable values, the analyst must exer-cise imagination and reason to derive the most sensible re-sult. In the above example, for instance, the offender mightbe of Middle-Eastern descent, thus accounting for the seem-ingly broad disparity in racial descriptions.
Ordinal descriptive values operating between a range, suchas �Height,� �Weight,� and �Age,� may be determined byderiving the mean values of all cases, then establishing a rangeby adding and subtracting one standard deviation. If there areany radically outlaying cases (as might result if one descrip-tion was derived from a source unable to make accurate dis-tinctions between values, such as a child-victim), these canbe identified (as falling outside of two standard deviations ofthe mean) and eliminated from consideration prior to devel-oping our profile.
Description variables which are not adequately corroborated(that is, not apparent in two-thirds of cases or more), such asa tattoo glimpsed by one witness but unseen by any others,should not be included in the physical profile, but should benoted in a summary document.
Offender Behavioral Profile:
Compiling a psychological profile of an offender is a labori-ous and painstaking affair. A comprehensive spectrum of fac-tors must be encompassed, and any omission or inadvertentaddition of valid clues will result in distorted findings (Dou-glas, Burgess, Burgess, and Ressler, 1992; Douglas, Burgess,and Ressler, 1988). It would be unreasonable to attempt toinclude an adequate methodology for conducting behavioralor psychological offender profiling here; however, the use-fulness of this process when incorporated into the DSTA tech-nique is great. For purposes of this document, it is assumedthe analyst will be familiar with the principles of behavioral,psychological, and forensic profiling, or will have at her orhis disposal individuals who are.
Spatio-Temporal Distribution
Series Timeline:
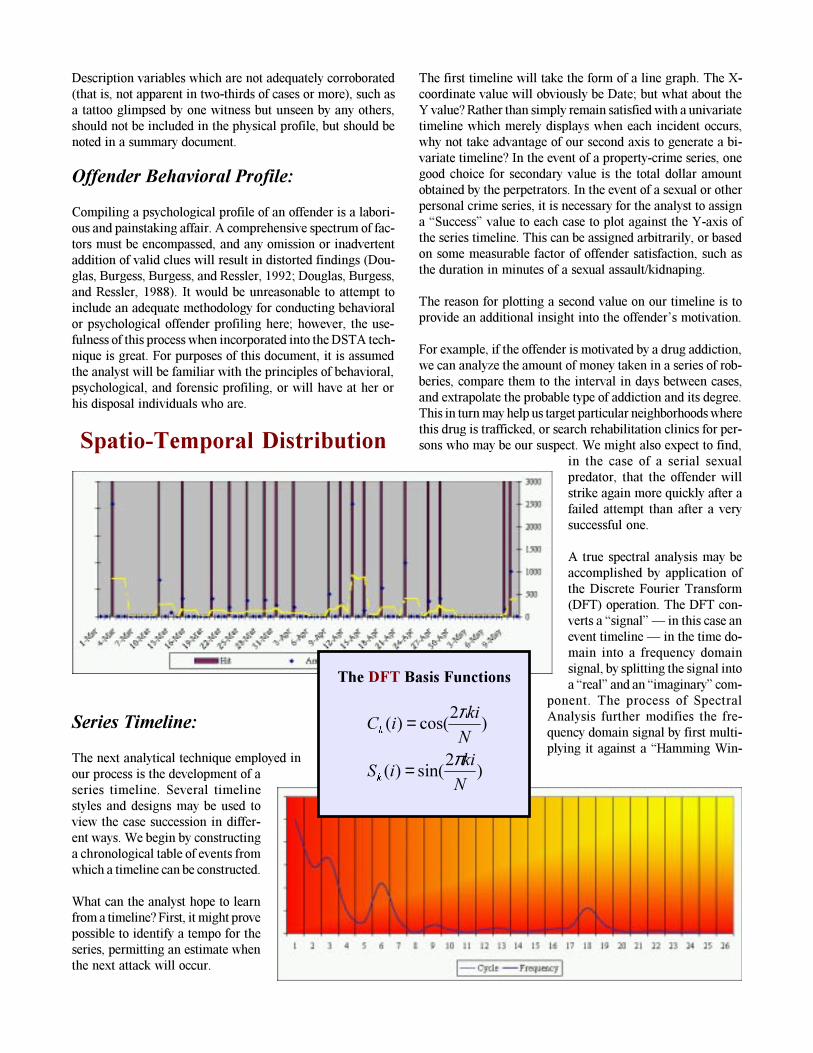
The next analytical technique employed inour process is the development of aseries timeline. Several timelinestyles and designs may be used toview the case succession in differ-ent ways. We begin by constructinga chronological table of events fromwhich a timeline can be constructed.
What can the analyst hope to learnfrom a timeline? First, it might provepossible to identify a tempo for theseries, permitting an estimate whenthe next attack will occur.
The first timeline will take the form of a line graph. The X-coordinate value will obviously be Date; but what about theY value? Rather than simply remain satisfied with a univariatetimeline which merely displays when each incident occurs,why not take advantage of our second axis to generate a bi-variate timeline? In the event of a property-crime series, onegood choice for secondary value is the total dollar amountobtained by the perpetrators. In the event of a sexual or otherpersonal crime series, it is necessary for the analyst to assigna �Success� value to each case to plot against the Y-axis ofthe series timeline. This can be assigned arbitrarily, or basedon some measurable factor of offender satisfaction, such asthe duration in minutes of a sexual assault/kidnaping.
The reason for plotting a second value on our timeline is toprovide an additional insight into the offender�s motivation.
For example, if the offender is motivated by a drug addiction,we can analyze the amount of money taken in a series of rob-beries, compare them to the interval in days between cases,and extrapolate the probable type of addiction and its degree.This in turn may help us target particular neighborhoods wherethis drug is trafficked, or search rehabilitation clinics for per-sons who may be our suspect. We might also expect to find,
in the case of a serial sexualpredator, that the offender willstrike again more quickly after afailed attempt than after a verysuccessful one.
A true spectral analysis may beaccomplished by application ofthe Discrete Fourier Transform(DFT) operation. The DFT con-verts a �signal� � in this case anevent timeline � in the time do-main into a frequency domainsignal, by splitting the signal intoa �real� and an �imaginary� com-
ponent. The process of SpectralAnalysis further modifies the fre-quency domain signal by first multi-plying it against a �Hamming Win-
The DFT Basis Functions
��
VLQ���
��
FRV���
1NL
L6
1NL
L&
N
N
π
π
=
=
The Poisson Proccess(Complete Spatial Ran-domness)
$
\
6<H
\$
<I λλ −=���
����
dow,� then examining the frequencies of events revealedwithin the signal. This allows the analyst to precisely deter-mine the periodicity of events, their tempo, tempo trends, andso forth (Smith, 1997). The DFT/Spectral Analysis techniqueis basic to most scientific and engineering disciplines, how-ever a methodology for performing spectral analysis is tooinvolved to fall within the scope of this paper.
Spatial Correlation:
The first stage of analysis consisted of pin-map productionand cluster analysis. Cases from ATAC are exported directlyinto ArcView 3.2 and geocoded against a Street Centerlinefile. Where possible, cases were also geocoded against a Par-cel File for greater accuracy. It is essential that geocoding beflawless when the point themes thus derived are to be used inDSTA; therefore, extreme accuracy indata and a robust basemap database isnecessary.
Having developed a point theme fromour geocoded event table, we are able toanalyze the point distribution to see ifthere appears to be spatial correlation.We might consider using either a simpleK-Test (�Nearest Neighbor�), or a moreadvanced Poisson process test for Com-plete Spatial Randomness (CSR) (Bailey and Gatrell, 1995).
Any of three possible distributionsshould be described by these tests: Clus-tered, Random, or Uniform.
Clustered distributions indicate a ten-dency for points to occur in proximity toone another. This distribution is the sim-plest to resolve from a crime analyst�spoint of view: One expects new eventsto occur in the vicinity of previousevents, and deploys patrol and surveil-lance assets accordingly. DSTA willfunction against series which displayclustered characteristics, however, simpler tools are likely tobe superior in this case. If the offender always strikes within100 yards of the same intersection, for example, it requiresno difficult statistical analysis to determine that the next eventis likely to occur in the same area!
A Random distribution indicates no spatial bias on the partof the offender. This distribution cannot be resolved usingDSTA, since spatial bias is a requirement for the technique.If your results indicate a Random point distribution pattern,however, do not abandon your efforts at once: often seem-ingly random patterns, when examined carefully, can revealclustered or uniform characteristics which can be exploitedby an adroit analyst.
Uniform distributions are easily confused with random dis-tributions; in fact, they typically appear to be completely spa-tially random at first glance, making specific mathematicaltesting necessary. It is a feature of human spatial perceptionthat uniformity and randomness are readily mistaken one forthe other. A uniform distribution of a crime series is the typeof distribution most suited to DSTA. This pattern may indi-cate that the offender is conscious of police observation andintentionally spaces his attacks to avoid surveillance or otherlaw enforcement countermeasures.
These tests for spatial dispersal function by comparing thedistances between cases in space, as determined byPythagorean derivation from their X and Y Cartesian coordi-nates. Purely spatial considerations, however, may fail to re-veal an accurate distribution.
DSTA emphasizes an inclusive Spatio-Temporal approach which treats time andspace equally. The interval between casesin hours or days is as important to thisprocess as their geographic separation inmiles.
When determiningComplete SpatialRandomness (CSR) or Nearest Neighbordistributions for DSTA, therefore, whencalculating the Distance between any two
event points, the analyst must factor the Temporal Displace-ment (time difference in hours or days,depending on the analyst�s unit of mea-surement) between the events. CurrentDSTA usage recommends standardizingdistance measurements in statute miles,and temporal measurement in days (andfractions of days: accuracy to at least twodecimal places is essential for many se-ries).
Using this technique, therefore, treatingtemporal separation as a virtual �Z� co-ordinate, can make spatially random dis-
tributions reveal their true clustered or uniform character.
Temporal Analysis
Timeline and Tempo:
The next step before us is to analyze the tempo of the serieswith a view to understanding when the perpetrator strikes, aswell as possibly learning more about his motivations or tar-geting parameters.
At this point, three questions should have been answered:
The K-Test (NearestNeighbor) with Circum-ferential Edge Correction
∑ ∑≠
=ML LM
LMK
Q
5
:
G,K.
����Ö
�
First, is there a temporal pattern to the progression ofevents? This question can be answered simply by calculatingthe mean interval between cases and determining the stan-dard deviation.
As deviation increases, predictability decreases with inverseproportion. Alternatively, either Spectral Analysis, or aLagged Variogram might reveal hidden frequencies and pat-terns, but this depends greatly on the tools available to theanalyst and his or her degree of expertise in using these meth-ods. Depending on the number of cases and the amount ofpreparation the analyst has spent developing shortcuts, eithermean intervals can be tabulated after excluding the outlyingtwo standard deviations of cases, or else the technique of Spec-tral Analysis can be performed.
Second, are there multiple perpetrators? This is best re-vealed by Spectral Analysis. If multiple perpetrators, or a ro-tating body of perpetrators, is effecting the series (as mightbe the case in a series of gang-related robberies or assaults),we would expect to see overlapping frequency waves.
Third, is the offender motivated by a predictable need? Thiscan be determined by bivariate analysis of the amount taken(for property crimes), or arbitrarily-assigned offender satis-faction values (for personal crimes), cross tabulated with theinterval between known events. The fact that these two vari-ables (interval and amount taken) are related or are not re-lated can be demonstrated by any of several simple tests, suchas the K-test for bivariate predictability, or even a P2-test.
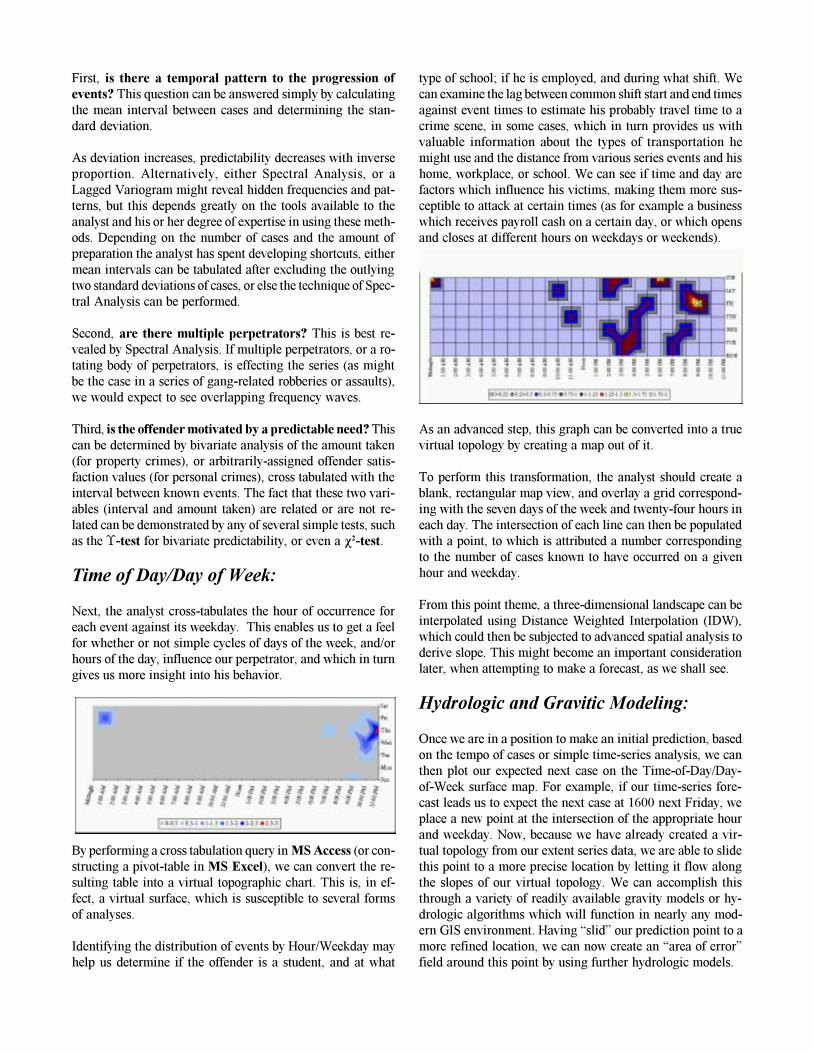
Time of Day/Day of Week:
Next, the analyst cross-tabulates the hour of occurrence foreach event against its weekday. This enables us to get a feelfor whether or not simple cycles of days of the week, and/orhours of the day, influence our perpetrator, and which in turngives us more insight into his behavior.
By performing a cross tabulation query in MS Access (or con-structing a pivot-table in MS Excel), we can convert the re-sulting table into a virtual topographic chart. This is, in ef-fect, a virtual surface, which is susceptible to several formsof analyses.
Identifying the distribution of events by Hour/Weekday mayhelp us determine if the offender is a student, and at what
type of school; if he is employed, and during what shift. Wecan examine the lag between common shift start and end timesagainst event times to estimate his probably travel time to acrime scene, in some cases, which in turn provides us withvaluable information about the types of transportation hemight use and the distance from various series events and hishome, workplace, or school. We can see if time and day arefactors which influence his victims, making them more sus-ceptible to attack at certain times (as for example a businesswhich receives payroll cash on a certain day, or which opensand closes at different hours on weekdays or weekends).
As an advanced step, this graph can be converted into a truevirtual topology by creating a map out of it.
To perform this transformation, the analyst should create ablank, rectangular map view, and overlay a grid correspond-ing with the seven days of the week and twenty-four hours ineach day. The intersection of each line can then be populatedwith a point, to which is attributed a number correspondingto the number of cases known to have occurred on a givenhour and weekday.
From this point theme, a three-dimensional landscape can beinterpolated using Distance Weighted Interpolation (IDW),which could then be subjected to advanced spatial analysis toderive slope. This might become an important considerationlater, when attempting to make a forecast, as we shall see.
Hydrologic and Gravitic Modeling:
Once we are in a position to make an initial prediction, basedon the tempo of cases or simple time-series analysis, we canthen plot our expected next case on the Time-of-Day/Day-of-Week surface map. For example, if our time-series fore-cast leads us to expect the next case at 1600 next Friday, weplace a new point at the intersection of the appropriate hourand weekday. Now, because we have already created a vir-tual topology from our extent series data, we are able to slidethis point to a more precise location by letting it flow alongthe slopes of our virtual topology. We can accomplish thisthrough a variety of readily available gravity models or hy-drologic algorithms which will function in nearly any mod-ern GIS environment. Having �slid� our prediction point to amore refined location, we can now create an �area of error�field around this point by using further hydrologic models.
Let�s explore this briefly:
The simplest sort of time series forecasting involved calcu-lating the mean interval between cases, adding this intervalonto the time of the last known event, and then creating an�Error Interval� or time range by adding and subtracting onestandard deviation (or two, or even three!) to this calculatedevent. This process has the advantage of simplicity, howeverit falls short in several key areas. For example, series withincreasing or decreasing intervals are relatively commonplace,but the old method does not allow for acceleration or decel-eration of tempo. Also, the error factor is dramatically multi-plied by failure to account for even one missing case in aseries, or the erroneous inclusion of an extra, actually unre-lated, case. These errors can be obviated by use of SpectralTime Analysis methods (Guha and Levy, 1990), however,these methods are more difficult for most analysts.
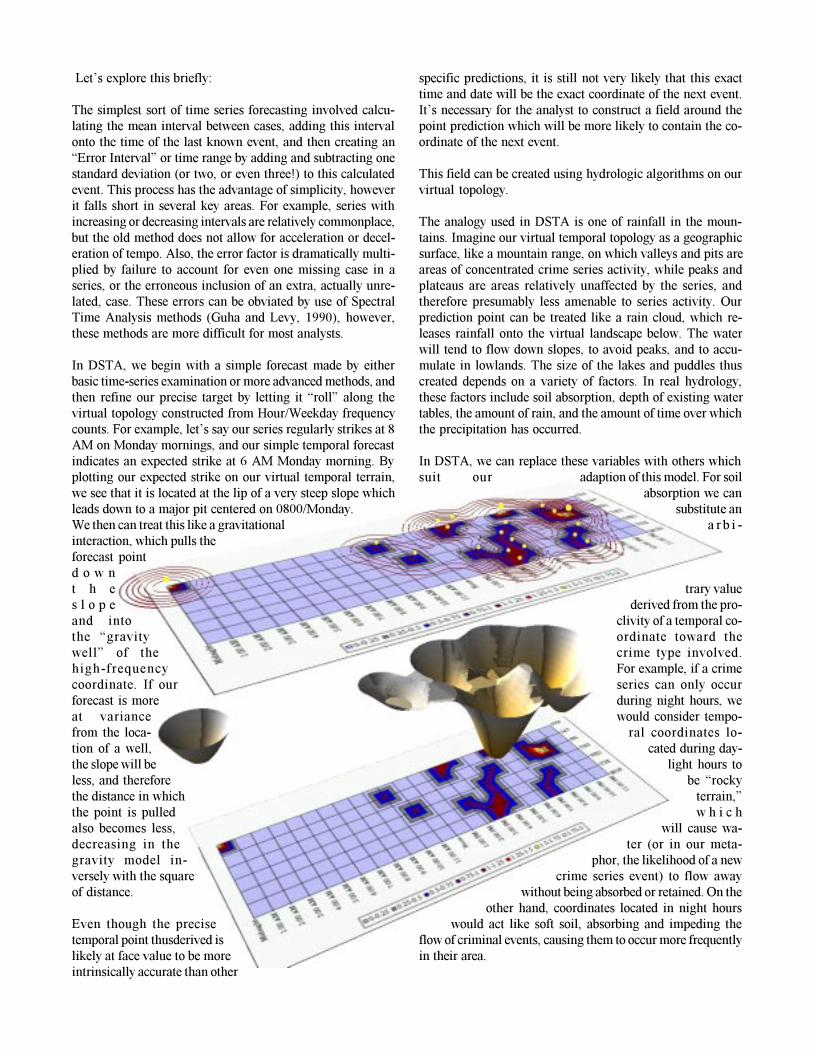
In DSTA, we begin with a simple forecast made by eitherbasic time-series examination or more advanced methods, andthen refine our precise target by letting it �roll� along thevirtual topology constructed from Hour/Weekday frequencycounts. For example, let�s say our series regularly strikes at 8AM on Monday mornings, and our simple temporal forecastindicates an expected strike at 6 AM Monday morning. Byplotting our expected strike on our virtual temporal terrain,we see that it is located at the lip of a very steep slope whichleads down to a major pit centered on 0800/Monday.We then can treat this like a gravitationalinteraction, which pulls theforecast pointd o w nt h es l o p eand intothe �gravitywell� of thehigh-frequencycoordinate. If ourforecast is moreat variancefrom the loca-tion of a well,the slope will beless, and thereforethe distance in whichthe point is pulledalso becomes less,decreasing in thegravity model in-versely with the squareof distance.
Even though the precisetemporal point thusderived islikely at face value to be moreintrinsically accurate than other
specific predictions, it is still not very likely that this exacttime and date will be the exact coordinate of the next event.It�s necessary for the analyst to construct a field around thepoint prediction which will be more likely to contain the co-ordinate of the next event.
This field can be created using hydrologic algorithms on ourvirtual topology.
The analogy used in DSTA is one of rainfall in the moun-tains. Imagine our virtual temporal topology as a geographicsurface, like a mountain range, on which valleys and pits areareas of concentrated crime series activity, while peaks andplateaus are areas relatively unaffected by the series, andtherefore presumably less amenable to series activity. Ourprediction point can be treated like a rain cloud, which re-leases rainfall onto the virtual landscape below. The waterwill tend to flow down slopes, to avoid peaks, and to accu-mulate in lowlands. The size of the lakes and puddles thuscreated depends on a variety of factors. In real hydrology,these factors include soil absorption, depth of existing watertables, the amount of rain, and the amount of time over whichthe precipitation has occurred.
In DSTA, we can replace these variables with others whichsuit our adaption of this model. For soil
absorption we cansubstitute an
a r b i -
trary valuederived from the pro-
clivity of a temporal co-ordinate toward thecrime type involved.For example, if a crimeseries can only occurduring night hours, wewould consider tempo-
ral coordinates lo-cated during day-
light hours tobe �rocky
terrain,�w h i c h
will cause wa-ter (or in our meta-
phor, the likelihood of a newcrime series event) to flow away
without being absorbed or retained. On theother hand, coordinates located in night hours
would act like soft soil, absorbing and impeding theflow of criminal events, causing them to occur more frequentlyin their area.
There are many hydrological models from which to choose,and the details of the process, like other stages of the tacticalanalysis process, are too involved to cover in depth here. In-terested persons are referred to the standing literature in theGIS field (Silver, 1998).
The point of this portion of the DSTA process is to improveupon the basic temporal forecast result (�...There is approxi-mately a 68% chance the next event will occur between 2 AMWednesday and 1 AM Thursday...�) by replacing it with afield of probabilistic values which correspond to the kernelestimation of temporal probability for the next event, super-imposed on a virtual temporal topology.
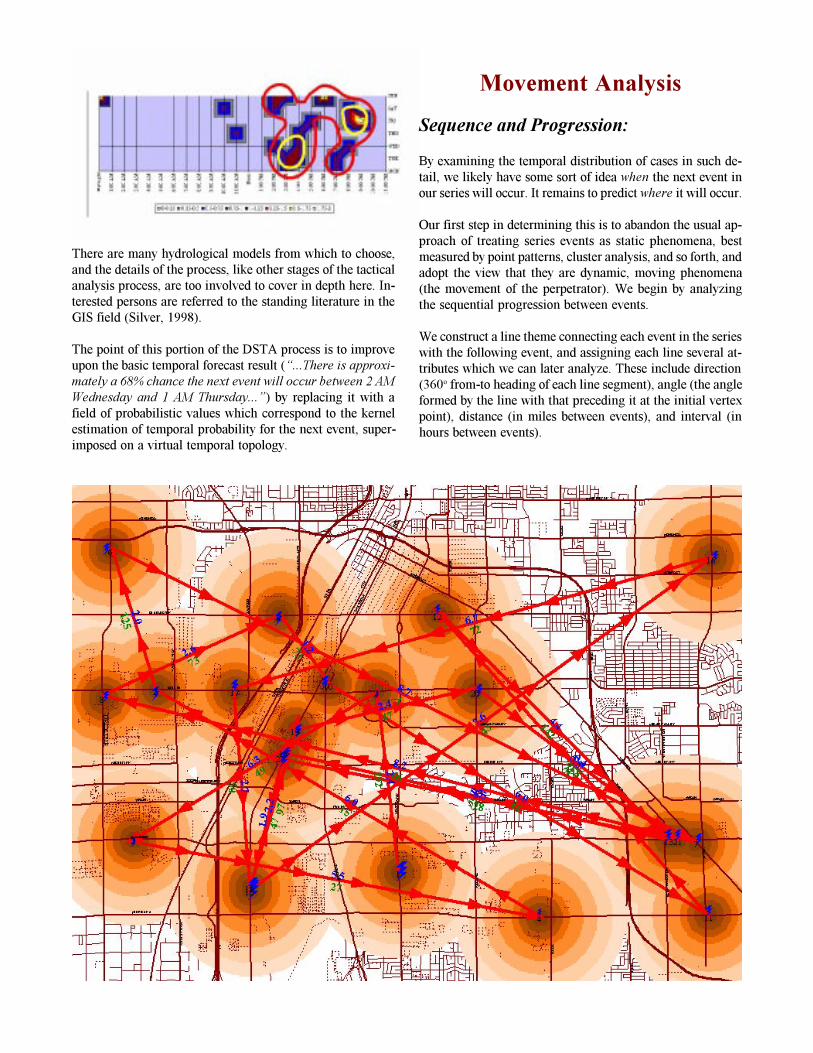
Movement Analysis
Sequence and Progression:
By examining the temporal distribution of cases in such de-tail, we likely have some sort of idea when the next event inour series will occur. It remains to predict where it will occur.
Our first step in determining this is to abandon the usual ap-proach of treating series events as static phenomena, bestmeasured by point patterns, cluster analysis, and so forth, andadopt the view that they are dynamic, moving phenomena(the movement of the perpetrator). We begin by analyzingthe sequential progression between events.
We construct a line theme connecting each event in the serieswith the following event, and assigning each line several at-tributes which we can later analyze. These include direction(360o from-to heading of each line segment), angle (the angleformed by the line with that preceding it at the initial vertexpoint), distance (in miles between events), and interval (inhours between events).
Now before we go any further, let�s stop for a �reality check.�The perpetrators of a crime series obviously do not proceeddirectly from one robbery to another (not usually, at least).They get up, go to work (or school), visit a friend, hold up astore, go to a movie, go home; get up and go to work, go outon a date, go home; get up and go to work, hold up a store, gohome, etc. In the mind of the perpetrator, his schedule is in-terspersed with non-criminal events. Yet, careful analysis mayreveal underlying patterns in his spatial and/or temporal tar-geting of which even he is unaware.
What spatial factors might we analyze to hunt for movementpatterns? Let�s start with some of these:
� Distance between cases� Interval (in hours) between cases� Angles (made by route lines)� Ratio of distance to interval� Ratio of distance to angles� Ratio of interval to angles� Cross tabulation of Time of Day to Distance� Cross tabulation of Day of Week to Distance
Why might these factors be important? Let�s address somecategories of relationships.
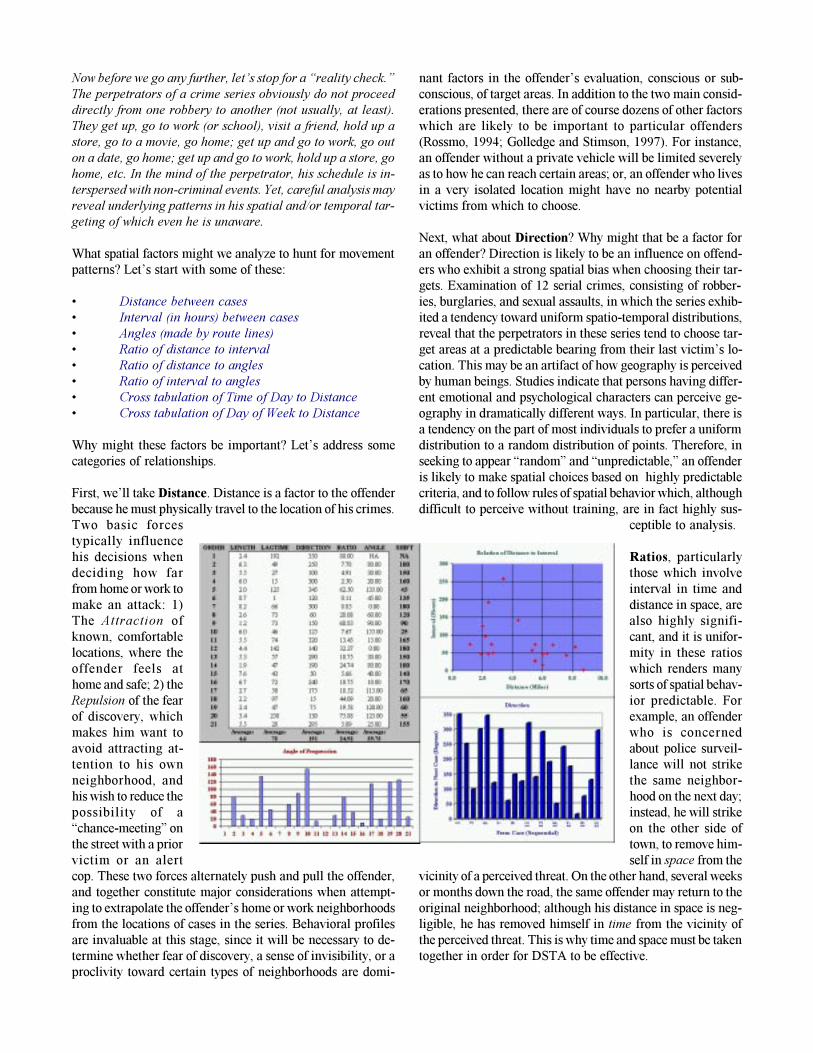
First, we�ll take Distance. Distance is a factor to the offenderbecause he must physically travel to the location of his crimes.Two basic forcestypically influencehis decisions whendeciding how farfrom home or work tomake an attack: 1)The Attraction ofknown, comfortablelocations, where theoffender feels athome and safe; 2) theRepulsion of the fearof discovery, whichmakes him want toavoid attracting at-tention to his ownneighborhood, andhis wish to reduce thepossibility of a�chance-meeting� onthe street with a priorvictim or an alertcop. These two forces alternately push and pull the offender,and together constitute major considerations when attempt-ing to extrapolate the offender�s home or work neighborhoodsfrom the locations of cases in the series. Behavioral profilesare invaluable at this stage, since it will be necessary to de-termine whether fear of discovery, a sense of invisibility, or aproclivity toward certain types of neighborhoods are domi-
nant factors in the offender�s evaluation, conscious or sub-conscious, of target areas. In addition to the two main consid-erations presented, there are of course dozens of other factorswhich are likely to be important to particular offenders(Rossmo, 1994; Golledge and Stimson, 1997). For instance,an offender without a private vehicle will be limited severelyas to how he can reach certain areas; or, an offender who livesin a very isolated location might have no nearby potentialvictims from which to choose.
Next, what about Direction? Why might that be a factor foran offender? Direction is likely to be an influence on offend-ers who exhibit a strong spatial bias when choosing their tar-gets. Examination of 12 serial crimes, consisting of robber-ies, burglaries, and sexual assaults, in which the series exhib-ited a tendency toward uniform spatio-temporal distributions,reveal that the perpetrators in these series tend to choose tar-get areas at a predictable bearing from their last victim�s lo-cation. This may be an artifact of how geography is perceivedby human beings. Studies indicate that persons having differ-ent emotional and psychological characters can perceive ge-ography in dramatically different ways. In particular, there isa tendency on the part of most individuals to prefer a uniformdistribution to a random distribution of points. Therefore, inseeking to appear �random� and �unpredictable,� an offenderis likely to make spatial choices based on highly predictablecriteria, and to follow rules of spatial behavior which, althoughdifficult to perceive without training, are in fact highly sus-
ceptible to analysis.
Ratios, particularlythose which involveinterval in time anddistance in space, arealso highly signifi-cant, and it is unifor-mity in these ratioswhich renders manysorts of spatial behav-ior predictable. Forexample, an offenderwho is concernedabout police surveil-lance will not strikethe same neighbor-hood on the next day;instead, he will strikeon the other side oftown, to remove him-self in space from the
vicinity of a perceived threat. On the other hand, several weeksor months down the road, the same offender may return to theoriginal neighborhood; although his distance in space is neg-ligible, he has removed himself in time from the vicinity ofthe perceived threat. This is why time and space must be takentogether in order for DSTA to be effective.
Circular and Linear Analysis:
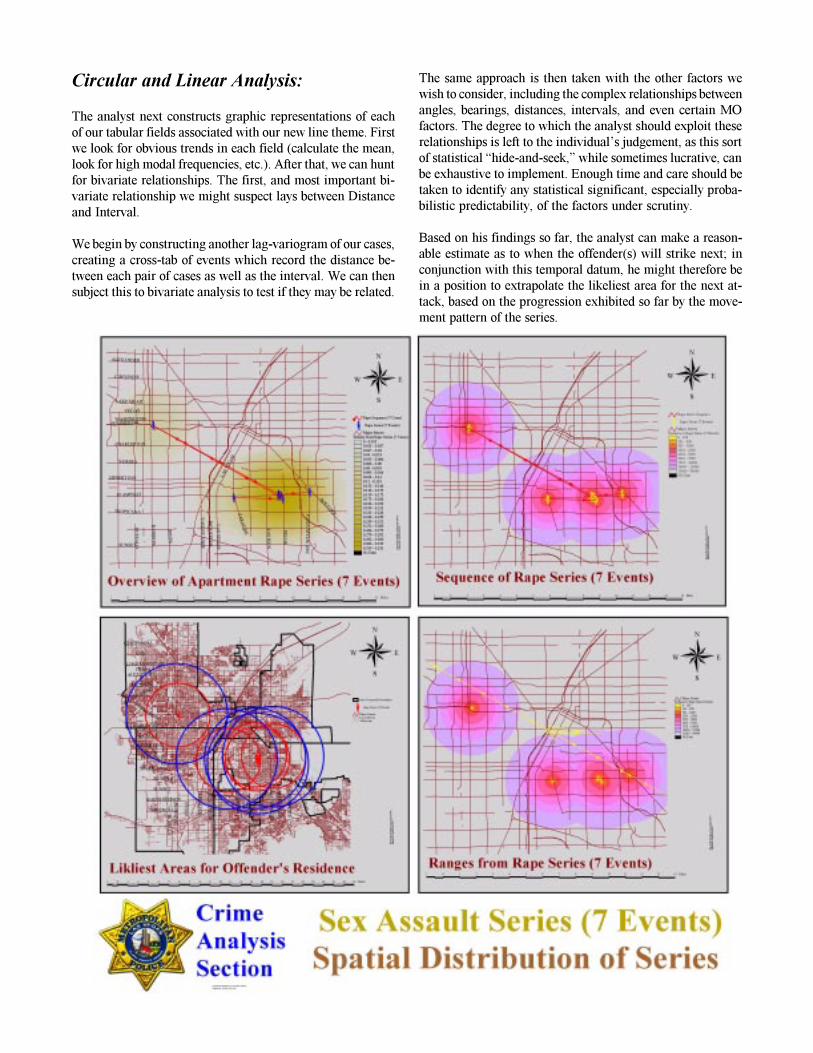
The analyst next constructs graphic representations of eachof our tabular fields associated with our new line theme. Firstwe look for obvious trends in each field (calculate the mean,look for high modal frequencies, etc.). After that, we can huntfor bivariate relationships. The first, and most important bi-variate relationship we might suspect lays between Distanceand Interval.
We begin by constructing another lag-variogram of our cases,creating a cross-tab of events which record the distance be-tween each pair of cases as well as the interval. We can thensubject this to bivariate analysis to test if they may be related.
The same approach is then taken with the other factors wewish to consider, including the complex relationships betweenangles, bearings, distances, intervals, and even certain MOfactors. The degree to which the analyst should exploit theserelationships is left to the individual�s judgement, as this sortof statistical �hide-and-seek,� while sometimes lucrative, canbe exhaustive to implement. Enough time and care should betaken to identify any statistical significant, especially proba-bilistic predictability, of the factors under scrutiny.
Based on his findings so far, the analyst can make a reason-able estimate as to when the offender(s) will strike next; inconjunction with this temporal datum, he might therefore bein a position to extrapolate the likeliest area for the next at-tack, based on the progression exhibited so far by the move-ment pattern of the series.
Target Analysis
Non-Spatial Factors:
The target of an attack is not merely some mathematical pointin space and time, it is a home, or a business, and more par-ticularly the person, or possessions, located within. We canuse the coarse analytical techniques of temporal and spatialmovement analysis presented so far to predict a geographicarea in which the next target will likely lie; however, in thevast majority of cases this area will contain hundreds, if notthousands, or tens of thousands, of potential targets. In orderfor our prediction to have law enforcement value, we mustrefine our forecast to be as specific as is feasible with theinformation available.
Two principal categories of non-spatial factors allow us toselect with discretion from among our potential targets: 1)Victimology; 2) Target Class.
Generally, crimes are divided into two broad categories:Crimes Against Persons (such as rape, assault, or murder) andCrimes Against Property (such as burglary, or auto theft).Quite often, these overlap (as in the case of armed robbery, orhome invasion, or car jacking).
When a crime series targets Persons (as opposed to Property),we can apply the science of Victimology to help understandthe nature of the crime. For example, a child molester is asexual offender who derives gratification through the abuseof a specific type of victim; moreover, most offenders have avery refined and exclusive set of preferences (victims shouldbe between certain ages, certain body frames, should be ei-ther rich or poor, or belong to a particular ethnic group, orhave a certain hair color, for example).
The distribution of persons matching the victim profile for agiven crime series may be susceptible to spatial and/or tem-poral analysis. For example, school children are not likely tobe victimized during school hours, when they are presum-ably subject to immediate supervision and will be noticedmissing quickly. Also, surveillance on the part of an offenderin the immediate vicinity of a school may be considered sus-picious and observed more readily than at another location.Children will follow predictable paths from home to school,and the locations of school bus stops are readily apparent;these, then, are spatial and temporal factors which could beused to refine the predicted location of a molestation serieswithin the geographic and temporal bounds of our DSTA pre-diction thus far. Likewise, a rapist who attacks young womenmight target them in the vicinity of a high school or univer-sity, or a place of business likely to have a large number ofpotential targets, such as a business park or an area with adultentertainment. Victims drawn from these locations, too, willonly be available for targeting at particular times of the day
and days of the week. Information on the locations of thesebusinesses can be derived from geographic databases of sev-eral types.
When a crime series targets Property, we can use preciselythe same inductive processes to refine our spatio-temporalforecast by examining where and when the property targetedby the offender is available to him.
The distribution of target property is subject to spatio-tempo-ral analysis in precisely the same way as the distribution ofpotential victim persons. Analysis of the business license filesfor each targeted establishment in a robbery or commercialburglary series may reveal certain similarities which, althoughnot necessarily causal, may be used as a starting point foridentifying the next target in the series. For example, an of-fender may target businesses without surveillance devices,which are located in strip malls, and are at or near the cornerof the property parcel. He may target only small businesses,and, in the case of a robber who must confront his victims, hemay select only businesses which have relatively few em-ployees.
Property size (in square feet), monthly rent, tax value, andmonition code are all fields captured on the license file datatables of most modern GIS databases for cadastral, assesso-rial, and other governmental factors. Therefore, from the com-plete business license file, the analyst selects as possible tar-gets for the next attack those businesses which share thesetraits within the accepted ranges. This list will be pared downnow to arrive at our list of likely targets.
Spatial Factors:
The analyst next must compare the known targets of the se-ries to many different sets of geographic data, searching forcorrelations; these include:
� Schools� Public buildings (libraries and government in-
stitutions)� Police substations� Bus stops and routes� Post offices� Apartment complexes� Zoning areas� Land use areas
Although it is impossible to prove a causal link between thesespatial and non-spatial factors, any apparently non-spuriousstatistical correlation between them leads the analyst to se-lect from his target list those target sites fitting the param-eters of the already-stricken businesses, and those which sharesimilar spatial neighborhoods with previous targets.
These may then be assigned threat-assessment levels deter-mined by the degree of commonality with the known targetsof the series, which are then added to their spatial proximityto the predicted areas of the next attack to prioritize their risk.The top sites can now be selected for directed patrols.
Offender Identification
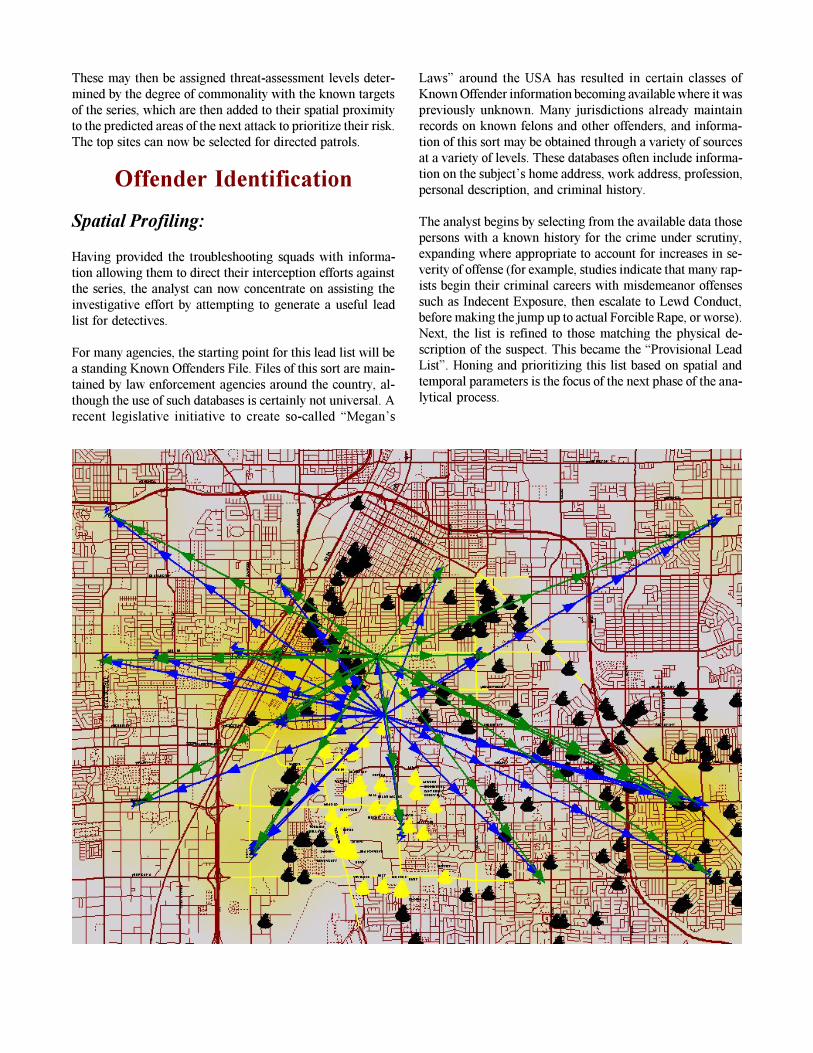
Spatial Profiling:
Having provided the troubleshooting squads with informa-tion allowing them to direct their interception efforts againstthe series, the analyst can now concentrate on assisting theinvestigative effort by attempting to generate a useful leadlist for detectives.
For many agencies, the starting point for this lead list will bea standing Known Offenders File. Files of this sort are main-tained by law enforcement agencies around the country, al-though the use of such databases is certainly not universal. Arecent legislative initiative to create so-called �Megan�s
Laws� around the USA has resulted in certain classes ofKnown Offender information becoming available where it waspreviously unknown. Many jurisdictions already maintainrecords on known felons and other offenders, and informa-tion of this sort may be obtained through a variety of sourcesat a variety of levels. These databases often include informa-tion on the subject�s home address, work address, profession,personal description, and criminal history.
The analyst begins by selecting from the available data thosepersons with a known history for the crime under scrutiny,expanding where appropriate to account for increases in se-verity of offense (for example, studies indicate that many rap-ists begin their criminal careers with misdemeanor offensessuch as Indecent Exposure, then escalate to Lewd Conduct,before making the jump up to actual Forcible Rape, or worse).Next, the list is refined to those matching the physical de-scription of the suspect. This became the �Provisional LeadList�. Honing and prioritizing this list based on spatial andtemporal parameters is the focus of the next phase of the ana-lytical process.
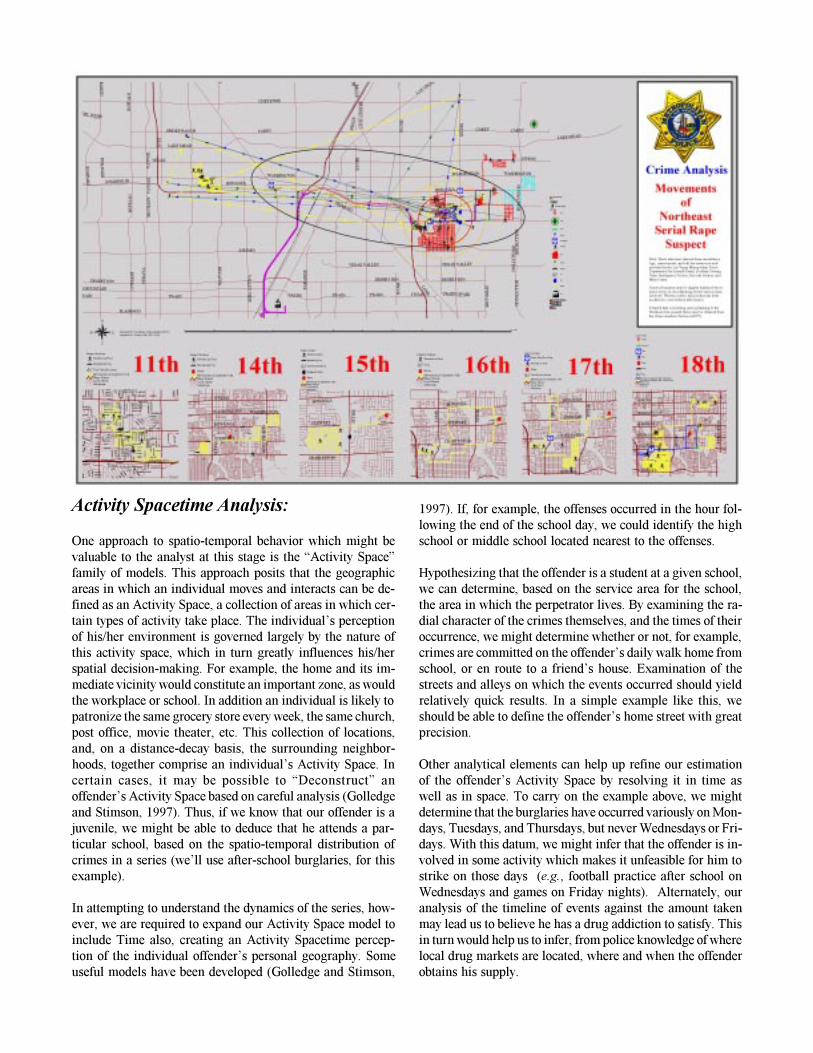
Activity Spacetime Analysis:
One approach to spatio-temporal behavior which might bevaluable to the analyst at this stage is the �Activity Space�family of models. This approach posits that the geographicareas in which an individual moves and interacts can be de-fined as an Activity Space, a collection of areas in which cer-tain types of activity take place. The individual�s perceptionof his/her environment is governed largely by the nature ofthis activity space, which in turn greatly influences his/herspatial decision-making. For example, the home and its im-mediate vicinity would constitute an important zone, as wouldthe workplace or school. In addition an individual is likely topatronize the same grocery store every week, the same church,post office, movie theater, etc. This collection of locations,and, on a distance-decay basis, the surrounding neighbor-hoods, together comprise an individual�s Activity Space. Incertain cases, it may be possible to �Deconstruct� anoffender�s Activity Space based on careful analysis (Golledgeand Stimson, 1997). Thus, if we know that our offender is ajuvenile, we might be able to deduce that he attends a par-ticular school, based on the spatio-temporal distribution ofcrimes in a series (we�ll use after-school burglaries, for thisexample).
In attempting to understand the dynamics of the series, how-ever, we are required to expand our Activity Space model toinclude Time also, creating an Activity Spacetime percep-tion of the individual offender�s personal geography. Someuseful models have been developed (Golledge and Stimson,
1997). If, for example, the offenses occurred in the hour fol-lowing the end of the school day, we could identify the highschool or middle school located nearest to the offenses.
Hypothesizing that the offender is a student at a given school,we can determine, based on the service area for the school,the area in which the perpetrator lives. By examining the ra-dial character of the crimes themselves, and the times of theiroccurrence, we might determine whether or not, for example,crimes are committed on the offender�s daily walk home fromschool, or en route to a friend�s house. Examination of thestreets and alleys on which the events occurred should yieldrelatively quick results. In a simple example like this, weshould be able to define the offender�s home street with greatprecision.
Other analytical elements can help up refine our estimationof the offender�s Activity Space by resolving it in time aswell as in space. To carry on the example above, we mightdetermine that the burglaries have occurred variously on Mon-days, Tuesdays, and Thursdays, but never Wednesdays or Fri-days. With this datum, we might infer that the offender is in-volved in some activity which makes it unfeasible for him tostrike on those days (e.g., football practice after school onWednesdays and games on Friday nights). Alternately, ouranalysis of the timeline of events against the amount takenmay lead us to believe he has a drug addiction to satisfy. Thisin turn would help us to infer, from police knowledge of wherelocal drug markets are located, where and when the offenderobtains his supply.
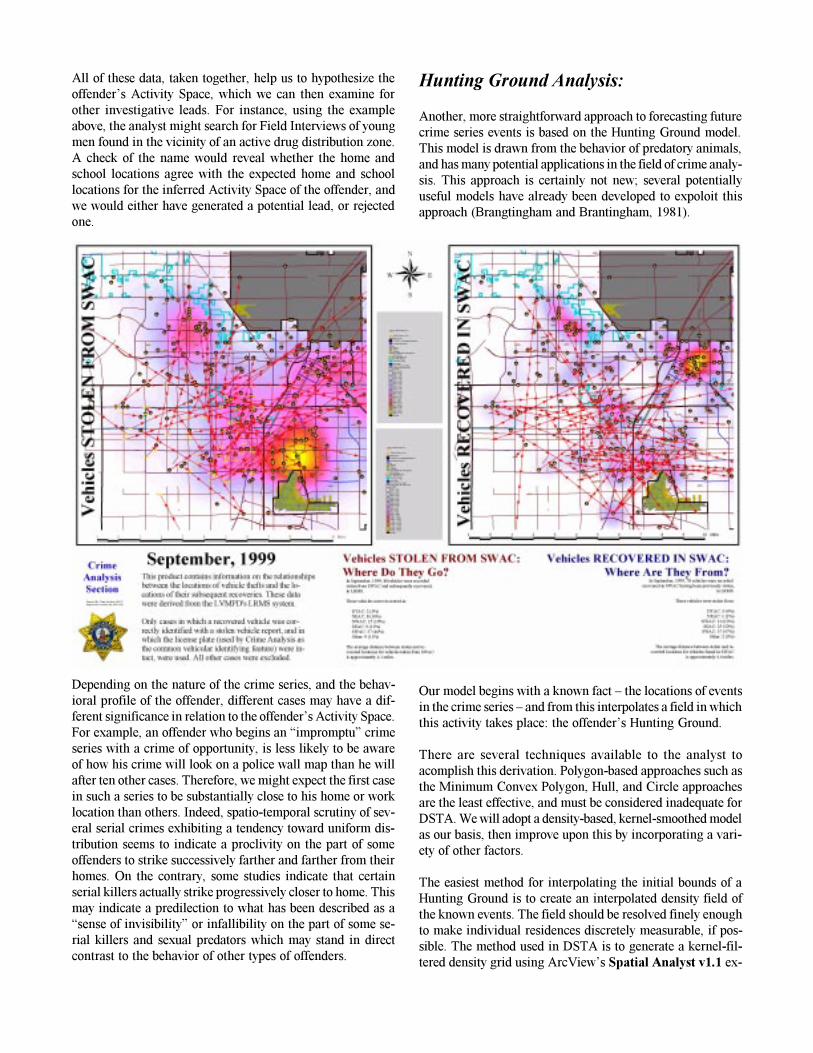
All of these data, taken together, help us to hypothesize theoffender�s Activity Space, which we can then examine forother investigative leads. For instance, using the exampleabove, the analyst might search for Field Interviews of youngmen found in the vicinity of an active drug distribution zone.A check of the name would reveal whether the home andschool locations agree with the expected home and schoollocations for the inferred Activity Space of the offender, andwe would either have generated a potential lead, or rejectedone.
Depending on the nature of the crime series, and the behav-ioral profile of the offender, different cases may have a dif-ferent significance in relation to the offender�s Activity Space.For example, an offender who begins an �impromptu� crimeseries with a crime of opportunity, is less likely to be awareof how his crime will look on a police wall map than he willafter ten other cases. Therefore, we might expect the first casein such a series to be substantially close to his home or worklocation than others. Indeed, spatio-temporal scrutiny of sev-eral serial crimes exhibiting a tendency toward uniform dis-tribution seems to indicate a proclivity on the part of someoffenders to strike successively farther and farther from theirhomes. On the contrary, some studies indicate that certainserial killers actually strike progressively closer to home. Thismay indicate a predilection to what has been described as a�sense of invisibility� or infallibility on the part of some se-rial killers and sexual predators which may stand in directcontrast to the behavior of other types of offenders.
Hunting Ground Analysis:
Another, more straightforward approach to forecasting futurecrime series events is based on the Hunting Ground model.This model is drawn from the behavior of predatory animals,and has many potential applications in the field of crime analy-sis. This approach is certainly not new; several potentiallyuseful models have already been developed to expoloit thisapproach (Brangtingham and Brantingham, 1981).
Our model begins with a known fact � the locations of eventsin the crime series � and from this interpolates a field in whichthis activity takes place: the offender�s Hunting Ground.
There are several techniques available to the analyst toacomplish this derivation. Polygon-based approaches such asthe Minimum Convex Polygon, Hull, and Circle approachesare the least effective, and must be considered inadequate forDSTA. We will adopt a density-based, kernel-smoothed modelas our basis, then improve upon this by incorporating a vari-ety of other factors.
The easiest method for interpolating the initial bounds of aHunting Ground is to create an interpolated density field ofthe known events. The field should be resolved finely enoughto make individual residences discretely measurable, if pos-sible. The method used in DSTA is to generate a kernel-fil-tered density grid using ArcView�s Spatial Analyst v1.1 ex-
tension, with a grid size of approximately 50 square feet (con-forming to a typical residential parcel size), and using a searchradius parameter equal to the mean distance between cases.This results in a very smoothed, fairly amorphous gradientfrom which any number of contour-line boundaries can beextracted. Density values greater than the mean density ofthe gradient range are typically used to define the perimeterof the Hunting Ground.
This simple approach, however, can be improved upon byincorporating a variety of other factors into the interpolationof the field.
In the wild, predators will make attacks in certain areas. Thesewill be places where their advantages over the victim are mul-tiplied, the advantages of the victim are minimized, and wherevictims may be found in adequate sufficiency. Forexample, a predator which kills by sudden ambushwill prefer a hunting ground of dense vegetation,while one which kills by pursuit will prefer a broad,open expanse without obstacles. Prey will be con-strained to follow game paths, and avoid rockyslopes; they will be forced to visit watering holesregularly. Therefore, where the Activity Spaces ofthe prey overlap the preferred killing terrain of thepredator, attacks will be concentrated. This is a su-perior definition of a Hunting Ground to a simpledensity grid of known attacks.
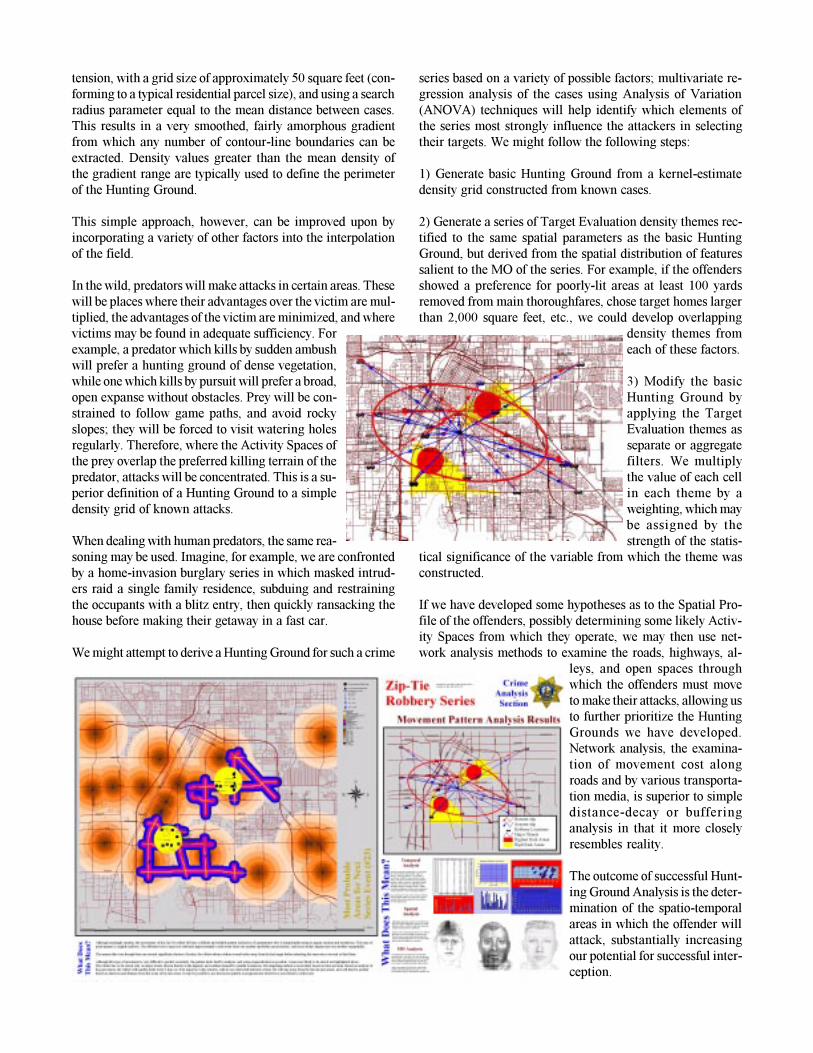
When dealing with human predators, the same rea-soning may be used. Imagine, for example, we are confrontedby a home-invasion burglary series in which masked intrud-ers raid a single family residence, subduing and restrainingthe occupants with a blitz entry, then quickly ransacking thehouse before making their getaway in a fast car.
We might attempt to derive a Hunting Ground for such a crime
series based on a variety of possible factors; multivariate re-gression analysis of the cases using Analysis of Variation(ANOVA) techniques will help identify which elements ofthe series most strongly influence the attackers in selectingtheir targets. We might follow the following steps:
1) Generate basic Hunting Ground from a kernel-estimatedensity grid constructed from known cases.
2) Generate a series of Target Evaluation density themes rec-tified to the same spatial parameters as the basic HuntingGround, but derived from the spatial distribution of featuressalient to the MO of the series. For example, if the offendersshowed a preference for poorly-lit areas at least 100 yardsremoved from main thoroughfares, chose target homes largerthan 2,000 square feet, etc., we could develop overlapping
density themes fromeach of these factors.
3) Modify the basicHunting Ground byapplying the TargetEvaluation themes asseparate or aggregatefilters. We multiplythe value of each cellin each theme by aweighting, which maybe assigned by thestrength of the statis-
tical significance of the variable from which the theme wasconstructed.
If we have developed some hypotheses as to the Spatial Pro-file of the offenders, possibly determining some likely Activ-ity Spaces from which they operate, we may then use net-work analysis methods to examine the roads, highways, al-
leys, and open spaces throughwhich the offenders must moveto make their attacks, allowing usto further prioritize the HuntingGrounds we have developed.Network analysis, the examina-tion of movement cost alongroads and by various transporta-tion media, is superior to simpledistance-decay or bufferinganalysis in that it more closelyresembles reality.
The outcome of successful Hunt-ing Ground Analysis is the deter-mination of the spatio-temporalareas in which the offender willattack, substantially increasingour potential for successful inter-ception.
Target Hardening
Community Awareness:
Of the three areas in which Tactical Crime Analysis can serveto conclude this series, two have been dealt with, to wit: Se-ries Interception (by stationing officers at interception pointsexposed by sequential prognostication) and Investigative Sup-port (by providing detectives with a prioritized Lead List oflikely perpetrators). The remaining area is Target Hardening,or making the victims less susceptible to the crime series.
General Target Hardening is effected by notifying the lo-cal media of the series and allowing them to publish informa-tion which will increase public awareness of the problem.
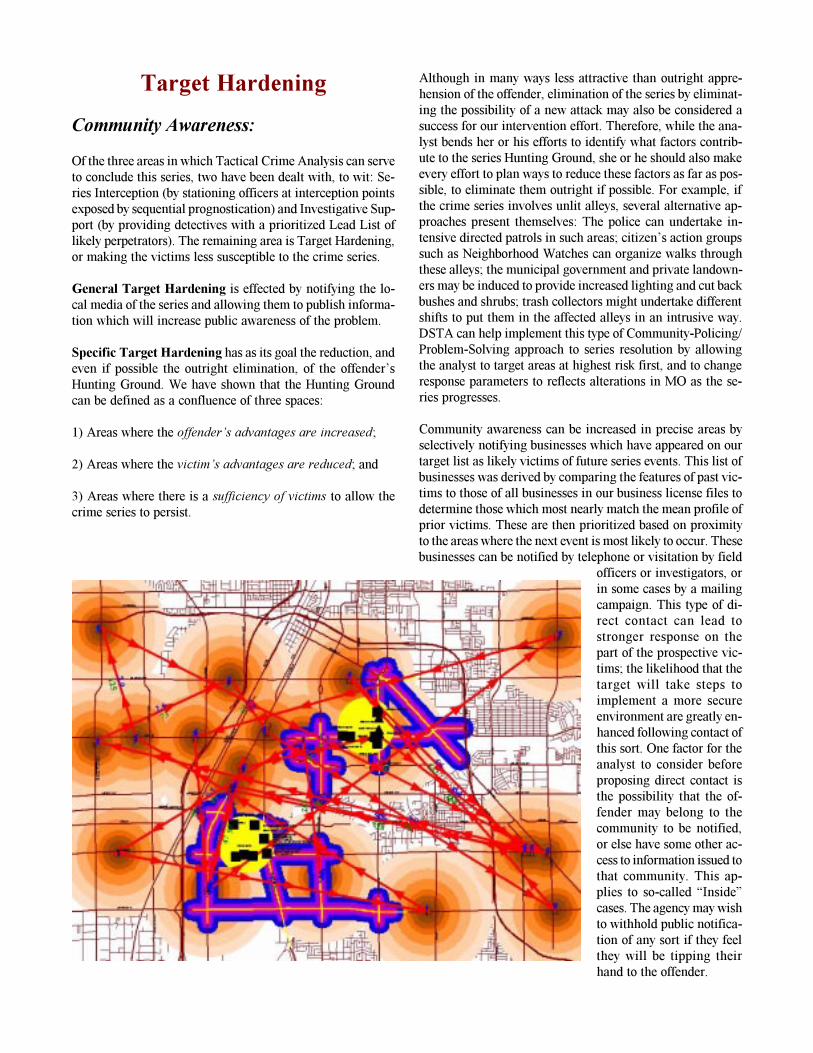
Specific Target Hardening has as its goal the reduction, andeven if possible the outright elimination, of the offender�sHunting Ground. We have shown that the Hunting Groundcan be defined as a confluence of three spaces:
1) Areas where the offender�s advantages are increased;
2) Areas where the victim�s advantages are reduced; and
3) Areas where there is a sufficiency of victims to allow thecrime series to persist.
Although in many ways less attractive than outright appre-hension of the offender, elimination of the series by eliminat-ing the possibility of a new attack may also be considered asuccess for our intervention effort. Therefore, while the ana-lyst bends her or his efforts to identify what factors contrib-ute to the series Hunting Ground, she or he should also makeevery effort to plan ways to reduce these factors as far as pos-sible, to eliminate them outright if possible. For example, ifthe crime series involves unlit alleys, several alternative ap-proaches present themselves: The police can undertake in-tensive directed patrols in such areas; citizen�s action groupssuch as Neighborhood Watches can organize walks throughthese alleys; the municipal government and private landown-ers may be induced to provide increased lighting and cut backbushes and shrubs; trash collectors might undertake differentshifts to put them in the affected alleys in an intrusive way.DSTA can help implement this type of Community-Policing/Problem-Solving approach to series resolution by allowingthe analyst to target areas at highest risk first, and to changeresponse parameters to reflects alterations in MO as the se-ries progresses.
Community awareness can be increased in precise areas byselectively notifying businesses which have appeared on ourtarget list as likely victims of future series events. This list ofbusinesses was derived by comparing the features of past vic-tims to those of all businesses in our business license files todetermine those which most nearly match the mean profile ofprior victims. These are then prioritized based on proximityto the areas where the next event is most likely to occur. Thesebusinesses can be notified by telephone or visitation by field
officers or investigators, orin some cases by a mailingcampaign. This type of di-rect contact can lead tostronger response on thepart of the prospective vic-tims; the likelihood that thetarget will take steps toimplement a more secureenvironment are greatly en-hanced following contact ofthis sort. One factor for theanalyst to consider beforeproposing direct contact isthe possibility that the of-fender may belong to thecommunity to be notified,or else have some other ac-cess to information issued tothat community. This ap-plies to so-called �Inside�cases. The agency may wishto withhold public notifica-tion of any sort if they feelthey will be tipping theirhand to the offender.
Directed Patrol Activities:
Officers can be directed to make a special effort to conductField Interviews, Traffic Stops, and routine surveillance inthe vicinity of projected target areas. As with communityawareness measures, the agency must balance the increasedlikelihood of a �Lucky Hit� against the danger of tipping theirhand. If the department is preparing to conduct a massive re-sponse or a serious intelligence/surveillance operation in thevicinity, the sight of hundreds of marked vehicles conductingsaturation-level patrols could well destroy whatever chancesuch a plan has for success.
Decoy and Bait Operations:
A final approach to target hardening can be achieved throughdecoy/bait operations. This involves situating undercover per-sonnel, surveillance devices, or bait objects like �trap cars�at selected target locations. Once again, the prioritized targetlist is an invaluable resource in planning this type of activity.
Overview of DSTA in Action
Summary:
At the beginning of this paper, we presented three goals forour analysis, which taken together could be said to representthe tactical products with the highest probability of resultingin a successful resolution to our crime series. These were:
1 Identify Suspect Lead List2 Target Hardening3 Intercept Next Series Event
We have also examined how Dynamic Spatio-TemporalAnalysis can be used to materially assist in the developmentof these products, to the benefit of law enforcement efforts toeliminate crime series.
Practice:
Many professional readers who have followed this discus-sion diligently up to this point will still feel incapable of in-corporating DSTA into their suite of Tactical Analysis tech-niques. For the most part, this will be due to the unfamiliarityof many �practicing� professionals in the Crime Analysiscommunity with developments initiated by the �academic�community. In the real world, however, it is not particularlydifficult to translate the methodological outlines presentedhere as an academic document into immediate practice.
This paper has been written to provide a concise overview ofthe process of Dynamic Spatio-Temporal Analysis as devel-oped at the Las Vegas Metropolitan Police Department. As
an academic summary document, there has been much dis-cussion of principles and doctrine, but little substance in theway of empirical method. Very little mention has been madeof specific software programs, point-and-click or step-by-stepmethodology, because this is a general document, and the tech-niques outlined here are intended to be non-specific towardplatform, software, data environment, or unit structure. It isexpected that they can be adapted to one degree or anotherfor use in nearly any law enforcement agency.
Law enforcement professionals interested in obtaining cop-ies of the Practical Methodology developed by the author,which is tailored toward very specific hardware, software,and data environments, and contains step-by-step guidelinesfor performing every stage of the processes outlined here, maycontact the author. The techniques which have been adaptedfor Dynamic Spatio-Temporal Analysis are borrowed from abroad variety of disciplines, including Wildlife and GameManagement, Meteorology, Signal Analysis, Satellite Imag-ery Analysis, Data Telemetry Interception, Economic Fore-casting, Flood Control, Antarctic Glaciology, and others.
At this point, it�s important to clearly recapitulate what our�prediction� actually requires in order to work:
� We�re attempting to intercept a pattern; therefore,there must actually be a pattern
� The analyst must accurately isolate all the elements,temporal and spatial, that define the pattern
� The offender must adhere to his pattern
As anyone working in law enforcement is well aware, minorchaotic changes in environment or the offender�s life can com-pletely distort any attempts to predict his behavior. Guessesabout where and when the offender might strike might be com-pletely reasonable, yet fail because the perpetrator catches acold that week; or has final exams in school; his girlfriendmoves in; he sees a news story about his crimes and growsalarmed at police response; his demand note gets eaten by hisdog or his flashlight batteries wear out � any of literally hun-dreds of thousands of imponderable factors can intervene.Several famous case predictions by federal and local law en-forcement analysts have been spoiled when the offendercatches the flu and stays in bed rather than making an attack,or he calls off an attack when the business he has targetedunexpectedly burns to the ground the night before. It is there-fore important for the analyst to maintain her or his credibil-ity by articulating the fallible nature of crime series predic-tion, even while standing up for the validity of the predictionitself.
DSTA is not purported to be a self-sufficient method for dis-posing of crime series; rather, it is presented as a homogenousgroup of techniques which, taken together, may be used toprovide a useful and powerful suite of tools in the kit of thesuccessful Tactical Crime Analyst. Further study and devel-opment continues.

References
Published Resources:
Bailey, Trevor; and Gatrell, Anthony (1995) Interactive Spa-tial Data Analysis. Longman Scientific & Technical Publish-ing.
Block, Rebecca; Dabdoub, Margaret; and Fregley, Suzanne(1995) Crime Analysis Through Computer Mapping. PoliceExecutive Research Forum.
Brantingham, P. L.; Brantignham, P. J. (1981) Environmen-tal Criminology. Sage.
Brantingham, P. L.; Brantignham, P. J. (1984) Patterns inCrime. MacMillan Press.
Burgess, Allen; Burgess, Ann; Douglass, John; and Ressler,Robert (1992) Crime Classification Manual. Jossey-Bass.
Burgess, Ann; Douglass, John; and Ressler, Robert (1988)Sexual Homicide. Lexington Books.
Golledge, Reginald; and Stimson, Robert (1997) Spatial Be-havior. The Guilford Press.
National Center for the Analysis of Violent Crime (NCAVC� Various Authors) (1993) Deviant and Criminal Sexuality.Federal Bureau of Investigation.
Rossmo, Kim (1993) Target Patterns of Serial Murderers:A Methodological Model. American Journal of Criminal Jus-tice 17(2).
Smith, Steven (1997) The Scientist and Engineer�s Guide toDigital Signal Processing. California Technical Publishing.
Internet Resources:
Agung, Anak (1997) Crime Hotspot and Dynamic Pin Map.1997 ESRI User�s Conference XVII Proceedings. http://www.esri.com/library/userconf/proc99/proceed/abstracts/a889.htm.
Brown, Donald (1999) A New Approach to Spatial-Tem-poral Criminal Event Prediction. 1999 ESRI User�s Con-ference XIX Proceedings. http://www.esri.com/library/userconf/proc99/proceed/abstracts/a889.htm.
Guha, R.V.; and Levy, Alon (1990) A Relevance-Based Meta-Level. http://www.cyc.com/tech-reports/act-cyc-040-90/act-cyc-040-90.html.
Helms, Dan (1996) ATAC For Analysts: Series Breaking.Bair Software, Research & Consulting. http://www.bairsoftware.com.
Lavigne, Nancy; and Mamalian, Cynthia (1999) The Use ofComputerized Crime mapping by Law Enforcement: Sur-vey Results (Preview). National Institute of Justice Studies.http://www.ncjrs.org/txtfiles1/fs000237.txt.
Silver, Steven (1998) Hydrologic Model Development andWater Resource Administration Within an ArcView GISEnvironment. 1998 ESRI User�s Conference XVIII Proceed-ings.