Embed Size (px)
Citation preview

The use of forensic science involume crime investigations:
a review of the researchliterature
Home Office Online Report 43/05
Sarah-Anne BradburyAndy Feist
The views expressed in this report are those of the authors, not necessarily those of the Home Office(nor do they reflect Government policy).

The use of forensic science in volume crime investigations: a review of the research literature
Sarah-Anne Bradbury Andy Feist Online Report 43/05

ii
Acknowledgements
Many people helped contribute to the preparation of this study. In particular we would like to thank Mark Bangs who worked on the earlier stages of the project. Joy Curwen, Forensic Science Service, as well as individual force Scientific Support Managers, kindly submitted research studies for inclusion. Professor John Burrows and Professor Nick Tilley also assisted with the identification of key studies in the scoping stage. We would like to thank Robin Williams, University of Durham, for acting as the external assessor for this study. Sarah-Anne Bradbury, Andy Feist Sarah-Anne Bradbury and Andy Feist are members of RDS (Crime Reduction and Community Safety Group).

iii
Contents Acknowledgements ii Executive summary v 1. Background and method 1 Objectives of the study 1 Method 2 Approaches to forensic research 5 Structure of the report 6 2. Overview of the contribution of forensic science to police investigations 8 The contribution of forensics to the detection of crime 8 Physical evidence as corroborative evidence, a means for identifying suspects, or as an intelligence tool? 9 Accessing the actual contribution of physical evidence to the detection
of volume crime cases 10 Summary 12
3. Call handling and initial response 13 Call handlers 13 Who attends crime scenes to retrieve physical evidence? 13 Decision-making about which scenes to attend 14 Screening for attendance, officer discretion and forensic awareness 15 Overall patterns of scene attendance by CSEs 17 Summary 20 4. Information and evidence gathering (1): up to the point of submission 21 The role that crime scene examiners perform 21 Rates of retrieval for physical evidence 22 Factors influencing the retrieval of forensic information 25 Submission of crime scene samples for analysis 30 Summary 33 5. Information and evidence gathering (2): post-submission 36 Achieving identifications 36 Summary 44 6. Suspect handling 46 Summary 48 7. The post-identification investigation: converting identifications into detections 49 The relationship between matches and detections 50 Identifications that do not yield detections 53 Timeliness 56 Summary 57 8. Overall attrition and the contribution of forensics to convictions 58

iv
The use of forensic evidence at court 61 Summary 67 9. Awareness and communication 68 Attitudes and communications between CSEs and investigating officers 69 Summary 70 10. Summary and conclusions 71 Initial response and crime scene attendance 72 Retrieval of forensic material 72 Submissions and identifications 74 Suspect handling 74 Converting identifications to detections 74 Overall attrition and conviction 75 Communication and integration 75 Crime reduction impacts and cost effectiveness 76 Where the evidence base can be further developed 77 Appendix 1. Search terms 78 Appendix 2. Selected studies (summaries) 80 References 88

v
Executive summary The use of forensic science techniques has traditionally been concentrated on more serious crimes such as rape and homicide. Increasingly, however, forensic techniques are being used routinely to aid the investigation of volume crimes such as burglary and vehicle crime. The current study aims to draw together UK and international social reseach on the application of forensic techniques to volume crime investigations. The main objectives of the review were to: • identify the mechanisms by which forensic science is applied to the investigation of volume
crime; • identify the strengths and weaknesses of the use of forensics in the investigation of volume
crime; and, • identify the way in which forensic science contributes to the effective and efficient detection
(and conviction) of crime. Overview of the contribution of forensic science to police investigations A number of general themes emerge from the research literature in terms of the overall contribution that forensics makes to crime detection.
• The proportion of volume crime offences detected through the use of forensic evidence has, historically, been low (less than 10 per cent of all detections). However, the growth of automated searching, alongside new forensic techniques such as DNA, and initiatives to improve attendance rates have increased the proportion of volume crime offences detected using forensic evidence. In the UK, it is estimated that, for directly detected volume crimes, the main evidence securing the detection was forensic in more than one quarter of cases.
• Traditionally forensic evidence has been used principally to ‘corroborate’ evidence
against known offenders; increasingly, however, forensic material is being used in a way that identifies unknown offenders.
• The presence of forensic material greatly increases the odds of detection where other
types of evidence are not available. Overall, therefore, forensic material makes the greatest contribution to detecting harder-to-solve crimes.
Initial response and crime scene attendance • The use of dedicated Crime Scene Examiners (CSEs) is not universal. In the US,
responsibility for collecting forensic evidence from crime scenes is often shared amongst CSEs, investigators or patrol officers. Policies about the deployment of CSEs range from blanket attendance for certain crime types, to discretionary attendance on the basis of information provided to a call taker, or by first attending officers (FAOs). In England and Wales, burglary dwelling attendance rates are generally high1, while a smaller proportion of vehicle crime offences are attended.
• For offences where attendance is discretionary, decisions to send a CSE will be
influenced primarily by the potential to recover forensic material and the perceived seriousness of the offence. Research into FAO decision-making over scene attendance
1 Currently estimated to be around 85 per cent (2004/05).
vi
has highlighted potential weaknesses in this method of CSE deployment, especially low levels of forensic awareness amongst FAOs. Even where mandatory attendance policies exist, the actual pattern of attendance may fall below what is expected either due to poor communication or the reluctance of patrol officers to be directed to meet mandatory instructions for CSE attendance.
• A recurring theme in this aspect of forensic activity is that of police force variations in
crime scene attendance rates (even allowing for similar crime types). Resourcing and geography have been identified as important factors in determining levels of CSE visits. One study of forensic performance in English and Welsh forces noted that, while the greater number of CSEs per recorded crime was generally associated with higher proportions of all scenes attended, not all forces conformed to the expected pattern. Other factors might limit attendance levels (e.g. less densely populated rural forces entailing greater distances between scene visits).
The retrieval of forensic material
• Only one study was identified that had involved observing what crime scene examiners do at scenes, and how they fit into the broader investigative process. In the US police department studied, CSEs were found to be disjointed members of an investigative team, fitting uncomfortably into the more rank-based structure of mainstream policing. The work of individual CSEs was poorly quality controlled: investigation reports, the main assessment tool for individual CSE performance, were found to be rarely reviewed. Victims’ perceptions of the service provided by the CSE were generally positive and this was generally acknowledged by CSEs themselves as an important part of their wider role. Other studies have, however, found victims to be critical of ill-considered CSE examinations.
• The initial screening of offences for forensic examination makes it hard to establish
genuine base rates for the potential to retrieve forensic material from crime scenes. A study which involved attendance by forensic specialists at unscreened major felony crime scenes found that fingermarks were present at similar proportions of burglary dwelling and vehicle crimes (41%), and 45 per cent of non-residential burglaries. The failure of scenes to yield physical evidence was usually due to scenes being cleaned prior to CSE attendance, inaccessible scenes, or minimal disturbance by the offender.
• Most studies of forensic retrieval rates at burglaries have consistently identified fingermarks as the most frequently retrieved contact trace material, with typically just under one in three residential burglary scenes attended resulting in the retrieval of fingerprints. Data on English and Welsh retrieval rates put DNA retrieval at ten per cent of all scenes visited (similar to shoemarks, although these recorded a greater variation between forces). Relatively high retrieval rates per crime scene visited are generally associated with crimes which are more frequently subjected to selective CSE attendance (screening), such as vehicle crime. Retrieval rates for offences receiving high levels of attendance (such as burglary dwelling) are, by comparison, generally lower.
• Even when comparing rates for particular material within particular crime types, marked area by area variations in retrieval rates are a common finding. Factors influencing retrieval rates over which the police have influence include the quality of initial advice on preservation; the resources available to examine scenes; the overall demand put on those resources (usually measured in workload), and policies in relation to forensic attendance.
• Attempts to explore the statistical relationship between attendance rates and retrieval rates (per scene visited), within particular crime types, have generally failed to find a clear relationship between the two. An analysis of force attendance rates and retrieval rates
vii
per scene visited (DNA) for burglary dwelling in English forces revealed a poor correlation. In a more limited study in three US forces, it was found that high attendance rates could result in relatively high recovery rates for fingermarks. An evaluation of an Australian police operation to increase the proportion of volume crime scenes visited by CSEs, did not generally find an improvement in key outcome measures (including retrieval rates). However, the authors argued for caution in interpreting these findings, due to weaknesses in the original intervention and some of the underpinning assumptions.
• In summary, the findings from these studies suggest that high attendance rates do not
appear to be an impediment to high retrieval rates per scene visited. By the same token, low attendance rates do not appear to be a necessary guarantee of high retrieval rates per scene visited. A range of other factors, such as how scenes that receive a visit are selected, the ability of individual CSEs, the speed of response, resourcing and communication/integration with police officers, are all likely to be important influences on retrieval rates.
• Explorations of the relationship between resources and retrieval rates indicate that
greater resources do not necessarily generate higher retrieval rates across similar crime types, This suggests that factors such as the degree of integration and communication between police and scientific support appeared to be important in determining retrieval rates.
Submissions of forensic material and identifications
• Research tracks a marked change in the process by which identifications are made using forensic material. Before automated searching, most fingerprint identifications arose from searches of the database requested by detectives against named suspects (so called request searches). Cold searches (those involving large scale manual searching of fingerprint files) were rarely undertaken. The most important factor influencing performance in forensic detections was the inclination of detectives to request searches of fingerprint databases. Automation of searching techniques was therefore identified as the critical barrier to better performance in forensic identifications.
• Although the development of automated fingerprint recognition systems has made the
process of comparing scene and offender prints, simpler, faster and generally more effective, US studies reviewed suggest that automation does not guarantee improvements in forensic identifications. The contrasting results of two evaluations of the introduction of automatic fingerprint systems in the US (Minnesota and Kentucky) illustrate the point. Minnesota was generally seen as effective in generating additional fingerprint detections, whereas the benefits in Kentucky were marginal. In the latter, a combination of a lack of evidence technicians, the reluctance of patrol officers to retrieve fingerprints, and their failure to submit them when they were retrieved, all conspired to produce a very modest improvement in fingerprint identification performance through automation.
• The increasing use of cold searching techniques against computer databases holding
fingerprint, DNA and footwear mark data means that forensic material can increasingly be used to generate first links to offenders. Indeed, a relatively recent study of DNA hits revealed that it identified the suspect (rather than simply corroborating involvement) in seven in ten cases. This illustrates just how far the balance has shifted in England and Wales from corroborative to inceptive applications of forensic material.
• A study in one English force found that the factors most associated with achieving a
forensic identification from a scene visit were exhibits retrieved (the more retrieved the

viii
higher the likelihood of a match), the nature of the offence, and the individual CSE in attendance. Analysis of individual CSE performance found marked variations in terms of their DNA matches/fingerprint identifications per scene visit, likely to be a consequence of differences in working practices between individuals.
Converting forensic identifications to detections
• Getting an identification from a forensic database does not guarantee a detection. The largest ‘tracking’ studies of forensic identifications in England and Wales suggest that around seven in ten matches/identifications in volume crime cases lead ultimately to detections. Other studies have suggested a lower conversion rate, although they tend to rely on secondary analysis of performance indicator data that may understate the actual number of identifications or hits that result in detections. Forensic detections have, however, also been found to lead to a number of additional detections. One study has found that each detection resulting from a DNA match would yield an additional 0.4 detected crimes (through the detection of linked offences).
• The fact that a reasonably high proportion of matches fail to yield initial detections, and
more general concerns over variations in force by force performance in both fingerprint and DNA identifications, has been an area of concern. Issues around legitimate access are particularly problematic when trying to convert an identification into a detection. A detailed study of DNA matches which resulted in no further action found that more than half of the cases failed to proceed because of a lack of supporting evidence (and in particular, suspects claiming legitimate access).
Overall attrition and conviction • In terms of the contribution that forensic evidence makes to convictions, a major study
found that, overall, the conviction rate for cases with scientific evidence was not significantly higher than those without. Significant differences were found, however, once crime types were examined individually. Use of forensics in murder, burglary and theft cases revealed its greatest impact on case outcomes at court, once other factors had been controlled for. For burglary, this amounted to the presence of forensic evidence yielding an increased likelihood to convict of 17 percentage points. One other clear finding was the association between the presence of forensic evidence and longer sentence lengths.
• Several recent studies have looked at the impact of DNA evidence on the outcomes of rape and homicide cases. The general picture appears to be that, as with forensic evidence more generally, the presence of DNA evidence in a case is more likely to lead to a case being finalised in court, and increases greatly the likelihood of a jury’s decision to convict (a similar, even stronger, finding emerged for fingerprints in relation to homicides). The presence of DNA appears generally to be associated with longer sentences (although the reason why this is the case is unclear).
Communication and integration • Two principal themes emerge from the research evidence on awareness and
communication. The first is that, in general, police officer appreciation of forensic evidence is, and continues to be, inadequate. This appears to be true for patrol officers but it is also possible that a lack of understanding exists amongst some senior detectives, where one would expect familiarity with forensic processes to be more developed. The second enduring theme has been the issue of integration of forensic and policing functions. Scientific skills and policing do not co-exist naturally. Integration requires effort, and a desire to co-operate, on both parts. Where this does happen, and forensic science

ix
makes a more central contribution to both volume (and serious) crimes, the benefits in terms of a more coherent approach to problem solving and detection, and ultimately performance, are supported from the findings of several studies.
Where the evidence base can be further developed Several areas appear to represent gaps in the current evidence base and therefore worthy of future work:
• At the very start of the forensic process, the individual performance of CSEs appears to vary; exactly why individual performance differs, or what happens to detection rates if CSEs take on more of the investigative role, is still not clear.
• The poor statistical relationship between forensic attendance and retrieval rates has long
been a feature of analysis in this area. Exactly what combinations of factors contribute to higher rates of forensic retrieval (and subsequent identification) need to be more clearly identified.

1
1. Background and method In the past, the use of forensic science techniques has been largely concentrated on more serious crimes such as rape and homicide. Increasingly, however, forensic techniques are being deployed across a wider range of crime types and are more routinely being used to aid the investigation of volume crimes such as burglary, vehicle crime and robbery (HMIC, 2000). Technological developments such as the establishment of DNA databases and automated fingerprint searching systems have meant considerable changes in the way in which forensic techniques have been applied to crime investigations. These developments are not, however, sufficient in themselves to bring about wholesale change in the investigative process. For this to happen they need to be embedded within, and linked to, existing ‘human’ actions in the investigative process. The current study aims to draw together UK and international social research on the application of forensic techniques to volume crime investigations. Central to this process has been a desire to gain a better understanding of the forensic investigation process as a whole. By doing this, it is hoped that the key issues relating to the application of forensic science can be highlighted and gaps in current knowledge identified at every stage of the investigative process–from the initial reporting of a crime, through to the charging and subsequent conviction of suspects. Research reviews seek to draw together available evidence from previous studies. Systematic reviews are the gold-standard form of this type of exercise (see e.g. Cochrane Collaboration, Campbell Collaboration and ESRC Evidence Centre http://www.evidencenetwork.org for further information on systematic reviews). Although this study has adopted systematic searching techniques it does not claim to be a systematic review. This reflects the fact that this exercise has focused on assimilating knowledge on the application of forensics to volume crime in general. The review process has uncovered a significant research literature, but the ways in which forensic science is applied to the investigative process has meant that there are few studies that have applied experimental or quasi-experimental designs. Furthermore, as this study will highlight, criminal investigations are predominantly complex processes made up of a range of interlinked components. For both these reasons, investigations are arguably fundamentally different from more discrete interventions focused on public policy objectives (for instance the introduction of CCTV to reduce crime), which have been subject to more methodologically sophisticated study and systematic review. Nevertheless, the review has been organised on systematic lines consistent with a systematic review methodology. Accordingly the key stages formulated included: • the identification of a set of research questions that the review will address; • the development of a protocol to guide the review; • systematic searching for relevant information; • study selection to be based on inclusion criteria; • appraising the quality of the included literature; and • synthesising findings. Objectives of the study The overall aim of this review was to gather, summarise, and integrate social research into the application of forensic science to the investigation of volume crime. Due to the broad nature of

2
this area, a systematic review methodology was employed for the searching and retrieval of the research, and a traditional literature review methodology used for the summarising and integration of findings. It was hoped that by undertaking this review as systematically as possible, any potential biases in the review methodologies would be minimised. The main objectives of the review were: • to identify the mechanisms by which forensic science is applied to the investigation of volume
crime; • to identify the strengths and weaknesses of the use of forensics in the investigation of volume
crime; and, • to identify the way in which forensic science contributes to the effective and efficient detection
(and conviction) of crime. Method This section will outline the methods employed to search, select and appraise the studies included in the report. In addition, the limitations of the process will be discussed. The review has been produced in parallel with a similar review on overall process in volume crime investigations. Although forensics can play an important part in detecting and investigating volume crime, it was decided that there was sufficient material on this aspect of the investigative process to warrant a separate review. The broader investigative study has been produced separately (Jansson, 2005). Criteria for considering studies for this review Inclusion and exclusion criteria were defined in relation to the three principal aims of the review. Given the broad nature of the review, the inclusion criteria were initially set wide to include a range of potential studies. As a result, studies were considered for inclusion that met the following criteria:
• Studies that examined the process by which forensic techniques are applied to volume crime. Volume crime was defined as burglary (dwelling and non-dwelling), robbery, theft or and from vehicles, and less serious stranger violence.
• Studies that evaluated particular forensic processes or applications which might have an application to volume crime, regardless of the crime type focus of the study (for instance, general studies on the use of fingerprints).
In both of the above criteria, the definition of the investigative process was defined as the point up to which an offender was charged (or the most equivalent point in overseas countries) although any studies that touched on the contribution of investigations to convictions were also considered for inclusion. The searching approaches adopted led to a focus on English language studies (although foreign language studies were not excluded from the process). Published and unpublished studies were eligible for inclusion; peer reviewed and non-peer reviewed studies were eligible for inclusion. In order to focus the time span of the review, only studies published (or made available) after the start of 1970 were eligible for inclusion. Studies meeting these initial criteria were then subject to a quality assessment process. An important issue raised in the original scoping of this review was the lack of a clear appreciation of the contribution of forensics to post-charge processes and convictions. Several research studies that assessed the contribution of forensics to criminal justice outcomes were identified although a number of robust studies dealt with the contribution of forensics to the prosecution of more serious offences. Although outside the ‘volume’ crime criterion, any relevant studies that dealt with more serious offences in the post-charge phase were reviewed and are

3
summarised in the study. Finally, in the conclusion, the study also touches briefly on research into the link between forensics and crime reduction and the cost-effectiveness of forensics. It was decided that no limitations would be set in terms of the research design used. Unlike traditional systematic reviews, all studies, regardless of the research design employed, were considered. The exclusion of studies on the basis of their research design was not deemed appropriate due to the broad objectives of the review and the wide range of research approaches employed. Search strategies for the identification of relevant studies Several search strategies were used to identify studies, published or otherwise, that met the preliminary eligibility criteria. The intention was to avoid bias resulting from searches that were not comprehensive. These strategies included a keyword search of databases, searches of relevant reviews, checking of bibliographies of relevant studies, and contact with experts. The library catalogues listed below were searched; these cover a wide range of publications and research, including grey (unpublished) literature.
• The Centrex Library, Bramshill. • The Home Office Library. • The British Library. • The London School of Economics Library. • The Forensic Science Service.
The following nine databases were searched.
• Criminal Justice Abstracts. • Sociological Abstracts. • Ingenta Services (through the Bath Information and Data Service, BIDS). • BIDS IBSS (International Bibliography of the Social Sciences). • PsychINFO (Psychology Information). • Institute for Scientific Information (ISI) Web of Science. • SIGLE (System for Information on Grey Literature in Europe). • NCJRS (National Criminal Justice Reference Service) Abstracts. • Applied Social Sciences Indexes and Abstracts. • Public Affairs Information Services. • FORS (Forensic Science Service Bibliographic Database). • Home Office Research Development and Statistics Directorate.
Searches were also conducted using the Internet search engines: Google; MSN Search; Yahoo; and, Lycos. Particular concerns existed around a possibly extensive ‘grey’ literature in the area of forensic research. To assist in tracking this material down several experts were contacted for help in identifying and retrieving relevant research. Scientific Support Managers from every police force in Great Britain were asked to provide details of any unpublished research known to them that met our general criteria. Several individuals in the Forensic Science Service (FSS) with responsibility for social and operational research were also approached. Eight studies were identified in this way, although only four met the criteria. Search terms Searching bibliographic databases to identify the relevant research literature posed a number of particular challenges. The application of forensic science within investigations is clearly not one process but many possible processes. This means that in addition to a series of generic search

4
terms around ‘forensic evidence’ and ‘crime scenes’, there were a large number of specific technique-based terms to consider (e.g.‘footwear marks’, ‘shoemarks’, ‘fingermarks’, ‘fingerprints’ and so on). The interchangeability of these terms and subtle changes in terminology made the search strategy complicated and required the use of different terms in some databases cataloguing North American studies. A further complication was that several bibliographic databases – especially those that had a forensic science focus – predictably threw up a large number of hits, but many of these focused on the physical science elements of forensic techniques. Given the social research focus of this review, these were excluded, although the number of potential studies initially identified in this way was considerable, and it was often necessary to examine many of these abstracts to assess whether or not a journal article or report was actually within or outside the criteria. A full list of search terms and the searches is given in Appendix A. Identified research studies The eligibility of studies for inclusion in the review was determined by an examination of abstracts. In instances where the abstract was deemed to provide insufficient information to determine the eligibility of the study the full text was reviewed. Altogether 499 non-duplicate papers were identified through the systematic search process. Of these 243 full-text reports were retrieved for further reading. Of these studies 50 actually passed the inclusion criteria after more detailed assessment. More than half of excluded studies did not have a sufficient focus on the investigative process to warrant inclusion. Existing literature reviews were also excluded at this point. A breakdown of the reasons for rejecting the studies that were identified and retrieved is provided in Table 1.1. Table 1.1: Included and excluded papers N
Total number of non-duplicate papers identified 499
Number of papers meeting the inclusion criteria 50 Number of papers not meeting the inclusion criteria 449
Reasons for excluding papers: No research content 208 Focus not use of forensic science and/or volume crime investigations 163 Textbook 54 Manual 6 Unobtainable 15 Not full report 3 Where analysis and data collection has been reported in more general assessments of the police use of forensic science, these have been included. Hence, several reports by Her Majesty’s Inspectorate of Constabulary (HMIC) have been included, where appropriate. There is likely to be a bias towards English language studies and some studies which have not been translated into English will have been missed.
5
Data extraction and quality assessment Details from the studies that met the inclusion criteria were extracted using a standardised data extraction sheet and the information presented in a standardised structured table. The studies were examined to ensure that all relevant data for that study were recorded. Information was extracted on a number of themes including:
• background details, e.g. author, date, publisher, publication status and study design; • sample size and type; • research tools and methods of analysis; and, • findings and conclusions.
Each study was then assessed for methodological quality, using a quality assessment framework developed for the review. The quality assessment framework was based on frameworks used for previous systematic reviews and adapted to fit the objectives of this review. It was intended to carry out the tasks listed below. • Assess the quality of the studies depending upon the design used (e.g. surveys, outcome
evaluations, and interviews). Since there is not one design that is most appropriate to the examination of the different aspects of the investigative process, it would not have been appropriate to have given them an overall assessment based on their design. This is different to the traditional approach to systematic reviews that focuses on outcome evaluations, with a recognised hierarchy of study designs placing randomised controlled trials at the top.
• Establish objective criteria (e.g. in terms of sample size and selection of cases) to help grade studies, particularly when assessing qualitative design aspects.
• Draw a distinction between poorly reported research and poorly designed/executed/analysed research.
Each study was evaluated using the quality assessment scale. Based on the scores, it was determined whether the study should be rejected for being below acceptable quality. However, the studies were not assigned any final grades or a ranking based on quality; the aim was only to determine which studies would be rejected. Approaches to social research in the use of forensic science Research studies that have examined the use of forensic science within volume crime investigations have employed a wide range of research approaches. The research that passed the inclusion criteria varied in terms of research design, method, and outcome measures. The majority of research included was evaluative, involving interviews, surveys, secondary data analysis, and literature reviews. Generally, outcome measures employed were rates of attendance at volume crime scenes, examination, recovery and submission of forensic materials, identifications, detections, convictions and sentence length. Research also measured timeliness, forensic awareness, knowledge, attitudes, and opinions. The various studies have typically approached the area from slightly different perspectives, which can be classified broadly according to the approach taken.
• Cohort studies that track the progress of offences or cases as the progress from initial notification to the police. These studies have typically looked at part of or the whole investigative process, and included in their sample all cases that were subject to forensic assessment, or yielded forensic material. Several have contrasted the progress and outcomes of ‘forensic’ versus ‘non-forensic’ cases, while others did not include ‘non-forensic’ comparison groups.
• Evaluation-based studies. Their focus is usually on a particular type of intervention or

6
process and the consequent changes in downstream performance/detections. • Observation-based studies. Although relatively rare, several early studies did examine
the way in which crime scene examiners operated. • Attitudinal and knowledge based studies. A handful of studies have explored the extent of
forensic awareness amongst different officers and police roles, or officers’ and criminal justice practitioners’ views on the use and value of forensic evidence.
Table 1.2 gives an overview of the numbers of studies under the principal headings that were examined during this review. Table 1.2: Focus of included research
Number of studies focusing on each area
General research (to the point of charge) 21 General research (post charge) In-force evaluations National evaluations Guidance/inspections
7 12 3 4
Literature reviews 3
Structure of the report The structure of this report has been devised, where possible, to categorise and review research evidence according to the initial divisions planned within Professionalising the Investigation Process (PIP) framework, developed by the Association of Chief Police Officers (ACPO) (2002), for assessing and accrediting police officers’ investigative abilities. The chapters broadly correspond to the key stages in the investigative process identified in the framework. These significant points in the investigative process are:
• initial contact/initial response; • scene assessment; • evidence gathering – the investigation; • victim and witness management; • suspect handling; • post-charge management; and, • file preparation/trial.
Each of these key components of the investigative process is covered by a separate chapter and the current relationship between PIP stages and forensic processes has been set out schematically in Figure 1.1. However, the report begins with an examination of those studies which have attempted to assess the broader contribution of forensic science to crime investigation rather than focusing on discrete components. The penultimate chapter examines some general issues around management and communication within forensic processes. The final chapter summarises the key elements to emerge from the report.

7
Figure 1.1: Application of P
IP stages to forensic process (DN
A and fingerm
arks only)
Post-charge managem
ent File preparation / trial
Evidence gathering
Scene assessment
Initial contact/initial report
Incident occurs
Crim
e scene exam
iner attendance
Request for
crime scene
examination
First officer attendance
Initial police assessm
ent
Incident reported/initial contact C
harge
D
etection
Further investigation
Force action forensic identification
Match
notification sent to force
Fingermarks
selected for searching on N
AFIS
Fingermarks
submitted for
in-force exam
ination Forensic m
aterials recovered
Crim
e scene exam
ination D
NA sam
ple subm
itted for external exam
ination
DNA
profile loaded onto N
DN
AD
Ident notification sent to force
Decision to
proceed with
case
C
ourt C
onviction
Elim
ination ten-prints taken Elim
ination DN
A sample taken
Suspect ten-print taken S
uspect DN
A sample taken
Victim and w
itness managem
ent
Suspect handling
8
2. Overview of the contribution of forensic science to police investigations The contribution of forensics to the detection of crime Before the detailed research into the application of forensic techniques to volume crime is explored, it is useful to summarise several studies that have attempted to set the contribution of forensics to the overall process of crime investigation in a wider context. The limited amount of work that has been undertaken on criminal investigations indicates that the majority of detected cases are not solved through the use of forensic evidence. Previous reviews of the research have concluded that forensic science is central to the detection of only a minority of crimes (see for instance reviews by Peterson, Bender and Gilliland (1982), Horvath and Meesig (1996) and Jansson, 2005)). The literature on the relative contribution of different investigative techniques is not large but most of it tends to support the limited role of forensics. A useful starting point in exploring the overall contribution of forensic material is to examine cases that relied in some way upon physical evidence. As the report goes on to consider in more detail, while it is relatively straightforward to identify those cases which involve the use of physical evidence, understanding the actual contribution of forensics to detections is more complex. One of the first studies to explore the contribution of physical evidence was the RAND study in the US in the mid 1970s (Greenwood et. al. (1975), and in particular the work of Petersilia, (1978)). The general conclusions from the RAND study was that investigators do not investigate crime in a way the public is often encouraged to believe. Most crimes are detected by offenders being arrested at the scene, or by critical information gathered from eyewitnesses. If these are absent there is little chance of a detection (for a fuller summary see Jansson, 2005). The use of physical evidence to detect offences was no exception to this general rule. The study revealed that between 1.2 per cent and 1.5 per cent of all burglaries were cleared up as result of fingerprints found at crime scenes (Greenwood, op. cit.). Steer’s 1974 study of a sample of detections in the Thames Valley police area in England found very limited use of physical evidence (Steer, 1980), albeit measured on a different basis to the RAND study. Of a random sample of detected offences in the police area (n=340), only three (0.9%) were detected as a result of fingerprint searches, with no other physical evidence categories listed. From a sample of more serious detected crimes (n=99), a similar proportion was detected by fingerprint matching. In terms of detections, Coupe and Griffiths’ (1996) study of burglary investigations in England revealed that forensic techniques were used in 17 per cent of detected burglaries. However, physical evidence was perceived as essential to detection in only six per cent of ‘primary’ detections.2 Working this figure back to ‘physical evidence’ detections as a proportion of all crimes generates a proportion similar to the RAND figure cited above. There are two main drawbacks with these studies. The first is that the majority of them portray a situation which predates, by some margin in several cases, significant developments in the application of forensic techniques to volume crime. There is evidence to suggest that the proportion of ‘volume crimes detected (and first linked) by forensic evidence in England and Wales has increased; analysis undertaken by Burrows, Hopkins et al. (2005) suggests forensic evidence is the main source of evidence in securing around one quarter of primary detections of volume crimes. Secondly, few of these studies set out to assess the impact of physical evidence on volume crime cases – they simply measure, as a by-product of more general studies of 2 ‘Primary’ detections exclude those achieved through offenders admitting others offences which are taken into consideration.
9
investigations, what proportion of detections were attributable to types of physical evidence compared to other sources of information. Physical evidence as corroborative evidence, a means for identifying suspects, or as an intelligence tool? A second theme to emerge from the broader research on physical evidence and detections has been the effort to assess the particular contribution that such evidence makes to the investigative process. The joint FSS/ACPO report Using Forensic Science Effectively (ACPO/FSS 1996) classifies evidence into one of three headings: inceptive (pointing directly to an unknown offender); corroborative (tending to confirm an existing hypothesis); and mandatory (necessary to satisfy a specific legal requirement). A series of studies in the US during the 1970s showed that, apart from generally low levels of utilisation in volume crimes, physical evidence was primarily a corroborative tool (either to confirm a suspicion or eliminate a doubtful suspect). It was much less frequently used to develop suspect sets along inceptive lines. For instance, Rosenthal and Travnicek (1974) undertook a study designed to explore how to increase the utilisation of physical evidence in crime investigation and prosecution. On the basis of data collected in three study sites in the US, they concluded that while its overall usage was variable, physical evidence was used only to corroborate existing investigative conclusions. The corroborative model of the application of forensic science was identified as an international phenomenon in Horvath and Meesig’s review of the research literature (1996). Ericson’s (1981) study of detectives in Canada also noted that, while forensic materials and scientific analysis did not play a major role in investigations, it did help to convict a suspect once identified. It was particularly effective in gaining ‘leverage’ during police interviews to gain confessions. Although the situation in Japan was reversed (with confessions being corroborated by forensic evidence after the event), the general principle still applied (Miyazawa, 1992). Horvath and Meesig’s summary of the use of forensics is helpful:
Currently, detectives use physical evidence to assist in either obtaining or corroborating confessions and in collecting intelligence. Seldom is physical evidence relied upon solely for its intrinsic value in identifying or locating a suspect
(Horvath and Meesig, 1996 p.965)
Ramsay (1987) undertook the first comprehensive social research study of British forensic science practice during the 1980s. This study also clearly points to the corroborative nature of the use of forensic science in the UK at that time:
Apart from a few exceptional cases…the police turned to the FSS because their investigations needed to be deepened if they were to be sure of gaining a conviction. There were, for instance, hardly any cases where the police had identified a suspect on the basis of fingerprint marks… (Ramsay, 1987 p13)
In the vast majority of physical evidence cases examined in Ramsay’s study, a suspect had already been identified before material was sent for examination (79%, n=330). In the minority of cases submitted to FSS without a suspect, most police officers were ‘not very hopeful’ that crucial evidence would emerge. Although the corroborative model is still central to the way in which forensic techniques are applied to crime investigations, this description is now far less appropriately applied to forensic science, particularly within a UK context. The development of techniques such as DNA sampling, in conjunction with initiatives such as the National DNA Database and DNA Expansion Programme, alongside the greater use of automated searching (e.g. for fingermarks), have shifted this balance towards greater use of forensic material to identify offenders (inceptive

10
applications) (see Burrows, Hopkins et al, op. cit.). It has also contributed to an increase in the routine application of forensic techniques to less serious crimes (the focus of this review, and covered in more detail in later chapters). Assessing the actual contribution of physical evidence to the detection of volume crime cases The review identified one study that aimed explicitly to examine the contribution that physical evidence makes to the detection of volume crime by comparing case outcomes in physical evidence/no physical evidence cases. Peterson, Mihajlovic and Gilliland (1984) undertook a major study based on the examination of 2,700 investigations drawn randomly from police and laboratory files in four US jurisdictions: cases involving physical evidence were over-sampled (1,600 cases were examined where physical evidence was collected and examined alongside 1,100 cases where physical evidence was not used). The physical evidence cases covered homicide, rape, aggravated assault, robbery and burglary; ‘no physical evidence’ cases consisted of robbery, aggravated assault and burglary only. The authors compared the clearance rates of those cases where physical evidence was retrieved and examined in the laboratory with those cases where there was no physical evidence. While controlling for other factors known to be associated with positive investigative outcomes (identification of a suspect at the outset of an investigation, availability of witness information and time between discovery of crime and police arrival), the analysis revealed that physical evidence cases generally had higher rates of clearance (than cases without). Table 2.1 presents the figures for burglary/property offences only. The general picture that emerges for burglary is that the presence of physical evidence significantly increases the likelihood of a clearance for most offences in three of the four sites. Moreover, this continues to hold true if other, traditionally important, information is absent. For instance, where no offender is in custody or named /placed at the outset of the investigation, in all but one site, the presence of physical evidence makes a highly statistically significant difference to the likelihood of a successful clearance.

11
Table 2.1: Burglary/property offences: clearances rates by physical evidence/no evidence, controlling for suspect in custody/named, time elapsed to police response and witness information provided to police at outset of investigation Clearance rates Physical
evidence Site 1 Site 2 Site 3 Site 4
Yes 93%
(***)
100% 85% 100% Suspect in custody or named and placed No
38% 93% 80% 95%
Yes 65% (***)
15% 29% (***)
56% (***)
Suspect not in custody/not named or placed No
6% 13% 4% 8%
Yes 83% (***)
64% 67% (***)
90% (**)
Time elapsed more than 10 minutes No
14% 69% 16% 48%
Yes 59% (***)
32%
23% (*)
58% (***)
Time elapsed less than 10 minutes No
7% 13% 7% 18%
Yes 94% (***)
84% 76% 93% (***)
Witness information provided to police at outset of investigation
No
21% 83% 56% 60%
Yes 33% (**)
5% 19% (**)
43% (***)
Witness information not provided No
7% 6% 3% 5%
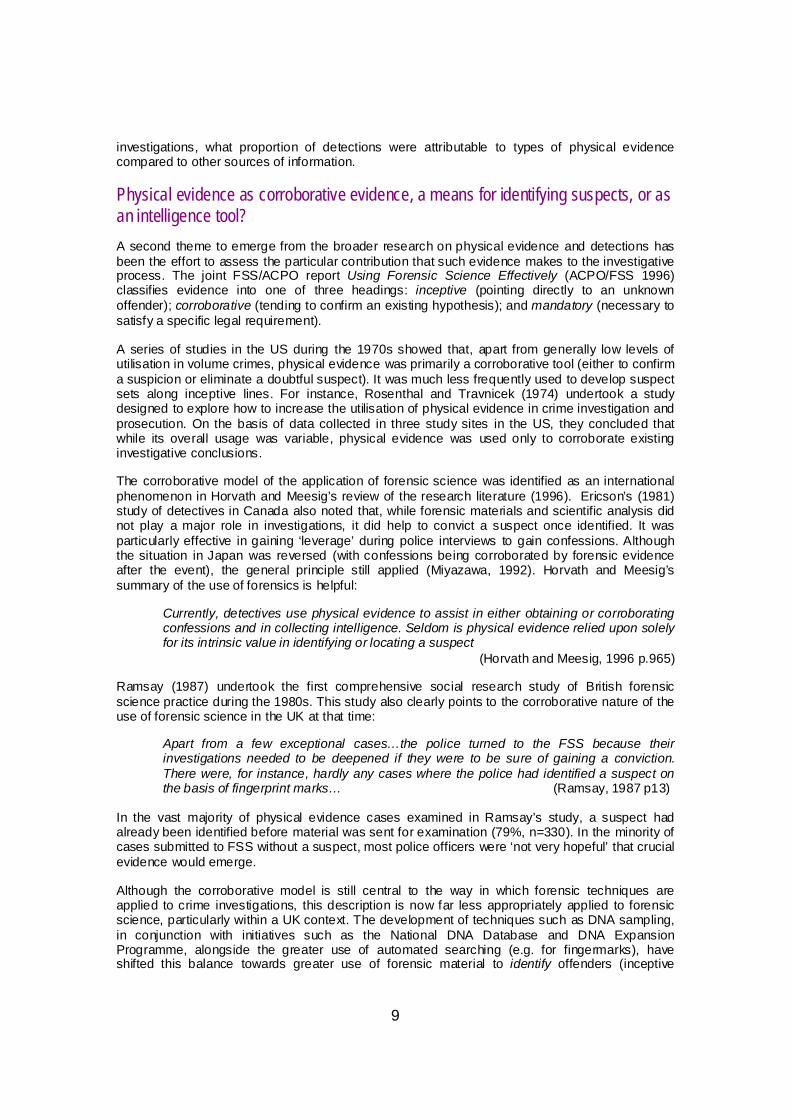
Source: Adapted from Peterson, Mihajlovic and Gilliland (1984). * p < 0.05. ** p < 0.01. *** p< 0.001. The authors go on to use log linear analysis to examine the joint effects of selected offence variables on outcome variables. This analysis presents findings in terms of the estimated effect of physical evidence on the odds of clearance (given the type of offence, location and the characteristics of the offence). For burglary cases, physical evidence has its greatest impact on clearances when a witness is located but no suspects are immediately identified or named. For two of the sites, such offences were around 19 times more likely to result in a clearance than cases without physical evidence. For robbery cases, the corresponding odds were around 17 times more likely. Even in burglaries where there was no suspect and no witness, in two of the sites, physical evidence increased the odds of a clearance eightfold. The authors conclude that in burglary and robbery cases, physical evidence makes its greatest contribution in those offences which otherwise would be least likely to be solved. Table 2.2 presents the findings from Peterson et al.’s (1984) analysis.
12
Table 2.2: Likelihood of a clearance by presence/absence of forensic evidence and other key evidence variables
Odds of a clearance when physical evidence
available over when it is not, by case type and jurisdiction
Peoria
Chicago
Kansas
City
Oakland
Robbery 5.13 0.92 3.67 5.45 Assault 0.99 0.18 2.41 1.06
No witness; no suspect
Burglary 7.86 1.41 2.38 8.34 Robbery 17.36 0.96 2.45 17.71 Assault 5.95 0.33 0.84 6.07
Witness; no suspect
Burglary 19.04 1.05 2.68 19.43 Robbery 1.26 1.22 0.39 1.59 Assault 6.77 6.57 2.12 8.56
Witness; susepct
Burglary 3.40 3.29 1.06 4.29 Source: Adapted from Peterson, Mihajlovic and Gilliland (1984). Summary This chapter has attempted to set the scene for understanding the contribution that forensic material makes to volume crime detections. There are three main themes worth highlighting. First, studies that have examined the proportion of offences detected through the use of forensic techniques have revealed that they have, traditionally, made only a small contribution to total detections; most crimes are detected by other means. However, more recent UK studies point to forensics contributing to a greater proportion of volume crime detections. Second, several key studies undertaken during the 1980s highlighted that forensic evidence was principally used to corroborate other evidence against known suspects, rather than for identifying unknown offenders. The increasing use of automated searching techniques using computer databases for fingerprints, DNA and footwear mark data, means that forensic material can increasingly be used to generate first links to crimes as well as providing evidence to secure subsequent detections. Finally, in spite of the apparently limited use of forensic material in crime detection, when physical material is considered against the wider evidential canvas, it is found to make a particularly important contribution in the detection of ‘harder-to-solve’ crimes. Forensic evidence greatly increases the odds of detecting an offence especially when other forms of evidence are absent. The increasing use of forensics as a tool by which unknown offenders are identified will have further strengthened the degree to which forensics assist in detecting otherwise hard-to-solve offences.
13
3. Call handling and initial response Call handlers The actions of those who first deal with the majority of initial reports of crimes – call handlers – can have a major influence on both the efficiency and effectiveness of subsequent forensic activity. Efficiency can be influenced because call handlers can gather information about the extent of ‘visible’ forensic evidence that may have been left at the scene (e.g. the presence or absence of blood, cigarette butts, shoemarks). This may assist in subsequent targeting of resources and the screening in of more ‘productive’ scenes. Call handlers are also well positioned to advise victims or witnesses on the actions necessary to preserve the crime scene by minimising disturbance and contamination, in order to enhance the subsequent availability of forensic material. This has the potential to increase the effectiveness of crime scene examinations. In spite of the important role that call handlers play in this area, little research has been identified on the role that call handlers play in terms of crime scene preservation, deployment of resources or the types of information collected or preservation advice ‘scripts’ that maximise downstream forensic opportunities. While a joint ACPO/Forensic Science Service study (ACPO/FSS, 1996) made recommendations on what call handlers should advise victims to do (and not to do) in respect of physical evidence, only one research study by Latif (unpublished) on call handling in Leicestershire was identified. The study reported on an FSS project to increase the effectiveness of the allocation of crime scene examiners3 (CSEs) by providing forensic awareness training to call handling staff. The objective was to improve the tasking of CSEs to burglary and vehicle crime scenes. Although the study, which compared rates of crime scene attendance and retrieval rates before and after the introduction of training, produced positive results, the reference periods were too small to generate robust findings. Who attends crime scenes to retrieve physical evidence? The assessment of the crime scene for potential forensic materials constitutes the first active stage of physical evidence retrieval within the investigative process. The way in which crime scenes are assessed and physical evidence retrieved varies from country to country and between different police organisations. The task can fall to front-line police officers, police officers with special training, dedicated specialists, or a mixture of these. In the UK it is standard practice for dedicated CSEs (who may either be officers or civilian police staff) to be responsible for the collection of forensic material from crime scenes. Various US studies (Greenwood et al. 1975; Petersilia 1978; and Eck, 1983) describe the routine practice whereby patrol officers and ‘evidence technicians’ have a responsibility for collecting forensic materials from crime scenes. Petersilia’s (1978) analysis of fingermark recovery in three US police departments found that, whilst practices varied, patrol officers in two case study areas were expected, or could be required, to retrieve fingermarks (depending on the offence type). A more recent study by Horvath, Meesig and Lee (2002), based on a survey of over 1,000 police agencies in the US, revealed that while 45 per cent of all responding agencies employed evidence technicians, responsibility for retrieving forensic materials from scenes of crime was often shared amongst investigators and patrol officers. Few studies have looked at the comparative benefits of different groups of individuals being
3 Alternative terms to describe this role are scenes of crime officer, crime scene investigator and evidence technician (more common in the US). In this report, the term ‘crime scene examiner’ has generally been used.

14
responsible for removing physical evidence from crimes scenes. A 1973 evaluation examined the impact of an expanded Evidence Technician Unit (ETU) in St Louis (Taylor et al., 1973). Selected police officers were trained in evidence collection to augment the ‘regular’ evidence technician unit staff. While the main finding was a marked increase in scenes searched (up 31%), the study generally revealed the benefits of having dedicated evidence technicians. Scenes processed by evidence technicians generated more arrests (9% higher), quicker times to trial and a higher proportion of guilty pleas. However, as the authors note, these findings do need to be treated with some caution because of the selectivity with which ETU staff attended scenes. The process of screening incidents for evidence technician attendance may have artificially inflated the extent to which an expansion in ETU staff yielded direct improvements in performance. Decision-making about which scenes to attend The issue of how decisions are made in respect of scene attendance is now considered. The starkest findings from those studies that have examined this aspect of crime scene attendance is the wide range of decision-making processes and decision-makers. The HMIC Thematic Inspection on scientific and technical support (2000) identified six different strategies to allocating CSEs to volume crime scenes in England and Wales.
• Attendance in support of force and basic command unit (BCU) policing priorities. • Blanket attendance at certain categories of volume crime, particularly residential burglary. • CSE attendance determined by first police officer attending (sometimes within preset
policy parameters). • CSE attendance determined by Crime Desk staff. • Crime management sergeant determines against a matrix of intelligence and presumed
solvability. • Assessment of scenes by uniformed officers with particular training.
These categories are, of course, not mutually exclusive – some forces may adopt a mixture of these approaches partly dependent upon crime type. A broadly similar range of approaches have been observed in other studies. For instance Peterson et al.’s (1984) study of four US jurisdictions revealed mixed attendance policies across all four sites. In Peoria, attendance at all serious crimes including burglaries was mandatory. In Chicago, mandatory offences which received the mobile crime lab only included fatal and near fatal violent crimes, with other scenes dependent on the discretion of the patrol officer and with policy being set by local commanders; the remaining two in the study sites fell somewhere between these two extremes. Taylor and Hirst (1995) conducted a national survey of all 43 police forces in England and Wales, and found 26 different ‘initial visit schemes’, which, for the purposes of this review, can be categorised into three broad policies for the attendance of CSEs at burglary scenes.
• Assessment of the need for CSE attendance by a uniformed officer, detective or specialist officer (the First Attending Officer (FAO) system).
• Replacement of the uniformed officer, detective and CSE roles by a police officer with additional training in forensic awareness.
• Attendance by a specialist officer and CSE simultaneously. In their evaluation of six schemes within these three categories, Taylor and Hirst noted that each of the schemes had implications for the deployment of resources. With reference to the forensic processes of volume crime investigation in particular, the FAO system, required training of police officers in forensic awareness for the scheme to work effectively. The replacement of the uniformed officer, detective and CSE by a single officer, whilst reducing the resource deployment

15
of scientific support units, also required greater training for the ‘replacement’ officer in forensic awareness. Perhaps the most promising scheme was the attendance of a specialist officer, such as a detective and a CSE together. This reduced the number of scene visits and increased the speed of the investigation. There were, however, resource implications for sending CSEs to all burglary scenes regardless of the potential for retrieval of forensic evidence (Taylor and Hirst, 1995). The study did not, however, consider in detail the impact of crime scene attendance policies on the allocation of CSEs to crime scenes or the consequences in terms of effectiveness (e.g. the impact on retrieval of physical evidence). The range of factors influencing CSE attendance (HMIC, 2000), combined with different force structures for the allocation of resources, create considerable variations in the amount of discretion CSEs exercise in selecting the scenes that they attend (Williams, 2004). In three of the seven English and Welsh sample forces that were reliant on the FAO system for allocating CSEs, Williams found very little scope for CSE discretion in terms of which scenes examiners attended. The expectation tended to be that CSEs would attend as many residential burglary scenes as possible, regardless of the potential for the retrieval of forensic materials. In two forces in Williams’ study where divisional police officers had received additional forensic awareness training, CSEs were found to be able to exercise some discretion in which scenes they attended. CSEs had most control, however, in the two forces that ran a central CSE control office, effectively taking away the gatekeeping role of the FAO. Here dedicated staff allocated CSEs based on information provided by victims and FAOs (Williams, 2004). Although a number of different approaches exist for deploying CSEs, FAOs frequently play a central role in the decision-making process around subsequent crime scene examiner attendance. Even when ‘formal’ policies for attendance are in place, FAO discretion can nonetheless be important in determining exactly what scenes get visited particularly in relation to less serious crimes and regardless of the existence of more formal decision-making processes for deployment of CSEs (ACPO/FSS, 1996 p.32). The decision of the first officer attending to request a CSE has been identified as driven by two main principles: on the one hand, seriousness of the offence; and on the other, their perceptions on the presence of forensic material. In a survey of patrol officers, Tilley and Ford (1996), found that seriousness of the case (78%) and perceived presence of forensic materials (66%) greatly influenced their decision to request CSE attendance (n=81). While one might expect officers to be better placed in determining ‘seriousness’, the extent to which FAOs are routinely able to correctly assess the forensic potential of scenes has been the subject of debate. Screening for attendance, officer discretion and forensic awareness The research literature has identified two main criticisms of FAOs in their ability to screen for CSE attendance. The first issue relates to their adherence to guidelines on when a CSE should be called. Peterson (1974) undertook an informative early study of the role of CSEs in the US. This is a rare example of participant observation in this area – the study involved 400 hours of field experience with police personnel in five metropolitan communities. A wide range of formal and informal guidance was found to exist on when patrol officers should call an evidence technician. In the site that had the strongest guidance on when an evidence technician should attend, it was evident that these rules had been informally relaxed so that a ‘substantial number’ of mandatory attendance scenes received no CSE. Peterson (1974) found that officers were disturbed by policies which reduced their discretion; most of the officers interviewed felt that they were well qualified to advise on which cases should be searched for physical evidence (although as is noted below, as a general rule this is open to question). A similar picture of limited adherence to rules on mandatory attendance of CSEs was found in a study of the police response to bus driver robberies (Misner and McDonald, 1970). A second theme to emerge from work on the role of the FAO is that, even where they have legitimate discretion over advising on crime scene attendance, their often low level of forensic
16
awareness means that they are poorly placed to make these judgements. Although this is one aspect of a wider concern about officers’ understanding and appreciation of physical evidence in the broadest sense (Ramsay, 1987; PSSO, 2003; Horvath and Meesig, 1996), the impact of poor awareness among FAOs on both assessing the forensic potential of scenes, and advising on preservation, is potentially considerable. One measure of forensic awareness of UK officers comes from a study that sought to test officers’ knowledge of forensic issues (Saulsbury, Hibberd and Irving, 1994). Police personnel from a sample of eight police forces were presented with a list of twelve different types of forensic materials and were asked, using a five-point scale, to rate whether their knowledge of each type was ‘sufficient to meet their responsibilities’. Of the total sample, around ten per cent of respondents felt that their knowledge was ‘at least occasionally insufficient’ for all types of forensic materials (Saulsbury et al., 1994). The study also considered respondents’ perceived level of forensic knowledge in relation to the main role they performed. For all of the types of forensic materials, respondents whose main role was as an FAO were most likely to describe their knowledge as ‘at least occasionally insufficient’. Although Saulsbury et al.’s study dates from the early 1990s, well before the establishment of the DNA Expansion Programme, weaknesses in officers’ general levels of forensic awareness were still being highlighted within more recent assessments of police skills and training needs (see for instance PSSO, 2003). Most recently, the issue of poor police knowledge in relation to forensic science was raised in contributions to the Science and Technology Select Committee (2005, paras 104-107). One likely consequence of limitations in FAO forensic awareness is a tendency for them to request CSE attendance even when there may be limited opportunities for retrieving material. An in-depth analysis of five forces as part of year 1 of the DNA Expansion Programme found that CSEs felt that FAOs tended to ‘err on the side of caution’ when requesting examiners (MHB, unpublished year 1). Frustrations with the imperfections of the FAO screening model, alongside the resource implications of separate, multiple visits to the same scene (highlighted by the Audit Commission, 1993, and Taylor and Hirst, 1995) have led some forces to explore more radical approaches to resourcing scene attendance. Brader and Delany (unpublished) reported on an evaluation of a ‘Borough Forensic Model’ in the Metropolitan Police Service (MPS) to increase crime scene attendance and improve timeliness at burglary offences. The model was piloted in two London boroughs and involved sending crime scene examiners to all burglary scenes as the sole response except where a suspect was present or if an artifice burglary. The CSE response was also due to be made within four hours of the examiner being tasked by the borough Telephone Investigation Bureau, and was organised on a 24-hour shift pattern. More detailed data were provided for one of the boroughs; the number of CSE attendances at burglaries increased during the initiative – the attendance rate went up from 60 per cent in the year prior to the intervention to 91 per cent in the project period. The proportion of all crime scenes yielding material went up (for DNA it increased by 75%, and fingermarks by 52%). However, the rate of increase did not keep pace with the increase in scenes visited, so the retrieval rate per scene visited actually fell for fingermarks and shoemarks (from 23% to 20%, and 14% to 10% respectively), although increased for DNA (up from 4.9% to 5.9%). The overall recovery of fingermarks and DNA went up by 40 per cent and 26 per cent respectively in the two boroughs. Fingerprint identifications and DNA hits both went up (34% and 14% respectively) but neither kept pace with the increase in scenes visited (the proportion of scenes yielding identifications fell in both boroughs). The evaluation also explored the relationship with judicial disposals in burglary. In both boroughs there appeared to be an increase in the rate of burglary offences leading to a judicial disposal. Exactly what contribution the changes brought about by the Borough Forensic Model made to this improvement is not clear (the project was running for only 6 months of the period in which the judicial disposal rate showed its marked improvement). However it is perhaps worth noting that, for one Borough, what the MPS define as ‘forensic judicial disposals’ actually only accounted for

17
1.9 per 100 offences, or approximately 14 per cent of all burglary judicial disposals in the year of the initiative. Several positive aspects of the model were identified in the evaluation. Although there was no indication that CSEs were spending longer at scenes, the new regime allowed them greater opportunity to do this if they deemed it necessary. Second, CSEs were achieving better response times to scenes, with benefits for both improved forensic preservation and positive feedback from victims. Finally, the model provided greater support to response officers through the provision of a 24-hour service (and the view that response officers’ appreciation of scene preservation issues had improved as a consequence), with a move towards genuine team (i.e. police–CSE) working. In terms of negative aspects of the project identified in the study, concerns over safety, the tasking of CSEs to low forensic potential scenes, and staffing problems on late shifts, were among the main problems raised. It is difficult, given the numerous changes brought about with the introduction of the Borough Forensic Model to isolate the precise impact of a change to sole responding CSE on forensic/detection performance. Overall patterns of scene attendance by CSEs This chapter concludes by looking briefly at patterns of crime scene attendance. As would be expected, the overall picture of CSE examiner attendance at crime scenes has been found to vary widely across different crime types. An area’s crime mix is, for instance, likely to be critical in determining overall rates of scene attendance. Cross-country comparisons are made difficult by the different ways in which crimes (the base rate for examiner visits) are counted. Furthermore, differences in the calculation of CSE attendance rate (even within the same country, e.g. reflecting the impact of several major changes to the counting of crime over time in England and Wales on CSE attendance rates), mean that exploring in detail variations in rates can be misleading. It is more meaningful to examine attendance rates by crime type and the findings of several studies are given in Table 3.1. Other studies have addressed this area but have mainly focused on the relationship between scene attendance and other aspects of the forensic investigation process, such as recovery rates or overall attrition (such as MHB et al., 2004, and Petersilia, 1978). These studies will be explored later in this review.
18
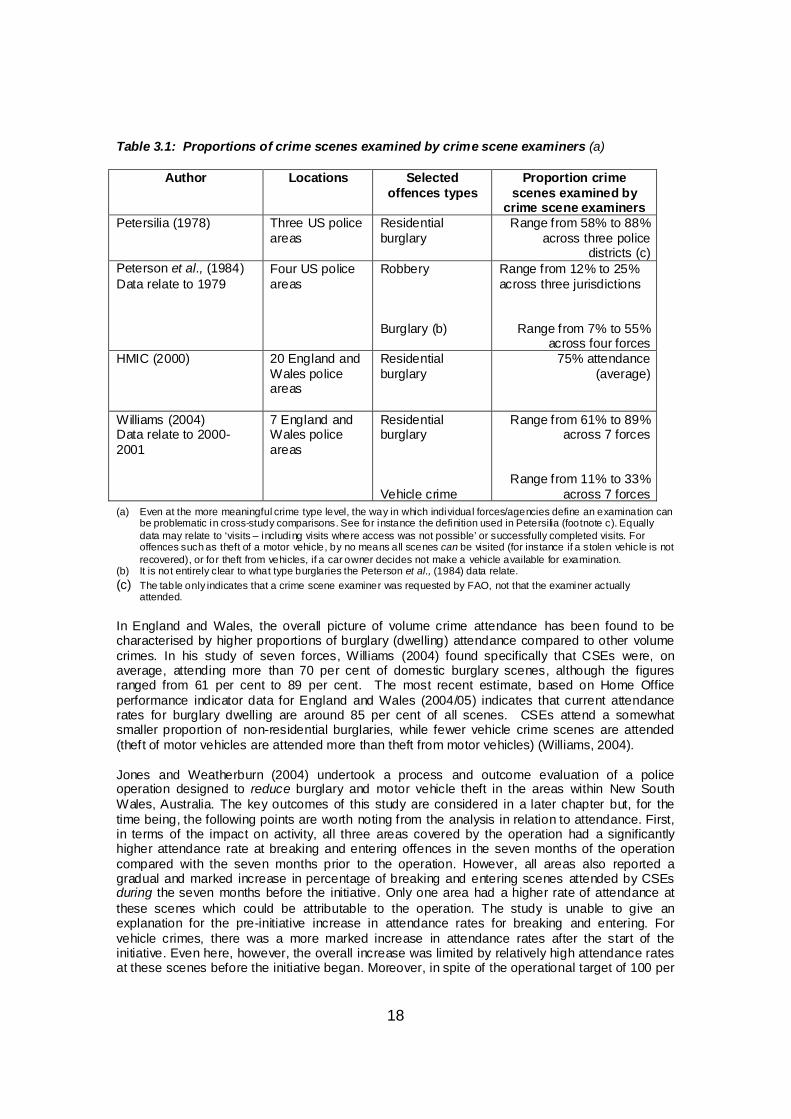
Table 3.1: Proportions of crime scenes examined by crime scene examiners (a)
Author Locations Selected offences types
Proportion crime scenes examined by
crime scene examiners Petersilia (1978)
Three US police areas
Residential burglary
Range from 58% to 88% across three police
districts (c) Peterson et al., (1984) Data relate to 1979
Four US police areas
Robbery Burglary (b)
Range from 12% to 25% across three jurisdictions
Range from 7% to 55% across four forces
HMIC (2000) 20 England and Wales police areas
Residential burglary
75% attendance (average)
Williams (2004) Data relate to 2000-2001
7 England and Wales police areas
Residential burglary Vehicle crime
Range from 61% to 89% across 7 forces
Range from 11% to 33% across 7 forces
(a) Even at the more meaningful crime type level, the way in which individual forces/agencies define an examination can be problematic in cross-study comparisons. See for instance the definition used in Petersilia (footnote c). Equally data may relate to ‘visits – including visits where access was not possible’ or successfully completed visits. For offences such as theft of a motor vehicle, by no means all scenes can be visited (for instance if a stolen vehicle is not recovered), or for theft from vehicles, if a car owner decides not make a vehicle available for examination.
(b) It is not entirely clear to what type burglaries the Peterson et al., (1984) data relate. (c) The table only indicates that a crime scene examiner was requested by FAO, not that the examiner actually
attended. In England and Wales, the overall picture of volume crime attendance has been found to be characterised by higher proportions of burglary (dwelling) attendance compared to other volume crimes. In his study of seven forces, Williams (2004) found specifically that CSEs were, on average, attending more than 70 per cent of domestic burglary scenes, although the figures ranged from 61 per cent to 89 per cent. The most recent estimate, based on Home Office performance indicator data for England and Wales (2004/05) indicates that current attendance rates for burglary dwelling are around 85 per cent of all scenes. CSEs attend a somewhat smaller proportion of non-residential burglaries, while fewer vehicle crime scenes are attended (theft of motor vehicles are attended more than theft from motor vehicles) (Williams, 2004). Jones and Weatherburn (2004) undertook a process and outcome evaluation of a police operation designed to reduce burglary and motor vehicle theft in the areas within New South Wales, Australia. The key outcomes of this study are considered in a later chapter but, for the time being, the following points are worth noting from the analysis in relation to attendance. First, in terms of the impact on activity, all three areas covered by the operation had a significantly higher attendance rate at breaking and entering offences in the seven months of the operation compared with the seven months prior to the operation. However, all areas also reported a gradual and marked increase in percentage of breaking and entering scenes attended by CSEs during the seven months before the initiative. Only one area had a higher rate of attendance at these scenes which could be attributable to the operation. The study is unable to give an explanation for the pre-initiative increase in attendance rates for breaking and entering. For vehicle crimes, there was a more marked increase in attendance rates after the start of the initiative. Even here, however, the overall increase was limited by relatively high attendance rates at these scenes before the initiative began. Moreover, in spite of the operational target of 100 per

19
cent attendance, this was never achieved: attendance rates for breaking and entering ranged from 60 per cent to 80 per cent during the operation, with comparable figures for vehicle crime of 50 to 70 per cent. Reasons offered for a failure to reach a 100 per cent attendance rate included victim non-co-operation and the perception that some scenes are so unlikely to yield forensic information that they are not worth visiting. In some instances, CSE attendance was not undertaken due to a breakdown in communication between initial attending officers or duty officers not being clear of the operational ground rules. Several studies have explored the relationship between the number of scenes visited and the number of CSEs available for deployment (Petersilia, 1978; Touche Ross, 1987; Audit Commission, 1993; Tilley and Ford 1996; Williams, 2004). The number of CSEs available and their overall deployment (including factors such as their actions at scenes and, critically, the time it takes for examiners to get to scenes, itself often a function of geographical coverage) are clearly important factors in determining the number of scenes visited. The data reported in these studies are summarised in Table 3.2. Although it is difficult to compare from study to study (due to different sample sizes and methods), the following general observations can be made. Petersilia (1978) found that the number of (all) crime scenes processed per year per ‘evidence technician’ was between 375 (Washington DC) and 500 (Richmond, Ca.). In the 1980s Touche Ross found an average of 705 scenes visited per CSE in the year under examination (based on data for 1986). By comparison, Tilley and Ford (1996) found a range of 334 to 705 visits per CSE across eight forces for which data were available (average of 626). Table 3.2: CSE workloads reported in reviewed studies Study reviewed Observed mean CSE workloads Petersilia, 1978 Ranging from 375 to 500 scenes per
annum (3 US police departments) Touche Ross, 1987 705 scenes per annum (provincial forces in
England and Wales) Audit Commission, 1993 800 scenes per annum. A range of 450 to
1,350 Tilley and Ford, 1996 626 ranging from 334 to 705 scenes per
annum (8 forces) Williams, 2004 Ranging from 375 to 577 scenes per
annum (7 forces). Williams (2004) also touched on CSE workload issues in his study. Based on scene examination data for vehicle crime and residential burglary cases from a sample of seven forces, a general association was observed between the total number of CSEs and total scenes visited. However, it was also noted that three of the forces in the sample did not conform to their expected ranking – two of these forces had CSEs carrying higher than average examination workloads whilst the other force had a low examination rate given its (relatively high) CSE resources (Williams, 2004). Although geographical factors may have played a part in influencing variations in workload, different management approaches, and the extent to which forensic science is integrated into investigations more generally, are seen as playing an important part in explaining variable force performance. Aside from the handful of studies that have examined the general relationship between CSE resources and numbers of visits, several have assessed the impact of particular initiatives designed to expand CSE resources in a more targeted fashion. The Pathfinder Initiative Evaluation (Burrows et al., 2005) examined the impact of increased forensic activities within seven divisions in two large police forces in north-west England. The evaluation focused on two components: the FSS Pathfinder project; and the DNA Expansion Programme. The aim of Pathfinder was to enhance the forensic examination of crime scenes, focusing on the collection of

20
Low Copy Number (LCN) DNA samples4, footmark/toolmark retrieval and linking, and the greater use of crime linking techniques. Initially the DNA Expansion Programme focused more on increasing the number DNA samples taking from offenders. As part of the Pathfinder project, Forensic Examiners (FEs) were assigned to scientific support units in the seven target divisions of Greater Manchester Police (GMP) and Lancashire Constabulary. Their role was initially to accompany CSEs to burglary and vehicle crime scenes to swab for LCN DNA samples. During the course of the project, however, their roles evolved. In Lancashire for example, FEs began to attend vehicle crime scenes unaccompanied, increasing scene examination resources for a crime type with typically low CSE attendance rates. It was found that attendance at crime scenes increased by nine per cent in the ‘Pathfinder divisions’, in part due to the increased activity of the FEs. The wider implications of Pathfinder will be explored in more detail in the next chapter. Other initiatives have concentrated on increasing attendance at particular crime types. An evaluation of the impact of the introduction of dedicated Vehicle Examiners (VEs) in one force revealed that in the year prior to the initiative, CSEs attended 1,129 vehicle crime scenes (thefts of, and from, vehicles). This increased by 73 per cent during the 12 months of the project to 1,958 vehicle crime examinations by both CSEs and VEs. The VEs attended a total of 1,575 vehicle crime scenes (80% of the total). During the 12-month period of the project, recovery of DNA from vehicle crime scenes increased from 33 cases in the year prior to the initiative to 184 cases after the initiative; the number of fingermarks recovered increased by just under half (Duncliffe, unpublished).
Summary Although call handlers can play a critical role in both resource allocation and in advising on forensic preservation, very little research has been undertaken in this particular area of forensic activity. In terms of who performs the task of crime scene examination, the use of dedicated Crime Scene Examiners is not universal. In the US, responsibility for collecting forensic evidence from crime scenes is often shared amongst CSEs, investigators or patrol officers. Policies about the deployment of CSEs range from 100 per cent attendance for certain crime types, to discretionary attendance on the basis of information provided to a call taker, or by FAOs. In England and Wales, burglary dwelling attendance rates are generally high and in excess of 70 per cent, while a smaller proportion of vehicle crime offences are attended. For offences where attendance is discretionary, decisions to send a CSE will be influenced primarily by the potential to recover forensic material and the perceived seriousness of the offence. Research into FAO decision-making over scene attendance has highlighted potential weaknesses in this method of CSE deployment, especially low levels of forensic awareness amongst FAOs. Even where mandatory attendance policies exist, the actual pattern of attendance may fall below what is expected either due to poor communication or the reluctance of patrol officers to be directed to meet mandatory instructions for CSE attendance. A recurring theme in this aspect of forensic activity is that of police force variations in crime scene attendance rates (even allowing for similar crime types). Resourcing and geography have been identified as important factors in determining levels of CSEs visits. One study of forensic performance in English and Welsh forces noted that, while the greater number of CSEs per recorded crime was generally associated with higher proportions of all scenes attended, not all forces conformed to the expected pattern. Other factors might limit attendance levels (e.g. less densely populated rural forces requiring greater distances between scene visits). 4 A super-sensitive technique for recovering DNA at crime scenes.

21
4. Information and evidence gathering (1): up to the point of submission The primary aim of the examination of crime scenes by CSEs is the recovery of forensic materials in order to facilitate the investigative process. The term ‘crime scene’ is often broadly defined. In addition to covering physical locations, such as a piece of land, an area within a street, a vehicle or building, it also includes the suspect, victim, and any witnesses to be interviewed or eliminated from the investigation. Furthermore, scenes extend to cover the homes of suspects, victims, or witnesses, and stolen or recovered property (ACPO/FSS, 1996). These all constitute possible crime scenes and have the potential to yield a variety of forensic materials (e.g. fingermarks, blood, body fluids, footwear marks, discarded clothing and toolmarks). All of these have the potential to provide the police with intelligence links to other offences committed by the same offender or to particular suspects (or groups of suspects). Furthermore, evidential materials such as glass, paint, fibres from clothing and hairs can provide strong corroborative evidence to link a suspect to a scene, or alternatively eliminate an individual from police enquiries. The role that crime scene examiners perform Although arguably not fully applicable to the UK situation, the best description of what CSEs do at scenes of crime and how they relate to the investigative process comes from Peterson’s observational study (1974). Several features of the evidence collection process identified by Peterson are worth highlighting. First, he found little evidence of a ‘team’ approach to the investigation. Communication between evidence technicians and patrol officers was limited. Exchanges that did take place between an FAO and a CSE were often perfunctory, extending to advice where particular objects were out of place, or suggesting access/departure points. Apart from the exchange of information to support reports, Peterson observed virtually no other communication. Peterson’s observations led him to be particularly critical of motivation and feedback regime within which CSEs operate, noting that the ‘traditional’ authoritarian approach to police management appeared especially ineffective in dealing with this specialist police function. There was little incentive for evidence technicians to perform a thorough examination. Evidence technicians often became detached from a case after their brief search for evidence. On the CSE as a team player, Peterson notes:
It was often apparent the technician saw himself not as part of a ‘team’ designed to solve crimes but rather as an individual interested primarily in fulfilling his assigned duties. (p.33)
Peterson’s account is useful because it identifies a range of factors which influence how US evidence technicians responded to particular scenes. The residence or type of surrounding could, for instance, influence the investigation. Households that were dirty or poorly kept were frequently perceived as impractical to search, and Peterson suggests that at times this might have resulted in victims in less affluent areas receiving a less thorough service. Conversely, the presence of onlookers or dealing with expectant victims might induce a more in-depth search. On the issue of quality control, Peterson noted that the investigation reports written and filed by examiners were the principal means by which senior colleagues evaluated practice in the field. In practice, however, the documents were found to be rarely reviewed (and contained little of use as a mechanism for review). As the author notes:

22
they merely documented the presence of a technician at the scene and described any evidence collected…they were not designed to explain how decisions were made during the course of the investigation or why particular evidence was screened out. (Peterson, 1974 p.25)
Indeed, many of these factors conspired to show the CSEs that Peterson observed frequently failing to identify forensic material of potential value, or otherwise simply neglecting having first identified it. A second theme related to the purpose of the examination: some CSE visits were seen as simply an opportunity to provide the victim with the sense that he or she was receiving ‘a service’. In such instances the scene examination was little more than a public relations exercise, an attempt to give taxpayers the sense that they were getting their money’s worth out of the police department (Peterson, 1974; but see also Ward, 1971; and Parker and Gurgin, 1972). It was also noted that technicians tended to apply stock phrases to explain actions (or the failure to retrieve physical evidence), in a way that was seen as ‘attempts to align the citizen’s expectation with the service which the division was prepared to give’ (Peterson, 1974, p.28). A different perspective on householder satisfaction came from Coupe and Griffiths (1996) in their examination of burglary investigations in the West Midlands. They concluded, albeit on limited evidence, that there was ‘no evidence that dispensing with many CSE visits would lower the victim’s regard for the service provided by the police’. Some CSE visits were considered too short, or were generally conducted in a way that gave a negative impression of the police service (Coupe and Griffiths, 1996). By contrast, Brader and Delaney found that replacing police officers with sole visits by CSEs to burglaries was associated with a positive response from the public. Time at the scene Research into what CSEs do at scenes has focused on the amount of time spent at the scene, and the scene/travel ratio. ACPO/FSS (1996) found in four survey forces that time at all types of scene ranged from 29 minutes to 54 minutes, whereas Coupe and Griffith stated that CSEs were thought (by victims) to spend 20 minutes at each burglary scene (Coupe and Griffiths, 1996). These findings are similar to those from US studies: Parker and Peterson’s (1972) observational study noted a typical time of 20 minutes for ‘major felony’ crimes. A sample of felony cases from Miami, Florida (Petersilia, 1978) gave time spent at scenes as varying from 19 minutes (vehicle crime) to 55 minutes (homicide), with an average of 36 minutes for all cases; the time spent at residential burglary cases (n=32) was 44 minutes. In terms of the relationship between time spent examining scenes and other tasks, ACPO/FSS (1996) found that, for English and Welsh CSEs, around one quarter of all CSE time was spent at scenes while 11 per cent was spent travelling. The balance of CSE time (65%) was under a broadly defined heading of ‘office and other tasks’. Prior to the more widespread collection of DNA material from volume crime scenes in England and Wales, Tilley and Ford (1996) found that, on the basis of interviews with CSEs (n=40), on average CSEs spent 70 per cent of the time at a scene looking for fingermarks. The number of scenes that had to be attended frequently (CSE ‘workload’) meant that they had to limit scene searches to particular evidence types. Both Touche Ross (1987) and Tilley and Ford (1996) found that this overall balance was common in volume crime investigations. Rates of retrieval for physical evidence Because of the process of decision making and the consequent filtering out of crime scenes, it is difficult to establish with clarity the ‘natural’ presence of physical material at crime scenes, and therefore the natural rate, other things being equal, at which one might expect it to be retrieved from different types of scene. A rare attempt to assess the presence of physical evidence at crime scenes was undertaken by Parker and Peterson (1972). Observers knowledgeable in the forensic
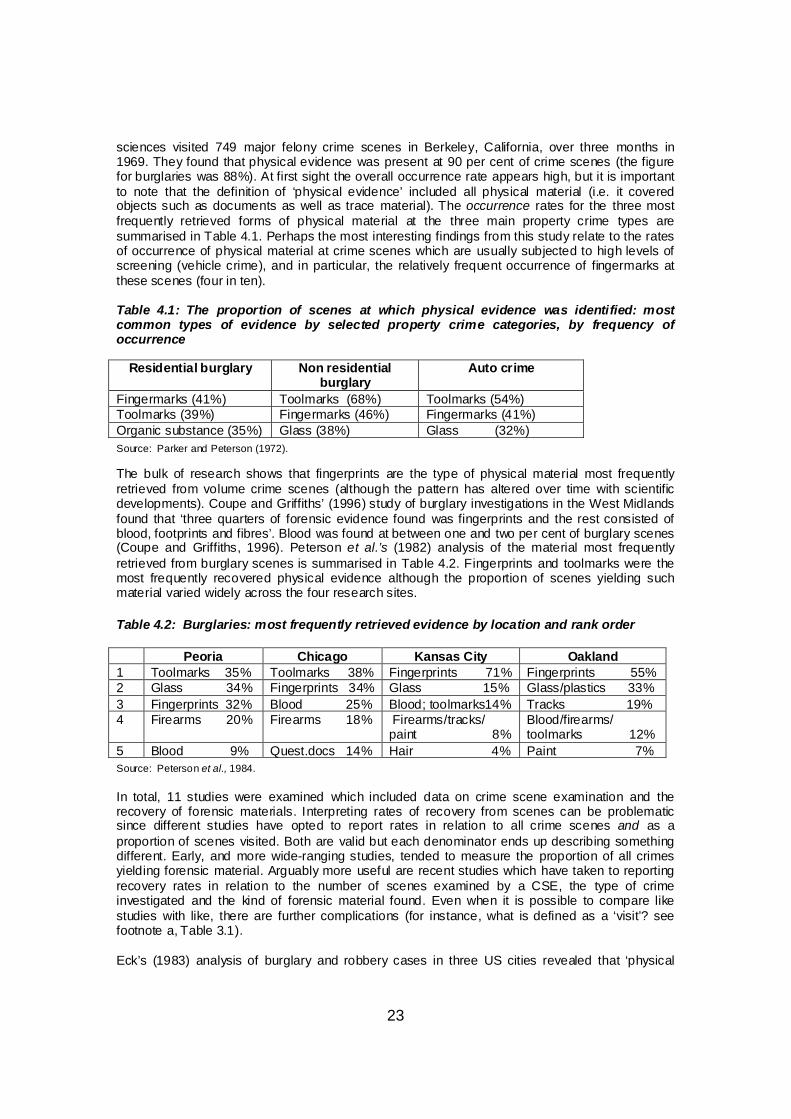
23
sciences visited 749 major felony crime scenes in Berkeley, California, over three months in 1969. They found that physical evidence was present at 90 per cent of crime scenes (the figure for burglaries was 88%). At first sight the overall occurrence rate appears high, but it is important to note that the definition of ‘physical evidence’ included all physical material (i.e. it covered objects such as documents as well as trace material). The occurrence rates for the three most frequently retrieved forms of physical material at the three main property crime types are summarised in Table 4.1. Perhaps the most interesting findings from this study relate to the rates of occurrence of physical material at crime scenes which are usually subjected to high levels of screening (vehicle crime), and in particular, the relatively frequent occurrence of fingermarks at these scenes (four in ten). Table 4.1: The proportion of scenes at which physical evidence was identified: most common types of evidence by selected property crime categories, by frequency of occurrence
Residential burglary Non residential burglary
Auto crime
Fingermarks (41%) Toolmarks (68%) Toolmarks (54%) Toolmarks (39%) Fingermarks (46%) Fingermarks (41%) Organic substance (35%) Glass (38%) Glass (32%) Source: Parker and Peterson (1972). The bulk of research shows that fingerprints are the type of physical material most frequently retrieved from volume crime scenes (although the pattern has altered over time with scientific developments). Coupe and Griffiths’ (1996) study of burglary investigations in the West Midlands found that ‘three quarters of forensic evidence found was fingerprints and the rest consisted of blood, footprints and fibres’. Blood was found at between one and two per cent of burglary scenes (Coupe and Griffiths, 1996). Peterson et al.’s (1982) analysis of the material most frequently retrieved from burglary scenes is summarised in Table 4.2. Fingerprints and toolmarks were the most frequently recovered physical evidence although the proportion of scenes yielding such material varied widely across the four research sites. Table 4.2: Burglaries: most frequently retrieved evidence by location and rank order Peoria Chicago Kansas City Oakland 1 Toolmarks 35% Toolmarks 38% Fingerprints 71% Fingerprints 55% 2 Glass 34% Fingerprints 34% Glass 15% Glass/plastics 33% 3 Fingerprints 32% Blood 25% Blood; toolmarks14% Tracks 19% 4 Firearms 20% Firearms 18% Firearms/tracks/
paint 8% Blood/firearms/ toolmarks 12%
5 Blood 9% Quest.docs 14% Hair 4% Paint 7% Source: Peterson et al., 1984. In total, 11 studies were examined which included data on crime scene examination and the recovery of forensic materials. Interpreting rates of recovery from scenes can be problematic since different studies have opted to report rates in relation to all crime scenes and as a proportion of scenes visited. Both are valid but each denominator ends up describing something different. Early, and more wide-ranging studies, tended to measure the proportion of all crimes yielding forensic material. Arguably more useful are recent studies which have taken to reporting recovery rates in relation to the number of scenes examined by a CSE, the type of crime investigated and the kind of forensic material found. Even when it is possible to compare like studies with like, there are further complications (for instance, what is defined as a ‘visit’? see footnote a, Table 3.1). Eck’s (1983) analysis of burglary and robbery cases in three US cities revealed that ‘physical
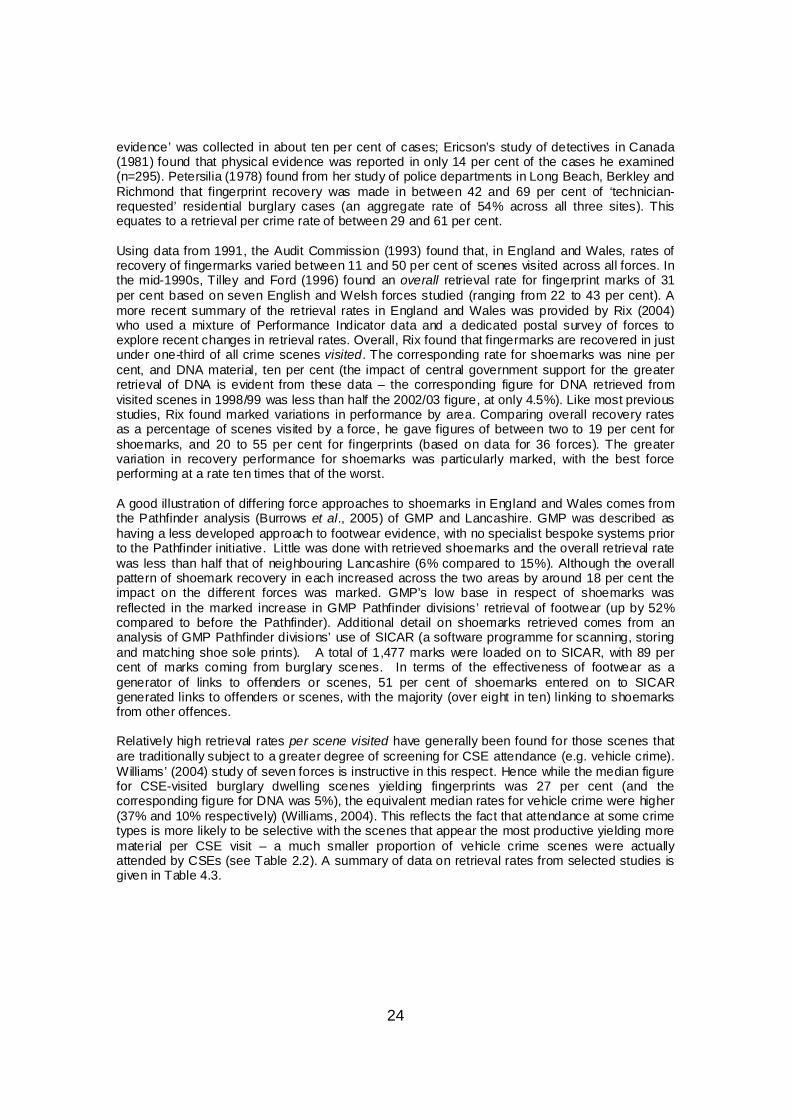
24
evidence’ was collected in about ten per cent of cases; Ericson’s study of detectives in Canada (1981) found that physical evidence was reported in only 14 per cent of the cases he examined (n=295). Petersilia (1978) found from her study of police departments in Long Beach, Berkley and Richmond that fingerprint recovery was made in between 42 and 69 per cent of ‘technician-requested’ residential burglary cases (an aggregate rate of 54% across all three sites). This equates to a retrieval per crime rate of between 29 and 61 per cent. Using data from 1991, the Audit Commission (1993) found that, in England and Wales, rates of recovery of fingermarks varied between 11 and 50 per cent of scenes visited across all forces. In the mid-1990s, Tilley and Ford (1996) found an overall retrieval rate for fingerprint marks of 31 per cent based on seven English and Welsh forces studied (ranging from 22 to 43 per cent). A more recent summary of the retrieval rates in England and Wales was provided by Rix (2004) who used a mixture of Performance Indicator data and a dedicated postal survey of forces to explore recent changes in retrieval rates. Overall, Rix found that fingermarks are recovered in just under one-third of all crime scenes visited. The corresponding rate for shoemarks was nine per cent, and DNA material, ten per cent (the impact of central government support for the greater retrieval of DNA is evident from these data – the corresponding figure for DNA retrieved from visited scenes in 1998/99 was less than half the 2002/03 figure, at only 4.5%). Like most previous studies, Rix found marked variations in performance by area. Comparing overall recovery rates as a percentage of scenes visited by a force, he gave figures of between two to 19 per cent for shoemarks, and 20 to 55 per cent for fingerprints (based on data for 36 forces). The greater variation in recovery performance for shoemarks was particularly marked, with the best force performing at a rate ten times that of the worst. A good illustration of differing force approaches to shoemarks in England and Wales comes from the Pathfinder analysis (Burrows et al., 2005) of GMP and Lancashire. GMP was described as having a less developed approach to footwear evidence, with no specialist bespoke systems prior to the Pathfinder initiative. Little was done with retrieved shoemarks and the overall retrieval rate was less than half that of neighbouring Lancashire (6% compared to 15%). Although the overall pattern of shoemark recovery in each increased across the two areas by around 18 per cent the impact on the different forces was marked. GMP’s low base in respect of shoemarks was reflected in the marked increase in GMP Pathfinder divisions’ retrieval of footwear (up by 52% compared to before the Pathfinder). Additional detail on shoemarks retrieved comes from an analysis of GMP Pathfinder divisions’ use of SICAR (a software programme for scanning, storing and matching shoe sole prints). A total of 1,477 marks were loaded on to SICAR, with 89 per cent of marks coming from burglary scenes. In terms of the effectiveness of footwear as a generator of links to offenders or scenes, 51 per cent of shoemarks entered on to SICAR generated links to offenders or scenes, with the majority (over eight in ten) linking to shoemarks from other offences. Relatively high retrieval rates per scene visited have generally been found for those scenes that are traditionally subject to a greater degree of screening for CSE attendance (e.g. vehicle crime). Williams’ (2004) study of seven forces is instructive in this respect. Hence while the median figure for CSE-visited burglary dwelling scenes yielding fingerprints was 27 per cent (and the corresponding figure for DNA was 5%), the equivalent median rates for vehicle crime were higher (37% and 10% respectively) (Williams, 2004). This reflects the fact that attendance at some crime types is more likely to be selective with the scenes that appear the most productive yielding more material per CSE visit – a much smaller proportion of vehicle crime scenes were actually attended by CSEs (see Table 2.2). A summary of data on retrieval rates from selected studies is given in Table 4.3.
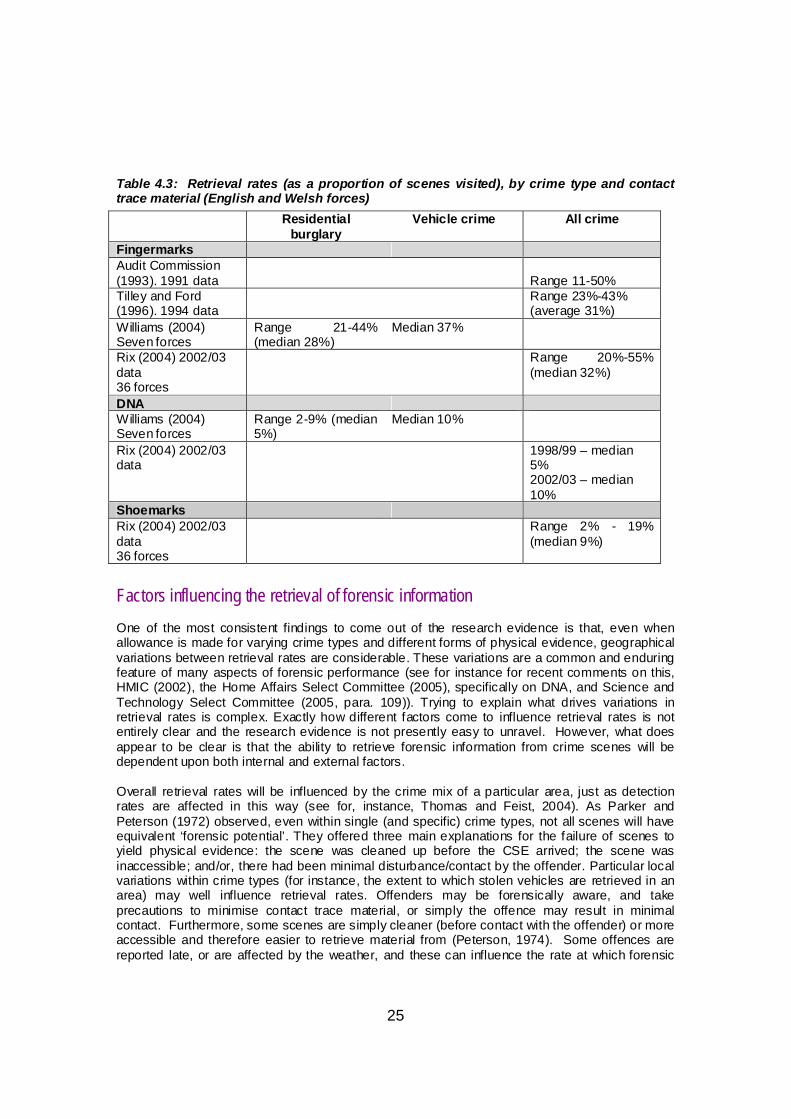
25
Table 4.3: Retrieval rates (as a proportion of scenes visited), by crime type and contact trace material (English and Welsh forces)
Residential burglary
Vehicle crime All crime
Fingermarks Audit Commission (1993). 1991 data
Range 11-50%
Tilley and Ford (1996). 1994 data
Range 23%-43% (average 31%)
Williams (2004) Seven forces
Range 21-44% (median 28%)
Median 37%
Rix (2004) 2002/03 data 36 forces
Range 20%-55% (median 32%)
DNA Williams (2004) Seven forces
Range 2-9% (median 5%)
Median 10%
Rix (2004) 2002/03 data
1998/99 – median 5% 2002/03 – median 10%
Shoemarks Rix (2004) 2002/03 data 36 forces
Range 2% - 19% (median 9%)
Factors influencing the retrieval of forensic information One of the most consistent findings to come out of the research evidence is that, even when allowance is made for varying crime types and different forms of physical evidence, geographical variations between retrieval rates are considerable. These variations are a common and enduring feature of many aspects of forensic performance (see for instance for recent comments on this, HMIC (2002), the Home Affairs Select Committee (2005), specifically on DNA, and Science and Technology Select Committee (2005, para. 109)). Trying to explain what drives variations in retrieval rates is complex. Exactly how different factors come to influence retrieval rates is not entirely clear and the research evidence is not presently easy to unravel. However, what does appear to be clear is that the ability to retrieve forensic information from crime scenes will be dependent upon both internal and external factors. Overall retrieval rates will be influenced by the crime mix of a particular area, just as detection rates are affected in this way (see for, instance, Thomas and Feist, 2004). As Parker and Peterson (1972) observed, even within single (and specific) crime types, not all scenes will have equivalent ‘forensic potential’. They offered three main explanations for the failure of scenes to yield physical evidence: the scene was cleaned up before the CSE arrived; the scene was inaccessible; and/or, there had been minimal disturbance/contact by the offender. Particular local variations within crime types (for instance, the extent to which stolen vehicles are retrieved in an area) may well influence retrieval rates. Offenders may be forensically aware, and take precautions to minimise contact trace material, or simply the offence may result in minimal contact. Furthermore, some scenes are simply cleaner (before contact with the offender) or more accessible and therefore easier to retrieve material from (Peterson, 1974). Some offences are reported late, or are affected by the weather, and these can influence the rate at which forensic
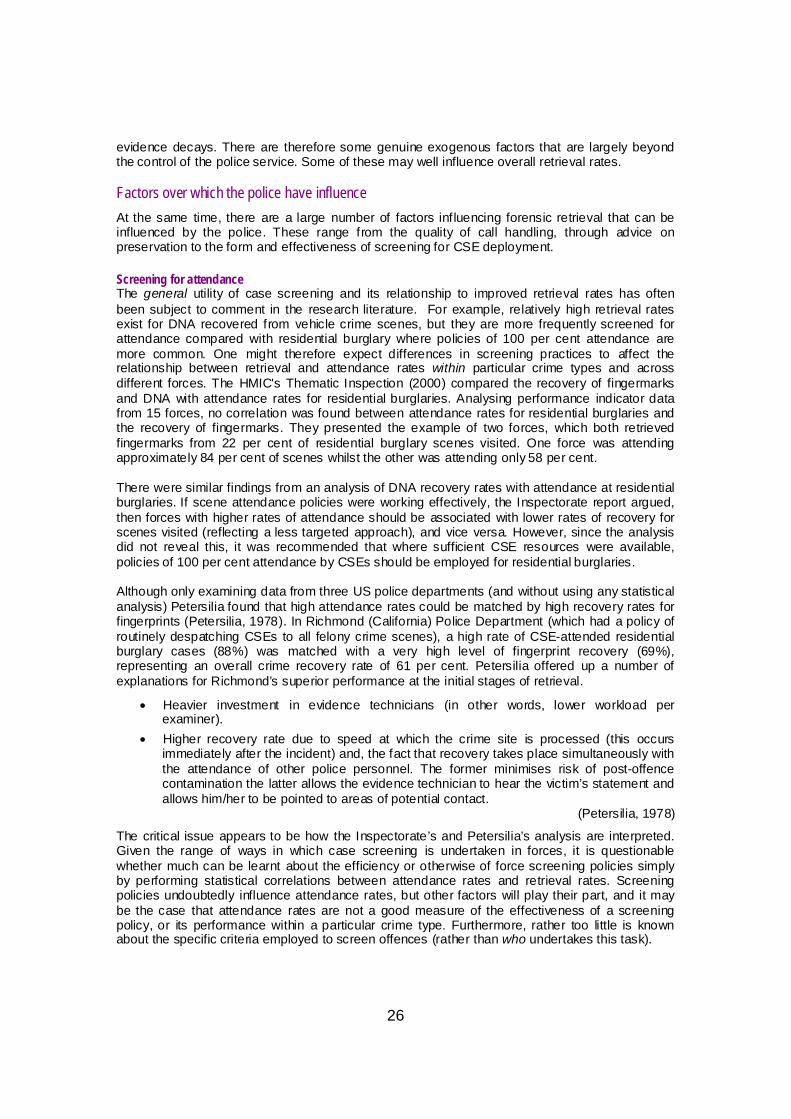
26
evidence decays. There are therefore some genuine exogenous factors that are largely beyond the control of the police service. Some of these may well influence overall retrieval rates. Factors over which the police have influence
At the same time, there are a large number of factors influencing forensic retrieval that can be influenced by the police. These range from the quality of call handling, through advice on preservation to the form and effectiveness of screening for CSE deployment. Screening for attendance The general utility of case screening and its relationship to improved retrieval rates has often been subject to comment in the research literature. For example, relatively high retrieval rates exist for DNA recovered from vehicle crime scenes, but they are more frequently screened for attendance compared with residential burglary where policies of 100 per cent attendance are more common. One might therefore expect differences in screening practices to affect the relationship between retrieval and attendance rates within particular crime types and across different forces. The HMIC's Thematic Inspection (2000) compared the recovery of fingermarks and DNA with attendance rates for residential burglaries. Analysing performance indicator data from 15 forces, no correlation was found between attendance rates for residential burglaries and the recovery of fingermarks. They presented the example of two forces, which both retrieved fingermarks from 22 per cent of residential burglary scenes visited. One force was attending approximately 84 per cent of scenes whilst the other was attending only 58 per cent. There were similar findings from an analysis of DNA recovery rates with attendance at residential burglaries. If scene attendance policies were working effectively, the Inspectorate report argued, then forces with higher rates of attendance should be associated with lower rates of recovery for scenes visited (reflecting a less targeted approach), and vice versa. However, since the analysis did not reveal this, it was recommended that where sufficient CSE resources were available, policies of 100 per cent attendance by CSEs should be employed for residential burglaries. Although only examining data from three US police departments (and without using any statistical analysis) Petersilia found that high attendance rates could be matched by high recovery rates for fingerprints (Petersilia, 1978). In Richmond (California) Police Department (which had a policy of routinely despatching CSEs to all felony crime scenes), a high rate of CSE-attended residential burglary cases (88%) was matched with a very high level of fingerprint recovery (69%), representing an overall crime recovery rate of 61 per cent. Petersilia offered up a number of explanations for Richmond’s superior performance at the initial stages of retrieval.
• Heavier investment in evidence technicians (in other words, lower workload per examiner).
• Higher recovery rate due to speed at which the crime site is processed (this occurs immediately after the incident) and, the fact that recovery takes place simultaneously with the attendance of other police personnel. The former minimises risk of post-offence contamination the latter allows the evidence technician to hear the victim’s statement and allows him/her to be pointed to areas of potential contact.
(Petersilia, 1978)
The critical issue appears to be how the Inspectorate’s and Petersilia’s analysis are interpreted. Given the range of ways in which case screening is undertaken in forces, it is questionable whether much can be learnt about the efficiency or otherwise of force screening policies simply by performing statistical correlations between attendance rates and retrieval rates. Screening policies undoubtedly influence attendance rates, but other factors will play their part, and it may be the case that attendance rates are not a good measure of the effectiveness of a screening policy, or its performance within a particular crime type. Furthermore, rather too little is known about the specific criteria employed to screen offences (rather than who undertakes this task).
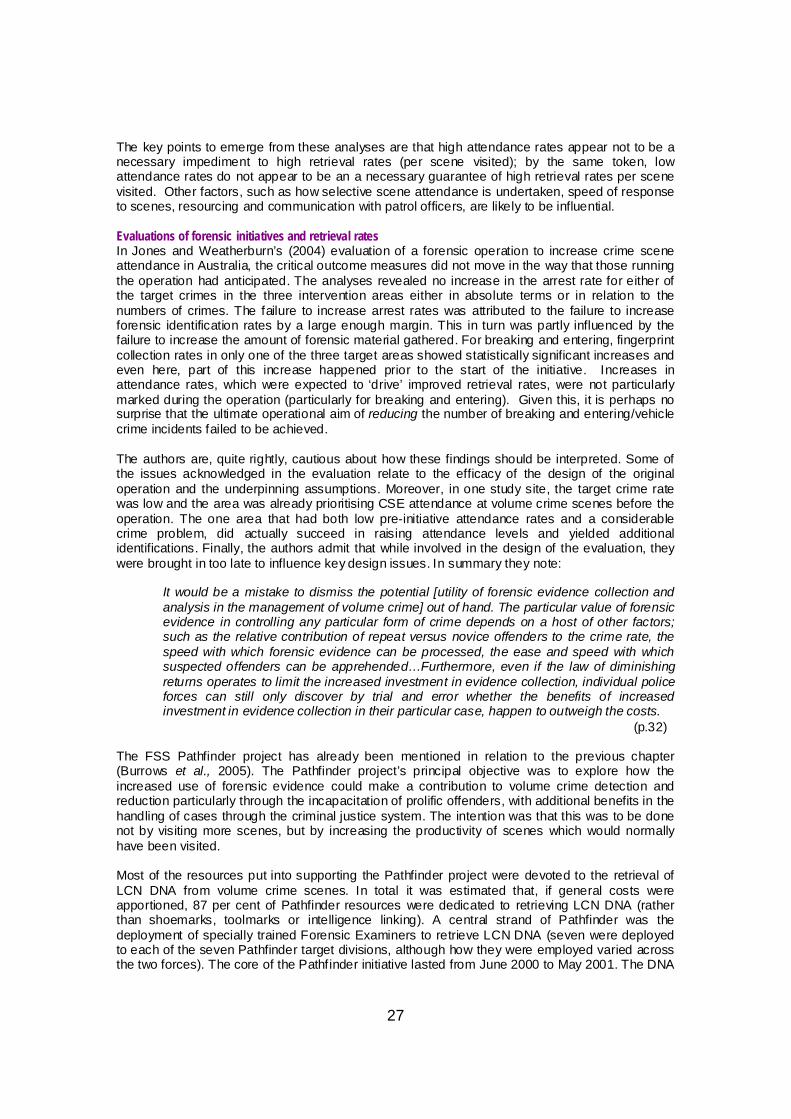
27
The key points to emerge from these analyses are that high attendance rates appear not to be a necessary impediment to high retrieval rates (per scene visited); by the same token, low attendance rates do not appear to be an a necessary guarantee of high retrieval rates per scene visited. Other factors, such as how selective scene attendance is undertaken, speed of response to scenes, resourcing and communication with patrol officers, are likely to be influential. Evaluations of forensic initiatives and retrieval rates In Jones and Weatherburn’s (2004) evaluation of a forensic operation to increase crime scene attendance in Australia, the critical outcome measures did not move in the way that those running the operation had anticipated. The analyses revealed no increase in the arrest rate for either of the target crimes in the three intervention areas either in absolute terms or in relation to the numbers of crimes. The failure to increase arrest rates was attributed to the failure to increase forensic identification rates by a large enough margin. This in turn was partly influenced by the failure to increase the amount of forensic material gathered. For breaking and entering, fingerprint collection rates in only one of the three target areas showed statistically significant increases and even here, part of this increase happened prior to the start of the initiative. Increases in attendance rates, which were expected to ‘drive’ improved retrieval rates, were not particularly marked during the operation (particularly for breaking and entering). Given this, it is perhaps no surprise that the ultimate operational aim of reducing the number of breaking and entering/vehicle crime incidents failed to be achieved. The authors are, quite rightly, cautious about how these findings should be interpreted. Some of the issues acknowledged in the evaluation relate to the efficacy of the design of the original operation and the underpinning assumptions. Moreover, in one study site, the target crime rate was low and the area was already prioritising CSE attendance at volume crime scenes before the operation. The one area that had both low pre-initiative attendance rates and a considerable crime problem, did actually succeed in raising attendance levels and yielded additional identifications. Finally, the authors admit that while involved in the design of the evaluation, they were brought in too late to influence key design issues. In summary they note: It would be a mistake to dismiss the potential [utility of forensic evidence collection and
analysis in the management of volume crime] out of hand. The particular value of forensic evidence in controlling any particular form of crime depends on a host of other factors; such as the relative contribution of repeat versus novice offenders to the crime rate, the speed with which forensic evidence can be processed, the ease and speed with which suspected offenders can be apprehended…Furthermore, even if the law of diminishing returns operates to limit the increased investment in evidence collection, individual police forces can still only discover by trial and error whether the benefits of increased investment in evidence collection in their particular case, happen to outweigh the costs. (p.32)
The FSS Pathfinder project has already been mentioned in relation to the previous chapter (Burrows et al., 2005). The Pathfinder project’s principal objective was to explore how the increased use of forensic evidence could make a contribution to volume crime detection and reduction particularly through the incapacitation of prolific offenders, with additional benefits in the handling of cases through the criminal justice system. The intention was that this was to be done not by visiting more scenes, but by increasing the productivity of scenes which would normally have been visited. Most of the resources put into supporting the Pathfinder project were devoted to the retrieval of LCN DNA from volume crime scenes. In total it was estimated that, if general costs were apportioned, 87 per cent of Pathfinder resources were dedicated to retrieving LCN DNA (rather than shoemarks, toolmarks or intelligence linking). A central strand of Pathfinder was the deployment of specially trained Forensic Examiners to retrieve LCN DNA (seven were deployed to each of the seven Pathfinder target divisions, although how they were employed varied across the two forces). The core of the Pathfinder initiative lasted from June 2000 to May 2001. The DNA

28
Expansion Programme, on the other hand, was intended to increase the overall efficiency of the NDNAD, by expanding the ‘population’ crime scene and criminal justice samples. The Pathfinder project was rolled out in seven divisions across two forces (Greater Manchester and Lancashire). The impact was to be measured by comparing the performance of these divisions with that of ‘control’ areas comprising ten non-intervention divisions in the two forces. The impact of DNA Expansion would be assessed by looking at performance in the ten control divisions and comparing with pre-Expansion Programme practice. In terms of DNA retrieved, the study revealed the following:
• DNA (SGM plus) recoveries from all crimes scenes visited increased by 38 per cent overall with the increase greatest in the Pathfinder divisions (an increase of 73% compared with an increase of 45% in the control divisions).
In terms of LCN DNA: • overall LCN was taken from 19 per cent of crime scenes visited (the rate varied depending on
whether the scene was visited by FEs alone (51%) or SOCOs with or without FEs (12%); • 3,251 samples were taken from 2,671 scenes of which 15 per cent yielded a partial or full
profile–22 per cent of successful profiles came from ignition boxes, which accounted for just under one quarter of all swabs;
• 63 per cent of LCN speculative searches on the NDNAD led to offender matches while a further four per cent led to scene to scene hits–overall this equated to 12 per cent of scenes from which LCN swabs were taken generating matches against subject samples.
There was also an 18 per cent increase in the rate of shoemarks recovered from crime scenes, but very little change in the rate of toolmark recovery. Neither of the initiatives introduced enhanced techniques for the retrieval of fingermarks (in fact the evaluation found that during the project, the rate of fingermark recovery actually fell in both forces by 1.3%). The Pathfinder divisions did, however, achieve an increase in the number of fingerprint identifications (up 2%) over the corresponding period, reflecting the greater attendance of FEs at vehicle crimes in Lancashire. Resources and integration A second area that has been explored is the relationship between retrieval rates and CSE workload. In his sample of seven forces, Williams (2004) suggested that variations between forces in the recovery of forensic materials could not simply be a reflection of variations in CSE workloads (i.e. the average number of scenes attended per CSE per year). Predictably, he found that two forces had high CSE workloads and low rates of recovery. The suggestion was that low retrieval rates might be due to CSEs having insufficient time to examine the scenes properly. However, he also found the converse was true – that low CSE workloads did not necessarily bring about higher rates of recovery. The failure to find a simple statistical relationship between resources to performance led Williams to conclude that scientific performance was equally likely to be influenced by the way CSE provision and activity was managed in forces (Williams, 2004). Williams found Scientific Support Unit (SSU) activity broadly fell into two categories. One emphasised the integrated role of CSEs within investigations (the so-called 'expert collaborator' model). The expert collaborator model was generally characterised by: • high degree of control that CSEs are able to exercise over their own work (including scene
attendance); and • high degree of SSU influence over the actions of others involved in the investigation of crime
(e.g. use of intelligence from scenes and feeding back of forensic results into the investigative process).
The other saw CSEs as primarily the providers of technical expertise. Although the 'expert collaboration' model has been promulgated for some time (ACPO/FSS, 1996 and Fraser, 2000),

29
both Williams' study of seven forces and the HMIC (2000) suggested that in England and Wales, there was still some way for it to go before it was fully adopted. Integration as a factor in performance has been highlighted in other studies. Petersilia’s assessment of the superrior forensic performance in Richmond (California) was seen in part as a consequence of the police department’s more integrated approach to forensics. This was shown not only by the use of joint CSE/patrol officer visits but also by the provision of detailed accounts from the CSEs lodged together with crime reports. Furthermore, the department also had a strong culture of using physical evidence in the detection of crime (Petersilia, 1978). The suggestion that resource variations alone will fail to explain differences in performance should not be a surprise to those familiar with the broader research literature on policing. It seems plausible that other factors highlighted from research in this area – organisational structures, the extent of integration and so on – make an important contribution to overall performance (although some of these may be less easy to measure in quantitative terms). Several other factors influencing CSE performance have been identified in the research literature, including CSE supervision and quality assurance, and variations in the performance of individual examiners. The ‘solo’ plight of the CSE, and the lack of effective mechanisms for quality controlling CSE work have already been touched upon (Peterson, 1972). Various studies have recommended that quality controlling of scene visits be undertaken (Touche Ross, 1987: House of Lords Select Committee, 1993; the Royal Commission on Criminal Justice, 1993; ACPO/FSS, 1996). However, Tilley and Ford (1996) found little evidence of in-force quality control or quality assurance (although one sample force did have exceptionally well developed quality assurance arrangements and procedures established for scene revisits), while HMIC (2000) offered no observations on this aspect of scene management. Most of the research around the factors influencing retrieval rates has focused on examining the different patterns in retrieval rates in relation to other factors (such as crime scene attendance). Several studies have also explored the impact of initiatives designed to increase attendance rates, or alternatively, assessing the impact of particular initiatives designed to improve retrieval rates for particular types of forensic recovery. The current verdict from the research evidence is simply that, while a menu of factors that influence retrieval rates can be identified, the critical processes that influence them are still not fully understood. Figure 4.1 attempts to summarise the key influences on the recovery of forensic materials by CSEs. These are not the only influences on recovery rates, but are those that have emerged from the research included in this review. These factors may be divided into two groups: policy and resource factors; and offence and forensic factors. As considered below, there is a strong argument for not considering retrieval rates in isolation.
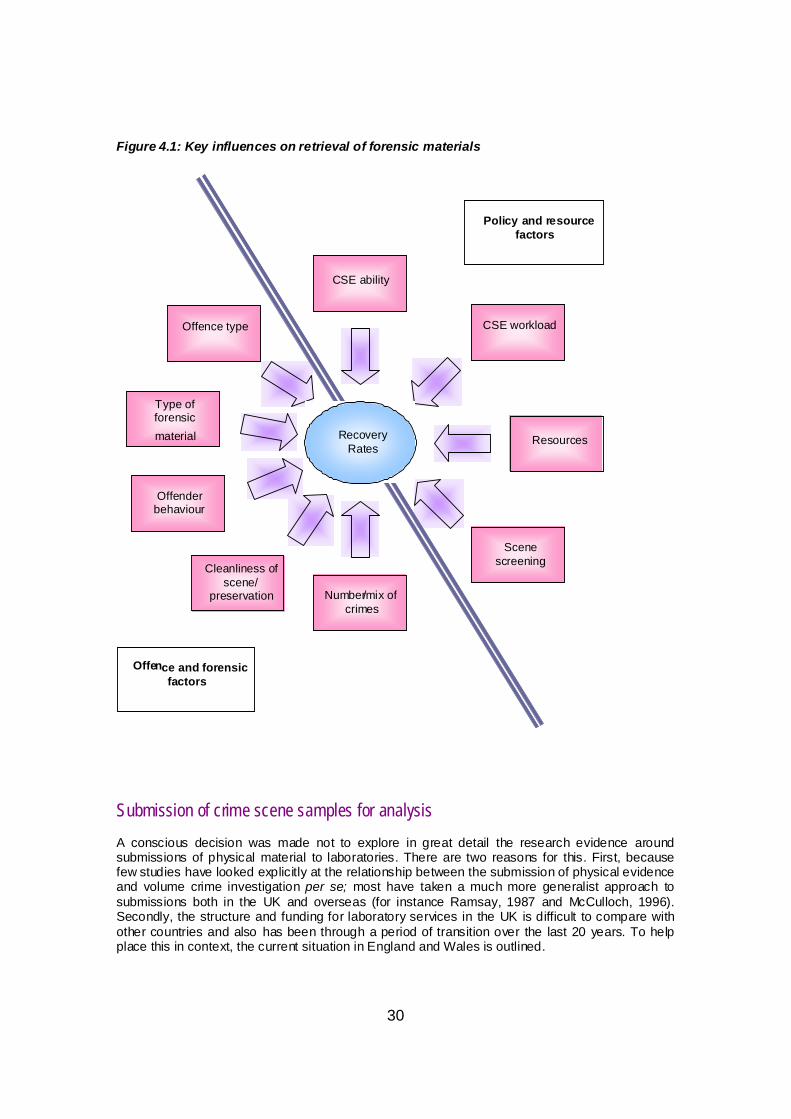
30
Figure 4.1: Key influences on retrieval of forensic materials
Submission of crime scene samples for analysis A conscious decision was made not to explore in great detail the research evidence around submissions of physical material to laboratories. There are two reasons for this. First, because few studies have looked explicitly at the relationship between the submission of physical evidence and volume crime investigation per se; most have taken a much more generalist approach to submissions both in the UK and overseas (for instance Ramsay, 1987 and McCulloch, 1996). Secondly, the structure and funding for laboratory services in the UK is difficult to compare with other countries and also has been through a period of transition over the last 20 years. To help place this in context, the current situation in England and Wales is outlined.
Resources
Type of forensic material
Offence type
Offender behaviour
Scene screening
CSE workload
CSE ability
Number /mix of crimes
Recovery Rates
Policy and resource factors
Offe n ce and forensic factors
Cleanliness of scene/
preservation
31
Materials that are authorised for submission are sent to the respective agencies for analysis. The current situation in England and Wales is that fingermarks are scanned onto the National Automated Fingerprint Information System (NAFIS) (or analysed manually using in-force fingerprint bureau records), whilst DNA samples are sent to external forensic laboratories where a DNA profile is developed for loading onto the National DNA Database. Shoemarks may be despatched to be loaded on to a force or a divisional system (see Rix, 2004 for a summary of the range of shoemark processes). Other materials such as fibres may either be analysed in-force or sent to FSS (or another supplier of forensic services) for analysis. In their Thematic Inspection, HMIC (2000) found that all forces in England and Wales have formal systems in place for managing the submission of forensic materials. These various systems were characterised as belonging to one of three basic models:
• authorisation of submissions at a local level following liaison with and screening by CSEs; • authorisation and screening of submissions at a central level within HQ scientific support;
and, • a combination of both of the above systems.
Several studies have looked at reasons for the submission of physical evidence, although they have not generally been undertaken on the basis of crime types. Excluding drugs cases, Peterson et al. (1984) found that the most frequent reason was to establish ‘association’ (between 44% and 63% depending on jurisdiction) and of these, most related to establishing a link between the offender and the scene. Between eight and ten per cent of evidence was to establish some ‘element’ of the crime (mainly rapes and arsons). Corroboration accounted for between four and ten per cent of evidence submissions, but it is important to note that the authors use a narrow definition of corroboration (involving the testing of victim statements or suspect alibis – not corroboration in the sense of supporting the case against a particular suspect). The balance of samples was accounted for by reconstructions and firearm operability. Ramsay’s (1987) analysis of material submitted to FSS Laboratories in England and Wales also explored the reasons for the police submitting physical material for analysis. This was approached from two angles: by interviewing police officers involved in cases; and by a statistical examination of case referral forms. The most common objective highlighted in the interviews with police officers was the strengthening or validation of a case against a suspect. Other specified objectives were establishing a crime had been committed, analysing items for future reference and identifying an unknown offender (the last two were cited as being comparatively rare). The statistical analysis of case referral forms revealed that (as with the US study), the issue of association was the key question being asked of FSS analysis. In 53 per cent of cases the aim was to match or link substances or items to a common source (n=593). The second most common reason was the identification of items and substances (39%). In only one-fifth of cases had a suspect not been identified before the referral of exhibits for analysis. Critically, Ramsay notes that: Virtually every time that the FSS was asked to look for a link between items, a suspect
had – almost by definition – been identified; this was also true of just over half the cases where the laboratories were simply requested to determine the nature of an item or substance. (Ramsay, 1987, p.14)
Although not a strictly comparable study, Speakman’s analysis of 427 DNA volume crime hits in England and Wales (1995-1999), is indicative of the change towards the inceptive application of forensic techniques. Of Speakman’s sample, DNA was used to initially identify the suspect in 69 per cent of cases, while corresponding figures for use for corroboration and elimination purposes were ten per cent and three per cent respectively.

32
Not all recovered forensic materials are submitted for further analysis (or for subsequent loading on forensic databases). There are a range of reasons why ‘attrition’ occurs between retrieval and submission, ranging from the poor quality of the forensic material recovered or financial constraints on what can be submitted for analysis (Saulsbury et al., 1994; HMIC, 2000). What seemed to be a very unbalanced relationship between (potential) materials recovered from crime scenes and those that were submitted for examination was an important theme of US research during the 1970s. Indeed, the apparently minimal contribution of forensic science laboratories to the overall criminal justice process could be considered to be the starting point of much of the early research enquiry in to physical evidence, particularly in the US. The explanation for low utilisation rates of physical evidence by laboratories partly lay in the complex nature of the attrition process that preceded material being submitted to a laboratory for examination (which have been described in some detail). The inability of the US laboratory infrastructure to deal with all but the most serious of crimes also reflected the growing dominance of drug cases within the laboratory workload (cf. Peterson et al., 1984). In England and Wales, Saulsbury et al., (1994) examined the reasons why forensic material was not submitted for analysis. Financial considerations were cited as the most common reason as to why items were not submitted to forensic laboratories (40% of cases, n=114). A simple way of exploring changes in the overall volume of non-fingerprint forensic submissions in England and Wales is to examine the number of cases submitted for examination and how this has changed over time. Ramsay (1987) presented figures on cases submitted to the Forensic Science Service for 1984; more recent data on cases for the period 1991/92-1996/97 were published in the HMIC Thematic What price policing? (1998). In England and Wales, the impact of the setting up of the NDNAD and more recently the DNA Expansion Programme have had a profound effect on the number of volume crime scenes from which material is submitted for analysis. In 1984, forensic material from 0.4 per cent of all burglaries was submitted to the FSS for analysis (note that these figures exclude fingerprint analysis). In the year that the National DNA Database was established (1995), burglary submissions more than doubled to 10,654 compared with the previous year, a number equivalent to one per cent of all burglaries (Table 4.4). Although the figure is not strictly comparable with those in previous years, by 2002/03 the number of DNA submissions from dwelling and other burglary scenes (rather than cases) submitted to the DNA database had increased to almost 30,000. Table 4.4: Cases submitted to the FSS by English and Welsh forces (excluding London): selected years 1984 1991/92 1994/95 1995/96 Burglary 3,030 4,126 4,593 10,654 Robbery 343 550 541 691 Sexual offences 1,508 1,682 1,604 1,642 Homicide 422 691 667 664 Source: Ramsay, 1987; HMIC, 1998. Studies that explored submissions issues have pointed to the fact that, in very simple terms, submissions are authorised in two ways: either through careful screening of the number and types of cases for submission, or by submitting all potential materials for analysis (HMIC, 2002; MHB unpublished year 1; MHB unpublished year 2; MHB, 2004). There are obvious strengths and weaknesses inherent in both of these systems. Strict screening of submissions ultimately reduces the costs involved in forensic analysis but also heightens the risk of not analysing items that may have the potential to identify offenders. On the other hand, ‘liberal’ policies may reduce this risk of missing identifications but are far more expensive and likely to result in high numbers of poor quality submissions and ‘legitimate access’ marks and stains (HMIC, 2000; HMIC, 2002).

33
One of the problems of focusing on retrieval rates as a measure of performance is that they will not reflect the final quality of material retrieved. For DNA in particular, retrieval is only a measure of intermediate forensic performance. Hence it is of little value if retrieval rates are high but the quality of the material retrieved (and subsequently submitted for loading on to forensic databases) is low. This can lead to highly inefficient effects, due to the additional costs of processing retrieved material that is poor in quality, and ultimately irrelevant to a successful investigative outcome. In a joint research FSS/force project aimed to test the effect of increasing scrutiny of submissions to the NDNAD on detections (Bond, unpublished) it was found that by scrutinising the quality of DNA crime scene stains prior to submission, the number of successful DNA profiles loaded on to the database increased, even though the number of submissions had actually fallen markedly. The number of stains submitted to the NDNAD fell from 1, 593 between October 2000 – 2001 (i.e. pre-initiative) to 566 (January 2002–December 2002). Nevertheless, DNA detections increased from 262 primary detections to 374 in the second period. Staff awareness of the potential for retrieving DNA does appear to be an important factor. In one in-force study, it was found that, after additional awareness training for all staff involved in the DNA process, combined with a review of activities undertaken during scene examination, the proportion of DNA samples submitted increased from 43 per cent to 72 per cent of recovered samples (Wells, unpublished). Table 4.5 gives an overview of submission rates in relation to recovered material from recent UK studies. The picture for England and Wales indicates that submission rates as a proportion of marks/material retrieved are slightly higher for DNA than for fingerprints. The high submission rate for DNA in England and Wales has in part been facilitated through the impact of the DNA Expansion Programme. Between April 2000 and March 2004, the Home Office provided £182m towards DNA Expansion with the aim of increasing the number of scenes of crime (and offender) samples on the National DNA database (FSS, 2004). Prior to the DNA Expansion Programme, submission rates for DNA were found to range widely across forces with some submission rates below 50 per cent, reflecting a mixture of inadequate systems or attempts to minimise the costs of processing (HMIC, 2000). Table 4.5: Submission rates by type of material recovered Fingerprints All scenes, England and Wales, (MHB 2004)
71% of fingerprints recovered from scenes submitted to the force fingerprint bureaux
DNA Other burglary (all forces in England and Wales) (MHB, 2001)
76% of DNA recovered from scenes submitted
All crime scenes (all forces in England and Wales) (MHB, 2001)
76% of DNA recovered from scenes submitted
Summary This chapter has examined research around crime scene examination, the retrieval of physical material and its submission to laboratories. Only one study was identified that had involved observing what crime scene examiners do at scenes, and how they fit into the broader investigative process. In the US police department studied, CSEs were found to be disjointed members of an investigative team, fitting uncomfortably into the more rank-based structure of mainstream policing. The work of individual CSEs was poorly quality controlled–investigation reports, the main assessment tool for a CSE’s performance, were found to be rarely reviewed. Victim perceptions of the service provided by the CSE were generally positive and this was generally acknowledged by CSEs themselves as an important part of their wider role. Other studies have, however, found victims to be critical of ill-considered CSE examinations.

34
The initial screening of offences for forensic examination makes it hard to establish genuine base rates for the potential to retrieve forensic material from crime scenes. A study which involved attendance by forensic specialists at unscreened major felony crime scenes found that fingermarks were present at similar proportions of burglary dwelling and vehicle crimes (41%) and 45 per cent of non-residential burglaries. The failure of scenes to yield physical evidence was usually due to scenes being cleaned prior to CSE attendance, inaccessible scenes, or minimal disturbance by the offender. Most studies of retrieval rates at burglaries have consistently identified fingerprints as the most frequently retrieved contact trace material, with typically just under one in three residential burglary scenes attended resulting in the retrieval of fingerprints. Data on English and Welsh retrieval rates put DNA retrieval at ten per cent of all scenes visited (similar to shoemarks, although these recorded a greater variation between forces). Relatively high retrieval rates per crime scene visited are generally associated with crimes which are more frequently subjected to selective CSE attendance (screening), such as vehicle crime. Retrieval rates for offences receiving high levels of attendance (such as burglary dwelling) are, by comparison, generally lower. Even when comparing rates for particular material within particular crime types, marked area by area variations in retrieval rates are a common finding. Factors influencing retrieval rates over which the police have influence include: the quality of initial advice on preservation; the resources available to examine scenes; the overall demand put on those resources (usually measured in workload): and policies in relation to forensic attendance. Attempts to explore the statistical relationship between attendance rates and retrieval rates (per scene visited), within particular crime types, have generally failed to find a clear relationship between the two. An analysis of force attendance rates and retrieval rates per scene visited (DNA) for burglary dwelling in English forces revealed a poor correlation. In a more limited study in three US forces, it was found that high attendance rates could result in relatively high recovery rates for fingermarks. An evaluation of an Australian police operation to increase the proportion of volume crime scenes visited by CSEs, did not generally find an improvement in key outcome measures (including retrieval rates). However, the authors argued for caution in interpreting these findings, due to weaknesses in the original intervention and some of the underpinning assumptions. In summary, the findings from these studies suggest that high attendance rates do not appear to be an impediment to high retrieval rates per scene visited. By the same token, low attendance rates do not appear to be a necessary guarantee of high retrieval rates per scene visited. A range of other factors, such as how scenes that receive a visit are selected, the ability of individual CSEs, the speed of response, resourcing and communication/integration with police officers, are all likely to be important influences on retrieval rates. Several qualitative studies of the variations in retrieval rates have highlighted the importance of other factors. Explorations of the relationship between resources and retrieval rates indicate that greater resources do not necessarily generate higher retrieval rates across similar crime types, suggesting that factors such as the degree of integration and communication between police and scientific support appeared to be important in determining retrieval rates. Retrieval rates are, of course, only an intermediate measure of performance. High retrieval rates of poor quality material can bring about low downstream inefficiencies as resources are used to test (but ultimately discard) forensic material. Not all retrieved material is submitted. This has reflected the direct costs of processing evidence and the quality of material retrieved. The direct costs of processing have often put a brake on what is submitted for analysis (although more serious cases will largely be exempt from this). In England and Wales, the combination of setting up the DNA Database and funding supplied through the DNA Expansion Programme has led to a real increase in the proportion of burglary (and other volume crime) cases in which material is submitted for scientific analysis.

35
Several studies have examined the reasons why cases are submitted for forensic analysis. Those that predate the development of widespread automation in searching on forensic databases, and the application of DNA to volume crime investigations, point to the overwhelming importance of forensic material as corroborative evidence against suspects already known to the investigation. The use of retrieved material act as an inceptive tool so providing a first link to offenders was rare in studies undertaken in the 1980s.

36
5. Information and evidence gathering (2): post-submission What happens after physical evidence has been submitted to the relevant laboratory depends on the type of material and the systems available for storing and/or comparing it. Developments in the storage and analysis of DNA and other material have brought about considerable changes in this area. Peterson et al., (1984) described the situation for examination of physical evidence in the US in the late 1970s as follows:
Most laboratories exercise considerable discretion when deciding to examine an item of evidence, depending on their scientific assessment of the potential value of such analyses. Laboratories may defer the examination of evidence until a suspect has been located…will frequently not analyze bloodstains found at the scene unless a suspect is present from whom comparative blood sample can be drawn. (Peterson et al., 1984 p.69)
To put this in context, in one of Peterson et al.’s four sites, the laboratory examined only 25 per cent of all burglary cases submitted, although two others examined close to 100 per cent (the fourth examined just over 71%). In prioritising cases, Peterson et al. identified five factors influencing decisions to analyse submitted material. • Emergency cases, including examples of ‘perishable evidence’. • Seriousness of the offence, with crimes against the person taking precedence over property
crimes. • Suspects, depending on the case and the evidence available, with cases without a suspect
given a much lower priority. • Prosecutor or judicial requests. • Scientific evaluation of the evidence. Furthermore, besides selecting which cases to examine, only a proportion of the potential evidence associated with a particular case usually would be submitted for examination. Peterson et al. found relatively high proportions of evidence collected being used in burglary cases (between one-half and over four-fifths). This, it was argued, reflected the lower volumes of evidence collected per case in property crimes. Achieving identifications It is in the area of forensic evidence processing that the last 20 years have seen the most significant developments. Petersilia’s (1978) description of searching techniques for fingerprints in police departments in the 1970s provides a useful picture of how this was done prior to the widespread introduction of automated searching:
The most frequent type of search performed by fingerprint specialists is referred to as a request search. In this case, the investigator has suggested one or more possible suspects for the crime, and has submitted their names to the fingerprint unit so that a search of the latents [scene marks] against their fingerprints can be made. The analysis that follows that request searches are responsible for a majority of suspect identifications. When suspects are not named by the investigating officer, the identifications bureau may perform one of two types of independent searches on latent prints. The first and most

37
common type, is a latent print file search. The prints of an arrested suspect are automatically searched for a match in the latent prints, usually by the crime type and the area in which he was arrested. In addition, the fingerprint specialist may search a specialized ‘repeat offender’ file that many departments maintain. Some [smaller] fingerprint identification sections…also conduct cold searches. In a cold search, the specialist takes a latent print and manually searches the entire fingerprint file, or a section of the file, in an attempt to match the print with one of the fingerprint cards. This is an extremely laborious process, and nearly impossible in large police departments where the fingerprint file may contain more than 300,000 sets of prints.
Within this general description, variations were found in the processes used in different police departments. As Table 5.1 shows, Washington DC achieved ‘a majority’ of identifications from ‘request’ searches, while Miami specialists produced nearly half of their identifications from ‘own initiative’ searches, and Richmond made 20 per cent of identifications from cold searches. Table 5.1: Summary of fingerprint identifications in three US police departments Washington, DC Miami, Florida Richmond, Ca Request searches Own (i.e. bureau) initiative Cold
465
147 -
183
176
20
224 -
54
Percentage of identifications from prints a
4.3% 9.0% 9.9%
IDs per equivalent fingerprint specialist per year
42 135 397
(a) Data relate to all crime scenes Source: Petersilia, 1978. Apart from offering a historical perspective on the productivity of fingerprints in yielding identifications, Petersilia’s analysis includes several helpful observations on what actually lies behind both the different ID rates and variations in productivity. The high productivity rate for Richmond (Ca.) was explained by the fact that: the CSEs were well trained; the high numbers of successful cold searches; and, critically, that ‘he [the fingerprint technician] works closely with detectives’. This feature, and in particular the links between fingerprint specialists and detectives in identifying MOs to guide own initiative searches, was also noted in Miami. Petersilia concluded that because request searches were such an important feature in all forces, overall fingerprint productivity depended heavily upon the inclination of investigators to request fingerprint searches. Automated fingerprint searching: evaluations Amongst Petersilia’s recommendations, greater investment in fingerprint identification (rather than initial collection) was favoured, since it appeared that identification rates remained low regardless of how well forces performed in collection. In Petersilia’s analysis of residential burglary cases in Richmond (Ca), Berkeley and Long Beach, it was noted that high crime scene attendance and high retrieval rates, were not matched by proportionately high identifications. Richmond (Ca), with its high attendance rates and retrieval rates of 60 per cent (nearly double Berkeley, the second best of the three), did not go on to generate a better overall performance in achieving identifications. In fact Long Beach, the poorest of the three in terms of evidence technician requests and proportion of cases yielding prints, had the best perpetrator identification rate (1.5% of all cases compared to 1.2% for Richmond and 1.1% for Berkeley). This was strong evidence to

38
support the premise that the relatively labour intensive, predominantly suspect oriented/corroboratively-focused approach to fingerprints could be revolutionised through automated searching. Indeed the introduction of automated fingerprint searching has been an important feature of developments in fingerprint technology since the mid-1970s in the US. Although it seems reasonable to assume that other studies have been commissioned on the impact of State-wide automatic fingerprint processing systems, only five could be identified through online searches. The focus of the evaluations varied. Several have looked at the impact of automated fingerprint processing on the criminal investigation process (such as the one undertaken in Minnesota (Coleman, 1980) and Kentucky (Cordner, 1990)). Other studies have tended to be less concerned with the criminal justice affects of Automated Fingerprint Recognition (AFR) and have focused instead on the accuracy and efficiency of the systems and their cost savings (SEARCH group (undated) on Arizona’s system, and Wolfe & Associates (1989) on Hawaii). The Minnesota and Kentucky studies are worth summarising briefly. The Minnesota Automated fingerprint identification process was the first automated fingerprint identification system to be introduced in the US in 1978, and was followed soon after by Maryland, Texas and California. The Minnesota system (known as MAFIN) enables the searching of unknown fingerprints from a crime against the fingerprints of known offenders. The system also compares newly arrested persons’ prints with those on file to check for aliases or prior records (Coleman, 1980). The evaluation examined the impact of MAFIN in the first year of use and revealed wide variations in first year performance between St Paul, Minneapolis and the State database (the Bureau of Criminal Apprehension (BCA)). For St Paul, the annual figures were as follows: • 3,120 fingerprints retained in the first year. • 19 per cent of retained fingerprints searched on MAFIN (c590). • 11 per cent of searches generate hits against known offenders. • The total number of hits was 95. The number of hits in Minneapolis and by the BCA was much less impressive (only 21 and 6 respectively). The evaluation suggests that St Paul’s success in part reflects the number of its juvenile card files relative to the other two agencies. An analysis of the first 100 hits revealed that 55 per cent of St Paul hits were for juveniles – St Paul’s Juvenile file was more than three times the size of Minneapolis, while the BCA did not collect juvenile prints. The ‘productivity’ of the St Paul juvenile file is illustrated by the fact that only four per cent of all records were juveniles. One- fifth of St Paul’s hits resulted from an offender’s prints being added to the file and matched with a fingerprint from a previous unsolved crime. Finally the study noted that the impressive performance of St Paul in part reflected a concerted effort to search for, and to identify, good quality fingerprints at scenes, and to search them against known offenders. In this respect, the initial activity associated with the introduction of MAFIN was not necessarily indicative of ‘normal’ MAFIN activity. In St Paul, the system was found to be most effective in identifying burglary suspects, which accounted for 68 per cent of all hits. It was estimated that these additional MAFIN-generated hits accounted for seven per cent of all cleared burglaries in the district. Finally the study assessed the net improvement in the effectiveness of MAFIN. Pre-MAFIN, all manual identifications involved known suspect searches. In its first year, MAFIN-generated hits in St Paul accounted for 37 per cent of all hits (337) in 1979. This increase in searches did not take place at the expense of manual identifications (which also increased over the previous year). However, it is worth noting that both the extra effort that went in to searching, combined with the picking up pre- MAFIN crime scene hits in year 1, may have inflated initial performance to a level above what would be considered more likely from the mature performance of the system. A similar evaluation was undertaken on Kentucky’s Automated Fingerprint Identification System (AFIS) (introduced in 1988-1989). The evaluation painted a much less impressive picture of a

39
state wide AFR system, with the data from the first 20 months of AFIS registering what the author described as ‘clearly minimal impact’. In this period, the system averaged less than three suspect hits per month, of which typically one was a backlog case (i.e. the scene or individual record dated from pre-AFIS times). As with other AFR studies, most suspect hits were for burglary offences. The evaluation also looked at post hit activity and noted that out of 59 AFIS-generated hits only 23 resulted in arrests (it was suggested that many of these might be offenders who were already incarcerated). Overall, the suspect hit rate was found to be three per cent which appears low when compared with other jurisdictions which typically were achieving rates of ten to twenty per cent. The evaluation provides a number of reasons as to why relatively few fingerprints were run through the system and why the suspect hit rate seemed low. These can be summarised under two headings: the poor retrieval of fingerprints; and the limitations of the database. Poor retrieval and processing of fingerprints • Insufficient CSEs. • Reluctance of patrol officers to retrieve fingerprints. • Retrieved prints not submitted to AFIS (due to lack of knowledge of its capabilities). • Insufficient training/resources to operate AFIS terminal in some areas. Limited ten-print data base • Incomplete database of ten-prints from arrested persons (failure of patrol officers to routinely
submit ten print cards). • No coverage of juvenile offenders. • Generally poor quality control of ten-print processes. These studies point to two critical features of introducing automated searching. First, automated searching is not a panacea. The complex connectivity of fingerprint processing means that critical weaknesses in any stage or stages can seriously limit the potential benefits which can come from automated searching. Secondly, the studies point to the importance of property offences (and burglary in particular) as the source of fingerprints, and property offenders (mainly burglars) as those most likely to be thrown up through database searches, and the consequent need for good coverage of juvenile offenders within ten-print datasets. In the UK, individual forces started putting their fingerprint systems on searchable computer records during the 1980s. The MPS’s own Automated Fingerprint Retrieval system became operational in 1984 (Warboys, 1987). AFR was adopted by the majority of forces during the 1990s. Joining adjacent forces’ AFR systems together was first introduced in 1992 by a consortium of forces, allowing mutual searching of prints held on the consortium’s database. The NAFIS system was introduced in 2001 and linked all fingerprint bureaux in England and Wales, allowing forces to interrogate the system by searching crime scene and suspect prints against a national database (MHB, 2004). Fingerprints are identified either by speculative searching of fingerprint collections or by direct comparison with a nominated suspect. Unlike DNA, unique matches are not thrown up by fingerprint searches, and generated lists of similar prints need to be subjected to a process of human checking once an identification is made (in accordance with ACPO guidelines; this is subject to confirmation by two other fingerprint officers). It is possible to compare recent performance in fingermark retrieval with that from older studies in the US (Petersilia, 1978). There are differences in the sample size and data collection method, as well as cross-cultural differences, but as a measure of how fingerprint identifications have improved over time the data can give some order of magnitude. Between 1.1 per cent and 1.5 per cent of all burglary offences in Petersilia’s three sites ended up yielding a fingerprint identification. This equates to between 1.4 per cent and 2.6 per cent of scenes where CSEs were requested. Using unpublished performance indicator data for domestic burglaries in England and Wales in 37 forces (2002/03), the fingerprint identification per burglary scenes visited rate is 4.7 per cent, whereas the identification rate for all burglary offences is 3.5 per cent (Table 5.2).
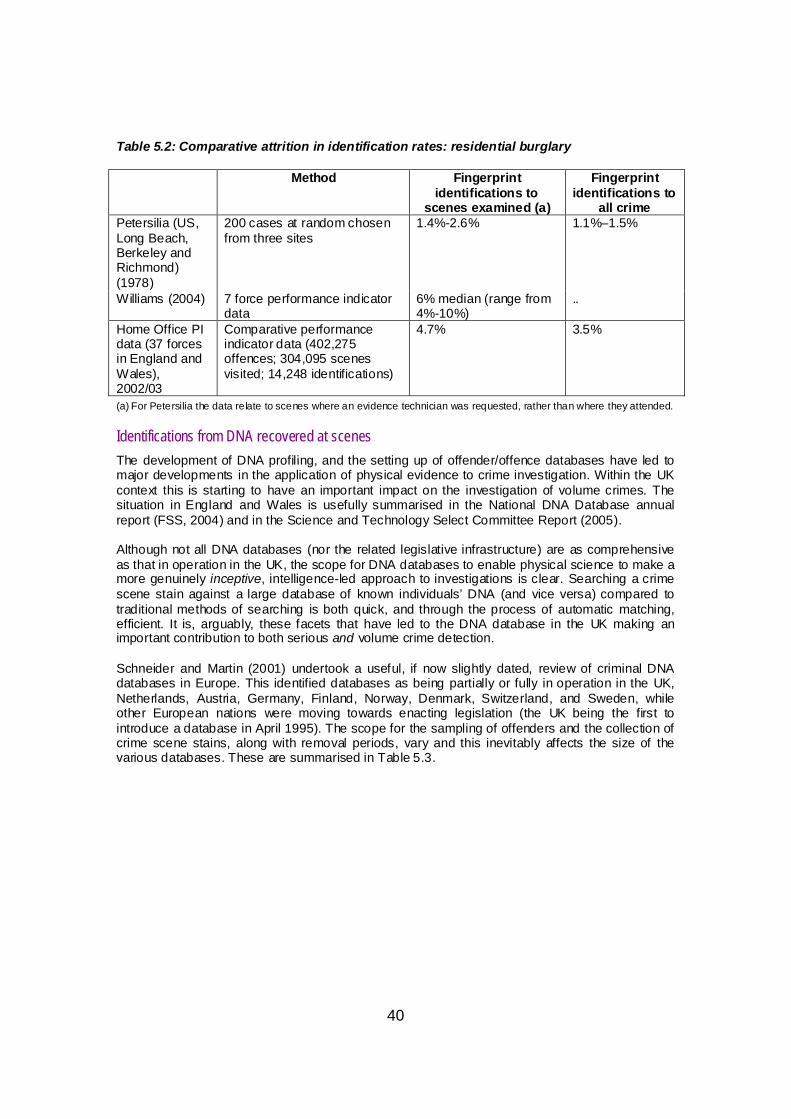
40
Table 5.2: Comparative attrition in identification rates: residential burglary
Method Fingerprint identifications to
scenes examined (a)
Fingerprint identifications to
all crime Petersilia (US, Long Beach, Berkeley and Richmond) (1978)
200 cases at random chosen from three sites
1.4%-2.6% 1.1%–1.5%
Williams (2004) 7 force performance indicator data
6% median (range from 4%-10%)
..
Home Office PI data (37 forces in England and Wales), 2002/03
Comparative performance indicator data (402,275 offences; 304,095 scenes visited; 14,248 identifications)
4.7% 3.5%
(a) For Petersilia the data relate to scenes where an evidence technician was requested, rather than where they attended. Identifications from DNA recovered at scenes The development of DNA profiling, and the setting up of offender/offence databases have led to major developments in the application of physical evidence to crime investigation. Within the UK context this is starting to have an important impact on the investigation of volume crimes. The situation in England and Wales is usefully summarised in the National DNA Database annual report (FSS, 2004) and in the Science and Technology Select Committee Report (2005). Although not all DNA databases (nor the related legislative infrastructure) are as comprehensive as that in operation in the UK, the scope for DNA databases to enable physical science to make a more genuinely inceptive, intelligence-led approach to investigations is clear. Searching a crime scene stain against a large database of known individuals’ DNA (and vice versa) compared to traditional methods of searching is both quick, and through the process of automatic matching, efficient. It is, arguably, these facets that have led to the DNA database in the UK making an important contribution to both serious and volume crime detection. Schneider and Martin (2001) undertook a useful, if now slightly dated, review of criminal DNA databases in Europe. This identified databases as being partially or fully in operation in the UK, Netherlands, Austria, Germany, Finland, Norway, Denmark, Switzerland, and Sweden, while other European nations were moving towards enacting legislation (the UK being the first to introduce a database in April 1995). The scope for the sampling of offenders and the collection of crime scene stains, along with removal periods, vary and this inevitably affects the size of the various databases. These are summarised in Table 5.3.

41
Table 5.3: European DNA databases: coverage and date of inception (as at Spring 2000) Start date Offenders Unknown
samples Hits – person to sample
Hits – sample to sample
UK 1995 764,000 75,200 70,400 10,400 Netherlands 1997 600 2,200 Small number due to procedural
problems Austria 1997 25,000 3,500 380 210 Germany 1998 32,100 3,900 200 Finland 1999 1,800 600 100 20 Norway 1999 150 None at time .. .. Denmark 2000 .. .. .. .. Sweden 2000 .. 60 .. .. Switzerland 2000 .. .. .. .. Source: adapted from Schneider and Martin (2001). Schneider and Martin note that several countries have adopted different stances to the UK in terms of issues of privacy, due process and data protection. In the Netherlands, for instance, at that time, intimate samples could not be obtained without consent from a perpetrator in cases where crimes attract a sentence of less than eight years imprisonment. Moreover, a database search is not undertaken automatically after a profile has been added but only upon the request of an investigating judge or prosecutor in a specific case context. This limits the number of ‘cold hits’. Restrictions on who could be sampled exist in Sweden (and originally in Germany, but these have now been relaxed). DNA legislation in New South Wales, Australia, gives police the power to take DNA samples from those arrested for an offence carrying a sentence of five years or more. The legislation also extended sampling powers to include suspects where police have reasonable grounds to believe that that person has committed such an offence. In contrast to the UK system, the sample has to be taken with informed consent of the individual. This legislation also made provision for setting up Australia’s national DNA database through the interstate exchange of information on DNA databases in other jurisdictions. Forensic matches and identifications The following section focuses solely on forensic matches and identifications. Marks or material lifted from crime scenes which, when loaded on to forensic databases also containing offender samples/marks may yield matches (for DNA) or identifications (for fingerprints). Not all forensic materials submitted for analysis are analysed and ‘loaded’ onto their respective intelligence systems. Hence, not all submitted DNA material or fingermarks will be of a sufficiently high quality to be loaded. The evaluation of the DNA Expansion Programme (MHB, year 2 unpublished) revealed that profiles obtained from around seven out of ten DNA scene samples submitted by forces in England and Wales were loaded onto the NDNAD in the second year of the Programme (70%). DNA samples from thefts of vehicle crimes had the highest proportion of successful profiles loaded, where as violence and sexual crimes had the lowest. A study by Walsh, Moss, Kliem and Vintiner (2002) included an examination of the success rate for different types of profiles loaded on to the New Zealand Crime Sample Database. Blood accounted for 58 per cent of all samples, with ‘bottle swabs’ the second most common category of sample (10%). Submissions of blood samples were most likely to be successfully loaded on the database (72.5% of submitted blood samples successfully loaded). Hair samples were least likely to be successfully loaded (only 16%). The main findings are summarised in Table 5.4.

42
Table 5.4: Samples submitted and success rate (New Zealand) Sample type Number submitted Number loaded Success rate (%) Blood 2,565 1,861 72.5 Semen 294 213 72.4 Cigarette butt 352 175 49.7 Bottle swab 441 184 41.7 Saliva 224 91 40.6 ‘Trace’ 387 89 23.0 Hair 159 26 16.4 Walsh, Moss, Kliem and Vintiner (2002). Table 5.5 summarises data from studies that have examined the rates of forensically derived identifications and matches. As in previous sections, the way in which particular outcome data are related to base populations varies from study to study. Identifications/matches are compared to the number of crime scenes examined and as a proportion of forensic submissions. For the sake of consistency, data are only presented in the form of identifications as a proportion of submissions. Table 5.5: Proportion of submissions resulting in matches/identifications, by crime type All burglary All crime Fingerprints 33% of ‘useful’ fingerprint files
retrieved from scenes yield identifications 1999-2000 (MHB unpublished data for one force)
c 20% of submissions resulted in identifications (5 forces, MHB 2004)
DNA
New Zealand – national average match rate (crime to person matches as a proportion of cases loaded), 37% (range for all12 districts, 8.3%-44.3%) (Walsh, Moss, Kliem and Vintiner, 2002)
Evaluations of the DNA Expansion Programme (MHB, unpublished year 1; MHB unpublished year 2) have presented various analyses of matches on the NDNAD. The Home Office DNA Expansion Programme was set up with the aim of providing sufficient funding to enable the police to take samples from all active offenders and to increase the retrieval and use of DNA material left at volume crime scenes. Prior to the Programme, samples were taken from an average of 200,000 offenders per year; by 2003/04 this had increased to over 450,000 per year. The first point to note is that (based on data from 2000/01), 96 per cent of matches are to samples provided by charged individuals (so-called criminal justice or subject samples) against crime scene samples, while the remaining four per cent are ‘scene to scene matches’. Comparable figures for New Zealand (Walsh et al., 2002) indicate a slightly smaller proportion of scene-subject sample matches (87% of a cumulative total of matches – 1997-2001 (20,778) – were person-to-scene with the remaining 13% scene-to-scene). Further analysis of the ‘subject to scene’ matches in England and Wales revealed that in just over one-third (35%) of cases, the scene sample was loaded prior to the subject sample. In other words, 35 per cent of matches result from adding new suspect profiles onto the NDNAD which already holds a DNA profile taken from a crime scene. The breakdown of subject-to-scene matches shows that 70 per cent of these are made up of only three offence types – residential burglaries (29%) and burglary ‘other’ (34%), and theft of motor vehicle (20%). The breakdown of crime scene samples loaded roughly mirrors the crime type breakdown of subject-to-scene matches, whereas the breakdown of subject samples loaded is quite different. On a related point MHB (MHB unpublished, year 2) observed that in a sample of over one thousand NDNAD matches, 80 per cent of subject samples produced matches against offence types that were different to that for which the suspect had been arrested.

43
According to a statistical summary provided in the DNA Database Annual report, in 2003/04 one or more suspects were nominated for 41,618 crime scenes held on the Database. Of the total, three offences dominate: taking a vehicle without consent (8,558, 21% of the total); domestic burglary (8,294 scenes, 20%), and burglary other (7,897 scenes or 19%). In short, 60 per cent of DNA scenes linked to one or more suspects in 2003/04 were accounted for by these three volume crime categories. A study by Leary and Pease (2003) analysed DNA submissions and matches from West Midlands police. Over a 19-month period they observed that the proportion of submitted crime scene samples resulting in a match on the NDNAD did not change as the number of samples submitted increased. Leary and Pease suggest that increasing crime scene samples submissions led neither to diminishing returns nor improvements in match results from the fast-changing population of active offenders. Turning to the practical implications of this, they note that this reinforces the importance of taking subject samples at the earliest possible opportunity in offenders’ criminal careers. Indeed this tends to support the finding from US AFR evaluation studies that suggest that a critical factor in ensuring the effective application of these approaches is having comprehensive suspect databases with particular attention to coverage of juvenile offenders. Leary and Pease also noted, for the same reasons, that the effectiveness of the NDNAD for detecting crime will not grow indefinitely with the size of the database but is dependent on the addition of recently identified offenders. Finally they concluded that, in terms of overall effectiveness, there were no apparent grounds for limiting the submission of crime scene samples since the study indicated that greater numbers of submissions did not lead to diminishing match rates. Variations in identification rates Suspect identification rates are the culmination of numerous activities upstream in the forensic process. Not only are rates dependent on policies and practices employed for the handling of suspects (see Chapter 6), they are equally dependent on scene attendance, evidence gathering activities, and submission policies. One of the principal considerations in the formulation of scientific support policies is how to maximise rates of matches and identifications. Consequently, it is likely that variations in these rates across offence types and between different forces are the result of factors influencing forensic activities already described in this review. For example, force scene attendance policy will influence variation in forensic identification rates across offence types, while the ability of individual CSEs and their workloads are just two of the factors likely to contribute to variations in identification rates across forces. A recent attempt to explore in more detail aspects of forensic performance in several English forces has been undertaken by the Lanner group (2004). This work has come about through the work initiated by the Home Office Police Standards Unit to improve forensic performance; a published document summarises the processes involved (Green and Loader, 2005). The general approach was to adopt data mining techniques to link different component parts of the forensic process. The data mining process brought together data from Locard (a system linking crime scene attendance through to identification) with the force crime recording and detection datasets. Data on one force’s entire crime scene examinations for an 8-month period in 2003 were analysed. Although the ultimate aim is to model forensic processes at different levels of input etc, the approach does involve the analysis of empirical data. Several aspects of this part of their work are worth reporting on. First the analysis explored the overall (i.e. all crime type) relationship between scene examinations and a range of other factors in order to identify which factors appear to be associated with forensic identifications (either DNA or fingerprints). The factor most associated with achieving an offender identification from a scene visit was the number of exhibits retrieved (the more retrieved the higher the likelihood of a match). The second most important factor was the nature of the offence; and the third most important was the individual CSE in attendance. Of the three, the first two are perhaps expected outcomes, while the third is possibly surprising. Factors that were found to have little influence on the likelihood of an identification

44
were time between examination and the lifted material arriving at the centre, and, where the crime occurs (i.e. the force division, albeit within only one force). Additional analysis of individual CSE performance found marked variations in individual CSE performance in terms of DNA matches/fingerprint identifications per scene visit (ranging from 8% to 2%). These aggregate results might reflect legitimate differences arising from different scene opportunities for individual CSEs (in other words, more productive scenes being visited disproportionately by ‘good’ CSEs), but further analysis did not suggest this was the case. Variations by gender, length of service or division were also hard to identify (although 5 of the 6 worst performing CSEs were male). Poor performing CSEs fell in to one of two categories: those that took higher than average numbers of lif ts from scenes but ultimately achieved few identifications; and those that simply retrieved from a small percentage of scenes visited (although the quality of retrieved material was acceptable). On the basis of this quantitative data, it was concluded that most of the statistical variation in individual examiner performance was likely to be the result of simple differences in working practices between individuals (Lanner, unpublished). Further and more detailed observational work would however need to be undertaken to understand more clearly what kind of practices or decision-making appeared to be associated with different individual level retrieval rates. Summary Research tracks a marked change in the process by which identifications are made using forensic material. Pre-automated searching, most fingerprint identifications arose from searches of the database requested by detectives against named suspects (so called request searches). Cold searches, those involving large-scale manual searching of fingerprint files were rarely undertaken. Furthermore, performance variations at the front end of the physical material collection and retrieval process were not reflected in performance in identifying suspects. The most important factor influencing performance in forensic detections was the inclination of detectives to request searches of fingerprint databases. Automation of searching techniques was therefore identified as the critical barrier to better performance in forensic identifications. Although the development of automated fingerprint recognition systems has made the process of comparing scene and offender prints, simpler, faster and generally more effective, US studies reviewed suggest that automation does not guarantee improvements in forensic identifications. The contrasting results of two evaluations of the introduction of automatic fingerprint systems in the US (Minnesota and Kentucky) illustrate the point. Minnesota was generally seen as effective in generating additional fingerprint detections, whereas the benefits in Kentucky were marginal. In the latter, a combination of a lack of evidence technicians, the reluctance of patrol officers to retrieve fingerprints, and their failure to submit when they were retrieved, all conspired to produce a very modest improvement in fingerprint identification performance through automation. Furthermore, the particular issue of covering high property offender groups in the ‘ten-prints’ appeared to play a critical part in the success of AFR in Minnesota and the failure in Kentucky. The development of national DNA databases has been an international phenomenon since 1995, although the coverage and scope of each database varies between different countries. For the DNA National Database, of the annual total of over 40,000 crime scenes to which one or more suspects were ‘nominated’ in 2003/04, 60 per cent were for burglary and taking a vehicle without consent. A study in one English force found that the factors most associated with achieving a forensic identification from a scene visit were exhibits retrieved (the more retrieved the higher the likelihood of a match), the nature of the offence, and the individual CSE in attendance. Analysis of individual CSE performance found marked variations in terms of their DNA matches/fingerprint identifications per scene visit, likely to be a consequence of differences in working practices between individuals.
45
6. Suspect handling The focus so far has largely been on the gathering, and subsequent processing, of forensic materials found at crime scenes. Some issues in relation to suspect handling–the storage of offender details have been touched upon (evaluations of AFR have highlighted the fact that the quality and breadth of known offender databases strongly influences their effectiveness in yielding identifications from fingermarks). This chapter examines research into other aspects of the application of forensic science to the handling of suspects. The collection of forensic materials from a suspect is different from the collection of forensic materials from a crime scene. In the police forces of England and Wales, it is usually the responsibility of the Custody Sergeant to oversee the fingerprinting and DNA sampling of arrested suspects. Whenever a suspect is charged with an offence a set of ‘ten-prints’ is obtained from the suspect for comparison with the marks obtained from the scene of crime. Legislation governing the taking of fingerprints stipulates that two sets of ‘ten-prints’ are required from all persons charged or cautioned for a recordable offence. This is regardless of whether the suspect is a first time offender or recidivist. For an identification to be made and used in evidence the match between the mark and prints has to be proved by three fingerprint officers, of whom two must be recognised as experts. Until the passage of the Criminal Justice and Police Act 2001, if an individual whose fingerprints had been taken on arrest for an offence was not cautioned or convicted, the set of ten-prints related to that offence had to be destroyed. Following the passing of the Act, fingerprints need not be removed, but they will be kept in a separate part of the overall NAFIS system. For DNA, the common term for suspect samples is criminal justice (or subject) samples. These are non-intimate samples, (e.g. a mouth swab or plucked body hair) taken from suspects ‘charged, reported or convicted of a recorded offence as defined by the Criminal Justice and Public Order Act 1994’. The power to DNA sample suspects came into effect at the same time as the National DNA Database became operational, on 10 April 1995. Due to the financial implications of taking and analysing subject samples from suspects for all recordable offences, ACPO recommended that in the beginning, the minimum level of sampling should include: all suspects charged or reported for offences against the person; sexual offences; and burglary offences. In their Thematic Inspection report, HMIC (2000) found that around half of all forces in England and Wales had extended the original sampling criteria to include a larger range of recordable offences. Seven forces were by then sampling for all recordable offences, whilst another fifteen forces had extended the criteria to include drug and vehicle related crimes. Officers in some forces also had the discretion to sample for offences outside the original criteria, if there was reason to suspect that other offences may have been committed by the suspect. Prior to the introduction of the DNA Expansion Programme, HMIC (2000) found that the majority of forces in England and Wales had written policies for DNA sampling. However, it was also found that not all forces adhered to these policies. On average, forces were failing to take subject samples in 33 per cent of cases where the suspect was eligible for sampling. Two reasons offered by HMIC for ‘under sampling’ were poor monitoring of subject sampling, and budgetary constraints. HMIC (2000) found that only around half of police forces in England and Wales had adequate monitoring systems for gauging rates of subject sampling. The Home Office DNA Expansion Programme was designed to increase the numbers of both crime scene and subject DNA sample profiles held on the National DNA Database. It was explicitly designed to ensure that samples were taken from all offenders charged with recordable offences and their profiles entered on to the Database. One consequence of this has been a rapid increase in the number of subject samples loaded annually. In 2000/01 there was a doubling in the annual number of subject samples loaded on to the National DNA database (from 228,088 in

46
1999/2000 to 466,555 in 2000/01); by 2003/04, samples from 433,033 subjects were loaded on to the NDNAD (FSS, 2004). From 5 April 2004, the legal position for taking suspect samples changed when new provisions in the Criminal Justice Act 2003 came into force; DNA profiles could now be taken from all persons arrested for a recordable offence. For shoemarks, the legislative context for taking suspects’ shoemarks in England and Wales is less straightforward (Rix 2004). As Rix notes, the covert taking of shoemark impressions from prisoners’ footwear used to be relatively common practice. However, this area of activity is not covered by discrete legislation; the Attorney General’s advice on covert taking of shoemarks is that its continued use will require a change to the law. Rix noted that the current legal position was generally hindering the use of shoemarks, although the Home Office was, at that time, reviewing the legal position. Very few studies were found either in the UK or international research literature on the specific issue of the processing of forensic samples taken from suspects. McCulloch and Tilley (unpublished) found that the proportion of fingerprints taken from arrestees ranged from 85 per cent to 92 per cent of arrests across six forces. They suggested that fingerprints may not be taken for a number of reasons. These were:
• dfficulties in taking fingerprints, for example when suspects are under the influence of alcohol;
• the belief that arrestee fingerprints were for identification purposes only, and therefore recidivists did not need to be printed;
• lack of awareness about which offences required fingerprints to be taken; • problems around the processing juveniles; • the mistaken belief, in one force, that Police and Criminal Evidence Act (PACE)
regulations prohibited the taking of fingerprints once the decision to caution had been made;
• low supervision by custody sergeants at busy times; and, • a lack of communication between the arresting officer and officers dealing with the case
at a later date in bail cases.
Unlike fingerprints, which should be taken every time a suspect is arrested, DNA samples should be taken once only. Prior to taking a DNA sample, officers are required to check the Police National Computer (PNC) for a ‘DNA Confirmed’ marker on the suspect’s record. If one is present, the suspect does not require resampling. However, if the PNC record shows a ‘DNA Taken’ marker (which indicates that a sample has been taken, but has not yet been profiled or confirmed), or no marker, then the suspect may be sampled. HMIC (2000) found in their Inspection, that nine per cent of suspects sampled already had ‘DNA Confirmed’ markers on their PNC records. They suggested that this may have been the result of inadequate procedures for the updating of PNC, and confusion amongst officers between the ‘DNA Confirmed’ and ‘DNA Taken’ markers (HMIC, 2000; MHB, year 2 unpublished). Some detail on the increase in subject sampling for DNA resulting from the DNA Expansion Programme comes from the Pathfinder study (Burrows et al., 2005). At the beginning of the evaluation period both Lancashire and Greater Manchester Police changed their policies to require the sampling of all those eligible under the 1994 Act. DNA samples from those charged or cautioned increased considerably although the impact of this change was only measurable in Lancashire where subject sampling more than trebled (up 216%). The increase in subject sampling combined with retrieval of DNA from scenes brought about a marked increase in DNA matches (up by 60% across the forces for all crime in the evaluation period), although little difference was found between the Pathfinder and control divisions within the two forces. The post-Expansion Programme DNA database in England and Wales has been particularly effective in yielding hits from rapes and other serious offences against the person (FSS, 2004).

47
This is partly due to the fact that the database contains the subject samples of an increasingly high proportion of volume crime offenders. Most of those who commit murder and serious sexual offences are known to the authorities (in that a majority have criminal records), but the vast majority are not ‘specialist’ serious offenders. Most share similar characteristics to the overall offender population: they commit burglary, theft and handling and other less serious property offences (Soothill et al., 2002). As a result, maximising the ‘hit’ potential of DNA databases (and other forensic databases) in serious crime requires that the known offender database is populated by a very high proportion of the known ‘volume crime offender’ population. Summary The importance of the inclusiveness of databases in determining the effectiveness of automated fingerprint systems has already been noted in Chapter 5. In England and Wales, the taking of fingerprints and DNA from suspects is governed by specific legislation (although for the latter the position has recently changed to cover all arrestees). Little research has been undertaken on the subject of suspect handling and the retrieval of samples. The main constraint to populating suspect databases once legislation has been enacted has been the financial costs of the process.
48
7. The post-identification investigation: converting identifications into detections Detected crimes are those that have been ‘cleared up’ by the police. In England and Wales it is the police who record detected crimes, in accordance with strict counting rules issued by the Home Office. Not every case where the police know, or think they know, who committed a crime can be counted as a detection. Some crimes are not counted as detected even though the offender is apprehended for another offence; and some crimes are counted as detected when the victim might view the case as far from solved. For any crime to be counted as detected, the following conditions must apply:
• a notifiable offence has been committed and recorded; • a suspect has been identified (and interviewed, or at least informed that the crime has been
‘cleared up’); • there is sufficient evidence to charge the suspect; and, • the victim has been informed that the offence has been ‘cleared up’. The police have a number of ways in which a crime can be counted as detected. It may be by: charging or issuing a summons to an offender; issuing a caution, reprimand, or final warning to the offender; having the offence accepted for consideration in court; or counting an offence as ‘cleared up’ but taking no further action (Thomas and Feist, 2004). The development of both DNA databases and the automation of fingerprint searching systems have meant that increasingly, hits from the loading of fingerprint or DNA retrieved from crime scenes (or offenders) can yield forensic identifications or matches. In other words, a previously unknown offender is linked to a crime. The use made of forensic identifications depends on the circumstances of a particular case. If a crime scene stain or fingerprint is matched to the DNA/prints of a previously unidentified offender, the police must decide whether this particular identification is sufficient to warrant charging the suspect, or whether further corroborative evidence is required. While this is clearly an important step in the investigative process, an identification does not equate to a detection. On the basis of DNA matching, in England and Wales, in 2003/04 one or more suspects were nominated for 41,618 crime scenes (FSS, 2004). Identifications arising from loading fingerprints on to NAFIS are estimated to be running at an annual total of around 54,000 (MHB, 2004), whereas total identifications from fingerprints in England and Wales are in the region of 91,000 per annum (Forensic Performance Indicator data, unpublished). The process by which identifications are notified to the police in England and Wales is similar for both fingerprints and DNA. In their Thematic Inspection, HMIC (2000) found that all identification notifications are received at a central point within every police force, usually within the scientific support function of the force. The response to these notifications varies across forces, with information conveyed through different functions of the force and in different formats (such as, by paper record, computer or telephone). In some forces the notification is passed directly from the scientific support function to the investigating officers, in others the scientific support function of force Crime Management/Intelligence Units produce what is called an ‘intelligence pack’ containing details about the suspect. These may include:
• a physical description of the suspect; • the suspect’s last known or other contact address;
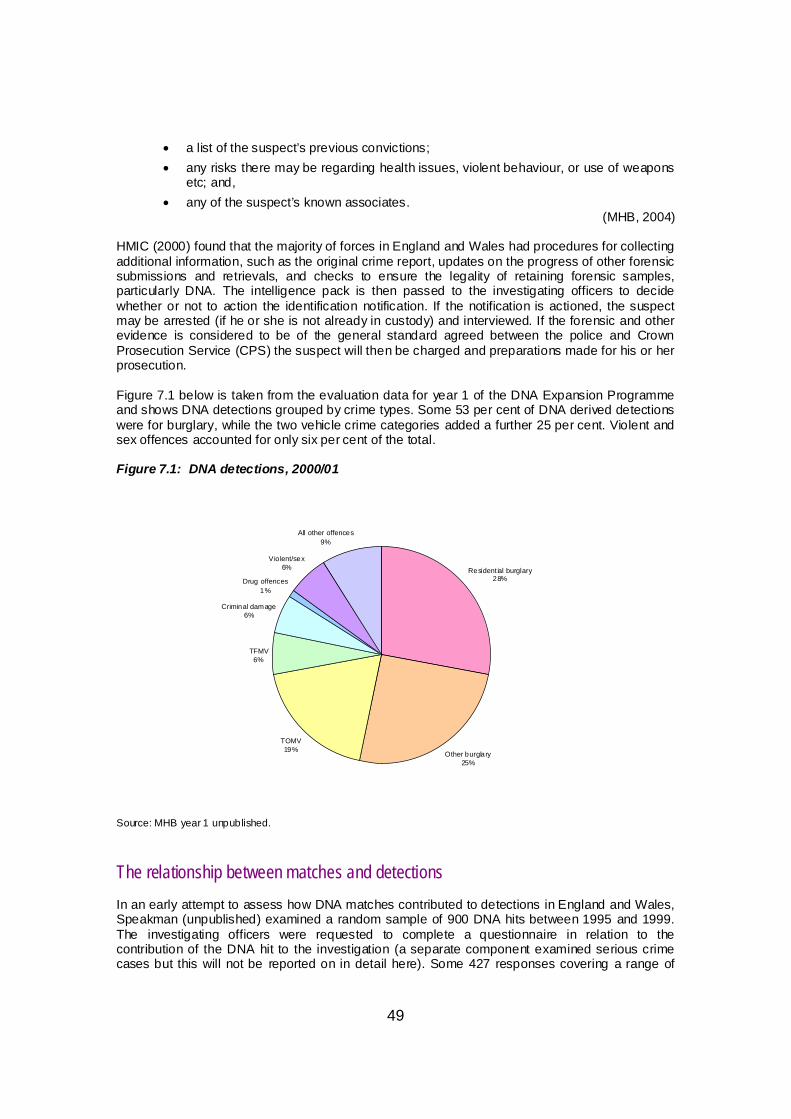
49
• a list of the suspect’s previous convictions; • any risks there may be regarding health issues, violent behaviour, or use of weapons
etc; and, • any of the suspect’s known associates.
(MHB, 2004) HMIC (2000) found that the majority of forces in England and Wales had procedures for collecting additional information, such as the original crime report, updates on the progress of other forensic submissions and retrievals, and checks to ensure the legality of retaining forensic samples, particularly DNA. The intelligence pack is then passed to the investigating officers to decide whether or not to action the identification notification. If the notification is actioned, the suspect may be arrested (if he or she is not already in custody) and interviewed. If the forensic and other evidence is considered to be of the general standard agreed between the police and Crown Prosecution Service (CPS) the suspect will then be charged and preparations made for his or her prosecution. Figure 7.1 below is taken from the evaluation data for year 1 of the DNA Expansion Programme and shows DNA detections grouped by crime types. Some 53 per cent of DNA derived detections were for burglary, while the two vehicle crime categories added a further 25 per cent. Violent and sex offences accounted for only six per cent of the total. Figure 7.1: DNA detections, 2000/01
Resident ial burglary28%
Other burglary25%
TOMV19%
TFMV6%
Criminal damage6%
Drug offences1%
Violent/sex6%
All other offences9%
Source: MHB year 1 unpublished.
The relationship between matches and detections In an early attempt to assess how DNA matches contributed to detections in England and Wales, Speakman (unpublished) examined a random sample of 900 DNA hits between 1995 and 1999. The investigating officers were requested to complete a questionnaire in relation to the contribution of the DNA hit to the investigation (a separate component examined serious crime cases but this will not be reported on in detail here). Some 427 responses covering a range of

50
volume crimes were analysed, the main categories being burglary dwelling (29%), burglary other (32%) and vehicle crime (29%). Overall, 71 per cent of hits resulted in a detection, with vehicle crime hits being underrepresented in the detections (accounting for only 16% of hits yielding a detection). Speakman’s analysis also highlights the way in which the advent of the NDNAD was instrumental in shifting towards an increasingly inceptive approach to the use of forensic techniques. Hence DNA was used to identify the suspect in 69 per cent of cases, compared with its use for corroborative purposes in only ten per cent of cases (the balance were for elimination or intelligence purposes). In terms of the evidential contribution of DNA, for all cases where a response was received (i.e. excluding those returns which did not answer this question), DNA was judged as being essential to the detection in 67 per cent of detected cases, and made some contribution in a further 17 per cent of cases. Furthermore, in 18 per cent of cases, DNA material had provided a means of linking the index offence to other offences. Pathfinder (Burrows et al., 2005) also attempted to gather information from all investigations in the Pathfinder divisions which yielded a forensic match (regardless of the contact trace material). In all cases, the officer in the case was asked to assess the contribution of the match in detecting the crime and to evaluate the match information in the light of all other evidence that was available. Of 1,719 identifications, 1,703 evaluation forms were issued of which 1,208 were returned (a response rate of 71%). In ten per cent of identifications there was more than one forensic identification. Most identifications came from fingerprints (68%), with conventional DNA yielding 17 per cent, LCN DNA a further seven per cent, and shoemarks eight per cent. Toolmarks accounted for only 15 identifications. Overall 73 per cent of identifications resulted in a detection, a proportion broadly consistent with that found in Speakman’s study for DNA. Particular emphasis was given to forensic identifications that revealed the first link between an offender and a scene. In Burrows et al.’s (2005) sample of detected cases involving a forensic match (n=883), forensic material provided the first link between an offender and an offence in 45 per cent of cases (in the remaining cases, the suspect had already been charged or a link had been gained through other means). DNA accounted for the highest proportion of so-called first link detections, with SGM plus and LCN each contributing 23 per cent of first link matches, whilst fingermarks contributed only nine per cent of such first links. Research into this aspect of the forensic process has focused on a ‘black hole’ within which identifications ‘disappeared’ after notification to forces. Several studies have pointed to what appear to be large variations in performance in converting identifications to detections, with the least effective forces having what appear to be extremely low conversion rates. The main findings from these are summarised in Table 7.1.
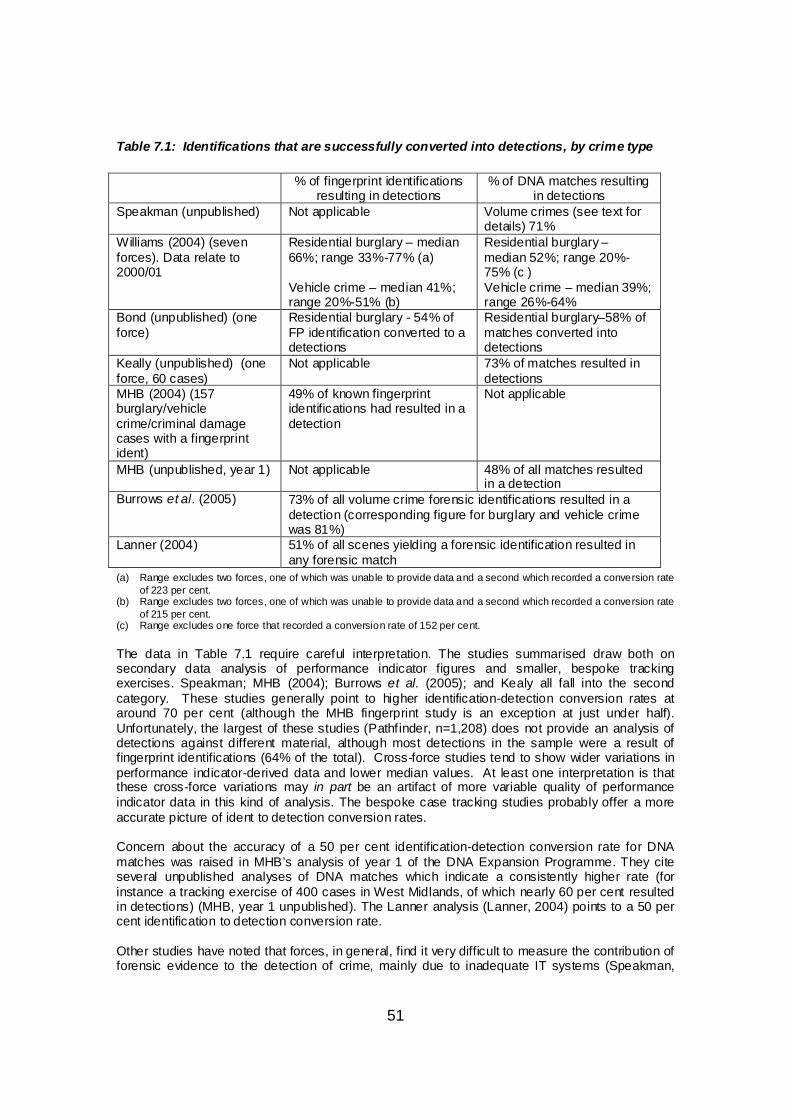
51
Table 7.1: Identifications that are successfully converted into detections, by crime type % of fingerprint identifications
resulting in detections % of DNA matches resulting
in detections Speakman (unpublished) Not applicable Volume crimes (see text for
details) 71% Williams (2004) (seven forces). Data relate to 2000/01
Residential burglary – median 66%; range 33%-77% (a) Vehicle crime – median 41%; range 20%-51% (b)
Residential burglary – median 52%; range 20%-75% (c ) Vehicle crime – median 39%; range 26%-64%
Bond (unpublished) (one force)
Residential burglary - 54% of FP identification converted to a detections
Residential burglary–58% of matches converted into detections
Keally (unpublished) (one force, 60 cases)
Not applicable 73% of matches resulted in detections
MHB (2004) (157 burglary/vehicle crime/criminal damage cases with a fingerprint ident)
49% of known fingerprint identifications had resulted in a detection
Not applicable
MHB (unpublished, year 1) Not applicable 48% of all matches resulted in a detection
Burrows et al. (2005) 73% of all volume crime forensic identifications resulted in a detection (corresponding figure for burglary and vehicle crime was 81%)
Lanner (2004) 51% of all scenes yielding a forensic identification resulted in any forensic match
(a) Range excludes two forces, one of which was unable to provide data and a second which recorded a conversion rate of 223 per cent.
(b) Range excludes two forces, one of which was unable to provide data and a second which recorded a conversion rate of 215 per cent.
(c) Range excludes one force that recorded a conversion rate of 152 per cent. The data in Table 7.1 require careful interpretation. The studies summarised draw both on secondary data analysis of performance indicator figures and smaller, bespoke tracking exercises. Speakman; MHB (2004); Burrows et al. (2005); and Kealy all fall into the second category. These studies generally point to higher identification-detection conversion rates at around 70 per cent (although the MHB fingerprint study is an exception at just under half). Unfortunately, the largest of these studies (Pathfinder, n=1,208) does not provide an analysis of detections against different material, although most detections in the sample were a result of fingerprint identifications (64% of the total). Cross-force studies tend to show wider variations in performance indicator-derived data and lower median values. At least one interpretation is that these cross-force variations may in part be an artifact of more variable quality of performance indicator data in this kind of analysis. The bespoke case tracking studies probably offer a more accurate picture of ident to detection conversion rates. Concern about the accuracy of a 50 per cent identification-detection conversion rate for DNA matches was raised in MHB’s analysis of year 1 of the DNA Expansion Programme. They cite several unpublished analyses of DNA matches which indicate a consistently higher rate (for instance a tracking exercise of 400 cases in West Midlands, of which nearly 60 per cent resulted in detections) (MHB, year 1 unpublished). The Lanner analysis (Lanner, 2004) points to a 50 per cent identification to detection conversion rate. Other studies have noted that forces, in general, find it very difficult to measure the contribution of forensic evidence to the detection of crime, mainly due to inadequate IT systems (Speakman,
52
unpublished). This problem is evident across many aspects of the forensic process but it is particularly problematic for the measurement of forensically-derived detections. The ACPO/FSS/HMIC joint Forensic Audit in 1999 found that more than half of all force in England and Wales (63%) were not able to give an accurate number for detections that were DNA-derived. At that time only 15 per cent of forces had mechanisms in place to evaluate the contribution of DNA to detections (cited in HMIC, 2000). Just under two-thirds of forces were found to be unaware of how many of their detections resulted from DNA matches, and only 15 per cent were seen as having adequate procedures for evaluating the benefits of forensic identifications (ACPO/FSS/HMIC Forensic Audit cited in HMIC 2000). For example, HMIC found that around 16 per cent of identifications examined were associated with crimes that had been detected prior to obtaining a forensic identification notification. MHB (DNA, year 1, unpublished) found that many forces still did not have computerised criminal intelligence systems for monitoring the actions following notification of a DNA match. The lack of integrated information technology systems made the monitoring of the use and value of DNA matches in detections difficult. Even in forces where there were computerised intelligence systems, some officers did not always ‘result’ cases. In other words, officers were failing to inform intelligence systems of the outcome of matches. Due to the lack of integrated systems and poor record keeping, the tracking and feedback of information to FAOs and CSEs was often difficult or at best patchy. A second issue with the data on forensically-derived detections is the extent to which the initial match generates additional detected offences. This issue has been subject to some misinterpretation. HMIC (2000, p 32) stated on the basis of Speakman’s analysis, that on ‘average every [DNA] identification leads to 1.4 detections’. In fact Speakman’s analysis focused on the additional linked crimes that can be detected in addition to the original DNA-derived detection. On average, Speakman found that each detection (rather than identification) resulting from a DNA match would yield an additional 0.4 detected crimes. It is certainly the case that DNA and other forensic evidence does succeed in yielding additional detections, and that most of the summary statistics provided in Table 7.1 do not take these into account. Apart from Speakman’s estimate of 0.4 additional detections for every offence additionally detected through a DNA identification, MHB (year 1, unpublished) also cite a West Midlands case-tracking exercise of 400 cases. In addition to 199 ‘primary’ DNA detections, the exercise identified a further 94 additional detections from these cases (suggesting that every identification-detection yields a further 0.47 detections). Pathfinder (Burrows et al., 2005) revealed that of those forensic identifications that led to detections, 17 per cent led to the detection of other crimes (although this figure is a minimum – an additional 26 per cent of respondents did not know if this was the case or not) (n=147). It is worth noting that most of these additional detections were not for offences taken into consideration (TICs); some 82 per cent resulted in separate charges. As already noted in Chapter 2, only a handful of studies have examined the overall contribution of forensics to crime detections. The Lanner data-mining analysis gives a more recent picture by identifying the percentage of detections which have a scientific identification (Lanner, 2004). For the target force across an eight-month period, 27 per cent of detected burglary dwellings had a scientific identification, compared with 16 per cent theft of vehicle, ten per cent theft from and only four per cent burglary other than dwelling. The overall rate for all crimes was three per cent (Lanner, 2004). The other relevant finding to emerge from the Lanner work was that the proportion of detections with a scientific identification varied markedly by force division (with one division tending to outperform its sister divisions in generating detection from scientific identifications). Identifications that do not yield detections Notwithstanding the failings of monitoring or tracking systems to identify accurately levels of identification generated detections, several studies have attempted to explore why forces fail to

53
convert higher proportions of matches to detections. An examination of what happened to 157 NAFIS-derived fingerprint identifications in four English forces (MHB, 2004) showed that:
• 15 per cent of identifications were of people who were deemed to have had legitimate access to the crime scene;
• no further action (NFA) was taken in 14 per cent of case, in some instances because of a delay in processing; and
• in almost a fifth of cases no further information was available, either because the case could not be traced, or because the case was still being investigated at the time the research was undertaken (some 10 months after the date of the offence).
In the Pathfinder case-tracking exercise, the reasons for a forensic match (fingermarks, DNA, shoemarks or toolmarks) failing to yield a detection were examined for the 325 undetected identifications. In six out of ten responses, the officer indicated that the suspect had been eliminated from enquiries; in a further 14 per cent of responses, the suspect could not be traced, and in 26 per cent of responses, a range of other reasons were offered including partial hits, public interest not to proceed and so on. A more detailed exercise was undertaken on DNA matches as part of the evaluation of Phase Two of the DNA Expansion Programme, (MHB, year 2 unpublished). MHB examined the reasons why not all DNA matches result in detections. Five forces were asked to keep records of all of their SGM plus matches from November 2001 over a four-month period, with the emphasis on monitoring actions taken following notification. A sample of 217 cases of SGM plus matches resulting in no further action (NFA) was generated. A total of thirteen reasons were identified for the failure of DNA matches to result in detections.
• Insufficient evidence (in addition to the match). • Legitimate access to the scene. • Person cannot be directly connected to the offence. • Beyond six month limitation period (for vehicle crime). • Offence resulted/detected to another offender. • Recorded under Home Office rules as ‘no crime’. • Not located on the system (either lost or historical hit for which papers destroyed). • Pending – bailed/ongoing investigations. • Pending – circulated on PNC. • Not resulted. • Undetected – no details. • Not in the public interest – e.g. historical hit, already in prison, written off. • Still awaiting evidential conversion.
Of these, the three most common reasons as to why DNA matches were not converted into detections were legitimate access (19%); insufficient evidence (16%); and person cannot be directly related to the offence (12%). The reasons for failed conversions into detections were common in cases of vehicle crime, residential burglary, and ‘other’ offences. ‘Insufficient evidence’ was most commonly cited in burglary other, residential burglary and criminal damage offences. Finally, an inability to connect the person to the offence was most likely to occur in residential burglary, criminal damage, and ‘other’ offences.

54
Figure 7.2: Main reasons for failing to convert DNA matches into detections, by offence type
Taken from MHB (unpublished year 2). The study identified four generic themes under which reasons for failing to convert matches to detections could be grouped. Although there is some overlap between these themes, they do provide a good general indication of the problem of conversion, and are summarised in Table 7.2. In just over half of all NFA matches, there was insufficient evidence to support a prosecution. These include cases where an individual (who might nevertheless actually be the offender) has claimed legitimate access during interview, rather than ‘genuine’ legitimate access. In one fifth of NFAs, it can be claimed that the match did not lead to a detection because the individual identified through the match could be genuinely eliminated. Five per cent of failures at this stage were due to system or administrative failures.
0%
10%
20%
30%
40%
50%
60%
70%
80%
90%
100%
Veh. crime Res burglary Burg other Crim. damage Other
Other Person not connected to offence Insufficient evidence Legitimate access

55
Table 7.2: Summary of explanations where DNA matches fail to result in a detection (five forces, 2001/02) Need for supporting evidence
54% Circumstances where: • legitimate access is claimed by someone who could still be the
offender; • there is insufficient additional evidence; • the offender cannot be directly connected to the case; • cases are pending conclusion. In these cases, the DNA match is not enough to conclusively link the suspect to the crime, and further investigations are needed to provide the additional evidence to support a prosecution.
DNA hit does not progress case
21% The DNA match relates to someone who may be eliminated as a suspect: • the victim or witness; • other householders (in the case of burglary); • previous owners (in the case of vehicle crime and stolen
property); No case to pursue
20% The DNA match identifies the likely offender, however the case is not pursued. This may relate to: • very old cases; • cases which have ‘disappeared’ off the system; • cases which are deemed ‘not in the public interest; • cases where the victim is unwilling to comply; • cases which have been detected to another offender; • cases beyond the six month limitation period for vehicle crime.
System, administrative and practice failures
5% Other reasons which may relate to those outlined above, include: • match notifications are lost in transit; • crime reports can not be located on force’ criminal intelligence
systems; • crime reports are incorrect; • case papers become mislaid or are destroyed; • cases languish in in-trays; • no protocols are in place for passing on matches when officers
are on leave; • there is no clear responsibility for the actioning and monitoring
of DNA matches. Adapted from MHB, year 2 unpublished. A number of other studies included in this review have also highlighted the problem of legitimate access issues within the first of these categories (i.e. alleged legitimate access outcomes). HMIC (2002) suggests that the reasons for the high number of legitimate access outcomes are poor interview techniques and the inappropriate disclosure of evidence to defence representatives before interviews. Such failures may enable suspects to fabricate legitimate reasons for their presence at the crime scene. However, an in-depth study of five forces, MHB (year 1 unpublished) reported that officers claimed to be careful about disclosing too much information about forensic evidence during interviews with suspects. They asserted that they gave only vague information in order to get the suspect to deny any presence at the crime scene. Timeliness Several studies have explored the consequences of reducing the time taken for the completion of the forensic processes. In addition to a more blanket desire to speed up the administration of justice, it has been suggested that timeliness is an important factor influencing overall efficiency

56
and effectiveness of forensic techniques. Faster forensic processing might increase the likelihood of confessions (and subsequent guilty pleas) by allowing stronger cases to be made against suspects (Gaule, unpublished). A forensically-supported case against a suspect at the point of charge might also bring about greater likelihood of remand (as opposed to the granting of bail). It might also allow more prolific offenders to be incarcerated more quickly. At the same time, it has also been suggested that in some instances, faster processing times might carry disadvantages. If, for instance, an offender will confess to additional offences when presented with forensic evidence against a single offence, this might negate the cost of processing material to prove the offender’s association with these scenes. Two studies examined the effect of timeliness of forensic analysis on detections (Bond unpublished, Gaule unpublished). This has been a particular issue for processing DNA. It typically takes longer for DNA results to be made available to investigators than it does for fingerprints. In partnership with the FSS, studies were conducted in two separate forces that had moved towards implementing a ’28-day turnaround’ for reporting DNA matches. In other words, the FSS was required to report DNA hits within 28 days of the offence being reported to the police. Gaule (unpublished) examined what happened to submissions before and after the introduction of a 28-day turnaround (n= 336 and n=308 respectively). While there was a modest increase in the proportion of submissions converted to hits, (up by around 14 percentage points), the most impressive results were for DNA detections. It was found that DNA detections increased by 29 percentage points during the project period (from 27% of DNA matches resulting in detections to 56%). Bond (unpublished) found that by having a similar timescale for processing both fingerprints and DNA, DNA matches were found to be as productive in facilitating so-called primary detections (see Table 7.3). Although there were more fingerprint identifications than DNA matches (143 and 33 respectively), similar proportions of both resulted in primary detections (58% of DNA matches and 54% of fingerprint identifications). Table 7.3: Number and proportion of DNA matches and fingerprint identifications yielding detections after the introduction of a 28-day turnaround DNA Fingerprints Number of identifications 33 143 Number of primary detections 19 (58%) 77 (54%) Number of taken into consideration detections
31 194
Bond, unpublished. Summary Getting an identification from a forensic database does not guarantee a detection. The largest ‘tracking’ studies of forensic identifications in England and Wales suggest that around seven in ten matches/identifications in volume crime cases lead ultimately to detections. Other studies have suggested a lower conversion rate, although they tend to rely on secondary analysis of performance indicator data that may understate the actual number of identifications or hits that result in detections. Forensic detections have, however, also been found to lead to a number of additional detections. One study has found that each detection resulting from a DNA match would yield an additional 0.4 detected crimes (through the detection of linked offences). The fact that a reasonably high proportion of matches fail to yield initial detections, and more general concerns over variations in force by force performance in both fingerprint and DNA identifications, has been an area of concern. Issues around legitimate access are particularly problematic when trying to convert an identification into a detection. A detailed study of DNA matches which resulted in no further action found that more than half of the cases failed to proceed because of a lack of supporting evidence (and in particular, possible offenders claiming legitimate access).

57
8. Overall attrition and the contribution of forensics to convictions Before moving on to examine the contribution of physical science to the post-charge stage, it is helpful to briefly review those studies which have covered more than one stage of the PIP process and examined more generally the process of overall attrition. A clear feature of the application of forensic science to volume crime investigation is the process of attrition. Peterson (1974) was one of the first to conceptualise this in terms of an evidence screening model consisting of, then, eight decision stages. 1. Decision to intervene in a crime. 2. Decision to process a crime formally. 3. Decision to request an evidence technician. 4. Decision of evidence technician to respond. 5. Decisions during investigation at the scene. 6. Decision to return evidence for analysis. 7 Decision to submit evidence to laboratory. 8 Decision to accept evidence. Each stage represents a point at which cases carried forward from the previous stage can be filtered out. Inevitably cases tend to be lost at each stage. While it is important to highlight the importance of decision-making in gatekeeping the progression of cases, Peterson describes how contextual factors shape those decisions (the speed of notification, weather, the patrol officer and the technician’s prior experience and learning). As discussed in the previous chapter, the development of forensic databases allows several additional stages beyond these eight to be considered. 9. Decision to load evidence on to databases. 10. Decision to search databases (depending on the database/legal context). 11. Decision to follow up a match to achieve a detection. 12. Decision to proceed with a case at court. Most studies have attempted to explore parts of the overall process of attrition. Few studies have succeeded in examining overall attrition throughout the whole of the criminal justice process. The reasons for this are the absence of comprehensive case-tracking databases, the problems of marrying discrete databases together, and the practical problem of ending up with so few ‘target cases’ at the very end of the process. Some studies have sought to get round this by simply examining the number of cases being processed at each stage (rather than a true ‘attrition model’ that would seek to track specific cases through the process). Two studies included in the review have examined the outcomes of forensic identifications. The Pathfinder case-tracking exercise, undertaken so as to map attrition from forensic identification right to conviction (Burrows et al., 2005), has already been discussed in this review. Figure 8.1 presents a simplified version of the results of the police, CPS and court data collection exercises. Each continuation of the process has been reindexed to 100 per cent to show the distribution of different types of outcome.

58
Figure 8.1: Attrition through the forensic process, from
identification to conviction
‘Lawful entry’
by suspect (47%
)
Suspect elim
inated by other m
eans (25%
)
Insufficient evidence to
charge (6%
)
Address not
known
(5%)
Suspect
absconded
(5%)
Other
reasons (12%
)
Reported for caution (2%
)
Offence TIC’d (8%
)
No proceedings
(4%)
Other
(4%)
CPS: no
case to answ
er (33%
)
Not proved (17%
)
Evidence challenged
(4%)
Not in public
interest
(29%)
Other
(17%)
Convicted (87%
) Acquitted
(2%)
Undetected (27%
)
Identifications (100%
)
Detected (73%
)
Charged (82%
)
Not
convicted (11%
)
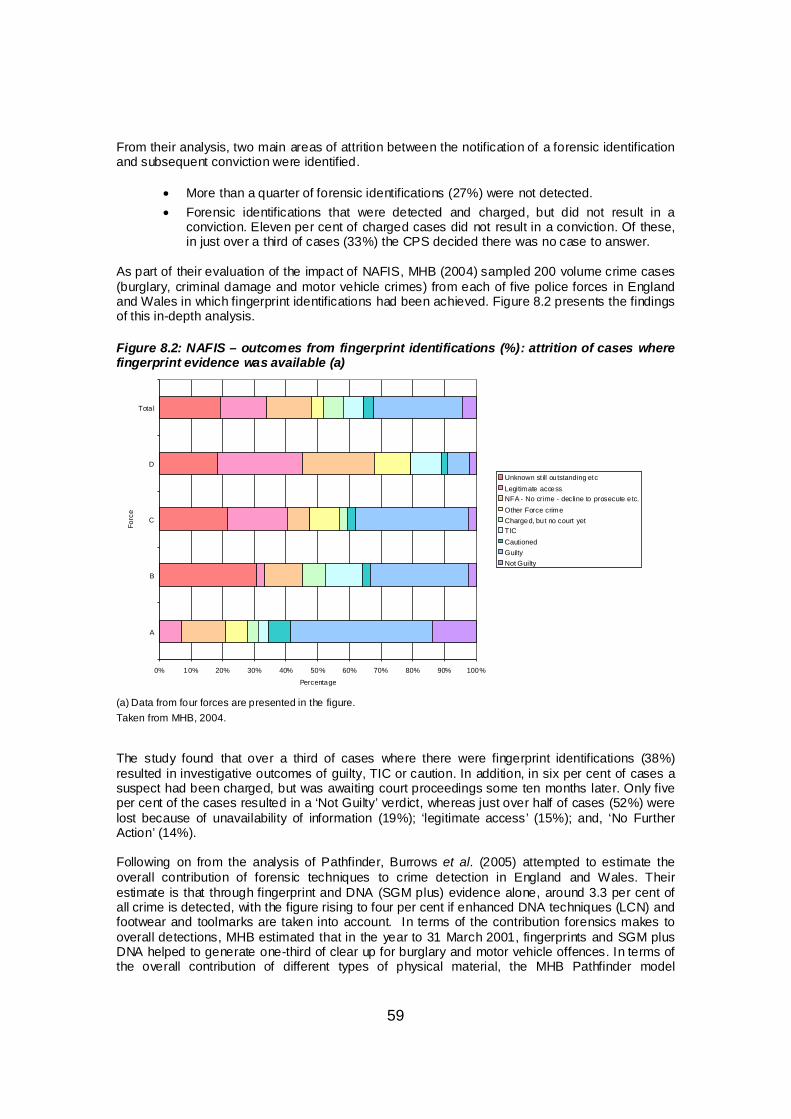
59
From their analysis, two main areas of attrition between the notification of a forensic identification and subsequent conviction were identified.
• More than a quarter of forensic identifications (27%) were not detected. • Forensic identifications that were detected and charged, but did not result in a
conviction. Eleven per cent of charged cases did not result in a conviction. Of these, in just over a third of cases (33%) the CPS decided there was no case to answer.
As part of their evaluation of the impact of NAFIS, MHB (2004) sampled 200 volume crime cases (burglary, criminal damage and motor vehicle crimes) from each of five police forces in England and Wales in which fingerprint identifications had been achieved. Figure 8.2 presents the findings of this in-depth analysis. Figure 8.2: NAFIS – outcomes from fingerprint identifications (%): attrition of cases where fingerprint evidence was available (a)
0% 10% 20% 30% 40% 50% 60% 70% 80% 90% 100%
A
B
C
D
Total
Forc
e
Percentage
Unknown st ill outstanding etcLegitimate accessNFA - No crime - decline to prosecute etc.Other Force crimeCharged, but no court yetTICCautionedGuiltyNot Guilty
(a) Data from four forces are presented in the figure. Taken from MHB, 2004. The study found that over a third of cases where there were fingerprint identifications (38%) resulted in investigative outcomes of guilty, TIC or caution. In addition, in six per cent of cases a suspect had been charged, but was awaiting court proceedings some ten months later. Only five per cent of the cases resulted in a ‘Not Guilty’ verdict, whereas just over half of cases (52%) were lost because of unavailability of information (19%); ‘legitimate access’ (15%); and, ‘No Further Action’ (14%). Following on from the analysis of Pathfinder, Burrows et al. (2005) attempted to estimate the overall contribution of forensic techniques to crime detection in England and Wales. Their estimate is that through fingerprint and DNA (SGM plus) evidence alone, around 3.3 per cent of all crime is detected, with the figure rising to four per cent if enhanced DNA techniques (LCN) and footwear and toolmarks are taken into account. In terms of the contribution forensics makes to overall detections, MHB estimated that in the year to 31 March 2001, fingerprints and SGM plus DNA helped to generate one-third of clear up for burglary and motor vehicle offences. In terms of the overall contribution of different types of physical material, the MHB Pathfinder model

60
estimated that for a representative 100 burglary and vehicle crime scenes examined, on average:
• 7.0 will produce fingerprint identifications; • 2.6 will produce SGM plus identifications; • 1.4 will produce LCN DNA identifications; • 0.5 will produce footwear identifications; • 0.1 will produce toolmark identifications.
The use of forensic evidence at court
Relatively few studies have attempted to identify the extent to which scientific or physical evidence is associated with increased likelihood of guilty pleas, convictions, and even the length of sentence. This partly reflected the small number of court cases that involved a scientific evidence component. Peterson et al.’s (1984) study of physical evidence in the investigative process noted that cases with physical evidence tend to go to trial more often than those without such evidence. That study also looked at court outcomes and identified higher conviction rates in offences with scientifically analysed evidence. However, in reviewing this and similar studies, Peterson et al. (1987) noted the general failure to control for other evidence and that so-called ‘extra legal’ factors in the cases reviewed mean that the results need to be treated with caution. Because of the paucity of studies in this area, those identified but covering more serious offences (i.e. beyond the volume crime definition) have been included. Most UK studies that have dealt with issues around the court process have simply tended to explore outcomes of cases that utilise physical evidence. Both Speakman (1999) and Burrows et al. (2005) have examined court outcomes in this way. The former noted that volume crime cases involving a DNA identification, which subsequently resulted in a charge (n=174) resulted in guilty pleas in 80 per cent of cases. As a proportion of all DNA cases which generated charges, 71 per cent resulted in convictions (n=140). The Pathfinder evaluation included a case-tracking exercise and a survey of criminal justice system professionals’ attitudes. A total of 708 cases in the Pathfinder analysis resulted in a charge and data for the case-tracking exercise were ultimately provided on 265 cases. Of those 223 cases that were finally been dealt with by the court, in 77 per cent of cases the defendant had pleaded guilty to the original charge (and in a further 9% of cases to an alternative charge). Only four per cent of cases were dealt with at trial – of which there was an equal split between not guilty and guilty verdicts. In only 11 per cent of the total sample (i.e. guilty pleas and contested cases) did the case not result in a conviction (n=25). In just under half of cases that did not result in conviction, the offender was found to have no case to answer, or the essential elements of the case (non-forensic) had not been proved beyond reasonable doubt. Pathfinder also examined the outcome of 473 cases that contained forensic evidence and which were disposed of by the Magistrates’ Courts (with the aim of comparing to aggregate outcomes for all indictable and summary non-motoring cases). There was some indication that forensically supported cases were less likely to be withdrawn and more like to result in a guilty verdict. Only 13 per cent of such cases were discontinued/withdrawn (compared to 24% of all indictable and summary non-motoring cases in England and Wales) and a slightly higher proportion of the Pathfinder cases resulted in a guilty verdict (72% compared to 68%). A small but useful study was undertaken on ‘failed’ prosecutions involving DNA hits in a Welsh force (Clancy, Maguire and Tregidga, 2004). The study was prompted by the force’s Scientific Support Unit’s observation that DNA hits resulting in a charge were not yielding convictions. According to their database, out of 230 cases involving a DNA hit and a subsequent charge, but in which a not guilty plea had been entered, only 17 (7%) resulted in a conviction. This, paradoxically, seemed to represent an attrition rate in contested cases far greater than that for all (forensic and non-forensic) cases.
61
Detailed examination of police case files, however, revealed a markedly different picture, calling into question the accuracy of the database. For all 1,168 cases on the database, just under seven in ten (68%) had resulted in the accused person pleading guilty as charged. In the 379 disputed cases, only 25 per cent resulted in a conviction, with the balance either resulting in a discontinuance (62%) or an acquittal (12%). The overall conviction rate for DNA match cases resulting in a charge was 76 per cent; the corresponding figure for Pathfinder cases was 87 per cent, although it is important to note the different ‘crime mix’ of the samples. A final part of the research was a series of interviews with police and crown prosecutors. In terms of police perceptions on the failure to secure a conviction the following issues were highlighted. • The particular problem of offenders using ‘pool cars’ in the commission of vehicle related
offences, allowing claims of legitimate access. • Funding and resources for volume crime investigations. • Absence of corroborating evidence once DNA is found. • Poor feedback and ‘distance’ from CPS and courts.
Interviews with the CPS highlighted above all the poor quality, incompleteness and delays in the submission of evidential packages in volume crime cases. Both parties were critical of low levels of forensic awareness of officers. By contrast, offenders and their briefs were becoming increasingly wise to the potential limitations around DNA evidence with a suggestion from one prosecutor that they were increasingly vulnerable to (unjustified) legitimate access challenges. No statistically significant differences emerged from the analysis by DNA source (e.g. hair, blood, etc.). A logistic regression model found that the best predictors of conviction in contested cases were the location of the CPS office and the number of previous convictions. Cases were also subjectively assessed by the researchers in terms of why they did not proceed to conviction. Although in a high proportion of cases it was not clear why a case had failed (31%), in just over four in ten cases, the defendant claimed legitimate access (43%). Decisions not to proceed in the public interest and technical/administrative problems were cited in 19 per cent and 12 per cent of cases respectively. Additionally, CPS files were examined for 26 of the failed cases. In no fewer than 17 cases, reference was made to long delays or failures by the police in producing full ‘DNA evidential packages’, and the absence of the ‘Forensic Scientist Statement’ in most of these. One of the most extensive studies of the use of physical evidence at court comes from Peterson et al. (1986, 1987). Their aim was to examine the effects of forensic evidence on the decision to charge, on decisions to determine guilt or innocence and to decide the severity of sentences. The study involved a number of methodological components: a postal survey of crime laboratories; analysis of a random sample of prosecutor case files for felonies in six US jurisdictions over three years (1975, 1978 and 1981); interviews with prosecutors, defence attorneys and forensic science examiners to determine their view on the value of forensic evidence; the use of hypothetical tests on trial attorneys in one County to assess the effects of different evidence on decisions; and finally, surveys of jurors who had returned verdicts in felony trials in Chicago to establish their views on scientific and expert evidence vis-a-vis other evidence. Overall one-third of case files examined contained laboratory reports. The proportion varied widely by offence type (for instance almost all murders contained a laboratory report, compared with one third of burglary files and 20% of robberies). The proportion of burglary cases in the six locations containing laboratory reports ranged from two per cent to 43 per cent of all cases, with a median value of 25 per cent. On average, Peterson et al. (1986, 1987) found that the conviction rate of cases with scientific evidence (that is, a laboratory report was submitted) was not significantly higher than cases without forensic evidence. Only one of the six study sites revealed a significantly higher level of conviction for cases with forensic evidence (78% with compared to 71% without). Further analysis explored whether forensic evidence was related to case outcome once other forms of

62
evidence and ‘extra-legal’ factors were controlled for. This involved controlling for around twelve other factors. Eight were found to be significant: tangible evidence (physical items which were not scientifically examined); seriousness of the incident; defendant statements; witnesses (number and ability); arrest at or near scene; victim-defence relationship; prior record of criminality of the offender; and defendant demographics. Three variables were identified as predictors of conviction (in that they were found to be significant in three or more sites): incriminating defendant statements (principally confessions); so-called tangible evidence; and the age of the defendant (younger defendants were more likely to be convicted). Forensic evidence was significant in only one area, although in two other areas, it interacted with other variables to produce a significant effect on outcome. However, this overall finding was not true for all crime types. The presence of laboratory reports had the greatest impact on the conviction of defendants charged with murder, burglary and theft. The presence of any kind of laboratory report increased the conviction rate for burglary by 17 percentage points; the presence of lab reports associating defendant with the crime were also found to be significant in murders and thefts. For rapes, the absence of a laboratory report yielded conviction rates 50 per cent below when a lab report was present. Forensic evidence, mainly in conjunction with the seriousness of the offence, did have a marked effect on supporting convictions on the top (most serious) charge. This was most marked in burglary cases. Once other factors were controlled for, the presence of a lab report in burglary cases increased by 20 percentage points the likelihood of a conviction to the top charge. No evidential issues were found to be associated with the decision to incarcerate an offender. Using multiple regression analysis, forensic evidence was found to be a significant variable in length of sentence. Indeed, this was the single most important evidential factor associated with the severity of sanctions. Longer sentences were given where laboratory reports were present in three sites, once controlling for other factors. In a fourth site, the content of a laboratory report (specifically, linking the defendant with the crime) was associated with a longer sentence. The additional sentence length was between 20 and 30 months depending on the location. The authors offer two possible explanations for this finding. First, that forensic evidence more graphically displays the nature of the crime. A second explanation is that it reflects the relationship between use of forensics and seriousness of the crime, although there was no evidence of collinearity between the two variables. The analysis did not explore whether victim- offender relationship might explain the difference in sentence length. In terms of the offence analysis, forensic science was found to have its major impact on attempted murder/aggravated battery, rape, robbery and burglary. Ironically, forensic scientists interviewed as part of the study believed that forensic evidence had its least impact at the sentencing stage.

63
Table 8.1: Numbers of research sites (cities) associated significantly with outcomes, by evidence and demographic factors
No of sites in which variable significantly associated with outcoming (a):
Conviction Charge reduction
Sentencing Sentencing length
Nature of evidence
Forensic science evidence
* * * ****
Tangible evidence
***
Defendant statements
***** * *
Number of eyewitnesses
* * * *
Arrested at or near scene
** ** ****
***
Seriousness of incident
** ** * *****
Prior relationship ** **** * Source: Peterson et al., 1987. (a) Each star represents a study site where the association between evidence and outcome were found to be significant. The debate around the contribution of forensic evidence to case outcomes is complex. Several problems exist in terms of accurately assessing the contribution of forensic evidence to convictions from the US research. As the authors conceded, one of the main problems is the generally high rate of successful convictions. On average Peterson et al.’s sample of prosecutors’ files revealed that 70 to 80 per cent of files result in a conviction, with only five to ten per cent being resolved by means of a trial. In the two sites where conviction rates were lowest, forensic science evidence appeared to be a significant predictor of conviction/non-conviction. The authors also note that these two locations use fingerprint and firearms evidence to a greater degree than the other study sites. Three studies were identified that looked at the role of DNA evidence in court proceedings. Briody (2002) examined a sample of 200 sexual offence cases in Queensland, Australia. Drawing heavily on the approach adopted by Peterson et al. in the US, Briody examined whether DNA evidence could contribute to the efficiency and effectiveness of the court process. In particular, the, following hypothetical questions were explored. • That cases with DNA evidence as part of the evidence package are more likely to reach
court. • That more guilty pleas result where suspects are confronted by DNA evidence associating
them with victim or crime scene. • That a relationship exists between DNA evidence implicating the accused and the likelihood
of a conviction. • That DNA evidence was associated with more and longer custodial sentences. One hundred and two sexual offences with DNA evidence were selected from Queensland forensic laboratory files, with a control group of 98 ‘similar’ sexual offences (but without DNA evidence) from a search of police records. Critically, in none of the selected cases was consent an issue at the time of the investigation – hence cases where suspects had admitted intercourse were excluded from the analysis.

64
In relation to DNA evidence influencing whether a case reached court or not, Briody found that, using logistic regression, DNA evidence was the only positive predictor (albeit not significant) of cases being brought to court. This concurs with Peterson et al.’s findings (1984) that cases with physical evidence tend to go trial more of the time. DNA evidence had no significant association with guilty pleas, although the applicability of this finding to the UK setting may be questionable. As Briody noted, ‘the explanation for this may lie in the timing of the availability of DNA testing’. The results of DNA testing in the 100 or so cases examined were available to the police only several months after the offender had been arrested and interviewed (median = 133 days). Since other studies have identified confession to the police as a predictor of guilty pleas, the author speculated that confronting suspects with DNA evidence at that time might yield more confessions (and consequently, guilty pleas; the then imminent introduction of a DNA database in the state was expected to help) (Briody, 2002). In terms of effects on jury decisions, DNA evidence was found to be a ‘crucial’ predictor of a guilty finding. A total of 47 cases were decided by juries, of which 20 included DNA evidence. Of these, 70 per cent resulted in a guilty verdict; of the non-DNA cases, 14 of the 27 (52%) resulted in not guilty verdicts. From logistic regression analysis it was found that juries were 33 times more likely to convict where prosecutors produced DNA evidence than when no DNA results were produced. Second after DNA evidence as significant predictor of the outcome of a case was whether or not the victim was under the influence of alcohol during the offence. Indeed in five of the six cases in which rapes where DNA evidence was used but where defendants were acquitted, the victim was intoxicated (and knew the accused). Finally, DNA evidence did emerge as a significant predictor at the point of sentencing, being associated with more and slightly longer sentences (where these were custodial). This too supports Peterson et al.’s (1987) finding in relation to sentence length and the presence of more general forensic evidence within the case. Two concluding points were highlighted in relation to sentencing. First, DNA might not act directly on sentencing but could act through other influencing factors. Second, while DNA was a good predictor of sentences involving incarceration, it was found to be a poor predictor of non-custodial sentences. The author concludes that the logistic regression analysis on sentencing does not account well for mitigating factors. The author cites a study of the effects of sentencing in which cases where a defendant was not known to the victim increased sentence length (Warner, 1998). Briody (2004) also undertook a similar study of homicide cases, using a sample of 150 solved and completed cases in Queensland, Australia. In one half of these cases, prosecutors produced DNA evidence to associate the crime with the suspect; the balance of cases was a control group in which no DNA evidence was submitted. The author aimed to test the four hypotheses examined in his previous sexual offences study (Briody, 2002). In terms of the effects of DNA on a case reaching court, the presence of DNA was found to be a significant positive predictor. Cases with incriminating DNA evidence were just under 15 times more likely to go to court than those cases without, although given that only 11 cases did not go to trial, the author advised caution in interpreting the finding. As with the previous study on sex offences, the presence of DNA evidence did not predict guilty pleas (the strongest predictor of guilty pleas was the nature of the offence). DNA evidence was found to be strongly associated with jurors’ decisions to convict. Incriminating fingerprints were also strongly associated with these outcomes (for DNA evidence the odds ratio was 23 while for fingerprints it was even greater, at over 50). Here again, the author advised caution in interpretation because of wide confidence intervals and the small number of cases on which the findings are based. Briody’s final analysis explored issues around forensic evidence and sentence length in homicide cases. Here the author found a less consistent pattern than that found by Peterson et al. (1987). For manslaughter cases, DNA was associated with sentences that were shorter by five months while the provision of fingerprint evidence was correlated with longer sentences (an increase of 3 months). One explanation for these findings was over the timeliness of evidence in the building of

65
the case. Gaule (unpublished) suggested that quicker results from forensic analysis could be used to negate alibis and strengthen the prosecution’s case (and consequently resulting in stronger penalties). In this study it was found that while fingerprint comparison results were provided within hours or days, DNA results were more likely to be subject to a delay of weeks or months. Purcell, Winfree and Mays (1994) examined 55 cases (in 13 US states) in which the prosecutor introduced or threatened to introduce DNA evidence in the trial. At the time at which the study was conducted it was estimated that there had been 200 trials which had been resolved through DNA evidence. The authors concede that the 55 cases subject to analysis were not representative of all cases tried in the US involving DNA evidence (the researchers experienced problems in tracing the prosecutors who had handled many cases). Data collection mainly consisted of telephone interviews with the attorneys in the case. The analysis examined three factors that previous research had suggested may affect the certainty of or uncertainty of criminal prosecutions: cross-race offences; victim-offender relationship; and crime seriousness. More than half the sample offences involved victims who were strangers to the offender (53%). The sample was dominated by offences involving murder (24) and rape (24). When prosecutors were asked whether the case was winnable without DNA evidence, over one half (56%) indicated that they believed that they could have won the case regardless. Logistic regression analysis identified that, on the basis of prosecutors’ assessments of ‘winnability’, use of DNA was necessary in cases where the accused was employed (hence revealing a degree of social stability for the offender) and, for cases involving older rather than younger offenders. Predictably perhaps, DNA evidence was viewed as necessary to win a case involving a stranger-defendant. The relationship between DNA and the prosecutor’s outcome of the case was found not to be associated with the seriousness of the crime. Additional analysis revealed that, in cases in which data were available, the presence of DNA testimony from an expert more than any other factor was associated with convictions as opposed to other case outcomes. In terms of sentencing, the presence of a testimony from DNA experts at the trial (and cases where the offender stranger-perpetrators), were associated with more severe sentences (although the impact of these variables was not statistically significant). The study did not, however, explore whether these two factors generally co-occur. Attitudes to the use of forensics at court Other studies of the role of forensic evidence within the court process have tended to focus on identifying the attitudes and views of criminal justice personnel. For instance Peterson, Mihajlovic and Bedrosian (1985) conducted a survey of all federal, state and local crime laboratories in America to establish what services were provided, personnel levels, evidence caseloads, scientific/research activities, and their relationship with other agencies. Ramsay (1987) also examined the views of criminal justice officials on the value of forensic evidence. Investigating officers were asked to balance the value of forensic evidence against the other evidence they had assembled during the course of their investigations. Table 8.2 presents the findings of this survey.
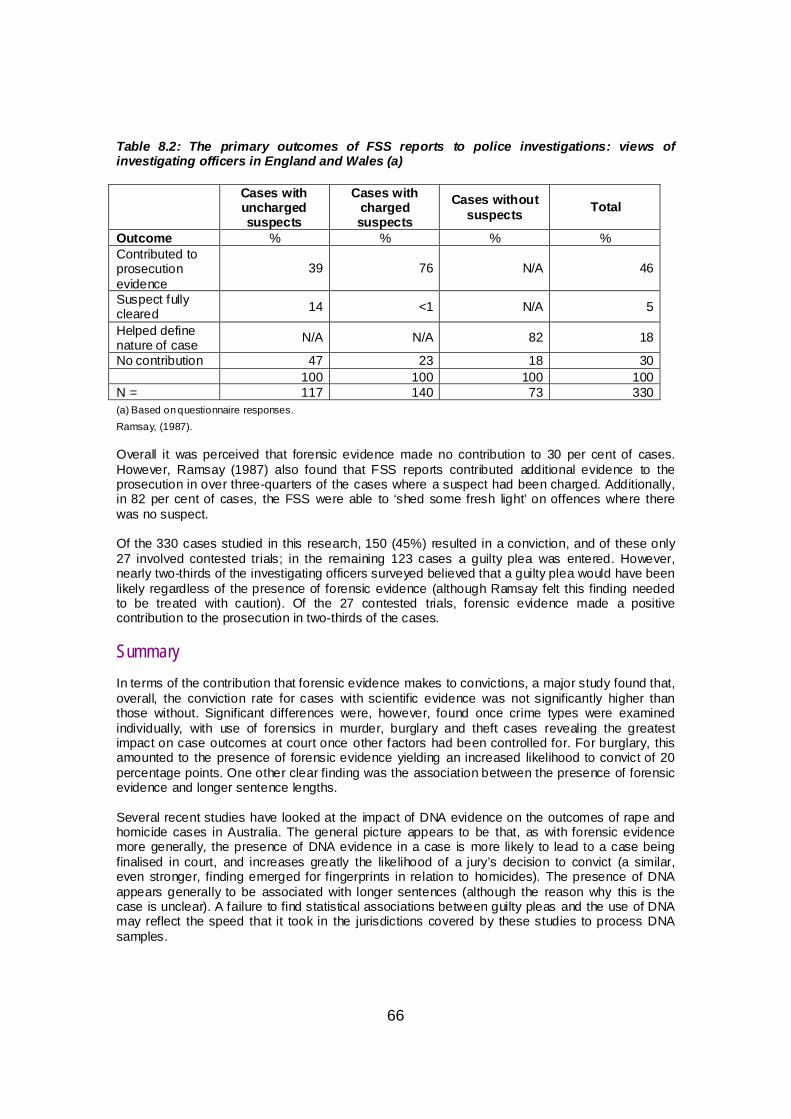
66
Table 8.2: The primary outcomes of FSS reports to police investigations: views of investigating officers in England and Wales (a) Cases with
uncharged suspects
Cases with charged suspects
Cases without suspects Total
Outcome % % % % Contributed to prosecution evidence
39 76 N/A 46
Suspect fully cleared 14 <1 N/A 5
Helped define nature of case N/A N/A 82 18
No contribution 47 23 18 30 100 100 100 100 N = 117 140 73 330 (a) Based on questionnaire responses. Ramsay, (1987). Overall it was perceived that forensic evidence made no contribution to 30 per cent of cases. However, Ramsay (1987) also found that FSS reports contributed additional evidence to the prosecution in over three-quarters of the cases where a suspect had been charged. Additionally, in 82 per cent of cases, the FSS were able to ‘shed some fresh light’ on offences where there was no suspect. Of the 330 cases studied in this research, 150 (45%) resulted in a conviction, and of these only 27 involved contested trials; in the remaining 123 cases a guilty plea was entered. However, nearly two-thirds of the investigating officers surveyed believed that a guilty plea would have been likely regardless of the presence of forensic evidence (although Ramsay felt this finding needed to be treated with caution). Of the 27 contested trials, forensic evidence made a positive contribution to the prosecution in two-thirds of the cases. Summary In terms of the contribution that forensic evidence makes to convictions, a major study found that, overall, the conviction rate for cases with scientific evidence was not significantly higher than those without. Significant differences were, however, found once crime types were examined individually, with use of forensics in murder, burglary and theft cases revealing the greatest impact on case outcomes at court once other factors had been controlled for. For burglary, this amounted to the presence of forensic evidence yielding an increased likelihood to convict of 20 percentage points. One other clear finding was the association between the presence of forensic evidence and longer sentence lengths. Several recent studies have looked at the impact of DNA evidence on the outcomes of rape and homicide cases in Australia. The general picture appears to be that, as with forensic evidence more generally, the presence of DNA evidence in a case is more likely to lead to a case being finalised in court, and increases greatly the likelihood of a jury’s decision to convict (a similar, even stronger, finding emerged for fingerprints in relation to homicides). The presence of DNA appears generally to be associated with longer sentences (although the reason why this is the case is unclear). A failure to find statistical associations between guilty pleas and the use of DNA may reflect the speed that it took in the jurisdictions covered by these studies to process DNA samples.
67
9. Awareness and communication This chapter draws together research around the application of physical evidence to volume crime investigations that do not necessarily fit neatly within the segments of the investigative process, but nonetheless have been the subject of attention in the research literature. In particular the chapter focuses on research that deals with aspects of the human aspect of forensic application to volume crime investigation. A common theme in research on both sides of the Atlantic has been the lack of forensic awareness of police officers. Horvath and Meesig concluded, largely on the basis of US studies, that ‘detectives view investigations within the context of their knowledge and skills. Because their training in and knowledge of physical evidence and scientific analyses are limited, they tend to focus on the human aspect of investigations…over which they have most control.’ (1996). They concluded that within most investigations, physical evidence has a generally subordinate role when compared with other contributions, such as witness statements. Studies in the UK have pointed to a lack of forensic awareness across many of those involved within the investigative process (see ACPO/FSS 1996). Saulsbury et al. (1994) identified a need for improvement in the forensic awareness levels of FAOs and their supervisors. Although his study was explicitly focused on the role of the Forensic Science Service, Ramsay (1987) noted particular problems in investigators’ perspectives on what forensic science might offer an investigation, but also touched on other issues such as the risk of forensic contamination by forensically unaware staff. Supporting evidence for this comes from studies that have attempted to identify the skills-base of investigators through interviews with existing Senior Investigating Officers (SIOs). Here, the notable finding is the absence of reference to requisite skills in forensic science as central to the role of the SIO (see for instance, Smith and Flanagan, 2000). The belief that ‘scientific support is not seen as a core investigative skill’ (ACPO/FSS, 1996) has been noted in a variety of research settings, and not just within the UK. Ramsay (1987) noted this as a problem amongst SIOs. ACPO/FSS (1996) found an almost complete lack of forensic awareness content in police probationer and refresher training. There is little evidence that the situation has improved since the 1990s. HMIC (2000) noted in their Thematic Inspection that although the standards of British Police Service training were high in the areas of crime scene management, there was a general lack of forensic awareness amongst operational police officers and their supervisors. They argued that, considering the pivotal role of FAOs in the effective preservation of crime scenes and the deployment of CSE resources, it was crucial that FAOs and their supervisors have adequate forensic awareness in order to perform their duties confidently. However, as with Saulsbury et al. (1994), HMIC (2000) found that there was still no national policy for the training of operational police officers in forensic awareness. Most operational staff rarely received forensic awareness or refresher training as part of their training requirement, and there was no national requirement for minimum standards in the delivery of such training (HMIC, 2000). Horvath and Meesig (1998) explored the relationship between what is known about the investigative process and the content of investigative textbooks. They undertook a content analysis of 21 textbooks on the criminal investigations process (published between 1975 and 1995). Overall, the topic area that received most attention was the investigation of specific crime types (42%), followed by information collection (39%). Information disposition and ‘general’ categories each accounted for nine per cent. The authors noted that, in spite of FAOs’ importance in attending crime scenes and making initial judgements about physical evidence, only one per cent of the combined content was devoted to the role of the patrol officer. Furthermore, while broader empirical evidence puts much greater emphasis on the contribution of what the authors describe as ‘talking to and collecting information from people’ (Horvarth and Meesig, 1996; see also Jansson, 2005) and relatively little from physical evidence, this balance was not at all reflected in the content analysis of the textbooks. Collecting and analysing physical evidence

68
accounted for 18 per cent of the textbook content compared to 22 per cent in what the authors describe as the ‘people’ subcategory. The authors note that this seems to be at odds with the low levels of collection of physical evidence as identified in the empirical research (and is also arguably at odds with research that suggests low levels of understanding of forensic issues by many investigators). The study also notes little coverage on the retrieval of evidence from suspects or on the use of physical evidence for corroborative purposes (in spite of research highlighting both aspects)–a finding that would appear to mirror the lack of research in this area. Few studies have explored the training of CSEs or its consequences. Wells (unpublished) examined the outcomes of a project involving FSS working with a force to increase the DNA awareness of scientific support staff. The objective was to increase their effectiveness at each stage of the DNA process. Following attendance on the training course, the research found that the recovery of DNA at volume crime scenes visited increased from two per cent (1999/2000) to seven per cent (2000/01). Improvements were also noted throughout the DNA process. The finding from the Lanner study (2004) around variations in individual CSE retrieval rates (not clearly associated with age, experience or gender) suggests that the area of personal CSE style and ability is one which may be ripe for further examination. Attitudes and communications between CSEs and investigating officers Police attitudes to the use of forensic science approaches have been found to be influenced by early experiences. In terms of how police officers developed their learning and understanding of forensic processes, Peterson’s (1974) study highlighted the importance of positive and negative feedback. Positive experiences, perhaps predictably, acted in the form of a positive feedback loop for police officers. For patrol officers, good experiences with laboratories induced a positive feedback approach; negative experiences generated scepticism about forensics and a preference for other sources of information. Several studies have highlighted the importance of communication between FAOs, CSEs and investigating officers. ACPO/FSS (1996 p.41) observed that CSEs commonly attended volume crime scenes with little or no prior information. In those cases where they were briefed, direct verbal contact was most common (in 52% of cases) and perceived as the most effective form of briefing. Likewise, the findings from the first year evaluation of the DNA Expansion Programme (MHB, unpublished year 1) noted that there were sometimes difficulties in achieving effective dialogue between scene examiners and police officers. In general, forces were found to be lacking in standardised processes for informing all parties of each other’s activities. A variety of arrangements existed for investigating officers to find out whether or not forensic materials had been recovered from a scene. These included crime reports, crime management systems, the scientific support unit system or via CSE worksheets. The enduring nature of the communication and integration themes is to some extent borne out by the work of Petersilia (1978), HMIC (2000) and Williams (2004), both covered previously in this review. In commenting upon the effectiveness of performance in Richmond, California, Petersilia noted the high degree of integration between detectives and forensic specialists in that force. Writing almost twenty five years later, the importance of integration of forensic and investigative skills was the enduring theme of Williams’ study of seven English and Welsh forces, albeit with a much firmer focus on the organisational and management relationships and how this can tangibly influence performance. The issues surrounding the sharing of information relating to forensic processes between all those involved in the investigation of volume crime, is a theme that emerges strongly within the research literature included in this review. One final point is worth making, if rather tentatively, from the research evidence. In an area such as forensic science, great store is often put on the introduction of new technology or automated processing. These changes can, indeed, yield considerable benefits in terms of enhanced performance, greater effectiveness and so on. However, it cannot be assumed that new

69
technology can be implemented successfully, and deliver change, without giving thought to the human and other processes that are affected by it (see for instance, the helpful discussion of the issue of employee orientation to automated fingerprint identification systems in Warboys, 1987). Summary Two principal themes emerge from the research evidence on awareness and communication. The first is that, in general, police officer appreciation of forensic evidence is, and continues to be, inadequate. This appears to be true for patrol officers but it is also possible that a lack of understanding exists amongst some senior detectives, where one would expect familiarity with forensic processes to be more developed. The second enduring theme has been the issue of integration of forensic and policing functions. Scientific skills and policing do not co-exist naturally. Integration requires effort, and a desire to co-operate, on both parts. Where this does happen, and forensic science makes a more central contribution to both volume (and serious) crimes, the benefits in terms of a more coherent approach to problem solving and detection, and ultimately performance, are supported from the findings of several studies.

70
10. Summary and conclusions Summarising the social research literature on the application of forensic science to volume crime presents a number of challenges. Like the body of research on more general investigative approaches, it consists of a mixture of phase specific studies, alongside more general overviews of the forensic process within investigations (Jansson, 2005). An additional problem associated with reviewing social research into forensic techniques has been assimilating information from a domain that has been significantly affected by the development and application of new technology. In some respects, the forensic process is essentially similar to that described in studies of the 1970s and 1980s, but the way in which forensic material can be processed and analysed has been revolutionised through automated fingerprint searching, DNA technology and the establishment of related databases. This raises important questions over the continuing validity of some of these earlier research findings and, where necessary, these have been pointed out in the text. On these grounds it might be tempting to dismiss the pre-AFR, pre-DNA research, to be of little value. The opposite approach has been chosen for two reasons. First, these earlier studies allow a much fuller picture of the journey that, from a social research perspective, forensic applications to volume crime have taken over the last 30 years. This relates both to the way in which forensic techniques can be applied to investigations (the increase in the importance of inceptive applications so that forensics provide the first link to the offender), and the increase in the use of these techniques in less serious offences. These observations are particularly relevant to the UK context, where the combination of a supportive legal framework, technological advances and the provision of financial resources, has made a major difference to the application of forensic techniques to volume crime. Second, these earlier studies continue to have considerable value in their own right, regardless of the technological changes described above, because they provide a more comprehensive overview of the way in which forensics are more generally of value to investigations. A further consequence of technological developments in forensic techniques has been that they have increasingly led the social research agenda. Hence recent UK research has been largely dominated by evaluations of DNA-related initiatives, rather than, say, focusing on the development of a better general understanding of the contribution of forensics to detections and prosecutions. It is clearly important to assess the impact of these large-scale resource-intensive initiatives. By the same token, it is also true that this process has guided a research agenda that has, perhaps inevitably, become skewed towards a better understanding of new applications, rather than a deeper understanding of existing processes. In some instances, more fundamental questions have been neglected (or can only be addressed by relying on findings from now quite dated studies). So what, in general, can be said about the role of forensics in the investigation of volume crime offences? There are four main themes worth highlighting. First, the proportion of offences in general (and volume crime in particular) that are detected by the use of forensic techniques is relatively small; most crimes are actually detected by other means. Second, historically, forensic evidence has mainly been used to corroborate other evidence against known suspects rather than for inceptive purposes or as an intelligence tool. This pattern, as noted above, has changed with the growth of searchable forensic databases and, in particular, the growth in the use of DNA sampling and matching technology-changes that are presently best evidenced in the UK. These developments have helped contribute to an increase in the proportion of volume crime detections that have been achieved through forensic information/evidence. Finally, when we examine forensics against the wider canvas of evidence, forensic evidence makes its most important contribution in the detection of hard to solve crimes. Studies conducted before the widespread use of forensic material to provide first links to offenders through automated searching
71
nevertheless found markedly increased odds for detecting an offence when other forms of evidence were not present. The more common use of forensics as an inceptive tool to provide the first link to unknown offenders will have further strengthened the forensic contribution to detecting otherwise hard-to-solve offences. Initial response and crime scene attendance In terms of the key stages of the investigative process, the following main points emerge. Although call handlers can play a critical role in both resource allocation and in advising on forensic preservation, very little research has been undertaken in this particular area of forensic activity. In terms of who performs the task of crime scene examination, the use of dedicated Crime Scene Examiners is not universal. In the US, responsibility for collecting forensic evidence from crime scenes is often shared amongst CSEs, investigators or patrol officers. Policies about the deployment of CSEs range from blanket attendance for certain crime types, to discretionary attendance on the basis of information provided to a call taker, or by FAOs. In England and Wales, burglary dwelling attendance rates are generally high and in excess of 70 per cent, while a smaller proportion of vehicle crime offences are attended. For offences where attendance is discretionary, decisions to send a CSE will be influenced primarily by the potential to recover forensic material and the perceived seriousness of the offence. Research into FAO decision-making over scene attendance has highlighted potential weaknesses in this method of CSE deployment, especially low levels of forensic awareness amongst FAOs. Even where mandatory attendance policies exist, the actual pattern of attendance may fall below what is expected either due to poor communication or the reluctance of patrol officers to be directed to meet mandatory instructions for CSE attendance. A recurring theme in this aspect of forensic activity is that of police force variations in crime scene attendance rates (even allowing for similar crime types). Resourcing and geography have been identified as important factors in determining levels of CSE visits. One study of forensic performance in English and Welsh forces noted that, while the greater number of CSEs per recorded crime was generally associated with higher proportions of all scenes attended, not all forces conformed to the expected pattern. Other factors might limit attendance levels (e.g. less densely populated rural forces requiring greater distances between scene visits). Retrieval of forensic material Only one study was identified that had involved observing what crime scene examiners do at scenes, and how they fit into the broader investigative process. In the US police department studied, CSEs were found to be disjointed members of an investigative team, fitting uncomfortably into the more rank-based structure of mainstream policing. The work of individual CSEs was poorly quality controlled–investigation reports, the main assessment tool for individual CSE performance, were found to be rarely reviewed. Victim perceptions of the service provided by the CSE were generally positive and this was generally acknowledged by CSEs themselves as an important part of their wider role. Other studies have, however, found victims to be critical of ill-considered CSE examinations.
The initial screening of offences for forensic examination makes it hard to establish genuine base rates for the potential to retrieve forensic material from crime scenes. A study which involved attendance by forensic specialists at unscreened major felony crime scenes found that fingermarks were present at similar proportions of burglary dwelling and vehicle crimes (four in ten), and 45 per cent of non-residential burglaries. The failure of scenes to yield physical evidence was usually due to scenes being cleaned prior to CSE attendance, inaccessible scenes, or minimal disturbance by the offender.
Most studies of retrieval rates at burglaries have consistently identified fingerprints as the most frequently retrieved contact trace material, with typically just under one in three residential

72
burglary scenes attended resulting in the retrieval of fingerprints. Data on English and Welsh retrieval rates put DNA retrieval at ten per cent of all scenes visited (similar to shoemarks, although these recorded a greater variation between forces). Relatively high retrieval rates per crime scene visited are generally associated with crimes which are more frequently subjected to selective CSE attendance (screening), such as vehicle crime. Retrieval rates for offences receiving high levels of attendance (such as burglary dwelling) are, by comparison, generally lower. Even when comparing rates for particular material within particular crime types, marked area by area variations in retrieval rates are a common finding. Factors influencing retrieval rates over which the police have influence include the quality of initial advice on preservation; the resources available to examine scenes; the overall demand put on those resources (usually measured in workload); and policies in relation to forensic attendance. Attempts to explore the relationship between forensic attendance and retrieval rates within crime types have not identified any clear relationship. In analysis undertaken for an HMIC thematic inspection on forensics, an anticipated association between higher attendance rates and lower retrieval rates for both fingerprints and DNA was not found within burglary dwelling. Research on fingerprints in the US also found that high attendance rates could be matched by high recovery rates for fingerprints. . An Australian evaluation of an initiative to increase the proportion of volume crime scenes visited by CSEs did not generally find improvements in key outcome measures (including retrieval rates), although the authors highlighted the need to interpret these findings with caution. High attendance rates appear not to be a necessary impediment to high retrieval rates (per scene visited). By the same token, low attendance rates do not appear to be a necessary guarantee of high retrieval rates per scene visited. Attendance clearly is an important factor in retrieval rates but other factors, such as how selective scene attendance is undertaken, speed of response to scenes, and resourcing and communication with patrol officers, are likely to be influential. Several qualitative studies of the variations in retrieval rates have highlighted the importance of other factors. Explorations of the relationship between resources and retrieval rates indicate that greater resources do not necessarily generate higher retrieval rates across similar crime types, suggesting that factors such as the degree of integration and communication between police and scientific support appeared to be important in determining retrieval rates. Retrieval rates are, of course, only an intermediate measure of performance. High retrieval rates of poor quality material can bring about low downstream inefficiencies as resources are used to test (but ultimately discard) forensic material. Not all retrieved material is submitted. This has reflected the direct costs of processing evidence and the quality of material retrieved. The direct costs of processing have often put a brake on what is submitted for analysis (although more serious cases will largely be exempt from this). In England and Wales, the combination of setting up the DNA Database and funding supplied through the DNA Expansion Programme has led to a real increase in the proportion of burglary (and other volume crime) cases in which material is submitted for scientific analysis. Several studies have examined the reasons why cases are submitted for forensic analysis. Those that predate the development of widespread automation in searching on forensic databases, and the application of DNA to volume crime investigations, point to the overwhelming importance of forensic material as corroborative evidence against suspects already known to the investigation. The use of retrieved material act as an inceptive tool and so provide a first link to offenders was rare in studies undertaken in the 1980s.
73
Submissions and identifications Research tracks a marked change in the process by which identifications are made using forensic material. Pre-automated searching, most fingerprint identifications arose from searches of the database requested by detectives against named suspects (so called request searches). Cold searches, those involving large-scale manual searching of fingerprint files were rarely undertaken. Furthermore, performance variations at the front end of the physical material collection and retrieval process were not reflected in performance in identifying suspects. The most important factor influencing performance in forensic detections was the inclination of detectives to request searches of fingerprint databases. Automation of searching techniques was therefore identified as the critical barrier to better downstream performance in forensic identifications. Although the development of automated fingerprint recognition systems has made the process of comparing scene and offender prints simpler, faster and generally more effective, US studies reviewed suggest that automation does not guarantee improvements in forensic identifications. The contrasting results of two evaluations of the introduction of automatic fingerprint systems in the US (Minnesota and Kentucky) illustrate the point. Minnesota was generally seen as effective in generating additional fingerprint detections, whereas the benefits in Kentucky were marginal. In the latter, a combination of a lack of evidence technicians, the reluctance of patrol officers to retrieve fingerprints, and their failure to submit them when they were retrieved, all conspired to produce a very modest improvement in fingerprint identification performance through automation. Furthermore, the particular issue of covering high property offender groups in the ‘ten-prints’ appeared to play a critical part in the success of AFR in Minnesota and the failure in Kentucky. A study in one English force found that the factors most associated with achieving a forensic identification from a scene visit were exhibits retrieved (the more retrieved the higher the likelihood of a match), the nature of the offence, and the individual CSE in attendance. Analysis of the performance of individual CSEs found marked variations in terms of their DNA matches/fingerprint identifications per scene visit, possibly as a consequence of differences in working practices between individuals. Suspect handling The importance of the inclusiveness of databases in determining the effectiveness of automated fingerprint systems has already been noted in Chapter 5. In England and Wales, the taking of fingerprints and DNA from suspects is governed by specific legislation (although for the latter the position has recently changed to cover all arrestees). Little research has been undertaken on the subject of suspect handling and the retrieval of samples. The main constraint to populating suspect databases once legislation has been enacted has been the financial costs of the process. Converting identifications to detections The increasing use of cold searching techniques against computer databases holding fingerprint, DNA and footwear mark data means that forensic material can increasingly be used to generate detections. Indeed, a relatively recent study of DNA hits revealed that it identified the suspect (rather than simply corroborating involvement) in seven in ten cases. This illustrates just how far the balance has shifted in England and Wales from corroborative to inceptive applications of forensic material. Getting an identification from a forensic database does not guarantee a detection. The largest ‘tracking’ studies of forensic identifications in England and Wales suggest that around seven in ten matches/identifications in volume crime cases lead ultimately to detections. Other studies have suggested a lower conversion rate, although they tend to rely on secondary analysis of performance indicator data that may understate the actual number of identifications or hits that

74
result in detections. Forensic detections have, however, also been found to lead to a number of additional detections. One study has found that each detection resulting from a DNA match would yield an additional 0.4 detected crimes (through the detection of linked offences). The fact that a reasonably high proportion of matches fail to yield initial detections, and more general concerns over variations in force by force performance in both fingerprint and DNA identifications, has been an area of concern. Issues around legitimate access are particularly problematic when trying to convert an identification into a detection. A detailed study of DNA matches which resulted in no further action found that more than half of the cases failed to proceed because of a lack of supporting evidence (and in particular, possible offenders claiming legitimate access). Overall attrition and conviction In terms of the contribution that forensic evidence makes to convictions, a major study found that, overall, the conviction rate for cases with scientific evidence was not significantly higher than those without. Significant differences were, however, found once crime types were examined individually, with use of forensics in murder, burglary and theft cases revealing the greatest impact on case outcomes at court once other factors had been controlled for. For burglary, this amounted to the presence of forensic evidence yielding an increased likelihood to convict of 20 percentage points. One other clear finding was the association between the presence of forensic evidence and longer sentence lengths. Several recent studies have looked at the impact of DNA evidence on the outcomes of rape and homicide cases in Australia. The general picture appears to be that, as with forensic evidence more generally, the presence of DNA evidence in a case is more likely to lead to a case being finalised in court, and increases greatly the likelihood of a jury’s decision to convict (a similar, even stronger, finding emerged for fingerprints in relation to homicides). The presence of DNA appears generally to be associated with longer sentences (although the reason why this is the case is unclear). A failure to find statistical associations between guilty pleas and the use of DNA may reflect the speed that it took in the jurisdictions covered by these studies to process DNA samples. Communication and integration Two principal themes emerge from the research evidence on awareness and communication. The first is that, in general, police officer appreciation of forensic evidence is, and continues to be, inadequate. This appears to be true for patrol officers but it is also possible that a lack of understanding exists amongst some senior detectives, where one would expect familiarity with forensic processes to be more developed. The second enduring theme has been the issue of integration of forensic and policing functions. Scientific skills and policing do not co-exist naturally. Integration requires effort, and a desire to co-operate, on both parts. Where this does happen, and forensic science makes a more central contribution to both volume (and serious) crimes, the benefits in terms of a more coherent approach to problem solving and detection, and ultimately performance, are supported from the findings of several studies. Crime reduction impacts and cost-effectiveness Two areas that have not been extensively covered in the research literature but are worth touching on briefly are the impact of forensics on crime reduction and the debate around the cost- effectiveness of forensics. There is little clear evidence that points to improvements in forensics having a major contribution in terms of overall crime reduction. As the Pathfinder evaluation highlights, “the absence of any consistent evidence of any crime reduction effect is not surprising – even if each of the…additional identifications attributable to Pathfinder…and DNA Expansion each related to separate crimes, this would only have affected 0.9 per cent of the target crimes in
75
the Pathfinder Divisions during the project period” (Burrows et al., 2005). DNA may, however, have a particular deterrent impact on some specific crime types, but at present the evidence base for a substantial crime reduction effect is poor. Furthermore, relatively little published research has been identified on the subject of the cost effectiveness of forensic approaches (some information on the costs of Pathfinder are given – see Burrows et al., 2005). Tilley and Ford (1996) noted the following in their discussion on cost effectiveness:
Asking whether forensic science is cost-effective is unintelligible: forensic science is used in too many ways; there is too little data on costs of alternative ways of solving crimes; forensic science normally operates not on as an alternative but as a complement to other police work.
The challenge to developing meaningful cost-effectiveness measures seems to reside in two features of the application of forensics. Any appreciation of the value of forensics needs to acknowledge at the outset the fact, increasingly, that forensic applications are being used to both corroborate other evidence and identify offenders. Different benefits apply to these different applications. Secondly, that on the surface, it would appear to be difficult to apply ‘routine’ cost-benefit analysis to the area of crime detection. A debate that focuses on whether forensic technique Y is more cost effective than investigative technique X is unlikely to yield a sensible resolution because it simply misses the point about how many crimes are detected. Not all offences (even within the same crime type) offer the same paths or opportunities for detection, because the so-called ‘information profile’ available at any offence varies from case to case. In support of this, as noted earlier, the research evidence suggests that forensic science is of most value in detecting cases when other forms of evidence are not present (and where other investigative techniques have not produced positive results). The cases where forensic evidence is of most value are cases which otherwise would be deemed (using Eck’s triage) as hard-to- solve (i.e. when the link between offender and victim is otherwise tenuous). Moreover, it is the intersection of different types of evidence and different types of information that often determines whether a case will be detected or not. Given this, the issue of the cost benefit assessment of alternative means to detecting crime seems (and where forensics sits within this), on balance, suggests this may not be a helpful mode of analysis. In volume crimes it seems reasonable to assume that, in a good proportion of cases where forensic evidence provides the first link to an offender, such offences would only be detected by forensic applications; without them, it is likely that the investigative effort would have been curtailed and the case filed ‘undetected – no further action’. In serious interpersonal crimes (rapes and homicides), however, the investigation may be persisted with (due to the gravity of the offence). It is in the area of serious interpersonal crime where the efficiency gains from forensics (both in terms of getting cases to courts, jury decisions and longer sentences) as well as the benefits of quicker and more cost-effective investigations and less abstracted staff, are clearest and not ambiguous. In at least one respect, the separation between the benefits of forensic applications to serious versus less serious offences is unhelpful. As noted, what makes forensic databases in England and Wales effective in yielding hits from rapes and other serious offences is the fact that the database contains the subject samples of such a high proportion of volume crime offenders. Most of those who commit murder and serious sexual offences are already ‘known to the authorities’ (in that a majority have criminal records), but they are not specialist serious offenders. Most share similar characteristics to the overall offender population: they commit burglary, theft and handling and other less serious property offences (Soothill et al., 2002). As a result, maximising the ‘hit’ potential of DNA databases (and other forensic databases) in serious crime, and the efficiency gains that these may generate, requires that the offender database is populated by a very high proportion of the known ‘minor’ offender population.
76
Where the evidence base can be further developed Although cost-benefit analysis may have little to add to overall understanding of the use of forensics, improving understanding of the costs and outcomes of the application of particular forensic techniques does have a key part to play in improving forensic processes. A central recurring theme in the research landscape reviewed is: how can efficiency and effectiveness be maximised given the current forensic environment? For the very reason that understanding is growing but at the same time, the techniques for both retrieving and analysing forensic material continue to change, these questions still need to be posed. In the present research review, some of the more interesting developments in research that will contribute to improving both the efficiency and effectiveness of the stream of forensic processes will be the greater use of data- mining approaches. These may provide further scope for clarifying the interrelationships between different forensic sub-processes, key stages of attrition, the places where blockages exist and how they can be overcome or ameliorated with the greatest impact on outcomes. The very limited amount of qualitative research in this area needs to be further developed as a complement to a purely quantitative approach. Having clarified where performance varies the most, and why, this will provide a focus about how best to improve performance. In terms of where the research base could be further strengthened, several areas appear worth exploring:
• At the very start of the forensic process, the individual performance of CSEs appears to vary; exactly why individual performance differs, or what happens to detection rates if CSEs take on more of the investigative role, is still not clear.
• The poor statistical relationship between forensic attendance and retrieval rates has long been a feature of analysis in this area. Exactly what combination of factors contribute to higher rates forensic retrieval (and subsequent identification) need to be more clearly identified.

77
Appendix 1. Search terms Date Database Successful search terms
05.01.03 Home Office Library Crime scene; DNA; Fingerprint; Forensic; Criminal investigation; Forensic evidence; Forensic investigation; Forensic science
06.01.03 British Library Forensic science; DNA; Forensic evidence; Forensic investigation; Crime scene; Fingerprint
27.01.03 NCJRS (Web based) Forensic Science Resources–Summary 11.02.03 Google Web
Directory Science > Science in Society > Forensic Science Science > Science in Society > Forensic Science > DNA Science > Science in Society > Forensic Science > Fingerprints Science > Science in Society > Forensic Science > Associations
11.02.03 MSN Web Directory Forensic Science Forensic > Law & Order > Crime Research
12.02.03 National Police Library
Taken from library catalogue: Criminal investigation; Crime scene investigation; Evidence collection; Forensic evidence; Forensic science; Burglary investigation; Robbery investigation; Management of criminal investigation; DNA profiling; Police use of forensic science; Forensic Science Service; Scenes of crimes officers; Fingerprints; investigative techniques; Blood and body fluids testing; Bloodstain evidence; Fibres identification; Footprints; Crime management; Fingerprinting; Human hair identification; Serology; National DNA database; Police relations with forensic scientists; FLINTS; Tyre marks; Fingerprint departments; Bitemarks; Paint identification; DNA sampling; National Automated Fingerprint Identification System; Cold cases; Fingerprint pattern.
12.02.03 Criminal Justice Abstracts
Taken from search terms list: Forensic; Forensics; Forensic sciences; Forensic science international; Crime scene; Fingerprints; DNA typing; Burglary; Police investigations; DNA testing; Crime laboratories; Evidence; DNA fingerprint; Bitemark; Bloodstain; Crime scene; DNA; Fingerprint; Footprint; Shoe mark; Tool mark; Crime laboratories; Criminal investigation; DNA fingerprinting; DNA testing; Scenes of crime officer;Tyre marks; Crime site; DNA data; DNA database and individual liberty; DNA related; Footwear; Evidence gathering; fibres(s);
19.02.03 Sociological Abstracts
Bloodstain; Crime scene; DNA; Fingerprint; Footprint; Forensic; Forensic investigation; Criminal investigation; DNA fingerprinting; DNA profiling; DNA testing; DNA typing; Evidence collection; Forensic evidence; Forensic science; Hair; Investigative techniques; Paint; Scientific support; Tyre; Investigations;
20.02.03 London School of Economics Library
Crime scene; DNA; Forensic investigation; Forensic examination; Forensic science; Forensic evidence; Fingerprint
25.02.03 BIDS: General Bitemark; Bloodstain; Crime scene; DNA; Fingerprint; Fingermark; Crime scene examination; Crime scene examiner; Crime investigation; Forensic investigation; Forensic evidence; DNA fingerprint; Forensic science; DNA profiling; DNA sampling; DNA testing; DNA typing;
27.02.03 Forensic Science International
Investigation; Crime scene; Scientific support; Police; Scene of crime; Crime scene examiner;
27.02.03 Journal of Forensic Science
Investigation; Crime scene; Scientific support; Police; Scene of crime officer; Crime scene examiner;
28.02.03 BIDS: PsychInfo Forensic evidence; Forensic investigation; Crime scene; Fingerprint; DNA; Forensic science;

78
12.03.03 BIDS: International Bibliography of the Social Sciences
Crime scene; DNA; Fingerprint; Forensic; Forensic evidence.
14.03.03 Athens: ISI Web of Science Service for UK Education
Bitemark; Crime scene; Fingerprint; Crime laboratories; DNA fingerprint; DNA profiling; DNA sampling; DNA typing; Forensic evidence; Forensic investigation;
21.04.04 National Criminal Justice Reference Service; Applied Social Sciences Indexes and Abstracts; Public Affairs Information Services; Criminal Justice Abstracts
Automated fingerprint identification; Crime and criminal identification; Crime detection and forensic sciences; Criminal investigation and forensic sciences; Criminal investigation and police effectiveness; Criminal investigation information processing systems; Criminalistics; DNA; DNA and convictions; DNA and court*; DNA and crime or police; DNA fingerprinting; DNA fingerprinting and criminal investigation; Evidence and forensic and police or crime; Evidence collection; Evidence gathering; Evidence idenficatn (sic) and analysis and fornensic sciences; Evidence technicians; Evidence technicians and forensic science; Fingerprint identification; Fingerprint units; Fingerprints and police effectiveness; Fingerprints or fingermarks; Forensic science and courts; Forensic science and police effectiveness; Forensic science* and crime; Forensic science* and police; Forensic sciences and prosecution; Latent fingerprints; Latent fingerprints and police effectiveness; Suspect identification; Suspect identification and latent fingerprints; Suspect identification and police effectiveness.
17.05.04 FORS (Forensic Science Service Bibliographic Database)
Fingerprints and court; Latent fingerprints and police; Fingerprints and police; Fingerprints and investigat*; Fingerprints and court; Fingerprint* and detection; Fingerprints and police; Fingerprint units or fingerprint identification; Fingerprint identification; Forensic science and courts; Evidence technician* or crime scene examine*; Evidence identification or evidence analysis; Evidence gathering; Evidence collection; Fingerprints and effect*; Fingerprints or fingermarks; Latent fingerprints; Suspect identification; Criminalistics; Criminalistics and police effect*; Criminal investigat* and forensic*; Crim* investigat* and police effective*; Crim* investig* and Police effect*; Crim investigation and police effect*; Investigat* and police; Detect* and police; Evidence and effective*; Crim* investigation and forensic*; Investigation* and forensic*; Crime detection and forensic*; Detection* and forensic; Detect* and forensic*; Crime and criminal identification; Effective* and forensic*; Automat* fingerprint identification or automat* fingerprint process*
Note * = searches undertaken using wildcard for endings of search terms.

79
Appendix 2. Selected studies (summaries)
Appendix A
pplication of forensic science to volume crim
e investigation evaluations meeting inclusion criteria
Author, title, publication date, location
Objectives
Area(s) of the investigative
process exam
ined
Methods used
Sample sum
mary
Outcom
e measures
Role of forensic science in investigations
Peterson, J. ,L., M
ihajlovic, S
., Gilliland, M
. (1984)
To determine the extent
of use of physical evidence in investigations and to evaluate the effects of scientifically analysed evidence on the resolution of the cases and the apprehension and prosecution of suspects.
Investigation and convictions.
Retrospective
review of crim
inal cases.
Retrospective review
of 2,700 crim
inal cases that had been selected random
ly from police and
crime laboratory files in
four separate jurisdictions: C
hicago, Peoria, Kansas
City and O
akland.
Extent of use of physical
evidence in the investigations and effects of scientifically analysed evidence on the resolution of the cases and the apprehension and prosecution of suspects.
Peterson, J.L., R
yan, J.P.,
Houlden, P
.J., Mihajlovic,
S. (1986)
To assess the uses and effects of forensic evidence in the adjudication of felony cases.
The application of forensic science to the investigation of volum
e crime.
Interviews, surveys and a review
of case files.
Interviews w
ith prosecutors, defence attorneys, and forensic scientists; exit surveys of form
er jurors and a review
of several thousand random
ly chosen felony case files from
prosecutor jurisdictions in six U
S
cities.
Use and effects of forensic
evidence.

80
Tilley, N. and Ford, A
. (1996)
Exam
ine and evaluate the police use of forensic science and, assess the extent to w
hich current forensic provision is m
eeting police needs.
Police use of
forensic science in the investigation of volum
e crime.
Semi-structured
interviews,
documentary
evidence and statistical inform
ation.
Twelve police forces: 133
interviews w
ith the force S
SM
and a sample of
SO
CO
s and police officers. In addition, 56 interviews w
ith personnel from each
of the FSS
laboratories and other forensic science suppliers. Tw
o further forces w
ere used on a pilot basis.
Opinions of practitioners/
suppliers backed with
documentary evidence.
Guidance/inspections etc
Touche Ross (1987)
Discusses scientific
support available within
police forces and issues that are com
mon to the
police and the FSS
.
The Scientific S
upport Function.
Using forensic science
effectively. AC
PO
/FSS
(1996)
To examine
arrangements for the
application of forensic science to the investigative process, and to provide inform
ation, models and
guidelines for improving
the use of this resource. The application of forensic science to the investigation of volum
e crime.
Semi-structured
interviews;
documentary
evidence; and, w
orkshops
Twelve police forces, 133
interviews w
ith the force S
SM
and a sample of
SO
CO
s and police officers. In addition, 56 interviews w
ith personnel from each
of the FSS
laboratories and other forensic science suppliers. Tw
o further forces w
ere used on a pilot basis.
Opinions of practitioners/
suppliers backed with
documentary evidence.

81
HM
IC (2000)
Exam
ine use of scientific and technical support by the police service in E
ngland and W
ales to reduce volume
crime.
The police use of scientific and technical support in the investigation of volum
e crime.
Docum
entary evidence; audit of scientific support activity; interview
s; focus groups; an audit of suspect D
NA
sam
ples, and D
NA
and fingerprint data from
a sample of
forces.
Relevant data collected
from all 43 police forces in
England and W
ales; and inspection visits to six forces, involving sem
i-structured interviews, focus groups and an audit of 100 crim
inal justice DN
A
samples and 30 D
NA
and 30 fingerprint identifications from
each force.
Exam
ination of the m
anagement of: D
NA;
fingerprints; identifications; footw
ear; intelligence; technical support; and, training. Focusing on: the current situation; policies; processes; procedures; structures; perform
ance; tim
eliness; leadership; effectiveness; and budgets.
HM
IC (2002)
Assess the extent to
which the police service
of England and W
ales has responded to the recom
mendations of the
thematic inspection
report Under the
Microscope, 2000.
The use of DNA
and fingerprinting in the investigation of volum
e crime. A self-
assessment
questionnaire com
prising three parts
Ten police forces received questionnaires to be com
pleted by the Chief
Officer responsible for the
Scientific S
upport functions; the SS
M; and, a
nominated B
CU
C
omm
ander.
Take up of recom
mendations from
U
nder the Microscope
(2000) and improvem
ents in the m
anagement of D
NA
and fingerprint identifications.
Techniques and their application
Petersilia, J (1978)
To see whether or not
there is a positive correlation between the fingerprint retrieval rates and the num
ber of suspects identified from
such evidence.
Collection and
processing of fingerprints.
Observation,
case file analysis and interview
s.
Com
parative analysis of the physical evidence collection and processing efforts in six U
.S police
departments.
Perform
ance data and opinions/view
points.

82
Saulsbury, W
., Hibberd,
M., and Irving, B
. (1994)
Identify the factors influencing the decision by police officers to subm
it items of potential
evidence for forensic exam
ination.
The submission
of physical evidence
Face-to-face questionnaire / survey
A representative sam
ple of eight police forces w
as chosen. Interview
s were
conducted with a roughly
stratified sample of police
personnel from three
stations within each force.
320 interviews.
Respondents: know
ledge about physical evidence and its uses; view
s on the usefulness of different types of physical evidence; decision m
aking processes w
ith regards the use of physical evidence; and, satisfaction w
ith forensic service suppliers.
McC
ulloch, H. (1996).
Identify the most
effective and efficient w
ay of collecting statistics on the use of forensic science support by the police.
Statistics on the
use of forensic science support. Analysis of data
extracted from
the SOC
IMs
database.
Data were extracted from
the S
OC
IMs databases of
a sample of 11 police
forces. Control group: data
were also collected from
tw
o forces which did not
use SO
CIM
s
Data on: forensic
submissions; forensic tests;
costs; forensic science suppliers; tim
eliness; drugs testing; and, value of forensic tests.
MH
B (2004)
To examine the police
use of fingerprint evidence, w
ith particular reference to the im
pact of N
AFIS
.
Impact of N
AFIS
on the investigation of volum
e crime.
Data analysis and
interviews
Analysis of N
AFIS
performance data and an
assessment of 'fingerprint
practices' in five police forces. Interview
s with
officers’ analysis of data on 200 cases w
hich drew on
fingerprint evidence and led to prosecution; and interview
s with senior C
PS
staff about the value of fingerprint evidence in these cases.
Assessm
ent of: practices in bureaux; police investigation practices m
aking use of fingerprint evidence of identity; C
PS
practices; reports provided by P
ITO;
growth in use of N
AFIS; num
ber of identifications in force; and, attrition (scene exam
ination and identification; identifications in the five forces; outcom
e follow
ing identification; and tim
eliness).
Rix, B
. (2004)
To examine the use and
cost-effectiveness of shoem
ark data in the investigation of crim
e.
The use of shoem
ark data in the investigation of volum
e crime.
Telephone and face-to-face interview
s, docum
entary evidence and statistical
Telephone interviews with
SS
Ms from
all 43 forces in E
ngland and Wales; visits
to seven forces, which
involved interviews w
ith officers, S
OC
Os and S
SU
Assessm
ent of the current use of shoem
arks and cost benefit analysis of alternative approaches.

83
information.
staff, as well as w
ith representatives of the C
PS
and FS
S.
William
s, R. (2004)
To identify the influence of contextual and organisational features on the perform
ance of scientific support at force level.
Managem
ent of scientific support to volum
e crime
investigation.
Data analysis;
semi-structured
individual and group interview
s; a num
ber of additional unstructured interview
s; and a focus group.
National perform
ance indicator data; V
isits to seven police forces, involving 26 sem
i-structured individual and group interview
s; and, a num
ber of additional unstructured interview
s in one force.
Exam
ination of the influence of different resource levels; crim
e scene attendance policies; m
anagement of
resources; crime scene
examination processes,
outputs and outcomes on
the performance of scientific
support at police force level.
Initiatives evaluations
Burrows, J. et al. (2005)
To assess the impact of
the Forensic Science
Service P
athfinder P
roject and the National
DNA
Database
Expansion P
rogramm
e.
Improving the
application of forensic science to volum
e crime
investigation.
A ‘process evaluation’, involving sem
i-structured interview
s; a data gathering and m
odelling exercise; and, a ‘case-tracking’ m
echanism to
examine the
outcome of cases
where forensic
identifications w
ere achieved.
Assessm
ent of the two
initiatives in 17 divisions of the G
MP
and Lancashire C
onstabulary. Seven
‘implem
entation’ divisions w
here both initiatives w
here in place, and ten ‘control’ divisions w
here only the D
NA
Expansion
Program
me had been
initiated. Interviews w
ere conducted w
ith Crim
e M
anagers, SO
CO
s, and S
SM
s. Case tracking of
1700 forensic cases.
Assessm
ent of: the forensic activity prior to and during the tw
o initiatives; the value of forensic identifications; A
ttrition; and, the impact of
forensic science on detection.
MH
B (unpublished, year 1) To docum
ent the key lessons that can be derived from
the collection and analysis of key perform
ance
DN
A
submissions
process
Analysis of key perform
ance indicators from
all forces (through the ‘G
eneral Data The ‘G
eneral Data R
eturn’ exercise involved all 43 police forces of E
ngland and W
ales. A further five
police forces were chosen
Assessm
ent of: the collection of D
NA sam
ples from
scenes of crime; the
collection of DNA
samples
from suspects for inclusion

84
indicators from all forces
in the first phase of the D
NA E
xpansion P
rogramm
e.
Return’, w
hich is com
pleted quarterly) and in-depth w
ork in five forces. Interview
s and the preparation of ‘process m
aps’.
for a more detailed stud y of
their systems and
processes. This involved
interviews w
ith the force S
SM
and headquarters staff, and the preparation of ‘process m
aps’ outlining forces policies and practices.
on the database; and actions follow
ing notification of an identification, or m
atch.
MH
B (unpublished year 2) To docum
ent the key lessons that can be derived from
the collection and analysis of key perform
ance indicators from
all forces in the second phase of the D
NA
Expansion
Program
me.
DN
A
submissions
process.
Analysis of key perform
ance indicators from
all forces (through the 'G
eneral Data
Return', w
hich is com
pleted quarterly) and in-depth w
ork in five forces. Interview
s and the preparation of ‘process m
aps’.
The ‘General D
ata Return’
exercise involved all 43 police forces of E
ngland and W
ales. A further five
police forces were chosen for a m
ore detailed study of their system
s and processes. T
his involved interview
s with the force
SS
M and headquarters
staff, and the preparation of ‘process m
aps’ outlining forces policies and practices.
Assessm
ent of: the collection of D
NA sam
ples from
scenes of crime; the
collection of DNA
samples
from suspects for inclusion
on the database; and actions follow
ing notification of an identification, or m
atch.
Efficiency and effectiveness of forensic laboratories
Peterson, J.L., M
ihajlovic, S
., Bedrosian, J.S
. (1985)
To gather information
from all federal, state,
and local crime labs in
the US
to determine the
services provided, num
ber of personnel, evidence caseloads, scientific and research activities, and relationships w
ith user agencies.
The crime
laboratory function.
Postal questionnaire.
Postal eight page
questionnaire sent to 319 federal, state, and local crim
e laboratories (response rate of 82%
).
Opinions of laboratory
officials backed by data collection.

85
Ram
say, M. (1987)
To examine the
effectiveness of the Forensic Science S
ervice in England and
Wales.
The Forensic S
cience S
ervice.
Data collection,
interviews and
questionnaires.
600 personal/property crim
es where the police
sought the help of the FSS
in 1984/85. Cases taken
from tw
o of the six FSS
laboratories in England
and Wales.
Data and
opinions/viewpoints on the
effectiveness of the FSS
.
In-force evaluations
Gaule, M
. (1999)
To identify the effects of tim
eliness of DN
A
crime stain analysis on
resulting detections.
Subm
ission of D
NA
. D
ata analysis.
336 DN
A crim
e stain subm
issions were review
ed prior to the pilot project. 308 D
NA
submissions were
reviewed in the period A
pril to S
ept 1998 during which
time the 28-day turnaround
was being achieved.
Assessm
ent of the percentage resulting hits; the percentage of hits resulting in detections; the percentage of detections resulting in convictions; and the percentage of convictions w
hich were a
result of guilty pleas.
Bond, J. (2002)
To examine the im
pact of im
proving timeliness
on the number of
detections derived from
DN
A intelligence. To im
prove the ‘value for m
oney’ from D
NA
volum
e crime stains
whilst m
aintaining levels of detections.
Timeliness and
‘value for m
oney’ of DN
A
submissions.
Data analysis
Project O
ne: All D
NA
subm
issions for the 12 m
onths period May 2001 to
April 2002. P
roject Tw
o: All
DNA
submission for the 8
month period January
2002 to Septem
ber 2002.
Detections derived from
forensic intelligence (75%
of D
NA hits w
ould be reported by the F
SS w
ithin 28 days). S
uccessful DNA
profiles.

86
Brader, S
. and Delaney, C
.
Assess the impact of
changes to forensic services for investigation of crim
e in tw
o MPS
boroughs, focusing on burglary.
Initial response/ scene assessm
ent/ evidence gathering.
Data analysis,
interviews.
Two London Scientific
Support U
nits
Assessm
ent of: intervention rate; tim
eliness of response; fingerprint and D
NA
submissions; and judicial
disposals for burglary.
Duncliffe, R
.L.
To assess the impact
of introducing trained vehicle exam
iners on crim
e and detections.
Application of
forensic science to vehicle crim
e D
ata analysis
Two vehicle exam
iners stationed at two S
OC
O
offices within W
arwickshire
for the 12 months
comm
encing 4 Septem
ber 2000;
Num
ber of vehicles exam
ined; change in deploym
ent of SO
CO
s; S
OC
O forensic recovery
rates; DN
A samples
collected and submitted;
fingermark subm
issions; num
ber of identifications for vehicle crim
e; and, effect on recorded crim
e.
Kelly, D
.
To establish whether
DN
A identifications are
being used to their m
aximum
potential by the police, prosecution service, and the courts. D
NA
hit notification through to conviction
Analysis of data and crim
e reports, and unstructured interview
s.
60 DN
A hit notifications
taken from six divisions in
GM
P. Ten hit notifications
were taken from
each of the divisions, five relating to burglary offences and five to vehicle crim
e.
Actions relating to the D
NA
hit notifications (detections, elim
ination’s, cautions, charges, and convictions).
Wells, M
.R. (unpublished )
To evaluate the use of D
NA
crime scene
stains, from initial
scene attendance throu gh outcom
e of the investigation.
Initial scene attendance through to outcom
e of investigation.
Data analysis;
workshop training
sessions and com
petency tests.
Com
parison of before and after data sets; training sessions w
ith nine CM
Us;
workshop training sessions
with 30 S
OC
Os; and C
SI
training with 9 students.
Attendance, recovery and
productivity; submission and
process times; sam
ple type and profile rates; and crim
e category and hit ratios.

87
References Association of Chief Police Officers/ Forensic Science Service (1996) Using forensic science effectively. London: ACPO/FSS. Association of Chief Police Officers (2002) Investigation of Volume Crime Manual. London: ACPO. Audit Commission (1993) Helping with enquiries: tacking crime effectively. London: HMSO. Bond, J. (unpublished) Using forensic science intelligence effectively: a report on two projects carried out jointly between Northamptonshire Police and the FSS. Brader, S. and Delaney, C. (unpublished) Borough Forensic Model – Burglary: Final Evaluation Report. Briody, M. (2002) The effects of DNA evidence on sexual offence cases in court. Current Issues in Criminal Justice Vol. 14, No 2 (pp.159-181). Briody, M. (2004) The effects of DNA evidence on homicide cases in court, The Australian and New Zealand Journal of Criminology, Vol.37, No 2 (pp. 231-252). Burrows, J., Hopkins, M, Hubbard, R., Robinson, A., Speed, M. and Tilley, N. (2005) Understanding the attrition process in volume crime investigations. Home Office Research Study 295. London: Home Office. Burrows, J., Tarling R., Mackie, A., Poole, H. and Hodgson, B. (2005) Forensic Science Pathfinder Project: evaluating increased forensic activity in two English police forces. RDS online report OLR 46/05. London: Home Office. Clancy, A., Maguire, M. and Tregidga, J. (2004) Failed prosecutions involving DNA ‘hits’: an analysis of cases in South Wales (unpublished). Coleman, S. (1980) An evaluation of Minnesota’s Automated Fingerprint Identification System (MAFIN). St Paul Minnesota: Crime Control and Planning Board Research and Evaluation Unit. Cordner, G. W. (1990) Estimating the Impact of Automatic Fingerprint Identification in Kentucky. Kentucky: Kentucky Criminal Justice Statistical Analysis Center. Coupe, T. and Griffiths, M. (1996) Solving Residential Burglary. RDS Crime Detection and Prevention Series Paper 77. London: Home Office. Duncliffe, R.L. (unpublished) Warwickshire Vehicle Initiative. FSS in Partnership with Warwickshire Police Eck, J.E. (1983) Solving Crimes: The Investigation of Burglary and Robbery. Washington, DC: Police Executive Research Forum. Ericson, R. V. (1981) Making crime: a study of detective work. Boston: Butterworth. Forensic Science Service (2004) The National DNA Database Annual Report 2003-04 . London: FSS.

88
Fraser, J. G. (2000) Not Science. Not Support: forensic solutions to investigative problems. Science and Justice, 40, 127-130. Gaule, M. (1999) Sussex Police/FSS Partnership Project: Identifying the effects of timeliness of DNA crime stain analysis on resultant detections. Unpublished. Green, R. and Loader, P. (2005) Scientific Support Performance Improvement Work Package. London: Home Office/ACPO/Lanner. Greenwood, P. and Petersilia, J. (1975) The Criminal Investigation Process - Volume 1: Summary and Policy Implications. Santa Monica, California: Rand. Greenwood, P., Chaiken, J. and Petersilia, J. (1977) The Criminal Investigation Process. Lexington, Mass: DC Heath. Her Majesty’s Inspectorate of Constabulary (HMIC) (1998) What price policing? A study of efficiency and value for money in the police service. London: Home Office. Her Majesty’s Inspectorate of Constabulary (HMIC) (2000) Under the microscope: thematic inspection report on scientific and technical support. London: Home Office. Her Majesty’s Inspectorate of Constabulary (HMIC) (2002) Under the microscope refocused: a revisit to the investigative use of DNA and fingerprints. London: Home Office. Home Affairs Select Committee (2005) Police Reform Fourth Report of Session 2004-05. HC370-1. London: The Stationery Office. Horvath, F. and Meesig, R. T. (1996) The Criminal Investigation Process and the Role of Forensic Evidence: A Review of Empirical Findings, Journal of Forensic Science, 41, (6) (pp.963-969). Horvath, F. and Meesig, R. T. (1998) Content analysis of textbooks on criminal investigation: an evaluative comparison to empirical research findings on the investigative process and the role of forensic evidence. Journal of Forensic Science, 43, (1), (pp.133 – 140). Horvath, F., Meesig, R.T. and Lee, Y.H. (2002). National Survey of Police Policies and Practices Regarding the Criminal Investigations Process: Twenty-Five Years After Rand. Criminal Investigation Online http//www.ciol.org/survey/summary.html <accessed 25th November 2004) Jansson, K. (2005) Volume crime investigations - a review of the research literature. Online report OLR 44/05. London: Home Office. Jones, C. and Weatherburn D. (2004) Evaluating police operations (1): a process and outcome evaluation of Operation Vendas www.lawlink.nsw.gov.au/boscar <accessed 2nd March 2005> Kelly, D. (unpublished) Research into the DNA hit process. Lanner Group (2004) Narrowing the Justice Gap: a report on opportunities to increase detections through better exploitation of forensic science. London: Home Office, Police Standards Unit. Latif, T. (unpublished) Leicestershire Constabulary Police Standards Unit Consultancy Project. FSS in Partnership with Leicestershire Constabulary. Leary, D. and Pease, K. (2003) DNA and the active criminal population, Crime Prevention and Community Safety – An International Journal 5, (1), (pp.7-12).
89
McCulloch, H. (1996) Police use of forensic science. Police Research Series Paper 19. London: Home Office. McCulloch, H. and Tilley, N. (unpublished) Effectiveness and efficiency in obtaining fingerprint identifications. MHB (2004) The processing of fingerprint evidence after the introduction of the National Automated Fingerprint Identification System (NAFIS). RDS online report OLR 23/04. London: Home Office. MHB (unpublished, year 1) DNA Expansion Programme: Evaluation Report, Phase One (April 2000 - March 2001). MHB (unpublished, year 2) DNA Expansion Programme: Evaluation Report for 2001/02. Miyazawa, S. (1992) Policing in Japan: a study on making crime. Albany New York: State University of New York Press. Misner, G. E. and McDonald, W. F. (1970) Reduction of Robberies and Assaults of Bus Drivers (Vol. II): The scope of the crime problem and its resolution. Berkeley California: University of California School of Criminology. Parker, B. and Gurgin, V. (1972). Criminalistics in the world of the future. Menlo Park California: Stanford Research Institute. Parker, B. and Peterson, J. L. (1972) Physical Evidence Utilization in the Administration of Criminal Justice. Washington DC: US Department of Justice. Petersilia, J. (1978) Processing Latent Fingerprints – What are the payoffs? Journal of Police Science and Administration, vol. 6, No 2 (pp.157-167). Peterson, J. L. (1974) The Utilization of Criminalistics Services by the Police: an analysis of the physical evidence recovery process. Washington DC: US Department of Justice. Peterson, J.L., Mihajlovic, S. and Gilliland, M. (1984) Forensic evidence and the police: the effects of scientific evidence on criminal investigations. Washington DC: US Government Printing Office. Peterson, J.L., Mihajlovic, S. and Bedrosian, J.S. (1985) The capabilities, uses and effects of the nation’s criminalistics laboratories. Journal of Forensic Sciences, Vol. 30, No 1 (pp.10 – 23). Peterson, J.L., Ryan, J.P., Houlden, P.J. and Mihajlovic, S. (1986) The uses and effects of scientific evidence in criminal case processing. Washington DC: US Department of Justice, National Institute of Justice. Peterson, J.L., Ryan, J.P., Houlden, P.J. and Mihajlovic, S. (1987) The uses and effects of forensic science in the adjudication of felony cases. Journal of Forensic Sciences, 32 (6) (pp.1730 – 1753). Police Skills and Standards Organisation (2003) Police sector – skills foresight report 2003. Police Skills and Standards Organisation. Purcell, N., Winfree, Jr, L.T. and Mays, G. L. (1994). DNA (Dexoyribonucleic Acid) evidence
90
and criminal trials: an exploratory survey of factors associated with the use of ‘genetic fingerprinting’ in felony prosecutions. Journal of Criminal Justice, Vol. 22 No 2 (pp.145-157). Ramsay, M. (1987) The effectiveness of the Forensic Science Service. Home Office Research Study No 92. London: Home Office. Rix, B. (2004) The contribution of shoemark data to police intelligence, crime detection and prosecution. Research Findings 236. London: Home Office. Roberts, P. and Willmore, C. (1993) Role of forensic science evidence in criminal proceedings. London: HMSO. Rosenthal, P. and Travnicek, D.A. (1974) Analysis of Criminalistics Laboratory Effectiveness in Criminal Justice Systems. Buffalo, New York: Calspan Corporation. Saulsbury, W., Hibberd, M., and Irving, B. (1994) Using physical evidence: an examination of police decision making. London: The Police Foundation. Schneider, P. M. and Martin, P. D. (2001) Criminal DNA databases: the European Situation, Forensic Science International, 1, 19 (pp.232-238). Science and Technology Select Committee (2005) Forensic Science on Trial. Seventh Report of Session 2004-05. HC 96-1. London: The Stationery Office. SEARCH Group Inc. (undated) The Arizona Fingerprint Identification Project – An evaluation. Sacramento, California: Search Group. Smith, N. and Flanagan, C. (2000) The effective detective: identifying the skills of an effective SIO. Police Research Series No. 122. London: Home Office. Soothill, K., Francis, B., Ackerley, E., and Fligelstone, R. (2002) Murder and serious sexual assault: what criminal histories can reveal about future serious offending. Police Research Series No.144: London: Home Office. Speakman, M. J. (unpublished, 1999) Evaluation of DNA ACPO/FSS DNA user group. Steer, D. (1980) Uncovering Crime: The Police Role. Royal Commission on Criminal Procedure, Research Study (7). London: HMSO. Taylor, M. and Hirst, J. (1995) Initial Scene Visits to House Burglaries. Police Research Series No. 14. London: Home Office. Taylor, B., Joiner, R. and McCarthy, D. (1973) Evidence Technician Unit Evaluation. St Louis Missouri: Missouri Law Enforcement Assistance Council. Thomas, N. and Feist, A. (2004) Detection of Crime in Crime in England and Wales 2003/2004 Statistical Bulletin 07/04. London: Home Office. Tilley, N. and Ford, A. (1996) Forensic science and crime investigation. Crime Detection and Prevention Series Paper 73. London: Home Office. Touche Ross (1987) Review of Scientific Support for the Police. 3 vols. London: Home Office. Walsh, S. J., Moss, D. S., Kliem C. and Vintiner, G. M. (2002) The collation of forensic DNA case data into a multi-dimensional intelligence database Science and Justice Vol.42 No 4 (pp. 205-214).

91
Warboys, F. E. (1987) Employee orientation to automated fingerprint identification systems. Proceedings from an International Forensic Symposium on Latent Prints. pp101-107 Quantico, Virginia. Ward, R. H. (1971) The investigative function: criminal investigation in the United States. Unpublished D. Crim. dissertation, School of Criminology University of California. Wells, M.R. (unpublished ) DNA Project – maximising potential. FSS in Partnership with South Wales Police. Williams, R. (2004) The management of crime scene investigation in relation to burglary and vehicle crime. Online report OLR 24/04. London: Home Office. Wolfe and Associates (1989) Management Study of the State Criminal Justice Information and Identification System. Honolulu, Hawaii: Legislative Auditor of the State of Hawaii.

Produced by the Research Development and Statistics Directorate, HomeOffice
This document is available only in Adobe Portable Document Format (PDF)through the RDS website
http://www.homeoffice.gov.uk/rds
Email: [email protected]
ISBN 1 84473 760 8 Crown copyright 2005


![Crime Scene and DNA Basics for Forensic Analysts[1]](https://img.pdfslide.net/doc/110x75/5469ec6bb4af9fba2b8b4984/crime-scene-and-dna-basics-for-forensic-analysts1.jpg)