Embed Size (px)
Citation preview
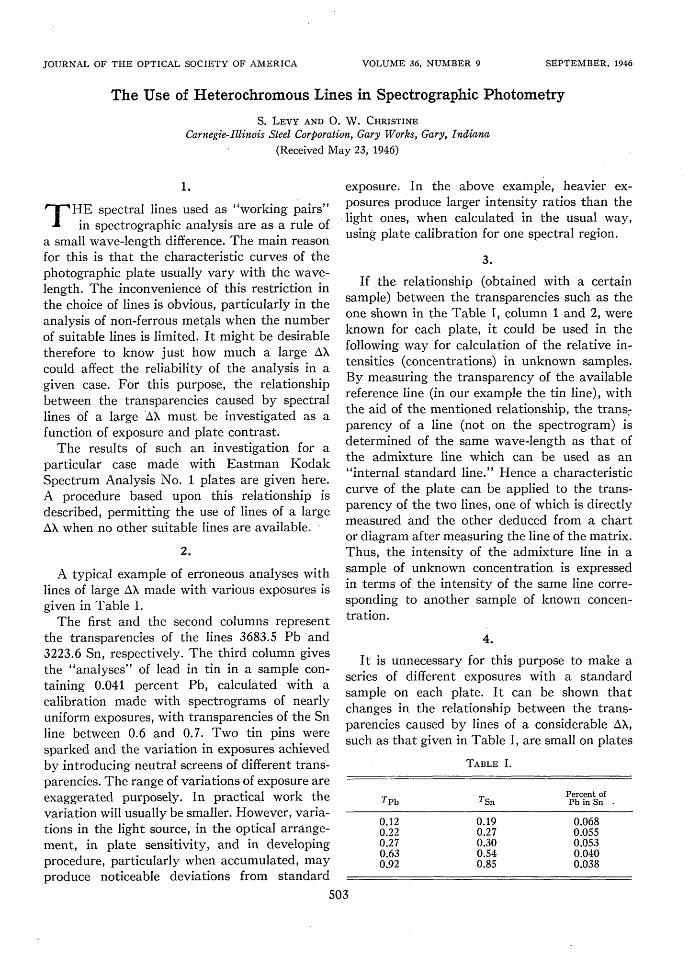
JOURNAL OF THE OPTICAL SOCIETY OF AMERICA
The Use of Heterochromous Lines in Spectrographic Photometry
S. LEVY AND 0. W. CHRISTINE
Carnegie-Illinois Steel Corporation, Gary Works, Gary, Indiana(Received May 23, 1946)
THE spectral lines used as "working pairs"T in spectrographic analysis are as a rule ofa small wave-length difference. The main reasonfor this is that the characteristic curves of thephotographic plate usually vary with the wave-length. The inconvenience of this restriction inthe choice of lines is obvious, particularly in theanalysis of non-ferrous metals when the numberof suitable lines is limited. It might be desirabletherefore to know just how much a large AXcould affect the reliability of the analysis in agiven case. For this purpose, the relationshipbetween the transparencies caused by spectrallines of a large X must be investigated as afunction of exposure and plate contrast.
The results of such an investigation for aparticular case made with Eastman KodakSpectrum Analysis No. 1 plates are given here.A procedure based upon this relationship isdescribed, permitting the use of lines of a largeAX when no other suitable lines are available.
2.
A typical example of erroneous analyses withlines of large AX made with various exposures isgiven in Table I.
The first and the second columns representthe transparencies of the lines 3683.5 Pb and3223.6 Sn, respectively. The third column givesthe "analyses" of lead in tin in a sample con-taining 0.041 percent Pb, calculated with acalibration made with spectrograms of nearlyuniform exposures, with transparencies of the Snline between 0.6 and 0.7. Two tin pins weresparked and the variation in exposures achievedby introducing neutral screens of different trans-parencies. The range of variations of exposure areexaggerated purposely. In practical work thevariation will usually be smaller. However, varia-tions in the light source, in the optical arrange-ment, in plate sensitivity, and in developingprocedure, particularly when accumulated, mayproduce noticeable deviations from standard
exposure. In the above example, heavier ex-posures produce larger intensity ratios than the
.light ones, when calculated in the usual way,using plate calibration for one spectral region.
3.
If the relationship (obtained with a certainsample) between the transparencies such as theone shown in the Table I, column 1 and 2, wereknown for each plate, it could be used in thefollowing way for calculation of the relative in-tensities (concentrations) in unknown samples.By measuring the transparency of the availablereference line (in our example the tin line), withthe aid of the mentioned relationship, the trans-parency of a line (not on the spectrogram) isdetermined of the same wave-length as that ofthe admixture line which can be used as an"internal standard line." Hence a characteristiccurve of the plate can be applied to the trans-parency of the two lines, one of which is directlymeasured and the other deduced from a chartor diagram after measuring the line of the matrix.Thus, the intensity of the admixture line in asample of unknown concentration is expressedin terms of the intensity of the same line corre-sponding to another sample of known concen-tration.
4.
It is unnecessary for this purpose to make aseries of different exposures with a standardsample on each plate. It can be shown thatchanges in the relationship between the trans-parencies caused by lines of a considerable AX,such as that given in Table I, are small on plates
TABLE I.
Percent ofTPb TSn Pb in Sn
0.12 0.19 0.0680.22 0.27 0.0550.27 0.30 0.0530.63 0.54 0.0400.92 0.85 0.038
503
SEPTEMBER, 1946VOLUME 36, NUMBER 9
S. LEVY AND 0. W. CHRISTINE
of the same emulsion type but of varying con-trast. Moreover, these changes can be accountedfor on each plate if the characteristic curve ofthe plate for one wave-length region is known.
This can be demonstrated experimentally andalso can be deduced by recalling the features ofthe characteristic curves of the photographicemulsions. They were discussed in a previouspaper' in so far as the application to spectro-graphic analysis is concerned and have beensince extensively tested in this laboratory. Theirvalidity within the limits necessary for ourpresent purpose can be considered established.
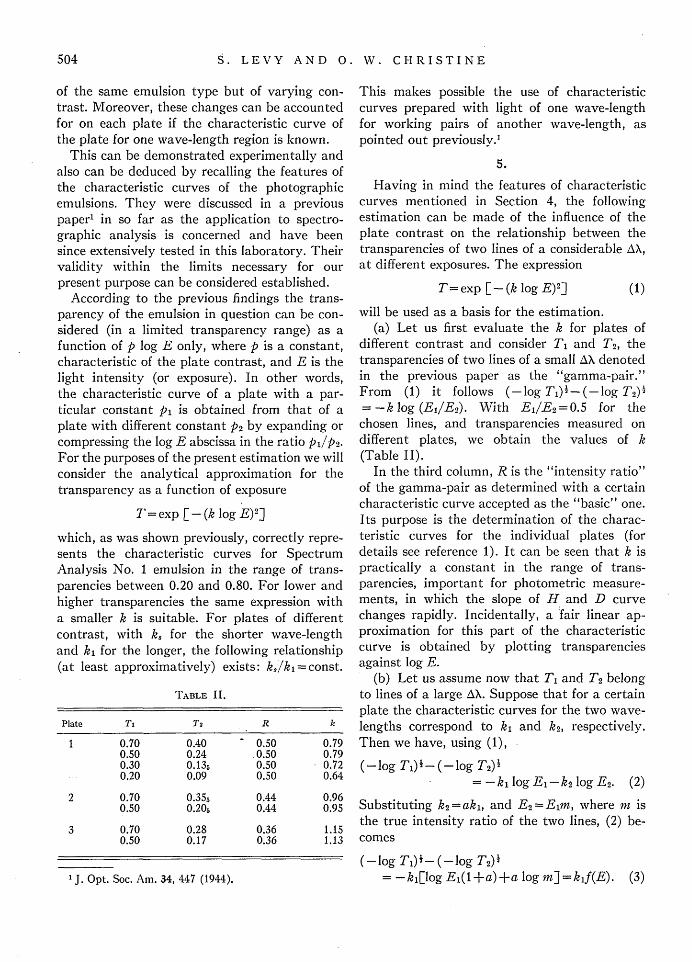
According to the previous findings the trans-parency of the emulsion in question can be con-sidered (in a limited transparency range) as afunction of p log E only, where p is a constant,characteristic of the plate contrast, and E is thelight intensity (or exposure). In other words,the characteristic curve of a plate with a par-ticular constant pi is obtained from that of aplate with different constant P2 by expanding orcompressing the log E abscissa in the ratio P1/P2.For the purposes of the present estimation we willconsider the analytical approximation for thetransparency as a function of exposure
T=exp [-(k log E)2 ]
which, as was shown previously, correctly repre-sents the characteristic curves for SpectrumAnalysis No. 1 emulsion in the range of trans-parencies between 0.20 and 0.80. For lower andhigher transparencies the same expression witha smaller k is suitable. For plates of differentcontrast, with k for the shorter wave-lengthand k for the longer, the following relationship(at least approximatively) exists: kki=const.
TABLE II.
Plate Ti T2 R k
1 0.70 0.40 0.50 0.790.50 0.24 .0.50 0.790.30 0.135 0.50 0.720.20 0.09 0.50 0.64
2 0.70 0.355 0.44 0.960.50 0.205 0.44 0.95
3 0.70 0.28 0.36 1.150.50 0.17 0.36 1.13
l J Opt. Soc. Am. 34, 447 (1944).
This makes possible the usecurves prepared with light offor working pairs of anotherpointed out previously.
of characteristicone wave-lengthwave-length, as
5.
Having in mind the features of characteristiccurves mentioned in Section 4, the followingestimation can be made of the influence of theplate contrast on the relationship between thetransparencies of two lines of a considerable AX,at different exposures. The expression
T= exp [-(k log E)2 ] (1)
will be used as a basis for the estimation.(a) Let us first evaluate the k for plates of
different contrast and consider T, and T, thetransparencies of two lines of a small AX denotedin the previous paper as the "gamma-pair."From (1) it follows (-log Tl) 1 -(-log T2 )-=-k log (Ej/E2 ). With E1 /E 2 =0.5 for thechosen lines, and transparencies measured ondifferent plates, we obtain the values of k(Table II).
In the third column, R is the "intensity ratio"of the gamma-pair as determined with a certaincharacteristic curve accepted as the "basic" one.Its purpose is the determination of the charac-teristic curves for the individual plates (fordetails see reference 1). It can be seen that k ispractically a constant in the range of trans-parencies, important for photometric measure-ments, in which the slope of H and D curvechanges rapidly. Incidentally, a fair linear ap-proximation for this part of the characteristiccurve is obtained by plotting transparenciesagainst log E.
(b) Let us assume now that T, and T2 belongto lines of a large AX. Suppose that for a certainplate the characteristic curves for the two wave-lengths correspond to k, and k2, respectively.Then we have, using (1),
(-log T) -(-log T2) =-k logEj-k 2 logE 2. (2)
Substituting k 2 =ak,, and E2 =Elm, where m isthe true intensity ratio of the two lines, (2) be-comes
(-log T,) -(-log T2 )1=-k,[log E,(1+a)+a log m]=kjf(E). (3)
504
HETEROCHROMOUS LINES IN
The Eq. (3) shows that (- log Ti)i - (- log T2)V'kis for the two lines a function of exposure only,that is, of the density level only, which is charac-terized, for instance, by T1 . For each k, T2 canthen be calculated, that corresponds to a givenT1, if the relationship is known for a certain k.That is to say, the relationship of transparenciesof these two lines of different wave-lengths forplate of any contrast can be calculated if ithas been found empirically for a certain contrast.
6.
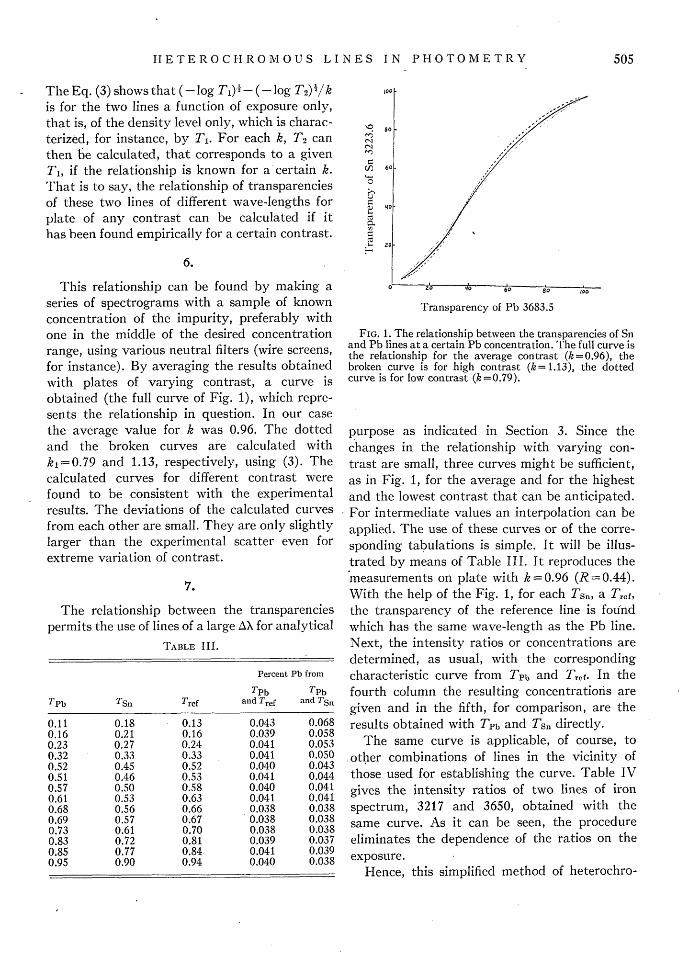
This relationship can be found by making aseries of spectrograms with a sample of knownconcentration of the impurity, preferably withone in the middle of the desired concentrationrange, using various neutral filters (wire screens,for instance). By averaging the results obtainedwith plates of varying contrast, a curve isobtained (the full curve of Fig. 1), which repre-sents the relationship in question. In our casethe average value for k was 0.96. The dottedand the broken curves are calculated withkl=0.79 and 1.13, respectively, using (3). Thecalculated curves for different contrast werefound to be consistent with the experimentalresults. The deviations of the calculated curvesfrom each other are small. They are only slightlylarger than the experimental scatter even forextreme variation of contrast.
7.
The relationship between the transparenciespermits the use of lines of a large AX for analytical
TABLE III.
Percent Pb from
TPb TPb
TPb TSn T
ref and Tref and TSn
0.11 0.18 0.13 0.043 0.0680.16 0.21 0.16 0.039 0.0580.23 0.27 0.24 0.041 0.0530.32 0.33 0.33 0.041 0.0500.52 0.45 0.52 0.040 0.0430.51 0.46 0.53 0.041 0.0440.57 0.50 0.58 0.040 0.0410.61 0.53 0.63 0.041 0.0410.68 0.56 0.66 0.038 0.0380.69 0.57 0.67 0.038 0.0380.73 0.61 0.70 0.038 0.0380.83 0.72 0.81 0.039 0.0370.85 0.77 0.84 0.041 0.0390.95 0.90 0.94 0.040 0.038
100
CSInC:
cuO
0
U
H_
so
60
ZQ qo 60 80 to0
Transparency of Pb 3683.5
FIG. 1. The relationship between the transparencies of Snand Pb lines at a certain Pb concentration. The full curve isthe relationship for the average contrast (k=0.96), thebroken curve is for high contrast (k=1.13), the dottedcurve is for low contrast (k=0.79).
purpose as indicated in Section 3. Since thechanges in the relationship with varying con-trast are small, three curves might be sufficient,as in Fig. 1, for the average and for the highestand the lowest contrast that can be anticipated.For intermediate values an interpolation can beapplied. The use of these curves or of the corre-sponding tabulations is simple. It will be illus-trated by means of Table III. It reproduces themeasurements on plate with k=0.96 (R= 0.44).With the help of the Fig. 1, for each Tsn a Tref,
the transparency of the reference line is foundwhich has the same wave-length as the Pb line.Next, the intensity ratios or concentrations aredetermined, as usual, with the correspondingcharacteristic curve from TPb and Tref. In thefourth column the resulting concentrations aregiven and in the fifth, for comparison, are theresults obtained with Tpb and Tsn directly.
The same curve is applicable, of course, toother combinations of lines in the vicinity ofthose used for establishing the curve. Table IVgives the intensity ratios of two lines of ironspectrum, 3217 and 3650, obtained with thesame curve. As it can be seen, the procedureeliminates the dependence of the ratios on theexposure.
Hence, this simplified method of heterochro-
- | |
PHOTOMETRY 505
BRIAN O'BRIEN
TABLE IV.
Intensity ratios from
T3650 T3 6.5 0T3217 T35o Tref and Tref and T3 217
0.13 0.05 0.07 0.78 0.510.22 0.12 0.17 0.78 0.650.31 0.20 0.30 0.76 0.750.42 0.35 0.48 0.78 0.870.47 0.40 0.54 0.77 0.880.50 0.46 0.57 0.81 0.930.66 0.65 0.75 0.82 0.980.67 0.66 0.76 0.78 0.980.81 0.83 0.89 0.83 1.06
mous photometry can be used also in othercases where the true values of intensity ratios
are of no importance and where, therefore, acalibrated light source is unnecessary; for in-stance, in the quantitative analysis by meansof the Raman effect which is in principle similarto the spectrographic analysis by emission.
It must be pointed out, however, that theresults of the heterochromous photometry canbe expected, in general, to have a somewhatlarger scatter in comparison to those in theusual monochromous photometry. The non-uni-formity of the developed photographic emulsionmight increase with the distance of the linesfrom each other. A smaller dispersion is thereforepreferable.
JOURNAL OF THE OPTICAL SOCIETY OF AMERICA VOLUME 36, NUMBER 9 SEPTEMBER, 1946
A Theory of the Stiles and Crawford Effect
BRIAN O'BRIENInstitute of Optics, University of Rochester, Rochester, New York
(Received June 22, 1946)
SOME thirteen years ago Stiles and Crawford'reported that light entering the human eye at
the center of the pupil was several times moreeffective in producing the sensation of vision thanlight entering near the margin of the pupil. Thisis usually known as the Stiles and Crawfordeffect, and has been amply confirmed by several,other investigators.'-' Subsequent work by thediscoverers of the effect 6 has shown that itoccurs for the light adapted but not for the darkadapted eye. Stiles7 has shown that the effect isdefinitely related to cone vision, since it is foundat all levels of adaptation when measurementsare confined to the fovea. The effect is also foundin any part of the retina when deep red light isused for illumination. In other words the effect isfound to exist in all cases where the visual re-sponse is owing primarily to the cone cells, whileunder conditions where pure rod vision is assured
I W. S. Stiles and B. H. Cravford, Proc. Roy. Soc. B112,428 (1933), B116, 55 (1934).
2 W. D. Wright and J. H. Nelson, Proc. Phys. Soc. 48,401 (1936).
3 W. Dziobek, Licht 4, 150 (1934).4 C. F. Goodeve, Proc. Roy. Soc. A155, 664 (1936).5 W. S. Stiles, Proc. Roy. Soc. B123, 90 (1937).' B. H. Crawford, Proc. Roy. Soc. B124, 81 (1937).7 W. S. Stiles, Proc. Roy. Soc. B127, 64 (1939).
there appears to be no Stiles and Crawford effectat all.
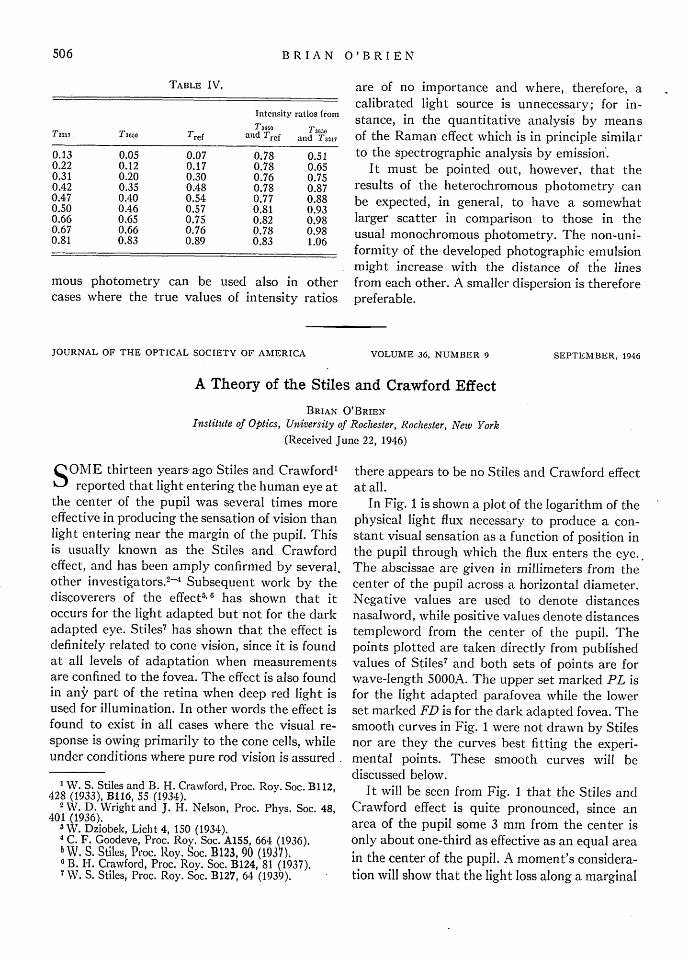
In Fig. 1 is shown a plot of the logarithm of thephysical light flux necessary to produce a con-stant visual sensation as a function of position inthe pupil through which the flux enters the eye.The abscissae are given in millimeters from thecenter of the pupil across a horizontal diameter.Negative values are used to denote distancesnasalword, while positive values denote distancestempleword from the center of the pupil. Thepoints plotted are taken directly from publishedvalues of Stiles7 and both sets of points are forwave-length 5000A. The upper set marked PL isfor the light adapted parafovea while the lowerset marked D is for the dark adapted fovea. Thesmooth curves in Fig. 1 were not drawn by Stilesnor are they the curves best fitting the experi-mental points. These smooth curves will bediscussed below.
It will be seen from Fig. 1 that the Stiles andCrawford effect is quite pronounced, since anarea of the pupil some 3 mm from the center isonly about one-third as effective as an equal areain the center of the pupil. A moment's considera-tion will show that the light loss along a marginal
506