Embed Size (px)
Citation preview
The use of Historical Control Data to Assess the Benefits of New Therapies: A Case Study of Blinatumomab versus Standard Therapy of Adults relapsed/refractory Acute Lymphoblastic Leukaemia
Maurille Feudjo Tepie
Director, Observational Research, Amgen Ltd
Joint EMA – EUROPABIO Workshop
London, 22nd, November 2016
Outline Background
Historical control group • Sources of data, analysis methods, results
Conclusion/discussion • Challenges, lessons learned,
Background: ALL Disease
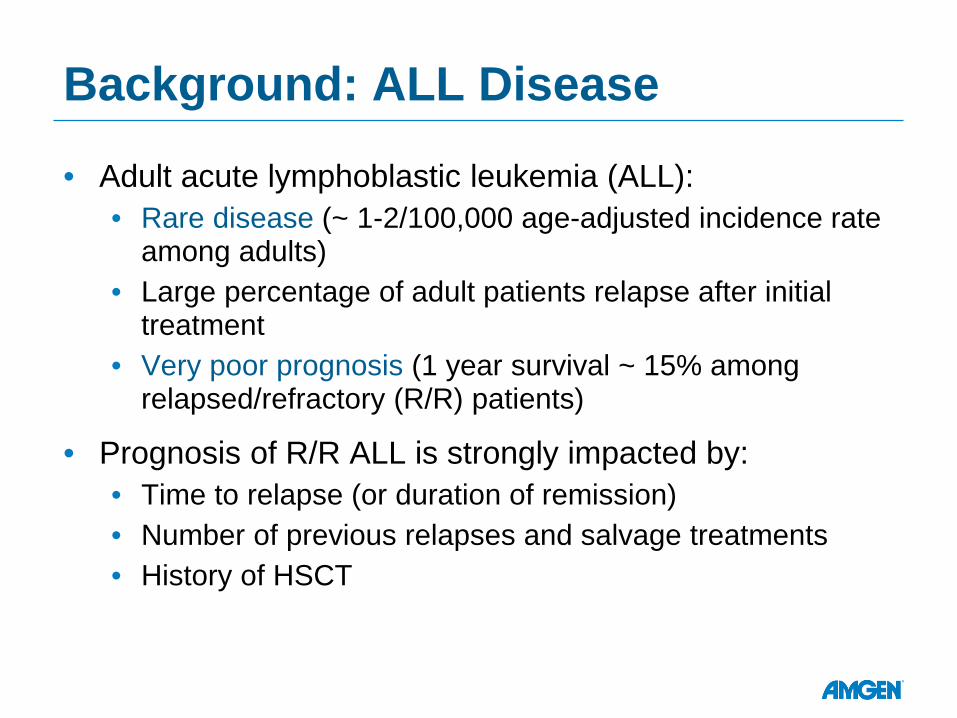
• Adult acute lymphoblastic leukemia (ALL): • Rare disease (~ 1-2/100,000 age-adjusted incidence rate
among adults) • Large percentage of adult patients relapse after initial
treatment • Very poor prognosis (1 year survival ~ 15% among
relapsed/refractory (R/R) patients)
• Prognosis of R/R ALL is strongly impacted by: • Time to relapse (or duration of remission) • Number of previous relapses and salvage treatments • History of HSCT
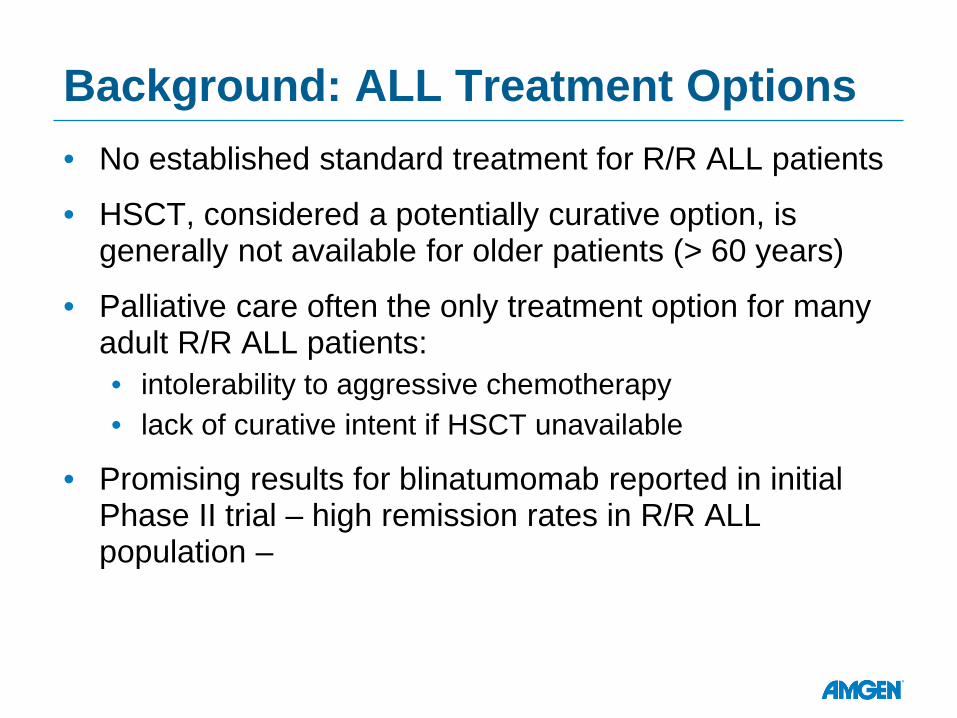
Background: ALL Treatment Options • No established standard treatment for R/R ALL patients
• HSCT, considered a potentially curative option, is generally not available for older patients (> 60 years)
• Palliative care often the only treatment option for many adult R/R ALL patients: • intolerability to aggressive chemotherapy • lack of curative intent if HSCT unavailable
• Promising results for blinatumomab reported in initial Phase II trial – high remission rates in R/R ALL population –
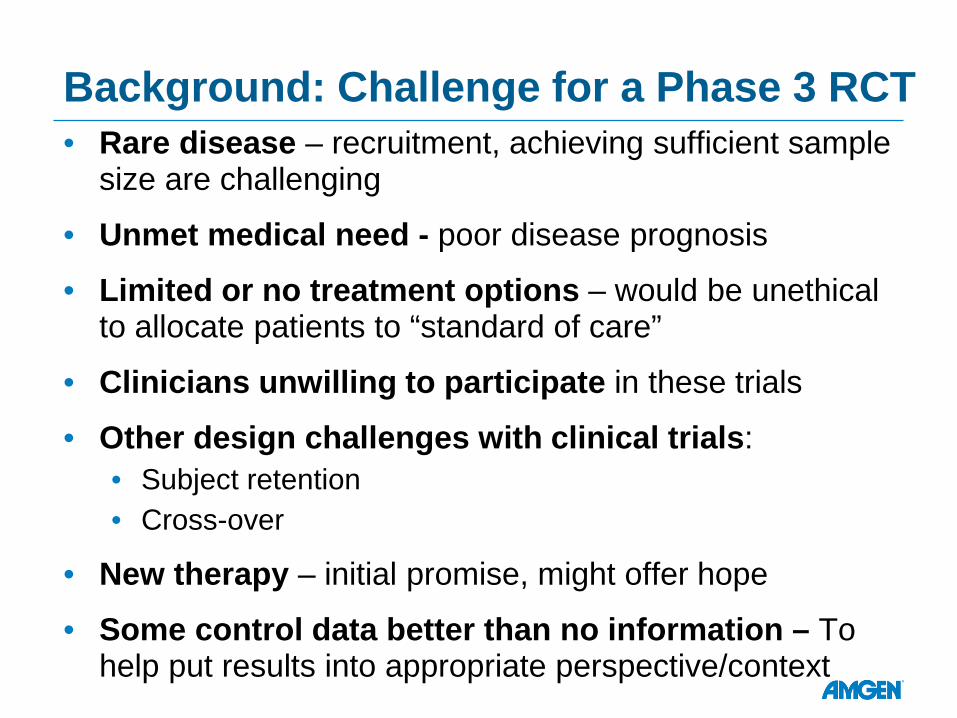
Background: Challenge for a Phase 3 RCT • Rare disease – recruitment, achieving sufficient sample
size are challenging
• Unmet medical need - poor disease prognosis
• Limited or no treatment options – would be unethical to allocate patients to “standard of care”
• Clinicians unwilling to participate in these trials
• Other design challenges with clinical trials: • Subject retention • Cross-over
• New therapy – initial promise, might offer hope
• Some control data better than no information – To help put results into appropriate perspective/context
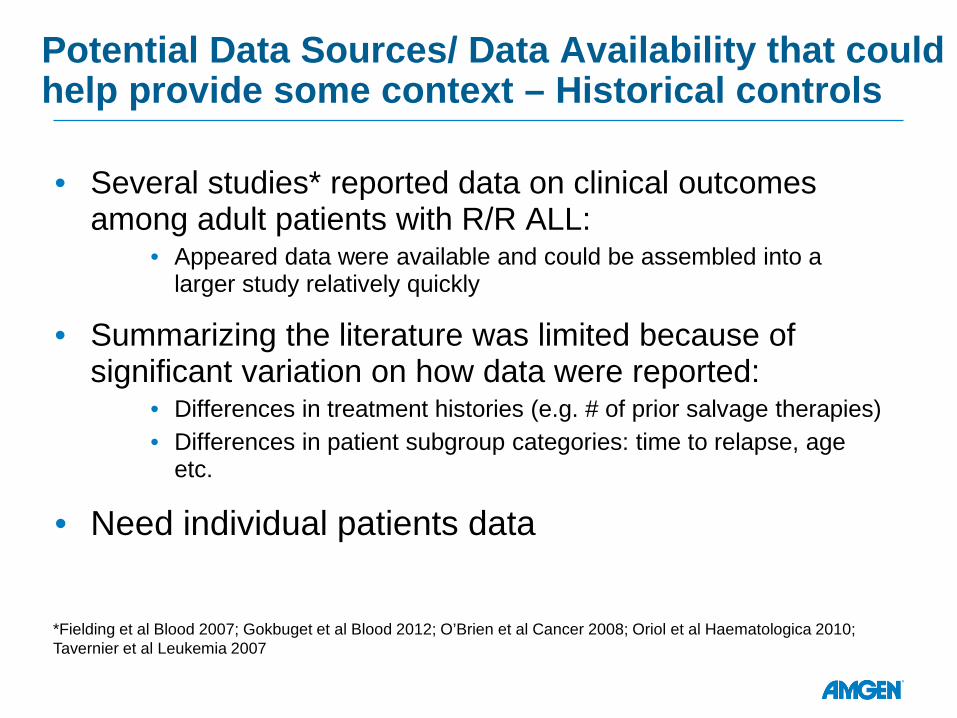
Potential Data Sources/ Data Availability that could help provide some context – Historical controls
• Several studies* reported data on clinical outcomes among adult patients with R/R ALL:
• Appeared data were available and could be assembled into a larger study relatively quickly
• Summarizing the literature was limited because of significant variation on how data were reported:
• Differences in treatment histories (e.g. # of prior salvage therapies) • Differences in patient subgroup categories: time to relapse, age
etc.
• Need individual patients data
*Fielding et al Blood 2007; Gokbuget et al Blood 2012; O’Brien et al Cancer 2008; Oriol et al Haematologica 2010; Tavernier et al Leukemia 2007
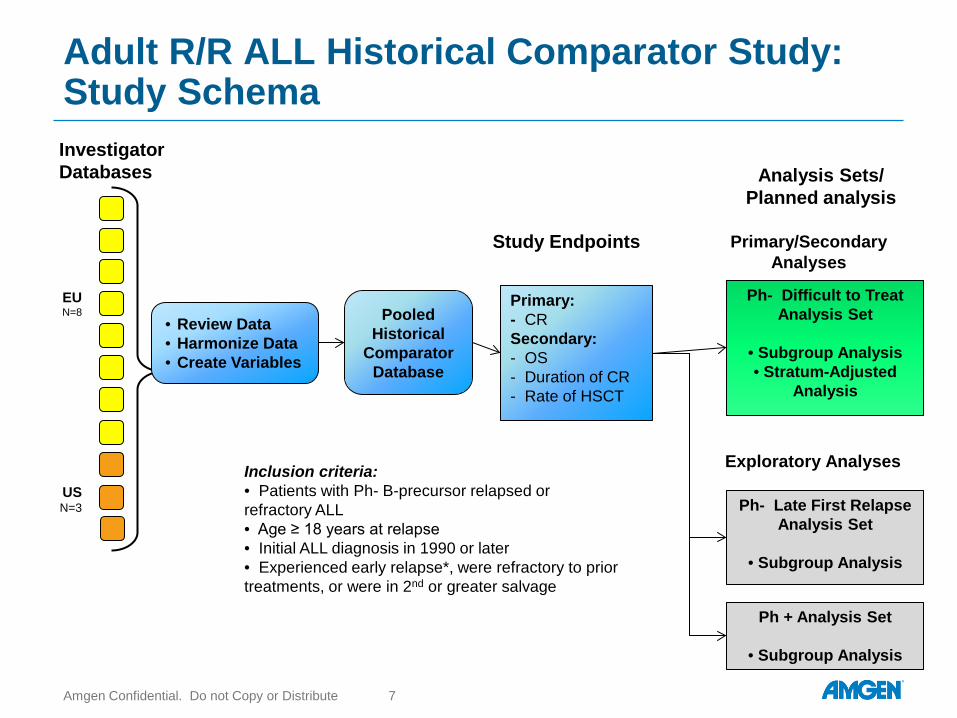
Adult R/R ALL Historical Comparator Study: Study Schema
Amgen Confidential. Do not Copy or Distribute 7
Investigator Databases
EU N=8
US N=3
• Review Data • Harmonize Data • Create Variables
Pooled Historical
Comparator Database
Primary: - CR Secondary: - OS - Duration of CR - Rate of HSCT
Ph- Difficult to Treat Analysis Set
• Subgroup Analysis • Stratum-Adjusted
Analysis
Ph + Analysis Set
• Subgroup Analysis
Analysis Sets/ Planned analysis
Study Endpoints Primary/Secondary Analyses
Ph- Late First Relapse Analysis Set
• Subgroup Analysis
Exploratory Analyses Inclusion criteria: • Patients with Ph- B-precursor relapsed or refractory ALL • Age ≥ 18 years at relapse • Initial ALL diagnosis in 1990 or later • Experienced early relapse*, were refractory to prior treatments, or were in 2nd or greater salvage
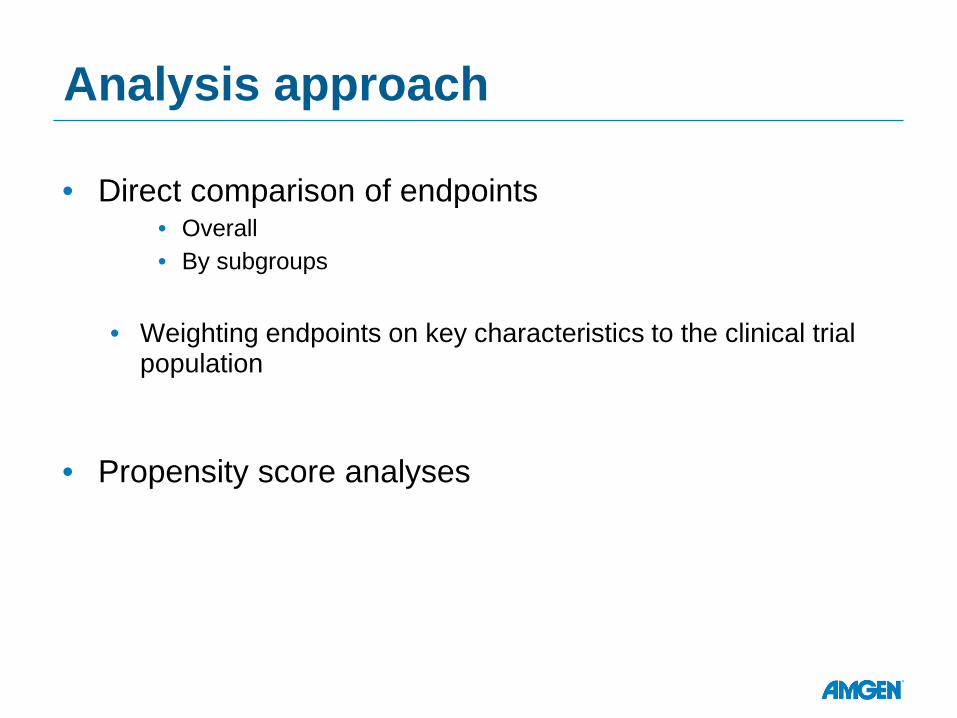
Analysis approach
• Direct comparison of endpoints • Overall • By subgroups
• Weighting endpoints on key characteristics to the clinical trial
population
• Propensity score analyses
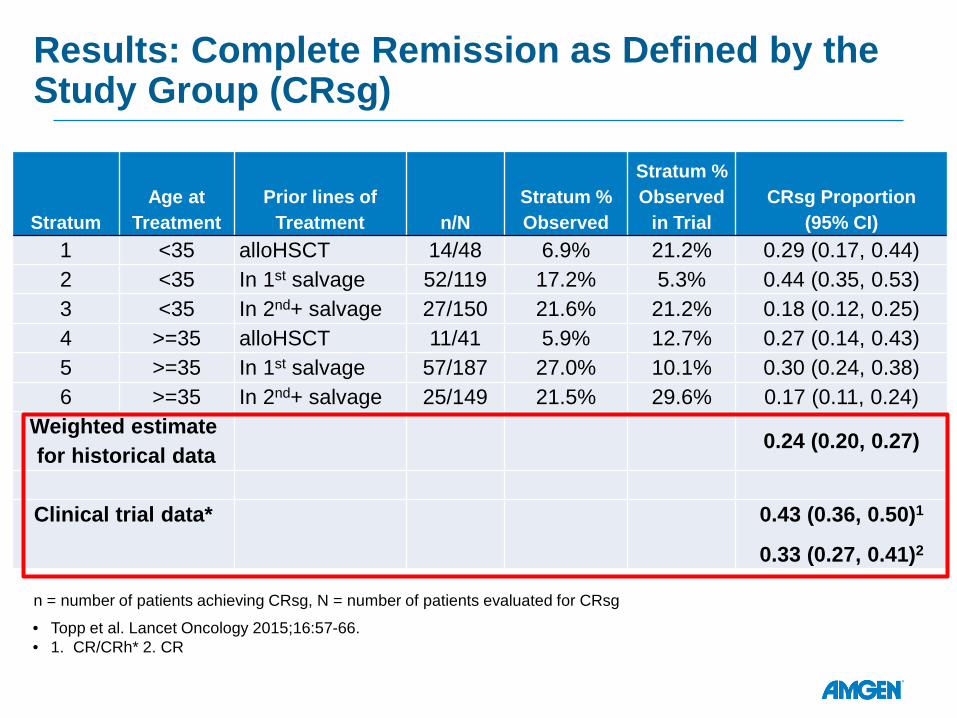
Results: Complete Remission as Defined by the Study Group (CRsg)
Stratum Age at
Treatment Prior lines of
Treatment n/N Stratum % Observed
Stratum % Observed
in Trial CRsg Proportion
(95% CI) 1 <35 alloHSCT 14/48 6.9% 21.2% 0.29 (0.17, 0.44) 2 <35 In 1st salvage 52/119 17.2% 5.3% 0.44 (0.35, 0.53) 3 <35 In 2nd+ salvage 27/150 21.6% 21.2% 0.18 (0.12, 0.25) 4 >=35 alloHSCT 11/41 5.9% 12.7% 0.27 (0.14, 0.43) 5 >=35 In 1st salvage 57/187 27.0% 10.1% 0.30 (0.24, 0.38) 6 >=35 In 2nd+ salvage 25/149 21.5% 29.6% 0.17 (0.11, 0.24)
Weighted estimate for historical data
0.24 (0.20, 0.27)
Clinical trial data* 0.43 (0.36, 0.50)1
0.33 (0.27, 0.41)2 n = number of patients achieving CRsg, N = number of patients evaluated for CRsg
• Topp et al. Lancet Oncology 2015;16:57-66. • 1. CR/CRh* 2. CR
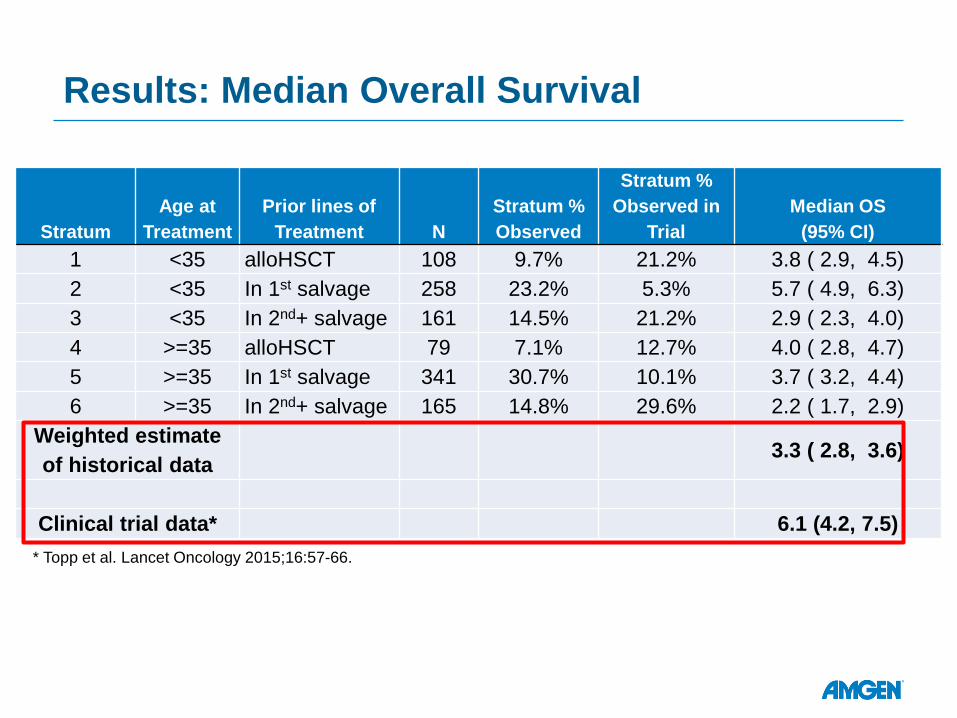
Results: Median Overall Survival
Stratum Age at
Treatment Prior lines of
Treatment N Stratum % Observed
Stratum % Observed in
Trial Median OS
(95% CI) 1 <35 alloHSCT 108 9.7% 21.2% 3.8 ( 2.9, 4.5) 2 <35 In 1st salvage 258 23.2% 5.3% 5.7 ( 4.9, 6.3) 3 <35 In 2nd+ salvage 161 14.5% 21.2% 2.9 ( 2.3, 4.0) 4 >=35 alloHSCT 79 7.1% 12.7% 4.0 ( 2.8, 4.7) 5 >=35 In 1st salvage 341 30.7% 10.1% 3.7 ( 3.2, 4.4) 6 >=35 In 2nd+ salvage 165 14.8% 29.6% 2.2 ( 1.7, 2.9)
Weighted estimate of historical data
3.3 ( 2.8, 3.6)
Clinical trial data* 6.1 (4.2, 7.5) * Topp et al. Lancet Oncology 2015;16:57-66.
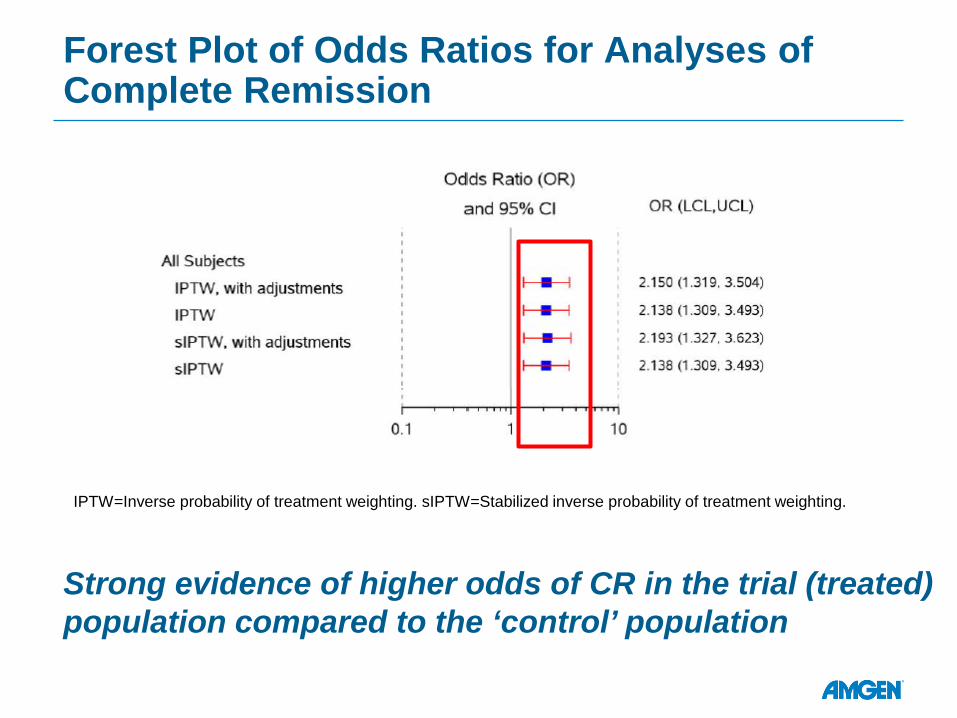
Forest Plot of Odds Ratios for Analyses of Complete Remission
IPTW=Inverse probability of treatment weighting. sIPTW=Stabilized inverse probability of treatment weighting.
Strong evidence of higher odds of CR in the trial (treated) population compared to the ‘control’ population
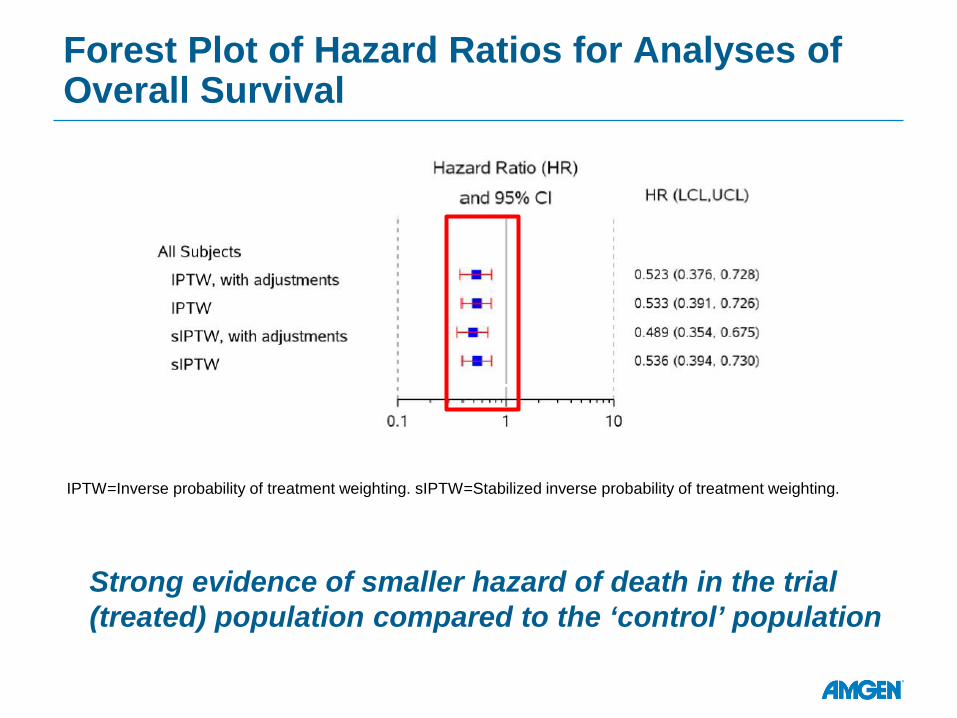
Forest Plot of Hazard Ratios for Analyses of Overall Survival
IPTW=Inverse probability of treatment weighting. sIPTW=Stabilized inverse probability of treatment weighting.
Strong evidence of smaller hazard of death in the trial (treated) population compared to the ‘control’ population
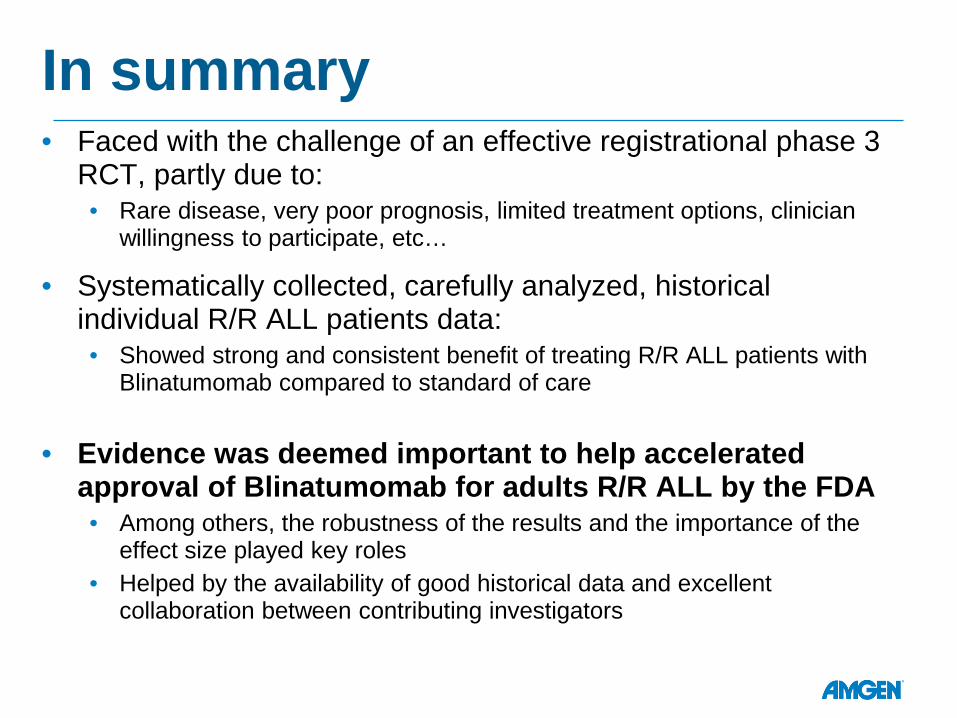
In summary • Faced with the challenge of an effective registrational phase 3
RCT, partly due to: • Rare disease, very poor prognosis, limited treatment options, clinician
willingness to participate, etc…
• Systematically collected, carefully analyzed, historical individual R/R ALL patients data: • Showed strong and consistent benefit of treating R/R ALL patients with
Blinatumomab compared to standard of care
• Evidence was deemed important to help accelerated approval of Blinatumomab for adults R/R ALL by the FDA • Among others, the robustness of the results and the importance of the
effect size played key roles • Helped by the availability of good historical data and excellent
collaboration between contributing investigators
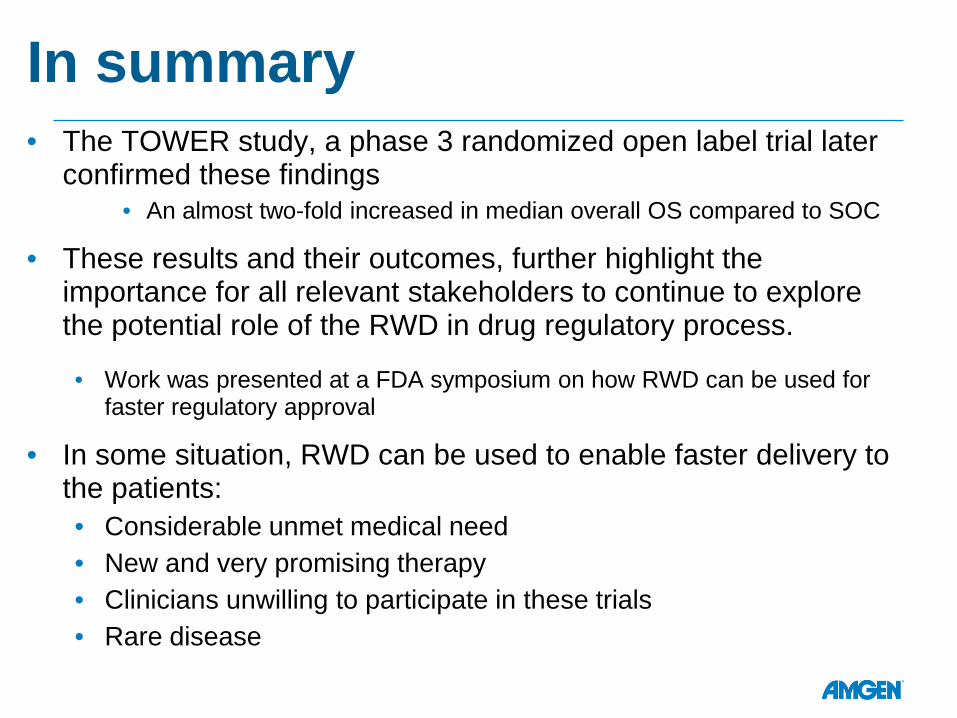
In summary • The TOWER study, a phase 3 randomized open label trial later
confirmed these findings • An almost two-fold increased in median overall OS compared to SOC
• These results and their outcomes, further highlight the importance for all relevant stakeholders to continue to explore the potential role of the RWD in drug regulatory process.
• Work was presented at a FDA symposium on how RWD can be used for faster regulatory approval
• In some situation, RWD can be used to enable faster delivery to the patients: • Considerable unmet medical need • New and very promising therapy • Clinicians unwilling to participate in these trials • Rare disease
Study Collaborators • Nicola Gokbuget*, Dieter Hoelzer
• University Hospital, Goethe University, Frankfurt, Germany
• Hagop Kantarjian, Susan O’Brien • University of Texas, Houston, Texas, United
States
• Hervè Dombret • Hôpital Saint-Louis, Paris, France
• Jose-Maria Ribera • ICO-Hospital Germans Trias I Pujol, Jose
Carreras Research Institute, Barcelona, Spain
• Adele K. Fielding • UCL Cancer Institute, London, United
Kingdom
• Renato Bassan • UOC Ematologia, Ospedale dell'Angelo,
Mestre-Venezia, Italy
• Sebastian Giebel • Maria Sklodowska Curie Memorial Cancer
Center and Institute of Oncology, Gliwice, Poland
* Principal Investigator
• Anjali Advani • Cleveland Clinic, Cleveland, Ohio, United
States
• Michael Doubek • University Hospital, Brno, Czech Republic
• Giovanni Martinelli • Policlinico S Orsola Istituto Seragnoli, Italy
• Martha Wadleigh • Dana Farber Cancer Institute, Boston,
Massachusetts
• Norbert Ifrah • Center Hospitalier Universitaire, Angers,
France
• Mireia Morgades • H. Germans Trias I Pujol, Barcelona, Spain
• Jacob M Rowe • Rambam Medical Center, Haifa, Israel
• Victoria Chia, Aaron Katz, Michael Kelsh, Julia Steiglmaier
• Amgen

Thank You!

Back UP
Particular Efforts to Minimize Bias
• At data collection stage – requested sites to provide all patients with R/R ALL – rather than having sites apply selection criteria
• Inclusion/exclusion criteria applied centrally across all data sets
• Study sites reflected centers of excellence for treatment of ALL
• Weighting, stratified, and propensity score analyses to make endpoints more comparable
• Variety of sensitivity analyses conducted in order to address assumptions
Strength/Limitations of the approach
• Availability of and access to external control data
• Data definitions – outcomes, exposure, covariates
• Study biases: • Selection • Confounding • Immortal Time
• Treatment differences: across time, geographic regions
• Heterogeneity
Propensity Score Analysis – Methods • Propensity scores derived from logistic regression
models considering available covariates
• Odds ratio (OR) for complete remission estimated from logistic regression models, using stabilized inverse probability treatment weighting (sIPTW)
• Hazard ratio (HR) for death estimated from Cox models, using inverse probability treatment weighting (IPTW)
• Sensitivity analysis conducted by: • Alternating weighting factors • Time period • Further model adjustments
20
Propensity Score Analysis
• Aim to create balance in baseline covariates between patients treated with blinatumomab and patients treated with standard of care (historical comparator)
• Covariates: • Age (years) • Sex (male, female) • Duration between most recent treatment and initial diagnosis • Region (USA, Europe) • Prior HSCT (yes, no) • Number of salvage therapies (1, 2, 3, and 4+) • Primary refractory and in/entering first salvage (yes, no) • Refractory to last salvage therapy (yes, no)
21
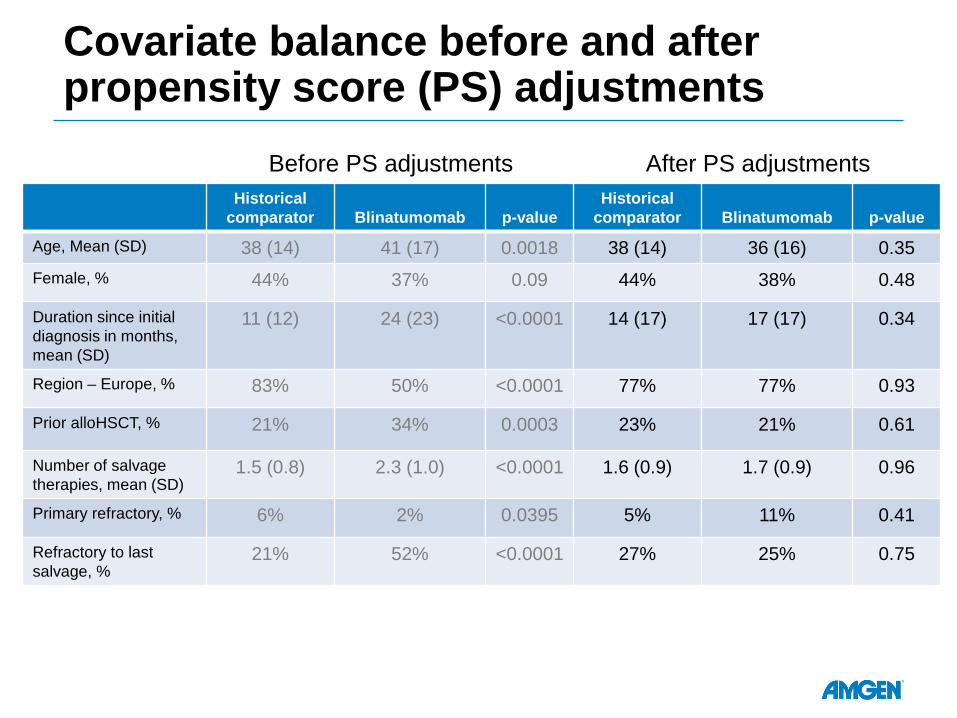
Covariate balance before and after propensity score (PS) adjustments
Historical comparator Blinatumomab p-value
Historical comparator Blinatumomab p-value
Age, Mean (SD) 38 (14) 41 (17) 0.0018 38 (14) 36 (16) 0.35 Female, % 44% 37% 0.09 44% 38% 0.48
Duration since initial diagnosis in months, mean (SD)
11 (12) 24 (23) <0.0001 14 (17) 17 (17) 0.34
Region – Europe, % 83% 50% <0.0001 77% 77% 0.93
Prior alloHSCT, % 21% 34% 0.0003 23% 21% 0.61
Number of salvage therapies, mean (SD)
1.5 (0.8) 2.3 (1.0) <0.0001 1.6 (0.9) 1.7 (0.9) 0.96
Primary refractory, % 6% 2% 0.0395 5% 11% 0.41
Refractory to last salvage, %
21% 52% <0.0001 27% 25% 0.75
Before PS adjustments After PS adjustments

Particular Efforts to Minimize Bias
• At data collection stage – requested sites to provide all patients with R/R ALL – rather than having sites apply selection criteria
• Inclusion/exclusion criteria applied centrally across all data sets
• Study sites reflected centers of excellence for treatment of ALL
• Weighting, stratified, and propensity score analyses to make endpoints more comparable
• Variety of sensitivity analyses conducted in order to address assumptions