Embed Size (px)
Citation preview

ABSTRACT
Title of dissertation: USE OF TARTARIC ACID AND ISOPROPYL ALCOHOL IN THE REDUCTION OF HEXAVALENT CHROMIUM AND APPLICATION TO CHROMIUM CONTAMINATED SOILS AND CHROMITE ORE PROCESSING RESIDUE
Dominic A. Brose, Doctor of Philosophy, 2012
Dissertation directed by: Professor Bruce R. James Department of Environmental Science and Technology
Although chromium (Cr) is a naturally occurring metal, in the oxidation state +(VI), it is
a health concern when present in soils and natural waters due to its solubility and toxicity.
Tartaric acid and isopropyl alcohol were evaluated for reduction of Cr(VI) at
environmentally relevant pH values, in the presence of soils, and from chromite ore
processing residue (COPR). Soil samples were taken from profiles located in
delineations of five soil mapping units in Maryland, USA: Christiana-Russett Complex,
Askecksy, Annapolis, Jackland, and Ingleside. In solution, the rate of reduction of
Cr(VI) by the tartaric acid-Cr-isopropyl alcohol complex was lowered from 0.128 to
0.011 h-1 as pH was raised from 3.0 to 5.0; however, in the presence of the Russett and
Jackland soils, the rates of reduction were 0.037 and 0.020 h-1, respectively despite pH
values of 5.3 and 5.0. In addition to Cr(VI) reduction, 97.6 and 89.9 µM Mn(II), and 427

and 67.6 µM Fe(II) were solubilized from the Russett and Jackland soils, respectively.
Adding soluble Mn2+ and Fe3+ to the five soils with tartaric acid and isopropyl alcohol
enhanced reduction of Cr(VI) in all soils, with the addition of Mn2+ enhancing reduction
by an additional 0.27 mM Cr(VI) in the Jackland soil and to 1.46 mM in the Downer soil.
Furthermore, the addition of tartaric acid and isopropyl alcohol to Mn-oxide coated sand
(1.8x10⁻¹ µmol Mn/mg) showed reductive dissolution of Mn(III,/IV)(hydr)oxides, and the
resulting Mn(II) enhanced reduction to 1.24 mM (62%) of Cr(VI). When applied to
COPR, tartaric acid-Cr-isopropyl alcohol or tartaric acid-Cr-Mn complexes reduced 0.3
mM (30%) Cr(VI), although when COPR was mixed with the Atsion, Collington, or
Russett soils, pH values remained below 5.0 and 0.84 mM (84%) of the Cr(VI) was
reduced. This work showed that a tartaric acid and isopropyl alcohol solution reductively
dissolves Mn(III,/IV)(hydr)oxides from soils, and the resulting Mn(II) enhances
reduction of Cr(VI), which can be potentially applied to the reduction of COPR-derived
Cr(VI) in a soil remediation strategy.

USE OF TARTARIC ACID AND ISOPROPYL ALCOHOL IN THE REDUCTION OF
HEXAVALENT CHROMIUM AND APPLICATION TO CHROMIUM CONTAMINATED SOILS AND CHROMITE ORE PROCESSING RESIDUE
By
Dominic A. Brose
Dissertation submitted to the Faculty of the Graduate School of the University of Maryland, College Park in partial fulfillment
for the requirements for the degree of Doctor of Philosophy
2012
Advisory Committee: Professor Bruce R. James, Chair Professor Neil Blough Professor Allen P. Davis Associate Professor Bahram Momen Professor Martin C. Rabenhorst

©Copyright by Dominic A. Brose
2012

ii
ACKNOWLEDGEMENTS
I wish to acknowledge and sincerely thank the many people who, without their assistance, completing this study would not be possible.
I would like to thank Bruce James, who has been not only my advisor, but my mentor, teacher, and friend over the years. It has been his patience and guidance that allowed for this work to be completed.
I would like to Marina Moses and my colleagues at the National Academies for
their encouragement and support. And lastly, thank you to my family and close friends for being there from when I first started down this path.

iii
TABLE OF CONTENTS
Chapter 1: Use of Tartaric Acid and Isopropyl Alcohol in the Reduction of Hexavalent Chromium and Application to Chromium Contaminated Soils and Chromite Ore Processing Residue: Literature Review .....................................................................1 Chapter 2: Hexavalent Chromium Reduction in Aqueous Solutions: The Role of Isopropyl Alcohol and Tartaric Acid .....................................................25 Chapter 3: The Role of Tartaric Acid, Isopropyl Alcohol, and Manganese in the Reduction of Hexavalent Chromium in Cr(VI)-Contaminated Soils ........................45 Chapter 4: Reduction of Hexavalent Chromium from Chromite Ore Processing Residue (COPR) with Tartaric Acid, Isopropyl Alcohol, and Divalent Manganese .................................................................................................................69 Chapter 5: Concluding Remarks ................................................................................91 Appendix A: Log Transformed Plots of First-Order Rate Reactions ........................97 Appendix B: Overview of Soils and Sampling ..........................................................101 Appendix C: Data Tables ...........................................................................................113 References ..................................................................................................................124
LIST OF FIGURES
Figure 1-1 Monoisopropyl chromate .........................................................................7 Figure 1-2 A pe-pH Diagram for Cr(VI)-Cr(III) .......................................................19 Figure 1-3 Reduction of 0.2 mM Cr(VI) in Watchung A Horizon Soil ....................20 Figure 2-1A Reduction 2.0 mM Cr(VI) with Increasing Isopropyl Alcohol .............30 Figure 2-2A Reduction 2.0 mM Cr(VI) with Increasing Tartaric Acid .....................31 Figure 2-3A Reduction 2.0 mM Cr(VI) with Increasing pH .....................................32 Figure 2-4A Reduction 2.0 mM Cr(VI) with Increasing Initial Cr(VI) Conc. ..........33 Figure 2-1B First-Order Rate Constants as Function of Isopropyl Alcohol ..............35 Figure 2-2B First-Order Rate Constants as Function of Tartaric Acid ......................36 Figure 2-3B First-Order Rate Constants as Function of pH ......................................37 Figure 2-4B First-Order Rate Constants as Function of Initial Cr(VI) Conc ............38 Figure 2-5A Decrease in pe in Samples with Increasing Isopropyl Conc. ................40 Figure 2-5B Decrease in pe in Samples with Increasing Tartaric Acid Conc. ..........41 Figure 2-6 A pe-pH Diagram for Cr(III)-Cr(VI) .......................................................42 Figure 3-1A Reduction 2.0 mM Cr(VI) in Presence of Maryland Soils ....................52 Figure 3-1B Log Transformed Plot for Reduction Cr(VI) in Maryland Soils ...........54

iv
Figure 3-2 Increase in pH with Reduction of Cr(VI) in Maryland Soils ...................55 Figure 3-3A Increase in Soluble Mn with Reduction Cr(VI) in Maryland Soils .......58 Figure 3-3B Increase in Soluble Fe with Reduction Cr(VI) in Maryland Soils ........59 Figure 3-4 Reduction 2mM Cr(VI) with Mn-oxide Coated Sand ..............................62 Figure 3-5 Reduction 2 mM Soluble in Presence of Six Soil-Related Metals ...........64 Figure 4-1A Reduction 1 mM Cr(VI) by Mn and Isopropyl Alcohol at Low and High Acidity ...................................................................................78 Figure 4-1B First-Order Rate Constants for Reduction Cr(VI) by Mn and Isopropyl Alcohol at Low and High Acidity ........................................79 Figure 4-2 Change in pH with Reduction COPR-Derived Cr(VI) ............................81 Figure 4-3A Reduction COPR-Derived Cr(VI) by Mn and Isopropyl Alcohol at Low and High Acidity........................................................................82 Figure 4-3B Log Transformed Plot for Reduction COPR-Derived Cr(VI) by Mn and Isopropyl Alcohol at Low and High Acidity ......................84 Figure 4-4 Fractions Cr Recovered from COPR Samples .........................................85 Figure 4-5 Fractions Cr Recovered from COPR-Soils Samples ................................88 Figure 4-6 Total Soluble Mn From COPR-Soils Samples.........................................89 Figure A-1 Log Transformed Plot for Increasing Isopropyl Alcohol ........................97 Figure A-2 Log Transformed Plot for Increasing Tartaric Acid ................................98 Figure A-3 Log Transformed Plot for Increasing pH ................................................99 Figure A-4 Log Transformed Plot for Increasing Initial Cr(VI) Concentrations ......100 Figure B-1 Russett Soil ..............................................................................................103 Figure B-2 Downer Soil .............................................................................................105 Figure B-3 Jackland Soil ............................................................................................107 Figure B-4 Collington Soil ........................................................................................109 Figure B-5 Atsion Soil ...............................................................................................111
LIST OF TABLES
Table 1-1 Reduction Half-Reactions for Cr and Soil Redox Active Species ............20 Table 3-1 Soil Characterization Data .........................................................................48 Table 3-2 Reduction 2 mM Cr(VI) in Maryland Soils with Fe3+ and Mn2+ Spikes and Oxidation 2 mM Cr(III) ...........................................................61 Table 4-1 Soil Characterization Data .........................................................................73 Table 4-2 Cr-Solution and COPR Sample Experimental Values ..............................77 Table B-1 Russett Soil Characterization Data ...........................................................94 Table B-2 Downer Soil Characterization Data ..........................................................95 Table B-3 Jackland Soil Characterization Data .........................................................98 Table B-4 Collington Soil Characterization Data ......................................................110 Table B-5 Atsion Soil Characterization Data ............................................................112 Table C-1 Figure 2-1A Data Set ................................................................................113
v
Table C-2 Figure 2-1B Data Set ................................................................................113 Table C-3 Figure 2-2A Data Set ................................................................................114 Table C-4 Figure 2-2B Data Set ................................................................................114 Table C-5 Figure 2-3A and 2-4A Data Sets..............................................................115 Table C-6 Figure 2-3B and 2-4B Data Sets ...............................................................115 Table C-7 Figure 2-5A Data Set ................................................................................116 Table C-8 Figure 2-5B Data Set ................................................................................116 Table C-9 Figure 3-1A Data Set ................................................................................117 Table C-10 Figure 3-1B Data Set ..............................................................................117 Table C-11 Figure 3-2 Data Set .................................................................................117 Table C-12 Figure 3-3A Data Set ..............................................................................118 Table C-13 Figure 3-3B Data Set ..............................................................................118 Table C-14 Figure 3-4 Data Set .................................................................................119 Table C-15 Figure 3-5 Data Set .................................................................................119 Table C-16 Figure 4-1A Data Set ..............................................................................120 Table C-17 Figure 4-1B Data Set ..............................................................................120 Table C-18 Figure 4-2 Data Set .................................................................................121 Table C-19 Figure 4-3A Data Set ..............................................................................121 Table C-20 Figure 4-3B Data Set ..............................................................................122 Table C-21 Figure 4-4 Data Set .................................................................................122 Table C-22 Figure 4-5 Data Set .................................................................................123 Table C-23 Figure 4-6 Data Set .................................................................................123

1
CHAPTER 1
USE OF TARTARIC ACID AND ISOPROPYL ALCOHOL IN THE REDUCTION OF HEXAVALENT CHROMIUM AND APPLICATION TO CHROMIUM
CONTAMINATED SOILS AND CHROMITE ORE PROCESSING RESIDUE: LITERATURE REVIEW
Challenges to the Remediation of Hexavalent Chromium
Chromium is a naturally occurring, transition metal found in the environment
mostly in the trivalent state, such as the chromium ore ferrochromite (FeO•Cr2O3). For
commercial use, ferrochromite ore is mined and roasted at high temperatures under
alkaline conditions by addition of sodium carbonate (soda ash); thereby oxidizing
insoluble Cr(III) to soluble Cr(VI) which is then leached from the roast to be used in a
wide array of industrial and consumer products (Darrie, 2001). Chromite ore processing
residue (COPR), the remaining solid waste product from this process, contains variable
amounts of unreacted ore and soluble and insoluble forms of Cr(VI), and is a persistent
source of Cr(VI) contamination in notable locations such as Baltimore, Maryland;
Hudson County, New Jersey; and Glasgow, Scotland (Burke et al., 1991; Darrie, 2001;
Deakin et al., 2001). COPR has also been used as fill material for construction purposes
because of its resemblance to a sandy soil, such as in the Dundalk Marine Terminal in
Baltimore, MD (CH2M Hill, 2011); however, residual Cr(VI) can persist as a potential
pollutant of soils, air, and groundwater from this soil-like material. For example, in
Hudson County, New Jersey, it was used to fill wetlands and poorly-drained landscapes
for use in industrial activity and development during the twentieth century (James, 1996).
Current remediation practices for COPR use either an Fe- or S-based reducing
agent, with the former resulting in concretions or clogging of pores with oxidized Fe(III)

2
minerals formed as Cr(VI) is reduced to Cr(III); the use of S results in delayed ettringite
(Ca6Al2(SO4)3•32H2O) formation, which results in extensive swelling and buckling of
paved surfaces when used as fill material for roads (Dermatas et al., 2006; Ludwig et al.,
2008). In contrast to these reducing agents, this research will investigate the potential use
of tartaric acid in an alcohol-water solution as an effective alternative to Fe- or S-based
reducing agents in the reduction of COPR derived Cr(VI). Remediation-by-reduction is a
soil clean-up strategy that can be used in an attempt to mitigate the toxic effects of Cr(VI)
and to clean up Cr contaminated sites to meet regulatory standards and protect human
health (James, 1996).
Health Concerns and Regulatory Context of Hexavalent Chromium
Concerns regarding the presence of Cr in the environment focus on the potential
adverse health effects of Cr(VI)-contaminated soils, groundwater, and drinking water
supplies. Regulation of Cr is currently based, not on the oxidation state of Cr, but on
total chromium concentration [i.e., the sum of Cr(III) and Cr(VI)]. The U.S.
Environmental Protection Agency’s national standard for total Cr in drinking water is 100
µg/L (100 ppb), except in California, whose current drinking water standard is 50 µg/L
(CDPH, 2009; USEPA, 2010). In 1999, California set a Public Health Goal of 2.5 µg/L,
which was based on a 1968 study in Germany that found stomach tumors in animals that
repeatedly ingested Cr(VI). The EPA rejected that study as flawed and determined there
was no evidence it was carcinogenic in water, which resulted in the state rescinding its
goal in 2001 and reverting back to the 50 µg/L standard (CDPH, 2009). The point of

3
contention regarding the 1968 study was on whether Cr(VI) is reduced to Cr(III) in the
stomach by gastric acids at pH 1-2.
Chromium(VI) is genotoxic in a number of in vitro and in vivo toxicity assays
(IARC, 1990). Because the mechanisms of genotoxicity and carcinogenicity are not fully
understood, the National Toxicology Program (NTP) conducted animal tests to assess the
potential for cancer due to ingestion of Cr(VI) (Stout et al., 2009). Reduction of Cr(VI)
to Cr(III) is hypothesized to occur primarily in the stomach, as a mechanism of
detoxification. In this 2-year NTP study, observed increases in abnormal growths in the
small intestine of mice, toxicity to red and white blood cells and bone marrow, and
uptake of Cr(VI) into tissues suggested that at least a portion of the administered Cr(VI)
was not reduced in the stomach (Stout et al., 2009).
This finding, in addition to the absence of increases in abnormal growths in the
small intestine in rats or mice exposed to chromium picolinate monohydrate (CPM), an
organically bound form of Cr(III) (NTP, 2008), provides evidence that Cr(VI) is not
completely reduced in the stomach and is responsible for these carcinogenic effects.
Additionally, it should be noted that Cr(III), like that found in CPM, is essential for
human health in trace amounts as an activator of insulin (ATSDR, 2000), but exists
predominantly in nature in cationic forms that are only sparingly-soluble in near-neutral
pH soils, plants, cells, and natural waters (Kimbrough et al., 1999).
There is currently no national, regulated standard for Cr in soils. Regulated
standards for Cr(VI) and Cr(III) are determined and enforced at the state level. Due to
extensive soil contamination from COPR disposal on and in soils of Hudson County, NJ,
the New Jersey Department of Environmental Protection (NJDEP) has set the allowable

4
Cr(VI) level in soils at 20 mg/kg based on a risk assessment analysis reviewed by a
NJDEP-established Chromium Workgroup (NJDEP, 2010). This is the lowest standard
set by any state. In order to successfully apply a remediation strategy that could meet a
standard of 20 mg Cr(VI)/kg soil, a thorough understanding of the dissolution, solubility,
reduction, and potential oxidation of Cr from Cr-containing minerals in COPR and
COPR-contaminated soils is essential.
Chromite Ore Processing Residue (COPR)
In oxidizing insoluble Cr(III) and extracting Cr(VI) from chromite ore
(FeO•Cr2O3) in a high-temperature lime roasting process, chromite ore processing residue
(COPR) is produced. This process separates metal impurities, such as Fe, Mg, and Al
from Cr and isolates Cr as soluble sodium chromate (Na2CrO4) (Lioy et al., 1992).
Added lime (CaO) forms Cr(III) and Cr(VI) minerals with a highly alkaline pH
approximately 11-12, and total Cr levels up to 46,000 mg/kg (Lioy et al., 1992).
Although each sample of COPR varies in mineralogical and chemical properties
from location to location and depending on how much CaO was added, some
commonalities of mineralogical properties important to understanding the chemical
behavior of COPR during reduction processes have been investigated (Chrysochoou et
al., 2010; Hillier et al., 2003; Tinjum et al., 2008). The most abundant metals other than
Cr found in COPR samples are Ca, Mg, Fe, and Al (Chrysochoou et al., 2010).
Additionally, Hillier et al. (2003) rationalized that there are three main categories of
mineral compositions in COPR samples. The first is chromite, a relic of the chromite ore.
The second category consists of minerals formed at the high temperatures during the
5
roasting process, such as brownmillerite and periclase, and the third category of minerals
includes ones that are presumed to have formed after COPR has been deposited and
exposed to more natural conditions, such as the leaching of elements with the influx of
water and uptake of CO2. Although there are many different minerals that can be
assigned to these three categories, there are four common minerals in COPR that have
been found to incorporate Cr(VI) by substitution for Fe or Al in their structures:
brownmillerite (Ca2(Fe,Al)2O5), ettringite (Ca6Al2(SO4)3(OH)12•26H2O), hydrocalumite
(Ca2(Al,Fe)(OH)6(OH) •3H2O), and hydrogarnet (Ca3(Al,Fe)2(H4O4)3) (Chrysochoou et
al., 2010; Hillier et al., 2003). Additionally, up to 30% of the mineralogical makeup of
COPR can be paracrystalline in structure (Hillier et al., 2003).
Column studies assessing the reduction of COPR with the influx of FeSO4-H2SO4
or polysulfides (CaSx) demonstrated that the hydraulic conductivity of the COPR
decreased following reduction treatment due to formation of precipitates in the pores
(Tinjum et al., 2008). One of the main issues with COPR reduction is ensuring that the
reductant is able to reach Cr(VI) entrained in Cr(VI)-bearing minerals. The addition of
SO42- with the reductant, such as FeSO4 enhances the amount of Cr(VI) reduced through
anion exchange; SO42- is able to displace CrO4
2- in Cr(VI)-bearing minerals (Geelhoed et
al., 2003). Once displaced and leached from COPR, soluble Cr(VI) can be reduced and
once reduced, Cr(III) will precipitate, but also possibly oxidized back to Cr(VI) if
sufficient levels of Mn(III,IV)(hydr)oxides are present (Bartlett and James, 1979).
Hexavalent Chromium
Remediation-by-reduction strategies in soils aim to reduce Cr(VI) to Cr(III),which
can be done either in situ with the soil or ex situ (James, 1996). This dissertation will

6
focus on the reduction of Cr(VI) by tartaric acid, which is a four-carbon, α-hydroxy
organic acid with two hydroxyl and two carboxylic acid groups:
(COOH(CHOH)2COOH). The oxidation of tartaric acid by Cr(VI) can be negligible if
pH is above 5.0; however, an isopropyl alcohol-water solution will enhance oxidation due
to an interaction between Cr(VI), the organic acid, and the alcohol, resulting in reduction
of Cr(VI) to Cr(III) and co-oxidation of the alcohol to acetone.
Westheimer and Novick (1943) first presented the mechanism for the oxidation of
isopropyl alcohol by chromic acid. Several important concepts needed for understanding
aqueous Cr(VI) solutions and its oxidation of isopropyl alcohol were put forth in this
early paper. First, Westheimer and Novick demonstrated that HCrO4- is more important
in oxidation reactions than Cr2O72- (Westheimer and Novick, 1943). Equation 1
illustrates the equilibrium between Cr2O72- and HCrO4
-; however at high Cr
concentrations and/or low pH values, Cr2O72- increases in importance.
Cr2O72- + H2O ↔ 2HCrO4
- ↔ CrO4- + 2H+ (1)
These authors also showed that as concentrations of HCrO4- were lowered, the
rate constants increased, and that kinetically the rate of isopropyl alcohol oxidation was
pseudo-first order with respect to Cr(VI). The rate constant also increased as the
concentration of isopropyl alcohol increased. An investigation of interferences in the
reaction showed that Fe3+ and Al3+ did not affect the oxidation of the alcohol; however,
Mn2+ added as MnCl2 lowered the rate of oxidation by half (Westheimer and Novick,
1943). In a solution of Cr(VI) and Mn2+, but no isopropyl alcohol, no oxidation of Mn2+
was observed, and so the authors hypothesized that an intermediate Cr(VI)-isopropyl
alcohol compound formed and enhanced the reactivity with Mn2+.

7
Further work by Westheimer and colleagues supported monoisopropyl chromate
as the intermediate species, and proposed that tetravalent chromium Cr(IV) was the
intermediate Cr species produced following the 2-electron transfer from isopropyl alcohol
to Cr(VI) in the oxidation of isopropyl alcohol to acetone (Holloway et al., 1951;
Watanabe and Westheimer, 1949). The authors proposed a monoisopropyl chromate
ester as the activated complex (Figure 1-1). The formation of the ester is necessary for
the electron transfer to occur, but it was determined that it is the decomposition or
cleavage of the ester bond that is the rate-limiting step in
determining the overall rate of oxidation. Kwart and Francis
(1959) working with secondary alcohols further
demonstrated that the ester decomposition step was the rate
limiting step in the reaction.
From these studies, the two electron transfer from isopropyl alcohol to Cr(VI) to
form acetone and Cr(IV) via a monoisopropyl chromate ester is summarized in equations
2 and 3.
CH3CHOHCH3 + H2CrO4- → (CH3)2CHOCrO3H + H2O (2)
(CH3)2CHOCrO3H + OH- → (CH3)2CO + HCrO3- + H2O (3)
The overall oxidation-reduction reaction for Cr(VI) being reduced to Cr(III) is illustrated
in equation 4.
1.5CH3CHOH CH3 + HCrO4- + 2H+ → 1.5CH3COCH3 + Cr(OH)3 + H2O (4)
Rahman and Rocek (1971) used acrylamide as a free-radical scavenger to provide insight
into the reactions that occur in equations 2 and 3 by presenting the following mechanistic
scheme:
Figure 1-1 Monoisopropyl-Cr(VI) ester

8
Cr(VI) + isopropyl alcohol → Cr(IV) + acetone (5)
Cr(IV) + isopropyl alcohol → Cr(III) + ketyl free-radical (6)
Cr(VI) + ketyl free-radical → Cr(V) + acetone (7)
Cr(V) + isopropyl alcohol → Cr(III) + acetone (8)
These authors suggested that the full reduction from Cr(VI) to Cr(III) requires both
transitional oxidation states Cr(V) and Cr(IV) as well as the production of a ketyl free-
radical.
Further work done by Hasan and Rocek (1972) showed an increase in the
oxidation rate with 1x10⁻⁴ to 1.0 M isopropyl alcohol, 4.2x10⁻⁴ to 4.2x10⁻² M H2CrO4,
1.9x10⁻⁵ to 0.2 M oxalic acid, and in up to 0.5 M perchloric acid. The rates ranged from
1.7x10⁻⁴ to 4.8x10⁻² (sec-1), and the reaction (total average reaction time was under 20
mins) increased with increasing oxalic acid concentrations until the reaction became zero
order in oxalic acid. The authors proposed that Cr(VI), isopropyl alcohol, and oxalic acid
formed an intermediate complex that allowed for a three-electron transfer resulting in the
reduction of Cr(VI) to Cr(III) (Hasan and Rocek, 1972). In addition to being the first
work completed with these unique constituents, this is also the first time a three-electron
oxidation step involving Cr(VI) had been proposed.
The mechanistic scheme for the intermediate complex was further described by
Mahapatro et al. (1980) using 2-hydroxy-2-methylbutyric acid and isopropyl alcohol.
The proposed reaction is illustrated in equations 9 - 13:

9
(2-hydroxy-2-methylbutyric acid
(9)
(10)
(11)
CH3CH2C•OHCH3 + Cr(VI) → CH3CH2COHCH3 + Cr(V) (12)
+ Cr(V) → CH3CH2COHCH3 + CO2 + Cr(III) (13)
Equation 9 shows the first step of the mechanism, which is the formation of a
bimolecular cyclic complex between Cr(VI) and the 2-hydroxy-2-methylbutyric acid. In
equation 10, this complex reacts with isopropyl alcohol to form a termolecular complex.
Equation 11 shows the oxidative decomposition of this complex to yield acetone, carbon
HCrO4- H+
(2-hydroxy-2-methylbutyric acid)
(isopropyl alcohol)

10
dioxide, trivalent chromium, and the free radical formed from the partial oxidation of 2-
hydroxy-2-methylbutyric acid. This α-hydroxy free radical reacts with a molecule of
Cr(VI) in equation 12 to form Cr(V), which can react with 2-hydroxy-2-methylbutyric
acid in equation 13 to yield carbon dioxide and trivalent chromium (Hasan and Rocek,
1973a; Mahapatro et al., 1980). At concentrations of 2-hydroxy-2-methylbutyric acid at
0.1 M, Cr(VI) at 5x10⁻⁴M, and isopropyl alcohol at 0.05 M, these authors showed the
reaction rate varied as a function of acidity, ranging from 0.30 sec-1 at 5x10⁻³ M
perchloric acid to 62 sec-1 at 1.9 M perchloric acid.
Other work by Hasan and Rocek (1973b) demonstrated that in addition to 2-
hydroxy-2-methylbutyric acid, this reaction occurs with other α-hydroxy carboxylic
acids, such as maleic, malic, tartaric, and citric acid. Kabir-ud-Din et al. (2002) showed
the reduction of Cr(VI) by tartaric acid in the three-electron transfer pathway, with the
intermediate production of Cr(V) and free radicals. As earlier studies have shown, the
ephemeral Cr(V) species is important as an intermediate Cr species involved in the
oxidation of tartaric acid and of isopropyl alcohol. Sun et al. (2009) demonstrated the
reduction of Cr(VI) in the presence of Fe(III) with tartaric, citric, malic, and n-butyric
acids. The authors showed that the extent of reaction increased as the number of
hydroxyl groups increased, due to the electron withdrawing nature of the hydroxyl group
increasing the tendency of the carboxyl group to leave the molecule in a reductive
decarboxylation step (Houghton, 1979).

11
Chromium Redox in Soils
Soils are a key medium for terrestrial ecosystems, and provide nutrients, water,
and physical space for plants and animals to reside. Microorganisms and macrofauna that
reside in the rhizosphere, or root zone of soils, are diverse and interact with their
environment in dynamic processes that alter that environment both physically and
chemically. The organic and inorganic solid phases of the soil matrix are also chemically
dynamic, and can consist of redox active species, such as Fe(II)/Fe(III)- and Mn(II, III,
IV)(hydr)(oxides), sulfur compounds, nitrogen compounds, soil organic matter, and
organic acids. The interaction of these chemical species with microorganisms, as well as
with each other, often with fluctuations in dissolved O2 concentrations due to the rise and
fall of water tables, can make soil redox processes and Cr redox cycling in soils dynamic
and challenging to study.
Solubility Hexavalent Cr forms tetrahedral, oxo(compounds) in aqueous
solution, whereas Cr(III) forms many stable, amphoteric compounds of which many are
octahedral, kinetically inert complexes (Niki, 1985). Chromium(III), when not
complexed by an organic chelating (or complexing) agent, will form Cr(OH)3 and
precipitate out of solution at approximately pH 5.5 and higher. Equation 14 shows the
formation of the Cr(III) hydroxide with Ksp = 10-12 (mol/L) at pH 7 given (James and
Brose, In press):
Cr(OH)3(S) ↔ Cr3+ + 3OH- (14)
The low Ksp value indicates that the hydroxide will be stable thermodynamically and
precipitate out of solution. In the presence of excess hydroxide ions, the formation of the
hydroxo-chromite ion Cr(OH)4- is possible, and is represented by equation 15.

12
Cr(OH)4- ↔ Cr(OH)3 + OH- (15)
Other precipitated forms for Cr(III) include chromium arsenate (CrAsO4) and chromite
(FeO∙Cr2O3) with Ksp values (pH 7) of 10-10 and 10-20 mol/L, respectively (James and
Brose, In press). Also contributing to solubility is the ability of Cr(III) to form both
organic and inorganic complexes (Cotton and Wilkinson, 1980; James and Bartlett,
1983a; Mandiwana et al., 2007; Puzon et al., 2008). If complexed with organic acids
such as fulvic or citric acid, Cr(III) will remain soluble at pH values up to 6.7 depending
in part on the pKa of the organic acid and the COOH-Cr(III) ratio (James and Bartlett,
1983b). The complexation of Cr(III) with organic ligands allows for organic-Cr(III)
complexes to remain soluble and resistant to biodegradation in soils and natural waters,
because complexed Cr inhibits the ligand serving as a carbon and energy source for
microbial growth (Puzon et al., 2008).
Relative to Cr(III) cationic compounds, Cr(VI) anionic compounds are more
soluble over the pH range of natural environments, i.e. 4.0 to 8.0, leading to a greater
concern about the potential mobility of Cr(VI) in soils and natural waters; however,
chromium (VI) salts, such as PbCrO4 and BaCrO4 with Ksp values (pH 7) of 1.8 x 10⁻⁶
and 1.7x10⁻³ mol/L, respectively, are only sparingly-soluble (James and Brose, In press).
Iron oxides are one of the most common minerals found in soils, with goethite (α-
FeOOH) existing in almost every soil in all climate regimes, with greater concentrations
occurring in wetter and cooler climates (Essington, 2004). Other Fe(III)(hydr)oxides
relevant to the current research are hematite (α-Fe2O3) and ferrihydrite (Fe5HO8•4H2O).
Mn(hydr)oxides in +III or +IV oxidation states are generally microcrystalline,
poorly-ordered (non-stoichiometric), and often occur as coatings on ped faces and pore

13
surfaces as concretions or nodules (Essington, 2004). Because of the paracrystalline
nature of naturally-occurring Mn(III,IV)(hydr)oxides, they are challenging to
characterize, especially in soils. Birnessite is one of the most common soil Mn minerals
and has a mixed +III/IV oxidation state and layered structure that commonly forms
surface coatings on clay and other mineral surfaces (Oze et al., 2007; Sparks, 2003).
Sorption In colloidal environments, such as soils and sediments with clays and
metal (hydr)oxides, sorption processes (cation exchange, precipitation, and surface-
induced hydrolysis) can immobilize cationic metals. Generally, the most important
parameters affecting sorption of metals in soils are other metal hydroxides, clay, organic
matter, oxidation state, concentration, solid-to-solution ratio, contact time, and most
importantly soil pH (Bradl, 2004). There are two main interactions between solute and
solid phases relevant to the current research that can be used to understand metal sorption
in soils. The first are inner-sphere surface complexes between the metal and surface site,
and second are electrostatic interactions, which consist of outer-sphere complexes where
the metal is at a distance from the surface site. The number of surface sites available
imparts cation exchange capacity (CEC) to the soil; the amount of negative charge of a
soil determines CEC and comprises of a constant charge component and a variable
charge (Sparks, 2003). The constant charge is due to isomorphic substitution in
secondary minerals, such as phyllosilicate clay minerals that result in a permanent
negative charge. Variable charge is attributed to the deprotonation and protonation of
functional groups on hydroxide groups on exposed edges of octahedral sheets of clays,
metal (hydr)oxides, silicates coated with metal oxides, and soil organic matter (Sparks,
2003).

14
Although CrO42- and HCrO4
- can adsorb to positively-charged surfaces similarly
to SO42-, the net negative charge of soils relevant to the current research will make
sorption of cations, such as Cr3+ more likely; however, under low pH conditions, some
surfaces sites can be protonated and allow for electrostatic adsorption of HCrO4-. This
sorption may be reversible and will allow anions to again be solubilized, or via
chemisorption, sorbed HCrO4- can potentially be incorporated into the structure of a
mineral surface (James and Bartlett, 1983c). Kantar et al. (2008) demonstrated the
“ligand-like” behavior of Cr(VI) in a soil column study, with maximum sorption of
Cr(VI) at acidic pH values and decreasing rapidly with an increase in pH.
Cr(III) was shown to be rapidly adsorbed by Fe(III) and Mn(III,IV)(hydr)oxides
and clay minerals, with adsorption increasing with increasing pH (Bradl, 2004).
Adsorption of Cr(III) decreased in the presence of competing anions for sorption sites.
Han et al. (2004) demonstrated the importance of contact time in that Cr(III) in
undisturbed and unpolluted soils was strongly bound to solid mineral phases, whereas
Cr(III) in newly contaminated soils was less strongly bound and was more associated
with soil organic matter making this form of Cr(III) potentially more labile.
Oxidation Soluble Cr(III) salts and freshly-precipitated hydroxides oxidize
rapidly to Cr(VI) in the presence of Mn(III,IV)(hydr)oxides in moist soils (Bartlett and
James, 1979). Mn(III,IV)(hydr)oxides, such as birnessite and todorokite have a low point
of zero charge (PZC) in the range of pH 1-2, resulting in their being negatively charged
in near-neutral, natural environments, and capable of attracting cations such as Cr3+ and
CrOH2+ (Kim et al., 2002). Cr(III) oxidation followed a first-order reaction dependent on
Cr(III) concentration with four Mn(III,IV)(hydr)oxides: todorokite, birnessite,

15
lithiophorite, and pyrolusite, with more Cr(III) being oxidized at pH 4 than pH 7 (Kim et
al., 2002).
The enhanced oxidation at lower pH values may be attributed to the proton
consuming nature of Mn(III,IV) reduction and also the decreased solubility of
Cr(III)(hydr)oxides at higher pH values. Additionally, the electron transfer between
Mn(III,IV) surfaces and Cr(III) species was shown to occur rapidly at pH 3, but was
inhibited at higher pH values, possibly due to a change in the charge on the mineral
surface induced by initial Cr(III) concentrations (Fendorf and Zasoski, 1992). Higher
initial Cr(III) concentrations resulting in the surface becoming less negatively charged,
resulted in the Mn(III/IV)(hydr)oxide being less able to adsorb Cr(III) in solution.
Alternately, Negra et al. (2005) demonstrated that the strongest oxidizing forms of Mn
had the greatest Mn(IV)/Mn(III) ratio, and that more Cr(III) oxidation was associated
with higher soil pH due to a greater proportion of Mn being in the +IV oxidation state.
Reduction In aerobic soils, Fe is predominantly immobile and found in the
oxidation state Fe(III) (Lemanceau et al., 2009). In a reducing environment, such as a
flooded soil, Fe(III) can be reduced to Fe(II) and migrate with moving water. The
reduction of Fe(III) to Fe(II) has a standard potential of +0.771 V and is illustrated in
equation 16 (Heusler and Lorenz, 1985).
Fe3+ + e- → Fe2+ (16)
The addition of a reducing agent to a soil with Fe(III) and Cr(VI) may result in the
reduction of Fe(III) to Fe(II), and in Fe(II) reducing Cr(VI) (Yang et al., 2008). Citric
acid was shown to effectively reduce Cr(VI) in the presence of “red soil”, and also in the
presence of Fe(III), which yielded a catalytic effect by being reduced to Fe(II) which then

16
reduced Cr(VI). It was also shown that the extent of reduction decreased as the pH was
raised from 3.3 to 5.1 (Yang et al., 2008).
Hug et al. (1997) demonstrated the complexity involved in the reduction of
Cr(VI) in natural environments having oxalate and Fe(III). A mechanistic kinetic model
was presented to explain both dark and photochemical reactions with oxalate where
superoxide (O2•-), hydroperoxyl radical (HO2), and Fe(II) were formed, which were likely
reductants for intermediate Cr(V) and Cr(IV) species. Following reduction, the main
product formed was a soluble Cr(III)-oxalate compound (Hug et al., 1997). Kantar et al.
(2008) also demonstrated the enhanced reduction of Cr(VI) by Fe(II) in adding the
organic acids galacturonic and glucuronic acids to systems with or without soil. The
reduction of Cr(VI) with these organic acids resulted in a delay in the breakthrough of Cr
in column studies, due to sorption of the newly formed Cr(III) to the soil.
In addition to Fe(II) as a reducing agent in soils, soil organic matter can also
contribute significantly to redox pathways. Generally, soil organic matter can be
considered to consist of humin, humic acids, and fulvic acids (Sparks, 2003). Soil humin
is regarded as the (paracrystalline) organic material that is neither soluble in acid nor
base. Soil humin has several distinct qualities, such as aromatic rings with carboxyl,
hydroxyl, carbonyl, and alkyl groups; significant amounts of C-1 to C-20 alkyl chains;
aromatic rings and alkyl groups with C-to-C bonds; and simple and polymeric
proteinaceous and carbohydrate groups associated along a randomly ordered backbone
(Baldock and Broos, 2012).
Humic and fulvic acids have many of the functional groups that contribute to
many of the chemical characteristics of a soil; these include carboxyl, phenolic, quinone,

17
alcoholic, ketone, amine, and amide groups (Sparks, 2003). Phenolic groups are
important in complexation reactions with metals, and can also be further oxidized to
produce quinones, which are considered to be the major electron donor and acceptor
moieties of humic material (Tan, 2003). Under aerobic conditions, humic acids express
significant reducing capacity, and although Fe(II) bound to humic acids can also
contribute electrons in reduction reactions, relative to humic acids its contribution can be
considered negligible (Peretyazhko and Sposito, 2006).
Thermodynamics
The redox reactions involving Cr(VI) and Cr(III) are not only dependent on pH,
but are also dependent on the pe, or “electron activity”, of the system. Electron activity,
or the potential for the electron to do electrical work, is measured as a voltage, Eh, and is
often expressed in Nernstian form as pe, where pe = Eh (V)/0.059. Although its activity
(related to concentration) is dimensionless due to the electron having negligible mass, it
is analogous to pH as the measure of proton activity (James and Brose, 2012). The large
charge-to-size ratio of the electron, again similar to the proton, (charge-to-size ratio for
H+ is small relative to e-) makes it ephemeral in free form, however, it is a strong
reducing agent with a potential of -2.7 V relative to hydrogen (James and Brose, 2012).
In soils and natural waters, the range for pH is approximately 3 to 12, and -10 to
17 for pe (Stumm and Morgan, 1996). These pe values correspond to Eh values of -591
to 1005 mV, where the more positive a value, the lower the electron activity. In soils, the
higher the Eh value the more the soil can be considered oxic. The pe and pH of a system
can be thought of as being in balance on a see-saw where a rise in one value corresponds
18
to a fall in the other, and vice-versa (James, 1996). One use of pe and pH data is to
represent which species of an element predominates, and is thermodynamically favorable,
at given electron and proton conditions. The pe-pH relationships for different species of
Cr(VI) and Cr(III) are illustrated with a pe-pH diagram, as shown in Figure 1-2.
Cr(VI) and Cr(III) redox reactions in soils and natural waters can also be
predicted using thermodynamic data and reduction half-reactions for Cr, Mn,
anthraquinone-2,6-disulfonate (AQDS), tartaric acid, and citric acid (Table 1-1).
Although the oxidized species of tartaric and citric acids were not indicated in the
reference, standard electron potentials (relative to SHE) were given (Milazzo et al.,
1978). The compound AQDS is a chemical analog for dissolved humic substances in
soils and natural waters (Lovley, 1996). The log K values of these equations can be
compared to predict which species may be oxidizing and which ones may be reducing.
The protonation of the chromate ion is important in considering the
thermodynamics of reduction and oxidation reactions of Cr. Take for example the ΔGr
values for the reduction reactions of HCrO4- and CrO4
2- by tartaric acid. For the reaction
with HCrO4- reduced by tartaric acid, the ΔGr value is -95.3 kJ/eq, whereas for the
reaction involving tartaric acid and CrO42- the ΔGr value is -107.3 kJ/eq. The reduction
of CrO42- by tartaric acid is more favorable than that for HCrO4
-. The standard electron
potentials for these values are determined at pH 0, and referring back to the pe-pH
diagram for Cr(VI) and Cr(III), as pH decreases Cr(VI) reduction may occur at higher Eh
values. Neither the pe-pH diagram nor Table 1-1 allow inference into the rate of

19
Figure 1-2 A pe-pH
diagram for C
r(VI)-C
r(III) redox transitions. Calculations
made w
ith ion activities at 10-4 M
.

20
reduction of Cr(VI), but instead only indicate if a reaction could be thermodynamically
favorable.
Another important soil constituent regarding Cr redox is Mn(III,IV)(hydr)oxides.
The log K value for γ-MnO2 (20.8) is greater than the log K for HCrO4- (18.9) indicating
that the oxidation of Cr(III) to Cr(VI) is thermodynamically favorable (Table 1-1). There
is great uncertainty in the exact composition of Mn(III,IV)(hydr)oxides and due to their
being non-stoichiometric, the thermodynamic predictions towards redox behavior are also
uncertain (James, 2002).
The thermodynamic predictions derived from this table have been explored
experimentally and were found to hold true (Brose, 2008; Brose and James, 2010). In the
Species Equation E0 (V) Log K ΔGr0
(kJ/mol)
A γ-MnOOH γ-MnOOH + e- + 3H+ → Mn2+ + 2H2O 1.50 25.4 -145.0
B CrO42- 1/3CrO4
2- + e- + 5/3H+ → 1/3Cr(OH)3 + 1/3 H2O 1.24 21.0 -119.9
C γ-MnO2 1/2 γ-MnO2 + e- + 2H+ → 1/2Mn2+ + H2O 1.23 20.8 -118.8
D HCrO4- 1/3HCrO4
- + e- + 4/3H+ → 1/3Cr(OH)3 + 1/3 H2O 1.11 18.9 -107.9
E Fe(OH)3 Fe(OH)3 + e- + 3H+ → Fe2+ + 3 H2O 0.93 15.8 -90.1
F AQDS 1/2AQDS + e- + 2H+ → 1/2 AH2DS 0.22 3.9 -22.3
G Lactic acid 1/2 pyruvate + e- + H+ → 1/2 lactate 0.23 3.9 -22.3
H Citric acid Oxidized species not indicated 0.19 3.2 -18.3
I Tartaric acid Oxidized species not indicated 0.13 2.2 -12.6
J CH2O 1/4CO2 + e- + H+ → 1/4 CH2O + 1/4H2O -0.07 -1.9 6.9
Table 1-1 Reduction half reactions for Cr(VI) and other species likely to be present in soils (AQDS= anthraquinone-2,6-hydroxy acid). These reactions can be combined to form redox reactions, many of which are energetically favorable as indicated by negative ∆Gr values. Data from James and Brose, In press; Milazzo et al., 1978;

21
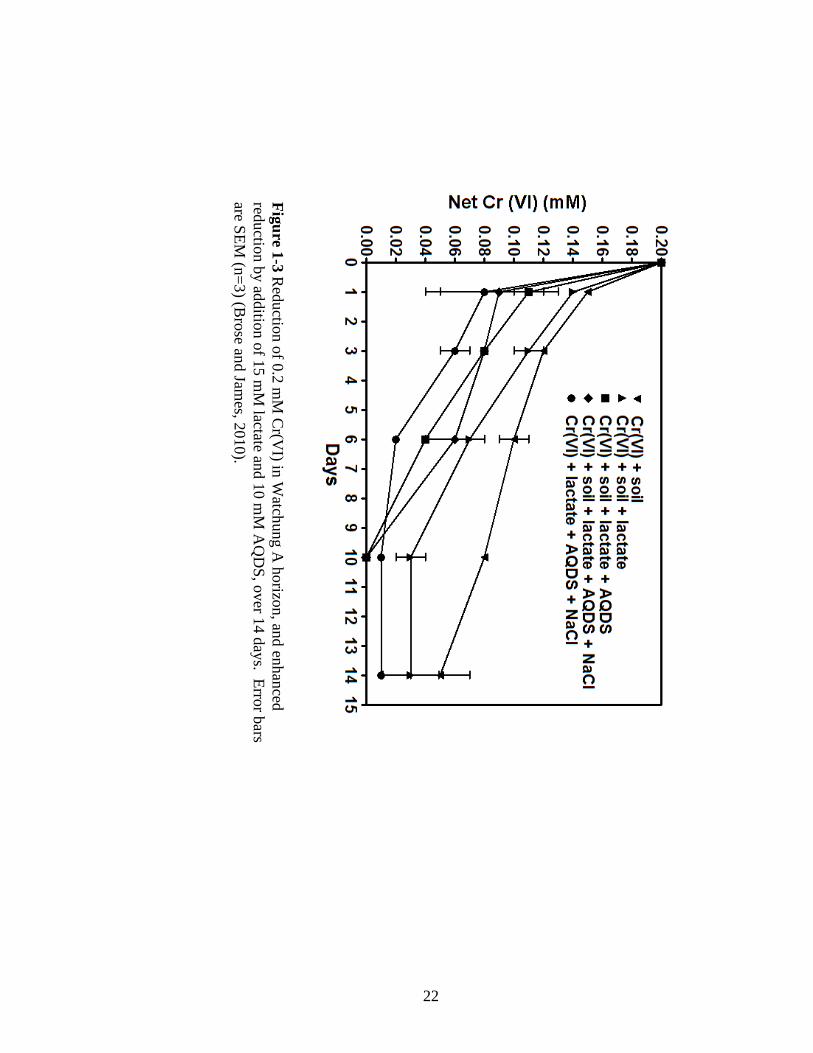
presence of anthraquinone-2,6-disulfonate (AQDS), lactic acid reduced 0.18 mM soluble
Cr(VI) in 14 days with an initial pH value of 5.5, initial Cr concentration of 0.2 mM, and
under aerobic conditions (22 ± 2º C). Using the same initial conditions, but conducted
with a soil sampled from the Ap horizon of a Watchung series mapping unit (Typic
Albaqualf), reduction was complete in 11 days. Both of these results showed more
reduction of Cr(VI) occurred in samples with AQDS than those without, indicating its
contribution to Cr(VI) reduction by acting as an electron shuttle. In the absence of
AQDS and soil, lactic acid did not reduce any Cr(VI) over the course of 14 days (Figure
1-3, Brose and James, 2010). The results are presented in net reduction terms due to the
possible re-oxidation of Cr(III) by Mn(III,IV)(hydr)oxides. In fact, soluble Mn, assumed
to be Mn(II) but measured as total soluble Mn, increased with time during the 14 day
trial. The reducing ability of the lactic acid-AQDS system was non-selective towards
Cr(VI) and also appeared to be reducing Mn(III,IV)(hydr)oxides. The co-reduction of
Mn suggests strong reducing conditions, which inhibited any potential re-oxidation of
freshly-reduced Cr(III) back to Cr(VI).
This interaction among organic acids, Cr(VI), and soils leads to the current work
that investigated the use of tartaric acid and isopropyl alcohol in the reduction of Cr(VI)
in aqueous solutions, in the presence of five Maryland soils, and with chromite ore
processing residue (COPR)-derived Cr(VI) in aqueous solutions and with the same
Maryland soils.
22
Figure 1-3 Reduction of 0.2 m
M C
r(VI) in W
atchung A horizon, and enhanced
reduction by addition of 15 mM
lactate and 10 mM
AQ
DS, over 14 days. Error bars
are SEM (n=3) (B
rose and James, 2010).

23
This work addressed the following research questions:
• How does the rate of reduction vary with the addition of tartaric acid and
isopropyl alcohol to aqueous solutions of Cr(VI) at environmentally relevant pH
values, i.e. 3-6?
• Does the addition of tartaric acid and isopropyl alcohol enhance the effect of
reduction of Cr(VI) in Maryland surface soil samples?
• Can a novel in-situ remediation strategy be employed in which tartaric acid and
isopropyl alcohol can be applied in the reduction of Cr(VI) from chromite ore
processing residue (COPR) and COPR-contaminated soils?
The literature review on the reduction of Cr(VI) with isopropyl alcohol and 2-
hydroxy-2-methylbutric acid or oxalic acid were conducted at concentrations up to 1 M
perchloric acid. The rate of these reactions were in s-1, with the average of the oxalic acid
experiments lasting only 20 minutes. These conditions suit the purpose of that work,
which was to infer mechanisms by investigating the kinetics of the reaction, but using
this chemistry in environmental applications will require knowledge about how these
reactions would “behave” under conditions more like what is found in soils and natural
waters. The first research question is explored in Chapter 2, which explores how the rate
changes under varying conditions of isopropyl alcohol, tartaric acid, Cr(VI), and
importantly, pH.
Reactions in aqueous solutions may not correlate to observations in the field, and
the second research question explores how reduction reactions of Cr(VI) by tartaric acid
and isopropyl alcohol would vary in five Maryland soils. Previous work with a
24
Watchung soil A horizon soil sampled showed that reduction of Cr(VI) by lactic acid was
enhanced in the presence of this soil. The five soil mapping units (Russett-Christiana,
Askecksy, Annapolix, Jackland, and Ingleside) were sampled in order to capture a range
of characteristics, such as texture, percent organic carbon, and levels of Fe(III)- and
Mn(III/IV)(hydr)oxides. Chapter 3 explores how reduction varied with time in the
presence of each of these soils.
The final research question posed addresses the remediation of chromite ore
processing residue (COPR), and applying the chemistry involving the tartaric acid-Cr-
isopropyl alcohol complex to the reduction of COPR-derived Cr(VI). This was the last of
the three research questions explored, and as seen in Chapter 4, included the lessons
learned from the work with the aqueous solutions and soils.
This dissertation research is presented in the next three chapters, with the last
chapter, Chapter 5, providing concluding remarks on the research and implications of the
results. Each of the next three chapters has been written to stand apart from each other
and submittable individually as a journal article manuscript. Chapter 2 will provide a
characterization of the reduction reaction between tartaric acid and Cr(VI) in isopropyl
alcohol, Chapter 3 applies this chemistry to the reduction of Cr(VI) in five Maryland
surface soil samples (see Appendix B for complete sampling details and soil
characterization data), and Chapter 4 applies this chemistry to the reduction of Cr(VI)
from chromite ore processing residue (COPR) in an attempt to develop a novel in-situ
remediation strategy.

25
CHAPTER 2
HEXAVALENT CHROMIUM REDUCTION IN AQUEOUS SOLUTIONS:
THE ROLE OF ISOPROPYL ALCOHOL AND TARTARIC ACID
Introduction
Chromium is a naturally occurring, transition metal found mostly in the trivalent
state; however, concerns regarding the presence of Cr in the environment focus on the
potential adverse health effects of Cr(VI)-contaminated soils, groundwater, and drinking
water supplies. Regulation of Cr is currently based, not on the oxidation state of Cr, but
on total chromium concentration [i.e., the sum of Cr(III) and Cr(VI)]. The U.S.
Environmental Protection Agency’s (USEPA) national standard for total Cr in drinking
water is 100 µg/L (USEPA, 2010). Chromium(VI) is genotoxic in a number of in vitro
and in vivo toxicity assays, and was found to be carcinogenic when administered in
laboratory animals (IARC, 1990; Stout et al., 2009). Thus, reducing Cr(VI) in
contaminated soils and natural waters to Cr(III) is a remediation strategy that would
detoxify the metal.
Soluble α-hydroxy carboxylic acids have been explored as reducing agents in the
treatment of Cr(VI), but alone they demonstrate negligible rates of reduction of Cr(VI).
When dissolved in an isopropyl alcohol-water solution, however, the reduction of Cr(VI)
will be significantly enhanced (Hasan and Rocek, 1973; Mahapatro et al., 1980). α-
hydroxy carboxylic acids in isopropyl alcohol enhance the reduction of Cr(VI) due to the
formation of a single termolecular complex that forms from the esterification of the
alcohol and the α-hydroxy carboxylic acid with Cr (Mahapatro et al., 1980; Hasan and

26
Rocek, 1973; Westheimer and Novick, 1943). The work of these authors demonstrated
an instantaneous three-electron transfer resulting in the oxidation of isopropyl alcohol
and α-hydroxy carboxylic acids. The present work will focus on tartaric acid, a four
carbon α-hydroxy carboxylic acid with two hydroxyl groups and two carboxylic acid
groups. The stoichiometry of the reaction results in two moles Cr(VI) reduced for every
one mole tartaric acid and isopropyl alcohol, as shown in equation 1:
COOH(CHOH) 2COOH + CH3CHOHCH3 + 2HCrO4- → (1)
HCOCOOH + CH3COCH3 + 2CO2 + 2Cr(OH)3 + H2O
The oxidative decomposition of the tartaric acid-Cr-isopropyl alcohol complex ultimately
yields acetone, carbon dioxide, trivalent chromium, and glyoxylic acid from the
decarboxylation of tartaric acid (Kabir-ud-Din et al., 2002).
Although pH was not directly reported, reactions in the literature were carried out
at concentrations of perchloric acid ranging from 0.1 to 0.9 M, corresponding to pH
values < 2.0 (Kabir-ud-Din et al., 2002; Mahapatro et al., 1980). The use of tartaric acid
and isopropyl alcohol could be an effective reductant in the treatment of Cr -
contaminated soils and natural waters; however, there currently are no data for this
reaction at conditions more relevant to environmental applications, i.e., in the pH range
of 3 to 6. The current work investigates the variation in the rate of the reaction with
variations in the concentrations of tartaric acid, isopropyl alcohol, Cr(VI) concentrations,
and acidity in aqueous solutions. Thermodynamic inferences are drawn from oxidation-
Tartaric acid Isopropyl alcohol
Glyoxylic acid Acetone

27
reduction potential (ORP) measurements, and the application of this reaction to the
treatment of Cr(VI) in soils and aqueous solutions is discussed.
Methods
Hexavalent chromium stock solutions at 1000 mg Cr(VI)/L were prepared from
DILUT-IT® Analytical Conc. Std, 1g Cr6+ (J.T. Baker, Inc.) or from reagent grade
K2CrO4 (J.T. Baker, Inc.) and stored at room temperature (22 ± 2º C). Concentrations of
2 mM (104 mg/L) Cr(VI) were used to represent drainage water or groundwater
concentrations subjacent to chromite ore processing residue (COPR) -enriched soils.
Chromium(VI) concentrations in such soil-water systems have been reported up 58 mM
(3,000 mg/L) (Yalcin and Unlu, 2006). Thus, 2 mM would be a low-to-medium
concentration representing Cr(VI) solutions leached from such soil-water systems.
Isopropyl alcohol was reagent grade (99.9% purity) and stored at room
temperature (22 ± 2º C). Tartaric acid (J.T. Baker, Inc.) solutions were made fresh at the
start of each experimental setup from reagent grade solids. All sample solutions included
0.01 M NaNO3 as a background electrolyte to control for ionic strength, and sample
solution pH was adjusted with µL volumes of reagent grade NaOH (J.T. Baker) or HNO3
(J.T. Baker) solutions. The solution pH values 3.0 to 6.0 were chosen as representative of
Mid-Atlantic soil and surface water pH values, and in part, from the reduction of Cr(VI)
occurring most readily at pH 3.3 to 5.1 (Yang et al., 2008). Solution pH was measured
potentiometrically using a glass electrode, and oxidation-reduction potential (ORP) was
measured using a combination platinum electrode with a Ag/AgCl reference electrode.

28
Eh values (mV) were reported relative to the standard hydrogen electrode (SHE), and
used to calculate pe values (pe = Eh/0/059).
The experiments were run under four conditions. The first was with tartaric acid
added to 50 mL Erlenmeyer flasks in concentrations of 0.29, 2.9, 5.8, 12, 23, 29, and 58
mM, corresponding to stoichiometric amounts of 0.5 to 20 times the stoichiometric
amount needed to fully reduce 2 mM (104 mg/L) Cr(VI) in a two-electron transfer
(equation 1). At each level of tartaric acid, isopropyl alcohol was added at 0.29 M and
pH was adjusted to 4.0. The second condition was with isopropyl alcohol added to
separate flasks in concentrations of 0.03, 0.29, 0.58, 1.2, 1.7, 2.4 and 2.9 M,
corresponding to stoichiometric amounts of 5 to 500 times the amount needed for full
reduction of 2 mM Cr(VI) in an two-electron transfer to Cr (equation 1). At each level of
isopropyl alcohol, tartaric acid was added at 23 mM and pH adjusted to 4.0. The third
condition included 2 mM Cr(VI), 23 mM tartaric acid, and 0.29 M isopropyl alcohol at
initial pH values of 3.0, 4.0, 5.0, and 6.0. The fourth condition included initial
concentrations of 0.2, 0.5, 1.0, 1.5, and 2.0 mM Cr(VI) with 23 mM tartaric acid, 0.29 M
isopropyl alcohol, and adjusted to pH 4.0.
All samples had 0.01 M NaNO3 as a background electrolyte and were brought to
initial pH values of 3.0, 4.0, 5.0 or 6.0 with HNO3 or NaOH. After all reagents except Cr
were added to the flask, 2.6 mL Cr(VI) stock solution was added to initiate the reaction,
which also brought the total volume to 25 mL. Flasks were capped with foam plugs, and
shaken at 100 cycles min-1 on an orbital shaker. Samples were taken at 2, 4, 8, 24, and 48
h, and then ongoing every 24 h until 240 h (10 d) for increasing isopropyl alcohol
concentrations, 312 h (13 d) for increasing pH and initial Cr(VI) samples, and 336 h (14

29
d) for samples with increasing tartaric acid concentrations. Sampling times up to 336 h
(14 d) were allowed in order to allow at least one of the treatments in each setup to fully
reduce Cr(VI).
At each sampling time, a 0.25 mL aliquot was removed from the flask, diluted to
10 mL with distilled water, and analyzed for Cr(VI) using a modified diphenylcarbazide
(DPC) method that combines an acidification step (pH 1.5-2) with the reduction reaction
between DPC and Cr(VI). In this method, the rapid reduction of Cr(VI) by DPC under
acidic conditions is coupled simultaneously with the immediate complexation of newly-
reduced, unhydrated Cr3+ cations by the oxidized form of DPC, diphenylcarbazone
(Bartlett and James, 1979). This reduces the likelihood that any organic C in the sample
will reduce Cr(VI) during analysis.
Results and Discussion
The reduction of Cr(VI) was examined by conducting the reaction with one of the
reagents (tartaric acid or isopropyl alcohol) in excess of the other at pH 4.0 (Figures 2-1A
and 2-2A). The reaction was also conducted with increasing pH from 3.0 to 6.0, while
tartaric acid and isopropyl alcohol were held constant (Figure 2-3A), and lastly the
reaction was conducted with increasing initial Cr(VI) concentrations at pH 4 with tartaric
acid and isopropyl alcohol concentrations constant (Figure 2-4A). The data from these
varying conditions provide insight into whether tartaric acid or isopropyl alcohol is the
limiting reagent, and into the sensitivity of the reaction to changes in pH and initial
Cr(VI) concentration. These data showed that reduction of 2.0 mM Cr(VI) was complete
within 48 h in samples that had 1.7 M or higher isopropyl alcohol concentrations in 23

30
FIGU
RE
2-1 (A) R
eduction of 2.0 mM
soluble Cr(V
I) at pH 4.0 in 23 m
M tartaric acid and increasing
concentration of isopropyl alcohol, from 0.03 to 2.9 M
(5x to 500x stoichiometric ratio). N
o data points fall in the approxim
ately 20 h break in x-axis. Error bars are SEM (n=3).
A

31
A
FIGU
RE
2-2 (A) R
eduction of 2.0 mM
soluble Cr(V
I) at pH 4.0 in 0.29 M
(2.2% v/v) isopropyl alcohol and increasing
concentrations of tartaric acid from 0.29 to 58 m
M (0.5x to 20x the stoichiom
etric ratio). Error bars are SEM (n=3).
A

32
FIGU
RE
2-3 (A) R
eduction of 2 mM
soluble Cr(V
I) in 23 mM
tartaric acid and 0.29 M (2.2%
) isopropyl alcohol with
increasing initial pH from
3.0 to 6.0 (final pH values labeled on graph). Error bars are SEM
(n=3).
A

33
FIGU
RE
2-4 (A) R
eduction of 0.2, 0.5, 1.0, 1.5, and 2.0 mM
soluble Cr(V
I) in 23 mM
tartaric acid and 0.29 M
(2.2% v/v) isopropyl alcohol. Error bars are SEM
(n=3).
A

34
mM tartaric acid (Figure 2-1A), or with 58 mM tartaric acid in 0.29 M isopropyl alcohol
(Figure 2-2A).
Reduction was greatest at pH 3.0, having reduced 2.0 mM Cr(VI) within 48 h;
however, at pH 6.0 only 0.3 mM Cr(VI) (15%) was reduced at 312 h (13 d) (Figure 2-
3A). For samples ranging in tartaric acid concentrations, 23 mM tartaric acid reduced
1.87 mM (93%) Cr(VI) and 0.29 mM tartaric acid reduced 0.6 mM Cr(VI) (29%). All
but the two lowest levels of isopropyl alcohol fully reduced Cr(VI) within 192 h (8 d),
although the sample at 0.03 M isopropyl reduced 1.85 mM (93%) Cr(VI) at 240 h (10 d).
The rate constants of these reactions under each of the four conditions (increasing
alcohol, tartaric acid, pH, or initial Cr concentration), were taken as the slopes of linear
regression best fit lines on first-order rate plots – natural log of Cr(VI) concentrations
over initial concentrations (ln C/Co) plotted as a function of time. Regression lines for
zero-order and second-order rate plots were also determined, but statistically fit less well
than regressions with first-order plots.
The negative first-order rate constants (-k) for each condition were plotted as a
function of the change in constituent of that condition: increasing isopropyl alcohol
(Figure 2-1B), tartaric acid (Figure 2-2B), pH (Figure 2-3B), and initial Cr concentration
(Figure 2-4B). The rate constants increased linearly with increasing isopropyl
concentration, but the rate constant increased exponentially with increasing tartaric acid
concentration and decreased exponentially with increasing pH. There is a greater
sensitivity of the reaction to tartaric acid concentrations and changes in pH then with
isopropyl alcohol. The slope of the line for the linear regression of the rate constant on

35
FIGU
RE
2-1 (B) First-order rate constants (h
-1) as a function of isopropyl concentration for data in (A).
B

36
FIGU
RE
2-2 (B) First-order rate constants as a function of tartaric acid concentration from
data in (A).
B

37
FIGU
RE
2-3 (B) First-order rate constants as a function of pH
from data in (A
) with increasing pH
.
B

38
FIGU
RE
2-4 (B) First-order rate constants as a function of initial soluble C
r(VI) concentration from
data in (A
). The slope of the regression line is not significantly different than zero (p=0.22), indicating that there is no effect of initial concentrations on the rate coefficient.
B

39
initial concentrations of Cr(VI) was not significantly different than zero (p=0.22), thus
indicating that there is no change in the rate constant regardless of initial Cr(VI)
concentration.
Because of the ability for tartaric acid to buffer pH due to the presence of two
carboxylic acid groups (pKa1=2.9, pKa2=4.4), the pH of the samples remained close to
4.0 over the approximately 12-14 d sampling period, with some drifting upwards by 0.1
to 0.2 units. Overall, there is a correspondence of decreasing pe values as Cr(VI) was
reduced, with initial pe values at approximately 11 to 12 and dropping to 8 to 9 (Figures
2-5A and B). For samples with 1.2 M isopropyl alcohol or higher in 23 mM tartaric acid,
pe values initially dropped to approximately 8; however, for lower alcohol
concentrations, pe values increased and then drifted back to approximately 11 (Figure 2-
5). Higher tartaric acid concentrations did not necessarily result in low pe values, as 0.29
mM tartaric acid had the lowest pe value at 8.5 yet 5.8 mM had the highest pe value at 11
with the remaining concentrations falling in between these two points (Figure 2-5).
These data indicate that initially the presence of tartaric acid, more so than
isopropyl alcohol, increased solution pe, but with time, the system became more reducing
as indicated by the drop in pe values. The time at which the curves of these pe values
leveled off corresponded with the approximate time that full reduction of Cr(VI) was
reached in those samples. Thermodynamically, when these values are compared with a
pe-pH diagram, it would be expected that the reduction of Cr(VI) would occur under
these conditions since they fall below the Cr(VI)-Cr(III) line (Figure 2-6). However, the
extent of reduction would be expected to decrease or not occur when conditions are in the
region of the box shown in Figure 2-6 that extends above the solid Cr(VI)-Cr(III) line.

40
FIGU
RE
2-5 (A) D
ecrease in pe from reduction of 2.0 m
M soluble C
r(VI) in 23 m
M tartaric acid, increasing
isopropyl alcohol, and pH 4. Isopropyl alcohol ranges from
0.03 to 2.9 M, w
hich is 5-500x stoichiometric ratio
for full reduction Cr(V
I). Error bars are SEM (n=3).
A
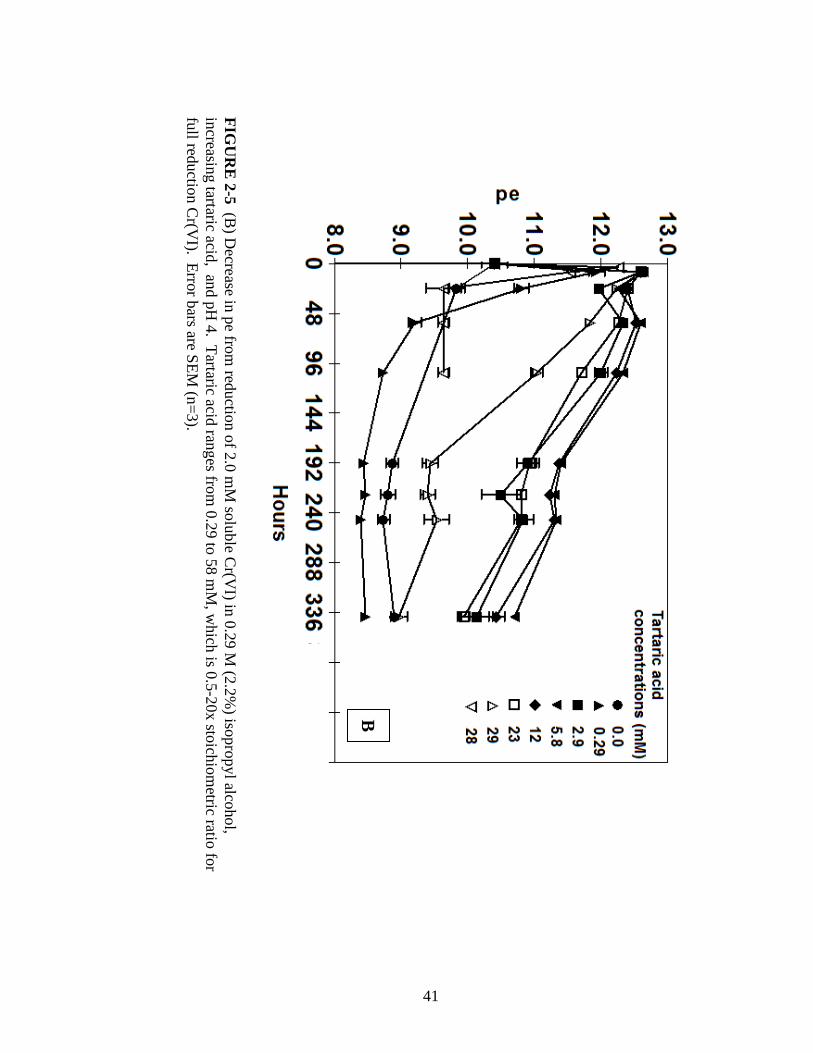
41
FIGU
RE
2-5 (B) D
ecrease in pe from reduction of 2.0 m
M soluble C
r(VI) in 0.29 M
(2.2%) isopropyl alcohol,
increasing tartaric acid, and pH 4. Tartaric acid ranges from
0.29 to 58 mM
, which is 0.5-20x stoichiom
etric ratio for full reduction C
r(VI). Error bars are SEM
(n=3).
B

42
FIGU
RE
2-6 A pe-pH
diagram for C
r(III) and Cr(V
I) showing the region for experim
ental conditions in Figures 2-1 to 2-4 w
ith the shaded box. Thermodynam
ically, Cr(V
I) reduction at initial conditions of 2 mM
C
r(VI) w
ould be expected in the region below the solid C
r(VI)-C
r(III) line, whereas reduction at conditions
when C
r(VI) has m
ostly been reduced (10-4 m
M) w
ould occur below the dashed C
r(VI)-C
r(III) line. The cross-hatched area betw
een the lines is a transition zone during experimental conditions.

43
This was demonstrated when the amount of Cr(VI) reduced decreased as pH
increased (Figure 2-3A), with only 0.3 mM (15%) Cr(VI) reduced at pH 6.0 at 312 h.
The solid line on the pe-pH diagram represents the initial 2.0 mM Cr(VI) concentration,
but as reduction occurs with time and Cr(VI) concentrations decrease, the line would shift
lower on the diagram. The dashed line is calculated at concentrations of 10-7 mM Cr(VI),
representing conditions after most of the Cr(VI) was reduced. The cross-hatched area
between the solid and dashed Cr(VI)-Cr(III) line would represent a transition zone during
the experimental period when Cr(VI) concentrations are decreasing. This transition zone
is approximately from pe 11.8 to 12.4, and as pe values of the treatment solutions passed
through this transitional zone, as most did as seen in Figures 2-5A and B, then depending
on the Cr(VI) concentration of the sample, the reduction reaction may be less
thermodynamically favorable until the pe dropped to below 11.8.
The highest rate constants in the present work were for the following three
conditions 1) pH 3, 23 mM tartaric acid, and 0.29 M isopropyl alcohol; 2) pH 4, 23 mM
tartaric acid, and 2.9 M isopropyl alcohol; and 3) pH 4, 58 mM tartaric acid, and 0.29 M
isopropyl alcohol, which corresponded to rates of 0.128, 0.142, and 0.162 h-1,
respectively. Mahapatro et al. (1980) found rates ranging from 504 to 3.5x10³ h-1 ,
corresponding to concentrations of 2-hydroxy-2-methylbutyric acid (HMBA) from 1 to
500 mM in 0.045 M isopropyl alcohol. The reduction of Cr(VI) by HMBA and isopropyl
alcohol have the same stoichiometric relationship as tartaric acid and isopropyl alcohol;
however, these experiments were conducted in 0.5 to 0.02 M perchloric acid, likely
resulting in pH values < 2.0 (pH not reported).

44
Based on the results presented by these authors, and in the present work, the
reduction of Cr(VI) by a tartaric acid and isopropyl alcohol complex at conditions
relevant to Cr-contaminated soils and natural waters will be most dependent on tartaric
acid concentrations, but more importantly, the pH of the system. Although the rates
presented here are much lower than what can be accomplished at a very low pH, these
rates, and the environmentally-relevant pH values at which they were determined,
suggest an application of the tartaric acid and isopropyl alcohol complex in a Cr(VI)
treatment scheme would still result in successful reduction of Cr(VI) to Cr(III).

45
CHAPTER 3
THE ROLE OF TARTARIC ACID, ISOPROPYL ALCOHOL, AND MANGANESE IN THE REDUCTION OF HEXAVALENT CHROMIUM
IN Cr(VI)-CONTAMINATED SOILS
Introduction
Remediation-by-reduction is a soil clean-up strategy that can be used in an
attempt to mitigate the toxic effects of Cr(VI) and to clean up Cr-contaminated sites to
meet regulatory standards and protect human health (James, 1996). Chromium is a
naturally occurring, transition metal, but the potential adverse health effects of Cr(VI) has
led to concern over contaminated soils, groundwater, and drinking water supplies.
Soils naturally contain chemical species capable of carrying out reduction and
oxidation reactions (redox active species), and many capable of reducing Cr(VI) to
Cr(III). For, example quinone and phenol functional groups and humic and fulvic acids
within soil organic matter (James and Bartlett 1983a, Wittbrodt and Palmer 1997,
Nakayasu et al. 1999, Rendina et al. 2011), α-hydroxy carboxylic acids (Deng and Stone
1996, Brose and James 2010, Tian et al. 2010), Fe2+ (Ludwig et al. 2008, Jagupilla et al.
2009, Qafoku et al. 2010), and H2S and HS- (Pettine et al. 1998, Chrysochoou and Ting
2011) have demonstrated the reduction of Cr(VI) to Cr(III). In this sense, soils, as natural
bodies on the landscape, have a tendency towards reducing or detoxifying Cr(VI) to
Cr(III).
Of particular interest is the reduction of Cr(VI) by α-hydroxy carboxylic acids,
such as lactic, tartaric, or citric acid. Although not strong reducing agents on their own,
in the presence of isopropyl alcohol, the ability of these organic acids to reduce Cr(VI) is
enhanced (Hasan and Rocek, 1972, Mahapatro e t al. 1980). The mechanism involved is
A B

46
the esterification of Cr with the α-hydroxy carboxylic acid and with isopropyl alcohol,
forming a termolecular complex that allows for a three-electron transfer to Cr(VI),
reducing it to Cr(III). The oxidation of the alpha-hydroxy carboxylic acid is a
decarboxylation step that releases two electrons with CO2. Tartaric acid has two
carboxylic acid groups and two hydroxyl groups, allowing for two decarboxylation steps
that results in glyoxylic acid (Kabir-ud-Din et al., 2002). The stoichiometry of the
reaction is two moles Cr(VI) reduced for every one mole tartaric acid and isopropyl
alcohol, as shown in equation 1:
COOH(CHOH) 2COOH + CH3CHOHCH3 + 2HCrO4- → (1)
(Tartaric Acid) (Isopropyl Alcohol) HCOCOOH + CH3COCH3 + 2CO2 + 2Cr(OH)3 + H2O
(Glyoxylic Acid) (Acetone)
In the presence of isopropyl alcohol and low pH values, tartaric acid has been
demonstrated to be an effective reducing agent for Cr(VI); however, there has not been
any application of this chemistry to Cr(VI)-contaminated soils and natural waters at
environmentally relevant pH values, i.e., pH 4.0-6.0. The present work investigates the
application of the tartaric acid-Cr-isopropyl alcohol complex to the reduction of Cr(VI) in
five Mid-Atlantic soils sampled from Maryland, USA.
Materials and Methods
Soils Soils samples from Maryland, USA were taken from profiles located in
delineations of five different mapping units as part of a larger sampling scheme to collect
soil profiles for research purposes. The horizons sampled from the profile in the

47
Askecksy soil mapping unit were similar to the Atsion series (sandy, siliceous, mesic,
Aeric Alaquod), the profile from the Russett- Christiana Complex unit was similar to the
Russett series (fine-loamy, mixed, semiactive, mesic Typic Hapludult), the profile from
the Annapolis unit was similar to the Collington series (fine-loamy, mixed, active, mesic
Typic Hapludult), the profile from the Ingleside unit was similar to the Downer series
(coarse-loamy, siliceous, semiactive, mesic Typic Hapludult), and the profile from the
Jackland unit was similar to the Jackland series (fine, smectic, mesic Aquic Hapludalf).
At each location a hole was dug to at least the first B horizon, although many of the pits
extended down to the second B and C horizons, which ranged from 80 to 140 cm in
depth. From each horizon exposed in the profile, approximately 20 L of soil was taken.
The sampling was conducted when soil matric water potentials were
approximately -5 to -10 kPa (field capacity moisture). The soil was brought into the
laboratory, passed through a 4-mm polyethylene sieve, mixed thoroughly by hand, and
stored in the dark at 22 ± 2º C in a plastic bucket lined with 1-mm thick plastic garbage
bags to minimize soil drying while maintaining the aerobic status of the soil.
The Ap or A horizon (surface horizon) of each soil was used, except for the
Atsion soil, a Spodosol, where the E horizon (eluviated horizon) was used instead. This
E horizon was overlain by an O/A horizon, which consisted of partially degraded and
fresh forest litter. Soil characterization data are summarized in Table 3-1 and full
sampling information and characterization data are available in Appendix B.

48
Table 3-1 Characterization data for soils. CBD refers to a citrate-dithionite extraction.
Reagents Hexavalent chromium stock solution at 1000 mg Cr(VI)/L was
prepared from reagent grade K2CrO4 (J.T. Baker, Inc.) and stored at room temperature
(22 ± 2º C). Isopropyl alcohol was reagent grade (99.9% purity) and stored at room
temperature (22 ± 2º C). Tartaric acid (J.T. Baker, Inc.) solution was made fresh at the
start of each experimental setup from reagent grade solids. All sample solutions in all
experiments included a final concentration of 0.01 M NaNO3 as a background electrolyte
to control for ionic strength, and sample solution pH was adjusted with µL volumes of
reagent grade NaOH or HNO3 (J.T. Baker).
Cr(VI) Reduction Treatments The field-moist equivalent of 5.0 g oven-dried
soil (105oC) of each soil was weighed into 50-mL polycarbonate Oak Ridge-type
centrifuge tubes. Tartaric acid salt was dissolved in 5 mM NaOH to approximately pH
4.0. Then to each centrifuge tube with soil, 12 mM tartaric acid, 0.29 M isopropyl
alcohol, and 0.01 M NaNO3 were added. Samples were adjusted to pH 4.0, if necessary,
with µL volumes of NaOH. After all solutions were added, 2.6 mL of the 1,000 mg/L
Cr(VI) stock solution and nanopure water (18 MΩ) was added for a final concentration of
Soil Texture (% sand, silt, clay)
Field pH
Eh (mV)
Organic Carbon (g/kg)
CBD Fe
(g/kg)
CBD Mn
(g/kg)
Russett Sandy loam (58, 37, 5.8) 5.0 577 25 ± 0.1 4.1 ±
0.3 0.3 ± 0.0
Atsion Sandy (94, 5.9, 0.1) 3.5-4.0 524 20 ± 0.4 0.1 ±
0.0 0.0 ± 0.0
Collington Loamy sand (83, 14, 3) 4.0 606 37 ± 0.0 3.0 ±
0.4 0.0 ± 0.0
Jackland Silt loam (35, 57, 8) 6.0 470 9.0 ± 0.1 6.3 ±
0.3 1.0 ± 0.0
Downer Loamy sand (75, 21, 4) 5.5 490 3.1 ± 0.1 1.5 ±
0.4 0.1 ± 0.0

49
2 mM Cr(VI), which initiated the reaction and brought the final volume to 25 mL.
Another set was repeated with all five soils, but with no tartaric acid or isopropyl alcohol
added.
The centrifuge tubes were capped and shaken at 50 cycles min-1 on an orbital
shaker. Destructive sampling was conducted in that at each sampling time, one set of
centrifuge tubes was removed from the shaker and processed. Sampling was done at 2,
24, 51, 75, and 99 h (approx. 4 d). At each time, sample solution pH was measured with
one hour left, at which point 0.25 mL of a 1 M KH2PO4/K2HPO4 buffer solution (pH 7.2)
was added and the centrifuge tubes were re-capped and shaken for the remainder of the
hour. The P buffer displaces exchangeable Cr(VI) from the soil to ensure that any loss of
Cr(VI) can be attributable to reduction processes, and not to sorption to colloidal
surfaces.
Samples were centrifuged (10 minutes, 10,000 x g, 24o C), and 0.25 mL aliquots
of centrifugate were diluted to 10 mL with distilled water and analyzed for Cr(VI) using a
modified diphenylcarbazide (DPC) method that combines an acidification step (pH 1.5-2)
with the reduction reaction between DPC and Cr(VI). In this method, the rapid reduction
of Cr(VI) by DPC under acidic conditions is coupled simultaneously with the immediate
complexation of newly-reduced, unhydrated Cr3+ cations by the oxidized form of DPC,
diphenylcarbazone (Bartlett and James, 1979). Total soluble Cr, Mn, and Fe remaining
in solution were determined by flame atomic absorption spectroscopy. Data were
analyzed and statistical differences reported with analysis of variance or analysis of
covariance using Statistical Analysis Software (SAS) v9.2.

50
Three trials were conducted based on results from the tartaric acid and soil
treatments. The first trial examined was the reduction of Cr(VI) in the five soils with
added Fe3+ and Mn2+ to assess the effect of these metals on the reduction of Cr(VI) by
tartaric acid. Solutions of Fe(NO3)3 and MnCl2 were made from reagent grade solids
(J.T. Baker, Inc.) and added to 50-mL polycarbonate Oak Ridge-type centrifuge tubes
with the field-moist equivalent of 5.0 g oven-dried soil (105oC) of each soil so that final
concentrations of Fe3+ and Mn2+ were 0.2 mM. Then, 2.6 mL of 1,000 mg/L Cr(VI)
stock solution and nanopure water was added for a total volume of 25 mL. The soils
were shaken for 23 h, the P-buffer added and shaken for 1 h, and then 0.25 mL aliquots
of centrifugate were diluted to 10 mL with distilled water and analyzed for Cr(VI) using
the modified DPC method. Total soluble Cr, Fe, and Mn were determined by flame
atomic absorption.
The second trial examined was with a synthetic Mn oxide-coated sand to evaluate
possible reductive dissolution of Mn(III,IV)(hydr)oxides by tartaric acid. The synthetic
Mn-oxide coated sand was prepared by using a wet oxidation procedure modified to
precipitate the colloidal oxide onto a sand surface (Golden et al., 1986). The oxide was
precipitated by adding 78 mL of 0.5 M MnCl2 and 97 mL of 5.5 M NaOH to 500 g of
acid-washed quartz sand in a crystallization dish. The mixture was placed in a drying
oven at 44 °C for 120 h. Sand/salt solution mixtures were stirred periodically to prevent
wicking of salts to the surface of the sand mixture. Prior to oxide synthesis, the quartz
sand was acid washed in 1.0 M HNO3 for 24 h. Tartaric acid, at pH 4.0, was added to
centrifuge tubes containing 0, 10, 50 and 100 mg of the Mn-oxide coated sand. Then, 2.6
mL of 1,000 mg/L Cr(VI) stock solution and nanopure water was added for a total

51
volume of 25 mL, and shaken for 48 h. Samples were centrifuged (10 minutes, 10,000 x
g, 24o C), and 0.25 mL aliquots of centrifugate was diluted to 10 mL with distilled water
and analyzed for Cr(VI) using the modified DPC method. Total soluble Cr and Mn were
determined by flame atomic absorption.
The third trial was the reduction of Cr(VI) by tartaric acid at pH 4.0 in aqueous
solutions in the presence of Al3+, Cr3+, Ca2+, Zn2+, and Cu2+. These metals represent
trivalent and divalent metals found in soils, and were tested to see if they had an effect on
the reduction of Cr(VI) by tartaric acid. Solutions for all metals were made from reagent
grade solids to a concentration of 0.5 mM in 50 mL Erlenmeyer flasks. The samples
were adjusted to pH 4.0, and 2.6 mL Cr(VI) stock solution and nanopure water was added
to 50 mL Erlenmeyer flasks for a total volume of 25 mL. The samples were shaken for
144 h, and 0.25 mL aliquots of sample were diluted to 10 mL with distilled water and
analyzed for Cr(VI) using the modified DPC method.
Results and Discussion
The control treatment (no soil) reduced 0.37 mM (19%) of the Cr(VI) in 99 h.
This amount of Cr(VI) reduction was enhanced by addition of the soil samples, which
ranged from 0.87 mM (44%) in the Atsion soil to 1.97 mM (99%) with the Russett soil
(Figure 3-1A). The Atsion and Downer soils were significantly different from the no soil
treatment (p < 0.05), but not from each other. Russett significantly reduced more Cr(VI)
than Jackland, which reduced more than Collington. With no tartaric acid added, the
Russett soil reduced 0.47 mM (25%) of the Cr(VI) at 99 h. The Collington reduced

52
Figure 3-1 (A) R
eduction of 2 mM
soluble Cr(V
I) by 12 mM
tartaric acid and 0.29 M isopropyl alcohol
(2% v/v) at pH
4 in the presence of five Maryland soils and one treatm
ent without soil. W
ith no tartaric acid or isopropyl alcohol added, the five soils (in sam
e order presented in graph legend) reduced 0.47, 0.51, 0.77, 0.63, and 0.34 m
M C
r(VI), respectively, after 99 h. Error bars are SEM
(n=3).
A

53
the most Cr(VI) in the absence of tartaric acid and isopropyl alcohol at 0.77 mM (39%).
The addition of tartaric acid and isopropyl alcohol enhanced the reduction of Cr(VI) over
that which would occur with just the soil sample.
First-order rate constants were determined by fitting a linear regression through
the natural log of the Cr(VI) concentrations over initial concentrations (C/Co) against
time for each soil with tartaric acid and isopropyl alcohol added. To determine if the
differences between the slopes of these regression lines were statistically significant,
analysis of covariance was conducted using SAS v9.2 with estimate statements to
determine differences between each slope (Figure 3-1B).
Correspondingly, the differences in slopes corroborated the analysis of variance
for differences between the soil effects at 99h, and so half-lives for Cr(VI) reduction from
each of these soil treatments were calculated from the first-order rate constant (t1/2 =
0.693/k). The following ranking of the soils from most reducing to least with their half-
lives resulted: Russett (18.7 h) > Jackland (34.1 h) > Collington (46.8 h) > Atsion (126
h) = Downer (140 h) > No Soil (371 h). As seen by the half-lives, the rate of reduction of
Cr(VI) in the Russett soil sample was 20 times the rate of the sample with no soil.
If the pH of an aqueous solution containing tartaric acid, isopropyl alcohol, and
Cr(VI) but with no soil is raised from 4.0 to 5.0, reduction is inhibited and the amount of
Cr(VI) reduced would be negligible. In the present soil systems, however, reduction was
not inhibited when pH reached as high as 5.3 in the Jackland soil sample (Figure 3-2).
The pH of the Russett soil sample rose to 5.0, and yet 99% of the Cr(VI) was reduced by
99 h. Although the rate of reduction of Cr(VI) by the tartaric acid-Cr-isopropyl alcohol

54
Figure 3-1 (B) N
atural log of soluble Cr(V
I) concentrations over initial concentrations (C/C
o ) fit with linear
regressions to determine first-order rate constants as slope of regression line. B

55
Figure 3-2 Change in pH
with reduction of 2 m
M C
r(VI) by 12 m
M tartaric acid and 0.29 M
isopropyl alcohol (2%
v/v) at pH 4 in the presence of five M
aryland soils and a no soil treatment. Error bars are SEM
(n=3).

56
complex is fastest at low pH values, the reaction continued to proceed in the presence of
the Russett and Jackland soils, even while pH values approached or exceeded 5.0.
This high pH inhibitory effect may have been overcome by Fe2+ or Mn2+
solubilized from Fe(III)- and Mn(III)(IV)hydroxides in the soil samples by addition of the
tartaric acid and isopropyl alcohol (Figure 3-3A and B). The Russett and Jackland
samples had the greatest amount of Mn solubilized with 98 and 90 µM, respectively, at
99 h. The Downer sample had considerably lower soluble Mn at the end of the trial
period with only 14 µM. Soluble Mn from the Atsion and Collington samples were
negligible, each having less than 10 µM. Samples that did not have tartaric acid and
isopropyl alcohol added had lower amounts of soluble Mn from the samples, with the
Russett having the most at 5.7 µM and the Atsion soil having no soluble Mn after 99 h
shaking.
Fe(III)(hydr)oxides were solubilized to an even greater extent, with the Collington
and Russett samples having the most solubilized with 550 and 427 µM, respectively.
Downer had lower soluble Fe with 207 µM. Samples that did not have tartaric acid and
isopropyl alcohol added had lower amounts of soluble Fe from the samples, with
Jackland having the most at 87 µM and the Atsion soil having the least at 7.7 µM. The
solubilization of these metal(hydr)oxides may play a role in the enhanced soil effect and
increase in pH seen in these samples. Equations 2-7 and corresponding log K values
illustrate the thermodynamic potential for the reductive dissolution of soil Fe(III)- and
Mn(III/IV)(hydr)oxides (James and Brose, 2012). The reduction of Cr(VI), for reference,
falls between the Fe and Mn values:

57
Reduction Half Reaction
Fe3+ + e- Fe2+ 13.0 (2)
Log K
FeOOH + e- + 3H+ Fe2+ + 2H2O 13.0 (3)
1/2Fe2O3 + e- + 3H+ Fe2+ + 3/2H2O 13.4 (4)
1/2MnO2 + e- + 2H+ 1/2Mn2+ + H2O 20.8 (5)
ϒ-MnOOH + e- + 3H+ Mn2+ + 2H2O 25.4 (6)
1/3HCrO4- + e- + 4/3H+ 1/3Cr(OH)3 + 1/3H2O 18.9 (7)
These equations show that protons are consumed in the reduction reactions and that the
reduction of Mn(III/IV)(hydr)oxides would be more thermodynamically favorable than
the reduction of Fe(III)(hydr)oxides. Taking equation 6 as an example, if tartaric acid
and isopropyl alcohol reduce ϒ-MnOOH by the same complex as Cr(VI), then the overall
reaction would consume 1.7 mol H+ for every mol Mn(III) reduced (equation 8):
COOH(CHOH) 2COOH + CH3CHOHCH3 + 6ϒ-MnOOH + 10H+ → (8) (Tartaric Acid) (Isopropyl Alcohol) HCOCOOH + CH3COCH3 + 6Mn2+ + 2CO2 + 11 H2O (Glyoxylic Acid) (Acetone)
The Russett soil resulted in 97.6 µM soluble Mn at 99 h, and attributing this reduction to
the reaction in equation 8, as an example, would result in 1.6 x 10⁻¹ mM H+ consumed
from solution. Unbuffered, this level of proton consumption would result in a pH close to
10; however, both tartaric acid and soil organic matter can contribute protons and buffer
against increased alkalinity. This suggests, however, that the increase in pH may be

58
Figure 3-3 (A) Solubilization of M
n(III,IV)(hydr)oxides from
five Maryland soils w
ith reduction of 2 mM
soluble C
r(VI) by 12 m
M tartaric acid and 0.29 M
isopropyl alcohol (2% v/v) at initial pH
4.0. Soil samples w
ith no tartaric acid and isopropyl alcohol solubilized less M
n (in order presented in graph legend) at 5.6, 0.0, 1.2, 1.5, and 1.2 µM,
respectively, at 99 h. Error bars are SEM (n=3).
A
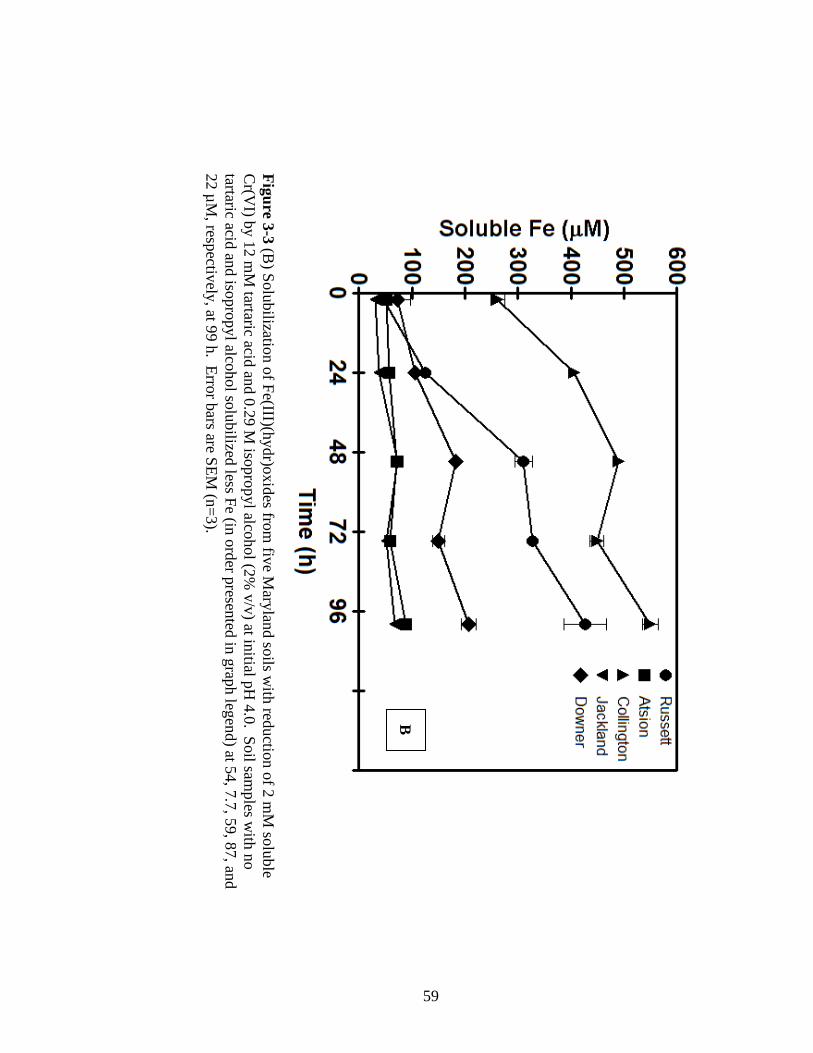
59
Figure 3-3 (B) Solubilization of Fe(III)(hydr)oxides from
five Maryland soils w
ith reduction of 2 mM
soluble C
r(VI) by 12 m
M tartaric acid and 0.29 M
isopropyl alcohol (2% v/v) at initial pH
4.0. Soil samples w
ith no tartaric acid and isopropyl alcohol solubilized less Fe (in order presented in graph legend) at 54, 7.7, 59, 87, and 22 µM
, respectively, at 99 h. Error bars are SEM (n=3).
B

60
attributed to the dissolution of Fe(III)- and Mn(III/IV)(hydr)oxides, and that the resulting
Mn(II) and to some extent, Fe(II), continued to enhance the reduction of Cr(VI).
When 200 µM Fe(III) was added to the five soil samples with 12 mM tartaric
acid, 0.29 M isopropyl alcohol, and at pH 4.0, there was enhanced reduction seen in all
soils, with Russett and Collington soils having the greatest enhanced effect over the soil
effect, reducing an additional 0.57 mM and 0.58 mM Cr(VI), respectively
(Table 3-2). When 200 µM Mn(II) was added to the soils under the same conditions (12
mM tartaric acid, 0.29 M isopropyl alcohol, and at pH 4.0), there was more of an
enhanced reduction for all soils from the Mn treatment than the Fe treatment, with
Russett and Downer reducing an additional 1.03 mM and 1.46 mM Cr(VI), respectively,
more than the soil effect (Table 3-2). The Jackland and Russett soils have naturally
higher levels of Mn(III,IV)(hydr)oxides than the other soils, which is illustrated when 2
mM Cr(III) is added to the soils and Cr(VI) is measured after 24 h shaking (Table 3-2).
The Jackland Ap horizon soil samples oxidized 0.52 mM (27%) Cr(III) to Cr(VI). It does
not appear that the Jackland soil oxidized the added Mn(II), as there was 200 µM soluble
Mn still left in solution (data not shown); however, the Atsion sample had only 26 µM
soluble Mn remaining in solution, suggesting that most of the added Mn oxidized as
Cr(VI) was reduced and precipitated out of solution or else was removed from solution
by sorption processes with the soil.

61
Table 3-2 Soluble Cr(VI) concentrations (mM) after 24 h shaking with no Mn2+ or Fe3+ added, with 0.20 mM Fe3+, 0.20 mM Mn2+, or 2.0 mM Cr3+ (conducted in separate experiment). Asterisks indicate significant treatment effects between the no added Fe3+ or Mn2+, Fe3+, and Mn2+ treatments within each soil (comparisons not made across soils) Errors are SEM (n=3).
Further evidence is seen for the role of Mn(III/IV)(hydr)oxides enhancing the
reduction of Cr(VI) by tartaric acid with the addition of 12 mM tartaric acid to Mn-oxide
coated quartz sand (Figure 3-4). The total amount of Mn on the coated sand, assuming
all added Mn2+ in solution oxidized and precipitated, was 1.8 x 10⁻¹ µmol Mn/mg sand.
The concentration of Cr(VI) decreased as soluble Mn increased linearly as the amount of
sand increased from 10 to 100 mg. With 100 mg sand, 1.24 mM (62%) of the Cr(VI) was
reduced and 41 µM soluble Mn remained in solution at the end of 48 h. If all
Mn(III/IV)(hydr)oxides on 100 mg sand were to be solubilized, 720 µM soluble Mn
would be present; thus, only 5.7% of the total amount of Mn came into solution. Total Cr
remained relatively constant at 2 mM; however, at 100 mg sand there is a slight tapering
Soil No added Mn or Fe
0.20 mM Fe3+
0.20 mM Mn2+
From 2.0 mM Cr3+
None 2.04 ± 0.01* 1.96 ± 0.03* 0.89 ± 0.00** 0.0 ± 0.0
Russett 1.40 ± 0.02* 0.83 ± 0.02** 0.37 ± 0.02*** 0.04 ± 0.01
Atsion 1.84 ± 0.02* 1.68 ± 0.02** 0.97 ± 0.11*** 0.0 ± 0.0
Collington 1.47 ± 0.03* 0.89 ± 0.05** 0.57 ± 0.02*** 0.0 ± 0.0
Jackland 1.46 ± 0.02* 1.34 ± 0.02** 1.19 ± 0.02*** 0.52 ± 0.18
Downer 1.96 ± 0.02* 1.67 ± 0.06** 0.50 ± 0.02*** 0.0 ± 0.0

62
Figure 3-4 Reduction of 2 m
M soluble C
r(VI) by 12 m
M tartaric acid at pH
4.0 added to increasing amounts of
Mn-oxide coated sand. Sam
ples shaken for 24 h. Error bars are SEM (n=3).

63
in total Cr, likely due to the sorption of Cr(VI) or Cr(III)-organic complexes to the Mn-
oxide coated sand.
The enhanced reduction of Cr(VI) by tartaric acid with the addition of Mn(II) was
shown by Kabir-ud-Din et al. (2002) to be due to a complex formed by the esterification
of tartaric acid with Cr(VI) and Mn(II) being bound to the tartaric acid. The bound
Mn(II) donates one electron in an overall three-electron transfer process (equation 9):
COOH(CHOH) 2COOH + 2MnII + 2HCrO4
- + 2H+ → (9) (Tartaric Acid) HCOCOOH + 2MnIII + 2CO2 + 2Cr(OH)3 + H2O (Glyoxylic Acid)
Tartaric acid donates four electrons and goes through two decarboxylation reactions, as it
does when complexed with Cr and isopropyl alcohol, but in this case, two moles of Mn
are required in the reduction of two moles Cr(VI). Manganese(II) was also demonstrated
to be a catalyst in the reduction of Cr(VI) by citric acid (Li et al., 2007).
To assess the effect that other metals, other than Mn(III/IV)(hydr)oxides and
Fe(III)(hydr)oxides, have on the reduction of Cr(VI) by tartaric acid and isopropyl
alcohol, 0.5 mM Al3+, Cr3+, Ca2+, Zn2+, and Cu2+ was added to the tartaric acid and
isopropyl alcohol system. These results showed that Cu2+ was the only other of these
metals to also enhance the reduction of Cr(VI) (Figure 3-5). The addition of Cu2+
reduced 1.1 mM (55%) Cr(VI) in 144 h, which was less effective than Mn2+, which
reduced all 2 mM soluble Cr(VI) in 48 h.
The role of Cu2+ in the enhanced reduction of Cr(VI) is likely a different
mechanism than through an organic-Cu complex. Pettine et al. (1998) showed the
enhanced effects of different metals on Cr(VI) reduction by H2S, including Cu2+. It was

64
Figure 3-5 Reduction of 2 m
M soluble C
r(VI) by 12 m
M tartaric acid in the presence of different m
etals at pH 4.0.
The only metals to enhance reduction w
ere Cu
2+ and Mn
2+. Error bars are SEM (n=3).
65
shown that Cu2+ and CrO42- complexed to form CuCrO4 and that this metal complex
increased the availability of Cr(VI) to receive electrons from H2S. In this same study,
Mn2+ had no effect on enhancing reduction of Cr(VI) by H2S, due to the weak formation
of a Mn-Cr(VI) complex. This sheds light on the reaction in this study, due to the
necessity for Mn2+ and tartaric acid to form a metal-ligand complex in order to be a
reducing agent for Cr(VI). Furthermore, although some Cu2+ would be complexed by
tartaric acid, the oxidation of Cu(II) to Cu(III) does not readily occur under ambient
temperatures and pressure (Cotton and Wilkinson, 1980). Neither Al3+ nor Fe3+, which
are readily complexed by organic ligands, enhanced reduction of Cr(VI). The lack of
enhanced reduction in the presence of these trivalent cations suggest that it is not just the
complexation of tartaric acid with Mn2+ that is important, as it is also the donation of one
electron from Mn2+.
The addition of isopropyl alcohol to tartaric acid enhances the ability of this α-
hydroxy carboxylic acid to reduce Cr(VI), but when applied to soils, this reduction is
further enhanced. Tian et al. (2010) treated soils with hydrogen peroxide to destroy soil
organic matter to demonstrate that the enhanced reduction from soils is related to a
mineral phase in soils and not to reducing functional groups or organic acids in the soil
organic matter, and postulated this enhanced reduction is attributable to the presence of
Mn(III,IV)(hydr)oxides.
The favorable thermodynamic predictions and demonstration of catalytic behavior
of Mn(II) suggests a mechanism where Mn(II) is solubilized by tartaric acid from easily
reducible Mn(III,IV)(hydr)oxides in the soil and the resulting Mn(II) is able to complex
with tartaric acid and Cr(VI) to enhance reduction. Additionally, the effectiveness of

66
Mn(II) in this system appears to be unique to Mn(II); although Cu(II) also enhances
reduction, the effectives of Cu(II) is much less, and by a different mechanism, than that
demonstrated by Mn(II). Complexation of metals to organic reducing agents will result
in stronger acting reducing agents; for example, the reduction half reaction for Fe3+ to
Fe2+ has a pe at pH 7 of 13.0, but when complexed to EDTA, this same reaction has a pe
of 2.0 (James and Brose, 2012). This same reaction when complexed with ferritin, a
ubiquitous, intracellular protein, has a pe of -3.2.
The complexation of Mn2+ with tartaric acid acts similarly in making tartaric acid
a more effective reductant of Cr(VI). In remediation by reduction strategies in soils,
there is concern that the reduction of Cr(VI) may be compromised by the presence of
Mn(III/IV)(hydr)oxides, due to their ability to re-oxidize Cr(III) to Cr(VI). By this
Mn(II)-tartaric acid complex and mechanism, the inherent ability of Mn(II) to enhance
the effectiveness of reduction of Cr(VI) by tartaric acid would be beneficial to the
treatment of Cr(VI)-contaminated soils. As a solution of tartaric acid and isopropyl
alcohol is applied to Cr(VI) contaminated soil, either in-situ or removed for treatment, the
tartaric acid and isopropyl alcohol would reduce Cr(VI) to Cr(III), while at the same time
reduce Mn(III/IV)(hydr)oxides to Mn(II), which will further enhance reduction of Cr(VI).
As seen in this work, the total amount of Cr remained soluble at pH values close
to 5.0, indicating that newly reduced Cr3+ was not precipitating out of solution. The
continued solubility of Cr in solution suggests that tartaric acid is complexing with the
Cr3+ upon reduction, and remaining soluble as an organic-metal complex. Kantar et al.
(2008) showed that new reduced Cr3+ was bound by galacturonic and glucuronic acids
added to soil columns as reducing agents, and that sorption processes delayed

67
breakthrough of the Cr from the columns. This suggests that as tartaric acid reduces
Cr(VI), it is complexing Cr3+ and in the presence of soil, will immobilize the movement
of Cr in the environment, further making the use of tartaric acid and isopropyl alcohol a
potential soil remediation strategy.

68

69
CHAPTER 4
REDUCTION OF HEXAVALENT CHROMIUM FROM CHROMITE ORE PROCESSING RESIDUE (COPR) WITH TARTARIC ACID,
ISOPROPYL ALCOHOL AND DIVALENT MANGANESE
Introduction
Chromite ore processing residue (COPR), the remaining solid waste product from
the processing of ferrochromite (FeO•Cr2O3), contains variable amounts of unreacted ore
and soluble and insoluble forms of Cr(VI), and is a persistent source of Cr(VI)
contamination in notable locations such as Baltimore, Maryland; Hudson County, New
Jersey; and Glasgow, Scotland (Burke et al., 1991; Darrie, 2001; Deakin et al., 2001).
COPR has also been used as fill material for construction purposes because of its
resemblance to a sandy soil; however, residual Cr(VI) can persist as a potential pollutant
of soils, air, and groundwater from this soil-like material. For example, in Hudson
County, New Jersey it was used to fill wetlands and poorly-drained landscapes for use in
industrial activity and development during the twentieth century (James, 1996).
Although COPR will vary in mineralogical and chemical properties from location
to location, there are some commonalities of mineralogical properties important to
understanding the chemical behavior of COPR during reduction processes. For example,
the most abundant metals other than Cr found in COPR samples are Ca, Mg, Fe, and Al
(Chrysochoou et al., 2010). Additionally, Hillier et al. (2003) described three main
categories of mineral compositions in COPR samples. The first is chromite, a relic of the
chromite ore. The second category consists of minerals formed at the high temperatures
during the roasting process, such as brownmillerite and periclase, and the third category
of minerals includes ones that are presumed to have formed after COPR has been

70
deposited and exposed to more natural conditions, such as the leaching of elements with
the influx of water. Although there are many different minerals that can be assigned to
these three categories, there are four common minerals in COPR that have been found to
substitute Cr(VI) for Fe or Al in their structures: brownmillerite (Ca2(Fe,Al)2O5),
ettringite (Ca6Al2(SO4)3(OH)12•26H2O), hydrocalumite (Ca2(Al,Fe)(OH)6(OH) •3H2O),
and hydrogarnet (Ca3(Al,Fe)2(H4O4)3) (Chrysochoou et al., 2010; Hillier et al., 2003).
Additionally, up to 30% of the mineralogical makeup of COPR can be paracrystalline in
structure (Hillier et al., 2003).
Current remediation practices for COPR use either an Fe- or S-based reducing
agent, with the former resulting in concretions or clogging of pores with oxidized Fe
minerals formed as Cr(VI) is reduced to Cr(III), and the latter resulting in delayed
ettringite (Ca6Al2(SO4)3•32H2O) formation, which results in extensive swelling and
buckling of paved surfaces when used as fill material for roads (Dermatas et al., 2006;
Ludwig et al., 2008). In contrast to these reducing agents, this research will investigate
for the first time the potential use of tartaric acid in combination with Mn(II) and
isopropyl alcohol as an effective alternative to Fe- or S-based reducing agents in the
reduction of COPR derived Cr(VI).
The reduction of Cr(VI) by tartaric acid at pH 5.0 or greater is negligible over the
course of several days to weeks; however, in the presence of Mn(II) or isopropyl alcohol,
reduction is enhanced to hours. The enhanced reduction of tartaric acid by the addition of
Mn(II) was shown by Kabir-ud-Din et al. (2002) to be due to a complex formed by an
esterification reaction with tartaric acid and Cr(VI) while Mn(II) is bound to tartaric acid.

71
The bound Mn(II) donates one electron to the single step three-electron transfer to
Cr(VI). The full reaction is shown in equation 1:
COOH(CHOH) 2COOH + 2MnII + 2HCrO4- + 2H+ → (1)
(Tartaric Acid) HCOCOOH + 2MnIII + 2CO2 + 2Cr(OH)3 + H2O (Glyoxylic Acid)
Tartaric acid in isopropyl alcohol will also enhance the reduction of Cr(VI) due to the
formation of a single termolecular complex that forms from the esterification of the
alcohol and organic acid with Cr(VI) (Westheimer and Novick, 1943; Hasan and Rocek,
1973; Mahapatro et al., 1980). An instantaneous three-electron transfer results in the
oxidation of both the alcohol and organic acid, yielding acetone and glyoxylic acid,
respectively from the decarboxylation of tartaric acid (Kabir-ud-Din et al., 2002). The
stoichiometry of the reaction results in two moles Cr(VI) reduced for every one mole
tartaric acid and isopropyl alcohol, as shown in equation 2:
COOH(CHOH) 2COOH + CH3CHOHCH3 + 2HCrO4- → (2)
(Tartaric Acid) (Isopropyl Alcohol)
HCOCOOH + CH3COCH3 + 2CO2 + 2Cr(OH)3 + H2O
(Glyoxylic Acid) (Acetone)
The application of a treatment consisting of isopropyl alcohol and Mn(II) added to
tartaric acid could be an effective remediation-by-reduction strategy, which is a soil
clean-up strategy that can be used in an attempt to mitigate the toxic effects of Cr(VI) and

72
clean up Cr contaminated sites to meet regulatory standards and protect human health
(James, 1996). Neither the tartaric acid-Mn nor the tartaric acid-isopropyl alcohol
complex has been applied as a reduction treatment to COPR or COPR-contaminated
soils, so the current work will investigate the reduction of COPR-derived Cr(VI) by each
of these complexes as well as in combination in order to assess the potential synergistic
effect between the two complexes. These complexes will be assessed in solution as well
as with COPR and in a soil-COPR mixture using five Maryland soils.
Materials and Methods
COPR Chromite ore processing residue (COPR) has been stored in the dark in a
plastic bucket at room temperature (22 ± 2º C). This COPR material comes from Kearny,
NJ at a site called Diamond Shamrock on the Belleville Turnpike, and has approximately
1,200 mg total Cr(VI)/kg COPR, 800 mg soluble Cr(VI)/kg COPR, and is alkaline with a
pH of approximately 8.0.
Soils Soil horizons from Maryland, USA were sampled from profiles located in
delineations of five different mapping units as part of a larger sampling scheme to collect
soil profiles for research purposes. The horizons sampled from the soil profile in the
Askecksy unit was similar to the Atsion series (sandy, siliceous, mesic, Aeric Alaquod),
the profile from the Russett- Christiana Complex unit was similar to the Russett series
(fine-loamy, mixed, semiactive, mesic Typic Hapludult), the profile from the Annapolis
unit was similar to the Collington series (fine-loamy, mixed, active, mesic Typic
Hapludult), the profile from the Ingleside unit was similar to the Downer series (coarse-
loamy, siliceous, semiactive, mesic Typic Hapludult), and the profile sampled from the
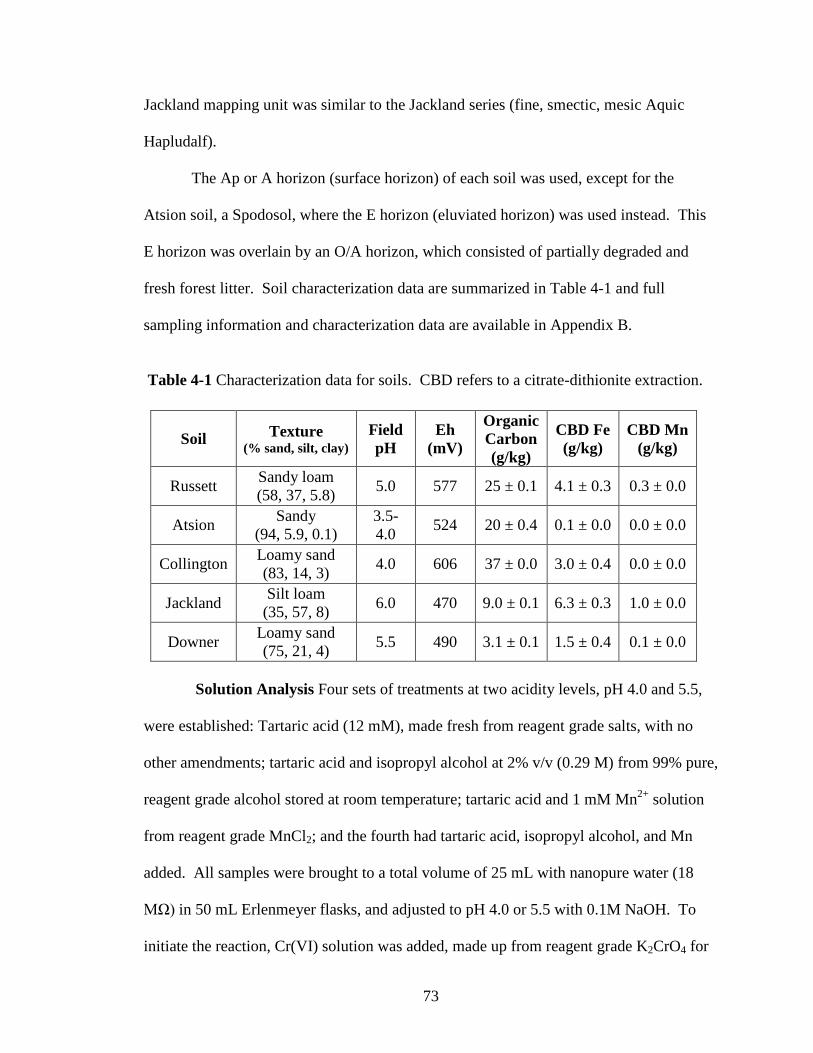
73
Jackland mapping unit was similar to the Jackland series (fine, smectic, mesic Aquic
Hapludalf).
The Ap or A horizon (surface horizon) of each soil was used, except for the
Atsion soil, a Spodosol, where the E horizon (eluviated horizon) was used instead. This
E horizon was overlain by an O/A horizon, which consisted of partially degraded and
fresh forest litter. Soil characterization data are summarized in Table 4-1 and full
sampling information and characterization data are available in Appendix B.
Table 4-1 Characterization data for soils. CBD refers to a citrate-dithionite extraction.
Solution Analysis Four sets of treatments at two acidity levels, pH 4.0 and 5.5,
were established: Tartaric acid (12 mM), made fresh from reagent grade salts, with no
other amendments; tartaric acid and isopropyl alcohol at 2% v/v (0.29 M) from 99% pure,
reagent grade alcohol stored at room temperature; tartaric acid and 1 mM Mn2+ solution
from reagent grade MnCl2; and the fourth had tartaric acid, isopropyl alcohol, and Mn
added. All samples were brought to a total volume of 25 mL with nanopure water (18
MΩ) in 50 mL Erlenmeyer flasks, and adjusted to pH 4.0 or 5.5 with 0.1M NaOH. To
initiate the reaction, Cr(VI) solution was added, made up from reagent grade K2CrO4 for
Soil Texture (% sand, silt, clay)
Field pH
Eh (mV)
Organic Carbon (g/kg)
CBD Fe (g/kg)
CBD Mn (g/kg)
Russett Sandy loam (58, 37, 5.8) 5.0 577 25 ± 0.1 4.1 ± 0.3 0.3 ± 0.0
Atsion Sandy (94, 5.9, 0.1)
3.5-4.0 524 20 ± 0.4 0.1 ± 0.0 0.0 ± 0.0
Collington Loamy sand (83, 14, 3) 4.0 606 37 ± 0.0 3.0 ± 0.4 0.0 ± 0.0
Jackland Silt loam (35, 57, 8) 6.0 470 9.0 ± 0.1 6.3 ± 0.3 1.0 ± 0.0
Downer Loamy sand (75, 21, 4) 5.5 490 3.1 ± 0.1 1.5 ± 0.4 0.1 ± 0.0

74
a final concentration of 1 mM Cr(VI). All sample solutions included 0.01 M NaNO3 as a
background electrolyte to control for ionic strength. Samples were shaken at 50 rpm on
an orbital shaker, and aliquots were taken at 2, 24, 48, 72, and 96 h for Cr(VI) analysis
spectrophotometrically by the DPC method (Bartlett and James, 1979) and total soluble
Cr and Mn analysis on flame atomic adsorption. Solution pH was measured
potentiometrically at each sampling time.
Solution and COPR Analysis Tartaric acid (12 mM) made up in 0.2 M (low
acidity) or 0.5 M (high acidity) HNO3 was added to 50 mL Oak Ridge-type centrifuge
tubes containing 1.63 g COPR material (equivalent to 1 mM soluble Cr(VI)). Three sets
of treatments at each level of acidity (low/high) were established; one set had isopropyl
alcohol at 2% v/v (0.29 M), another had 1 mM Mn(II) solution added, and the third set
had both isopropyl alcohol and Mn added to the samples. All samples were brought to a
total volume of 25 mL with nanopure water. All sample solutions included 0.01 M
NaNO3 as a background electrolyte to control for ionic strength. Sample pH was taken
potentiometrically at 2, 24, 48, 72, and 96 h, and at each sampling time an additional 10
µL concentrated HNO3 was added to the low acidity sample set and 50 µL was added to
the high acidity set in attempt to maintain the different pH levels. Samples were
centrifuged (10 minutes, 10,000 x g, 24o C) and 0.25 mL aliquots of centrifugate was
diluted to 10 mL for Cr(VI) and total soluble Cr and Mn analysis as previously described.
Soil and COPR Analysis The field-moist equivalent of 5.0 g oven-dried soil
(105oC) of each soil was weighed into 50-mL polycarbonate Oak Ridge-type centrifuge
tubes. To simulate Cr-contaminated soils, each sample had 1.63 g COPR added
(equivalent to 1 mM soluble Cr(VI) in the equilibrium solution). The tartaric acid

75
solution was made up in 0.5 M HNO3 and added to three sets of the soil/COPR mixtures.
One set had isopropyl alcohol at 2% v/v (0.29 M), another had 1 mM Mn2+ solution
added, and the third set had both isopropyl alcohol and Mn added to the samples. All
samples were brought to a total volume of 25 mL with nanopure water. All sample
solutions included 0.01 M NaNO3 as a background electrolyte to control for ionic
strength. Samples were shaken for 48 h. Solution pH was measured at one hour
remaining in the sampling time, at which point 0.25 mL of a 1 M KH2PO4/K2HPO4
buffer solution (pH 7.2) was added. The centrifuge tubes were re-capped and shaken for
the remainder of time. The purpose of the P buffer was to displace exchangeable Cr(VI)
from the soil and ensure that any loss of Cr(VI) can be attributable to reduction and
precipitation processes, and not to sorption of Cr(VI) to colloidal surfaces. Samples were
centrifuged (10 minutes, 10,000 x g, 24o C), and 0.25 mL aliquots of centrifugate was
diluted to 10 mL and analyzed for Cr(VI) and total soluble Cr and Mn as described
above. Data were analyzed and statistical differences reported using analysis of variance
or analysis of covariance with Statistical Analysis Software (SAS) v9.2.
USEPA SW-846 Method 3060A Following 48 h shaking for COPR/soils and 96
h for COPR, USEPA SW-846 Method 3060A was performed on all samples. This
method is an alkaline digestion procedure for extracting Cr(VI) from soluble, adsorbed,
and precipitated forms of chromium compounds in soils, sludges, sediments, and similar
waste materials (EPA, 1982). The sample is digested using a 0.28M Na2CO3 /0.5M
NaOH solution and heating at 90-95 °C for 60 minutes to dissolve Cr(VI) and stabilize it
against reduction to Cr(III). Following the extraction, the digestate is diluted to 100 mL
and mixed uniformly. A 25 mL aliquot is taken, centrifuged and diluted, as previously

76
described, and analyzed for Cr(VI) using the DPC method and total Cr using flame
atomic absorption.
Results and Discussion
Solution systems The two samples with 1 mM Cr(VI)-salt solution and tartaric
acid/Mn and tartaric acid/Mn/isopropyl alcohol at pH 4 were most effective, reducing all
Cr(VI) in 48 h (Figure 4-1A, Table 4-2). The corresponding treatments at pH 5.5 only
reduced 0.6 mM Cr(VI) (60%) at 96 h, demonstrating that pH is a major determinant of
the extent of Cr(VI) reduction. The tartaric acid/Mn and tartaric-acid/Mn/isopropyl
alcohol treatments at both pH levels were not significantly different (p-value < 0.05) in
analysis of variance, demonstrating that Mn contributes more to the reduction than the
isopropyl alcohol, and furthermore, that having both Mn and alcohol in solution does not
result in any synergistic effects. The tartaric acid/isopropyl alcohol treatments at pH 4.0
and 5.5 were significantly different from each other, with the samples at pH 4.0 reducing
0.44 mM (44%) of the Cr(VI) and at pH 5.5 reducing only 0.1 mM (10%) (Figure 4-1A,
Table 4-2). The pH for the samples stayed within 0.1 unit of initial pH values, except for
the treatments at pH 5.5 with isopropyl alcohol, which increased to pH 5.8 and 6.0 (Table
4-2).
The first-order rate constants were determined by fitting a linear regression
through the natural log of the Cr(VI) concentrations over initial concentration (C/Co) as a
function of time for each treatment (Figure 4-1B, Table 4-2). Analysis of covariance was

77
Table 4-2 Values from Cr-solution and COPR samples (non-soil) for final pH, final concentration soluble Cr(VI), first-order rate constant where applicable, half-life from rate constant, r2 for first-order regression line, significant differences between first-order slopes at p<0.05, and final concentration soluble Mn. Isopropyl alcohol = IPOH, low acidity = 0.2 M HNO3 and high acidity = 0.5 M HNO3.
Treatment pH at 96 h
Cr(VI) at 96 h (mM)
First- order rate
constant (h-1)
Half-life (h)
r2
Sig. Difference between
Half-lives
Mn at 96 h
(mM)
pH 4 4.1 ± 0.0
0.8 ± 0.08 k=0 N/A 0.26 * 0.0 ±
0.0
pH 5.5 5.5 ± 0.0
1.1 ± 0.05 k=0 N/A 0.02 * 0.0 ±
0.0
pH 5.5/IPOH 5.8 ± 0.0
0.9 ± 0.01 k=0 N/A 0.23 * 0.0 ±
0.0
pH 4/IPOH 4.0 ± 0.1
0.5 ± 0.04 -0.008 88.6 0.79 ** 0.0 ±
0.0
pH 5.5/Mn 5.4 ± 0.1
0.4 ± 0.01 -0.010 69.3 0.92 *** 0.9 ±
0.01
pH 5.5/Mn/IPOH 6.0 ± 0.1
0.4 ± 0.01 -0.010 69.3 0.94 *** 0.9 ±
0.03
pH 4/Mn 4.1 ± 0.0
0.0 ± 0.0 -0.067 10.2 0.97 **** 0.9 ±
0.01
pH 4/Mn/IPOH 4.1 ± 0.0
0.0 ± 0.0 -0.068 10.3 0.95 **** 0.9 ±
0.01
Low acidity/Mn 6.3 ± 0.1
0.9 ± 0.01 k=0 N/A 0.22 † 0.3 ±
0.01
Low acidity/IPOH 6.2 ± 0.1
0.9 ± 0.02 k=0 N/A 0.22 † 0.0 ±
0.0
Low acidity/Mn/IPOH 6.3 ± 0.1
0.9 ± 0.02 -0.001 693 0.46 †† 0.3 ±
0.0
High acidity/IPOH 5.7 ± 0.1
0.7 ± 0.07 -0.005 139 0.86 ††† 0.0 ±
0.0
High acidity/Mn 5.9 ± 0.2
0.7 ± 0.02 N/A N/A 0.61 N/A 0.4 ±
0.03
High acidity/Mn/IPOH 5.8 ± 0.1
0.5 ± 0.02 N/A N/A 0.79 N/A 0.5 ±
0.0

78
Figure 4-1 (A) R
eduction of 1 mM
soluble Cr(V
I) with 12 m
M tartaric acid and 0.29 M
isopropyl alcohol (2%
v/v), 1 mM
Mn
2+, or combination of both at pH
4 or 5.5. Error bars are SEM
(n=3).
A

79
Figure 4-1 (B) N
atural-log of soluble Cr(V
I) concentrations over initial concentrations (C/C
o ) to determ
ine first-order rate constants as slope of the regression lines. Error bars are SEM (n=3).
B

80
used to test significant differences between slopes for each treatment. Half-lives for
Cr(VI) reduction from each of the treatments were calculated from the first-order rate
constants (t1/2 = 0.693/k) (Table 4-2). The Mn and Mn/isopropyl alcohol treatments at
pH 4 had a half-life of 10.4 h, which was the lowest half-life. In comparison, the sample
with isopropyl alcohol at pH 4 had the highest half-life at 89 h. The samples at pH 4 and
5.5 without any amendments and the isopropyl alcohol treatment at pH 5.5 all had slopes
that were not significantly different than zero, and so no rate constants or half-lives were
determined for these samples (Table 4-2).
COPR Systems Sample pH also played a strong role in determining the extent of
Cr(VI) reduced in the samples with COPR-derived Cr(VI) . The pH increased for all
sample treatments in the initial 24 h, but from 24 to 96 h, the pH decreased to
approximately 5.7 for the high acidity sets and 6.2 for the low acidity sets (Figure 4-2,
Table 4-2). These higher pH values resulted in less Cr(VI) being reduced than in the Cr-
salt solution systems. The most Cr(VI) reduced was by the Mn/isopropyl alcohol
treatment at high acidity, which reduced 0.5 mM (50%) of the soluble Cr(VI) at 96 h
(Figure 4-3A, Table 4-2). This same treatment had 0.9 mM Cr(VI) at 24 h, and at 96 h
had 0.9 mM total Cr in solution, indicating that nearly all the soluble fraction of Cr(VI)
comes into solution within the first 24 h. COPR samples with no tartaric acid or
isopropyl alcohol also solubilized 1.1 mM Cr(VI) at 96 h. The three treatment sets at low
acidity were not statistically significant from each other (p-value < 0.05), and reduced
approximately 0.1 mM (10%) of the solubilized Cr(VI) (Figure 4-3A, Table 4-2).

81
Figure 4-2 Change in pH
with reduction of C
OPR
-derived Cr(V
I) at two acidity levels, 0.2 M
(low) or
0.5 M (high) H
NO
3 and with 12 m
M tartaric acid and 0.29 M
isopropyl alcohol (2% v/v), 1 m
M M
n2+, or
combination of both. Error bars are SEM
(n=3).

82
Figure 4-3 (A) R
eduction of CO
PR-derived C
r(VI) at tw
o acidity levels, 0.2 M (low
) or 0.5 M (high) H
NO
3 , and 12 m
M tartaric acid and 0.29 M
isopropyl alcohol (2% v/v), 1 m
M M
n2+, or com
bination of both. Samples w
ith no tartaric acid or isopropyl alcohol solubilized 1.1 m
M C
r(VI) at 96 h. Error bars are SEM
(n=3).
A

83
From 2 to 24 h, Cr(VI) increased for all treatments as Cr(VI) was continually
solubilized. The natural log of the Cr(VI) concentrations over initial concentrations
(C/Co) as a function of time was plotted for all treatments from 24 to 96 h. Only the low
acidity treatments and the high acidity treatment with isopropyl alcohol fit the first-order
rate equation (Figure 4-3B). The data for the high acidity treatments with Mn and
Mn/isopropyl alcohol did not fit first-order or second-order rate equations. For the
samples fitted with first-order rate equations, the low acidity Mn and isopropyl alcohol
treatments did not have a slope that was significantly greater than zero (p<0.05). Only
half-lives for the low acidity treatment with Mn/isopropyl alcohol and the high acidity
treatment with isopropyl alcohol were calculated, resulting in 693 and 139 h, respectively
(Table 4-2). These half-lives demonstrate that although some reduction occurs in the pH
range 5.0 – 6.0, the alkalinity of the system strongly contributes to the rate of Cr(VI)
reduction.
Another contributing factor to the decrease in reduction in the COPR samples
with added Mn2+ was the loss of soluble Mn (Table 4-2). There is a clear distinction
between the samples in the Cr(VI)-salt solution system, which all had between 0.9 and 1
mM soluble Mn after 96 h, and the COPR samples, which were all less than 0.5 mM after
96 h shaking. The oxidation of Mn2+ to MnOOH or MnO2 may have been possible with
the initial, rapid increase in pH in the COPR samples, although also likely is the sorption
to the remaining solid fraction of COPR in suspension.
The alkaline digestion (USEPA SW-846 Method 3060A) of the remaining COPR
demonstrated that there was still Cr(VI) entrained in the solid fraction at 96 h (Figure 4-
4). The remaining solid fraction in the samples ranged from 50-60% of the total amount

84
Figure 4-3 (B) N
atural-log of soluble Cr(V
I) concentration over initial concentration (C/C
o ) to determine first-
order rate constants as slope of the regression lines. High acidity sam
ples with M
n and Mn/IPO
H did not fit first- or
second-order rate equations as indicated by dashed lines. Error bars are SEM (n=3).
B

85
Figure 4-4 Fractions of Cr recovered from
CO
PR sam
ples at two different acidity levels, 0.2 M
or 0.5 M H
NO
3 , and 12 m
M tartaric acid w
ith 0.29 M isopropyl alcohol (2%
v/v), 1 mM
Mn
2+ , or a combination of both. Total fractions
accounted for were the sam
e as unreacted CO
PR. Sam
ples with tartaric acid m
ade up in 0.5 M H
NO
3 reduced a fraction of the C
r(VI), w
hereas those in 0.2 M H
NO
3 did not.

86
of Cr(VI), with only the high acidity treatments having reduced Cr(VI) (Table 4-2). This
demonstrates that the treatments solubilized only 44 to 52% of the total amount of Cr(VI)
in the COPR samples (approximately 1200 mg/kg) and that the high acidity samples were
able to reduce 9.8 to 21% of the total Cr(VI) in the COPR.
COPR and Soils The solubilization of Cr(VI) from COPR and subsequent
reduction was enhanced across all treatments in the presence of the five Maryland soils
(Figure 4-5). The pH range across all soils and all treatments was 3.6 - 4.2, much lower
than the COPR system samples that did not have soil. In the presence of the five
Maryland soils, the pH was maintained, as opposed to the pH increase seen in the COPR
system samples. The buffering of pH in the soils allowed for more Cr(VI) to be
solubilized out of the COPR and subsequently reduced.
Also evident from Figure 4-5 is the precipitation or sorption of Cr(III) from the
system. The addition of P-buffer to displace any sorbed Cr(VI) to soils is effective due to
the charge and structural similarities of H2PO4- to HCrO4
-. The difference between total
soluble Cr from the COPR sample and Cr(VI) recovered from the treatments is attributed
to Cr(III), which would be present as Cr(OH)2+ or CrOH2+ and available for sorption to
negative sites in the soil organic matter or on surfaces of clay and mineral surfaces. Also
possible is the precipitation of Cr(OH)3 from solution, although precipitation is favored at
pH values greater than 5.5. The loss of Mn was also observed, and was greatest for the
Russett and Atison soils (Figure 4-6). All samples had some Mn solubilized from the
soil, as evident by Mn in the isopropyl alcohol treatments without added Mn. For the
Jackland, Collington, and Downer soils, the amount of Mn recovered was approximately
the same as the amount added.

87
There were no significant treatment differences between the isopropyl alcohol,
Mn, and Mn/isopropyl alcohol treatments in the reduction of COPR-derived Cr(VI) in the
presence of the Atsion and Christiana soils (p<0.05); however, for the Collington soil the
Mn treatment was significantly different from the other two treatments. For the Jackland
and Downer soils, the isopropyl alcohol treatment was different than the Mn and
Mn/isopropyl alcohol (significant differences indicated as asterisks in Figure 4-5)
Additionally, that the Mn and Mn/isopropyl alcohol treatments were not significantly
different in the Russett, Atsion, Downer, and Jackland soils, indicating there were no
synergistic effects observed when both Mn and isopropyl alcohol were combined.
The present work showed that the amount of Cr(VI) solubilized out of COPR by
tartaric acid was greatly enhanced in the presence of the five Maryland soils. Tinjum et
al. (2008) used a combination of FeSO4 and H2SO4 solution to leach and reduce Cr(VI)
from COPR and were able to solubilize up to 34% of the initial Cr(VI) due to the acid
dissolution of Cr-minerals and replacement of CrO42- with SO4
2-. The acidification of
COPR for reduction of Cr(VI) is necessary, whether the reductant is S, Fe, or an organic-
based reductant (Jagupilla et al., 2009; Su and Ludwig, 2005). This work demonstrated
that at pH values below 5.0, the addition of Mn2+ to tartaric acid is an effective reductant
of Cr(VI) and that COPR-derived Cr(VI) would need to be acidified in order for this
treatment to be used in a viable remediation strategy. This work also is the first to
demonstrate that when COPR is acidified and tartaric acid and Mn2+ applied in the
presence of soil, this treatment is effective in reducing 84% of the Cr(VI) from a COPR
sample having approximately 1,200 mg total Cr(VI)/kg COPR.

88
Figure 4-5 Fractions of Cr recovered from
CO
PR and soil sam
ples from five M
aryland soils: Russett, A
tsion, Collington,
Jackland, and Dow
ner. Treatments added w
ere 12 mM
tartaric acid with 0.29 M
isopropyl alcohol (2% v/v), 1 m
M M
n2+ , or a
combination of both. C
ross-hatched sorbed/precipitated fractions taken as non-recoverable Cr after com
pletion of Method
3060A. Significant differences in C
r reduction from treatm
ents indicated by asterisk above bars.
Russett
Atsion
C
ollington
Jackland
Dow
ner
* * * * * *
* ** *
* ** ** * ** **

89
Figure 4-6 Total soluble Mn in supernatant follow
ing 48 h shaking with C
OPR
and soil samples from
five M
aryland soil profiles: Russett, A
tsion, Collington, Jackland, and D
owner. Treatm
ents were 12
mM
tartaric acid with 0.29 M
isopropyl alcohol (2% v/v), 1 m
M M
n2+ , or a com
bination of both. Error bars are SEM
(n=3).

90

91
CHPATER 5
Concluding Remarks
Although Cr is a naturally occurring metal, in the oxidation state +(VI) it is a
health concern when present in soils and natural waters due to its demonstrated toxicity
and carcinogenicity. Once Cr(VI) is reduced, organic-Cr(III) complexes can stay in
solution at pH values up to 8.0, but these complexes can be rendered immobile in soils
due to the presence of organic matter, which sorbs the organic component of the
complex. Different reducing agents have been employed in treating COPR-contaminated
soils, but the two most commonly used ones are reduced S and Fe, and although each of
these reducing agents is effective in reducing Cr(VI) to Cr(III), they can be problematic
in the application to a COPR-contaminated soil. When reduced S oxidizes in the
presence of COPR and soils, it forms the mineral ettringite, which entraps water
molecules and swells in volume, a recognized problem when COPR has been used as a
fill material for asphalt paving. The oxidation of Fe2+ to Fe(OH)3 results in the
precipitation of Fe and formation of concretions that inhibit the mixing process, thus
resulting in incomplete treatment of the COPR material.
This PhD dissertation presents an alternative to Fe or S for reduction of Cr(VI) in
aqueous solutions and soils: the use of tartaric acid with isopropyl alcohol in the
remediation of COPR-derived Cr(VI). Tartaric acid, a naturally occurring organic acid
found in grapes, is oxidized to glyoxylic acid, which would be readily decomposable
after treatment of COPR in a soil environment. Likewise, the oxidation of isopropyl
alcohol to acetone at the concentrations used (2.2% v/v) would not pose any health or
environmental risks following treatment. Concentrated isopropyl alcohol is a recognized

92
health and flammability hazard, and the current work has taken care to use concentrations
of 4% alcohol (v/v) or less.
Tartaric acid and isopropyl alcohol each form an ester with Cr(VI), resulting in a
termolecular complex that greatly enhances the reduction over that which would occur
with only tartaric acid. The work in Chapter 2 shows that this reaction is sensitive to
changes in pH, illustrating the nature of pH as a master variable in many redox reactions
that occur in soils and natural waters. The reduction of Cr(VI) was complete in less than
48 h at pH 4.0, but at pH 6.0 less than 10% of the Cr(VI) was reduced. The reaction also
showed sensitivity to the concentration of tartaric acid, in that as the concentration
increased, the rate of the reaction increased exponentially. The drivers of the reaction
then are the concentration of tartaric acid and pH; however, application of this chemistry
to artificially made Cr-contaminated soils demonstrated that the reaction was not as
sensitive to pH in the presence of soils samples taken from five Maryland soil mapping
units: Russett-Christiana Complex, Askecksy, Annapolis, Jackland, and Ingleside.
In Chapter 3, when tartaric acid and isopropyl alcohol were applied in the
reduction of Cr(VI) in the presence of these five soils, there was a significant soil
treatment effect, but also unexpected results regarding pH effects. The greatest amount
of Cr(VI) reduced occurred in the presence of the Russett soil, which also had the second
greatest increase in pH. The initial pH for all samples was 4.0, but by the end of 99 h
(approx. 4 d), the pH increased to 5.0 for Russett and 5.3 for the Jackland soil. Both of
these soils demonstrated that when applied to a soil environment, the pH effect seen in
Chapter 2 is less applicable and that the reduction of Cr(VI) continues at these higher pH
values.
93
One possible mechanism responsible for the pH and enhanced soil effects seen is
attributed to Mn(III/IV)(hydr)oxides and Fe(III)(hydr)oxides in the soil. It is evident that
these metal (hydr)oxides are solubilized from the soil samples, and the reactions for the
reductive dissolution for both Mn(III/IV) and Fe(III) show a consumption of protons.
Thus, the increase in pH seen in the Jackland and Russett soils may be attributed to the
reductive dissolution of these minerals, allowing the reduced forms, Fe2+ and Mn2+, to
contribute to the reduction of Cr(VI), despite this increase in pH.
The addition of Fe(III) to samples containing tartaric acid, isopropyl alcohol, and
the five soils only enhanced reduction to a great extent in the Russett and Collington
soils; however, the addition of Mn(II) significantly enhanced reduction in all the soils,
except the Jackland soil. Furthermore, the addition of tartaric acid and isopropyl alcohol
to Mn-oxide coated sand indicated dissolution of Mn from the sand and the enhanced
reduction of Cr(VI) as the amount of Mn-oxide coated sand increased. This dissertation
contributes to the larger body of literature on Mn and tartaric acid interactions by
showing that the tartaric acid and isopropyl alcohol solution is capable of solubilizing
Mn(III/IV)(hydr)oxides and that the resulting Mn(II) is then available to further enhance
the reduction of Cr(VI).
When applying this chemistry to COPR-derived Cr(VI) in Chapter 4, both the
isopropyl alcohol and Mn complexes were used as reducing agents for Cr(VI). At pH
values less than 5.0, the addition of Mn(II) to tartaric acid was a much more effective
reducing agent than the addition of isopropyl alcohol. At higher pH values, though, this
difference is not as stark. When applied to COPR-soil mixtures, both are effective at
reducing Cr(VI), with the Mn treatments reducing slightly more Cr(VI) for the Downer,

94
Collington, and Jackland soils. Often, there are synergistic effects seen when two
chemicals that share a similar chemical mechanism are present together in a given
reaction. There were no synergistic effects observed, however, when both Mn and
isopropyl alcohol were added to the same sample; however, there were no inhibitory
effects observed either. When Cr(VI) was added to the soils in Chapter 3, there were
significant differences observed in Cr(VI) reduction among the five soils; however, this
soil effect was not as apparent in the COPR-soil mixtures. The increase in pH observed
with COPR samples was buffered in the presence of the five soils, and thus, the pH
remained low enough for the added Mn and isopropyl alcohol treatments to effectively
act on Cr(VI).
This dissertation presents the use of tartaric acid and isopropyl alcohol in the
reduction of Cr(VI) in Cr(VI)-contaminated soils and COPR, and found that in addition
to tartaric acid and isopropyl alcohol being effective at low enough pH, the addition of
Mn(II) to tartaric acid was also effective as a reducing agent. Tartaric acid-isopropyl
alcohol and tartaric acid-Mn complexes are effective reducing agents individually, and
although there is no synergism when used in combination, this work has shown that in the
presence of soil, Cr(VI) reduction is enhanced - even with the Downer soil, which is a
sandy soil, low in organic C, clay, Mn(III/IV)(hydr)oxides, and Fe(III)(hydr)oxides.
Soils, in the reduction of Cr(VI), contribute Mn(II) to the system from reductive
dissolution processes, buffer against changes in pH, and provide surfaces for reactions to
occur. Soils, as a natural body on the landscape, will naturally detoxify Cr(VI) to a
limited extent, and this tendency may allow for either of the tartaric acid-isopropyl

95
alcohol or tartaric acid-Mn complexes to complete the reduction process as a remediation
strategy to clean up these polluted soils.
The experimental designs in Chapters 3 and 4 allowed for a thorough mixing of
the reductants with Cr(VI), soils, and COPR material. Further work is needed to
understand how these batch experiments would compare with leaching studies in order to
fully evaluate the use of the solutions in an in-situ remediation strategy. Although
effective in reducing Cr(VI), leaching a solution of tartaric acid and isopropyl alcohol
through COPR-contaminated soils to depths as far down as 10 or 15 ft may not fully
access all the Cr(VI) for reduction to meet regulatory standards. These batch studies do
demonstrate that if the COPR and soil material were removed and treated in a batch
reactor application, with thorough mixing and acidification, the treatment would be
effective in reducing Cr(VI) to Cr(III) and immobilizing it either through sorption or
precipitation processes. This material could then be filled back into the original location
without having to be moved off-site for treatment.
There were clear differences in the reduction of Cr(VI) in the different soils in
Chapter 3; however, the application of this to the COPR-soil mixtures in Chapter 4
resulted in less clear soil differences. More investigation is needed with these and
additional Maryland soils to better relate Cr redox processes in soils back to inherent
chemical or physical properties of these soils. Soils are a complex media for
experimentation, and other authors have attempted to link Cr redox to soil properties
through various kinetic and statistical studies with mixed results. This dissertation
showed that Mn(III/IV)(hydr)oxides and Fe(III)(hydr)oxides are key contributors to the

96
reduction of Cr(VI), but that pH, a master variable for many redox processes in soils and
natural waters, is also a key driver.
Although this dissertation does not attribute the reduction of Cr(VI) to specific
soil properties or minerals, the proposed reductive dissolution of Fe(III)- and
Mn(III/IV)(hydr)oxides provides insight into natural processes involving naturally
occurring α-hydroxy carboxylic acids and minerals in soils. These interactions between
organic acids and minerals in natural soil bodies could influence mineral formation,
illuviation of reduced Fe and Mn to lower horizons, soil organic matter formation and
decomposition, and accessibility of organic compounds to microbiological communities.
Lastly, this dissertation provides a basis for further investigation of leaching studies with
α-hydroxy carboxylic acids through soils and Cr(VI)-contaminated soils, and for a
possible field-scale application to a COPR-contaminated site.

97
APPENDIX A
FIGU
RE
A-1 Linear regression best fit lines for natural log concentration over initial concentration for reduction
of 2.0 mM
soluble Cr(V
I) at pH 4.0 in 23 m
M tartaric acid and increasing concentration of isopropyl alcohol. Error
bars are SEM (n=3).

98
FIGU
RE
A-2 Linear regression best-fit lines for natural log concentration over initial concentration for reduction
of 2.0 mM
soluble Cr(V
I) at pH 4.0 in 0.29 M
isopropyl alcohol and increasing concentrations of tartaric acid. Error bars are SEM
(n=3).

99
FIGU
RE
A-3 Linear regression best-fit lines for natural log concentration over initial concentration for reduction
of 2.0 mM
soluble Cr(V
I) in 0.29 M isopropyl alcohol and 23 m
M tartaric acid w
ith increasing pH. Error bars are
SEM (n=3).

100
FIGU
RE
A-4 Linear regression best-fit lines for natural log concentration over initial concentration for reduction
of increasing concentrations of soluble Cr(V
I) at pH 4.0 in 0.29 M
isopropyl alcohol and 23 mM
tartaric acid. Error bars are SEM
(n=3).

101
APPENDIX B
OVERVIEW OF SOILS AND SAMPLING
Five soil profiles from Maryland, USA were sampled as part of a larger sampling
scheme by our Soil Chemistry Laboratory to collect soil horizon samples for research and
teaching purposes. The soils were sampled from delineations of five different map units:
Askecksy, Russett- Christiana Complex, Annapolis, Ingleside, and Jackland.. At each
location a hole was dug so that at least the upper B horizon was exposed, although many
of the pits extended down to the lower B and C horizons, which ranged down from 24 to
90 cm in depth. From major horizons exposed in the profile, approximately 20 L of soil
was taken by carefully excavating soil material out of the horizon with a knife and onto
the head of a shovel. The sampling was conducted when soil matric water potentials
were approximately -5 to -10 kPa (field capacity moisture). The soil was brought into the
laboratory, passed through a 4-mm polyethylene sieve, mixed thoroughly by hand, and
stored in the dark at 22 ± 2º C in a plastic bucket lined with 1-mm thick plastic garbage
bags to minimize soil drying while maintaining the aerobic status of the soil.
Soil properties were analyzed for each horizon of the five profiles sampled. The
soils were analyzed for water content by drying at 105º C for 24 h (Gardner, 1986), for
pH by field colorimetric method, and for Eh (lab) potentiometrically with platinum
electrode (relative to standard hydrogen electrode (SHE)). Also performed was particle
size analysis by pipette method to determine textural data for each horizon (Gee and
Bauder, 1986), and LECO analysis for % C, N, and H (Nelson and Sommers, 1996).
Dithionite extractable Fe and Mn were determined from the five soils using a modified
Na-citrate and Na2S204 extraction method (Mehra and Jackson 1960). To the field-moist

102
equivalent of 2.5 g oven-dried soil 20 mL of 0.3 M Na-citrate and 2.5 mL of 1 M
NaHCO3 was added, shaken, and brought to 75-80° C in a water bath. After soil
suspensions reached 75° C for five minutes, 0.5 g Na2S204 was added and suspensions
stirred intermittently for 5 minutes. Then, an additional 0.5 g Na2S204 was added and
stirred intermittently for another 10 minutes. To each sample, 5 mL of a saturated NaCl
solution was added to flocculate the soil. Samples were centrifuged for 10 minutes at
10,000 rpm (~ 10 K RCF) and the supernatant liquid was decanted into a 200 mL flask.
Samples were washed twice with remaining Na-citrate solution and decanted into the
same flask. Solutions were brought to volume and Fe and Mn analyzed by flame AAS.
In addition to soil characterization data, a Soil Quick Redox Assessment was also
conducted. For this, 10.0 mL of 0.2 mM Cr(NO3)3 was added to each soil in 50-mL
centrifuge tubes and also separately, 10.0 mL of 0.2 mM K2CrO4 was added to each soil
in 50-mL centrifuge tubes. This is equivalent to a concentration of 0.1 mM Cr or 5.2
mg/L. The tubes were capped and shaken on a reciprocating shaker at 110 cycles min-1
for 20 ± 1 hours at which point they were opened and 0.2 mL of 1.0 M phosphate buffer
(K2HPO4/KH2PO4 mole ratio = 1; pH 7.2) was added. The tubes were capped and shaken
one additional hour. They were then removed and centrifuged at 10,000 rpm (~ 10 K
RCF) for 15 minutes. Chromium(VI) in the centrifugate was then measured by adding
1.0 mL of diphenylcarbazide (DPC) reagent to 10 mL of a 1-to-5 dilution of each
centrifugate. The values represent “net Cr(VI) reduction” and “net Cr(III) oxidation” by
each soil.
The following descriptions summarize the soil characterization and redox
assessment data for the five soils sampled and used in the current work.
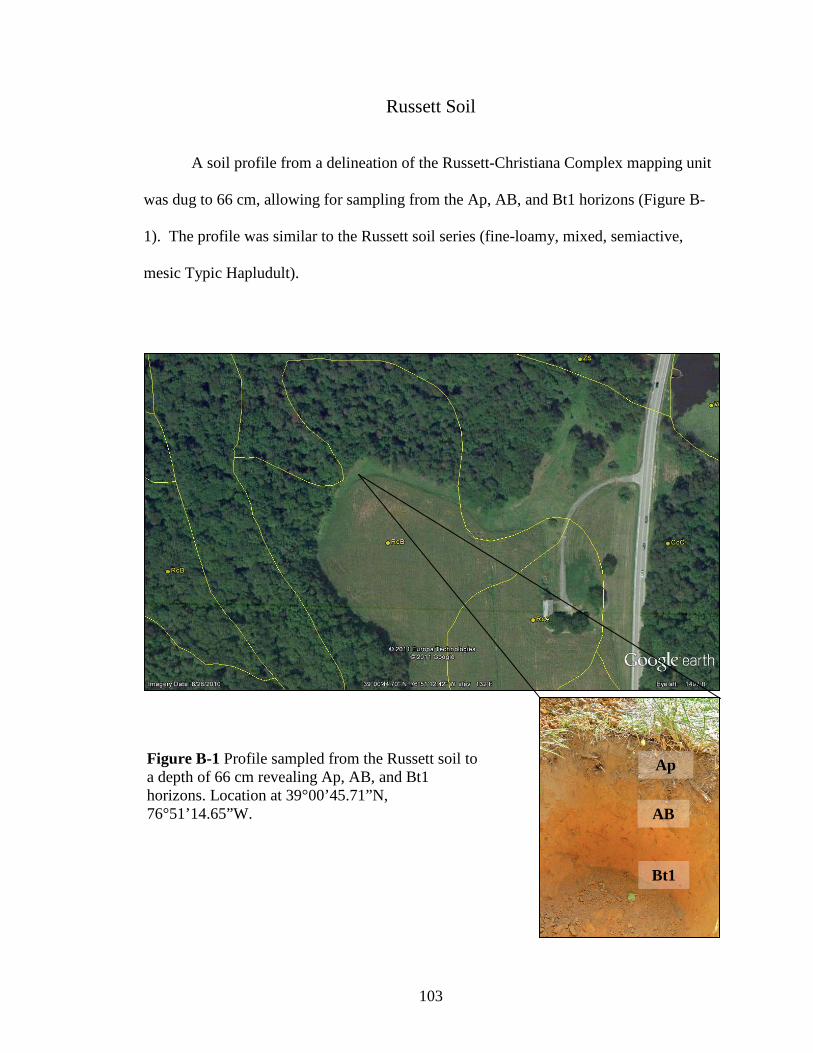
103
Russett Soil
A soil profile from a delineation of the Russett-Christiana Complex mapping unit
was dug to 66 cm, allowing for sampling from the Ap, AB, and Bt1 horizons (Figure B-
1). The profile was similar to the Russett soil series (fine-loamy, mixed, semiactive,
mesic Typic Hapludult).
Figure 3-1 Profile sampled from the Russett-Christiana Complex to a depth of 26 cm revealing Ap, A1, and B horizons. Location at 39°00’44.70”N and 76°51’12.42”W.
Bt1
AB
Ap Figure B-1 Profile sampled from the Russett soil to a depth of 66 cm revealing Ap, AB, and Bt1 horizons. Location at 39°00’45.71”N, 76°51’14.65”W.

104
The horizons sampled from the Russett soil profile were sandy with the Ap and
AB horizons having 58 and 53% sand, respectively and having a sandy loam texture
(Table B-1). The Bt1 horizon had less sand and was a loam in texture. The pH for the
three horizons ranged from 5.0 - 6.0, and were aerobic with Eh values from 507 - 577 mV
relative to standard hydrogen electrode (SHE). The Ap horizon reduced 2.0 mg/L
Cr(VI), which was the most reduced in the quick redox assessment for this profile, and
the AB horizon oxidized 0.91 mg/L, which was the most for this profile.
Table B-1 Soil characterization data for Russett soil profile. CDB refers to the citrate-dithionite extraction and N/A is not analyzed.
Characteristics Soil Horizons
Ap (0-36 cm)
AB (36-66 cm)
Bt1 (>66 cm)
Texture (% sand, silt, clay)
Sandy loam (58, 37, 5)
Sandy loam (53, 38, 9)
Loam (40, 42, 18)
Field pH 5.0 6.0 4.5 – 5.0
Lab Eh (mV) 577 507 540
Organic Carbon by LECO (g/kg soil) 25 ± 0.1 6.3 ± 0.03 1.4 ± 0.01
Cr Oxidized (mg/L) 0.38 ± 0.03 0.91 ± 0.04 0.0 ± 0.02
Cr Reduced (mg/L) 2.0 ± 0.12 0.64 ± 0.02 0.84 ± 0.03
CDB Fe (g/kg) 4.1 ± 0.32 N/A N/A
CDB Mn (g/kg) 0.25 ± 0.02 N/A N/A

105
Downer Soil
A soil profile from a delineation of the Ingleside mapping unit was dug to 61cm,
allowing for sampling from the A, Ap, and BA horizons (Figure B-2). The profile was
similar to the Downer soil series (coarse-loamy, siliceous, semiactive, mesic Typic
Hapludult).
BA
Ap
A
Figure B-2 Profile sampled from the Downer soil to a depth of 24 cm revealing A, Ap, and BA horizons. Location at 38°54’08.11”N, 76°08’11.38”W.
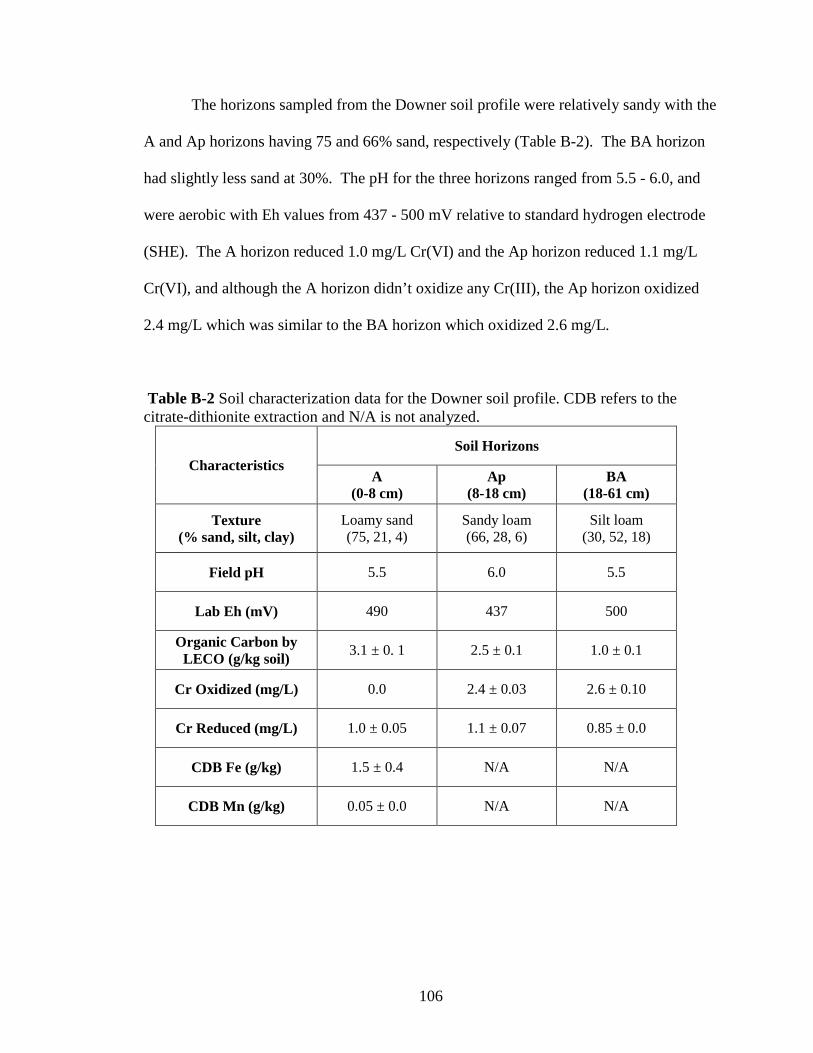
106
The horizons sampled from the Downer soil profile were relatively sandy with the
A and Ap horizons having 75 and 66% sand, respectively (Table B-2). The BA horizon
had slightly less sand at 30%. The pH for the three horizons ranged from 5.5 - 6.0, and
were aerobic with Eh values from 437 - 500 mV relative to standard hydrogen electrode
(SHE). The A horizon reduced 1.0 mg/L Cr(VI) and the Ap horizon reduced 1.1 mg/L
Cr(VI), and although the A horizon didn’t oxidize any Cr(III), the Ap horizon oxidized
2.4 mg/L which was similar to the BA horizon which oxidized 2.6 mg/L.
Table B-2 Soil characterization data for the Downer soil profile. CDB refers to the citrate-dithionite extraction and N/A is not analyzed.
Characteristics Soil Horizons
A (0-8 cm)
Ap (8-18 cm)
BA (18-61 cm)
Texture (% sand, silt, clay)
Loamy sand (75, 21, 4)
Sandy loam (66, 28, 6)
Silt loam (30, 52, 18)
Field pH 5.5 6.0 5.5
Lab Eh (mV) 490 437 500
Organic Carbon by LECO (g/kg soil) 3.1 ± 0. 1 2.5 ± 0.1 1.0 ± 0.1
Cr Oxidized (mg/L) 0.0 2.4 ± 0.03 2.6 ± 0.10
Cr Reduced (mg/L) 1.0 ± 0.05 1.1 ± 0.07 0.85 ± 0.0
CDB Fe (g/kg) 1.5 ± 0.4 N/A N/A
CDB Mn (g/kg) 0.05 ± 0.0 N/A N/A

107
Jackland Soil
A soil profile from a delineation of the Jackland mapping unit was dug to 78 cm,
allowing for sampling from the Ap, Bt, and BC horizons (Figure B-3). The profile was
similar to the Jackland series (fine, smectic, mesic Aquic Hapludalf).
BC
Bt
Ap Figure B-3 Profile sampled from the Jackland soil to a depth of 78 cm revealing Ap, Bt, and BC horizons. Location at 39°09’57.04”N, 77°19’10.50”W.

108
The horizons sampled from the Jackland soil profile were higher in silt and clay
than the other profiles with 8.9, 33, and 13% clay in the Ap, Bt, and BC horizons,
respectively (Table B-3). The pH for the three horizons ranged from 6.0 – 6.5, and were
aerobic with Eh values from 449 - 470 mV relative to standard hydrogen electrode
(SHE). The Ap horizon reduced the most Cr(VI) at 1.0 mg/L; however, the Ap and Bt
horizons oxidized 2.4 and 2.6 mg/L Cr(III), respectively, which is indicative of the higher
concentrations of Mn(III,IV)(hdyr)oxides present relative to the other soils.
Table B-3 Soil characterization data for the Jackland soil profile. CDB refers to the citrate-dithionite extraction and N/A is not analyzed.
Characteristics Soil Horizons
Ap (0-20 cm)
Bt (20-45 cm)
BC (45-78 cm)
Texture (% sand, silt, clay)
Silt loam (35, 57, 8)
Clay loam (30, 37, 33)
Sandy loam (69, 19, 12)
Field pH 6.0 6.0-6.5 5.5-6.5
Lab Eh (mV) 470 460 449
Organic Carbon by LECO (g/kg) 9.0 ± 0.1 4.0 ± 0.1 1.3 ± 0.0
Cr Oxidized (mg/L) 2.4 ± 0.03 2.6 ± 0.10 0.79 ± 0.02
Cr Reduced (mg/L) 1.1 ± 0.07 0.85 ± 0.05 0.49 ± 0.08
CBD Fe (g/kg) 6.3 ± 0.26 N/A N/A
CBD Mn (g/kg) 1.0 ± 0.03 N/A N/A

109
Collington Soil
A soil profile from a delineation of the Annapolis mapping unit was dug to 90 cm,
allowing for sampling from the A, Ap, and Bt horizons (Figure B-4). The profile was
similar to the Collington series (fine-loamy, mixed, active, mesic Typic Hapludult).
The profile sampled from the Collington
Bt
Ap
A Figure B-4 Profile sampled from the Collington soil to a depth of 90 cm revealing A, Ap, and Bt horizons. Location at 38°51’23.51”N, 76°46’53.74”W.

110
The horizons sampled from the Collington soil were relatively high in sand with
83, 76, and 71% sand in the A, Ap, and Bt horizons, respectively (Table B-4). The pH
for the three horizons ranged from 4.0 - 4.5. These horizons had the highest Eh values
ranging from 597 - 607 mV relative to standard hydrogen electrode (SHE). The A
horizon reduced the most Cr(VI) from this profile at 3.9 mg/L; and none of the horizons
oxidized any Cr(III), which is indicative of very low concentrations of
Mn(III,IV)(hdyr)oxides present relative to the other soils.
Table B-4 Soil characterization data for the Collington soil profile. CDB refers to the citrate-dithionite extraction and N/A is not analyzed.
Characteristics Soil Horizons
A (0-10 cm)
Ap (10-24 cm)
Bt (24-90 cm)
Texture (% sand, silt, clay)
Loamy sand (83, 14, 3)
Loamy sand (76, 20, 4)
Sandy clay loam (71, 5, 24)
Field pH 4.0 4.0-4.5 4.0
Lab Eh (mV) 606 597 607
Organic Carbon by LECO (g/kg) 37 ± 0.02 2.5 ± 0.01 1.7 ± 0.01
Cr Oxidized (mg/L) 0.0 0.0 0.0
Cr Reduced (mg/L) 3.9 ± 0.12 0.88 ± 0.01 1.3 ± 0.04
CBD Fe (g/kg) 3.0 ± 0.41 N/A N/A
CBD Mn (g/kg) 0.01 ± 0.0 N/A N/A

111
Atsion Soil
A soil profile from a delineation of the Askecksy mapping unit was dug to 114
cm, allowing for sampling from the O/A, E, Bh, Bs, and C horizons (Figure B-5). The
profile was similar to the Atsion series (sandy, siliceous, mesic, Aeric Alaquod).
Figure B-5 Profile sampled from the Atsion soil to a depth of 84 cm revealing O/A, E, Bh, Bs, and C horizons. Location at 38°12’52.11”N, 75° 31’20.05”W.
O/A
E
Bh
Bs
C
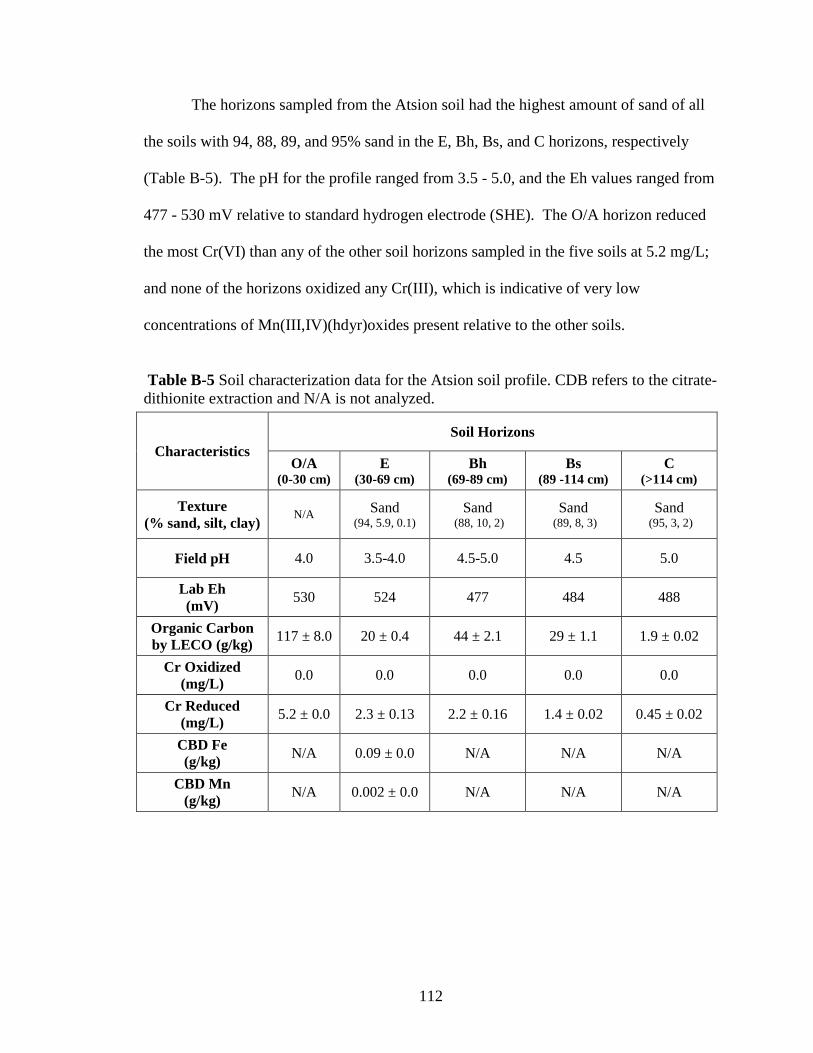
112
The horizons sampled from the Atsion soil had the highest amount of sand of all
the soils with 94, 88, 89, and 95% sand in the E, Bh, Bs, and C horizons, respectively
(Table B-5). The pH for the profile ranged from 3.5 - 5.0, and the Eh values ranged from
477 - 530 mV relative to standard hydrogen electrode (SHE). The O/A horizon reduced
the most Cr(VI) than any of the other soil horizons sampled in the five soils at 5.2 mg/L;
and none of the horizons oxidized any Cr(III), which is indicative of very low
concentrations of Mn(III,IV)(hdyr)oxides present relative to the other soils.
Table B-5 Soil characterization data for the Atsion soil profile. CDB refers to the citrate-dithionite extraction and N/A is not analyzed.
Characteristics Soil Horizons
O/A (0-30 cm)
E (30-69 cm)
Bh (69-89 cm)
Bs (89 -114 cm)
C (>114 cm)
Texture (% sand, silt, clay) N/A Sand
(94, 5.9, 0.1) Sand
(88, 10, 2) Sand
(89, 8, 3) Sand
(95, 3, 2)
Field pH 4.0 3.5-4.0 4.5-5.0 4.5 5.0
Lab Eh (mV) 530 524 477 484 488
Organic Carbon by LECO (g/kg) 117 ± 8.0 20 ± 0.4 44 ± 2.1 29 ± 1.1 1.9 ± 0.02
Cr Oxidized (mg/L) 0.0 0.0 0.0 0.0 0.0
Cr Reduced (mg/L) 5.2 ± 0.0 2.3 ± 0.13 2.2 ± 0.16 1.4 ± 0.02 0.45 ± 0.02
CBD Fe (g/kg) N/A 0.09 ± 0.0 N/A N/A N/A
CBD Mn (g/kg) N/A 0.002 ± 0.0 N/A N/A N/A

113
APPENDIX C
Table C-1 D
ata Set for Figure 2-1A. Tim
e in hours and data in mM
soluble Cr(V
I) for increasing concentration isopropyl alcohol.
Table C-2 D
ata Set for Figure 2-1B. Tim
e in hours and data are ln C/C
o for soluble Cr(V
I) for increasing concentration isopropyl alcohol..

114
Table C-3 D
ata Set for Figure 2-2A. Tim
e in hours and data in mM
soluble Cr(V
I) for increasing concentration tartaric acid.
Table C-4 D
ata Set for Figure 2-2B. Tim
e in hours and data are ln C/C
o for soluble Cr(V
I) for increasing concentration tartaric acid.
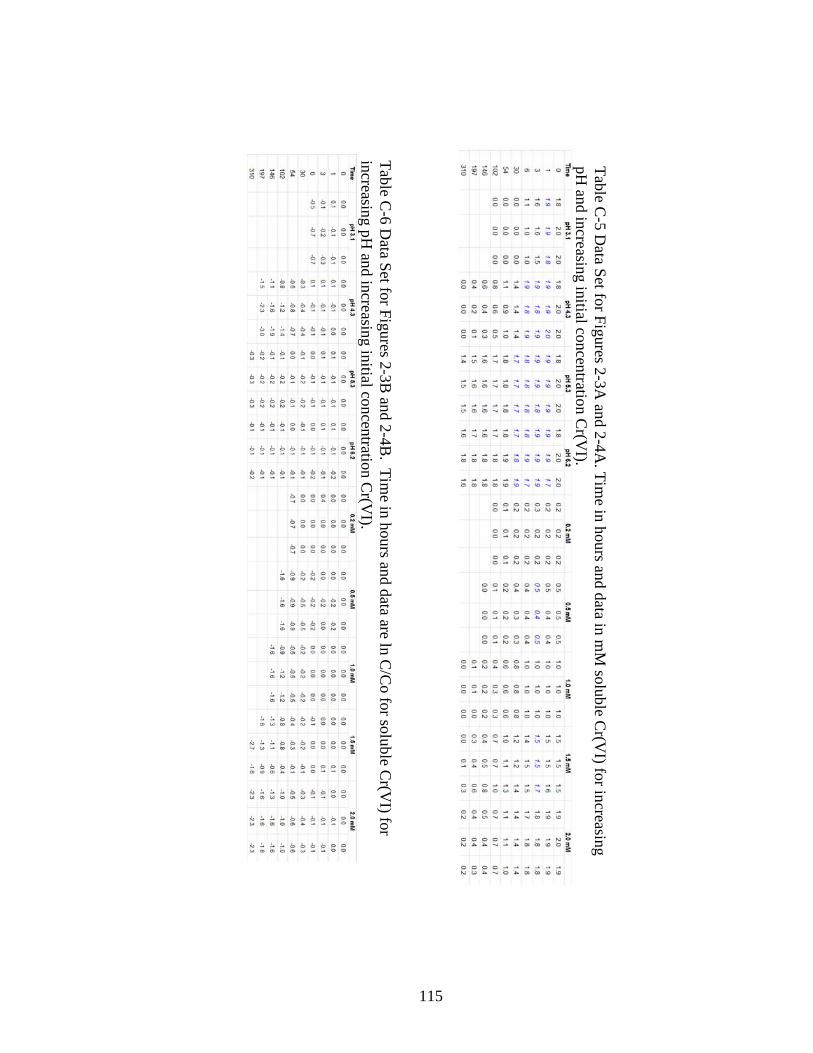
115
Table C-5 D
ata Set for Figures 2-3A and 2-4A
. Time in hours and data in m
M soluble C
r(VI) for increasing
pH and increasing initial concentration C
r(VI).
Table C-6 D
ata Set for Figures 2-3B and 2-4B
. Time in hours and data are ln C
/Co for soluble C
r(VI) for
increasing pH and increasing initial concentration C
r(VI).

116
Table C-7 D
ata Set for Figure 2-5A. Tim
e in hours and data are pe of solution with increasing concentration isopropyl
alcohol.
Table C-8 D
ata Set for Figure 2-5B. Tim
e in hours and data are pe of solution with increasing concentration
tartaric acid.

117
Table C-9 D
ata Set for Figure 3-1A. Tim
e in hours and data are mM
of soluble Cr(V
I) with 0.29 M
isopropyl alcohol, 12 mM
tartaric acid, and pH
4 for five Maryland soils.
Table C-10 D
ata Set for Figure 3-1B. Tim
e in hours and data are ln concentration over initial concentration (C/C
o) for soluble C
r(VI) w
ith 0.29 M isopropyl alcohol, 12 m
M tartaric acid, and pH
4 for five Maryland soils.
Table C-11 D
ata Set for Figure 3-2. Time in hours and data are pH
for suspensions with 0.29 M
isopropyl alcohol, 12 mM
tartaric acid, and pH
4 for five Maryland soils.

118
Table C-12 D
ata Set for Figure 3-3A. Tim
e in hours and data are µM of soluble M
n with 0.29 M
isopropyl alcohol, 12 mM
tartaric acid, and pH
4 for five Maryland soils.
Table C-13 D
ata Set for Figure 3-3B. Tim
e in hours and data are µM of soluble Fe w
ith 0.29 M isopropyl alcohol, 12 m
M
tartaric acid, and pH 4 for five M
aryland soils.
Table C-13 D
ata Set for Figure 3-3B. Tim
e in hours and data are µM of soluble Fe w
ith 0.29 M isopropyl alcohol, 12 m
M
tartaric acid, and pH 4 for five M
aryland soils.

119
Table C-14 D
ata Set for Figure 3-4. Soluble Cr(V
I) after 24h shaking in presence of Mn-oxide coated sand w
ith 12 m
M tartaric acid and pH
4. Initial Cr(III) concentration at 2 m
M, and done in separate experim
ent.
Table C-15 D
ata Set for Figure 3-5. Soluble Cr(V
I) after 24h shaking in presence of trivalent and divalent metals w
ith 12 m
M tartaric acid, 0.29 M
isopropyl alcohol, and pH 4.

120
Table C-16 D
ata Set for Figure 4-1A. Soluble C
r(VI) in m
M after 96 h in presence of 1 m
M M
n2+, 0.29 M
isopropyl alcohol, or both w
ith 12 mM
tartaric acid at pH 4 or 5.5.
Table C-17 D
ata Set for Figure 4-1B. N
atural log of soluble Cr(V
I) concentrations over initial concentration (ln C/C
o) for 96 h in presence of 1 m
M M
n2+, 0.29 M
isopropyl alcohol, or both with 12 m
M tartaric acid at pH
4 or 5.5.

121
Table C-18 D
ata Set for Figure 4-2. pH for 96 h in presence of 1 m
M M
n2+, 0.29 M
isopropyl alcohol, or both with 12 m
M
tartaric acid at low or high acidity. Low
acidity is initial 0.2 M H
NO
3 concentration and high acidity is 0.5 M H
NO
3 . Time is
in hours.
Table C-19 D
ata Set for Figure 4-3A. Soluble C
r(VI) in m
M for 96 h in presence of 1 m
M M
n2+, 0.29 M
isopropyl alcohol, or both w
ith 12 mM
tartaric acid at low or high acidity. Low
acidity is initial 0.2 M H
NO
3 concentration and high acidity is 0.5 M
HN
O3 . Tim
e is in hours.

122
Table C-20 D
ata Set for Figure 4-3B. N
atural log of soluble Cr(V
I) concentrations over initial concentration (ln C/C
o) starting at 24 h in presence of 1 m
M M
n2+, 0.29 M
isopropyl alcohol, or both with 12 m
M tartaric acid at low
or high acidity. Low
acidity is initial 0.2 M H
NO
3 concentration and high acidity is 0.5 M H
NO
3 . Time is in hours.
Table C-21 D
ata Set for Figure 4-4. Fractions of Cr recovered from
CO
PR sam
ples in presence of 1 m
M M
n2+, 0.29 M
isopropyl alcohol, or both with 12 m
M tartaric acid at low
or high acidity. Low
acidity is initial 0.2 M H
NO
3 concentration and high acidity is 0.5 M H
NO
3 .

123
Table C
-22 Data Set for Figure 4-5. Fraction of C
r remaining after 48 h shaking in presence of five
Maryland soils w
ith 1 mM
Mn
2+, 0.29 M isopropyl alcohol, or both w
ith 12 mM
tartaric acid .
Table C-23 D
ata Set for Figure 4-6. Soluble Mn concentrations in m
M after 48 h shaking in presence of
five Maryland soils w
ith 1 mM
Mn
2+, 0.29 M isopropyl alcohol, or both w
ith 12 mM
tartaric acid.

124
REFERENCES Agency for Toxic Substances and Disease Registry Staff (ATSDR). 2000. U.S.
Department of Health and Human Services. Toxicological Profile for Chromium, DHHS-ATSDR, Atlanta, GA.
Baldock J.A., and K. Broos. 2012. Soil Organic Matter, in: P.M Huang, Y. Li, and M.E. Sumner (Eds.), Handbook of Soil Sciences: Properties and Processes, 2nd ed., CRC Press, Boca Raton, FL.
Bartlett R.J., and B.R. James. 1979. Behavior of Chromium in Soils (III) Oxidation. Journal of Environmental Quality 8:31-35.
Bradl H.B. 2004. Adsorption of Heavy Metal Ions on Soils and Soils Constituents. Journal of Colloid and Interface Science 277:1-18.
Brose D. 2008. Oxidation-Reduction Transformations of Chromium in Aerobic Soils and the Role of Electron-Shuttling Quinones in Chemical and Microbiological Pathways. Masters Thesis. Deparment of Environmental Science and Technology, University of Maryland, College Park, MD.
Brose, D. A., and B. R. James. 2010. Oxidation-Reduction Transformations of Chromium in Aerobic Soils and the Role of Electron-Shuttling Quinones. Environmental Science & Technology 44:9438-9444.
Burke T., Fagliano J., Goldoft M., Hazen R.E., Iglewicz R., and T. McKee. 1991.
Chromite Ore Processing Residue in Hudson County, New Jersey. Environmental Health Perspectives 92:131-137.
California Department of Publich Health (CDPH). 2009. Chromium 6: Timeline for
Drinking Water Regulations. Online: www.cdph.ca.gov/certlic/drinkingwater/ Pages/Chromium6timeline.aspx
CH2M Hill. 2011. Corrective Measures, Alternatives Analysis, Dundalk Marine
Terminal, Baltimore, Maryland. Prepared for Honeywell, Morristown, N.J. and Maryland Port Administration, Baltimore, MD.
Chrysochoou M., Dermatas D., Grubb D.G., Moon D.H., Christodoulatos C. 2010.
Importance of Mineralogy in the Geoenvironmental Characterization and Treatment of Chromite Ore Processing Residue. Journal of Geotechnical and Geoenvironmental Engineering 136:510-521.
Chrysochoou, M., and A. Ting. 2011. A kinetic study of Cr(VI) reduction by calcium polysulfide. Science of the Total Environment 409 (19):4072-4077.

125
Cotton F.A., and A.G. Wilkinson. 1980. Advanced Inorganic Chemistry. 4th ed. John Wiley and Sons, Inc. , New York.
Darrie G. 2001. Commercial Extraction Technology and Process Waste Disposal in the
Manufacture of Chromium Chemicals from Ore. Environmental Geochemistry and Health 23:187-193.
Deakin D., West L.J., Stewart D.I., and B.W.D. Yardley. 2001. The Leaching Characteristics of Chromite Ore Processing Residue. Environmental Geochemistry and Health 23:201-206.
Deng, B. L., and A. T. Stone. 1996. Surface-catalyzed chromium(VI) reduction: Reactivity comparisons of different organic reductants and different oxide surfaces. Environmental Science & Technology 30 (8):2484-2494.
Dermatas D., Chrysochoou M., Moon D.H., Grubb D.G., Wazne M., Christodoulatos C.
2006. Ettringite-induced Heave in Chromite Ore Processing Residue (COPR) upon Ferrous Sulfate Treatment. Environmental Science & Technology 40:5786-5792.
Essington M.E. 2004. Soil and Water Chemistry CRC Press LLC, Boca Raton, FL.
Fendorf S.E., Zasoski R.J. 1992. Chromium(III) Oxidation by Delta-MnO2 (I) Characterization. Environmental Science & Technology 26:79-85.
Gardner, W.H. 1986. Water Content, In A. Klute, ed. Methods of Soil Analysis. Part 1.
Physical and Mineralogical Methods 2nd ed. Soil Science Society of America, Madison Wisconsin.
Gee, G.W., and J.W. Bauder. 1986. Particle-size Analysis, In A. Klute, ed. Methods of Soil
Analysis. Part 1. Physical and Mineralogical Methods 2nd ed. Soil Science Society of America, Madison Wisconsin.
Geelhoed J.S., Meeussen J.C.L., Roe M.J., Hillier S., Thomas R.P., Farmer J.G., Paterson
E. (2003) Chromium Remediation or Release? Effect of Iron(II) Sulfate Addition on Chromium(VI) Leaching from Columns of Chromite Ore Processing Residue. Environmental Science & Technology 37:3206-3213.
Golden, D. C., J. B. Dixon, et al. 1986. Ion-Exchange, Thermal Transformations, and
Oxidizing Properties of Birnessite. Clays and Clay Minerals 34 (5): 511-520. Han F.X.X., Su Y., Sridhar B.B.M., Monts D.L. 2004. Distribution, Transformation and
Bioavailability of Trivalent and Hexavalent Chromium in Contaminated Soil. Plant and Soil 265:243-252.

126
Hasan F., Rocek J. 1972. Cooxidation of Isopropyl Alcohol and Oxalic-Acid by Chromic Acid - One-Step Three-Electron Oxidation. Journal of the American Chemical Society 94:3181.
Hasan F., Rocek J. 1973a. 3-Electron Oxidations IV. Chromic Acic Cooxidation of
Tertiary Hydroxy-Acids and Alcohols. Journal of the American Chemical Society 95:5421-5422.
Hasan F., Rocek J. 1973b. 3-Electron Oxidations V. Rapid Reaction of Chromic Acid with 2-Component Substrate System. Journal of Organic Chemistry 38:3812-3814.
Heusler K.E., Lorenz W.J. 1985. Iron, Ruthenium, and Osium, in: A. J. Bard, et al. (Eds.), Standard Potentials in Aqueous Solution, Marcel Dekker, Inc., New York, NY. pp. 391-412.
Hillier S., Roe M.J., Geelhoed J.S., Fraser A.R., Farmer J.G., Paterson E. 2003. Role of Quantitative Mineralogical Analysis in the Investigation of Sites Contaminated by Chromite Ore Processing Residue. Science of the Total Environment 308:195-210.
Hohl H., Stumm W. .1976. Interaction of Pb-2+ with Hydrous Gamma-Al-2O-3. Journal of Colloid and Interface Science 55:281-288.
Holloway F., Cohen M., Westheimer F.H. 1951. The Mechanism of the Chromic Acid Oxidation of Isopropyl Alcohol - The Chromic Acid Ester. Journal of the American Chemical Society 73:65-68.
Houghton R.P. 1979. Metal Complexes in Organic Chemistry Cambridge University Press, Cambridge, U.K.
Hug S.J., Laubscher H.U., James B.R. 1997. Iron(III) Catalyzed Photochemical Reduction of Chromium(VI) by Oxalate and Citrate in Aqueous Solutions. Environmental Science & Technology 31:160-170.
International Agency for Research on Cancer (IARC). 1990. Chromium and Chromium Compounds. IARC Monographs on the Evaluation of Carcinogenic Risks to Humans 49:49-256.
Jagupilla, S. C., D. H. Moon, et al. 2009. Effects of Particle Size and Acid Addition on
the Remediation of Chromite Ore Processing Residue using Ferrous Sulfate. Journal of Hazardous Materials 168(1): 121-128.

127
James B.R. 1996. The Challenge of Remediating Chromium-Contaminated Soil. Environmental Science & Technology 30:A248-A251.
James B.R. 2002. Redox Phenomena, Encyclopedia of Soil Science, Marcel Dekker, Inc.,
New York, NY.
James B.R., Bartlett R.J. 1983a. Behavior of Chromium in Soils (VI) Interactions between Oxidation-Reduction and Organic Complexation. Journal of Environmental Quality 12:173-176.
James B.R., Bartlett R.J. 1983b. Behavior of Chromium in Soils (V) Fate of Organically Complexed Cr(III) Added to Soil. Journal of Environmental Quality 12:169-172.
James B.R., Bartlett R.J. 1983c. Behavior of Chromium in Soils (VII) Adsorption and Reduction of Hexavalent Forms. Journal of Environmental Quality 12:177-181.
James B.R., and D.A. Brose. 2012. Oxidation-Reduction Phenomena, in: P.M Huang, Y. Li, and M.E. Sumner (Eds.), Handbook of Soil Sciences: Properties and Processes, 2nd ed., CRC Press, Boca Raton, FL.
James B.R., and D.A. Brose. (In press) Chromium, Encyclopedia of Environmental Management, CRC Press, Washington, D.C.
Kabir-ud-Din., Hartani K., Khan Z. 2002. One-Step Three-Electron Oxidation of Tartaric and Glyoxylic Acids by Chromium(VI) in the Absence and Presence of Manganese(II). Transition Metal Chemistry 27:617-624.
Kantar C., Cetin Z., Demiray H. 2008. In Situ Stabilization of Chromium(VI) in Polluted Soils using Organic Ligands: The role of Galacturonic, Glucuronic and Alginic Acids. Journal of Hazardous Materials 159:287-293.
Kim J.G., Dixon J.B., Chusuei C.C., Deng Y.J. 2002. Oxidation of Chromium(III) to (VI) by Manganese Oxides. Soil Science Society of America Journal 66:306-315.
Kimbrough D.E., Cohen Y., Winer A.M., Creelman L., Mabuni C. 1999. A Critical Assessment of Chromium in the Environment. Critical Reviews in Environmental Science and Technology 29:1-46.
Kwart H., Francis P.S. 1959. Structural and Conformational Effects on the Rates of Oxidation of Secondary Alcohols by Chromic Acid. Journal of the American Chemical Society 81:2116-2119.

128
Lan, Y. Q., C. Li, J. D. Mao, and J. Sun. 2008. Influence of Clay Minerals on the Reduction of Cr6+ by Citric Acid. Chemosphere 71 (4):781-787.
Lemanceau P., Bauer P., Kraemer S., Briat J.F. 2009. Iron Dynamics in the Rhizosphere
as a Case Study for Analyzing Interactions Between Soils, Plants and Microbes. Plant and Soil 321:513-535.
Li, C., Y. Q. Lan, and B. L. Deng. 2007. Catalysis of manganese(II) on chromium(VI)
reduction by citrate. Pedosphere 17 (3):318-323. Lioy P.J., Freeman N.C.G., Wainman T., Stern A.H., Boesch R., Howell T., Shupack S.I.
1992. Microenvironmental Analysis of Residential Exposure to Chromium-Laden Wastes in and Around New-Jersey Homes. Risk Analysis 12:287-299.
Loach, P.A. (ed.). 1976. Oxidation-Reduction Potentials, Absorbancy Bands, and Molar Absorbency of Compounds used in Biochemical Studies, pp. 1-122-130. Chemical Rubber Co., Cleveland, OH.
Lovley, D.R., J.D. Coates, Blunt Harris, E L., Phillips, E.J.P., and J.C. Woodward.1996. Humic Ssubstances as Electron Acceptors for Microbial Respiration. Nature 382(6590): 445-448.
Ludwig R.D., Su C.M., Lee T.R., Wilkin R.T., Sass B.M. 2008. In-Situ Source Treatment of Cr(VI) using a Fe(II)-Based Reductant Blend: Long-Term Monitoring and Evaluation. Journal of Environmental Engineering-ASCE 134:651-658.
Mahapatro, S. N., M. Krumpolc, and J. Rocek. 1980. 3-Electron Oxidations .17. the Chromium(VI) and Chromium(V) Steps in the Chromic-Acid Cooxidation of 2-Hydroxy-2-Methylbutyric Acid and 2-Propano. Journal of the American Chemical Society 102 (11):3799-3806.
Mandiwana K.L., Panichev N., Kataeva M., Siebert S. 2007. The Solubility of Cr(III) and
Cr(VI) Compounds in Soil and their Availability to Plants. Journal of Hazardous Materials 147:540-545.
Masel, R.I. 2001. Chemical Kinetics & Catalysis. New York, NY, John Wiley and Sons,
Inc. Matocha, C.J., Scheckel, K.G., Sparks, D.L. 2005. Kinetics and Mechanisms of Soil
Biogeochemical Processes. In Chemical Processes in Soils, edited by M. A. Tabatabai, Sparks, D.L.: Soil Science Society of America.
Mehra, O.P. and M.L. Jackson. 1960. Iron Oxide Removal from Soils and Clays by a
Dithionite–Citrate System Buffered with Sodium Bicarbonate. Swineford Ada (Ed.), Clays and Clay Minerals, Proc. 7th Natl. Conf., Washington DC, 1958, Pergamon Press, New York, pp. 317–327.

129
Milazzo, G., V.K. Sharma, and S. Caroli. 1978. Tables of Standard Electrode Potentials
Wiley, New York, NY. Nakayasu, K., M. Fukushima, K. Sasaki, S. Tanaka, and H. Nakamura. 1999.
Comparative Studies of the Reduction Behavior of Chromium(VI) by Humic Substances and their Precursors. Environmental Toxicology and Chemistry (6):1085-1090.
National Toxicology Program (NTP). 2008. Toxicology and Carcinogenesis Studies of
Chromium Picolinate Monohydrate (CAS No. 27882-76-4) in F344/N Rats and B6C3F1 Mice (Feed Studies) [draft]. Research Triangle Park, NC.
Negra C., Ross D.S., Lanzirotti A. 2005. Oxidizing Behavior of Soil Manganese:
Interactions Among Abundance, Oxidation State, and pH. Soil Science Society of America Journal 69:87-95.
Nelson, D.W., and L.E. Sommers. 1996. Total Carbon, Organic Carbon, and Organic Matter,
In D. L. Sparks, ed. Methods of Soil Analysis. Part 3. Chemical Methods Soil Science Society of America, Madison Wisconsin.
New Jersey Department of Environmental Protection (NJDEP). 2010. Understanding the
Hexavalent Chromium Risk Assessment and Soil Standard Setting Process. Online: http://www.state.nj.us/dep/dsr/chromium/final_HexChromRAGuide.pdf
Niki K. 1985. Chromium, Molybdenum, and Tungsten, in: A. J. Bard, et al. (Eds.),
Standard Potentials in Aqueous Solution, Marcel Dekker, Inc., New York, NY. pp. 453-506.
Oze C., Bird D.K., Fendorf S. 2007. Genesis of Hexavalent Chromium from Natural Sources in Soil and Groundwater. Proceedings of the National Academy of Sciences of the United States of America 104:6544-6549.
Peretyazhko T., Sposito G. 2006. Reducing Capacity of Terrestrial Humic Acids. Geoderma 137:140-146.
Pettine, M., Barra, I., Campanella, L., and F.J. Millero. 1998. Effect of Metals on the
Reduction of Chromium (VI) with Hydrogen Sulfide. Water Research 32(9): 2807-2813.
Pettine, M., F. J. Millero, and R. Passino. 1994. Reduction of Chromium (VI) with
Hydrogen-Sulfide in NaCl Media. Marine Chemistry 46 (4):335-344. Pflaum, R. T., and L. C. Howick. 1956. The Chromium-Diphenylcarbazide Reaction.
Journal of the American Chemical Society 78 (19):4862-4866.

130
Puzon G.J., Tokala R.K., Zhang H., Yonge D., Peyton B.M., Xun L.Y. 2008. Mobility and Recalcitrance of Organo-Chromium(III) Complexes. Chemosphere 70:2054-2059.
Qafoku, N. P., P. E. Dresel, E. Ilton, J. P. McKinley, and C. T. Resch. 2010. Chromium
transport in an acidic waste contaminated subsurface medium: The role of reduction. Chemosphere 81 (11):1492-1500.
Rahman M., Rocek J. 1971. Mechanism of Chromic Acid Oxidation of Isopropyl Alcohol
- Evidence for Oxidation by Chromium(IV). Journal of the American Chemical Society 93:5462.
Rendina, A., M. J. Barros, and A. F. de Iorio. 2011. Changes in the speciation, Partitioning and Phytoavailability of Chromium Induced by Organic Soil amendments. Chemical Speciation and Bioavailability 23 (1):53-60.
Scheckel, K. G. and D. L. Sparks. 2001. Temperature Effects on Nickel Sorption Kinetics at the Mineral-Water Interface. Soil Science Society of America Journal 65(3):719-728.
Sparks D.L. 2003. Environmental Soil Chemistry. 2nd ed. Elsevier Science, San Diego,
CA. Stout M.D., Herbert R.A., Kissling G.E., Collins B.J., Travlos G.S., Witt K.L., Melnick
R.L., Abdo K.M., Malarkey D.E., Hooth M.J. 2009. Hexavalent Chromium Is Carcinogenic to F344/N Rats and B6C3F1 Mice after Chronic Oral Exposure. Environmental Health Perspectives 117:716-722.
Stumm W., Morgan J.J. 1996. Aquatic Chemistry. 3rd ed. Wiley-Interscience, New York,
NY. Su, C. M. and R. D. Ludwig. 2005. Treatment of Hexavalent Chromium in Chromite Ore
Processing Solid Waste using a Mixed Reductant Solution of Ferrous Sulfate and Sodium Dithionite. Environmental Science & Technology 39(16): 6208-6216.
Sun J., Mao J.D., Gong H., Lan Y.Q. 2009. Fe(III) Photocatalytic Reduction of Cr(VI) by
Low-Molecular-Weight Organic Acids with alpha-OH. Journal of Hazardous Materials 168:1569-1574.
Tan K.H. 2003. Humic Matter in Soil and the Environment. Principles and Controversies
Marcel Dekker, Inc., New York, NY. Tian, X. F., X. C. Gao, F. Yang, Y. Q. Lan, J. D. Mao, and L. X. Zhou. 2010. Catalytic
Role of Soils in the Transformation of Cr(VI) to Cr(III) in the Presence of Organic Acids Containing alpha-OH Groups. Geoderma 159 (3-4):270-275.

131
Tinjum J.M., Benson C.H., Edil T.B. 2008. Mobilization of Cr(VI) from Chromite Ore Processing Residue through Acid Treatment. Science of the Total Environment 391(1): 13-25.
U.S. Depratment of Health and Human Services, Agency for Toxic Substances and
Disease. 2000. Toxicological Profile for Chromium. www.atsdr.cdc.gov. U.S. Environmental Protection Agency (EPA). 2010. Basic Information about Chromium
in Drinking Water, Washington, D.C. Online:http://www.epa.gov/safewater/ contaminants/basicinformation/chromium.html#four.
U.S. Environmental Protection Agency (EPA). 1982. Test Methods for Evaluating
Solid Wastes, Physical/Chemical Methods. SW-846, Second Edition. Office of Solid Waste and Emergency Response, Washington, D.C.
Watanabe W., Westheimer F.H. 1949. The Kinetics of the Chromic Acid Oxidation of
Isopropyl Alcohol - The Induced Oxidation of Manganous Ion. Journal of Chemical Physics 17:61-70.
Westheimer F.H., Novick A. 1943. The Kinetics of the Oxidation of Isopropyl Alcohol
by Chromic Acid. The Journal of Chemical Physics 11:506-512. Wittbrodt, P. R., and C. D. Palmer. 1997. Reduction of Cr(VI) by soil humic acids.
European Journal of Soil Science 48(1):151-162. Yalcin, S., and K. Unlu. 2006. Modeling Chromium Dissolution and Leaching from
Chromite Ore-Processing Residue. Environmental Engineering Science 23(1):187-201.
Yang J.W., Tang Z.S., Guo R.F., Chen S.Q. 2008. Soil Surface Catalysis of Cr(VI)
Reduction by Citric Acid. Environmental Progress 27:302-307.


![Formulation of Bio-Based Adhesives with Industrial Application · be amines, carboxylic acids, halogenated acids or alcohols. [7] In some developed researches water, mono-hydroxy](https://img.pdfslide.net/doc/110x75/5f06a22b7e708231d418f708/formulation-of-bio-based-adhesives-with-industrial-application-be-amines-carboxylic.jpg)