Embed Size (px)
Citation preview

The Use of ICT in Education: a survey of schoolsin Europe
Patricia Wastiau, Roger Blamire, Caroline Kearney, Valerie Quittre,Eva Van de Gaer & Christian Monseur
IntroductionThe Survey of Schools: ICT in education was commissioned in 2011 by the EuropeanCommission Directorate General Communications Networks, Content and Tech-nology to benchmark access, use of and attitudes to ICT in schools in the EU27,Croatia, Iceland, Norway and Turkey. It is one of a series in the EU’s cross-sectorbenchmarking activities comparing national progress towards the Digital Agendafor Europe and EU2020 goals (EU Growth strategy for the coming decade)TheSurvey was conducted in partnership between European Schoolnet and the Univer-sity of Liège (Service d’Approches Quantitatives des faits éducatifs, Department ofEducation)1. It is the first European survey on the topic to be conducted onlineand to include students directly. Work on the survey took place between January2011 and November 2012, with data collection in autumn 2011. This articlepresents its main findings based on over 190,000 questionnaire answers fromstudents, teachers and head teachers.
Analytical FrameworkDespite substantial funding for technology in schools and its stated impor-tance in achieving national and European targets, there is a lack of reliablecomparative data and indicators to support evidence-based policies (Pelgrum2009; See also Biagi & Loi in this issue pp. 28–42). The Survey of Schools:ICT in Education was designed to provide a more solid evidence base on thetopic.
Across a range of international studies and reports a broad consensus isemerging on the domains for which indicators on the provision, use and impact oflearning technologies and ICT policy initiatives in schools are needed. This workand the priorities formulated by the European Commission in the terms ofreference for the Survey were used to define the following areas where indicatorswould be produced:• Schools’ ICT infrastructure (desktop computer; mobile devices such as laptops,
notebooks, tablets, smartphones, etc.; broadband; school website, emailaddresses, virtual learning environment, etc.; deployment of equipment inclassrooms, computer labs, libraries, etc.; maintenance). Infrastructure featuresin all definitions of the areas for which indicators on ICT in education areneeded (Scheuermann & Pedro, 2009); it is a basic condition, necessary but notsufficient, for any use to happen.
• Teachers’ and students’ access to ICT at school (years of experience using ICT atschool, % of time, frequency) and ICT-based activities organised by teachers andperformed by students during lessons (frequency; type of activities; digitalresources used). The case for the introduction of these two areas is made byJohannessen (in Scheuermann & Pedro, 2009) and has been integrated in the
bs_bs_banner
European Journal of Education, Part I
© 2013 Blackwell Publishing Ltd., 9600 Garsington Road, Oxford OX4 2DQ, UK and 350 Main Street, Malden, MA02148, USA.
Survey to better identify and quantify basic components that are more relatedto outputs — not in terms of achievement or competence (out of the scope ofthe present Survey) but of access, organisation, frequency and context of use, aswell as the nature of ICT-based activities;
• Teachers’ and students’ declared confidence in their digital competences (opera-tional skills, social media skills, safe and responsible Internet use) and train-ing (participation, content and modalities). Although measuring digitalcompetence was outside the scope of the investigation, an indicator of itwas brought into the Survey by looking at the above areas in relationto the plea for ICT indicators to focus on outcomes and achieve-ments (Erstad, Kikis, Scheuermann & Villalba, in Scheuermann & Pedro,2009);
• School strategy and leadership (policies about ICT use in teaching and learningand in subjects; discussion about ICT use at whole-school level; time forteachers to collaborate and network; incentives to reward ICT use; innovationpolicy, etc.); the inclusion of this area also reflects recent work by the expertsmentioned above which underlines the importance of school leadership for ICTto be adopted and fully used in teaching and learning by the whole schoolcommunity (Erstad, Kikis, Scheuermann and Villalba, in Scheuermann &Pedro, 2009);
• Opinions and attitudes of school heads, teachers and students (ICT relevancefor different learning processes; impact on learning, achievement andmotivation).
Survey MethodologySampling Design
The Survey collected data from schools (school heads), classrooms (teachers), andstudents at grade 4 (ISCED2 level 1; primary level of education), grade 8 (ISCEDlevel 2; lower secondary level of education) and grade 11 (ISCED level 3; uppersecondary level of education, general and vocational). Unlike the two previoussurveys3 on ICT, the Survey in schools: ICT in education had a student questionnairecomponent. Heads of schools with students in these grades, teachers teachingthem and the students themselves were surveyed, the students only at grades 8and 11.
The international sample design framework is a stratified two-stage clustersample design.— In the first stage, schools were stratified, explicitly and/or implicitly, and
selected with probabilities according to their size. Replacement schools wereidentified in advance in case a school refused to take part.
— In the second stage, one class was randomly selected within the sampled andparticipating schools, and all the students in the selected class were surveyed.Classes were selected with equal probabilities within schools.
Within schools, a simple random sample of one class was drawn from the listof possible classes at the target grade entered online by a school coordinatornominated by the head teacher. The definition of ‘possible classes’ depended onthe level. At ISCED level 1, they are all those with target grade students. Theteacher responsible for the class was in the teacher target population; if morethan one teacher shared responsibility, one of the teachers was randomly
12 European Journal of Education, Part I
© 2013 Blackwell Publishing Ltd.
selected. At ISCED 2 and ISCED 3 level, the possible classes were defined asthe learning groups of students for the language of instruction (i.e. a class learn-ing English in England, German in Austria, Italian in Italy, etc.). At ISCED level2 and ISCED level 3, all mathematics, science, and language teachers who teachany student in the sampled class belong to the teacher target population. AtISCED level 3 vocational education, if there were no language classes, an admin-istrative unit was chosen.
Implementation Process
The ministries of education in each country were asked to nominate a nationalcoordinator (NC) and provide access to the most recent version of their officialschool databases. Samples of schools and replacement schools were randomlyselected in each country for each grade.
Administration Process
The three survey questionnaires were translated into the official language(s) of theparticipating countries and made available to respondents in the appropriatelanguage.
Administration of the survey was online. The school coordinator was emailedthe URL of questionnaires, IDs and passwords and asked to distribute them to theschool head and the selected teachers and students.
Data Analysis
After data cleaning and weighting and non-response adjustments, data were proc-essed and standard errors calculated.
Some of the items in the school head, teacher and student questionnaires weredesigned to be used in analyses as single items (e.g. gender), but most weredesigned to be combined in some way in order to measure latent constructs thatcould not be observed directly. For these items, transformations or scaling proce-dures were used to construct meaningful indices (varimax rotation with SASsoftware, Cronbach alpha’s calculation, etc.).
A two-step cluster analysis method (in SPSS software) was used to identifygroups of students, teachers, and schools that resemble each other on a number ofpreselected variables.When determining the number of clusters, not only statisticalcriteria were taken into account (best fit), but also criteria of interpretability andsimilarity across the different grades, i.e. solutions that were interpretable and thatfitted each grade.
The Survey findings are based on 156,634 questionnaire answers from stu-dents, 24,522 from teachers and 10,137 from head teachers in 27 countries4
collected between September and December 2011.
First Part of the Survey Findings: ‘State of the Art’ indicators1. ICT Infrastructure in Schools
Laptop and tablet computers5 and mobile phones are increasingly seen as useful ineducation (Prensky, 2004), offering portability and choice as to when and where touse them. A literature review of UK research on the topic (Savill-Smith and Kent,2003 cited in Condie, 2007) states that in order for a specific device to be usedoptimally, certain technical and organisational conditions must be fulfilled 0. A
Patricia Wastiau et al. 13
© 2013 Blackwell Publishing Ltd.
tablet was found to be best used together with a wireless network and a wirelessdata projector which enabled it to be moved around between pupils in class,something which is difficult to organise with laptops that are physically connectedto an interactive whiteboard (IWB) for example. There is also a growing body ofevidence on the impact of IWBs on learning. Research from the UK (Underwood,2009) investigated the use of IWBs and learning platforms as a lever for change.Whilst IWBs are motivating for students and facilitate cross-school use of ICT,they are not strongly linked to transformational pedagogies or learning (Wastiau2010).
One area of investigation in the Survey is whether a trend is observed thatmoves away from fixed installations of computers in labs, classrooms or otherlocations towards mobile learning devices. Another is the availability of onlinelearning environments and their characteristics as well as other support devicesenabling overall efficient functioning, e.g. availability of projectors, wireless andbroadband connections.
The Survey findings paint a picture of students and teachers with unprec-edented access to educational technology: there are around twice as many com-puters per 100 students in secondary schools than in 2006, laptop computers areavailable in classrooms, and broadband is almost ubiquitous in schools (95% ofschools compared to 65–75% in 2006). There are now between three and sevenstudents per computer on average in the EU; computers are more often located inthe classroom, even if still frequently found in computer labs. Laptops, tablets andnetbooks are becoming pervasive, but only in some countries (See Bocconi et al. inthis issue pp. 113–130). In these countries, the impact of such a trend can beexpected to be positive on learning processes and students’ competence; theliterature review previously mentioned (Savill-Smith and Kent, 2003 cited inCondie, 2007) revealed that personal digital assistants (PDAs) helped to increasestudent motivation, develop organisational skills, encourage responsibility, facili-tate independent and collaborative learning and were useful as reference andassessment tools for tracking pupils’ progress (See Redecker & Johannessen in thisissue pp. 79–96).The Survey findings show that, on average in the EU, interactivewhiteboards are present in approximately one in three classrooms (over 100students per IWB), as well as data projectors (50 per ‘beamer’ as they are some-times called). More than 9 out of ten students are in schools with broadband, atmost commonly between 2 to 30 mbps.
According to the Survey results, at EU level on average, between 25 and 35%of students in grades 4 and 8, and around 50% of students in grade 11 are inhighly equipped schools, i.e. with fast broadband (10 mbps or more) and highconnectedness. The percentages of such schools differ enormously betweencountries. At least 80% of students in grades 4 and 8 are in highly digitallyequipped schools with fast broadband and relatively high connectedness inDenmark, Finland, Norway and Sweden where almost all students in grade 11are in such highly equipped schools. Conversely, less than 20% of students ingrade 4 and less than 10% in grade 8 are in such schools in around half thecountries surveyed (Bulgaria, Croatia, Greece, Hungary, Italy, Slovakia, Slovenia,Poland, Romania and Turkey); the situation in these countries improves at grade11, but to a large extent only in Croatia and Slovenia where 60% to 80%of students are in highly equipped schools. These findings are presented inFigure 1.
14 European Journal of Education, Part I
© 2013 Blackwell Publishing Ltd.

FIGURE 1. Percentages of students at grade 4 (Fig. 1a) and grade 11 general(Fig. 1b) by school type in terms of equipmentSource: country and EU level, 2011–12.
Patricia Wastiau et al. 15
© 2013 Blackwell Publishing Ltd.
Even so, the survey also reveals that school heads and teachers consider thatinsufficient ICT equipment (especially interactive white boards and laptops) is themajor obstacle to ICT use. Inhibitors are not the same across countries.
Interestingly, the Survey did not find any overall relationship between high levelsof infrastructure provision as defined above and student and teacher use, confidenceand attitudes.This confirms a key finding of the international comparative study ofpedagogy and ICT use in schools, SITES 2006 (Law, Pelgrum, & Plomp, 2008),conducted by the IEA and which focused on the role of ICT in teaching and learningin mathematics and science classrooms. It showed that provision, access andconnectivity do not, in themselves, lead to ICT use in learning and teaching.
Students’ and Teachers’ Confidence in their Digital Competence andFrequency of ICT-based Learning ActivitiesResearch over the past 15 years has demonstrated the significant influence of teachercompetence on student achievement (Owston, 2006). It is therefore important forall teachers to have the necessary knowledge and skills to integrate ICT in their dailyteaching practice in order to maximise their ability to help to improve students’digital competence. The digital competence here involves the confident and criticaluse of Information SocietyTechnology (IST) for work, leisure and communication.It is underpinned by basic skills in ICT, i.e. the use of computers to retrieve, store,produce, present and exchange information, and to communicate and participate incollaborative networks via the Internet (European Commission, 2007).
Research shows that there is a relation between teachers’ digital competenceand their use of ICT in the classroom. Hence, participation in professional devel-opment activities can significantly influence their ICT use (Fredriksson et al.,2008; Valiente, 2010). Teachers prefer informal methods of training, blendedtraining and training that relates to real classroom settings (Balanskat et al., 2006),and collaboration between teachers is an efficient way for such professional devel-opment to happen (Bacigalupo & Cachia 2011). We also know from research inthis area that more experience in using technologies is positively related to theacquisition of students’ digital skills and their confidence in using these tools(OECD, 2010). More generally, incoming teachers have not been sufficientlytrained in the pedagogical use of ICT (OECD, 2008; Starkey, 2010). They aregenerally more traditional users of the Internet and lack knowledge in how toexploit social media tools for learning (MMB, 2008). Evidence also suggests thatsocial media approaches can facilitate technological, pedagogical and organisa-tional innovation in teaching and learning, thus contributing to the modernisationof systems and institutions to meet the challenges of the 21st century (Redeckeret al., 2009).
The Survey of Schools: ICT in education investigates teachers’ and students’frequency of ICT use and ICT-based activities during lessons, as well as theirconfidence in their respective digital competences, and the relationship betweenboth. The findings reveal that most have been familiar with ICT at school for afew years but still mainly use it to prepare their teaching. Only a few use it — butstill to a limited extent — to work with students during lessons, and even lessfrequently to communicate with parents or divide students’ work between schooland home in new ways. The overall frequency of use of different types of ICT-based activities in class declared by teachers is several times a month on averageat EU level, while students declare undertaking ICT-based activities between
16 European Journal of Education, Part I
© 2013 Blackwell Publishing Ltd.

several times a month and never or almost never. The higher frequency declaredby teachers could be explained by the lack of equipment accessible to all studentsin the classroom and by the teacher-centred approach — as opposed to thestudent-centred one — that still prevails in many teaching and learning environ-ments. Digital resources such as exercise software, online tests and quizzes, datalogging tools, and computer simulations are still very rarely used by studentsduring lessons. Their ICT-based activities related to learning at home are morefrequent than ICT activities at school. This finding underlines both the extent ofintentional learning taking place outside school and students’ interest in sponta-neous self-directed learning.
The Survey results also show that teacher participation in ICT training forteaching and learning (T&L) is rarely compulsory. At EU level, depending on thegrade, only around 25–30% of students are taught by teachers for whom ICTtraining is compulsory.This is in contrast to teachers’ interest in ICT shown in theSurvey: around 70% of students at all grades are taught by teachers who haveengaged in personal learning about ICT in their own time. Although onlineresources and networks are widely available in Europe, they are a relatively newway for teachers to engage in professional development, and only a minority ofthese opportunities are used by schools.
The Survey findings provide evidence that teachers who are confident in theirdigital skills and positive about ICT’s impact on learning organise more frequentICT-based activities with their students. They were asked to rate their level ofconfidence in their ability to perform 20 ICT-related tasks using a Likert scaleranging from ‘none’ to ‘a lot’. By subjecting the data to factor analysis, two scalesemerged from the 20 items. These included what had been categorised as opera-tional skills and social media skills. Teachers’ operational skills comprise produc-tion of text using word processing software; editing digital photos, movies or othergraphics; editing online text containing Internet links and images; creating adatabase; using a spreadsheet to plot a graph; downloading and installing softwareon a computer, etc. Social media skills consist in the ability to participate in anonline discussion forum, create and maintain blogs or websites and participate insocial networks. Figure 2 presents the results in terms of mean scores on a scalefrom 1 to 4 (1 being ‘none’ and 4 being ‘a lot’). Unsurprisingly, across countries,teachers consider themselves more confident in their operational skills than in theirsocial media skills.
Students were asked to rate their level of confidence in their ability to performmore than 24 ICT-related tasks according to a Likert scale ranging from ‘not atall’ to ‘a lot’. Factor analysis of the data revealed four scales from the list ofitems. These included operational skills and social media skills (as found in the
FIGURE 2. Teachers’ confidence in their operational and social media skillsSource: mean score on a scale from 1 — meaning ‘not at all confident’ — to 4 —meaning ‘a lot confident’; EU level; 2011–12.
Patricia Wastiau et al. 17
© 2013 Blackwell Publishing Ltd.
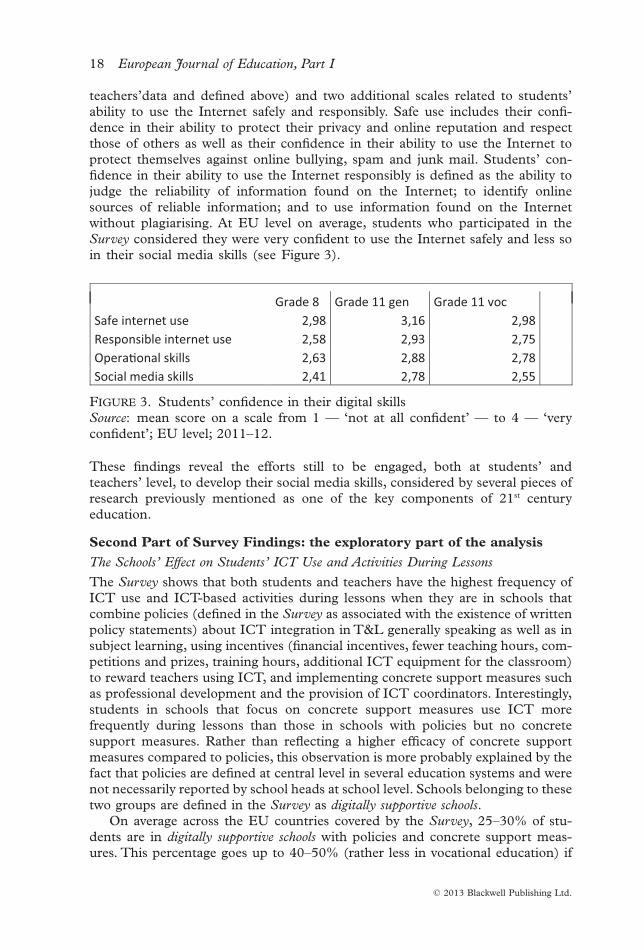
teachers’data and defined above) and two additional scales related to students’ability to use the Internet safely and responsibly. Safe use includes their confi-dence in their ability to protect their privacy and online reputation and respectthose of others as well as their confidence in their ability to use the Internet toprotect themselves against online bullying, spam and junk mail. Students’ con-fidence in their ability to use the Internet responsibly is defined as the ability tojudge the reliability of information found on the Internet; to identify onlinesources of reliable information; and to use information found on the Internetwithout plagiarising. At EU level on average, students who participated in theSurvey considered they were very confident to use the Internet safely and less soin their social media skills (see Figure 3).
These findings reveal the efforts still to be engaged, both at students’ andteachers’ level, to develop their social media skills, considered by several pieces ofresearch previously mentioned as one of the key components of 21st centuryeducation.
Second Part of Survey Findings: the exploratory part of the analysisThe Schools’ Effect on Students’ ICT Use and Activities During Lessons
The Survey shows that both students and teachers have the highest frequency ofICT use and ICT-based activities during lessons when they are in schools thatcombine policies (defined in the Survey as associated with the existence of writtenpolicy statements) about ICT integration in T&L generally speaking as well as insubject learning, using incentives (financial incentives, fewer teaching hours, com-petitions and prizes, training hours, additional ICT equipment for the classroom)to reward teachers using ICT, and implementing concrete support measures suchas professional development and the provision of ICT coordinators. Interestingly,students in schools that focus on concrete support measures use ICT morefrequently during lessons than those in schools with policies but no concretesupport measures. Rather than reflecting a higher efficacy of concrete supportmeasures compared to policies, this observation is more probably explained by thefact that policies are defined at central level in several education systems and werenot necessarily reported by school heads at school level. Schools belonging to thesetwo groups are defined in the Survey as digitally supportive schools.
On average across the EU countries covered by the Survey, 25–30% of stu-dents are in digitally supportive schools with policies and concrete support meas-ures. This percentage goes up to 40–50% (rather less in vocational education) if
FIGURE 3. Students’ confidence in their digital skillsSource: mean score on a scale from 1 — ‘not at all confident’ — to 4 — ‘veryconfident’; EU level; 2011–12.
18 European Journal of Education, Part I
© 2013 Blackwell Publishing Ltd.
students in digitally supportive schools that mostly focus on concrete supportmeasures are added. There are very large differences between countries: at least50% of students — and many more in a few countries at grade 4 — are indigitally supportive schools (at several grades) with both policies and supportmeasures in the Czech Republic, Denmark, Norway, and Slovenia, as well as inBulgaria, Estonia, Ireland and Spain at grade 4; while only less than 10% ofstudents are in such schools in Croatia (at grade 8), France (at grade 4) andGreece at grade 8 and 11.
The Teacher Factor in Students’ Use of ICT for Learning
Students’ use of ICT for learning during lessons is related to teachers’ confidencein their own ICT competences, their opinion about the relevance of ICT for T&Land their access to ICT at school. The Survey shows that students ICT mostfrequently when they are taught by teachers with great confidence in their owndigital competence (operational and social media skills) and in their ability to usethe Internet safely and responsibly, with positive opinions about ICT use for T&L,as well as facing few obstacles and having broad access to ICT infrastructure atschool.These teachers are defined in the Survey as digitally confident and supportiveteachers.
On average across the EU countries covered by the Survey, between 20–25%of students are taught by digitally confident and supportive teachers having broadaccess to ICT and facing few obstacles to their use at school. Here again, thereare great differences between countries. 30 to 50% of students at grade 4 and/orgrade 8 are taught by such teachers in Bulgaria, Estonia, Ireland, Portugal, Slo-vakia, Slovenia and Sweden; conversely, less than 10% of students in the samegrades are taught by such teachers in Austria, Belgium, Cyprus, France, Finland,Greece and Luxembourg. In grade 11 general education, more than 45% ofstudents are taught by such teachers in Denmark, Luxembourg, Norway andPortugal; conversely, less than 10% of students are in this situation in Greece,Romania and Turkey.
Interestingly, students taught by teachers who are confident in their own ICTskills and positive about ICT use in T&L but who have little access and faceobstacles to its use report more frequent use of ICT during lessons than studentstaught by teachers with great access and few obstacles, but who are neitherconfident in their own digital competence nor positive about ICT use for T&L.These findings show that confident and supportive teachers are needed to use ICTinfrastructure effectively and exploit its potential and that they are able to make thebest use of relatively poor ICT learning environments.
The Effect of Students’ ICT Use at School or Home on Confidence in Their DigitalCompetences
A key finding of the Survey shows that, across the countries surveyed, students aremore confident in their digital competences when they have great access to/use ofICT at home AND at school than students who have little access/use at school andhigh access/use at home, or little access/use at both6. Such confidence applies tostudents’ operational ICT skills, social media skills, ability to use the Internetresponsibly, and, to a slightly lesser extent, to use the Internet safely. Thesestudents are not only confident in their digital competences, but are also positiveabout the impact of using ICT in T&L. Such students, with great access/use to
Patricia Wastiau et al. 19
© 2013 Blackwell Publishing Ltd.
ICT at home AND at school are defined in the Survey as digitally confident andsupportive students.
Across the EU countries, on average 30–35% of students are digitally confidentand supportive students. The highest percentage is found in Denmark at all gradesand in Norway at grade 11. Across the EU, the highest percentage is observed ingrade 11 general education, suggesting there has been a particular focus on policiesat that education level. Around 50% of students in grades 8 and 11 vocationaleducation and down to 35% in grade 11 general education have great access/use athome but little access/use at school. Of particular concern is the fact that 18–28%of students, depending on the grade, have little access to/use of ICT both at homeand at school.
Relationships between digitally supportive schools, digitally confident and supportiveteachers, and digitally confident and supportive students
The Survey findings presented above indicate percentages of digitally supportiveschools, digitally confident and supportive teachers and digitally confident and supportivestudents. Are there any relations between these? In other words, do educationalsystems with a high percentage of digitally supportive schools include a largepercentage of digitally confident and supportive teachers or students, or thereverse? To answer these questions, correlation coefficients were computed atcountry level between these percentages. What follows illustrates the results atgrade 11 in general education (the same analysis was made at grades 4, 8 and 11in vocational education but is not presented here; the trend is similar throughoutall grades, the only difference being its extent).
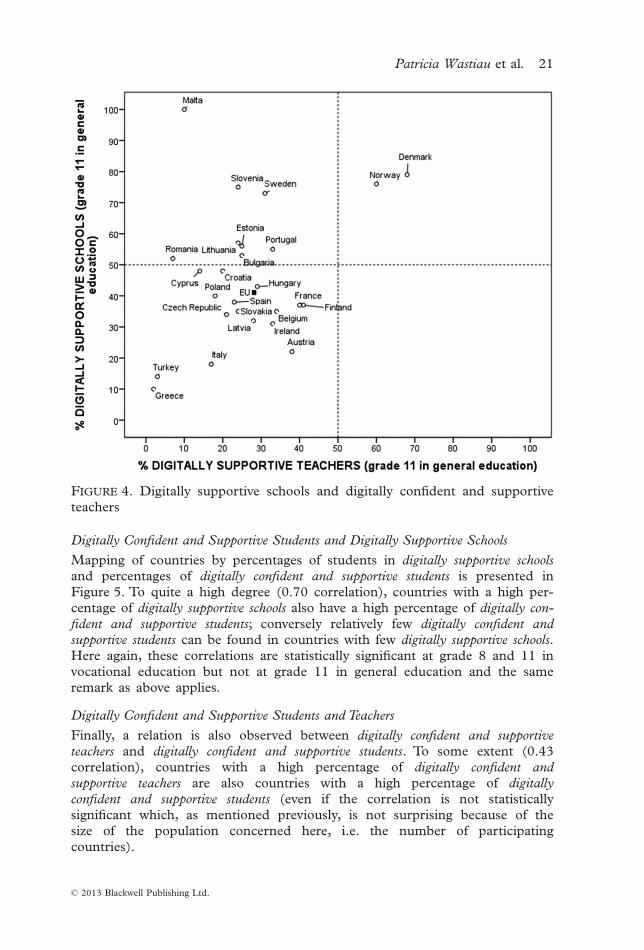
Digitally Confident and Supportive Teachers and Digitally Supportive Schools
To some extent (a correlation of 0.33), as the percentage of digitally supportiveschools increases, so does that of digitally confident and supportive teachers. Whilethere may be national or regional contexts that favour the development of digitallysupportive schools and digitally confident and supportive teachers, the data do notallow us to affirm whether digitally supportive schools encourage teachers to becomesupportive or the reverse. A coefficient correlation does not, of course, prove acausal relationship, but simply confirms the numerical association between phe-nomena. In other words, where we find digitally supportive schools, we also finddigitally confident and supportive teachers.
Although correlations are statistically significant at grades 4 and 11 voca-tional education, they are not at grades 8 and 11 general education. This is notsurprising given the small size of the population concerned (the countries par-ticipating in the survey), but it does not prevent the trend from beingmentioned.
Mapping of countries by percentages of students in digitally supportive schoolsand percentages of students taught by digitally confident and supportive teachers ispresented in Figure 4. It shows that differences between countries are greaterconcerning percentages of students in digitally supportive schools than percentagesof students taught by digitally confident and supportive teachers. Percentages of thelatter are particularly high in Denmark and Norway at grade 11 in general edu-cation compared to other countries; analysing the data in the same way at eachlevel in the survey reveals that percentages of students in digitally supportive schoolsare also high in both countries at all grades.
20 European Journal of Education, Part I
© 2013 Blackwell Publishing Ltd.
Digitally Confident and Supportive Students and Digitally Supportive Schools
Mapping of countries by percentages of students in digitally supportive schoolsand percentages of digitally confident and supportive students is presented inFigure 5. To quite a high degree (0.70 correlation), countries with a high per-centage of digitally supportive schools also have a high percentage of digitally con-fident and supportive students; conversely relatively few digitally confident andsupportive students can be found in countries with few digitally supportive schools.Here again, these correlations are statistically significant at grade 8 and 11 invocational education but not at grade 11 in general education and the sameremark as above applies.
Digitally Confident and Supportive Students and Teachers
Finally, a relation is also observed between digitally confident and supportiveteachers and digitally confident and supportive students. To some extent (0.43correlation), countries with a high percentage of digitally confident andsupportive teachers are also countries with a high percentage of digitallyconfident and supportive students (even if the correlation is not statisticallysignificant which, as mentioned previously, is not surprising because of thesize of the population concerned here, i.e. the number of participatingcountries).
FIGURE 4. Digitally supportive schools and digitally confident and supportiveteachers
Patricia Wastiau et al. 21
© 2013 Blackwell Publishing Ltd.
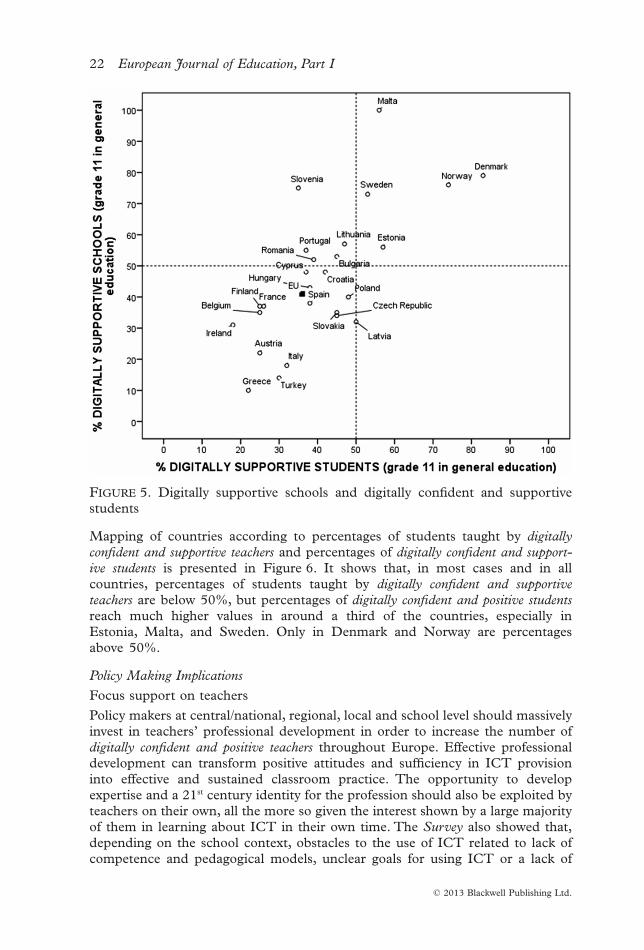
Mapping of countries according to percentages of students taught by digitallyconfident and supportive teachers and percentages of digitally confident and support-ive students is presented in Figure 6. It shows that, in most cases and in allcountries, percentages of students taught by digitally confident and supportiveteachers are below 50%, but percentages of digitally confident and positive studentsreach much higher values in around a third of the countries, especially inEstonia, Malta, and Sweden. Only in Denmark and Norway are percentagesabove 50%.
Policy Making Implications
Focus support on teachers
Policy makers at central/national, regional, local and school level should massivelyinvest in teachers’ professional development in order to increase the number ofdigitally confident and positive teachers throughout Europe. Effective professionaldevelopment can transform positive attitudes and sufficiency in ICT provisioninto effective and sustained classroom practice. The opportunity to developexpertise and a 21st century identity for the profession should also be exploited byteachers on their own, all the more so given the interest shown by a large majorityof them in learning about ICT in their own time. The Survey also showed that,depending on the school context, obstacles to the use of ICT related to lack ofcompetence and pedagogical models, unclear goals for using ICT or a lack of
FIGURE 5. Digitally supportive schools and digitally confident and supportivestudents
22 European Journal of Education, Part I
© 2013 Blackwell Publishing Ltd.

consensus about it. Therefore regular discussions with teaching staff should notonly help to increase consensus about ICT use for T&L at whole school level, butalso be a starting point for peer learning exchanges between teachers and stimu-late new ways of ‘on the job’ professional development. A particular focus shouldbe put on capacity building in the area of new patterns of teacher professionaldevelopment through online learning communities and other approaches closelyintegrated into teachers’ daily practice (informal methods, blended learning,teacher and school networking on a local/regional basis, etc.), all of which are notmuch used according to the Survey findings. These more recent professionaldevelopment models should also integrate teaching and learning activities,showing teachers how ICT can be fully integrated to support efficient learning.Policy makers should also devote attention to the creation and dissemination ofgood quality digital learning resources in order to increase their use by teachersand students during lessons.
More than 70% of teachers surveyed at all grades expressed a positive or verypositive opinion about the relevance and positive impact of ICT to supportdifferent students’ learning processes (working collectively, autonomously, prac-tising, etc.) and objectives (motivation transversal skills, higher order thinkingskills, etc.). This overwhelmingly positive opinion of the latter presents an oppor-tunity that should not be missed for teacher professional development to producehuge benefits and impact. In other words, there is no longer a need to convinceteachers and school heads about the relevance of using ICT for T&L, but the
FIGURE 6. Digitally confident and supportive teachers and students
Patricia Wastiau et al. 23
© 2013 Blackwell Publishing Ltd.

need to equip teaching staff with the digitally based teaching competences andexperience they need to transform positive opinions into efficient practice in theclassroom.
Policies and actions defined at EU level to support a quantitative and quali-tative increase in teacher professional development could usefully look at capac-ity building in the area of new patterns of professional development usingthe currently under-used approaches mentioned above. This action at EUlevel could identify the conditions for the best use of such types of scheme andhow to mainstream them, more from the point of view of process-relatedthan content aspects. EU actions in support of the production of evidenceabout which approach to use according to the objectives to be reached wouldcontribute to better in-service teacher training provision and renewed initialteacher education.
Bring about inspiring school leadership and support infrastructure developmentwhere still needed
The findings of the Survey show that policies and actions relating to infrastruc-ture provision are still needed if most students at all grades are to be in highlydigitally equipped schools as defined above. These policies, focused on providinglaptops (or tablets, netbooks, etc.) and interactive whiteboards, would help toovercome what is still considered by practitioners as the major obstacle to ICTuse. Such policies are a matter of urgency in those countries that lag behindothers. At EU level, supporting policies should take into account the very dif-ferent levels and characteristics of infrastructure provision measured by theSurvey depending on the country, developing diversified support actions suitedto the most equipped education systems as well as to the less well-equippedones.
The Survey findings also strongly support the idea that the goal ofincreasing students’ — and teachers’ — ICT use for T&L during lessons canbe reached through other types of action at whole-school level. Increasingthe number of digitally supportive schools is then a complementary objective to beset in several countries, and urgently so in countries with very low percentagesof such schools. Depending on the extent of autonomy given to schools,national, regional and local policy makers — and school heads more importantlyin decentralised systems — would do well to define and implement policieson ICT integration in teaching and learning as well as in subjects, imple-ment incentives to reward teaching staff using ICT in T&L, introduce achange management programme, and — very importantly — provide dailysupport in the classroom thanks to readily available ICT coordinators. Ratherthan suggesting that there is a ‘silver bullet’ type of policy or interventionoffering a panacea for supporting ICT use in T&L at school level, the findingsof the Survey show that it is a combination of several of the above policiesand measures, articulated together in a systemic approach, that make thedifference.
Boost the use of ICT at school to build students’ confidence in their digitalcompetence
The Survey findings underline the importance of developing ICT use duringlessons in school for students to become more confident in their digital
24 European Journal of Education, Part I
© 2013 Blackwell Publishing Ltd.

competence, regardless of the many opportunities some have to use ICT out ofschool, and even more fundamentally for those who still lack access to itat home. Increasing the amount of well-designed ICT-based activities in schoolis the best way to increase the number of digitally confident and supportivestudents.
Policy makers should also consider how to offer access/use to ICT at schoolto students who do not have access to/use at home. The survey findings make acase for strengthening public action at institutional, local, regional, national andEuropean levels to boost ICT use at school as a means to reduce the gapbetween ICT use out of and in school — a gap identified many years ago butstill persistent in 2012 — and give greater opportunities to about 30% of16-year-old students who lack adequate home access to ICT to experience andbenefit from it at school. ICT use at school should take account of differencesin home access and patterns of use by students. The survey findings (e.g. thedigitally confident and supportive student) reinforce those reported in Are the NewMillennium Learners Making the Grade? (OECD, 2010): the digital divide in edu-cation goes beyond the issue of access to technology. A second digital divideseparates those with the competences and skills to benefit from computer usefrom those who do not. These competences and skills are closely linked to stu-dents’ economic, cultural and social capital (See Istance & Kools in this issue,pp. 43–57).
ConclusionThe survey results point to a number of policy actions at all levels ofthe system to ensure optimal use of increasingly tight financial resources.European policies can play a major role to support all the above policies andactions needed to bring about a digital education system and increase thenumber of digitally supportive schools and digitally confident and supportiveteachers and students by continuing to regularly monitor progress in allMember States. Particular attention should focus on countries where theeffective use of ICT in T&L still lags far behind education systems in othercountries.
PatriciaWastiau, European Schoolnet, 61 rue deTrèves, 1040 Brussels, Belgium, [email protected] Blamire, European Schoolnet, 61 rue de Trèves, 1040 Brussels, Belgium,[email protected] Kearney, European Schoolnet, 61 rue de Trèves, 1040 Brussels, Belgium,[email protected]érie Quittre, Service d’approches quantitatives des faits éducatifs (SAQFE),Département Education, Université de Liège, Boulevard du Rectorat, 5 4000 Liège,Belgium,[email protected] Van de Gaer, Service d’approches quantitatives des faits éducatifs (SAQFE),Département Education, Université de Liège, Boulevard du Rectorat, 5 4000 Liège,Belgium, [email protected] Monseur, Service d’approches quantitatives des faits éducatifs (SAQFE),Département Education, Université de Liège, Boulevard du Rectorat, 5 4000 Liège,Belgium, [email protected]
Patricia Wastiau et al. 25
© 2013 Blackwell Publishing Ltd.
NOTES
1. The University of Liège’s partners were in charge of the whole samplingdesign, data cleaning and weighting, and statistical analysis (frequencies, cor-relations, scales development, cluster analysis). European Schoolnet designedthe analytical framework, the questionnaires, and drafted the comments fromthe statistical analysis.
2. ISCED is the International Standard Classification in Education (ISCED-97)adopted in 1997 by the UNESCO General Conference.
3. eEurope 2002 — An Information Society For All — Action Plan prepared bythe Council and the European Commission, 19–20 June 2000 http://ec.europa.eu/information_society/eeurope/2002/action_plan/pdf/actionplan_en.pdfeEurope 2005 — An information society for all — An Action Plan, 21/22 June2002 http://eur-lex.europa.eu/LexUriServ/LexUriServ.do?uri=COM:2002:0263:FIN:EN:PDF
4. Due to the low schools participation rate in Germany, The Netherlands,the UK and Iceland, data concerning these countries were not consideredrepresentative enough to be included in the analysis.
5. Tablets or tablet computers can be defined as a personal mobile computerlarger than a mobile phone integrated into a flat touch screen and primarilyoperated by touching the screen (Wikipedia).
6. The cluster analysis used to study the issue at stake did not identify a fourthgroup composed of students with great access/use at school and little access/use at home.
REFERENCES
BALANSKAT, A., BLAMIRE, R. & KEFALA, S. (2006) The ICT ImpactReport. A Review of Studies of ICT Impact on Schools (Brussels, EuropeanSchoolnet).
BACIGALUPO, M. & CACHIA, R. (2011) Teacher Collaboration Networks in 2025.What is the Role of Teacher Networks for Professional Development in Europe?(Sevilla, JRC-IPTS).
EUROPEAN COMMISSION (2007) The Key Competences for Lifelong Learning — AEuropean Framework (annex of a Recommendation of the European Parliamentand of the Council of 18 December 2006 on key competences for lifelong learning(Brussels, European Communities).
FREDRIKSSON, U., JEDESKOG, G. & PLOMB, T. (2008) Innovative use of ICT inschools based on the findings in ELFE project, Education & InformationTechnologies, 13, pp. 83–101.
LAW, N., PELGRUM, W. J. & PLOMP, T. (Eds) (2008) Pedagogy and ICT Use inSchools around theWorld.Findings from the IEA International Comparative StudiesSites 2006 (Hong Kong, CERC-Springer).
MMB (2008) Digitale Schule — wie Lehrer Angebote im Internet nutzen (Institut fürMedien- und Kompetenzforschung).
OECD (2008) ICT and InitialTeacherTraining-research. Review Draft (Paris, OECDPublishing).
OECD (2010) Are the new Millennium Learners Making the Grade? Technology Useand Educational Performance in PISA (Paris, OECD Publishing).
26 European Journal of Education, Part I
© 2013 Blackwell Publishing Ltd.

OWSTON, R., (2006) Teachers can make a difference: Professional development as apolicy option for improving student learning with ICT. Paper prepared for theCEIRIS-Keris international Expert meeting on ICT and Educational Per-formance), South Korea, October 16–17, 2007.
PELGRUM, H. (2009) Study on Indicators of ICT in Primary and SecondaryEducation/IIPSE (Brussels, European Commission).
PRENSKY, M. (2004) Digital Game-based Learning (New-York, McGraw-Hill)REDECKER, C., ALA-MUTKA, K., BACIGALUPO, M., FERRARI, A. & PUNIE, Y.
(2009) Learning 2.0: The Impact of Web 2.0 Innovations on Education andTraining in Europe (Sevilla, JRC-IPTS).
SCHEUERMANN & PEDRO, F. (2009) Indicators, Criteria and Benchmarks for Inter-national Comparisons (Luxembourg, OPOCE).
SAVILL-SMITH, C. & KENT, Ph. (2003) The use of palmtop computers forlearning: a review of the literature, in: R. CONDIE & B. MUNRO (2007) TheImpact of ICT in Schools — A Landscape Review (Coventry, BECTA).
STARKEY, L. (2010) Teachers’ pedagogical reasoning and action in the digital age,Teachers and Teaching: theory and practice, 16, pp. 233–244.
UNDERWOOD, J. (2009) The Impact of Digital Technology (Coventry, BECTA).VALIENTE, O. (2010) 1–1 in Education: Current Practice, International Comparative
Research Evidence and Policy Implications. OECD EducationWorking Papers, No.44 (Paris, OECD Publishing).
WASTIAU, P. (2010) Virtual Learning Platforms in Europe: what can we learn fromexperience in Denmark, the United Kingdom and Spain? — A Comparative Over-view (Paris/Brussels, Caisse des dépôts/European Schoolnet).
Patricia Wastiau et al. 27
© 2013 Blackwell Publishing Ltd.