Embed Size (px)
Citation preview
THE USE OF MICRODIALYSIS AND METABOLOMICS TO STUDY
THE BIOMARKER DIFFERENCES BETWEEN DONATION AFTER
CIRCULATORY DEATH (DCD) AND DONATION AFTER BRAIN
DEATH (DBD) LIVER GRAFTS IN ORTHOTOPIC LIVER
TRANSPLANTATION
By
THAMARA PRABHATH RANASINGHE PERERA
A thesis submitted to the University of Birmingham for the degree of
DOCTOR OF MEDICINE
Centre for Liver Studies School of Immunity and Infection
College of Medical and Dental Sciences University of Birmingham
June 2015
University of Birmingham Research Archive
e-theses repository This unpublished thesis/dissertation is copyright of the author and/or third parties. The intellectual property rights of the author or third parties in respect of this work are as defined by The Copyright Designs and Patents Act 1988 or as modified by any successor legislation. Any use made of information contained in this thesis/dissertation must be in accordance with that legislation and must be properly acknowledged. Further distribution or reproduction in any format is prohibited without the permission of the copyright holder.
ABSTRACT
Donor organ shortage is a major barrier to the progress of liver transplantation;
options to widen the donor pool include use of marginal donor grafts and those
from donors after circulatory death (DCD), despite risks of early graft failure. This
thesis studies the key metabolic feature differences between DCD and from donors
after brain death (DBD), using combination of microdialysis for tissue fluid
sampling, and colourimetry, Coularray and Fourier transform ion cyclotron
resistance - mass spectrometry(FTICR-MS) as analytical platforms. The initial study
proved feasibility of above methods to identify metabolic changes through cold
storage to reperfusion, and the involvement of energy and amino acid metabolism
pathways. Comparison of DCD and DBD grafts by microdialysis combined with
colourimetry proved energy depletion, and increased lactate/pyruvate ratio in DCD
grafts. Metabolomic studies consolidated the findings of primary impact on energy
metabolism pathways during cold storage. Both CEAD and FTICR-MS identified key
biomarker differences and the effect on tryptophan and kynurenine pathway, and
this finding was reproduced in all three metabolomic studies conducted. Over
expression of these metabolites in DCD grafts and failed allografts may be related to
energy metabolism, and tryptophan and kynurenine could potentially be developed
as biomarkers predicting liver graft function.

In loving memory of my Mom and Dad
ACKNOWLEDGEMENTS
Work leading to this thesis created several hurdles; a lot of my time was devoted to
the clinical activities in a busy liver transplant unit and this drove my research
ideas. Many people have supported me in my academic and clinical career and I am
grateful for all of them for showing me the path; few stand out! Professor Kemal
Deen, Chair of Surgery at the Medical School of University Kelaniya, Sri Lanka where
I had my undergraduate education was my first role model. Also alumni of
University of Birmingham, he is partly responsible for ethos I follow to date. I am
forever grateful for his teachings and guidance and encouragement to undertake
research work. Professor Darius Mirza at the Liver unit in Birmingham was my
teacher, mentor and my second role model who then became a personal friend with
whom I often share my thoughts. Without his tremendous support I would be
without this academic work or the liver transplant skills. Together, above two
greats influenced my professional career. The third person I am going to
acknowledge is also a fellow countryman who was at the Liver unit in Birmingham
during the days I was hunting for a transplant fellowship. Mr. Michael Silva not only
provided me with the opportunity to join the team in Birmingham, but also set up
the preliminary work and background related to the research presented in this
thesis, continuing from his initial work in microdialysis in liver transplantation. I
did not foresee at the beginning of my career in surgery twelve years ago, any of the
opportunities that have come my way since; “You can’t connect the dots looking
forward; you can only connect them looking backwards…..” – Steve Jobs, Stanford
commencement address, 2005
I am grateful to all my patients willingly consented to interventions and to take part
in the studies outlined in this thesis. Next, I am thankful to all members and
collaborators of our research group; Doug Richards has been exceptionally
supportive of my projects through the years, and Nick Murphy, Mark Viant, Olga
Hrydziuszko, Jennifer Kirvan, Desley Neil all helped me immensely in completing
this work. I am also thankful to the external collaborators; Roger Higdon and
Eugene Kolker from the Bioinformatics and High-throughput Analysis Lab, Centre
for Developmental Therapeutics at Seattle Children’s Research Institute, who
collaborated with me during the data analysis phase. Jean Shaw, Bridget Gunson
and Sue Paris were tolerated my numerous requests of consumables, reagents or
data and I am grateful to them. Former consultants at the liver unit Professor John
Buckels and Mr. David Mayer, along with Mr. Simon Bramhall, Mr. John Isaac and
Mr. Paolo Muiesan, some of them later became my colleagues, were very patient
during my days as a research fellow, and allowed me to insert tiny little catheters in
to the liver grafts used by them. The liver theatres, intensive care unit members and
the ward staff never complained I appreciate their invaluable support throughout.
Also I am thankful to those helped me carry forward the research work based on
what we have uncovered through the studies outlined here, namely Hermien
Hartog, Gary Reynolds, Stefan Hubscher and Jeremy Tomlinson.
All this work was possible because I also had the wonderful support from my family.
The sacrifices made by Nierosha, my soul partner in life, were enormous as she
shouldered all the responsibilities of raising our two little angels while I was
engrossed in work. I must also confess that she constantly reminded me of
completing this thesis, but not always in the appropriate times! I am grateful that
those reminders set targets for me - now that I have completed the thesis I will be
expecting reminders on other things I have conveniently forgotten in life.
Table of Contents
CHAPTER 1 INTRODUCTION ....................................................................................................... 1
1.1 Liver Transplantation ....................................................................................................... 1
1.2 Current issues ...................................................................................................................... 5
1.3 Donor organ shortage ....................................................................................................... 6
1.4 The marginal donor ........................................................................................................... 7
1.5 Graft steatosis ..................................................................................................................... 10
1.6 Donation after circulatory death ................................................................................ 12
1.6.1 Donor warm ischaemia ........................................................................................... 14
1.7 Graft preservation ............................................................................................................ 16
1.7.1 Cold ischaemia ............................................................................................................ 16
1.7.2 Preservation-reperfusion injury .......................................................................... 18
1.8 Primary non-function ...................................................................................................... 19
1.9 Biomarkers predicting graft function ....................................................................... 20
CHAPTER 2 RESEARCH HYPOTHESIS AND STUDY PLAN ............................................. 22
2.1 Research aim ...................................................................................................................... 22
2.2 Research proposal ............................................................................................................ 24
2.3 Study design ........................................................................................................................ 26
2.3.1 The donor operation ................................................................................................ 26
2.3.2 Liver transplantation technique .......................................................................... 28
2.4 Microdialysis....................................................................................................................... 30
2.4.1 Microdialysis in liver transplantation ............................................................... 31
2.4.2 Microdialysis catheter ............................................................................................. 32
2.4.3 Microdialysis Fluid .................................................................................................... 34
2.4.4 Microdialysis pump .................................................................................................. 35
2.5 Technique of Microdialysis ........................................................................................... 35
2.5.1 Microdialysis kit ......................................................................................................... 35
2.5.2 Procedure ..................................................................................................................... 35
2.6 Sampling protocols .......................................................................................................... 37
2.7 Metabolomics ..................................................................................................................... 40
CHAPTER 3 PROOF OF PRINCIPLE: METABOLOMICS IN HUMAN LIVER TRANSPLANTATION .......................................................................................................................... 43
3.1 Liver biopsy and FT-ICR MS metabolomics ............................................................ 44
3.2 Extracellular fluid and CEAD metabolomics .......................................................... 45
3.3 Histology .............................................................................................................................. 47
3.4 Results ................................................................................................................................... 48
3.4.1 Liver metabolism of cold phase vs. post reperfusion .................................. 48
3.4.2 Redox metabolism in microdialysates post reperfusion ............................ 55
3.5 Discussion ............................................................................................................................ 56
CHAPTER 4 CHANGES IN BASIC ENERGY METABOLISM AND KEY DIFFERENCES IN LIVER GRFATS FROM DCD AND DBD DONORS ................................................................. 60
4.1 Introduction ........................................................................................................................ 60
4.2 Methods ................................................................................................................................ 64
4.2.1 Microdialysis analyser and colourimetry ......................................................... 64
4.2.2 Statistical analysis ..................................................................................................... 69
4.3 Patient and graft characteristics ................................................................................. 69
4.4 Results ................................................................................................................................... 71
4.4.1 Interstitial lactate and pyruvate level ................................................................ 71
4.4.2 Glycerol levels ............................................................................................................. 75
4.4.3 Graft outcomes............................................................................................................ 75
4.5 Discussion ............................................................................................................................ 76
CHAPTER 5 KEY METABOLITE FEATURE DIFFERENCES BETWEEN DCD AND DBD LIVER GRFATS IDENTIFIED THROUGH CEAD BASED METABOLOMICS ............ 80
5.1 Introduction ........................................................................................................................ 80
5.2 Coulometric electrochemical array detection (CEAD) ....................................... 81
5.2.1 CEAD sample and data analysis: .......................................................................... 83
5.3 Patients and methods ...................................................................................................... 84
5.4 Results ................................................................................................................................... 86
5.4.1 Overall metabolic activity detected by CEAD ................................................. 86
5.4.2 Bench Samples – Donor Type and Cold Ischemia ......................................... 86
5.4.3 First Reperfusion Sample – Donor Type, Cold and implantation time . 90
5.4.4 Mean of Post Reperfusion Samples – Donor Type, Cold and
implantation time ....................................................................................................................... 92
5.4.5 Differences in Patients with Poor Graft Function patients for Bench,
First Reperfusion and Mean Reperfusion Samples ....................................................... 96
5.5 Summary of main metabolite differences ............................................................... 97
5.6 Discussion ............................................................................................................................ 99
CHAPTER 6 FTICR BASED MASS SPECTROMETRY ANALYSIS OF DCD AND DBD LIVER GRAFTS USED IN CLINICAL LIVER TRANSPLNATATION ................................... 105
6.1 Introduction ..................................................................................................................... 105
6.2 Fourier Transform Ion Cyclotron Resistance – Direct Infusion (FTICR-DI)
mass spectrometry ...................................................................................................................... 107
6.2.1 Basis of FTICR .......................................................................................................... 107
6.2.2 Mass spectrometer ................................................................................................. 110
6.2.3 FTICR data analysis ................................................................................................ 112
6.2.4 FTICR data: Statistical analysis ......................................................................... 114
6.2.5 Putative assignment of metabolites ................................................................ 115
6.3 Patients and graft characteristics ............................................................................ 116
6.4 Changes in hepatic metabolism during transplantation ................................ 118
6.5 Hepatic metabolism in DBD compared to DCD grafts ..................................... 122
6.6 Discussion ......................................................................................................................... 127
CHAPTER 7 CONCLUDING REMARKS AND FUTURE WORK ...................................... 129
7.1 Graft function and energy metabolism .................................................................. 129
7.1.1 Re-charging the energy status of liver grafts as an option for successful
liver transplantation .............................................................................................................. 131
7.1.2 Insulin, insulin like growth factor-I (IGF-I) and liver ............................... 132
7.1.3 Insulin resistance and liver transplantation ................................................ 136
7.1.4 Energy metabolism and Insulin resistance could be the cause of graft
failure in steatotic grafts ....................................................................................................... 137
7.2 Biomarkers of poor graft function .......................................................................... 138
7.3 Summary of future directions ................................................................................... 140
CHAPTER 8 END PAGES ........................................................................................................... 141
8.1 APPENDICES .................................................................................................................... 141
8.1.1 Appendix 1 ................................................................................................................ 142
8.1.2 Appendix 2 ................................................................................................................ 143
8.1.3 Appendix 3 ................................................................................................................ 144
8.1.4 Appendix 4 ................................................................................................................ 145
8.2 BIBLIOGRAPHY ............................................................................................................... 146
List of Illustrations
Figure 1-1: Global liver transplant activity (source - Global observatory on Donation and Transplantation); in most of the countries where there is busy transplant activity the organ donor sources are cadaveric than live donation ...................................................... 4
Figure 1-2: Trends of organ donation in the United Kingdom; the average donor age is increased over past ten years and majority of the organ donor pool is over 50years of age .............................................................................................................................................................. 9
Figure 1-3: Changing demographics of organ donation in the United Kingdom; there is progressive increase of organ donors with BMI over 30 denoting significant proportion of donors are likely to be marginal .......................................................................... 10
Figure 2-1: The processes involved in the liver transplantation from the donor to the recipient; graft ischaemia is inevitable outcome leading poor or good graft function providing space for the investigation of metabolic differences between these two outcomes ................................................................................................................................................... 25
Figure 2-2: The microdialysis catheter with its components ............................................... 33
Figure 2-3: the components of a microdialysis catheter (reproduced from CMA microdialysis) .......................................................................................................................................... 33
Figure 2-4: Schematic representation of the sampling end of the microdialysis catheter; the perfusate enter the sampling end through the inner core which equilibrates with the solutes within the interstitial space as it runs through the outer tube (Perera BJS 2014) ........................................................................................................................ 34
Figure 2-5: Insertion of microdialysis catheter in to the liver graft during bench phase sampling; the catheter is held in place with a pair of forceps while the splittable introducer (light blue handles) is gently withdrawn .......................................... 36
Figure 2-6: Microdialysis catheter in-situ in a transplant recipient; the catheter has been introduced at the level of falciform ligament directed towards the segment IV of the liver graft; a superficial suture used to secure the microdialysis catheter to the falciform ligament ................................................................................................................................. 37
Figure 2-7: The Menghini biopsy needle used for allograft biopsy sampling during the cold storage and post reperfusion; needle supplied with blocking pin that prevent suction of biopsy material to the syringe, trocar and obturator (from Dixon surgical Instruments, UK) .................................................................................................................................... 38
Figure 2-8: study of metabolomics and different approaches; the diagram illustrates that that the entire metabolome cannot be studied by one analytical platform alone and combination of techniques may be used to detect metabolites according to the particle size present [adapted from Van der Greef et al. "The role of metabolomics in systems Biology", In: Metabolic Profiling, Kluwer (2003)] ................................................... 41
Figure 3-1: Principle analysis scores plot for liver biopsy spectra in the positive and negative ion mode; cold phase (green) and post reperfusion (red) showing an expected separation between spectra from liver biopsies in each phase is shown but within each phase close clustering could be seen ..................................................................... 48
Figure 3-2: Principle score analysis plot for CEAD time course data. First time point for each patient is on the right as also indicated by the patient labels and time trajectory for the samples from each patient follows a similar trend ............................... 55
Figure 3-3: Principle scores plot for CEAD time course data (first time point for each patient is on the right, as also indicated by the patient label) showing that the metabolism following reperfusion changed rapidly to stabilize nearly 21hrs post reperfusion ............................................................................................................................................... 56
Figure 4-1: Mean (standard error of mean) of lactate, pyruvate and calculated lactate: pyruvate ratio; showing initial high levels. Lactate/pyruvate ratio was initially high in the immediate post reperfusion period and then dropped to baseline levels .......... 63
Figure 4-2: The ISCUS microdialysis analyser (reproduced from product note ISCUSfelx.pdf http://www.mdialysis.com/analyzers/iscusflex-for-point-of-care) .... 64
Figure 4-3: chemical reactions leading to the colorimetric detection of lactate present within sample by the microdialysate analyser ........................................................................... 66
Figure 4-4: Chemical reactions leading to the detection of pyruvate concentration of a sample by the microdialysate analyser ......................................................................................... 67
Figure 4-5: Chemical reactions leading to the detection of glycerol concentration of sample by the microdialysate analyser ......................................................................................... 68
Figure 4-6: Median lactate levels in microdialysate samples obtained from cold phase sampling through to 48hours post reperfusion; comparison between graft types (p<0.05) ..................................................................................................................................................... 72
Figure 4-7: Median pyruvate levels in microdialysate samples from cold storage sampling through to 48hours post reperfusion; comparison between graft types showing that both DCD and DBD grafts had lower levels pyruvate (p=n.s) at the end of the cold storage and these were progressively replenished upon reperfusion. ...... 73
Figure 4-8: Comparison between calculated lactate/pyruvate ratio between DCD and DBD grafts during the cold phase sampling; DCD grafts had greater energy depletion represented by higher lactate/pyruvate ratio in the cold phase (p<0.05) ..................... 74
Figure 4-9: comparison of lactate/pyruvate (median) trends between the DCD and DBD grafts from cold storage through to 48hours post reperfusion; the higher lactate pyruvate ration present in the DCD grafts in the cold phase rapidly reversed and comparable ratios are seen upon reperfusion ........................................................................... 74
Figure 4-10: Comparison of median glycerol levels between DCD and DBD grafts from cold storage through to 48hours post reperfusion; DCD grafts had non-significantly elevated interstitial glycerol levels ....................................................................... 75
Figure 4-11: Comparison of median lactate/pyruvate levels of failed allografts due to poor function against those with successful outcomes; the bottom straight line represents the median values for lactate/pyruvate in all successful grafts, and the failed allografts showed greater lactate/pyruvate ratios compared with successful grafts ........................................................................................................................................................... 76
Figure 5-1: The curve displays the percentage of mobile phase B in the eluent over the 45 minute time period for each sample injection, the remainder being mobile phase A (Perera et al. 2014a) ............................................................................................................ 82
Figure 5-2: Heat map of normalised metabolite expression values; columns represent patient samples (Red - DBD, Blue - DCD) and rows represent the metabolite peaks labeled by their retention time. Samples and peaks are clustered by expression patterns (Perera et al. 2014a) ........................................................................................................... 88
Figure 5-3: Overall trend of selected metabolites with cold ischaemia time elapsed against metabolite intensity for the cold storage samples .................................................... 89
Figure 5-4: Trend of cold ischaemia time with metabolic intensity (selected metabolites) for the first reperfusion samples (Blue corresponds DBD donors, Orange DCD donors) through CEAD analysis of microdialysate samples. ...................... 91
Figure 5-5: Trends of implantation time with metabolic intensity observed in the first reperfusion samples (Blue corresponds to DBD donors, Orange DCD donors) ............ 92
Figure 5-6: Trend of cold ischemia time with metabolite intensity for the mean of reperfusion samples. Blue corresponds to DBD donors and orange DCD donors. ...... 94
Figure 5-7: Trend of warm ischemia time with metabolite intensity for the mean of post reperfusion samples. Blue corresponds to DBD donors and orange DCD donors. ....................................................................................................................................................................... 95
6-1: The schematic representation of basis of FTICT mass spectrometry (source: Department of Biosciences, University of Birmingham) ..................................................... 109
6-2: Typical example of a FTICR mass spectrometry pattern showing different metabolite peaks according to the respective m/z ratio ..................................................... 110
6-3: The Thermo LTQ FT Ultra mass spectrometer with key elements labeled (Image courtesy – Jennifer Kirwan, Department of Biosciences, University of Birmingham) .................................................................................................................................................................... 111
Figure 6-4: Example chromatogram from FTICR-MS assay of a sample used in the study; the relative abundance is of a metabolite identified by m/z ratio is represented in the Y-axis ........................................................................................................................................... 114
Figure 6-5: Principle component analysis scores plot showing the similarities and
differences between the metabolic profiles of the grafts in donor (T0), cold (CP, T1) and
post-reperfusion phases (PR, T2). Donor and post-reperfused biopsies cluster together and
have distinctive metabolic profiles compared to the cold-phase biopsies, indicative of the
rapid resumption of the biochemical functions in the post-reperfused grafts in the direction
of the ‘healthy’ donor grafts. ............................................................................................................. 120
Figure 6-6: Principle component analysis scores plots highlighting the metabolic
separation of the DBD and DCD grafts in the cold phase (CP) and separately the post-
reperfusion phase (PR), based on analyses of just the 50 and 64 peaks identified as being
significantly different (between DBD and DCD) for the CP and PR groups, respectively.
.................................................................................................................................................................... 123
Figure 6-7: The differences between tryptophan and kynurenine in failed allografts due to primary non-function (n=2) vs. other allografts (n=36) in the cold phase (grey) and post reperfusion (blue). The data show the relative abundances of the metabolites with 95% confidence intervals (statistics not applied due to limited sample size ............................................................................................................................................ 126
7-1: the mechanisms of actions of hormones insulin, insulin like growth factor-I (IGF-I) and IGF binding protein (IGFBP) .............................................................................................. 134
List of Tables
Table 3-1: Demographics, timings of liver allograft biopsy, total cold ischaemia times and period of reperfusion established prior to the T2 biopsy, combined with intra-operative parameters and outcomes of the graft recipients in the study........................ 46
Table 3-2: Histological grading of graft steatosis (microvesicular and macrovesicular) of the grafts used in the proof-of-principle study. Macro and micro-vesicular steatosis is expressed as a percentage during cold phase and post reperfusion biopsy samples and an increase in microvesicular steatosis is noted in post reperfusion samples whereas macro-vesicular steatosis remains somewhat unchanged ................................. 47
Table 3-3: Putatively identified metabolites for peaks within 1% top PC1 loadings in FTICR analysis, smallest p values largest (up and down) fold changes ........................... 50
Table 3-4: Peaks identified in the KNN algorithm (successful vs. unsuccessful grafts) with putative metabolite assignments and corresponding KEGG pathways; fold change calculated as mean of successful peak divided by mean of unsuccessful field level ............................................................................................................................................................. 52
Table 4-1: Demographics of liver transplant recipients, donors and liver allografts between DCD and DBD groups in the study group; both groups are comparable for donor, graft and operative characteristics apart from the dWIT ........................................ 70
Table 5-1: The recipient demographics, donor demographics and graft characteristics including steatosis, ischaemia times and degree of ischaemia reperfusion of assessed by histological grading following reperfusion ............................................................................ 87
Table 5-2: Significant metabolite differences (metabolite denoted by corresponding retention time) between DCD and DBD grafts during cold storage sampling ............... 89
Table 5-3: Main differences observed in 1st reperfusion microdialysis sample; metabolites identified by retention time peak ........................................................................... 90
Table 5-4: Key metabolite differences for Mean of post reperfusion samples (6-48hours) through CEAD analsys; metablites identified by retention time ..................... 93
Table 5-5: Overall metabolite peak differences of failed allografts and expression ratio of such peaks. The peak at 10.23minutes has the highest expression ratio and identified as kynurenine ..................................................................................................................... 96
Table 5-6: Summary of key metabolites and differences observed in during each phase post reperfusion with relevance to the different graft types. .................................. 98
Table 6-1: The characteristics and basic demographics of the recipients undergoing liver transplantation. ......................................................................................................................... 117
Table 6-2: Top putatively annotated metabolic fold-changes (FC) in the liver grafts
between donor phase (D, T0), cold phase (CP, T1) and post-reperfusion phase (PR, T2),
considering the DBD and DCD biopsies as one group. ............................................................ 121
Table 6-3: Top putatively annotated metabolic fold-changes between the DCD and DBD
grafts: combined results for the comparison, (i) in the cold phase (CP, T1), (ii) following
reperfusion (PR, T2), and (iii) in response from going from CP (T1) to PR (T2) ............... 122
Table 6-4: Metabolic pathways discovered to differ significantly between DCD and DBD
grafts, including the associated putatively annotated metabolites in those pathways. ..... 125
ABBREVIATIONS
3-NT 3-Nitrotyrosine
ALD alcoholic liver disease
AMP adenosine monophosphate
ANOVA analysis of variance
AST aspartate transaminase
ATP adenosine triphosphate
BMI body mass index
CEAD coulometric electrode array detection
CIT cold ischaemia time
CP cold phase
DBD donation after brain death
DCD donation after circulatory death
DCHBS 5-dichloro-2-hydroxy-benzene sulphonic acid
DIMS direct injection mass spectrometry
dWIT donor warm ischaemia time
ESLD end stage liver disease
FTICR Fourier transform ion cyclotron resonance
GC gas chromatography
GH growth hormone
GMP Guanosine monophosphate
HBV hepatitis B virus
HCV hepatitis C virus
HMMA 4-Hydroxy-3-methoxymandelic acid
HoS Hyper-osmolar solution
HPLC High Performance Liquid Chromatography
IDO indoleamine 2-3 dioxygenase
IGF-1 insulin like growth factor-I
IGF-1R insulin like growth factor-I receptor
IGFBP insulin like growth factor binding protein
IGL-1 Institut Georges Lopez-1
IPF initial poor function
IR insulin receptor
ITBL ischaemic type biliary lesions
L/P ratio lactate:pyruvate ratio
LC liquid chromatography
LDLT live donor liver tranplant
MELD model for end stage liver disease
MS mass spectrometry
NASH non-alcoholic steatohepatitis
NHSBT National health service blood and transplant
NMR nuclear magnetic resonance
NODAT new onset diabetes after transplantation
NTI non-thrombotic infarction
OLT orthotopic liver transplantation
PBC primary biliary cirrhosis
PCA principle component analysis
PCLD polycystic liver disease
PNF primary non-function
POD Peroxidase
PR Post-reperfusion
PRI post reperfusion injury
PSC primary sclerosing cholangitis
ROS reactive oxygen species
SAM S-adenosyl methionine
SIM selected ion stitching
TDO tryptophan 2-3 dioxygenase
TM transformation mapping
UW University of Wisconsin
1
CHAPTER 1 INTRODUCTION
1.1 Liver Transplantation
The history of liver transplantation in humans goes back over half a Century and no
other surgical procedure has undergone transformation from its original description
to what it is today (Starzl et al. 1963). Other than the technical successes of this
operation, the complexity of patients, the overall post operative care including
immunosuppressant management (Iwatsuki et al. 1988;Todo et al. 1990) and
prevention of both immune and infective complications that were primary barriers
have dramatically changed in the past 50 years(Calne et al. 1979). When the first
attempt of liver transplantation was made 1963 albeit unsuccessfully, the graft taken
from a cadaveric donor confirmed after circulatory death and the transplant
operation did not see the anticipated success (Starzl, Von Kaulla, Hermann, Brittain,
& Waddell 1963). Two years on from the undesired outcome the first successful
transplant operation was carried out however the initial success was limited to only
28% patient survival in the first one year (Starzl et al. 1979). The progress made in
the field of liver transplantation in the last five decades is probably incomparable to
other branches in medicine. In the early era, liver transplantation was considered a
huge undertaking with significant risks of mortality. Bleeding was the primary
concern in those candidates undergoing transplantation, primarily related to the
poor coagulation status resulting from the chronic liver damage and portal
hypertension (Bontempo et al. 1985). In addition alternative techniques developed
for explanation of the damaged liver, for example by-passing both portal and
systemic circulation (Shaw Jr et al. 1984), in addition to the technological innovations
that also have contributed to the success (Starzl et al. 1985).
Liver transplantation was initially introduced as the treatment of choice for end
stage liver disease (ESLD). With the successful results and acknowledgement of these
by the medical community not only caused a surge in patients with ESLD referred for
transplantation, but also widened the indications for liver transplantation
2
(Neuberger 2004). Chronic hepatitis virus infection (Hepatitis B and C) is a global
health problem and majority of these patients ended up with ESLD or primary liver
cancer (hepatocellular carcinoma) on the background of cirrhosis (Bismuth et al.
1987). Currently, a significant proportion of patients undergoing liver
transplantation are comprised of primary liver tumours (Iwatsuki et al.
1985;Mazzaferro et al. 2008). Diagnostic accuracy in detection of early primary liver
cancer, newer contrast agents have contributed to huge expansion of cancer patient
group (Colli et al. 2006). Alcohol is a universal problem and up to one fifth of liver
transplant recipients had alcohol related aetiology for treatment (Neuberger 1989).
In addition to those with chronic ESLD, acute hepatic insufficiency or failure was also
considered an excellent indication for transplantation. In a majority of patients with
acute liver failure, the physiological and biochemical sequelae could be only reversed
by liver replacement as the chances of hepatic regeneration is remote in most of
these cases (O'Grady et al. 1991). More indications for liver transplantation included
metabolic disorders, where the actions of some of the enzyme defects or metabolic
pathways have actions on other end organs resulting in disability or disease status.
In this group of patients, the structural and normal hepatic synthetic capacity is
essentially normal apart from the presence of defective metabolic pathways due to
genetic mutations. Urea cycle defects (Saudubray et al. 1999), familial amyloidosis
(Holmgren et al. 1993)and primary hyper-oxaluria are classic examples for these
metabolic disorders (Watts et al. 1991). All of these new additions to the liver
transplant indications have caused the transplant wait listed patients to grow.
Apart from the survival advantages resulting from liver transplantation,
improvement in quality of life following a successful operation is remarkably
different to other forms solid organs transplant. Physical status, sexual health and
social functioning are remarkably better after liver transplantation (Bravata et al.
1999). Some of these results are attributed to the metabolic and biological changes
brought about by the graft, nevertheless the reduced allogenicity and immune-
protective capabilities of the liver is primarily responsible for reduced incidence of
acute cell mediated or antibody mediated immune responses. As a result the majority
of patients could be managed with lower levels of maintenance immunosuppression
3
without the need for more frequent or intense monitoring. Of course the advent of
newer immunosuppressive medication, in particular calcineurin inhibitors and
tacrolimus further improved the long term outcomes of liver transplantation and the
short term survival figures improved from 60-70% at 85-90% following these
developments (Wiesner 1998) .
Currently liver transplantation accounts for the second most frequent organ
transplanted in solid organ transplantation programs worldwide, and second only to
renal transplantation. In the year 2012 alone, nearly 24 000 liver transplants were
performed in 68 countries across the world according the data from the Global
Observatory of Organ Transplantation (www.transplant-observatoryorg). In the
United Kingdom there has been a steady increase the transplant activity in the recent
past and nearly 800 liver transplants were performed in the year 2012/2013. And
according to the National Health Service Blood and Transplant (NHSBT), the
regulatory body in the United Kingdom for organ transplantation, the increase in the
liver transplant activity is on the rise over the recent years and the projected number
of transplants by 2020 is expected to be around 1000.
Most of the transplant programs are reliant on cadaveric donors for the supply of
organs. In these countries the concept of brain death or brain stem death is widely
accepted and legalised to ensure the organ donation process is ethically and
medically acceptable (Truog and Robinson 2003). Most of the countries in Europe
and America have accepted cadaveric organ donation. However, in some other
countries there are barriers to cadaveric organ donation and these are primarily due
religious, ethical and psychological issues concerning the confirmation of death
(Horton and Horton 1990). In those countries therefore the only form of organ
donation is live donation. Liver transplantation using a hemiliver or segmental graft
from a live donor itself is a technical advancement that was mastered by surgeons in
the past two decades, enabled by our current understanding of segmental anatomy,
blood supply and drainage of liver (Azoulay et al. 2001;Tanaka et al. 1993). In 13
countries in the world, the live donor liver transplant activity exceeds the cadaveric
transplant activity (figure 1-1) and the results of live donor liver transplantation are
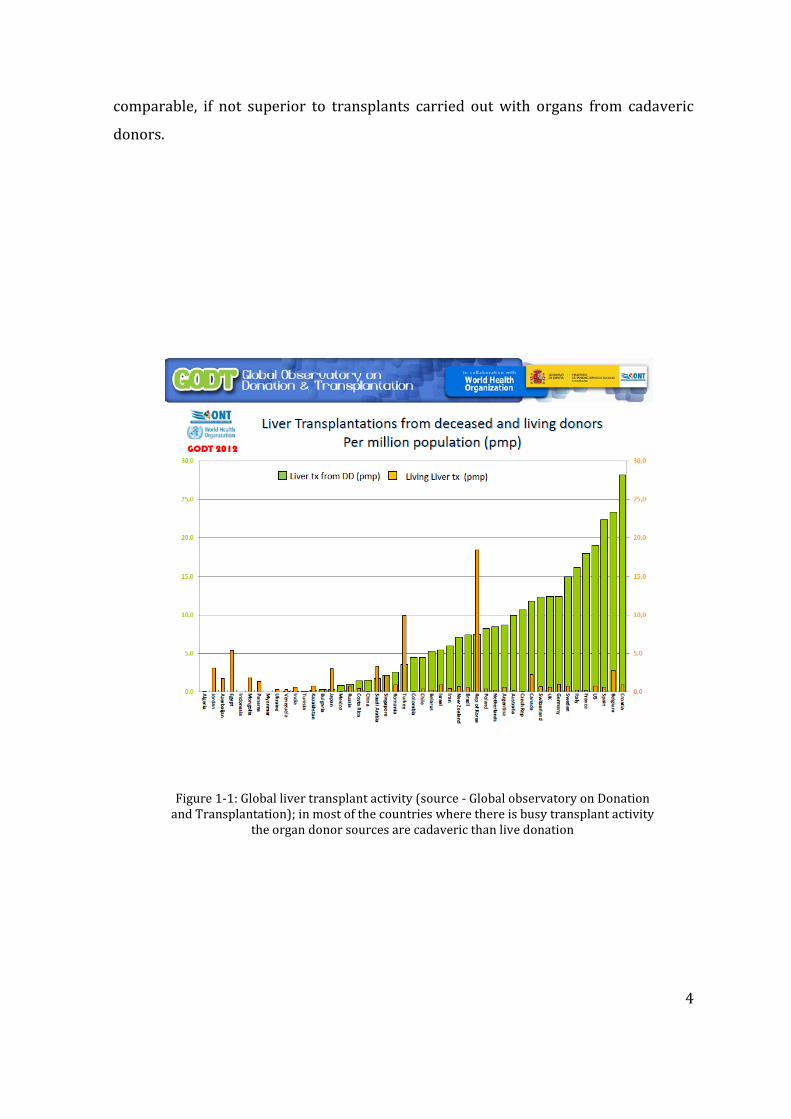
4
comparable, if not superior to transplants carried out with organs from cadaveric
donors.
Figure 1-1: Global liver transplant activity (source - Global observatory on Donation and Transplantation); in most of the countries where there is busy transplant activity
the organ donor sources are cadaveric than live donation
5
1.2 Current issues
Increased number of patients added to the liver transplant wait list is a global trend
(Kim et al. 2006). This growing demand for organs is a problem not limited to the
prospective liver transplant candidates alone, but affects all other solid organ
transplant recipients on the wait lists. The increase in demand for the organs is due
to many reasons, and foremost is the reliability of solid organ transplantation as the
best modality of treatment over other conservative and less invasive procedures.
Transplantation makes a patient less dependent on organ support measures which
require repeated hospital admission, incurring significant loss in the quality of life
and also associated with huge financial burden to the patients as well as healthcare
institutions, whereas organ transplantation makes less dependency on the health
care resources during the follow up and more independence with return to normal
social life.
The current organ supply however does not meet the demand, leaving a widening
gap between the organ supply and the demand. It is estimated that current
transplant activity caters only about 10% of those in need of a solid organ transplant
according to world wide data. With regards to liver transplantation, this gap cannot
be filled by cadaveric donor sources alone, therefore the transplant centers
pioneered cadaveric transplant activity also have taken up liver donation as a
supplemental organ source to meet the demand. In the Europe and America there
has been an increase in liver donor transplant activity in the past decade that
accounts up to 5.2% and 13.4% of total liver transplants respectively. This is in
contrast to the 83.5% of peak liver transplant activity reported in the Middle East
and Asia.
In addition to live liver donation as a solution to organ shortage, many other
strategies have been introduced primarily through surgical innovation and
understanding disease aetiologies. These include split liver transplantation, the
cadaveric counterpart of liver donation. The advantage of split liver transplantation
is such that it yields two unequal grafts which could especially benefit those
recipients disadvantaged in organ allocation systems due to the smaller body size
6
(Azoulay, Castaing, Adam, Savier, Delvart, Karam, Ming, Dannaoui, Krissat, & Bismuth
2001). Primarily paediatric liver transplant recipients benefit from split liver
transplantation, and probably the only source of organs in those programs solely
reliant on cadaveric organ donation. Moreover, split liver transplantation has moved
one further, and full left-right split may even benefit two adult recipients (Gundlach
et al. 2000). Domino liver transplantation is for of organ exchange between patients
where a diseased liver explanted from a recipient is (ex. Familial amyloid
polyneuropathy) transplanted to another recipient who is in dire need of a graft
(Wilczek et al. 2008). There a risk of disease transmission from the domino donor to
the domino recipient in this case, however overall benefits of liver transplantation in
the domino recipient outweigh the risks of disease transmission.
Although these pioneering surgical techniques have added extra organs to the
cadaveric donor pool the gap between the net organ supply and demand has not
been reduced. The impact caused by these innovative techniques is probably
insignificant when applied to the global situation of organ donation. Therefore the
major current issue faced by the global transplant community, donor organ shortage
still remains a significant issue without a definitive solution.
1.3 Donor organ shortage
As discussed above the pioneering cases of experimental liver transplantation were
performed with donors following cardiac death, but towards the end of the first
decade after liver transplantation was introduced, the concept of “brain stem death”
determination was universally accepted by many centers in the world (Veith et al.
1977;Youngner et al. 1989). Catastrophic brain injury due to spontaneous or
traumatic events caused irreversible brain injury and despite this the organs of the
rest of the body functioned for a period of time as long as the vital organs are kept
alive by advanced intensive care based medical management through organ support
(Frowein et al. 1989). Once the medical support is discontinued these patients
progress to natural death, hence the neurological death confirmed by brain stem
death criteria was considered a synonym of natural death (Kaste et al. 1979). It was
7
then accepted that these patients could potentially donate their organs and the
organs from these prospective donors remain alive until the time of organ
procurement. This was a major shift in organ donation practice that changed the
transplantation practice and by the late 20th Century the majority of the organs
donors were those following brain stem deaths (DBD).
Perception of LDLT as a suitable organ source for liver graft shortage was accepted at
difference paces by many, and there were clear geographical variations. Primarily the
Far East and Eastern countries where there is legislative, infrastructural or religious
barriers to cadaveric donation, LDLT was the only viable organ donor source. In the
Western world LDLT was considered a supplementary donor organ source to
existing cadaveric transplant programs and the contribution to the overall donor
pool is low (Schemmer et al. 2005). Ethical considerations of donor morbidity and
mortality were considered major obstacles in the western world for rapid
dissemination and wide embrace of LDLT practice. Instead, the majority of these
centers relying on cadaveric programs explored the use of more marginal donor
organs that were earlier deemed unsuitable for transplantation.
1.4 The marginal donor
The majority of the donors confirming to the criteria of brain stem death
determination were initially comprised from victims of catastrophic neurological
events (Kompanje et al. 2011). The success in the surgical field of liver
transplantation, research in to new drug developments and anti-rejection strategies,
better understanding of immunological mechanisms in the transplantation field was
perhaps parallel to the other developments of socio-economic aspects of the society,
and these include improved road networks, industrialization and expansion of
automobile industry that saw the increased road travel (Park 2004). Road accidents
were common and young victims of such road accidents were confirmed brain dead
and constituted the majority of donors in the late 20th Century (Bendorf et al. 2012).
8
Being young individuals devoid of other co morbidities, the quality of the liver graft
and other solid organs donated by these patients were considered the best in quality
and the numbers were sufficient to provide the organs required for transplant
programs starting to practice liver transplant procedure. As the transplant wait lists
grew and in parallel safety measures were introduced in the automobiles which
reduced the number of accident victims. The resulting outcome was a widening
disparity between the supply and the demand for organs.
The epidemiology of organ donation has gone through a paradigm change over the
last couple of decades (DeCarlis et al. 1996;Summers et al. 2010). The young, healthy
and fit donor population has been replaced by more elderly, obese donor population
with other co-morbidity (Attia et al. 2008). Increased life expectancy from the
advanced medical management is one reason. Changing lifestyle, socio-economic
status, cultural and behavioral patterns including substance use is different in the
current era. This means the catastrophic neurological events that fulfill the criteria to
be tested for brain stem death are either spontaneous brain bleeding or infarctions in
group of patients who are also likely to have other co morbidity like hypertension,
diabetes, obesity or other metabolic disorders. The organ donation situation has
therefore changed from a donor pool consisting a younger donor pool in the late 20th
Century to a more elderly donor population in the recent past (Borchert et al.
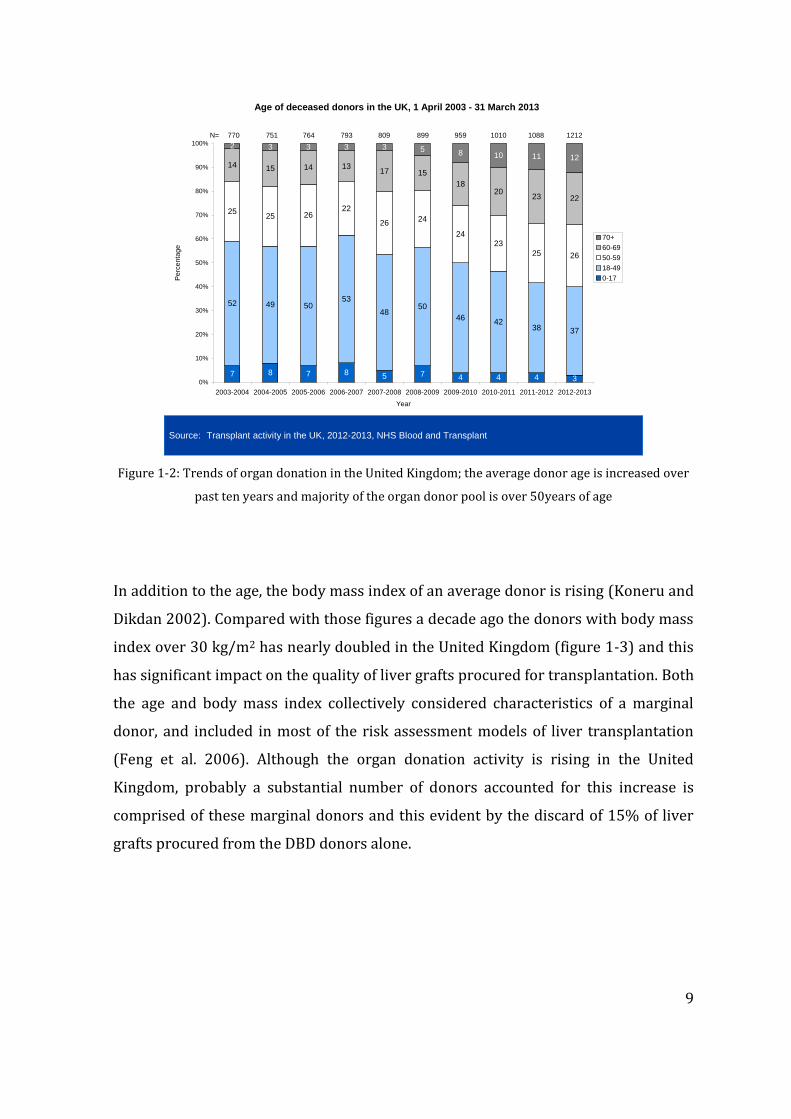
2005;Cohen et al. 1997). The data from the United Kingdom is a fine example to this
phenomenon where the younger donor population was gradually replaced by more
elderly donors. Over the past decade the donors under 50 years have reduced from
59% to 42%, an almost 50% drop in the young donors in the United Kingdom in 10
years (figure 1-2).
9
7 8 7 8 5 7 4 4 4 3
52 49 5053
4850
4642
38 37
2525 26
22
2624
2423
25 26
14 15 14 1317 15
1820
23 22
2 3 3 3 3 5118 10 12
0%
10%
20%
30%
40%
50%
60%
70%
80%
90%
100%
2003-2004 2004-2005 2005-2006 2006-2007 2007-2008 2008-2009 2009-2010 2010-2011 2011-2012 2012-2013
Year
Pe
rce
nta
ge
70+
60-69
50-59
18-49
0-17
Age of deceased donors in the UK, 1 April 2003 - 31 March 2013
770 751 764 793 809 899 959 1010 1088 1212N=
Source: Transplant activity in the UK, 2012-2013, NHS Blood and Transplant
Figure 1-2: Trends of organ donation in the United Kingdom; the average donor age is increased over
past ten years and majority of the organ donor pool is over 50years of age
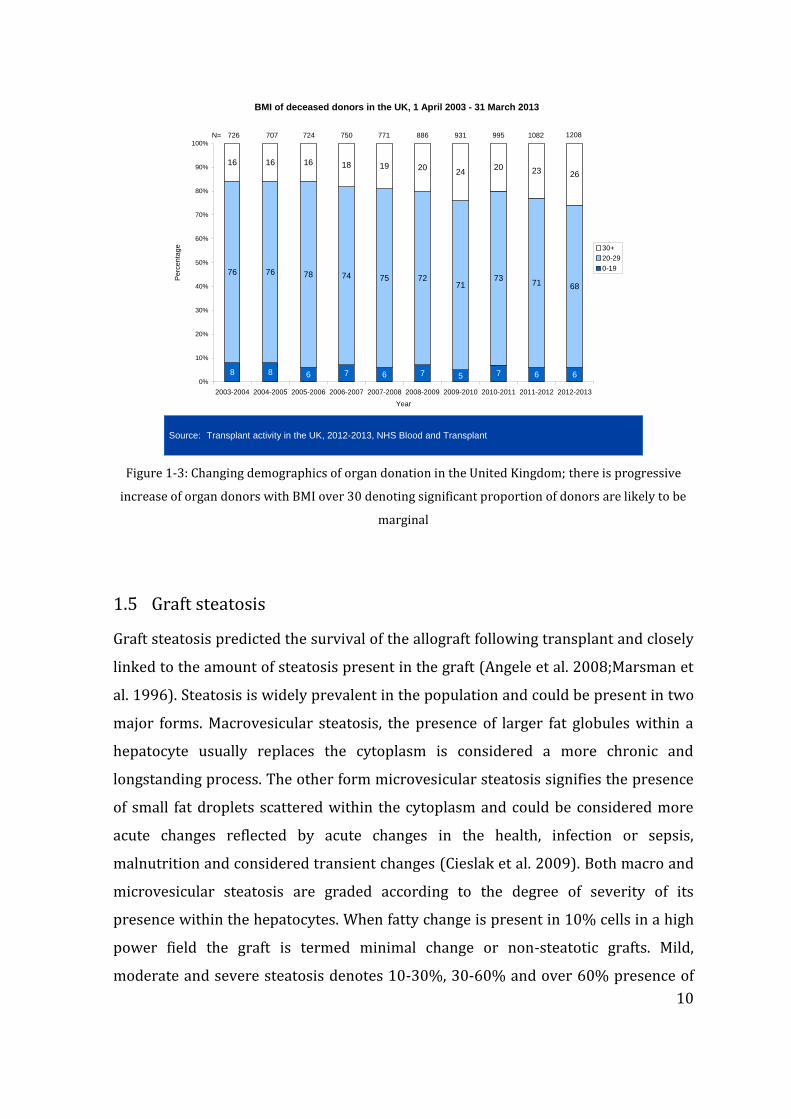
In addition to the age, the body mass index of an average donor is rising (Koneru and
Dikdan 2002). Compared with those figures a decade ago the donors with body mass
index over 30 kg/m2 has nearly doubled in the United Kingdom (figure 1-3) and this
has significant impact on the quality of liver grafts procured for transplantation. Both
the age and body mass index collectively considered characteristics of a marginal
donor, and included in most of the risk assessment models of liver transplantation
(Feng et al. 2006). Although the organ donation activity is rising in the United
Kingdom, probably a substantial number of donors accounted for this increase is
comprised of these marginal donors and this evident by the discard of 15% of liver
grafts procured from the DBD donors alone.
10
8 8 6 7 6 7 5 7 6 6
76 76 78 74 75 7271
7371 68
16 16 16 18 19 2024
20 23 26
0%
10%
20%
30%
40%
50%
60%
70%
80%
90%
100%
2003-2004 2004-2005 2005-2006 2006-2007 2007-2008 2008-2009 2009-2010 2010-2011 2011-2012 2012-2013
Year
Pe
rcen
tag
e 30+
20-29
0-19
BMI of deceased donors in the UK, 1 April 2003 - 31 March 2013
726 707 724 750 771 886 931 995 1082 1208N=
Source: Transplant activity in the UK, 2012-2013, NHS Blood and Transplant
Figure 1-3: Changing demographics of organ donation in the United Kingdom; there is progressive
increase of organ donors with BMI over 30 denoting significant proportion of donors are likely to be
marginal
1.5 Graft steatosis
Graft steatosis predicted the survival of the allograft following transplant and closely
linked to the amount of steatosis present in the graft (Angele et al. 2008;Marsman et
al. 1996). Steatosis is widely prevalent in the population and could be present in two
major forms. Macrovesicular steatosis, the presence of larger fat globules within a
hepatocyte usually replaces the cytoplasm is considered a more chronic and
longstanding process. The other form microvesicular steatosis signifies the presence
of small fat droplets scattered within the cytoplasm and could be considered more
acute changes reflected by acute changes in the health, infection or sepsis,
malnutrition and considered transient changes (Cieslak et al. 2009). Both macro and
microvesicular steatosis are graded according to the degree of severity of its
presence within the hepatocytes. When fatty change is present in 10% cells in a high
power field the graft is termed minimal change or non-steatotic grafts. Mild,
moderate and severe steatosis denotes 10-30%, 30-60% and over 60% presence of
11
steatosis of the graft and this classification is generally used for both types of
steatosis.
Macrovesicular steatosis is a known risk factor for liver allograft failure, and the
impact from microvesicular steatosis alone is considered not significant as an
independent predictor (Salizzoni et al. 2003). Generally the moderate or severe
steatosis is associated with over 30% risk of graft failure following liver
transplantation (Marsman, Wiesner, Rodriguez, Batts, Porayko, Hay, Gores, & Krom
1996). Macrovesicular steatosis also does impact independently on graft function
immediately after transplantation; the degree of steatosis is directly proportionate to
graft dysfunction (Perez-Daga et al. 2006). Moreover, macrovesicular steatosis may
interact with other variables of the donor. For example, a mildly steatotic graft from
an elderly donor may act in synergistic manner and the outcome following
transplantation may be worse than that of a moderately steatotic liver from a
younger donor (Busquets et al. 2001). The decreased plasma membrane fluidity in
the sinusoidal lining cells after cold storage has been postulated as the mechanism of
injury causing liver dysfunction attributable to graft failure (Fukumori et al. 1999).
The organ discard rate after procuring with intention to transplantation is
increasingly high due to the presence of steatosis. As discussed previously most of
these donors consist of elderly or obese donor population which is a significant
problem faced by transplant surgeons. Despite the results of steatotic liver grafts are
known to be poorer than the healthy liver grafts, the transplant surgeons are
compelled to the use these grafts in a more selective manner to relieve burden on
transplant wait list (McCormack et al. 2007).
The use of steatotic grafts in liver transplantation with success was partly related to
the progressive attitude of transplant surgeons willing to push the boundaries
(Imber et al. 2002;Mirza et al. 1994) and accept graft offers deemed unsuitable for
transplantation by others. The data generated through this approach has other
centers explore the maximum utility of donor organ pool (Verran et al. 2003).
Furthermore, characterization of degree of graft dysfunction based on traditional
biochemical criteria helped differentiate early poor outcomes and more intensive
12
management of patients receiving these grafts (Tekin et al. 2004). Various scoring
systems have been developed to describe the marginality of a donor allografts and
almost all of these incorporate graft steatosis (Axelrod et al. 2007;Dutkowski et al.
2012); however apart from retrospective comparison of experience between
difference transplant programs etc, the real time utility of these scoring systems in
the actual day to day decision making is limited.
1.6 Donation after circulatory death
Organ donation after circulatory death (DCD), also previously known as non-heart
beating donation is not a new concept in the field of organ transplantation (Kootstra
1997)and at the beginning of this chapter introduced that historical attempts of
experimental organ transplantation were carried out with organ procured from
cadavers. Even prior to the era where concepts of organ preservation was
introduced, experiments involved transplantation of organs from cadaveric donors,
and not surprisingly the transplant operations carried out with these “post-mortem”
organs did not succeed. The initial outcomes may have been hindered by the inferior
quality of these grafts, because the cessation of circulatory function is associated
with abrupt cessation of metabolic functions within of the cells within a tissue, with
eventual energy exhaustion and widespread cell death or necrosis.
The practice of organ donation from DCD donors faded during the 1960’s and 1970’s
and the organ donor pool during this era primarily consisted of DBD donors. By this
time transplant professionals had refined and gained a significant experience in liver
transplant techniques. The improved quality of life gained by liver transplantation
attracted the interest and the better outcomes were convincing enough to attract
more and more patient referrals, and relaxation of indications for liver
transplantation as discussed earlier in this chapter. The ultimate result was the
expansion of transplant wait lists with patients listed, whilst the donor organ pool
did not expand at the same rate despite wider practice of brain stem death or
determination of neurological death. Consequently, DCD liver transplantation was
revived in the late 1990’s in this backdrop of donor organ shortage (Abt et al.
13
2004;Muiesan et al. 2005). With improved organ preservation techniques in place,
DCD grafts were procured from donors who were pre-identified and under tight
conditions (D'Alessandro et al. 2000). Generally potential DCD donors also included
those who suffered major neurological injury not severe enough to make a diagnosis
of brain stem death or that these neurological events were so recent that the usual
pathophysiology and brain oedema had not fully evolved. These patients do not meet
the criteria for determination of neurological death, and on the other hand continued
life support or neurosurgical interventions are unlikely to improve the condition
either. Further treatment in these patients is therefore deemed futile, and a clinical
decision is taken by the attending physicians to withdraw life supporting treatment.
Once life support is withdrawn these patients progress to eventual circulatory arrest
and cardiac function ceases (Ridley et al. 2005). Cessation of cerebral circulation is
vital for the eventual neurological death, due to the lack of blood and oxygen supply
to the brain. Cerebral circulation is absolutely vital for the life as the research
suggests absence of cerebral circulation for more than 2-3 minutes is associated with
irreversible neuronal injury and death. In these donors therefore a standard five
minutes period, termed as “obligatory stand-off time” is allowed for the neurological
death to ensue (Reich et al. 2009). Confirmation of death is by traditional criteria and
thereafter it allows a legal and ethical framework of organ procurement for
transplantation.
There has been a steep rise in organ transplant activity with organs from DCD donors
worldwide (Moers et al. 2007;Reich et al. 2000). In the United Kingdom alone, the
DCD organ donation activity increased by many-folds in the recent years, this
undoubtedly contributed to the increased transplant activity seen over the years.
Despite this, there are certain issues that surround the DCD organ donation that
limits the best utility of the DCD grafts. The origin of most these problems is the
basic difference between the two key types of organ donation processes. In DBD
donation, the donor is confirmed brain dead by neurological criteria, therefore
intervention to facilitate donation is allowed; therefore donor operation could begin
with and warm phase dissection and mobilisation of organs could be carried out
before finally the organ support is withdrawn. Even the administration of medication
14
with the view of preservations of organs in the best possible state is legally and
ethically allowed in this case scenario. In DCD donors however, treatment is
withdrawn prior to the death, and indeed this is the process that allows natural
passage in to the death of a prospective DCD donor. In most circumstances the
donors linger in a phase called “agonal phase” before the cardiac death ensues and no
intervention is ethically or legally allowed during this period.
1.6.1 Donor warm ischaemia
The donor warm ischaemia refers to an ischaemic insult to the organs of a potential
donor, once life sustaining treatment is withdrawn (Hoshino et al. 1988). As
discussed above, in many of prospective DCD donors, perfusion of the vital organs is
maintained by intense management aimed at maintaining the adequate perfusion by
means of vasopressors and oxygenation through mechanical ventilation. Without
these, hypoxaemia and hypotension ensue and the tissues undergo ischaemic
damage of varying degrees, and these become the usual preceding events following
treatment withdrawal in a patient. The cells continue metabolism at body
temperature, but the lack of oxygenated perfusion makes these cells prone to
ischaemic damage. The degree of damage depends on the time exposed these cells or
the tissues to warm ischaemia (Takada et al. 1997).
In DCD donors after treatment withdrawal, the time taken to circulatory death is
variable, and unpredictable. Dependency on higher level of organ support probably
makes the progression to circulatory death quicker once the life supportive
treatment is withdrawn. In some other patients despite being on significant amount
support prior to withdrawal, eventual progression to circulatory death may be
prolonged. Transplant professionals do not have any access for donor management
or intervention during this variable period and this is protected by the ethical and
legal guidelines surrounding organ donation. Therefore it is important to select DCD
donors that only progress to circulatory death within a pre-defined time frame,
proven by the animal, clinical and laboratory data where procurement and
15
transplantation of organs from such donors are proven to be a success. Transplant
surgeons therefore have set time limits to accept organs dependent on the ischaemic
susceptibility of the various organs in the body. In liver transplantation the general
rule is to accept 30minutes of donor warm ischaemia and the outcomes of grafts with
donor warm ischaemia beyond 30 minutes are significantly inferior with increased
risk of graft failure rates (Takada, Taniguchi, Fukunaga, Yuzawa, Otsuka, Todoroki,
Iijima, & Fukao 1997).
The implications of donor warm ischaemia could be disastrous in some cases, and
also in a group of patients after liver transplantation the long term morbidity could
be the result of damage caused by donor warm ischaemia to the grafts. Primary non-
function or immediate graft failure is significantly higher in the DCD liver
transplantation and the clinical data from all the large centers report donor warm
ischaemia is directly attributable to primary graft failure (Strasberg et al. 1994). The
biliary tree receives its blood supply solely from the hepatic artery through a rich
vascular complex called peri-biliary vascular arcade. Lack of oxygen delivery to the
bile ducts during the donor warm ischaemia period makes these bile ducts
susceptible to ischaemic injury and the damage is manifested as ischaemic type
biliary lesions in the post operative period (Heidenhain et al. 2010).
Ischaemic type biliary lesions (ITBL) represents a wider spectrum of pathology
ranging from isolated short segment biliary strictures to more widespread and global
damage to the bile ducts (Abt et al. 2003). Although the donor warm ischaemia is
primarily responsible for the ITBL, other causes are hypothesized, such as bile salt
toxicity (Buis et al. 2006;Buis et al. 2009), immunological damage etc (Rull et al.
2001). In its milder form of the spectrum, these could managed conservatively with
minimal intervention or surgery, however more serious form of involvement of the
bile ducts necessitate a re-transplantation without which the quality of the life of
recipients is poor. This is one major obstacle faced by transplant surgeons at present
selecting the best liver grafts that would not lead to the development of ITBL,
because this complication may put extra burden on the system where the demand for
organs for first time transplant itself is very high, and the addition of more patients
16
requiring re-grafts or re-transplantation adds further burden to the system (Foley et
al. 2011).
1.7 Graft preservation
The history of organ preservation dates back to mid 20th Century and progress that
has been made constitutes the backbone of the success of solid organ transplantation
(Belzer and Southard 1988). Explanted organs are no longer connected to the
circulation and this result in impaired oxygen delivery, along with impaired nutrient
delivery and removal of metabolic waste products. Research related to organ
preservation has undergone phases over the decades and static cold storage has
been currently the universally accepted technique of organ preservation. Cooling
down the tissues are known to reduce the metabolic demand of the cells within,
therefore the intracellular enzymes that function at optimal body temperatures
would become less active, thus the energy dependent systems become less
demanding (Southard 1999). This principle was introduced in 1960’s and it was
proved that internal cooling is far more effective than topical cooling alone, and both
internal and external cooling could achieve rapid cooling of the tissue rendering
them less metabolically active during the time these organ come out of donors’ body
cavity and until the circulation is restored.
1.7.1 Cold ischaemia
Static cold storage upon organ procurement and transfer until these are transplanted
has been in practice as the gold standard of organ preservation over the latter part of
the 20th Century. Although recent studies suggest normothermic preservation may
be more superior to cold preservation and this emerging data may re-shape the
practice of the organ transplantation practice in the future (Brockmann et al.
2009;McLaren and Friend 2003). Tissue cooling is effective and a cheaper way of
preservation and maintaining the viability of organs. Each 100 C drop in the tissue
temperature is known to reduce the metabolic activity by 50% and therefore cooling
achieved at 0-40 C may reduce the intracellular metabolic activity down to 10% of
the baseline (Belzer & Southard 1988). This degree of metabolic activity is sufficient
17
to maintain the cells alive, however the duration of cold ischaemia tolerated by
different organs and cell types vary. For example cardiac muscle tolerates the least
duration of cold ischaemia that does not exceed 6 hours, and unless the grafts are
transplanted within this time frame primary graft failure ensues. In liver
transplantation the cold ischaemia time is a modest period, but this again varies with
the quality of the graft. A non-steatotic liver graft from a healthy young donor may
tolerate a cold ischaemia time up to 16-18 hours and in case of a marginal or
steatotic graft this would be much shorter (Yoglu et al. 1988).
Several organ preservation solutions have been introduced, and historically all of
these solutions contain electrolytes composition similar to that of the intracellular
environment. The basic composition of the organ preservation solutions consisted
electrolytes, energy source usually of elemental that feeds directly in to the ATP
generating mechanisms within the cell, buffer solution to counteract the acidaemia
that builds up in an organ during ischaemia, basic and essential amino acids and
antibiotics. The composition of these solutions has been designed with the
understanding of the metabolic pathways and molecular mechanisms. Among the
preservation solutions available in the market at present University of Wisconsin
solution (UW solution) is considered the gold standard (Koning et al. 1997). Liver
grafts preserved with UW solution are known to be associated with less ischaemia
reperfusion injury and better organ preservation compared with other solutions
(D'Alessandro et al. 1991;Mangus et al. 2006). Sometimes these solutions may be
used in combination; especially in case of liver graft perfusion that allows dual
perfusion through the hepatic artery and the portal vein. Five commonly used organ
preservation solutions include UW, Euro-Collins, Celsior, Custodial and IGL-1
solution. Hyperosmolar Citrate or HoS is a low viscosity solution, also known as
Marshal’s citrate solution primarily used in renal graft preservation, however may be
used in liver preservation when used in combination with a superior preservation
solution as mentioned above.
18
1.7.2 Preservation-reperfusion injury
Preservation-reperfusion injury (PRI) is a term applied to describe the pathological
changes in an organ injury following the restoration blood supply in the new host
(recipient) (Serracino-Inglott et al. 2001). These complex changes are the result of
oxygen radical induced organ injury, characterized by the increased microvascular
permeability and hemorrhage in to the tissue parenchyma, tissue oedema and
variable degree of cellular injury (Jaeschke et al. 1990). Despite diminution of
intracellular metabolism during the cold preservation, the cells continue to consume
intracellular ATP for the maintenance of essential intracellular functions that
including maintenance of integrity of the cell membrane and mitochondria. Depletion
of intracellular ATP cause breakdown of adenosine and mitochondria causes
accumulation of chemical substances which could act as free radicals when the
tissues are re-oxygenated (Jaeschke 2003).
Free radical induced tissue injury further aggravates the damage by the release of
cytokines. The increased microvascular permeability and hemorrhage in the tissues
brings in neutrophils and macrophages in to the tissue which act synergistically
control the tissue damage (Fondevila et al. 2003). The pathophysiology involves the
release of the cytokines in to the systemic circulation and distant tissue damage is
also occurring during the reperfusion of a graft, and this phenomenon is termed
“reperfusion syndrome” (Goode et al. 1994). Preservation-reperfusion injury and
reperfusion injury is correlated with the degree of organ damage during cold
preservation (Reddy et al. 2005). Severely ischaemic grafts would be associated with
severe PRI and reperfusion injury and in well preserved grafts these effects are less
severe. In severe forms the PRI could cause lethal injury to the graft causing
immediate or primary graft failure, and the release of massive load of cytokines and
free radicals in to the circulation via returning venous drainage could lead to
immediate cardio-vascular and systemic instability to the patient. Furthermore, end
organ damage, primarily the renal injury is ensued in case of liver transplant
recipients. The data from liver transplantation suggests that acute kidney injury and
19
renal failure is common after the use of liver grafts from marginal donors including
those from DCD donors.
1.8 Primary non-function
Primary non-function (PNF) is a clinical entity encountered in liver transplantation,
as well with other solid organ transplants. This is also termed as initial poor function
(IPF), and describes the failure of the transplanted liver graft to restore the function
once the blood supply is re-connected surgically. In liver transplantation PNF is seen
in up to 2-10% of cases and the incidence varies with the graft types and the quality
of the organs transplanted (Strasberg, Howard, Molmenti, & Hertl 1994). Liver grafts
from DBD donors has a lower incidence of PNF up 2-5% meanwhile that from DCD
liver grafts may be doubled and reported in up 8-15% cases. In liver transplantation
PNF is a more serious complication, because the recipient life is in danger in this
situation and the only survivable option for these patients is an immediate re-
transplantation of the liver graft.
The exact aetiology of PNF is unknown; however the pathological studies of the
explanted failed allografts showed the widespread hepatocytes necrosis and
sinusoidal haemorrhage (Gonzalez et al. 1994). Severe PRI is attributed to these
changes and known risk factors for such severe injury are known to be prolonged
cold preservation or cold ischaemia time, graft steatosis, usually moderate to severe
macrovesicular steatosis, elderly donor grafts etc (Ploeg et al. 1993). Grafts from DCD
donors, as discussed above have been exposed to added donor warm ischaemia prior
to the start of cold storage thus tolerate only less period of cold ischaemia. Therefore
attempts are made to transplant the liver grafts from DCD donors within a shorter
time frame. Clinicians are aware of these risk factors causing PNF however despite
the best efforts to choose the grafts from donors that are likely to function normally
in the recipient, PNF occur as a surprising event and in most cases unpredictable. It is
also important to discuss that the PNF is not entirely graft related and the recipient
environment also play a significant part in the occurrence of this complication
20
(Markmann et al. 2001;Schaubel et al. 2008). Extremely sick patients with
physiological disturbance may not tolerate a marginal liver graft that would function
normally in a recipient with stable physiology, and this complicates the life of a liver
transplant surgeon. Careful donor-recipient matching is a clinical skill that transplant
surgeons master through the years of experience.
Transplant surgeons usually make clinical decisions based on the predictability of
graft function, influenced by variety of information passed on to them at the time of
donor organ offering. Age, previous medical history, immediate pre-donation medical
condition and laboratory findings, especially the liver function status and general
physiology of the donor at the time of organ offering heavily influence the decision
making and every effort is made to choose functioning grafts (Hoofnagle et al. 1996).
The unpredictable nature of PNF is exemplified by the graft failures despite attention
to the details (Marino et al. 1995). Younger and previously healthy donor liver grafts
are no exceptions (Todo et al. 1989;Wall et al. 1990).
Whilst PNF has serious consequences to the recipient, because without a life saving
emergency transplant within a very short period of time the hope for survival is
almost zero, there are other aspects which affect many other prospective transplant
recipients in the wait list. In the PNF situation allocation of another liver graft on
priority basis, as allowed by almost all transplant allocation systems means that the
donor organ pool is minus one further liver graft that could have potentially saved
the life of another patient given there was no PNF situation. Although incidence of
PNF low, these situations consume number of good quality liver grafts from a
national donor organ pool. Combined with the current situation of organ scarcity
PNF is an added pressure on the system.
1.9 Biomarkers predicting graft function
It appears from the above discussion that currently there is a significant organ
shortage of liver grafts despite attempts to bridge this gap with marginal grafts.
Currently no investigation could accurately predict the organ function following
21
transplantation; therefore many of these marginal organs are rejected outright. As
reported by the pioneers of liver transplantation through their early experience, a
significant proportion of grafts that were considered “good” in quality had resulted in
poor graft function after transplantation (Makowka et al. 1987). Also no
investigation that could predict primary non-function of the liver grafts has been
developed and the quality assessment of a liver graft is determined by the routine
liver biochemistry, donor past and current medical history and combination of
macroscopic and microscopic examination of liver graft in some cases. The liver
biochemistry may be normal whilst the graft is still in the donor environment, but
these do not reflect the interim physiological changes whilst the organs are procured
and preserved in the static cold storage. The macroscopic and microscopic
examination may be acceptable however, the exact extent of PRI will not be known
until the graft is perfused in the recipient, and by this time the surgical steps have
gone too far to the extent of point of no return. Those traditional methods of organ
assessment or the clinical expertise combined with these alone do not prevent PNF of
liver grafts. This creates a room and a need for novel biomarkers that would predict
PNF of liver grafts at various stages of the journey of an organ in the process of liver
transplantation. Perhaps these biomarkers may be present in the donor, and if tested
positive a more cautious approach may be employed in selecting those liver grafts for
transplantation. Or else the grafts could be tested at the end of the cold storage
before implantation or even after implantation and the presence of these biomarkers
predicting PNF may open up avenues for further research in mechanisms to modify
the pathophysiological sequelae through intervention.
22
CHAPTER 2 RESEARCH HYPOTHESIS AND STUDY PLAN
2.1 Research aim
Conventionally, the immediate success of a transplanted liver allograft is assessed by
a combination of clinical and biochemical criteria. In the presence of immediate poor
graft function or PNF the recipient haemodynamics and physiology deteriorate
significantly (Koffron and Stein 2008). Usually this is seen as prolongation of the
reperfusion syndrome that is manifested only in a proportion of such patients.
Lactate clearance and correction of acid base imbalance are other parameters that
could be used with real time blood sampling. Other biochemical and haematological
investigations also performed routinely in transplanted patients and these include
serum alanine and aspartate transaminases, prothrombin time and serum bilirubin
(Tekin, Imber, Atli, Gunson, Bramhall, Mayer, Buckels, Mcmaster, & Mirza 2004).
High serum transaminases levels are generally considered to reflective of the
severity of graft injury during the ischaemia and reperfusion. Inability of the liver
graft to resume immediate function results in lack of coagulation factor production
leading to prolongation of prothrombin time (Pokorny et al. 2000). Bilirubin is also a
surrogate marker of allograft injury. Whilst PNF could be diagnosed when all these
clinical features and biochemical findings considered together, an isolated rise of a
single enzyme or presence of recipient instability do not help clinical decision
making, as these could be the result of many other physio-chemical processes.
The studies outlined in this thesis were aimed at identifying metabolic differences
and changes between cadaveric liver grafts used in the clinical liver transplantation
setting, from cold ischaemia to reperfusion, using several novel techniques. The
specific objective was to identify the key differences between the DCD and DBD liver
grafts, with the possibility of identifying biomarkers predictive of graft function. This
was in the background of real shortfall of organs available for liver transplantation in
the UK with approximately 20% of patients on the waiting list dying due to delay in
23
receiving a suitable graft as discussed in the previous chapter. In the United Kingdom
and other Western countries, many transplant centres currently use liver grafts that
are considered sub-optimal for transplantation in an attempt to increase the donor
pool. These sub-optimal or marginal grafts however have a higher tendency to
function poorly in the recipient post transplantation leading to initial poor function
or primary non function that could lead to re-transplantation or death of the
recipient. Therefore this project was designed with aims of understanding the
metabolic changes that occur in a liver graft during the process of transplantation.
Identifying these biomarkers would help further research on therapeutic
intervention on the grafts with unfavourable biomarkers predicting poor function;
furthermore this approach would also help in better graft recipient matching, and
understanding interventional processes designed to optimize grafts has the potential
to increase the donor pool while making the utilization of a scarce resource better.
Birmingham Liver Unit has developed the technology needed to use the technique of
microdialysis (Silva et al. 2005;Silva et al. 2006a) in the setting of liver
transplantation through real time analysis of the metabolic changes that occur within
the graft during the donor operation, while in cold storage and immediately post
transplantation. Using targeted analytical platforms previous studies have shown
that microdialysis can study the changes within the graft safely, is able to
differentiate between grafts that function well post transplantation, and has the
ability to study specific metabolic pathways. The current studies were focussed on
the use of this tried and tested method with different and novel analytical platforms
so as to study the whole metabolome in order to identify specific metabolic
signatures that will then be identified in more easily accessible biologic material like
liver biopsies and blood samples. At the outset we envisaged that this project
therefore has real potential in producing results which will translate to data that will
have clear clinical benefits.
The specific aim of this research was to investigate metabolic differences of the liver
grafts obtained from DCD and DBD donors. We hypothesized that the changes in the
intracellular metabolome in the process of preservation-reperfusion injury would be
reflected in the extracellular fluid, through the transfer of these metabolites across
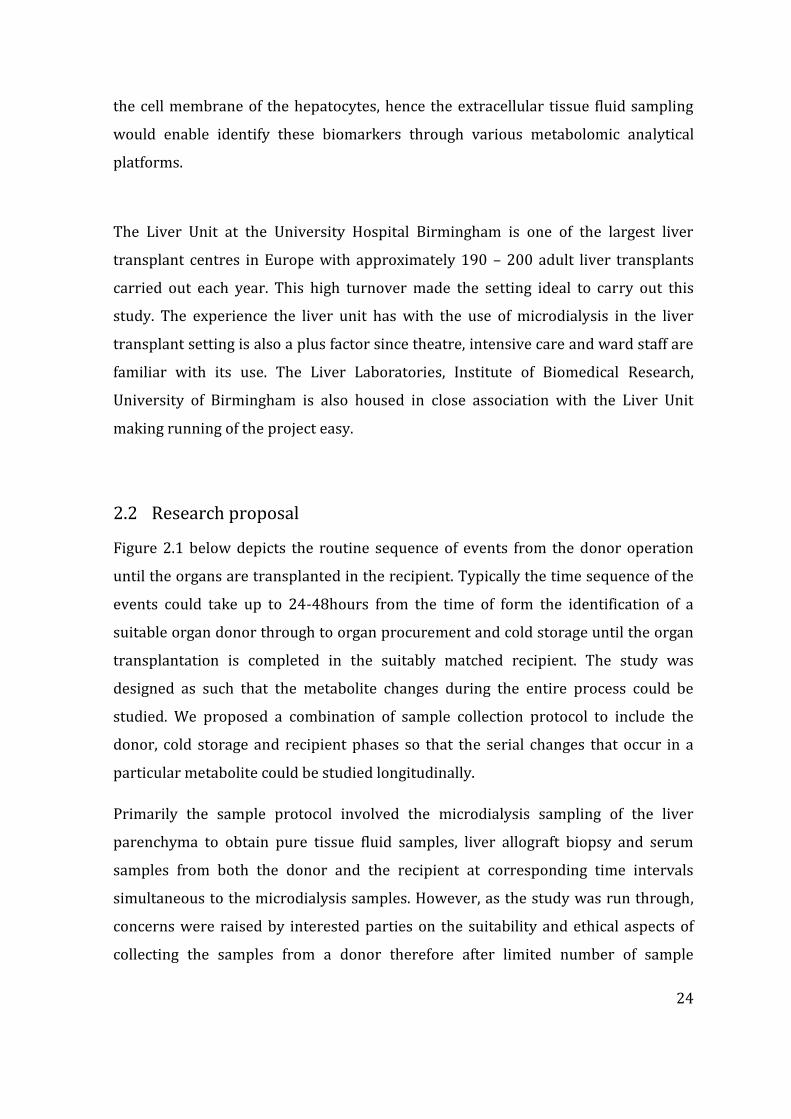
24
the cell membrane of the hepatocytes, hence the extracellular tissue fluid sampling
would enable identify these biomarkers through various metabolomic analytical
platforms.
The Liver Unit at the University Hospital Birmingham is one of the largest liver
transplant centres in Europe with approximately 190 – 200 adult liver transplants
carried out each year. This high turnover made the setting ideal to carry out this
study. The experience the liver unit has with the use of microdialysis in the liver
transplant setting is also a plus factor since theatre, intensive care and ward staff are
familiar with its use. The Liver Laboratories, Institute of Biomedical Research,
University of Birmingham is also housed in close association with the Liver Unit
making running of the project easy.
2.2 Research proposal
Figure 2.1 below depicts the routine sequence of events from the donor operation
until the organs are transplanted in the recipient. Typically the time sequence of the
events could take up to 24-48hours from the time of form the identification of a
suitable organ donor through to organ procurement and cold storage until the organ
transplantation is completed in the suitably matched recipient. The study was
designed as such that the metabolite changes during the entire process could be
studied. We proposed a combination of sample collection protocol to include the
donor, cold storage and recipient phases so that the serial changes that occur in a
particular metabolite could be studied longitudinally.
Primarily the sample protocol involved the microdialysis sampling of the liver
parenchyma to obtain pure tissue fluid samples, liver allograft biopsy and serum
samples from both the donor and the recipient at corresponding time intervals
simultaneous to the microdialysis samples. However, as the study was run through,
concerns were raised by interested parties on the suitability and ethical aspects of
collecting the samples from a donor therefore after limited number of sample
25
collection from the DBD donors, the donor phase sampling was abandoned. This was
felt appropriate, as in case of DCD donors’ practical difficulties arose with
microdialysis sample collection owing to the rapid nature of surgical steps leading to
organ procurement, as outlined in the chapter 1 and below.
Donor Ischaemia Cold Injury Warm Injury Reperfusion
Donor
(4 hours)
Cold Storage /
Back table
Preparation
(4 hours)
Liver
Implantation
(24-48 hours)
Project Model
Graft
Ischaemia
Reperfusion
Poor Graft
Function
Good graft
function
Identification of
metabolic
differences exist
between DCD and
DBD liver grafts that
predict poor graft
function
Figure 2-1: The processes involved in the liver transplantation from the donor to the recipient; graft ischaemia is inevitable outcome leading poor or good graft function providing space for the investigation of metabolic differences between these two outcomes
26
2.3 Study design
2.3.1 The donor operation
The principles of donor operation for organ procurement involves identification and
preparation of the abdominal descending aorta for cannulation and institution of the
cold preservation solution, and isolation of the abdominal aorta to confine the
perfusate to circulate only through the visceral blood supply. This is achieved by
cross clamping the abdominal aorta at the diaphragmatic hiatus at the beginning of
the cold perfusion. Outflow venting is the third essential key component in
abdominal organ harvest which done by opening the abdominal and thoracic inferior
vena cava within the pericardial sac. Although these three principle steps are the
essential steps in organ procurement from deceased donors, various other surgical
steps are undertaken and this is determined by the nature of the organ donation.
In donors after brain death (DBD), the organs are perfused with intact circulation
hence ample time is available for the donor surgeon to mobilize the intra-abdominal
viscera intended for transplantation (Brockmann et al. 2006). This is termed as
warm phase dissection that is aimed at isolation of the individual blood supply to the
respective organs. The advantage of this technique is the positive identification of
vascular anatomy, allowing abnormal anatomy to be recognized, thereby minimizing
unwanted injury to these vessels (Baranski 2009). Early practice of organ donation
differed from this approach in that organs were procured en-bloc and separated in
an ice bath; as organs are without blood supply at this stage, positive identification of
structures is difficult the chances of causing injury to blood vessels was higher. Loss
of orientation anatomy further increased the chances of inadvertent injury. In
current DBD organ donation practice thus organs are mobilized prior to aortic
cannulation and eventual cross clamp, spending a variable time period of warm
dissection depending on the experience of the organ retrieval surgeon. The common
bile duct is divided just above the duodenum and the bile is flushed through the
opening made in the gall bladder prior to the institution of the cold preservation
solution heralds the cold ischaemic preservation.
27
The situation is technically more demanding in donors after circulatory death (DCD)
wherein “circulatory” death is confirmed prior to the beginning of the donor
operation. Therefore no time is spent on mobilizing organs in a warm phase, as each
minute passed further aggravates the warm ischaemic injury to the organs. The aim
is therefore rapid laparotomy and cannulation of the aorta followed by the adherence
to the key steps in basic organ donation surgery. This technique is often termed
“super-rapid” technique of organ procurement and the objective is to minimize the
warm ischaemic damage and initiation of cold preservation at the earliest possible
time point (Fong and Blumgart 2000).
As the liver receives a double blood supply through the hepatic artery and the portal
vein, a dual perfusion system is used in the majority of the cases of liver graft
retrieval with rare exceptions. Whilst the hepatic artery is perfused through the
aortic cannula, the superior mesenteric vein is identified and cannulated to perfuse
the graft with further organ preservation solution. This dual perfusion ensures
maximum volume of organ preservation solution reaching the hepatocytes, and
adequate microvascular flush thereby achieving better cellular preservation. In our
practice we used Marshall’s hyper-osmolar citrate solution to perfuse the aorta and
University of Wisconsin solution to perfuse the portal vein with 4 and one liters
respectively. Marshall’s solution has been introduced as a kidney preservation
solution and was choice of solution owing to low viscosity and the cost. Viscosity of a
preservation solution is a key indicator for the effectiveness of organ preservation
solution (Guarrera and Karim 2008); higher viscosity solutions cause diminished
microvascular flush. This in turn leads to longer cold flush times and inadequate
organ preservation. Microvascular hypo-perfusion leads to increased incidence of
biliary complications in liver transplantation (Maheshwari et al. 2007). Marshalls’
solution therefore is an ideal solution in the donation after circulatory death setting
where micro-thrombus formation post mortem has been already initiated. Our
practice of using Marshalls’ solution was different to many other liver transplant
centers which used University of Wisconsin solution for aortic perfusion which
deemed to yield better organ preservation and increased cold preservation times
based on randomized controlled studies.
28
Once perfused with the cold preservation solution, liver grafts were retrieved with
intact hepatic arterial supply, portal vein and the bile duct in the hepatic hilum, along
with the retrohepatic inferior vena cava. These grafts were then perfused in the back
bench – with University of Wisconsin solution 500 and 250cc through the portal vein
and the hepatic artery respectively before being packed in double sterile bags.
Residual bile is more likely to be inspissated in the cold temperature, and if not
removed may solidify to form biliary casts in the recipient. Therefore bile duct is also
usually flushed to remove any residual bile. The liver graft is then safely placed in an
ice box for transport.
2.3.2 Liver transplantation technique
Macroscopic appearance of the liver graft is a crude assessment of the degree of
steatosis; however this is practiced through generations. Generally this information
is gathered from the organ retrieval surgeon but examination of the liver graft prior
to commencement of the recipient transplant operation is a more reliable form of
organ assessment as often experience of the surgeon assessing the organ is counted.
Size of the liver graft, colour, margins and the consistency are key elements of
assessment. Larger liver grafts with yellow appearance, often with rounded edges as
opposed to sharp edges denote a fatty liver, whereas a firm graft texture may suggest
steatosis or fibrosis as well as inadequate / suboptimal preservation. A careful and
reasonably accurate assessment by the experienced recipient surgeon is possible
through macroscopic appearance alone that could be performed once the liver graft
is taken out of ice at the implanting centre. In doubtful cases, rapid processing of a
liver biopsy specimen is requested to quantify the degree of steatosis before making
a final decision on transplantability of the organ.
The liver transplantation technique that is commonly described as the modified
piggyback technique was followed in all cases that we studied. In brief, this included
laparotomy and entry in to the abdominal cavity. Hilar dissection with division of the
bile duct, hepatic artery and the portal vein followed and a temporary port-caval
shunt was performed in the majority of cases. Complete posterior mobilisation of the
29
liver whilst preserving the native vena cava is required for the modified piggyback
technique, hence ligation and division of individual hepatic veins was mandatory.
Mobilisation and explantation of the native liver is completed by taking the right
hepatic vein and the left/middle hepatic veins as a common trunk. The liver graft
prepared in the ice bath is taken out for implantation and this time point signifies the
end of the cold ischaemia. As the liver graft is exposed to the room temperature
during the implantation procedure until blood supply is restored, this period of re-
warming is termed as warm ischaemia, and the time lag between the graft taken out
of ice and reperfusion with the recipients own blood is termed the implantation time.
The first anastomosis to be performed is a creation of venous outflow by way of a
side to side cavo-cavoplaty. Here a large opening made between the graft and the
recipient cava is sutured together to allow free venous return of the hepatic venous
blood. In the next step the portal vein of the recipient is directly anastomosed to the
graft portal vein, at the end procedure the graft is flushed with a physiological
solution to get rid of excess potassium from the graft. This excess potassium is the
result of organ preservation solution, as well cell lysis; if not flushed, a massive load
of potassium is released to the circulation during reperfusion, causing immediate
cardiac rhythm abnormalities and even cardiac arrest on table. Both vena caval and
portal venous anastomoses are completed once the flush out with physiological
saline is complete.
Liver grafts are reperfused with portal venous blood first, before the commencement
of hepatic arterial anastomosis. The objective behind this rationale is to minimize the
warm ischaemic injury during the reperfusion phase. Caval and portal clamps are
released to reperfuse liver graft with blood and significant haemodynamic changes
are anticipated in this stage. Sudden release of cold blood passage through the liver
graft entering circulation, combined with the release of cytokines and other chemo
mediators of cell damage, excess potassium all contribute to these haemodynamic
changes which are collectively termed as “reperfusion syndrome”. As the new liver
allograft should start to function in the recipient’s body but this immediate function
may be determined by the degree of organ damage during brain or circulatory death
in the donor and subsequent cold storage. In addition, further injury to the graft
30
occurs during the reperfusion through activation of oxygen free radicals and Kupffer
cell mediated reperfusion injury.
The hepatic artery anastomosis between the recipient and graft is carried out next,
and restitution of oxygenated blood to the graft could cause further reperfusion
injury. This step permits the graft to be fully oxygenated and also achieves perfusion
of the arterially supplied biliary tree. The final anastomosis is carried out to ensure
biliary drainage, through the native bile duct or by creation of a Roux en-Y
hepaticojejunostomy. A surgical drain inserted at the end of the operation helps
monitor ongoing bleeding, and provides drainage for excessive ascites once the
abdomen is closed
2.4 Microdialysis
Microdialysis is a technique of interstitial tissue fluid sampling using the principle of
solute transfer across a semi-permeable membrane across a concentration gradient.
This technique mimics the transfer of solutes across a thin capillary blood vessel and
originally described in experimental animal and human models involving
neurosurgery and subsequently used as a research tool involving various organs
(Nilsson et al. 1999). The technique involves an insertion of a specially designed
microdialysis catheter and embedded in the tissue, and a battery driven syringe
pump which pumps a physiological solution. The pump is designed in a way that the
microdialysis fluid pumped in to the tissue could be controlled via a variable flow
rate, and the returning fluid after equilibrium in the tissue space is returned and
collected at the outside body by a microvial. The benefits of using microdialysis in
combination with metabolomics are two-fold; the major advantage of microdialysis is
known to be due to the purity of the sample as blood is not is in contact with the fluid
hence sample preparation is not necessary. It therefore does not require laborious
methods of solid phase extraction for analysis. Additionally, the microdialysate is relatively
organ specific and does not have metabolites from other organ systems which can confound
data analysis. CMA Microdialysis Stockholm, Sweden is the only supplier of microdialysis
consumables which are licensed to be used in humans.
31
2.4.1 Microdialysis in liver transplantation
Microdialysis has been applied as a research tool in both experimental and liver
transplantation setting of both animal and human studies. Whilst the majority of the
studies were focused on graft monitoring, including those from our own research
group, the technique has been used to monitor the distant organs during the process
of liver transplantation. The earliest studies investigated the basic energy substrates
and metabolic end products of pig liver transplantation model involving donor
operation to cold ischaemia and reperfusion and documented the changes in lactate,
pyruvate, glucose and glycerol levels in the perfusate (Nowak et al. 2002a). Going
further the same group studied the metabolic changes in the human model and
reported reducing lactate levels post reperfusion and stabilization of pyruvate levels
during the first 24 hours of transplantation. Glycerol is an abundant glycolipid in the
cellular membranes and increased glycerol levels in the extracellular tissue space is
correlated with the degree of cellular injury (Nowak et al. 2003a). The same study
reported that the liver grafts used in liver transplantation had higher levels of
glycerol and these gradually reduced over the period up to 24 hours after the
reperfusion. This finding denotes that graft injury is immediate after the reperfusion
and with time the tissue injury becomes less severe after transplantation (Nowak et
al. 2002b). In a case report, microdialysis as an investigation tool to monitor the
extra-hepatic organs was demonstrated when the investigators implanted a
microdialysis catheter in the brain in a patient undergoing liver transplantation for
acute hepatic failure. The authors in this case demonstrated changes to
neurochemistry, more specifically a rise in intracerebral lactate levels without any
evidence of changes in cerebral perfusion pressures, denoting lactate flux from
systemic circulation to the cerebral circulation that correspond to the changes that
occurred in the systemic circulation during the process of transplantation. These
along with other neurotransmitter changes suggest that microdialysis is a valuable
tool not only in the investigation of grafts of interest, but also distant organs where
the direct effects of graft dysfunction may have implications for.
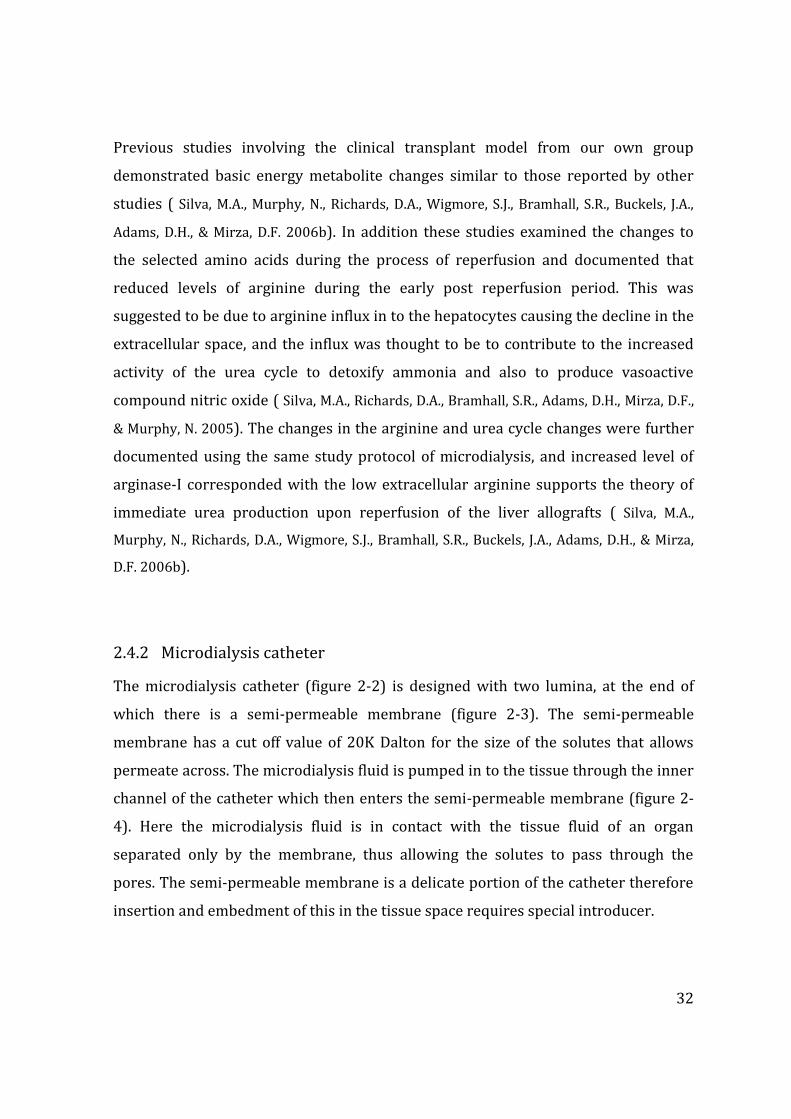
32
Previous studies involving the clinical transplant model from our own group
demonstrated basic energy metabolite changes similar to those reported by other
studies ( Silva, M.A., Murphy, N., Richards, D.A., Wigmore, S.J., Bramhall, S.R., Buckels, J.A.,
Adams, D.H., & Mirza, D.F. 2006b). In addition these studies examined the changes to
the selected amino acids during the process of reperfusion and documented that
reduced levels of arginine during the early post reperfusion period. This was
suggested to be due to arginine influx in to the hepatocytes causing the decline in the
extracellular space, and the influx was thought to be to contribute to the increased
activity of the urea cycle to detoxify ammonia and also to produce vasoactive
compound nitric oxide ( Silva, M.A., Richards, D.A., Bramhall, S.R., Adams, D.H., Mirza, D.F.,
& Murphy, N. 2005). The changes in the arginine and urea cycle changes were further
documented using the same study protocol of microdialysis, and increased level of
arginase-I corresponded with the low extracellular arginine supports the theory of
immediate urea production upon reperfusion of the liver allografts ( Silva, M.A.,
Murphy, N., Richards, D.A., Wigmore, S.J., Bramhall, S.R., Buckels, J.A., Adams, D.H., & Mirza,
D.F. 2006b).
2.4.2 Microdialysis catheter
The microdialysis catheter (figure 2-2) is designed with two lumina, at the end of
which there is a semi-permeable membrane (figure 2-3). The semi-permeable
membrane has a cut off value of 20K Dalton for the size of the solutes that allows
permeate across. The microdialysis fluid is pumped in to the tissue through the inner
channel of the catheter which then enters the semi-permeable membrane (figure 2-
4). Here the microdialysis fluid is in contact with the tissue fluid of an organ
separated only by the membrane, thus allowing the solutes to pass through the
pores. The semi-permeable membrane is a delicate portion of the catheter therefore
insertion and embedment of this in the tissue space requires special introducer.
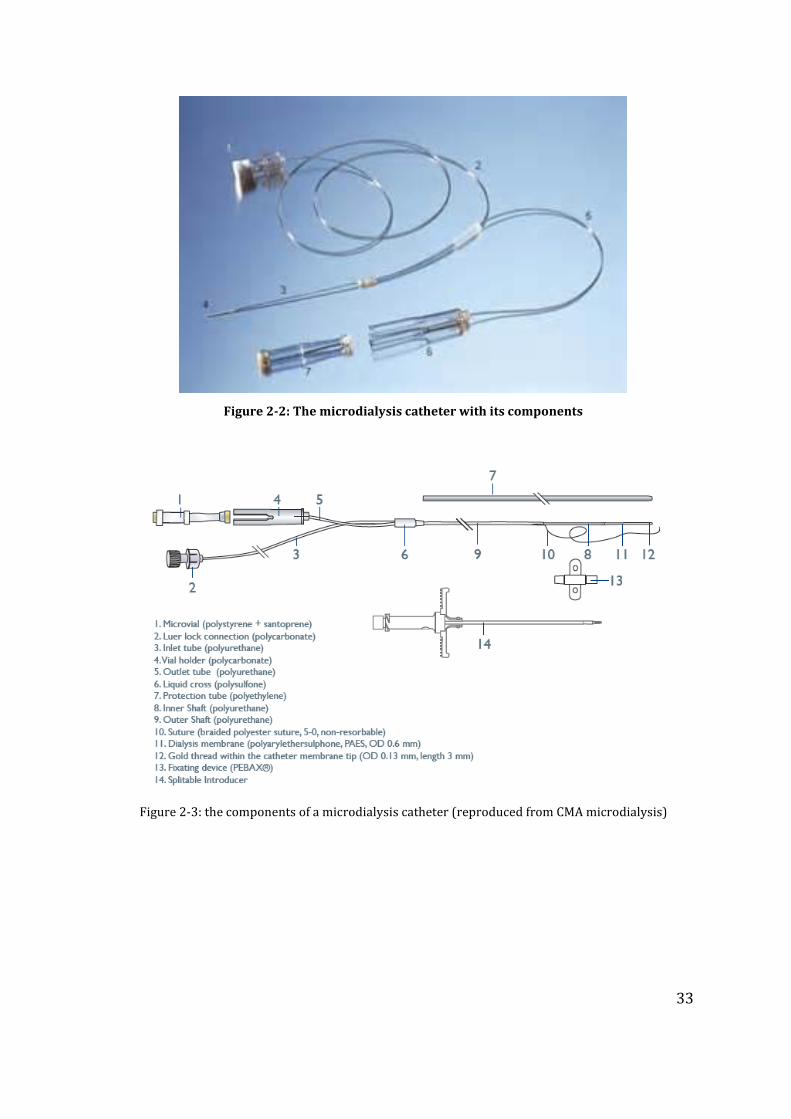
33
Figure 2-2: The microdialysis catheter with its components
Figure 2-3: the components of a microdialysis catheter (reproduced from CMA microdialysis)
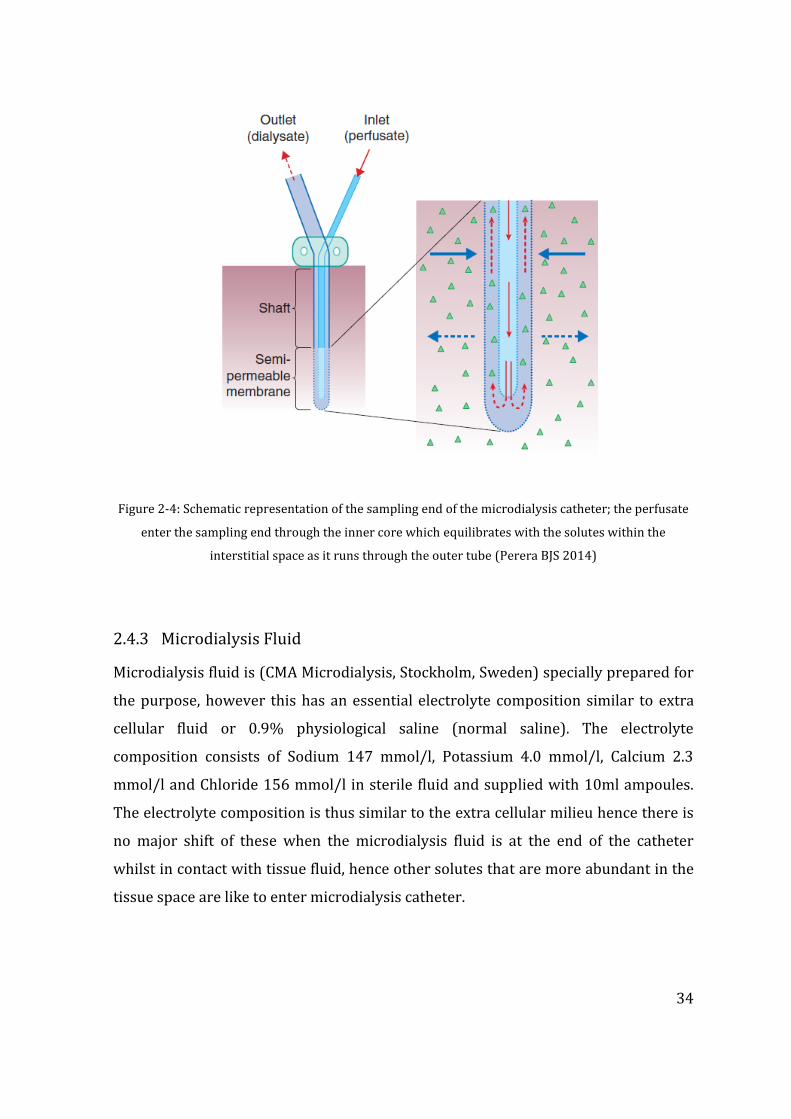
34
Figure 2-4: Schematic representation of the sampling end of the microdialysis catheter; the perfusate
enter the sampling end through the inner core which equilibrates with the solutes within the
interstitial space as it runs through the outer tube (Perera BJS 2014)
2.4.3 Microdialysis Fluid
Microdialysis fluid is (CMA Microdialysis, Stockholm, Sweden) specially prepared for
the purpose, however this has an essential electrolyte composition similar to extra
cellular fluid or 0.9% physiological saline (normal saline). The electrolyte
composition consists of Sodium 147 mmol/l, Potassium 4.0 mmol/l, Calcium 2.3
mmol/l and Chloride 156 mmol/l in sterile fluid and supplied with 10ml ampoules.
The electrolyte composition is thus similar to the extra cellular milieu hence there is
no major shift of these when the microdialysis fluid is at the end of the catheter
whilst in contact with tissue fluid, hence other solutes that are more abundant in the
tissue space are like to enter microdialysis catheter.
35
2.4.4 Microdialysis pump
Microdialysis pump is a small device with approximate dimensions of 7x4x1cm and
powered by two 1.2Mv lithium batteries. Both the pump and specially designed
syringe are supplied by the manufacturer (CMA Microdialysis, Stockholm, Sweden)
and there are various deigns that are made for purpose. For research purposes of the
liver there are two types of pumps; CMA 60 and CMA 61 hepatic microdialysis
pumps. The differences between these two pumps are subtle and primarily related to
the flow rate. The flow rate of each these pump could be adjusted by from 0.1µl to
0.6µl per minute. At slower rates, the microdialysis fluid transit across the semi-
permeable membrane is slower, and the solute transit is supposed to be maximum.
The syringe compartment of the pump accommodates a specially designed syringe
with a capacity of up to 3.5cc of fluid. The luer lock of the syringe end is designed to
connect to one end of the microdialysis pump.
2.5 Technique of Microdialysis
Microdialysis technique is a delicate procedure however simple to carry out once
familiarised with the equipment and the insertion technique. The instrumentation is
usually designed for the different tissues that could be studied and generally
supplied as pre-assembled kits in most occasions.
2.5.1 Microdialysis kit
The microdialysis kit is an assortment of essential components provided as pre-
packed sterile kit for single use only. It consists of a single microdialysis catheter, a
splittable introducer and microvials and syringe fro the pump. Microdialysis fluid is
supplied as a separate item, and apart from the catheter all other accessories are also
available as separate items.
2.5.2 Procedure
Insertion of microdialysis catheter in to the tissue space is an invasive procedure and
carries a risk of inoculation or introduction of organisms, hence carries an infection
risk. Therefore the procedure is carried out under sterile conditions with the
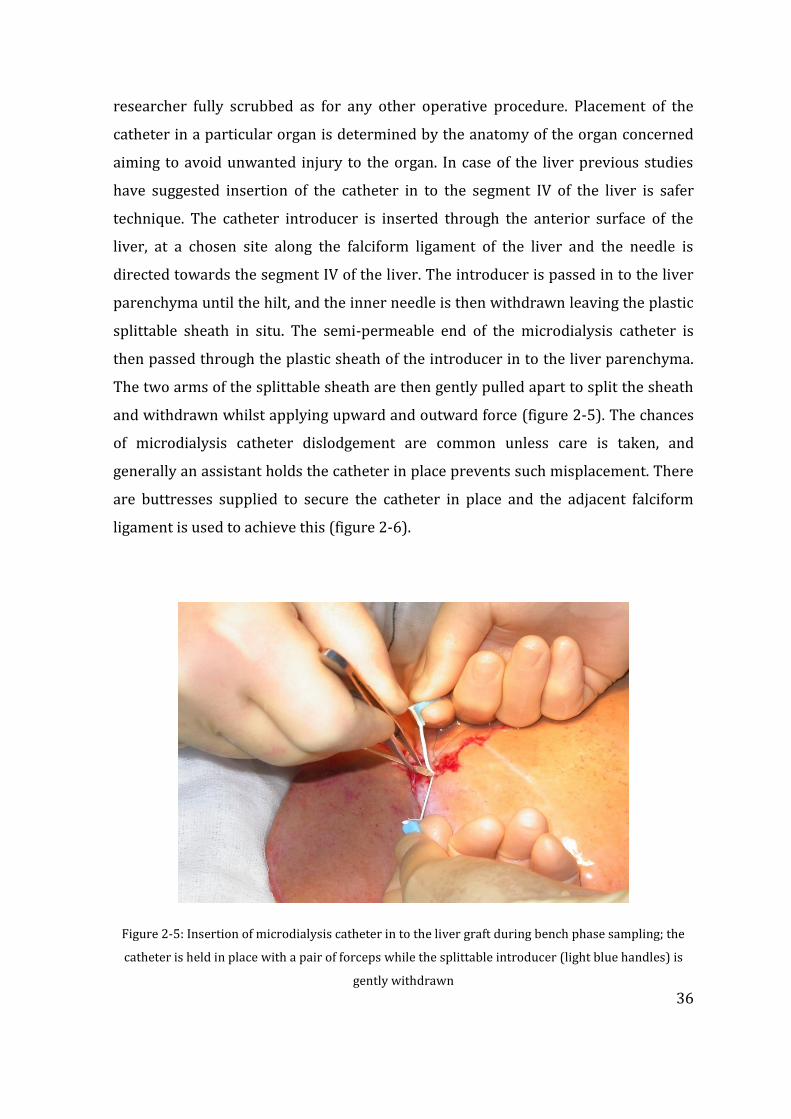
36
researcher fully scrubbed as for any other operative procedure. Placement of the
catheter in a particular organ is determined by the anatomy of the organ concerned
aiming to avoid unwanted injury to the organ. In case of the liver previous studies
have suggested insertion of the catheter in to the segment IV of the liver is safer
technique. The catheter introducer is inserted through the anterior surface of the
liver, at a chosen site along the falciform ligament of the liver and the needle is
directed towards the segment IV of the liver. The introducer is passed in to the liver
parenchyma until the hilt, and the inner needle is then withdrawn leaving the plastic
splittable sheath in situ. The semi-permeable end of the microdialysis catheter is
then passed through the plastic sheath of the introducer in to the liver parenchyma.
The two arms of the splittable sheath are then gently pulled apart to split the sheath
and withdrawn whilst applying upward and outward force (figure 2-5). The chances
of microdialysis catheter dislodgement are common unless care is taken, and
generally an assistant holds the catheter in place prevents such misplacement. There
are buttresses supplied to secure the catheter in place and the adjacent falciform
ligament is used to achieve this (figure 2-6).
Figure 2-5: Insertion of microdialysis catheter in to the liver graft during bench phase sampling; the
catheter is held in place with a pair of forceps while the splittable introducer (light blue handles) is
gently withdrawn
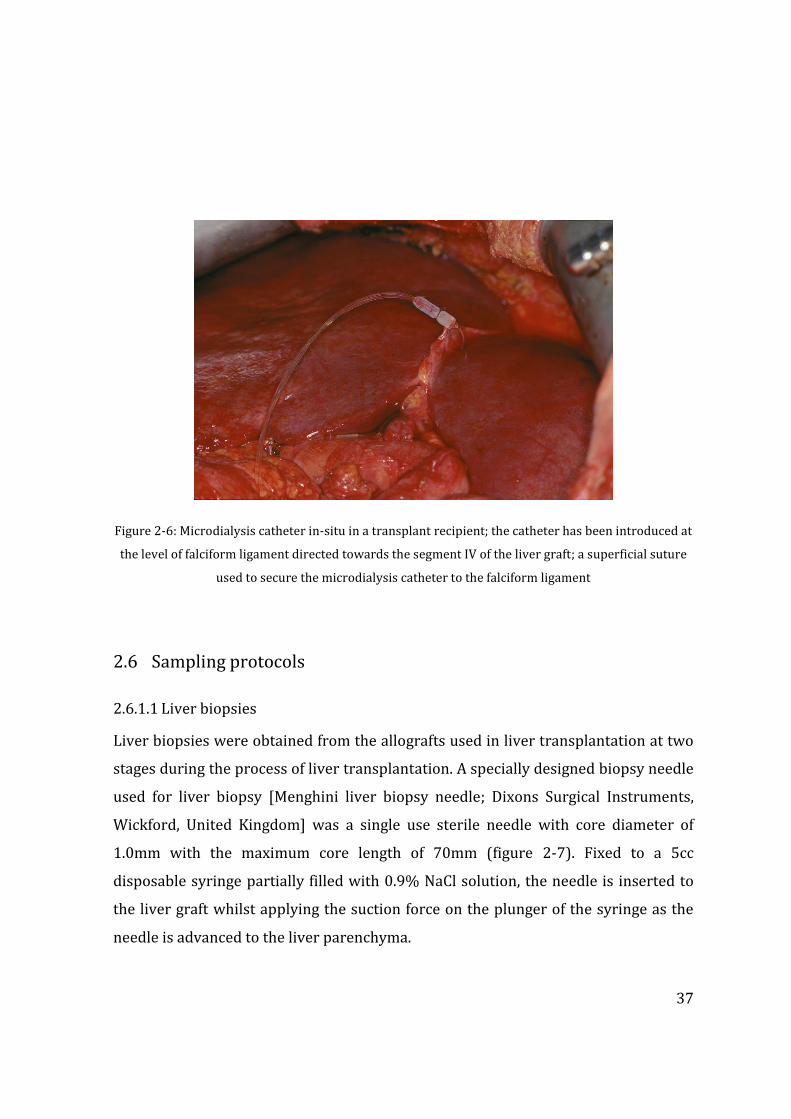
37
Figure 2-6: Microdialysis catheter in-situ in a transplant recipient; the catheter has been introduced at
the level of falciform ligament directed towards the segment IV of the liver graft; a superficial suture
used to secure the microdialysis catheter to the falciform ligament
2.6 Sampling protocols
2.6.1.1 Liver biopsies
Liver biopsies were obtained from the allografts used in liver transplantation at two
stages during the process of liver transplantation. A specially designed biopsy needle
used for liver biopsy [Menghini liver biopsy needle; Dixons Surgical Instruments,
Wickford, United Kingdom] was a single use sterile needle with core diameter of
1.0mm with the maximum core length of 70mm (figure 2-7). Fixed to a 5cc
disposable syringe partially filled with 0.9% NaCl solution, the needle is inserted to
the liver graft whilst applying the suction force on the plunger of the syringe as the
needle is advanced to the liver parenchyma.
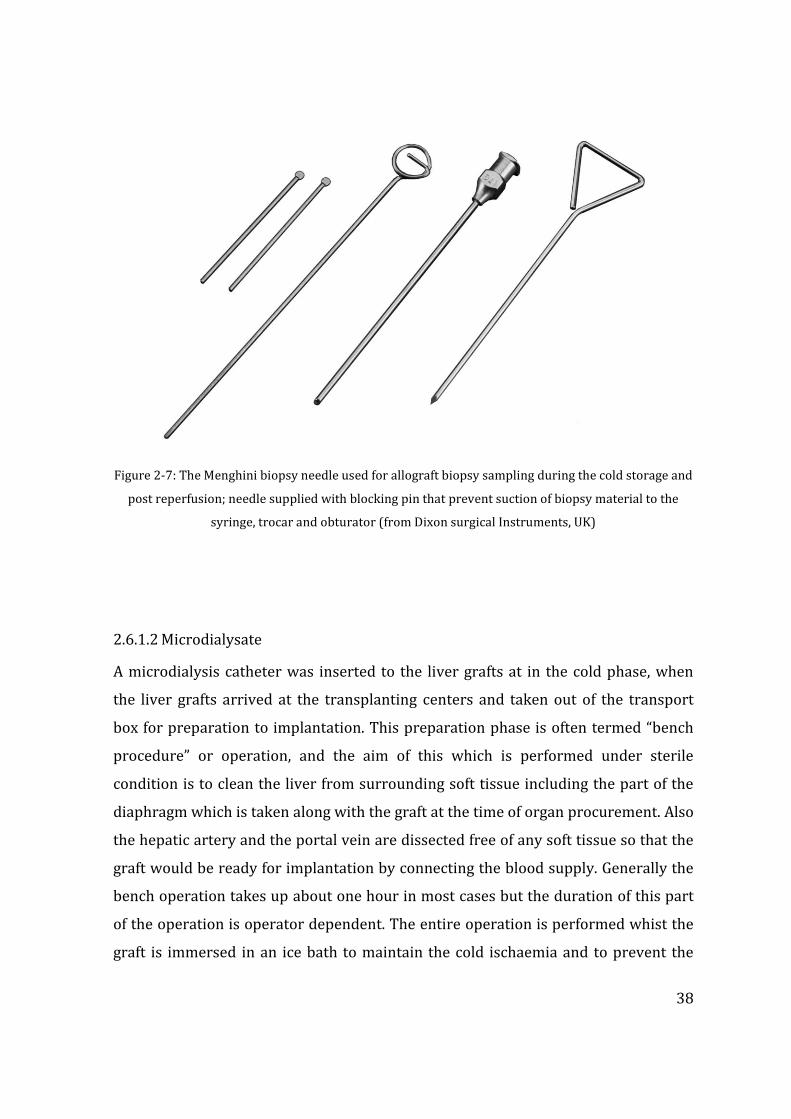
38
Figure 2-7: The Menghini biopsy needle used for allograft biopsy sampling during the cold storage and
post reperfusion; needle supplied with blocking pin that prevent suction of biopsy material to the
syringe, trocar and obturator (from Dixon surgical Instruments, UK)
2.6.1.2 Microdialysate
A microdialysis catheter was inserted to the liver grafts at in the cold phase, when
the liver grafts arrived at the transplanting centers and taken out of the transport
box for preparation to implantation. This preparation phase is often termed “bench
procedure” or operation, and the aim of this which is performed under sterile
condition is to clean the liver from surrounding soft tissue including the part of the
diaphragm which is taken along with the graft at the time of organ procurement. Also
the hepatic artery and the portal vein are dissected free of any soft tissue so that the
graft would be ready for implantation by connecting the blood supply. Generally the
bench operation takes up about one hour in most cases but the duration of this part
of the operation is operator dependent. The entire operation is performed whist the
graft is immersed in an ice bath to maintain the cold ischaemia and to prevent the
39
rewarming of the graft. In transplant practice, the beginning of the bench operation
often simultaneous with the admission of the transplant recipient to the anaesthetic
induction, and this allows the operating surgeon to visually inspect the liver and
make a decision on the usability of the graft.
A microdialysis catheter was inserted at the beginning of the bench operation and
connected to the microdialysis pump for sample collection. Depending on the time of
organ procurement and the planned theatre time for implantation of the graft, a
variable period of cold ischaemia had been elapsed before the insertion of
microdialysis catheter and this was recorded. The sample collection was continued
as long as the graft remained in the ice bath at the end of the bench operation and up
until the graft was taken out of ice for implantation. Therefore the sample collected
represented the latter part of the cold phase of the liver graft preserved in ice, and
depending on the circumstances this ranged from nearly an hour to few hours the
most. Once the graft was ready to be taken out of ice bath for implantation, the
microdialysis catheter was removed along with the sample vial. The sample was
labeled using a labeling system to represent the patient identifier and cold phase.
The implantation phase of the liver graft is usually characterized by two distinctive
phases and the surgical technique is described earlier in this chapter. The
“reperfusion phase” is when the portal vein clamp is released to reperfuse the graft;
the time of reperfusion is usually the portal clamp release time. This was noted in
each case. The arterialisation of the graft begins after this phase followed by the
biliary anastomosis or reconstruction. The surgeon ensures haemostasis is achieved
surgically and coagulation correction is supported by the anaesthetist. Once the
patients achieved stable haemodynamic parameters and when the abdomen is ready
to be closed, a fresh microdialysis catheter was inserted into the implanted liver
graft. This catheter was passed out of the abdomen at the upper end of the abdominal
wound and carefully secured during the abdominal wall closure. The microdialysis
pump and the vials were connected to this circuit and samples were collected at
every six hours from the time of reperfusion. Because the microdialysis catheter was
not introduced at the time of reperfusion of the graft which was impractical in a
highly demanding clinical situation, and this was done only before the abdominal
40
closure, a variable time was lost in each case in the first six hour block after the
reperfusion but this never went beyond six hours. Samples were then collected at
each six hour block until 48 hours after the reperfusion and labeled using the same
method. All microdialysate samples were then stored at -800C.
2.7 Metabolomics
Metabolomics refers to the “study of the metabolome” and is a relatively new area of
research in the biological systems. Small (<1,000 Da) catabolic and anabolic products
(metabolites) can regulate, amongst other processes, cell signalling, cell-to-cell
communication and energy transfer, and can be the first bio chemicals to respond to
internal or external stimuli. This responsiveness makes the metabolome an
informative measure of the cell’s dynamic state, a property that has led to a
considerable and growing interest in the application of metabolomics in the health
sciences. Recently metabolomics has begun to be used in clinical solid organ
transplantation (Bohra et al. 2013;Wishart 2005a) where it holds considerable
promise for the discovery of biomarkers to predict poor graft function or patient
survival, as well as to elucidate the molecular mechanisms underlying
pathophysiological processes such as during graft dysfunction, injury or rejection.
Metabolomic studies have become a reality due to the advancement in the
technological methods in detecting and analysis of smaller molecules way of high
throughput studies. Overall, studies of the systems biology could be of various types
depending on the target molecules of study and form a hierarchy from the nucleic
acids to the metabolic products; for example genomics refer to the study of the genes,
and the study transcription factors of the genes is referred as transcriptonomics.
Proteomics and metabolomics refer to the study of protein proteins and metabolic
end products of such proteins respectively. Metabolomics is the study of the smallest
molecules present in the biological systems (figure 2-8). Meanwhile, genomic studies
represent the capabilities within a biological system to perform various functions
which may or not all occur at any given time. For example certain biological
mechanisms may remain dormant until a particular stimulus causes the gene
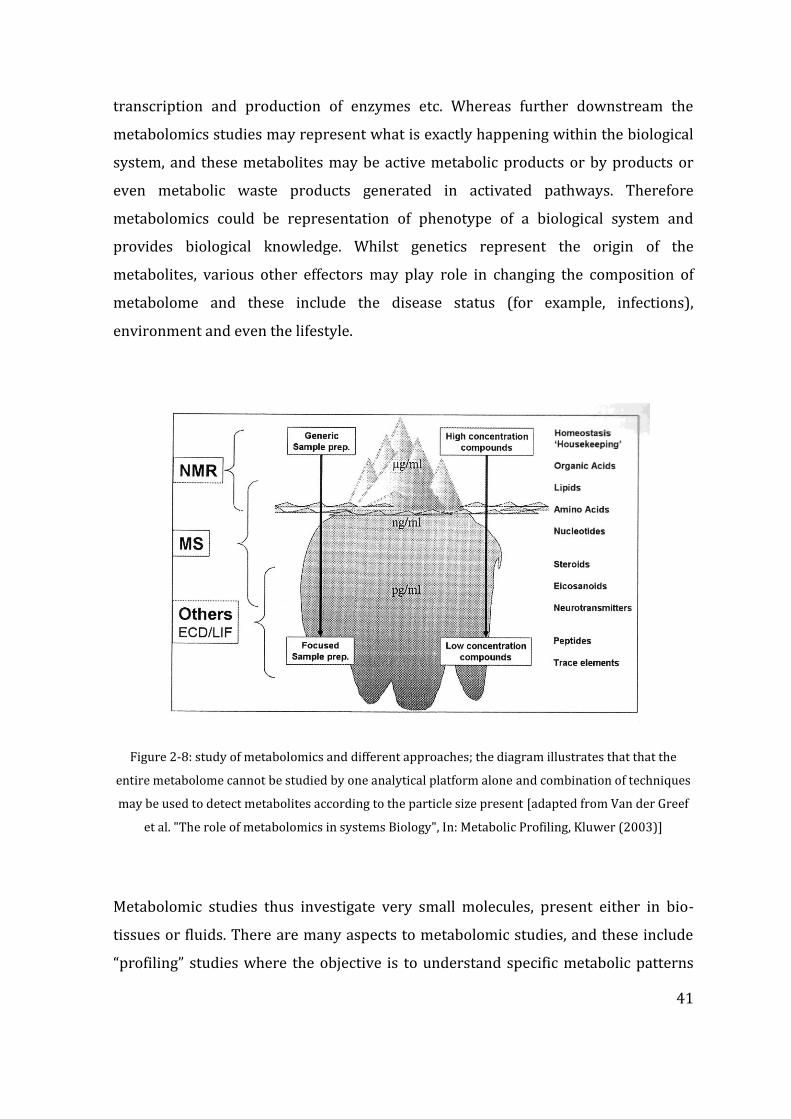
41
transcription and production of enzymes etc. Whereas further downstream the
metabolomics studies may represent what is exactly happening within the biological
system, and these metabolites may be active metabolic products or by products or
even metabolic waste products generated in activated pathways. Therefore
metabolomics could be representation of phenotype of a biological system and
provides biological knowledge. Whilst genetics represent the origin of the
metabolites, various other effectors may play role in changing the composition of
metabolome and these include the disease status (for example, infections),
environment and even the lifestyle.
Figure 2-8: study of metabolomics and different approaches; the diagram illustrates that that the
entire metabolome cannot be studied by one analytical platform alone and combination of techniques
may be used to detect metabolites according to the particle size present [adapted from Van der Greef
et al. "The role of metabolomics in systems Biology", In: Metabolic Profiling, Kluwer (2003)]
Metabolomic studies thus investigate very small molecules, present either in bio-
tissues or fluids. There are many aspects to metabolomic studies, and these include
“profiling” studies where the objective is to understand specific metabolic patterns
42
rather than investigation of specific pathways, which is usually done by “shotgun”
approaches. Shotgun approach allows the though investigation of specific pathways
identified through the profiling studies. A further subset study could be performed in
metabolomics, for example the investigation of the lipids (lipidomics). Metabolomic
studies use the long history of biochemistry in to the use, and looks at “higher order”
information to look at genes and proteins, therefore the closest link to the genes and
metabolic pathways. However, these studies are time consuming, and need specific
instrumentation. Usually metabolomic studies generate millions of data and analysis
of these data requires sophisticated statistical methods and often interpretation of
these data requires the support of bioinformatics.
Several types of metabolomics studies are possible and these are facilitated by
various bio-analytical tools. These include mass spectrometry (MS), Nuclear
magnetic resonance (NMR), Infrared spectroscopy, and electrochemical array
detection. In addition the techniques are usually combined as complementary
techniques, for example liquid chromatography (LC) or gas chromatography (GC)
combined with mass spectrometry (LC-MS and GC-MS respectively). Whilst the
employment of a single technique is helpful in profiling techniques, combination of
different techniques to investigate a particular biological system could be more
advantageous in identifying specific pathways.
43
CHAPTER 3 PROOF OF PRINCIPLE: METABOLOMICS IN
HUMAN LIVER TRANSPLANTATION
The work outlined in this chapter was originated from the collaborative work with the
School of Biosciences, University of Birmingham. Post graduate researcher Olga
Hrydziuszko under the tutelage of Professor Mark Viant provided the technical support
for FTICR analysis and bio-statistical input, and Dr. Doug Richards from the School of
Clinical and Experimental Medicine at the University of Birmingham performed
microdialysis sample analysis through CEAD. The contribution form the researcher
presenting in this thesis was the microdialysis technique, sample collection, clinical
data collection and correlation and interpretation of biostatistics results with clinical
outcomes, and final intellectual contribution to the manuscript provided in appendix 1;
OMICS. 2010;14(2):143-50. doi: 10.1089/omi.2009.0139
At the early phase of the proposed research plan, a smaller group of liver grafts used
in liver transplantation was used to investigate the applicability of the metabolomic
analytical platform described in the previous chapter. This was termed a proof of
principle study, and was specifically aimed at detecting the capability of FTICR mass
spectrometry and Coulometric electrochemical array detection (CEAD) as analytical
platforms using the samples described previously (Hrydziuszko et al. 2010a). In this
study, eight (n=8) consented adult patients undergoing orthotopic liver
transplantation were recruited. The median age of recipients was 56 (46 - 62) years.
The median MELD score was 20 (range 15-22).
At the end of each recipient operation, a microdialysis catheter was inserted to the
liver as described earlier in chapter 2 (Silva, Richards, Bramhall, Adams, Mirza, &
Murphy 2005). Bench phase microdialysis sampling was not carried out in this
smaller study as longitudinal investigation of biomarker changes through cold
44
ischaemia to reperfusion was not aimed. Serial hourly samples were collected during
the next 48 hours post reperfusion and 10l of each sample were injected into the
HPLC/CEAD system and chromatographic data analysis was carried out as discussed
previously. Spontaneous intra-cranial bleed was the cause of brain death in all
donors and the median donor age was 66 (range 40-72). In this proof of principle
study, 7 out of 8 liver grafts were obtained from donors after brain death
determination (DBD) whilst the remaining liver graft was from a DCD donor. The
clinical outcomes following the transplantation included one case initial poor
function (IPF) in the graft with AST levels of >1000 IU/L and INR >1.4 in the second
day following liver transplant. Two patients died within 2 months following
operation (one due to due to disseminated intravascular coagulation secondary to
sepsis and multi organ failure, and the other due to unexplained cardiac arrest on
day 5).
3.1 Liver biopsy and FT-ICR MS metabolomics
Liver tissue samples were obtained by Menghini biopsy were available for seven
liver allografts at two stages during transplant process: T1 was obtained during the
cold phase bench preparation of the liver graft whilst the organ is maintained at 4C,
and T2 at the end of transplantation surgery before abdominal closure (warm
ischemia and reperfusion injury), resulting in a total of 14 samples. Liver biopsies
were extracted using a methanol:chloroform:water method (Taylor et al. 2009) and
the polar metabolites analysed by direct infusion nanoelectrospray FT-ICR mass
spectrometry (selected ion monitoring (SIM) spectral stitching); m/z 70 to 500;
positive and negative ion modes, with each sample analyzed in duplicate) (Southam
et al. 2007). Spectra were processed as described previously including a 3-step
filtering algorithm (Payne et al. 2009) that excluded from the peak list all of the
known drugs administered to the donors and/or recipients.
45
3.2 Extracellular fluid and CEAD metabolomics
At the end of the recipient operation, a microdialysis catheter was inserted into the
liver as described earlier in chapter 2 (Silva, Richards, Bramhall, Adams, Mirza, &
Murphy 2005). The Bench phase microdialysis sampling was carried out in this
smaller study as longitudinal investigation of metabolic changes through cold
ischaemia to reperfusion was not aimed. Serial hourly dialysate samples were
collected during the next 48 hours and 10l of each sample were injected into the
HPLC/CEAD system and chromatographic data analysis was carried out as discussed
previously. Table 3-1 demonstrates some selected demographics along with the time
sequence including the cold and warm ischaemia times and graft outcomes.
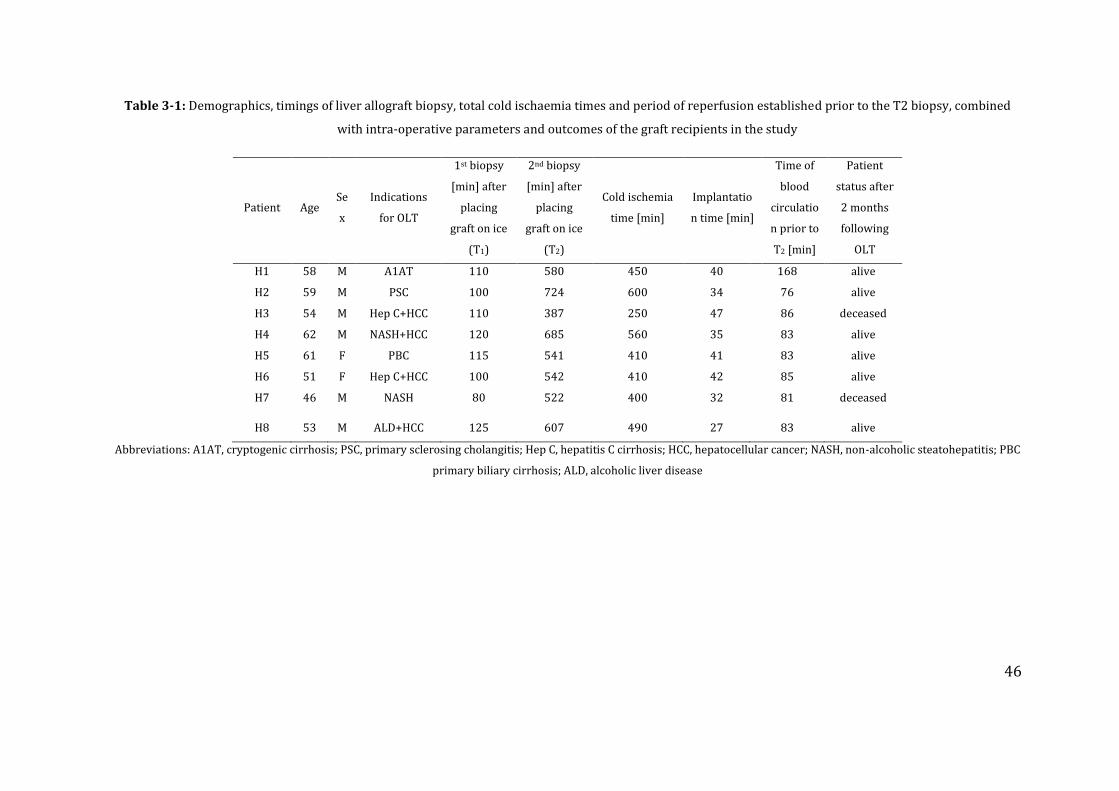
46
Table 3-1: Demographics, timings of liver allograft biopsy, total cold ischaemia times and period of reperfusion established prior to the T2 biopsy, combined
with intra-operative parameters and outcomes of the graft recipients in the study
Patient Age Se
x
Indications
for OLT
1st biopsy
[min] after
placing
graft on ice
(T1)
2nd biopsy
[min] after
placing
graft on ice
(T2)
Cold ischemia
time [min]
Implantatio
n time [min]
Time of
blood
circulatio
n prior to
T2 [min]
Patient
status after
2 months
following
OLT
H1 58 M A1AT 110 580 450 40 168 alive
H2 59 M PSC 100 724 600 34 76 alive
H3 54 M Hep C+HCC 110 387 250 47 86 deceased
H4 62 M NASH+HCC 120 685 560 35 83 alive
H5 61 F PBC 115 541 410 41 83 alive
H6 51 F Hep C+HCC 100 542 410 42 85 alive
H7 46 M NASH 80 522 400 32 81 deceased
H8 53 M ALD+HCC 125 607 490 27 83 alive
Abbreviations: A1AT, cryptogenic cirrhosis; PSC, primary sclerosing cholangitis; Hep C, hepatitis C cirrhosis; HCC, hepatocellular cancer; NASH, non-alcoholic steatohepatitis; PBC
primary biliary cirrhosis; ALD, alcoholic liver disease
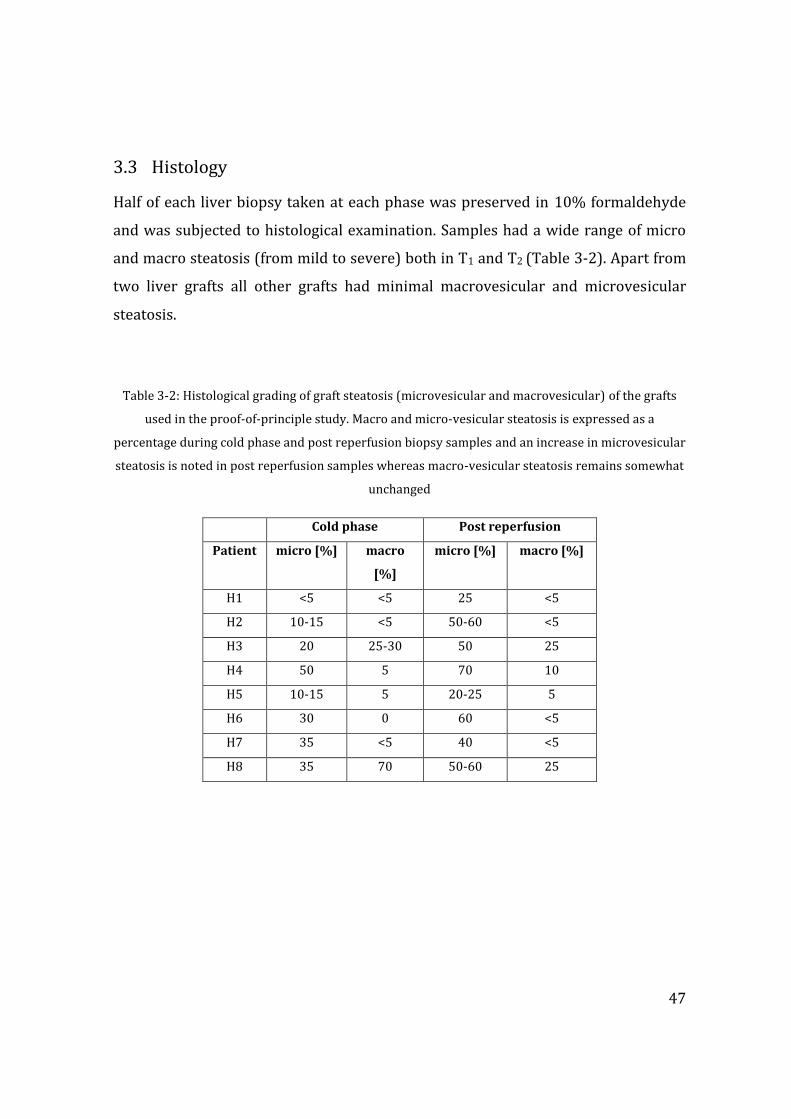
47
3.3 Histology
Half of each liver biopsy taken at each phase was preserved in 10% formaldehyde
and was subjected to histological examination. Samples had a wide range of micro
and macro steatosis (from mild to severe) both in T1 and T2 (Table 3-2). Apart from
two liver grafts all other grafts had minimal macrovesicular and microvesicular
steatosis.
Table 3-2: Histological grading of graft steatosis (microvesicular and macrovesicular) of the grafts
used in the proof-of-principle study. Macro and micro-vesicular steatosis is expressed as a
percentage during cold phase and post reperfusion biopsy samples and an increase in microvesicular
steatosis is noted in post reperfusion samples whereas macro-vesicular steatosis remains somewhat
unchanged
Cold phase Post reperfusion
Patient micro [%] macro
[%]
micro [%] macro [%]
H1 <5 <5 25 <5
H2 10-15 <5 50-60 <5
H3 20 25-30 50 25
H4 50 5 70 10
H5 10-15 5 20-25 5
H6 30 0 60 <5
H7 35 <5 40 <5
H8 35 70 50-60 25
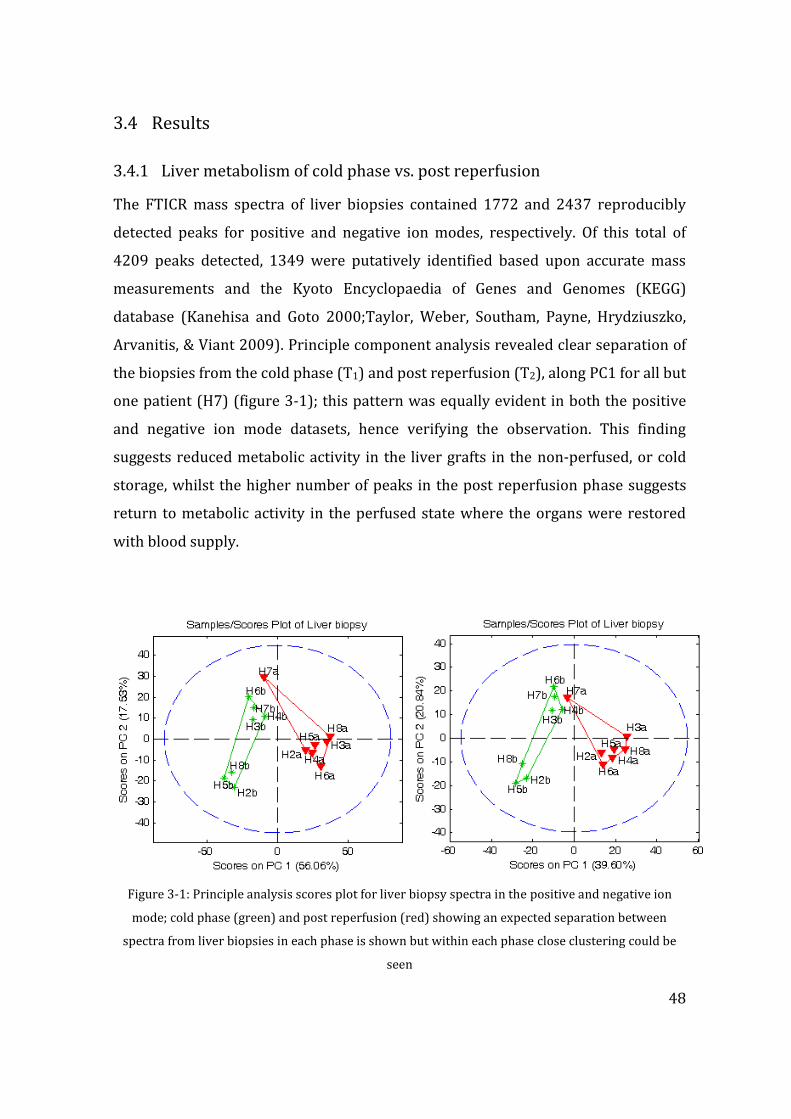
48
3.4 Results
3.4.1 Liver metabolism of cold phase vs. post reperfusion
The FTICR mass spectra of liver biopsies contained 1772 and 2437 reproducibly
detected peaks for positive and negative ion modes, respectively. Of this total of
4209 peaks detected, 1349 were putatively identified based upon accurate mass
measurements and the Kyoto Encyclopaedia of Genes and Genomes (KEGG)
database (Kanehisa and Goto 2000;Taylor, Weber, Southam, Payne, Hrydziuszko,
Arvanitis, & Viant 2009). Principle component analysis revealed clear separation of
the biopsies from the cold phase (T1) and post reperfusion (T2), along PC1 for all but
one patient (H7) (figure 3-1); this pattern was equally evident in both the positive
and negative ion mode datasets, hence verifying the observation. This finding
suggests reduced metabolic activity in the liver grafts in the non-perfused, or cold
storage, whilst the higher number of peaks in the post reperfusion phase suggests
return to metabolic activity in the perfused state where the organs were restored
with blood supply.
Figure 3-1: Principle analysis scores plot for liver biopsy spectra in the positive and negative ion
mode; cold phase (green) and post reperfusion (red) showing an expected separation between
spectra from liver biopsies in each phase is shown but within each phase close clustering could be
seen
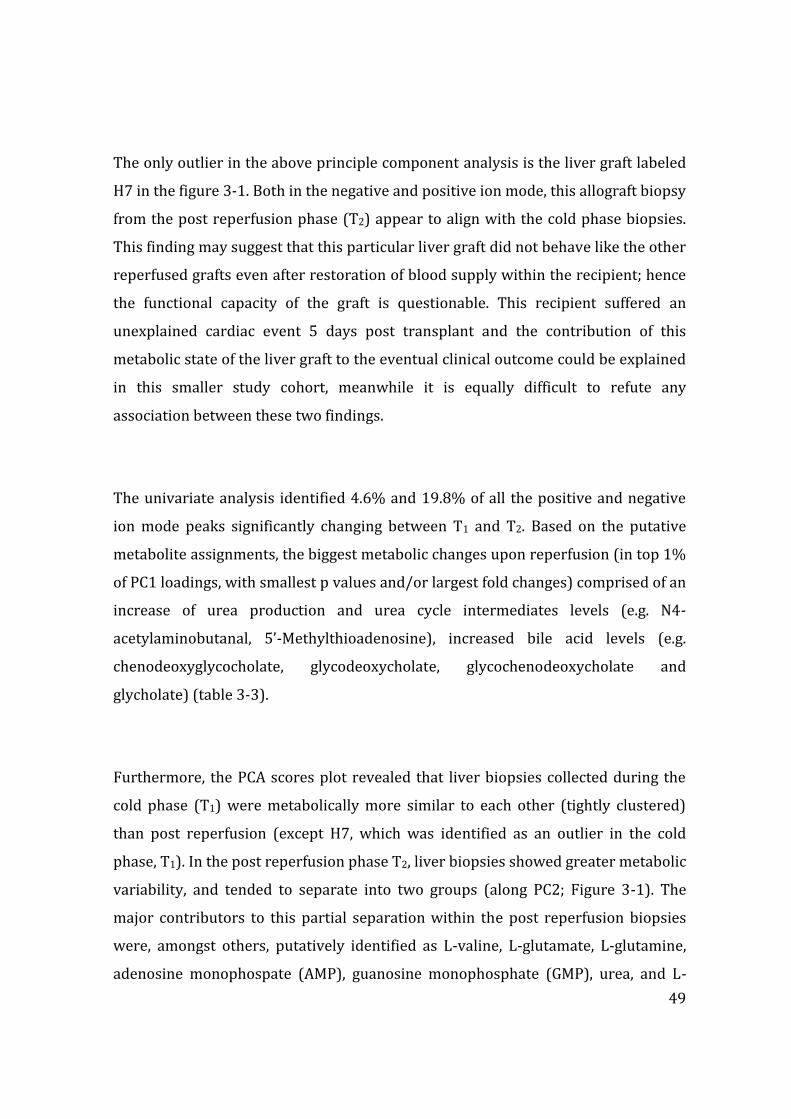
49
The only outlier in the above principle component analysis is the liver graft labeled
H7 in the figure 3-1. Both in the negative and positive ion mode, this allograft biopsy
from the post reperfusion phase (T2) appear to align with the cold phase biopsies.
This finding may suggest that this particular liver graft did not behave like the other
reperfused grafts even after restoration of blood supply within the recipient; hence
the functional capacity of the graft is questionable. This recipient suffered an
unexplained cardiac event 5 days post transplant and the contribution of this
metabolic state of the liver graft to the eventual clinical outcome could be explained
in this smaller study cohort, meanwhile it is equally difficult to refute any
association between these two findings.
The univariate analysis identified 4.6% and 19.8% of all the positive and negative
ion mode peaks significantly changing between T1 and T2. Based on the putative
metabolite assignments, the biggest metabolic changes upon reperfusion (in top 1%
of PC1 loadings, with smallest p values and/or largest fold changes) comprised of an
increase of urea production and urea cycle intermediates levels (e.g. N4-
acetylaminobutanal, 5’-Methylthioadenosine), increased bile acid levels (e.g.
chenodeoxyglycocholate, glycodeoxycholate, glycochenodeoxycholate and
glycholate) (table 3-3).
Furthermore, the PCA scores plot revealed that liver biopsies collected during the
cold phase (T1) were metabolically more similar to each other (tightly clustered)
than post reperfusion (except H7, which was identified as an outlier in the cold
phase, T1). In the post reperfusion phase T2, liver biopsies showed greater metabolic
variability, and tended to separate into two groups (along PC2; Figure 3-1). The
major contributors to this partial separation within the post reperfusion biopsies
were, amongst others, putatively identified as L-valine, L-glutamate, L-glutamine,
adenosine monophospate (AMP), guanosine monophosphate (GMP), urea, and L-
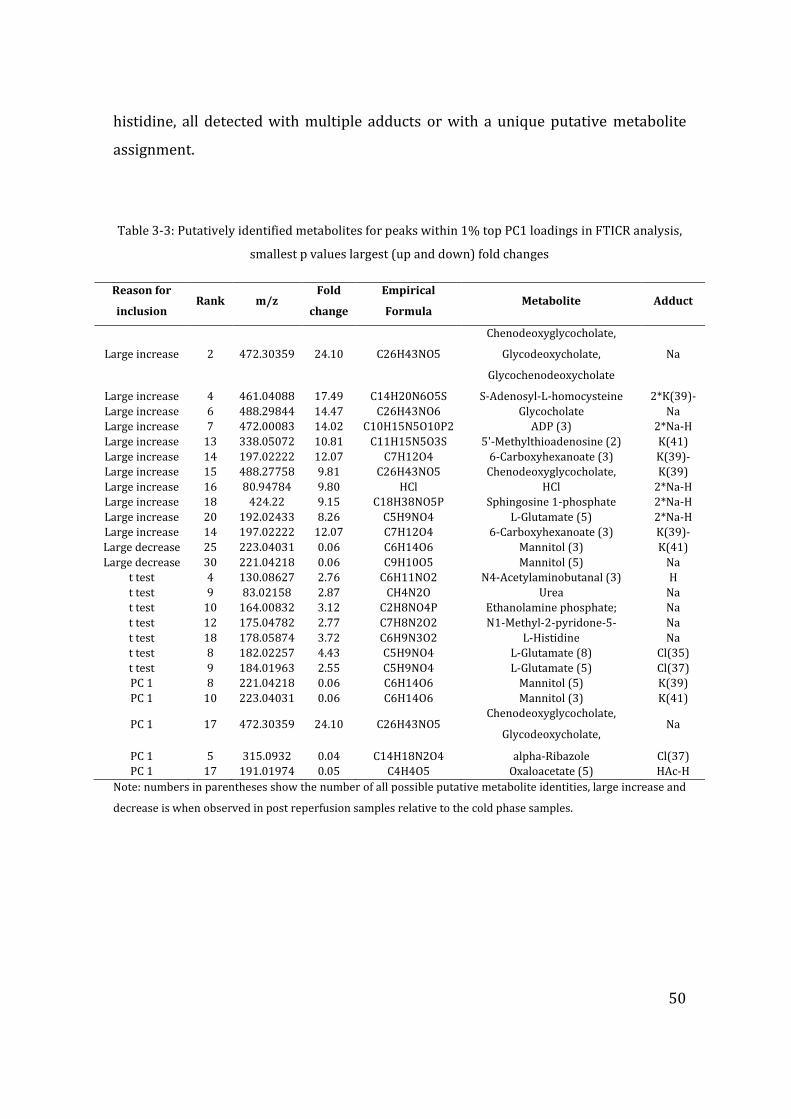
50
histidine, all detected with multiple adducts or with a unique putative metabolite
assignment.
Table 3-3: Putatively identified metabolites for peaks within 1% top PC1 loadings in FTICR analysis,
smallest p values largest (up and down) fold changes
Reason for
inclusion Rank m/z
Fold
change
Empirical
Formula Metabolite Adduct
Large increase 2 472.30359 24.10 C26H43NO5
Chenodeoxyglycocholate,
Glycodeoxycholate,
Glycochenodeoxycholate
Na
Large increase 4 461.04088 17.49 C14H20N6O5S S-Adenosyl-L-homocysteine 2*K(39)-
H Large increase 6 488.29844 14.47 C26H43NO6 Glycocholate Na
Large increase 7 472.00083 14.02 C10H15N5O10P2 ADP (3) 2*Na-H
Large increase 13 338.05072 10.81 C11H15N5O3S 5'-Methylthioadenosine (2) K(41)
Large increase 14 197.02222 12.07 C7H12O4 6-Carboxyhexanoate (3) K(39)-
2*H Large increase 15 488.27758 9.81 C26H43NO5 Chenodeoxyglycocholate,
Glycodeoxycholate,
Glycochenodeoxycholate
K(39)
Large increase 16 80.94784 9.80 HCl HCl 2*Na-H
Large increase 18 424.22 9.15 C18H38NO5P Sphingosine 1-phosphate 2*Na-H
Large increase 20 192.02433 8.26 C5H9NO4 L-Glutamate (5) 2*Na-H
Large increase 14 197.02222 12.07 C7H12O4 6-Carboxyhexanoate (3) K(39)-
2*H Large decrease 25 223.04031 0.06 C6H14O6 Mannitol (3) K(41)
Large decrease 30 221.04218 0.06 C9H10O5 Mannitol (5) Na
t test 4 130.08627 2.76 C6H11NO2 N4-Acetylaminobutanal (3) H
t test 9 83.02158 2.87 CH4N2O Urea Na
t test 10 164.00832 3.12 C2H8NO4P Ethanolamine phosphate; Na
t test 12 175.04782 2.77 C7H8N2O2 N1-Methyl-2-pyridone-5-
carboxamide (2)
Na
t test 18 178.05874 3.72 C6H9N3O2 L-Histidine Na
t test 8 182.02257 4.43 C5H9NO4 L-Glutamate (8) Cl(35)
t test 9 184.01963 2.55 C5H9NO4 L-Glutamate (5) Cl(37)
PC 1 8 221.04218 0.06 C6H14O6 Mannitol (5) K(39)
PC 1 10 223.04031 0.06 C6H14O6 Mannitol (3) K(41)
PC 1 17 472.30359 24.10 C26H43NO5 Chenodeoxyglycocholate,
Glycodeoxycholate,
Glycochenodeoxycholate
Na
PC 1 5 315.0932 0.04 C14H18N2O4 alpha-Ribazole Cl(37)
PC 1 17 191.01974 0.05 C4H4O5 Oxaloacetate (5) HAc-H
Note: numbers in parentheses show the number of all possible putative metabolite identities, large increase and
decrease is when observed in post reperfusion samples relative to the cold phase samples.
51
3.4.1.1 Relating molecular phenotype to clinical outcome – preliminary
findings
Peaks detected in the early post reperfusion phase (T2) that could predict successful
vs. unsuccessful patient outcome were identified using KNN algorithm. The two
unsuccessful grafts were characterized by elevated levels of L-glutamate,
homoarginine, glycerophosphocholine (GPC), 1-ribosylimidazole-4-acetate
(histidine metabolism) and O-succinyl-L-homoserine (methionine and sulfur
metabolism), 7,8-Dihydro-7,8-dihydroxykynurenate, 4-(2-Amino-3-
hydroxyphenyl)-2,4-dioxobutanoate and 4-(2-Amino-5-hydroxyphenyl)-2,4-
dioxobutanoate (tryptophan metabolism) all detected with multiple adducts or with
only one putative metabolite assignment (Table 3-4). Tryptophan metabolism
appeared to be altered – peak was assigned multiple putative metabolites and latter
three identified metabolites were participating in tryptophan metabolism.
Successful grafts were characterized by altered (increased metabolite levels)
pentose phosphate pathway and pentose-glucuronate interconversion (e.g. D-
ribose) and pyrimidine metabolism (e.g. uridine), and the conversely the lack of
above conversions was a remarkable finding in those grafts with an unsuccessful
outcome.
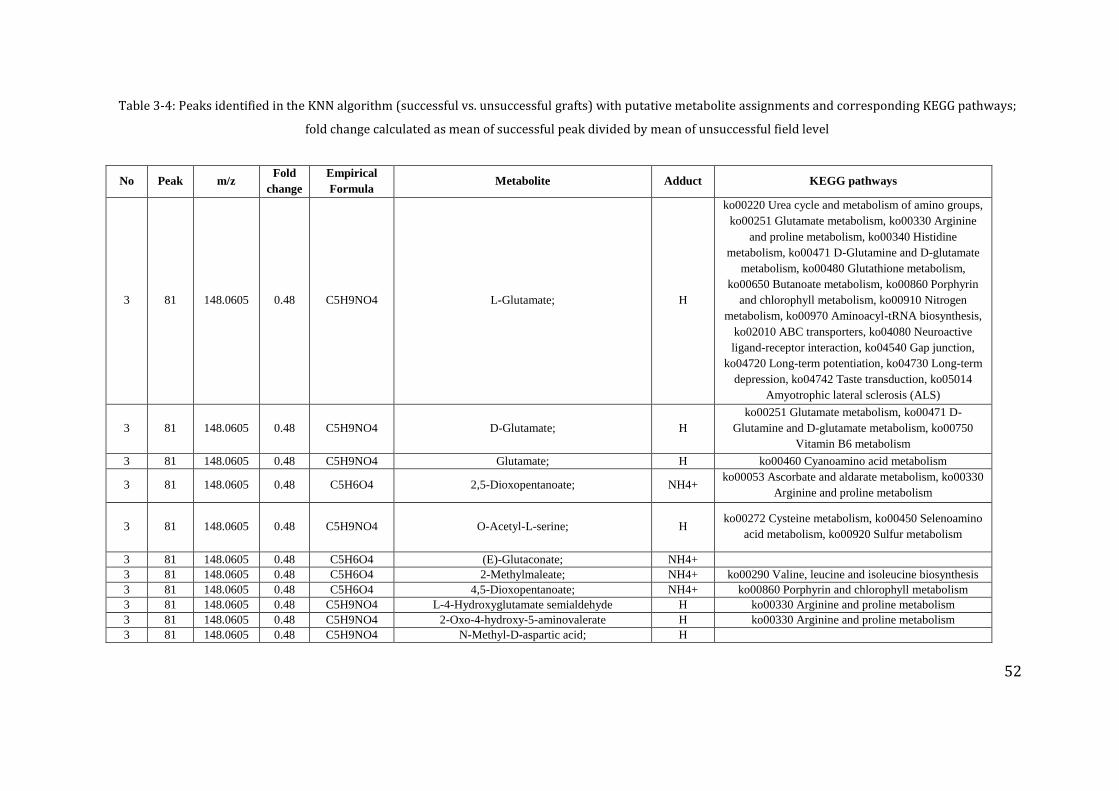
52
Table 3-4: Peaks identified in the KNN algorithm (successful vs. unsuccessful grafts) with putative metabolite assignments and corresponding KEGG pathways;
fold change calculated as mean of successful peak divided by mean of unsuccessful field level
No Peak m/z Fold
change
Empirical
Formula Metabolite Adduct KEGG pathways
3 81 148.0605 0.48 C5H9NO4 L-Glutamate; H
ko00220 Urea cycle and metabolism of amino groups,
ko00251 Glutamate metabolism, ko00330 Arginine
and proline metabolism, ko00340 Histidine
metabolism, ko00471 D-Glutamine and D-glutamate
metabolism, ko00480 Glutathione metabolism,
ko00650 Butanoate metabolism, ko00860 Porphyrin
and chlorophyll metabolism, ko00910 Nitrogen
metabolism, ko00970 Aminoacyl-tRNA biosynthesis,
ko02010 ABC transporters, ko04080 Neuroactive
ligand-receptor interaction, ko04540 Gap junction,
ko04720 Long-term potentiation, ko04730 Long-term
depression, ko04742 Taste transduction, ko05014
Amyotrophic lateral sclerosis (ALS)
3 81 148.0605 0.48 C5H9NO4 D-Glutamate; H
ko00251 Glutamate metabolism, ko00471 D-
Glutamine and D-glutamate metabolism, ko00750
Vitamin B6 metabolism
3 81 148.0605 0.48 C5H9NO4 Glutamate; H ko00460 Cyanoamino acid metabolism
3 81 148.0605 0.48 C5H6O4 2,5-Dioxopentanoate; NH4+ ko00053 Ascorbate and aldarate metabolism, ko00330
Arginine and proline metabolism
3 81 148.0605 0.48 C5H9NO4 O-Acetyl-L-serine; H ko00272 Cysteine metabolism, ko00450 Selenoamino
acid metabolism, ko00920 Sulfur metabolism
3 81 148.0605 0.48 C5H6O4 (E)-Glutaconate; NH4+
3 81 148.0605 0.48 C5H6O4 2-Methylmaleate; NH4+ ko00290 Valine, leucine and isoleucine biosynthesis
3 81 148.0605 0.48 C5H6O4 4,5-Dioxopentanoate; NH4+ ko00860 Porphyrin and chlorophyll metabolism
3 81 148.0605 0.48 C5H9NO4 L-4-Hydroxyglutamate semialdehyde H ko00330 Arginine and proline metabolism
3 81 148.0605 0.48 C5H9NO4 2-Oxo-4-hydroxy-5-aminovalerate H ko00330 Arginine and proline metabolism
3 81 148.0605 0.48 C5H9NO4 N-Methyl-D-aspartic acid; H
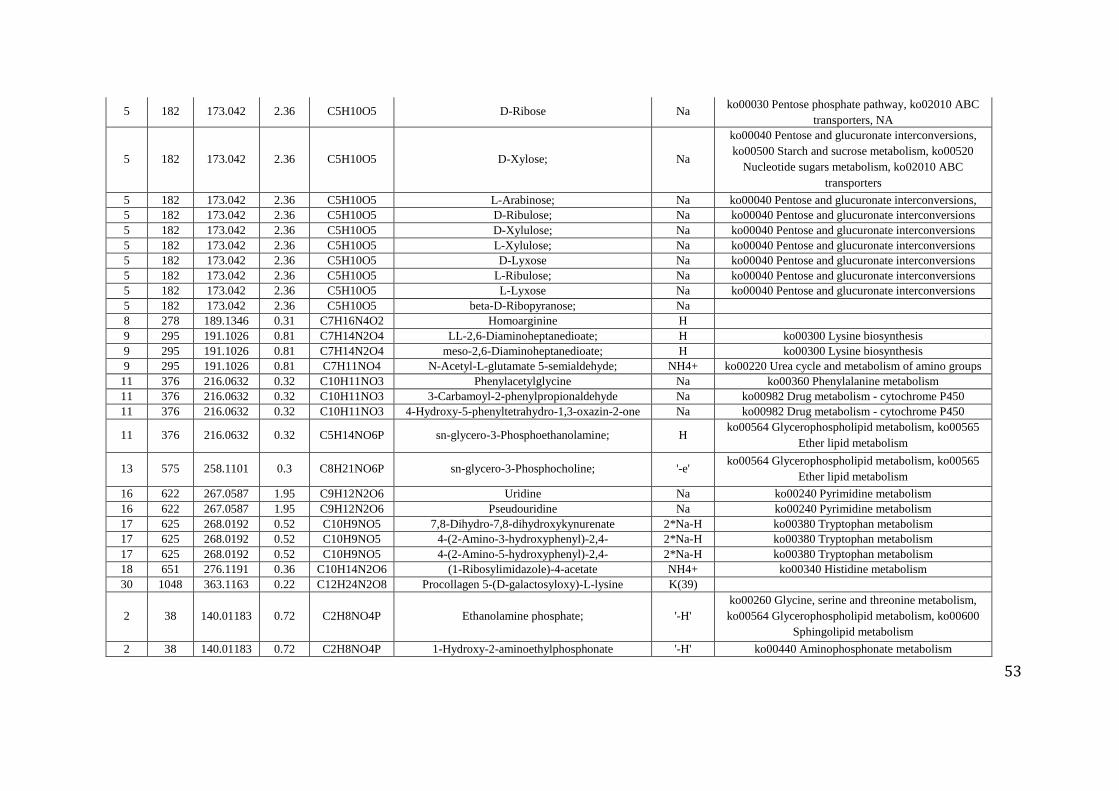
53
5 182 173.042 2.36 C5H10O5 D-Ribose Na ko00030 Pentose phosphate pathway, ko02010 ABC
transporters, NA
5 182 173.042 2.36 C5H10O5 D-Xylose; Na
ko00040 Pentose and glucuronate interconversions,
ko00500 Starch and sucrose metabolism, ko00520
Nucleotide sugars metabolism, ko02010 ABC
transporters
5 182 173.042 2.36 C5H10O5 L-Arabinose; Na ko00040 Pentose and glucuronate interconversions,
ko00053 Ascorbate and aldarate metabolism, ko00520
Nucleotide sugars metabolism, ko02010 ABC
transporters
5 182 173.042 2.36 C5H10O5 D-Ribulose; Na ko00040 Pentose and glucuronate interconversions
5 182 173.042 2.36 C5H10O5 D-Xylulose; Na ko00040 Pentose and glucuronate interconversions
5 182 173.042 2.36 C5H10O5 L-Xylulose; Na ko00040 Pentose and glucuronate interconversions
5 182 173.042 2.36 C5H10O5 D-Lyxose Na ko00040 Pentose and glucuronate interconversions
5 182 173.042 2.36 C5H10O5 L-Ribulose; Na ko00040 Pentose and glucuronate interconversions
5 182 173.042 2.36 C5H10O5 L-Lyxose Na ko00040 Pentose and glucuronate interconversions
5 182 173.042 2.36 C5H10O5 beta-D-Ribopyranose; Na
8 278 189.1346 0.31 C7H16N4O2 Homoarginine H
9 295 191.1026 0.81 C7H14N2O4 LL-2,6-Diaminoheptanedioate; H ko00300 Lysine biosynthesis
9 295 191.1026 0.81 C7H14N2O4 meso-2,6-Diaminoheptanedioate; H ko00300 Lysine biosynthesis
9 295 191.1026 0.81 C7H11NO4 N-Acetyl-L-glutamate 5-semialdehyde; NH4+ ko00220 Urea cycle and metabolism of amino groups
11 376 216.0632 0.32 C10H11NO3 Phenylacetylglycine Na ko00360 Phenylalanine metabolism
11 376 216.0632 0.32 C10H11NO3 3-Carbamoyl-2-phenylpropionaldehyde Na ko00982 Drug metabolism - cytochrome P450
11 376 216.0632 0.32 C10H11NO3 4-Hydroxy-5-phenyltetrahydro-1,3-oxazin-2-one Na ko00982 Drug metabolism - cytochrome P450
11 376 216.0632 0.32 C5H14NO6P sn-glycero-3-Phosphoethanolamine; H ko00564 Glycerophospholipid metabolism, ko00565
Ether lipid metabolism
13 575 258.1101 0.3 C8H21NO6P sn-glycero-3-Phosphocholine; '-e' ko00564 Glycerophospholipid metabolism, ko00565
Ether lipid metabolism
16 622 267.0587 1.95 C9H12N2O6 Uridine Na ko00240 Pyrimidine metabolism
16 622 267.0587 1.95 C9H12N2O6 Pseudouridine Na ko00240 Pyrimidine metabolism
17 625 268.0192 0.52 C10H9NO5 7,8-Dihydro-7,8-dihydroxykynurenate 2*Na-H ko00380 Tryptophan metabolism
17 625 268.0192 0.52 C10H9NO5 4-(2-Amino-3-hydroxyphenyl)-2,4-
dioxobutanoate
2*Na-H ko00380 Tryptophan metabolism
17 625 268.0192 0.52 C10H9NO5 4-(2-Amino-5-hydroxyphenyl)-2,4-
dioxobutanoate
2*Na-H ko00380 Tryptophan metabolism
18 651 276.1191 0.36 C10H14N2O6 (1-Ribosylimidazole)-4-acetate NH4+ ko00340 Histidine metabolism
30 1048 363.1163 0.22 C12H24N2O8 Procollagen 5-(D-galactosyloxy)-L-lysine K(39)
2 38 140.01183 0.72 C2H8NO4P Ethanolamine phosphate; '-H'
ko00260 Glycine, serine and threonine metabolism,
ko00564 Glycerophospholipid metabolism, ko00600
Sphingolipid metabolism
2 38 140.01183 0.72 C2H8NO4P 1-Hydroxy-2-aminoethylphosphonate '-H' ko00440 Aminophosphonate metabolism
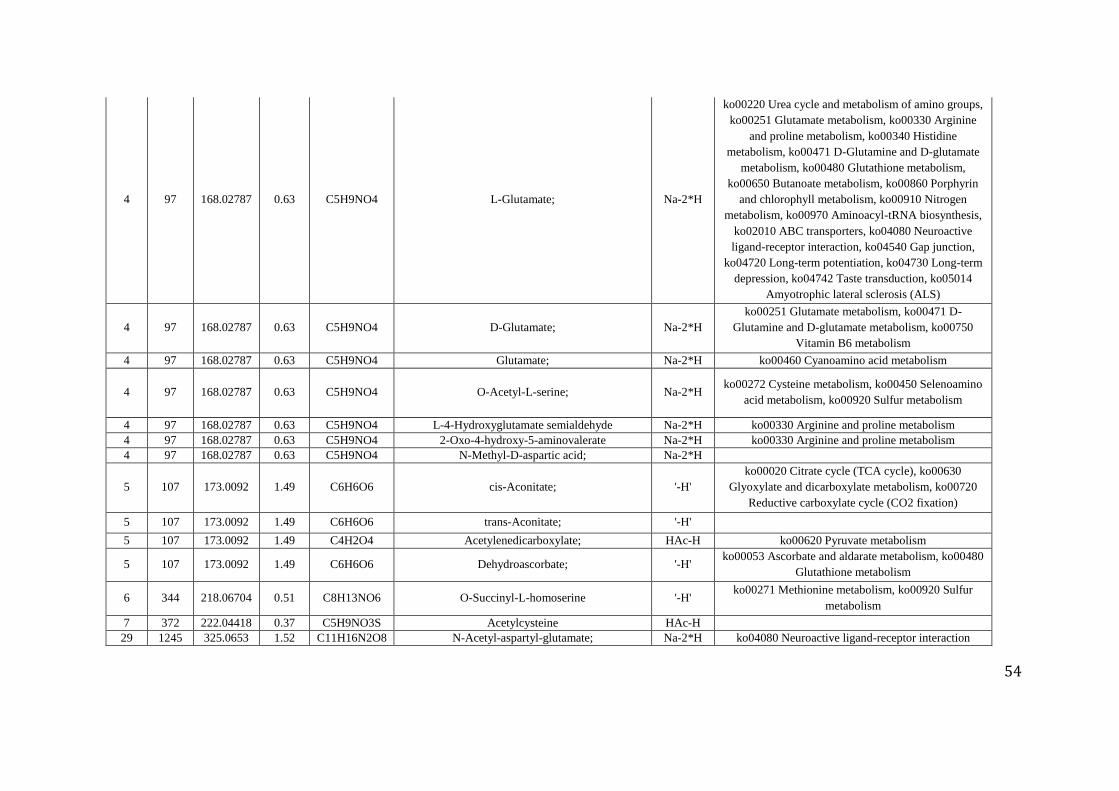
54
4 97 168.02787 0.63 C5H9NO4 L-Glutamate; Na-2*H
ko00220 Urea cycle and metabolism of amino groups,
ko00251 Glutamate metabolism, ko00330 Arginine
and proline metabolism, ko00340 Histidine
metabolism, ko00471 D-Glutamine and D-glutamate
metabolism, ko00480 Glutathione metabolism,
ko00650 Butanoate metabolism, ko00860 Porphyrin
and chlorophyll metabolism, ko00910 Nitrogen
metabolism, ko00970 Aminoacyl-tRNA biosynthesis,
ko02010 ABC transporters, ko04080 Neuroactive
ligand-receptor interaction, ko04540 Gap junction,
ko04720 Long-term potentiation, ko04730 Long-term
depression, ko04742 Taste transduction, ko05014
Amyotrophic lateral sclerosis (ALS)
4 97 168.02787 0.63 C5H9NO4 D-Glutamate; Na-2*H
ko00251 Glutamate metabolism, ko00471 D-
Glutamine and D-glutamate metabolism, ko00750
Vitamin B6 metabolism
4 97 168.02787 0.63 C5H9NO4 Glutamate; Na-2*H ko00460 Cyanoamino acid metabolism
4 97 168.02787 0.63 C5H9NO4 O-Acetyl-L-serine; Na-2*H ko00272 Cysteine metabolism, ko00450 Selenoamino
acid metabolism, ko00920 Sulfur metabolism
4 97 168.02787 0.63 C5H9NO4 L-4-Hydroxyglutamate semialdehyde Na-2*H ko00330 Arginine and proline metabolism
4 97 168.02787 0.63 C5H9NO4 2-Oxo-4-hydroxy-5-aminovalerate Na-2*H ko00330 Arginine and proline metabolism
4 97 168.02787 0.63 C5H9NO4 N-Methyl-D-aspartic acid; Na-2*H
5 107 173.0092 1.49 C6H6O6 cis-Aconitate; '-H'
ko00020 Citrate cycle (TCA cycle), ko00630
Glyoxylate and dicarboxylate metabolism, ko00720
Reductive carboxylate cycle (CO2 fixation)
5 107 173.0092 1.49 C6H6O6 trans-Aconitate; '-H'
5 107 173.0092 1.49 C4H2O4 Acetylenedicarboxylate; HAc-H ko00620 Pyruvate metabolism
5 107 173.0092 1.49 C6H6O6 Dehydroascorbate; '-H' ko00053 Ascorbate and aldarate metabolism, ko00480
Glutathione metabolism
6 344 218.06704 0.51 C8H13NO6 O-Succinyl-L-homoserine '-H' ko00271 Methionine metabolism, ko00920 Sulfur
metabolism
7 372 222.04418 0.37 C5H9NO3S Acetylcysteine HAc-H
29 1245 325.0653 1.52 C11H16N2O8 N-Acetyl-aspartyl-glutamate; Na-2*H ko04080 Neuroactive ligand-receptor interaction
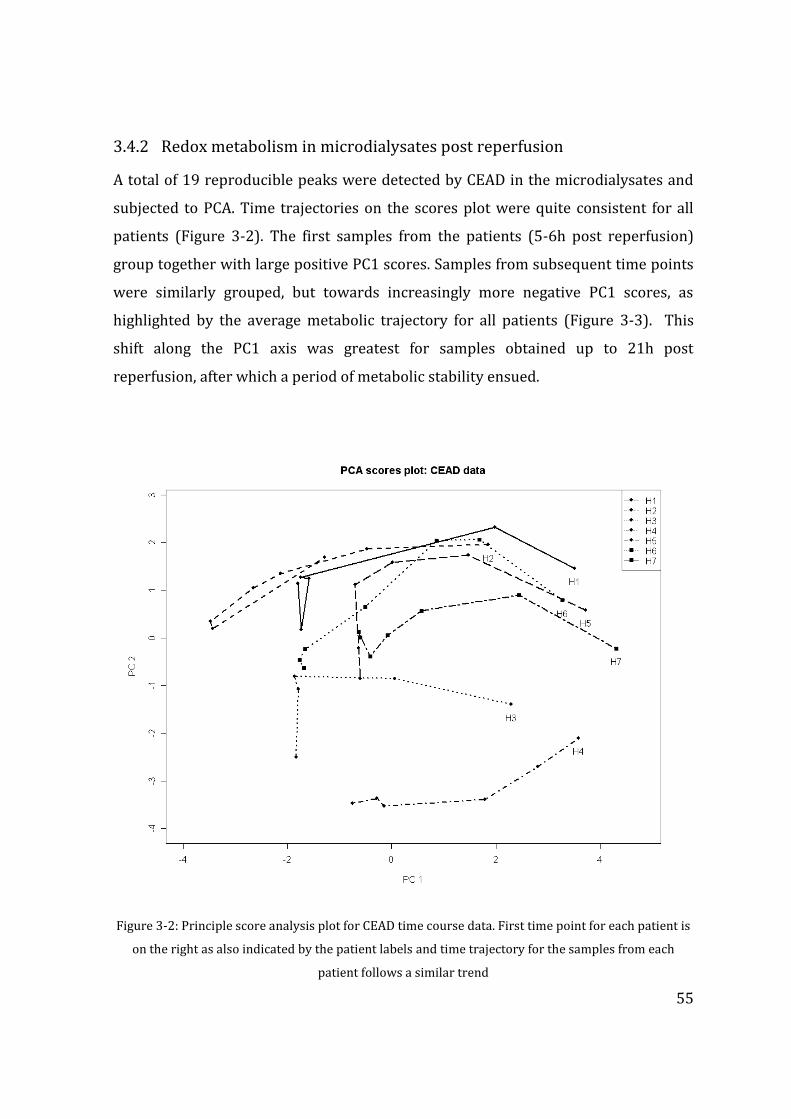
55
3.4.2 Redox metabolism in microdialysates post reperfusion
A total of 19 reproducible peaks were detected by CEAD in the microdialysates and
subjected to PCA. Time trajectories on the scores plot were quite consistent for all
patients (Figure 3-2). The first samples from the patients (5-6h post reperfusion)
group together with large positive PC1 scores. Samples from subsequent time points
were similarly grouped, but towards increasingly more negative PC1 scores, as
highlighted by the average metabolic trajectory for all patients (Figure 3-3). This
shift along the PC1 axis was greatest for samples obtained up to 21h post
reperfusion, after which a period of metabolic stability ensued.
Figure 3-2: Principle score analysis plot for CEAD time course data. First time point for each patient is
on the right as also indicated by the patient labels and time trajectory for the samples from each
patient follows a similar trend
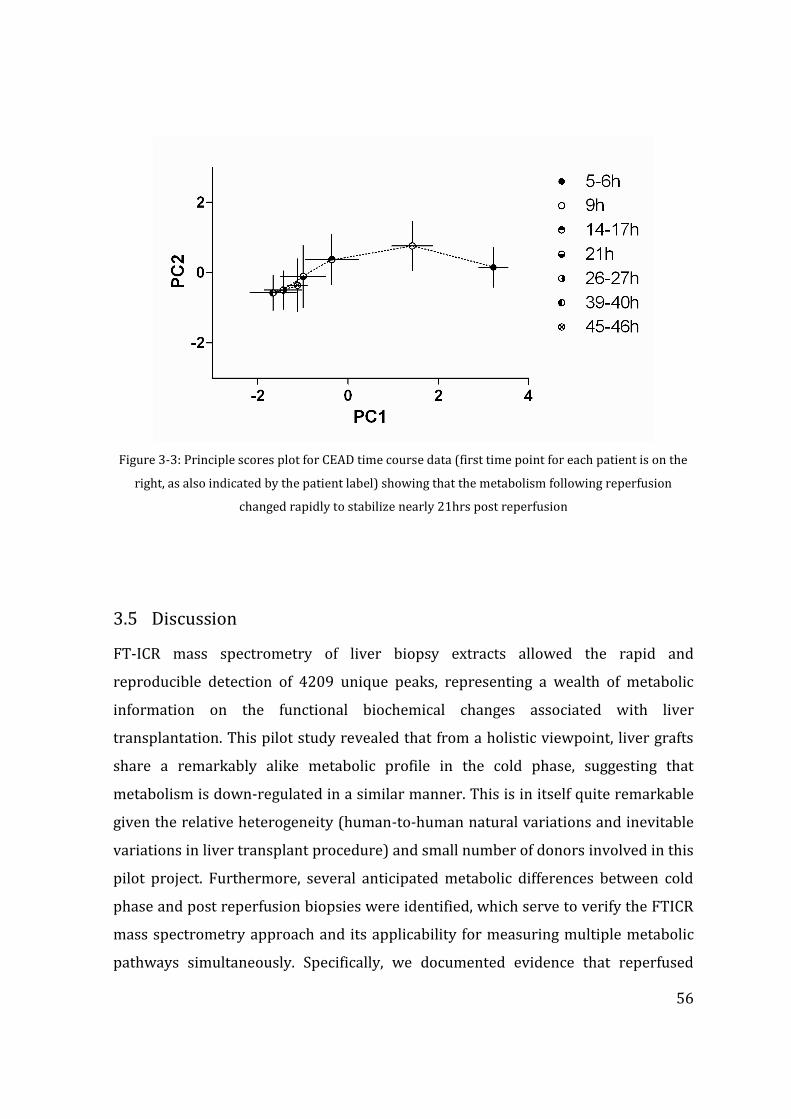
56
Figure 3-3: Principle scores plot for CEAD time course data (first time point for each patient is on the
right, as also indicated by the patient label) showing that the metabolism following reperfusion
changed rapidly to stabilize nearly 21hrs post reperfusion
3.5 Discussion
FT-ICR mass spectrometry of liver biopsy extracts allowed the rapid and
reproducible detection of 4209 unique peaks, representing a wealth of metabolic
information on the functional biochemical changes associated with liver
transplantation. This pilot study revealed that from a holistic viewpoint, liver grafts
share a remarkably alike metabolic profile in the cold phase, suggesting that
metabolism is down-regulated in a similar manner. This is in itself quite remarkable
given the relative heterogeneity (human-to-human natural variations and inevitable
variations in liver transplant procedure) and small number of donors involved in this
pilot project. Furthermore, several anticipated metabolic differences between cold
phase and post reperfusion biopsies were identified, which serve to verify the FTICR
mass spectrometry approach and its applicability for measuring multiple metabolic
pathways simultaneously. Specifically, we documented evidence that reperfused
57
grafts restart their metabolic activity and physiological functions, including synthesis
(e.g. bile acid production, urea synthesis) and excretion (clearance of UW solution),
with the latter one also being in agreement with the previous NMR studies (Duarte et
al. 2005). Again from a holistic viewpoint, liver biopsies exhibited considerably
greater metabolic variability following reperfusion. This is again what would be
expected considering the variation in the OLT procedure itself as well as the impact
of the recipient’s metabolism on the graft. Another expected biochemical response to
OLT was a disturbance of energy metabolism (increase of metabolites levels involved
in energy metabolism). The top 1% changes comprised only a couple of putative
metabolites involved in this process (formate, L-aspartate ADP, AMP). However,
additional analysis showed that there was a remarkably consistent increase of
abundance of ‘energy’ involved metabolites (similar analysis on carbohydrate and
amino acids metabolism did not show similar consistency, which emphasizes the
results), especially the ones involved in oxidative phosporylation (fumarate,
orthopohosphate, pyrophosphate, ADP), showing that it is possible to extract a
meaningful information not only from an analysis of peaks contributing to the major
changes.
Considering the second analytical approach, the combination of microdialysis
sampling and CEAD time trajectory data allowed the longitudinal analysis of liver
metabolism post-reperfusion. It detected a series of changes in the redox metabolism
of extracellular fluid, revealing a rapidly changing liver metabolism immediately post
reperfusion followed by stabilization after ca. 21 h.
The FTICR mass spectra revealed two intriguing findings, which, due to the small
number of patients, must be interpreted with caution. First, the only liver graft
obtained by donation after cardiac death corresponded to the only outlier on the PCA
scores plot, having a metabolite profile in the cold phase more similar to the other
livers’ metabolic profiles in the post reperfusion (T2) stage. This may have resulted
from a less effective perfusion of the graft with preservation solution, since it was
performed after a period of circulatory arrest (e.g. possibility of micro clot
formation), which would have several consequences for graft metabolism. For
58
example, less effective preservation could result in potentially ongoing and injurious
metabolic activity within the cold phase graft (T1) that more closely resembles post
reperfusion (T2) metabolism. The second intriguing finding, revealed in both the
positive and negative ion PCA scores plots, is the apparent separation of the post
reperfused biopsies into two groups. The two patients with unsuccessful outcome,
i.e. who died within 2 months of OLT, were clustered in one of these groups. Further
investigation of these findings with a KNN analysis suggests that during the period
that the second biopsy was collected in the post reperfusion phase (Table 3-1) the
liver metabolism varies quite considerably between patients, perhaps due to
differing rates of metabolic recovery of liver function. This is consistent with the
CEAD data which highlights the considerable change in metabolism in the first 21h of
reperfusion. At post reperfusion time T2, some metabolites (e.g. histidine) varying
not having the effect on the OLT outcome, while others (e.g. urea, GPC) are
potentially predictive of OLT outcome. Encouragingly, the unvarying levels of GPC
throughout OLT were suggested as a potential marker of IPF in the NMR liver biopsy
studies (Duarte, Stanley, Holmes, Lindon, Gil, Tang, Ferdinand, McKee, Nicholson, &
Vilca-Melendez 2005). In our results, GPC was not significantly changed between T1
and T2 (p value 0.38). The patient who developed IPF (H8) was clustered in the
other group, suggesting that perhaps there are yet different metabolic processes,
involving creatinine and IMP, altered. Finally, it may be worth noticing that
histological data were not consistent with the clinical data or the metabolomics
studies.
Collectively, this pilot study shows that FT-ICR mass spectrometry and CEAD are
useful tools for characterizing multiple metabolic pathways in the liver throughout
and following liver transplantation. We have focused our interpretation and
discussion on the measurements of known and expected biochemical changes during
transplantation, since this serves to validate the application of these metabolomics
methods. However, it is crucial to emphasize that more than 4000 signals were
detected in the mass spectra and CEAD chromatograms, which could contain a
wealth of novel metabolic information associated with liver transplantation
including predictive markers of clinical outcome or poor graft function. However,
59
extracting such knowledge would require the application of more powerful
supervised multivariate statistical methods, which in turn is dependent upon a
considerably larger patient cohort, which were basis for the larger studies comparing
DCD and DBD grafts that followed. In addition, the definitive identification of the
metabolites within these metabolomics datasets would further strengthen our
interpretation. This awaits the on-going development of automated metabolite
identification strategies. The initial success of this pilot study, in terms of the ability
of two metabolomics approaches to identify key metabolic changes within a
relatively heterogeneous group of only eight donor liver grafts encouraged us
proceed with the much larger study cohort comparing different graft types.
60
CHAPTER 4 CHANGES IN BASIC ENERGY METABOLISM AND
KEY DIFFERENCES IN LIVER GRFATS FROM DCD
AND DBD DONORS
The data presented in this chapter represents researcher’s own work published as an
original manuscript and presented in Appendix 2; Br J Surg. Jun;101(7):775-83. doi:
10.1002/bjs.9478.
4.1 Introduction
Cold ischaemia results in the switching on of anaerobic metabolism in the absence of
oxidative metabolism. Anaerobic metabolism is one of the primary fallback energy
generating mechanism in all cell systems, and there is continuous utilization of
intracellular energy resources during the process of anaerobic metabolism. In the
aerobic respiratory state, primary energy substrate glucose is metabolized through
the process of glycolysis yielding two molecules of pyruvate, which in turn enters the
Krebs’ cycle. Complete oxidization refers to the combination of glycolysis and Krebs’
cycle that yield maximum number of adenosine tri-phosphate (ATP) molecules for
energy depending biological processes within cells. However, in the absence of
oxidative metabolism pyruvate is metabolized through the anaerobic pathway;
though this pathway is energy driven, there is a net gain of two ATP molecules and
this is used for basic intra-cellular mechanisms in the reduced metabolic state.
Primarily this energy is used to maintain ATP driven Na+/K+ pumps which are
paramount in maintaining cellular integrity.
Complete intracellular energy exhaustion is associated will cell death; however
maintenance of cellular integrity is an energy dependent process. Plasma membrane
bound Na+/K+ pumps are primarily responsible in maintaining the efflux of Na+ from
61
the intracellular compartment to the extracellular compartment, in exchange for K+
ions, and these Na+/K+ pumps are driven by ATP. In the absence of these intracellular
accumulation of the Na+ is associated with water retention, oedema and finally
rupture of the plasma membrane culminating in cell death. In tissues or organs, the
degree of ischaemic tolerability is determined by many factors. Once the oxygen
supply is halted, anaerobic metabolism takes over for a period of time, and
generation of ATP is continued using the intracellular energy reserves, primarily
glycogen stores. Glycogen stores provide the energy substrate for metabolism when
there is no external supply of primary energy substrate glucose delivered in to the
tissues. Therefore, ischaemic tolerability is relied on the amount of intracellular
energy reserves and the anaerobic threshold of the tissue. Some organs or the tissues
with body do not have intracellular energy reserves at all, for example neuronal cells
in the brain, hence entirely depend on the constant supply of glucose and oxygen
received from the circulation. Therefore the brain becomes extremely sensitive and
even shortest periods of hypoxia leads to irreversible and permanent brain injury.
The liver on the other hand is the primary metabolic organ of the body. Hepatocytes
store large amounts of energy in the form of glycogen, and even in the fasted state
releases glucose in to the circulation through conversion of glycogen stores to
glucose and also through gluconeogenesis (Silva, Murphy, Richards, Wigmore,
Bramhall, Buckels, Adams, & Mirza 2006b). The primary difference existing between
the DCD and DBD donors was discussed in Chapter 1; donor warm ischaemia
originating from lower oxygen saturation of peripheral blood and hypotension are
common after treatment withdrawal in a DCD donor. The cellular systems within
such a donor would continue to use intracellular energy stores, through anaerobic
metabolic pathways. Therefore it could be hypothesized that the DCD grafts have
depleted energy reserves at the beginning of the cold ischaemia, when compared
with DBD liver grafts. Meanwhile energy utilization and intracellular metabolism is
continued, albeit at a slower rate through cold storage which further compound the
depletion of energy stores. Therefore it could be regarded that the added warm
62
ischaemia prior to the beginning of cols ischaemia in the DCD donor aggravate the
ischaemic insult.
Previously, our research group in Birmingham studied the changes in basic energy
metabolism within DBD grafts using microdialysis. These studies focused on lactate,
pyruvate, glucose and glycerol levels in selected DBD graft cohort, and shown that
initial high lactate recorded within liver allografts rapidly cleared following
reperfusion of the grafts. Also lower levels of pyruvate at the end of the cold storage
were rapidly replenished after the reperfusion. When these two findings were
combined together, a calculated Lactate/pyruvate ratio was higher in the cold
storage with the reversal of this ratio following the reperfused state (Figure 4-1).
Previous studies have shown that increased lactate/pyruvate ratio is a hallmark of
ischaemia and the evidence is origination from virtually every human tissue.
Although proven in the DBD liver transplantation setting, comparative energy
reserves assessment has not been carried out with DCD liver grafts. At the outset we
hypothesized that DCD liver grafts should have more combined ischaemic damage
due to donor warm ischaemia and cumulative cold ischaemia. We therefore
anticipated that significant difference between the basic energy metabolic markers
between the DCD and DBD grafts.
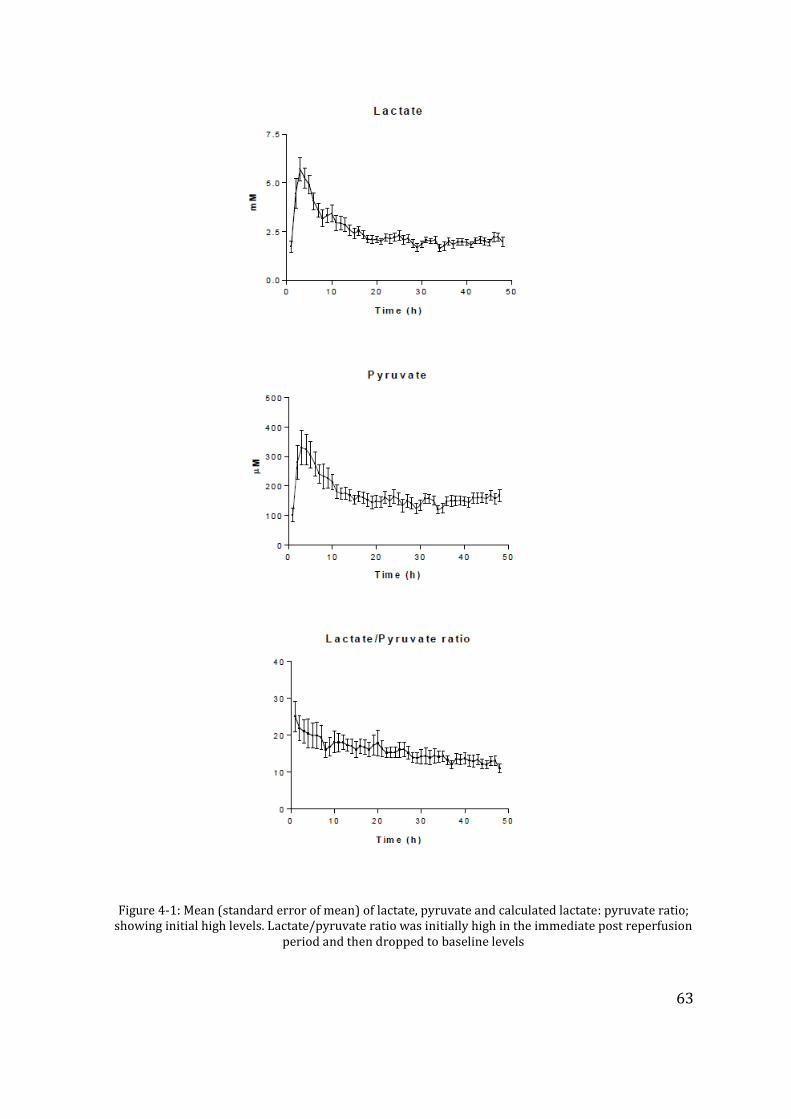
63
Figure 4-1: Mean (standard error of mean) of lactate, pyruvate and calculated lactate: pyruvate ratio; showing initial high levels. Lactate/pyruvate ratio was initially high in the immediate post reperfusion
period and then dropped to baseline levels
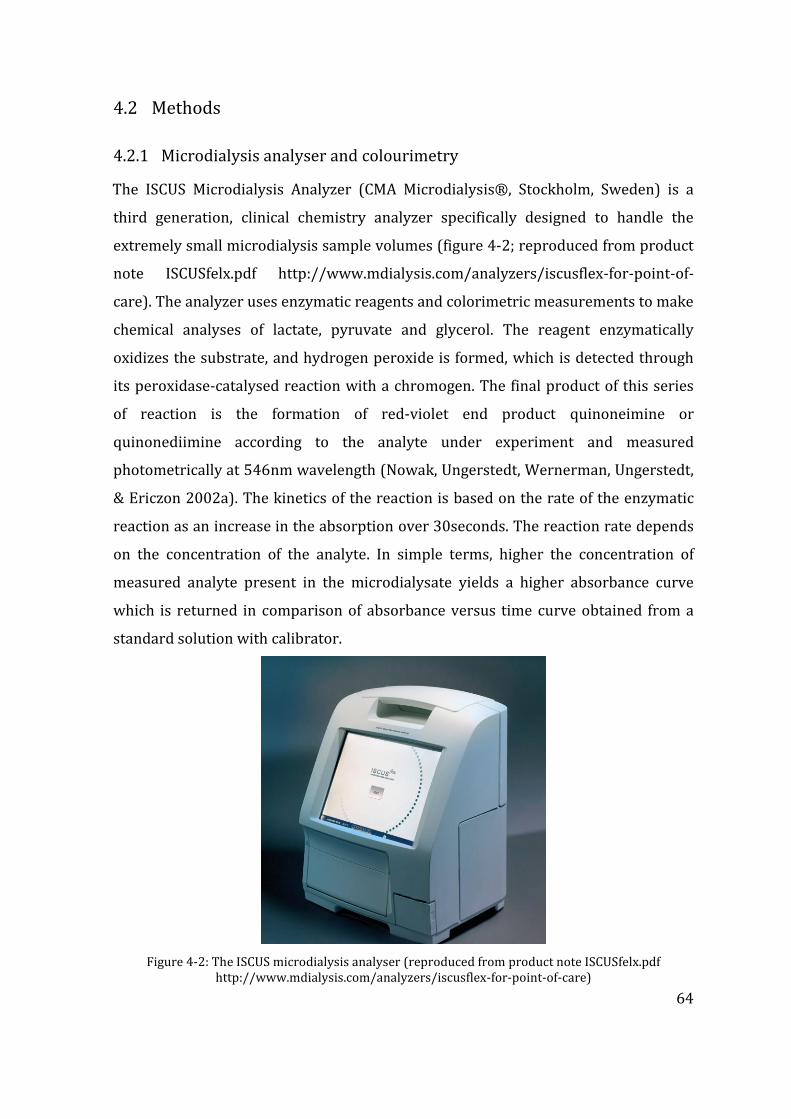
64
4.2 Methods
4.2.1 Microdialysis analyser and colourimetry
The ISCUS Microdialysis Analyzer (CMA Microdialysis®, Stockholm, Sweden) is a
third generation, clinical chemistry analyzer specifically designed to handle the
extremely small microdialysis sample volumes (figure 4-2; reproduced from product
note ISCUSfelx.pdf http://www.mdialysis.com/analyzers/iscusflex-for-point-of-
care). The analyzer uses enzymatic reagents and colorimetric measurements to make
chemical analyses of lactate, pyruvate and glycerol. The reagent enzymatically
oxidizes the substrate, and hydrogen peroxide is formed, which is detected through
its peroxidase-catalysed reaction with a chromogen. The final product of this series
of reaction is the formation of red-violet end product quinoneimine or
quinonediimine according to the analyte under experiment and measured
photometrically at 546nm wavelength (Nowak, Ungerstedt, Wernerman, Ungerstedt,
& Ericzon 2002a). The kinetics of the reaction is based on the rate of the enzymatic
reaction as an increase in the absorption over 30seconds. The reaction rate depends
on the concentration of the analyte. In simple terms, higher the concentration of
measured analyte present in the microdialysate yields a higher absorbance curve
which is returned in comparison of absorbance versus time curve obtained from a
standard solution with calibrator.
Figure 4-2: The ISCUS microdialysis analyser (reproduced from product note ISCUSfelx.pdf http://www.mdialysis.com/analyzers/iscusflex-for-point-of-care)
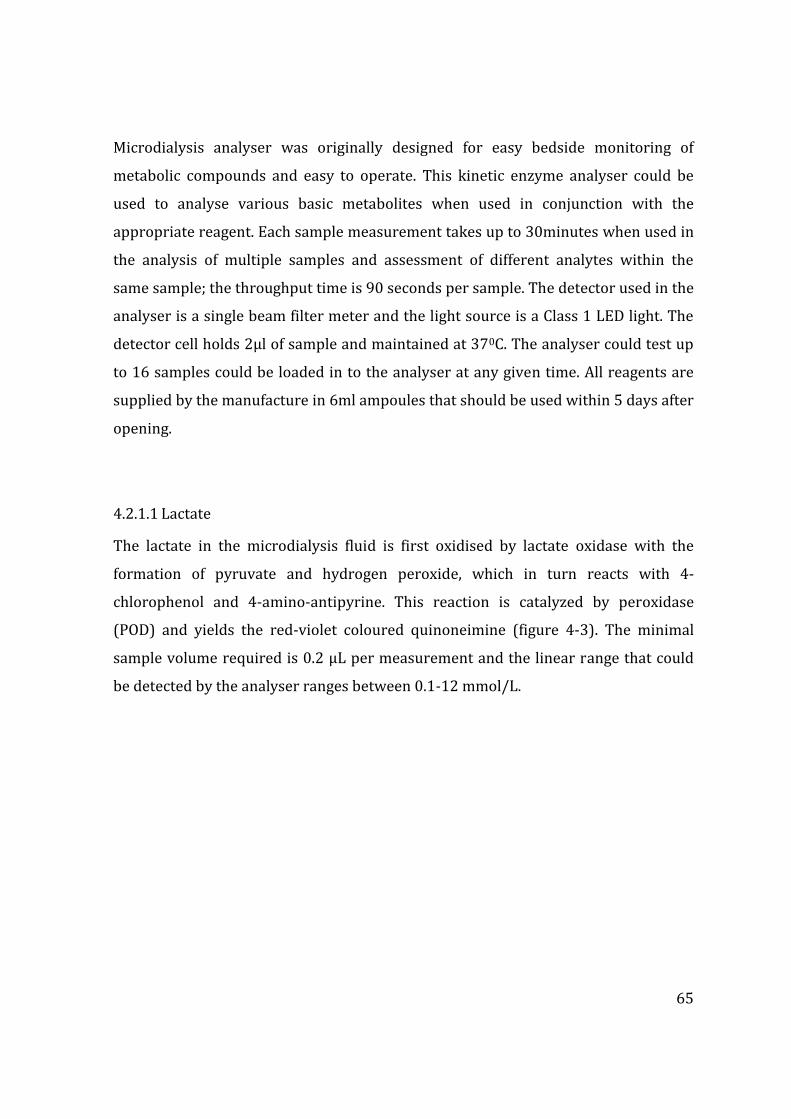
65
Microdialysis analyser was originally designed for easy bedside monitoring of
metabolic compounds and easy to operate. This kinetic enzyme analyser could be
used to analyse various basic metabolites when used in conjunction with the
appropriate reagent. Each sample measurement takes up to 30minutes when used in
the analysis of multiple samples and assessment of different analytes within the
same sample; the throughput time is 90 seconds per sample. The detector used in the
analyser is a single beam filter meter and the light source is a Class 1 LED light. The
detector cell holds 2µl of sample and maintained at 370C. The analyser could test up
to 16 samples could be loaded in to the analyser at any given time. All reagents are
supplied by the manufacture in 6ml ampoules that should be used within 5 days after
opening.
4.2.1.1 Lactate
The lactate in the microdialysis fluid is first oxidised by lactate oxidase with the
formation of pyruvate and hydrogen peroxide, which in turn reacts with 4-
chlorophenol and 4-amino-antipyrine. This reaction is catalyzed by peroxidase
(POD) and yields the red-violet coloured quinoneimine (figure 4-3). The minimal
sample volume required is 0.2 μL per measurement and the linear range that could
be detected by the analyser ranges between 0.1-12 mmol/L.
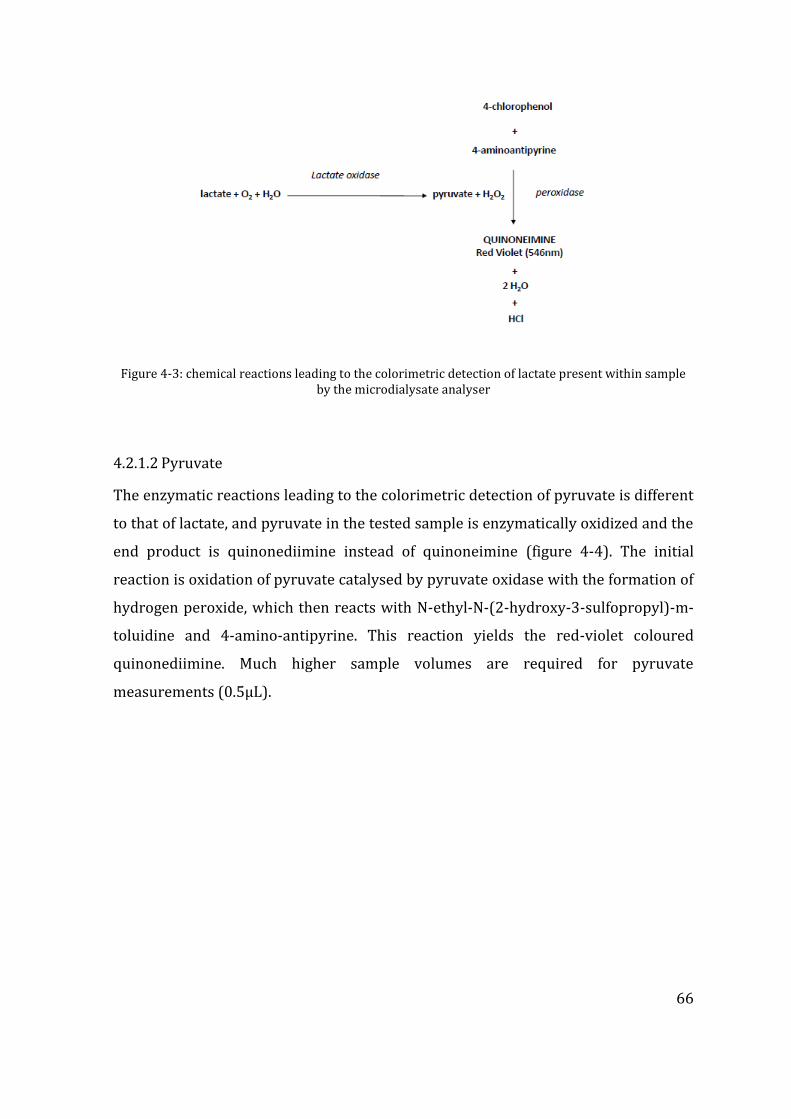
66
Figure 4-3: chemical reactions leading to the colorimetric detection of lactate present within sample by the microdialysate analyser
4.2.1.2 Pyruvate
The enzymatic reactions leading to the colorimetric detection of pyruvate is different
to that of lactate, and pyruvate in the tested sample is enzymatically oxidized and the
end product is quinonediimine instead of quinoneimine (figure 4-4). The initial
reaction is oxidation of pyruvate catalysed by pyruvate oxidase with the formation of
hydrogen peroxide, which then reacts with N-ethyl-N-(2-hydroxy-3-sulfopropyl)-m-
toluidine and 4-amino-antipyrine. This reaction yields the red-violet coloured
quinonediimine. Much higher sample volumes are required for pyruvate
measurements (0.5µL).
67
Figure 4-4: Chemical reactions leading to the detection of pyruvate concentration of a sample by the microdialysate analyser
4.2.1.3 Lactate/pyruvate ratio
Lactic acid is H+ ion donor and dissociated in to lactate and hydrogen ion, and this
causes intracellular acidosis which is a protective mechanism. As some degree of
cellular damage is inevitable during the preservation these molecules are readily
pass through the damaged cell membranes thus these molecules could present in the
extracellular compartment. The degree of lactic acidosis corresponds with the degree
of tissue ischaemia and probably directly proportionate. There is increasing evidence
to suggest that lactate/pyruvate ratio is better marker of energy depletion of a tissue
(Jansson et al. 2009). With more and more pyruvate being metabolized through
anaerobic metabolism, catalysed by lactate dehydrogenase enzyme the intracellular
pyruvate stores are depleted with prolongation of cold ischaemia time. In the
absence of external glucose source, generally delivered to the cells by the blood flow
in the living state, the only other source of pyruvate generation is the breakdown of
intracellular energy stores, in the form of glycogen breakdown.
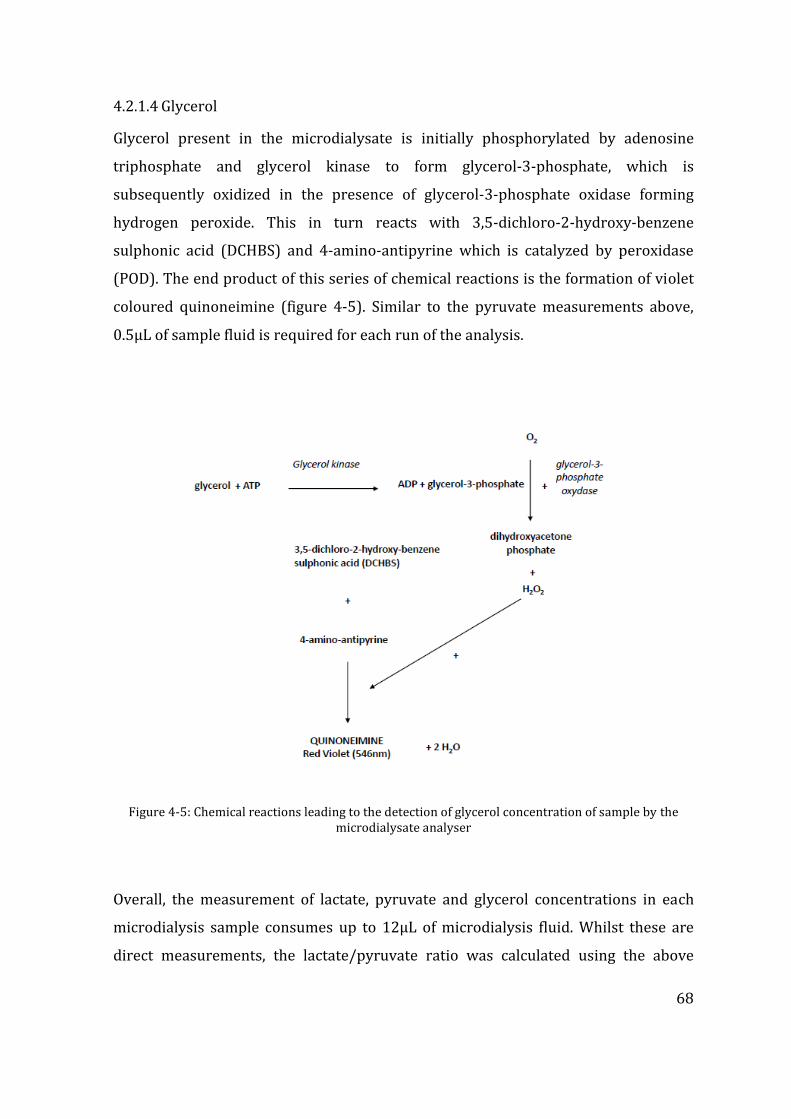
68
4.2.1.4 Glycerol
Glycerol present in the microdialysate is initially phosphorylated by adenosine
triphosphate and glycerol kinase to form glycerol-3-phosphate, which is
subsequently oxidized in the presence of glycerol-3-phosphate oxidase forming
hydrogen peroxide. This in turn reacts with 3,5-dichloro-2-hydroxy-benzene
sulphonic acid (DCHBS) and 4-amino-antipyrine which is catalyzed by peroxidase
(POD). The end product of this series of chemical reactions is the formation of violet
coloured quinoneimine (figure 4-5). Similar to the pyruvate measurements above,
0.5µL of sample fluid is required for each run of the analysis.
Figure 4-5: Chemical reactions leading to the detection of glycerol concentration of sample by the microdialysate analyser
Overall, the measurement of lactate, pyruvate and glycerol concentrations in each
microdialysis sample consumes up to 12µL of microdialysis fluid. Whilst these are
direct measurements, the lactate/pyruvate ratio was calculated using the above
69
readings, as it was the lactate/pyruvate ratio which is regarded as the better marker
of metabolic strain of a given tissue rather than any one or both of these metabolites
in isolation.
4.2.2 Statistical analysis
Statistical program for Social Statistics (SPSS) version 21.0 (IBM) was used for
statistical analysis. Comparison of median distribution of Lactate, Pyruvate and L/P
ratio between groups at each sampling time point was carried out with 2-
independent samples Mann-Whitney U test. The Friedman test for k-dependent
samples was applied to compare the trend of Lactate, Pyruvate and L/P ratio within
each group. Significance was assigned at p<0.05 at 95% confidence interval.
4.3 Patient and graft characteristics
In this study, a total of 30 liver grafts were studied (DCD; n=10 and DBD; n=20). The
DCD grafts were procured according to the United Kingdom guidelines, and following
the treatment withdrawal donor warm ischaemia time (dWIT) was calculated from
the onset of systolic blood pressure<50mmHg or oxygen desaturation measured by
pulse oximetry <80% (whichever came first) to the time of institution of the cold
perfusion in the donor. Grafts were procured and cold stored as described in the
Chapter 2. The median dWIT time was 22 (13 – 28) minutes in the DCD grafts.
Among the recipients receiving these grafts, the disease aetiology and the indication
for LT were varied however there was a roughly equal distribution of cases present
between the DCD and DBD groups. The recipient demographics and the indications
for the LT are summarized in table 4-1.
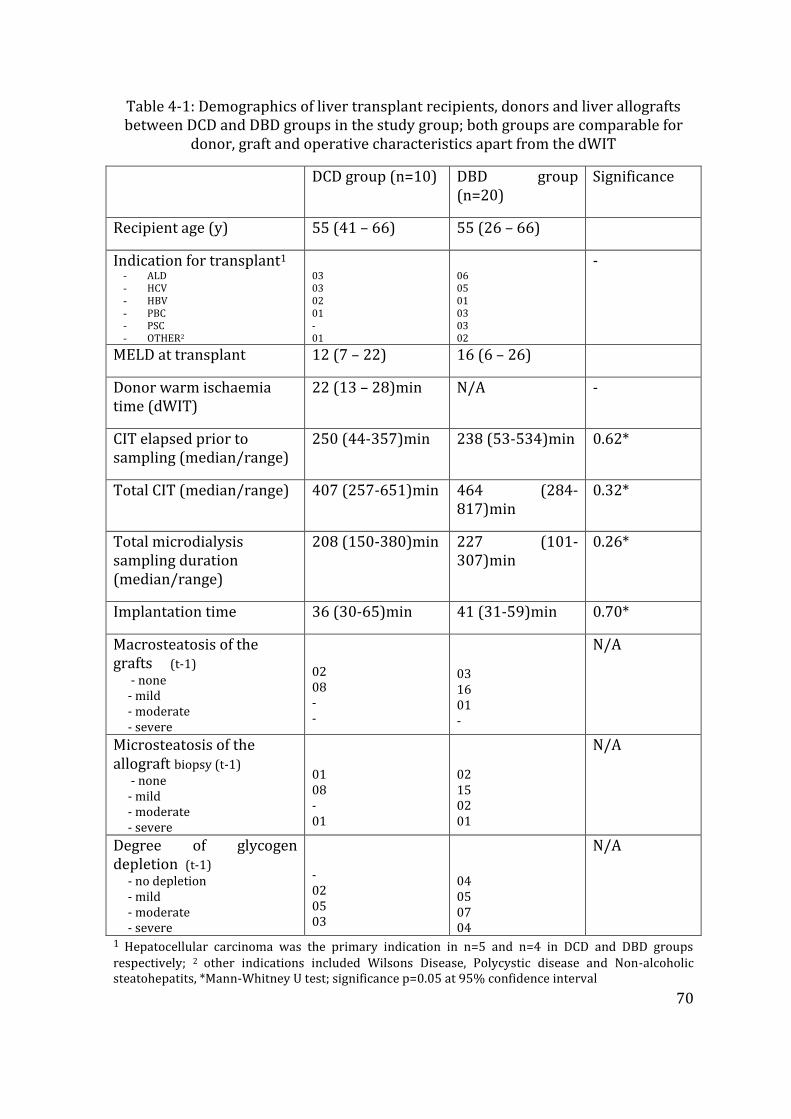
70
Table 4-1: Demographics of liver transplant recipients, donors and liver allografts between DCD and DBD groups in the study group; both groups are comparable for
donor, graft and operative characteristics apart from the dWIT
DCD group (n=10) DBD group (n=20)
Significance
Recipient age (y) 55 (41 – 66) 55 (26 – 66)
Indication for transplant1
- ALD - HCV - HBV - PBC - PSC - OTHER2
03 03 02 01 - 01
06 05 01 03 03 02
-
MELD at transplant 12 (7 – 22) 16 (6 – 26)
Donor warm ischaemia time (dWIT)
22 (13 – 28)min N/A -
CIT elapsed prior to sampling (median/range)
250 (44-357)min 238 (53-534)min 0.62*
Total CIT (median/range) 407 (257-651)min 464 (284-817)min
0.32*
Total microdialysis sampling duration (median/range)
208 (150-380)min 227 (101-307)min
0.26*
Implantation time 36 (30-65)min 41 (31-59)min 0.70*
Macrosteatosis of the grafts (t-1) - none - mild - moderate - severe
02 08 - -
03 16 01 -
N/A
Microsteatosis of the allograft biopsy (t-1) - none - mild - moderate - severe
01 08 - 01
02 15 02 01
N/A
Degree of glycogen depletion (t-1) - no depletion - mild - moderate - severe
- 02 05 03
04 05 07 04
N/A
1 Hepatocellular carcinoma was the primary indication in n=5 and n=4 in DCD and DBD groups respectively; 2 other indications included Wilsons Disease, Polycystic disease and Non-alcoholic steatohepatits, *Mann-Whitney U test; significance p=0.05 at 95% confidence interval
71
Liver grafts in both groups had been stored in the cold phase for an equal amount of
time prior to the insertion of the microdialysis catheter (250min and 238minutes
respectively for DCD and DBD grafts; p=0.619). The median sampling duration
between the two groups, and the final overall CIT was not different between the two
groups (p=0.260 and p=0.328 respectively). The implantation technique of liver
grafts was standard in both groups and there was no significant difference in
implantation time between the groups (table 4-1)
Histological examination of the graft biopsies obtained during the cold phase
revealed presence of low degree of steatosis. This may reflect the selective and
cautious use of liver grafts in the transplant setting owing to the adverse effects that
are associated higher of steatosis. None of the grafts had severe macrosteatosis,
whilst only one graft from each group had severe microsteatosis. Whereas more
strikingly in the histological assessment, the degree of glycogen depletion appeared
to be more abundant in the DCD grafts; 8/10 (80%) grafts in this group had
moderate or severe glycogen depletion compared with 11/20 (55%) in the DBD
group at cold storage.
4.4 Results
4.4.1 Interstitial lactate and pyruvate level
The DCD liver grafts had significantly higher lactate levels compared with DBD grafts
during cold storage sampling [11.6 (0.4 – 27.0) mmol/l vs. 1.2 (0.2 – 6.0) mmol/l;
p=0.015; Mann Whitney U test]. This difference was seen only in the cold storage
microdialysis sampling and the first sample immediately post reperfusion did not see
any significant difference between the interstitial lactate levels due to rapid
clearance. This rapid clearance continued in these grafts at each 6 hour interval up to
48 hours in both groups (figure 4-6). Lactate levels were significantly reduced
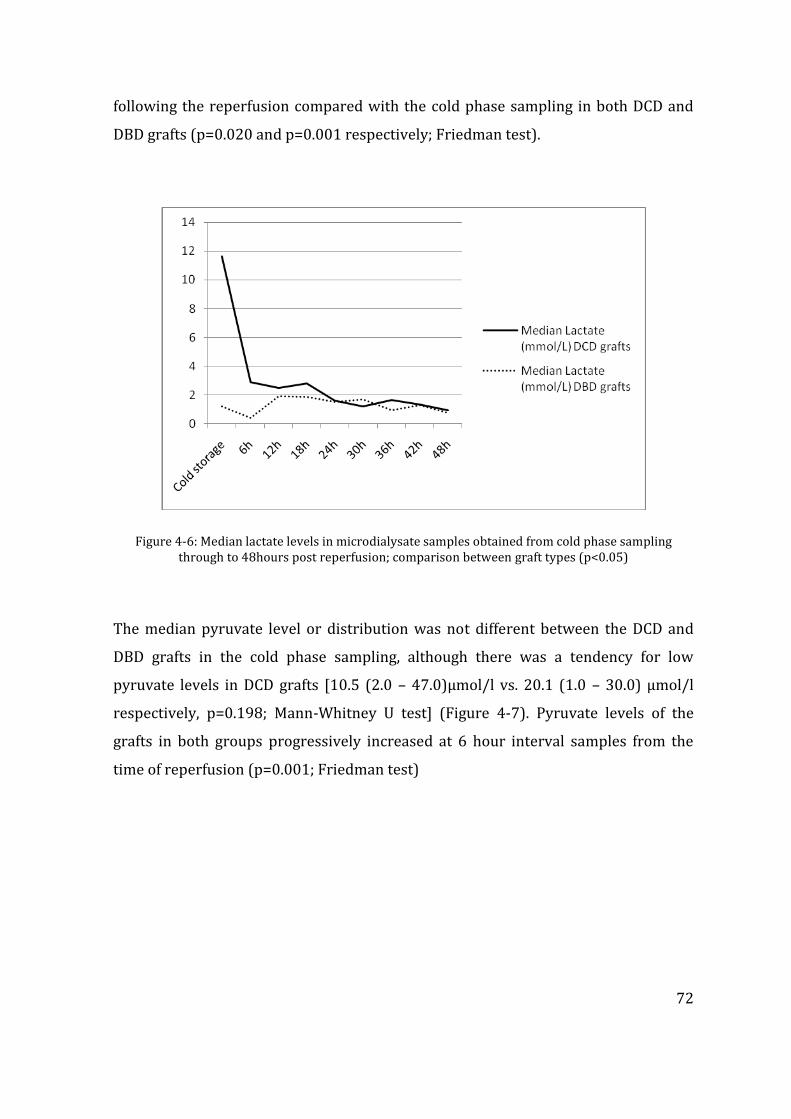
72
following the reperfusion compared with the cold phase sampling in both DCD and
DBD grafts (p=0.020 and p=0.001 respectively; Friedman test).
Figure 4-6: Median lactate levels in microdialysate samples obtained from cold phase sampling through to 48hours post reperfusion; comparison between graft types (p<0.05)
The median pyruvate level or distribution was not different between the DCD and
DBD grafts in the cold phase sampling, although there was a tendency for low
pyruvate levels in DCD grafts [10.5 (2.0 – 47.0)µmol/l vs. 20.1 (1.0 – 30.0) µmol/l
respectively, p=0.198; Mann-Whitney U test] (Figure 4-7). Pyruvate levels of the
grafts in both groups progressively increased at 6 hour interval samples from the
time of reperfusion (p=0.001; Friedman test)
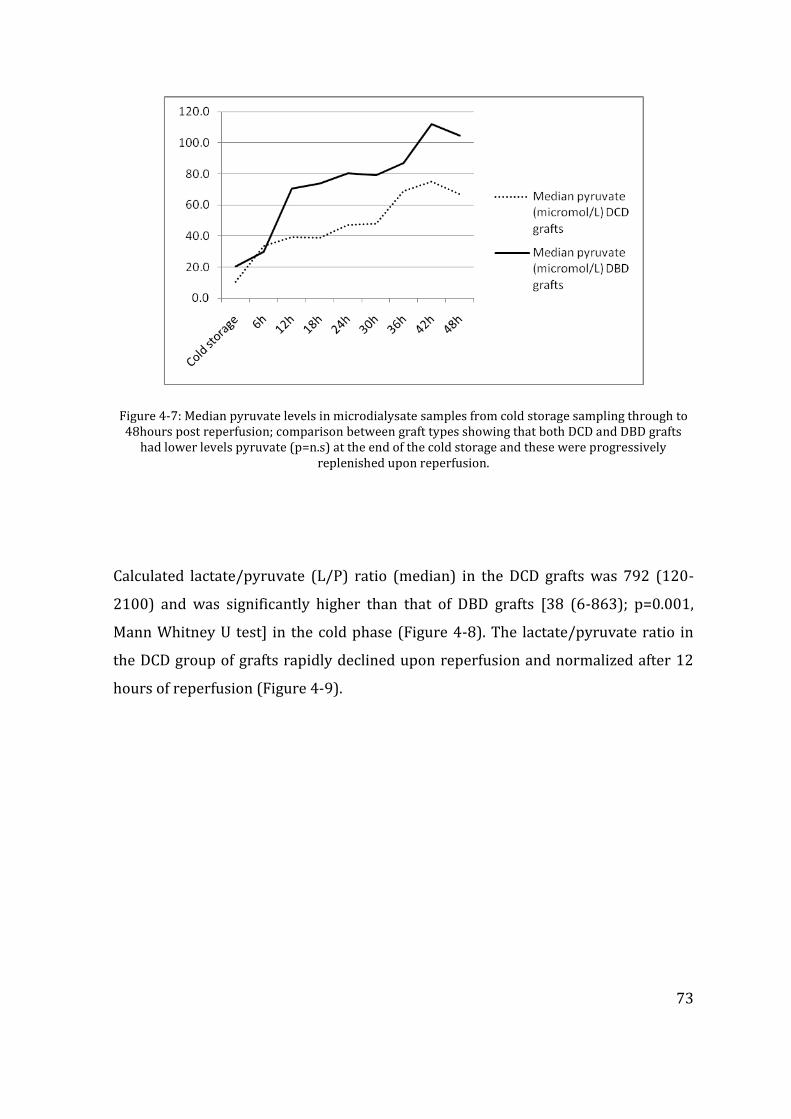
73
Figure 4-7: Median pyruvate levels in microdialysate samples from cold storage sampling through to 48hours post reperfusion; comparison between graft types showing that both DCD and DBD grafts
had lower levels pyruvate (p=n.s) at the end of the cold storage and these were progressively replenished upon reperfusion.
Calculated lactate/pyruvate (L/P) ratio (median) in the DCD grafts was 792 (120-
2100) and was significantly higher than that of DBD grafts [38 (6-863); p=0.001,
Mann Whitney U test] in the cold phase (Figure 4-8). The lactate/pyruvate ratio in
the DCD group of grafts rapidly declined upon reperfusion and normalized after 12
hours of reperfusion (Figure 4-9).
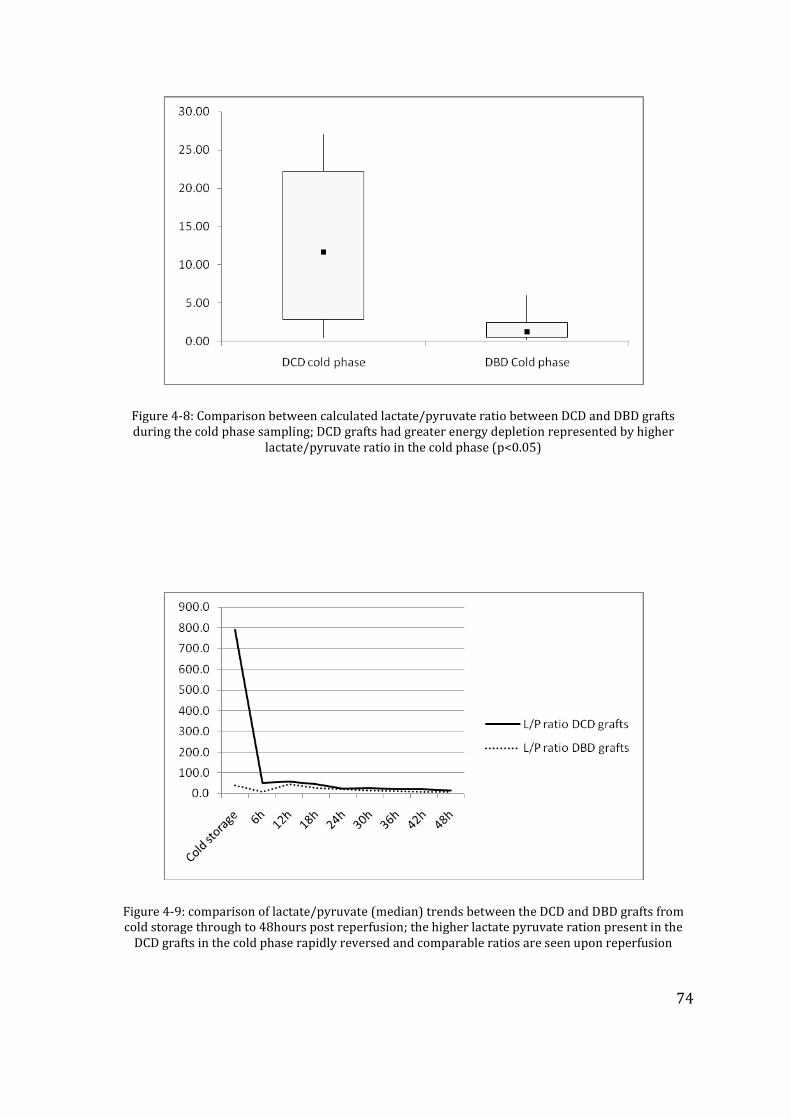
74
Figure 4-8: Comparison between calculated lactate/pyruvate ratio between DCD and DBD grafts during the cold phase sampling; DCD grafts had greater energy depletion represented by higher
lactate/pyruvate ratio in the cold phase (p<0.05)
Figure 4-9: comparison of lactate/pyruvate (median) trends between the DCD and DBD grafts from cold storage through to 48hours post reperfusion; the higher lactate pyruvate ration present in the
DCD grafts in the cold phase rapidly reversed and comparable ratios are seen upon reperfusion
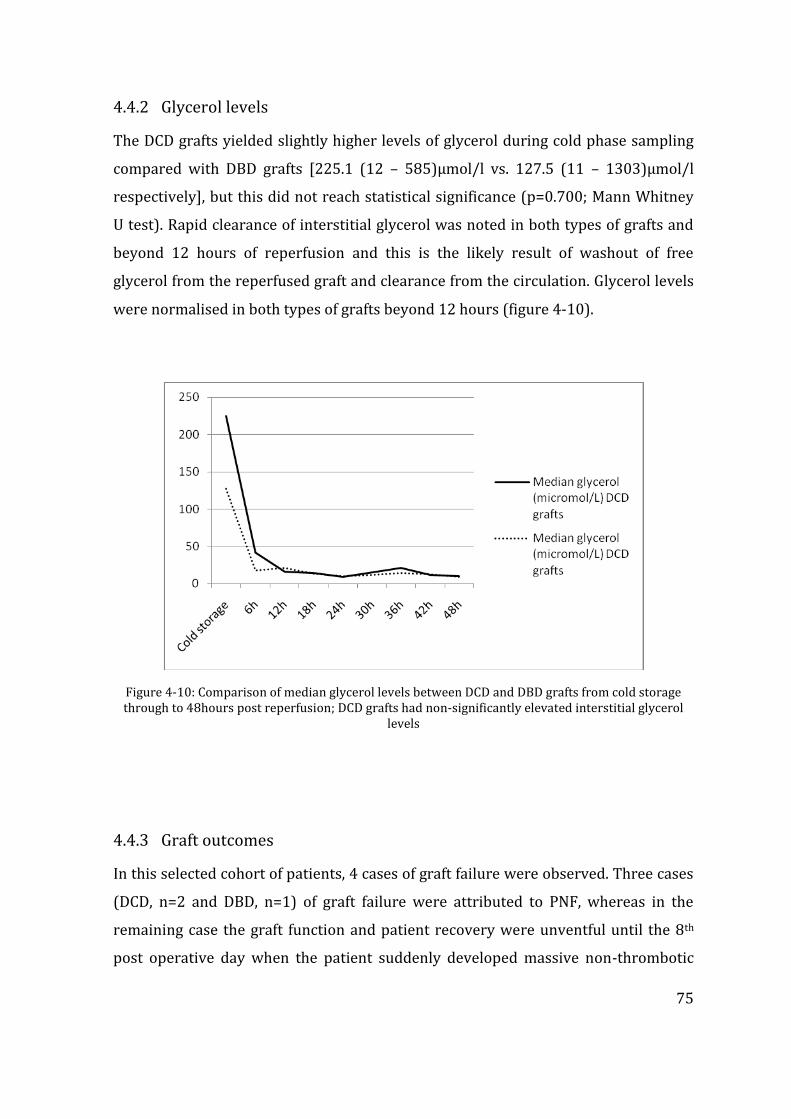
75
4.4.2 Glycerol levels
The DCD grafts yielded slightly higher levels of glycerol during cold phase sampling
compared with DBD grafts [225.1 (12 – 585)µmol/l vs. 127.5 (11 – 1303)µmol/l
respectively], but this did not reach statistical significance (p=0.700; Mann Whitney
U test). Rapid clearance of interstitial glycerol was noted in both types of grafts and
beyond 12 hours of reperfusion and this is the likely result of washout of free
glycerol from the reperfused graft and clearance from the circulation. Glycerol levels
were normalised in both types of grafts beyond 12 hours (figure 4-10).
Figure 4-10: Comparison of median glycerol levels between DCD and DBD grafts from cold storage through to 48hours post reperfusion; DCD grafts had non-significantly elevated interstitial glycerol
levels
4.4.3 Graft outcomes
In this selected cohort of patients, 4 cases of graft failure were observed. Three cases
(DCD, n=2 and DBD, n=1) of graft failure were attributed to PNF, whereas in the
remaining case the graft function and patient recovery were unventful until the 8th
post operative day when the patient suddenly developed massive non-thrombotic
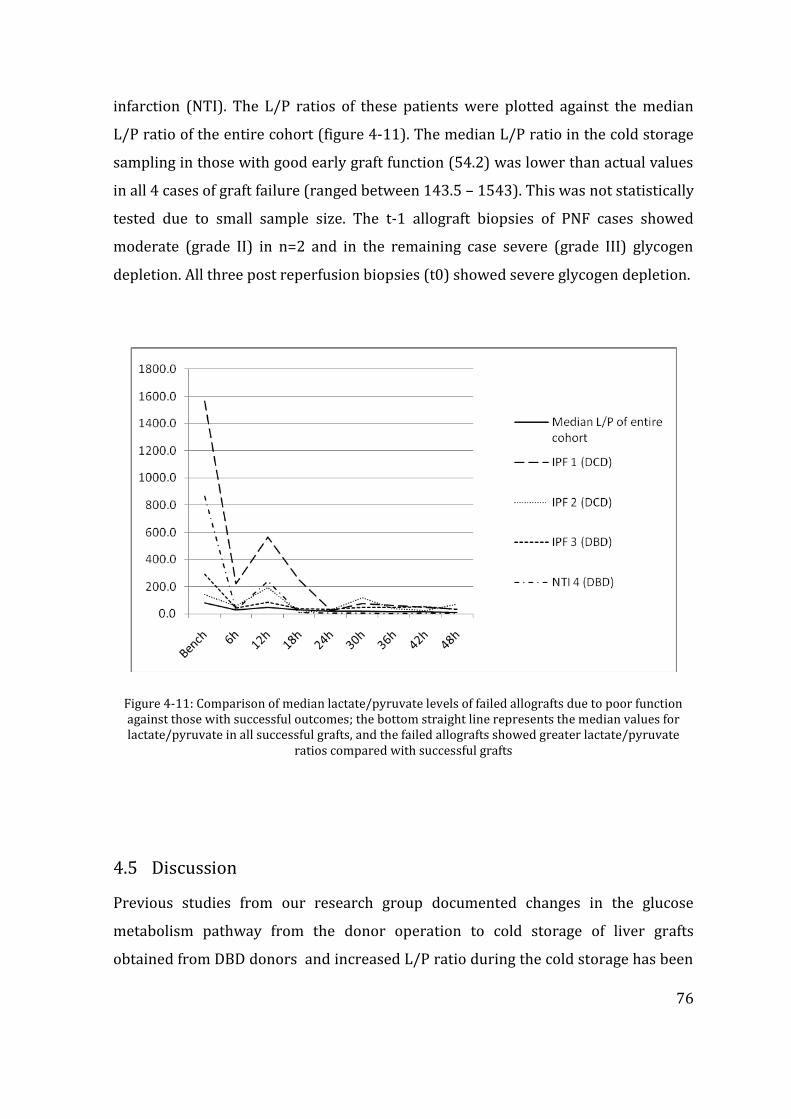
76
infarction (NTI). The L/P ratios of these patients were plotted against the median
L/P ratio of the entire cohort (figure 4-11). The median L/P ratio in the cold storage
sampling in those with good early graft function (54.2) was lower than actual values
in all 4 cases of graft failure (ranged between 143.5 – 1543). This was not statistically
tested due to small sample size. The t-1 allograft biopsies of PNF cases showed
moderate (grade II) in n=2 and in the remaining case severe (grade III) glycogen
depletion. All three post reperfusion biopsies (t0) showed severe glycogen depletion.
Figure 4-11: Comparison of median lactate/pyruvate levels of failed allografts due to poor function against those with successful outcomes; the bottom straight line represents the median values for lactate/pyruvate in all successful grafts, and the failed allografts showed greater lactate/pyruvate
ratios compared with successful grafts
4.5 Discussion
Previous studies from our research group documented changes in the glucose
metabolism pathway from the donor operation to cold storage of liver grafts
obtained from DBD donors and increased L/P ratio during the cold storage has been
77
attributed to severity of IR injury (Nowak et al. 2002c;Silva, Murphy, Richards,
Wigmore, Bramhall, Buckels, Adams, & Mirza 2006b;Silva et al. 2008). Whilst
complimenting some of the findings of those studies, the presented data in this study
reports the key differences that exist in basic metabolism with reference to DCD and
DBD grafts. Apart from the inherent differences surrounding organ donation in DCD
grafts with relevance to dWIT, all grafts in this study were comparable in terms of
macroscopic quality of the graft, microscopic appearance (macro-steatosis) and both
CIT and implanatation times. In this regard, the metabolic changes discovered in the
cold storage in this study may be attributed to the added dWIT in DCD grafts, which
is the key difference between the two types of grafts.
The higher lactate/pyruvate ratio in this study was primarily due to intial higher
lactate levels in the interstital space of the DCD grafts. Though the pyruvate levels
were relatively lower in the DCD grafts, these grafts were not totally depleted of
primary energy substrate which was reassuring finding that may have led to the
successful outcomes in the majority of DCD grafts. Higher lacate levels could be
explained by the lack of tissue perfusion following treatment withdrawal of DCD
donors. Hypotension and reduced oxygen saturation both contribute to lack of
oxygen delivery at tissue level. This in turn leads to slowing down of oxidative
metabolism and switching on the anaerobic metabolic pathways to generate ATP that
maintains cellular integrity(Brinkkoetter et al. 2008;Vajdova et al. 2002). Whilst the
donor core temperature mainatained at room temperature near the “agonal phase”,
cellular metabolism proceeds at the usual rate until the organs are cooled, hence the
increased demand for intracellular energy. Higher lactate is thus generated in DCD
grafts by more and more pyruvate being metabolised throgh anaerobic metabolism.
Tissue acidosis is detrimental to cellular viability and persistent acidosis augments
cellular injury by widespread apoptosis. The mechanisms involve so called of
mitochhondrial permeality transition (MPT) pathway and pH paradox (Lemasters et
al. 1998). Interstitial acidosis is inevitable in cold preservation of organs. The basic
78
metabolism within cellular systems is significantly reduced, but not completely
halted by hypothermia. Each 100C degree drop in the environment is likely to reduce
the metabolism by 1.5-2.0 fold, thus liver grafts stored in 0-40C prior to the
implanatation are likely to retain up to 10% of basic metabolism, energy for which is
primarily driven by anaerobic metabolism (Belzer & Southard 1988). Upon
reperfusion of liver grafts in the new recipient, reversal of energy balance occurs
with rapid restoration restitution of pyruvate through glycolysis that enter the Kreb’s
cycle for oxidative metabolism (Takada, Taniguchi, Fukunaga, Yuzawa, Otsuka,
Todoroki, Iijima, & Fukao 1997). Until this phase occurs, anaerobic metabolism
continues with continous production of metabolic waste lactate, which is primarily
responsible for tissue acidosis (Dutkowski et al. 1998). Data in this study is
insufficient to attribute the graft failures to increased lactate and L/P ratio; however
it should be noted that all three PNF grafts had initial high L/P ratio during the cold
storage and includes one DBD graft. The association between higher L/P ratio and
PNF should therefore be further studied.
Relative increase in interstitial glycerol probably reflects higher degree of cellular
injury in DCD grafts in the presence of acidosis (Boutilier 2001;Monbaliu et al.
2008;Vollmar et al. 1994). This increased glycerol levels may indicate increased cell
lysis by apoptosis however this does not appear to be overwhelming in DCD grafts,
again a reassuring finding in the liver grafts used in the transplantation setting
(Hillered et al. 1998;Hogberg et al. 2012a;Hogberg et al. 2012b;Nowak, Ungerstedt,
Wernerman, Ungerstedt, & Ericzon 2002c). The finding of higher interstitial lactate,
L/P, pyruvate and the trend towards increased glycerol in DCD grafts probaly
provided more insights in to the metabolic changes in the DCD grafts during cold
preservation. These observations are consistent with previous animal models
examining ischaemia reperfusion injury through microdialysis (Nowak et al. 2003b).
Traditional organ preservation fluids have been designed to minimise the tissue
acidosis being built up during cold storage (Straatsburg et al. 2002). Increased
acidosis in DCD grafts prior to the commencement of organ preservation is probably
the hallmark difference between the two types of grafts, and the buffering capacity of
79
the traditional perfusion is probably insufficient to cope with the existing extent of
interstitial acidosis. This data probably calls for further studies in minimising graft
acidosis in DCD grafts by intervention prior to the organ procurement or during cold
preservation. These methods may include machine perfusion or in-situ regional
normothermic perfusion where the behaviour of the potential graft may be further
assessed and if required modulated (Brockmann, Reddy, Coussios, Pigott, Guirriero,
Hughes, Morovat, Roy, Winter, & Friend 2009;McLaren & Friend 2003).
In summary, the data herein examines the key differences in the basic cellular
metabolism in liver allografts, where DCD grafts have a higher interstitial lactic
acidosis and L/P ratio during cold storage. Rapid clearance of lactate is noted
following reperfusion of the grafts, and after 48 hoours of reperfusion, no significant
difference existed between the functioning DBD and DCD grafts. There is a tendency
towards increased glycerol levels in DCD grafts denoting higher degree of cellular
injury, and the non-functioning liver grafts had above average interstitial acidodis.
These findings suggests further studies on modulation of basic energy levels in the
grafts along with improved preservation techniques to avoid unwarranted severe
acidosis.
80
CHAPTER 5 KEY METABOLITE FEATURE DIFFERENCES
BETWEEN DCD AND DBD LIVER GRFATS
IDENTIFIED THROUGH CEAD BASED
METABOLOMICS
The work outlined in this chapter was largely researcher’s own work performed in
collaboration with Dr. Doug Richards from the School of Clinical and Experimental
Medicine at the University of Birmingham performing microdialysis sample analysis
through CEAD. The contribution from the researcher included performing
microdialysis sampling, clinical data collection. The researcher also initiated and
developed links with the Bioinformatics and High-throughput Analysis Lab, Center for
Developmental Therapeutics, Seattle Children’s Research Institute, Seattle, Washington
for bio statistical input, with data analysis and interpretation performed through
clinical transplantation perspective. The researcher wrote the manuscript, with
contribution by co-authors and the manuscript is provided in appendix 3; OMICS.
2014;18(12):767-77. doi: 10.1089/omi.2014.0094
5.1 Introduction
Moving on to the study of basic metabolomics aspects of the transplanted liver grafts
we used the microdialysate samples from grafts to using coulometric electrochemical
array detection. The laboratory analytical input for this part of the study was given
by the School of Clinical & Experimental Medicine, College of Medical & Dental
Sciences at the University of Birmingham. Chapter 2 described in detail the
coulometric electrochemical array detection (CEAD) and statistical analysis
techniques which were supported by external collaborators. The feasibility of CEAD
81
as an analytical platform was described in previous proof of principle study as
outlined in chapter 3. To date this was the only clinical study involving CEAD in the
liver transplant setting. Although CEAD analysis in the previous study failed to
underpin any biomarkers, which was beyond the scope of pilot study, the present
study involved a much larger group of liver grafts used in the clinical transplantation
setting and we aimed to identify key metabolite feature differences through this
approach.
5.2 Coulometric electrochemical array detection (CEAD)
All microdialysis samples were analyzed on the Coularray 5600A 16-channel
metabolomics system, under the control of Chromeleon software (Thermo Fisher
Scientific, UK). The column used was a Luna 5µ C18(2) (100 x 4.6mm) (Phenomenex,
UK), maintained at a temperature of 35oC. Mobile phase A consisted of 20mM sodium
dihydrogen phosphate, and 1.5x10⁻⁴M sodium heptane sulphonic acid, adjusted to pH
3.2. Mobile phase B consisted of 95% (v/v) methanol, 5% deionised water, and
1.5x10⁻⁴M sodium heptane sulphonic acid. Mobile phase flow-rate was maintained at
800µl/min throughout and the gradient profile over the 45 min run time is shown in
figure 5-1.
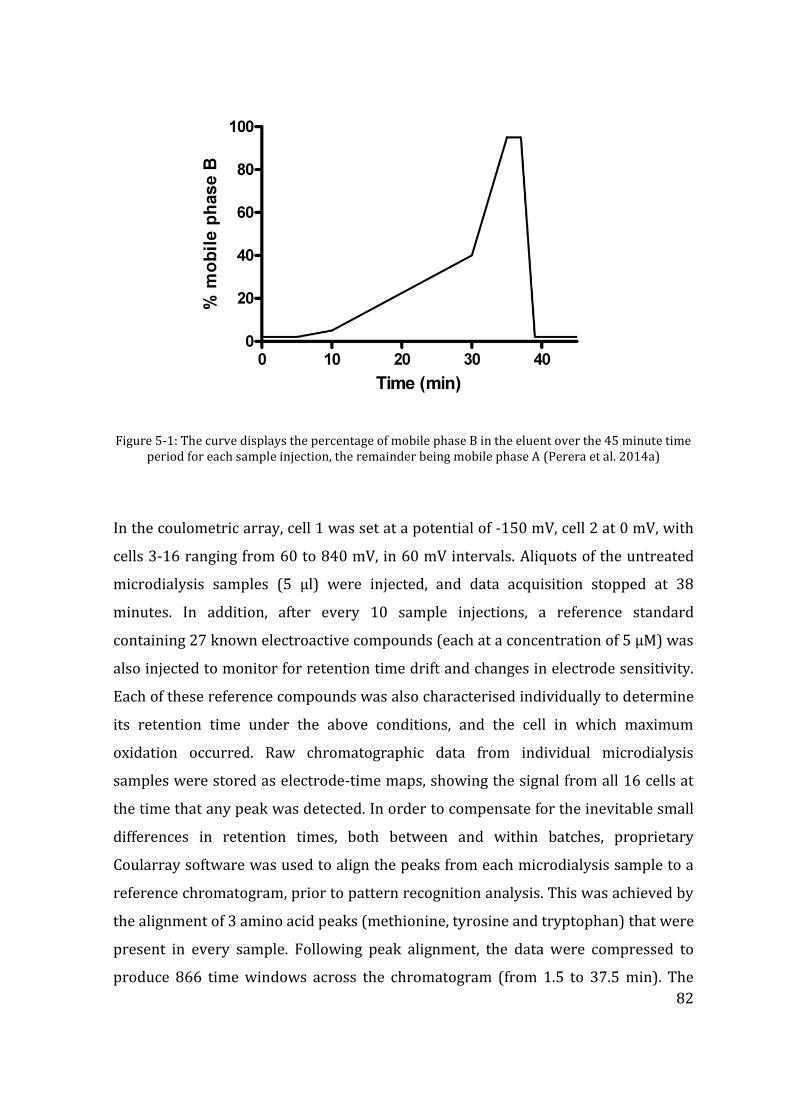
82
Figure 5-1: The curve displays the percentage of mobile phase B in the eluent over the 45 minute time period for each sample injection, the remainder being mobile phase A (Perera et al. 2014a)
In the coulometric array, cell 1 was set at a potential of -150 mV, cell 2 at 0 mV, with
cells 3-16 ranging from 60 to 840 mV, in 60 mV intervals. Aliquots of the untreated
microdialysis samples (5 µl) were injected, and data acquisition stopped at 38
minutes. In addition, after every 10 sample injections, a reference standard
containing 27 known electroactive compounds (each at a concentration of 5 µM) was
also injected to monitor for retention time drift and changes in electrode sensitivity.
Each of these reference compounds was also characterised individually to determine
its retention time under the above conditions, and the cell in which maximum
oxidation occurred. Raw chromatographic data from individual microdialysis
samples were stored as electrode-time maps, showing the signal from all 16 cells at
the time that any peak was detected. In order to compensate for the inevitable small
differences in retention times, both between and within batches, proprietary
Coularray software was used to align the peaks from each microdialysis sample to a
reference chromatogram, prior to pattern recognition analysis. This was achieved by
the alignment of 3 amino acid peaks (methionine, tyrosine and tryptophan) that were
present in every sample. Following peak alignment, the data were compressed to
produce 866 time windows across the chromatogram (from 1.5 to 37.5 min). The
83
average signal output across all 16 cells of the array was displayed for each of these
time windows.
5.2.1 CEAD sample and data analysis:
The CEAD data were formed into 3 analysis datasets consisting of the bench sample,
the first post-reperfusion sample (mainly at 6 hours, but at 12 hours for 7 patients),
and a time trend analysis set consisting of all post-reperfusion samples from 6 to 48
hours. Some patients did not have data in all datasets, 4 patients out of the 40 did not
have a bench sample, 2 patients did not have a post reperfusion sample at 6 or 12
hours, and finally not all patients had samples analyzed at all post reperfusion time
points; overall there were 280 post-reperfusion samples analyzed from 39 out of 40
patients. The 3 datasets were processed separately prior to data analysis.
First, each sample was normalized by dividing by the median signal intensity of each
sample. This was done separately for a window above and a window below 7
minutes since signal intensity was much higher prior to 7 minutes. After
normalization only windows where the maximum signal across samples was above a
noise threshold were retained. Then windows were grouped into peaks using a
heuristic peak finding algorithm (Rolinski et al. 2007). The algorithm identifies peaks
by thresholding for the minimum height of peak and the drop between peaks
required separating peaks. Fairly liberal parameters of 0.5% of the maximum peak to
retain a peak and 5% drop between peaks to separate peaks were used to avoid
merging separate metabolite peaks. Peak areas were calculated by summing all
windows within a peak for each sample. A retention time was assigned using the
window at the maximum of the peak. For putative identification of metabolite peaks,
retention times were matched to the mean values above (+/- 5%), and in addition
the potential at which maximum oxidation occurred was matched (+/- 60 mV) (table
1). Metabolites containing more than one oxidisable group may have more than one
maximum potential, and this is again characteristic for identification purposes.
84
The statistical analysis for the metabolite data was conducted using methods similar
to those used previously for proteomics and microarrays (Higdon et al. 2013;Kolker
et al. 2012;Smyth 2004). First, peak areas were log transformed. Bench and 1st
reperfusion datasets showed similar spreads across patients after transformation
but were re-centered using a mean correction. However, the time-trend dataset
showed an increase in variation as post-reperfusion time increased therefore these
data was also scaled by the standard deviation prior to analysis. T-tests and linear
regression models were fit to individual peaks from the bench and first reperfusion
datasets to find associations between metabolite peak intensity and donor type, cold-
ischemia time, and the interaction between donor type and ischemia time.
Expression ratios and P-values were reported for each comparison and metabolite
peak. Repeated measures ANOVA was applied to each peak in the time trend dataset
to determine if there were any overall trends versus post-reperfusion time and
whether those trends varied with donor type and cold ischemia times. In addition,
datasets were created for the mean of all post-reperfusion samples and the slope
over time (calculated by a linear regression versus post-reperfusion time) for each
metabolite peak in order to describe broad shifts in metabolite peak intensity and
general upward or downward trends in intensity.
5.3 Patients and methods
A total of 40 adult patients undergoing elective liver transplants excluding those
undergoing emergency liver transplantation, re-grafts or split liver transplants were
included. A hepatic microdialysis catheter was introduced to the liver graft in the
cold phase as described previously and cold storage samples were collected. This
was done towards the end of the cold storage when the liver grafts arrived in the
transplant centre for implantation, and during the bench procedure of liver graft
preparation. As a result a variable time period of cold ischaemia time has been
elapsed prior to the insertion of microdialysis catheter and this was recorded. A fresh
catheter for post reperfusion sample collection was inserted to each studied graft
85
towards the end of the transplant operation and serial sample collection was carried
out until 48 hours of reperfusion.
The study group consisted of 13 DCD liver grafts and 27 DBD whole liver grafts. The
donor characteristics, the cold ischaemia time elapsed before insertion first
microdialysis catheter, total cold ischaemia time, implantation time of each graft and
overall ischaemia reperfusion injury assessed at the end of reperfusion obtained
through a liver biopsy histological examination according to a previously described
methods have been summarized in table 5-1. As with our previous study the disease
distribution between the DCD and DBD group was heterogeneous, meanwhile the
recipients’ age distribution was similar. The DCD group had less advanced liver
disease and this was due to the fact DCD grafts being marginal, physiologically more
stable patients were selected for transplantation according to the unit’s practice
policy. Important finding was that the liver grafts were obtained from donors with
otherwise similar characteristics in terms of age, BMI and graft steatosis. The only
difference between these two groups was therefore the donor warm ischaemia
incurred by the DCD donors which is related to the nature of organ donation. The
median donor warm ischaemia time was 13 minutes whilst the maximum warm
ischaemia time of the grafts in this cohort did not exceed the current accepted time
limit of 30 minutes.
Similar time duration in the cold storage had been elapsed before insertion of the
cold phase microdialysis catheter in each group and the cold phase sampling time
was not different. Furthermore overall cold ischaemia time elapsed prior to the
implantation was similar between the group and these findings reduced the bias of
attributing any metabolite differences detected in CEAD analysis to increased cold
ischaemic injury.
86
Four (n=4) liver grafts did not yield adequate samples material for CEAD analysis.
This was due to the fact that bench phase was so quick that the liver graft was taken
out of ice for implantation sooner. Total of 36 bench samples and 280 post-
reperfusion microdialysate samples were analyzed.
5.4 Results
5.4.1 Overall metabolic activity detected by CEAD
Overall, the donor types do group together based upon the bench sample and first
reperfusion metabolite expression patterns as can be seen in the clustering on top of
figure 5-2. However, the metabolite patterns are not sufficient to completely separate
the donor types (DCD vs. DBD).
5.4.2 Bench Samples – Donor Type and Cold Ischemia
In the analysis of the bench samples (table 5-2) below indicates there are metabolites
that are over-expressed in DCD donors occurring at peaks around 3.8 minutes, 5 and
10 minutes having expression ratios near 3 fold. In addition, metabolites are over-
expressed in the DBD donors at peaks occurring at 6.5, 12 and 14.5 minutes with
expression ratios near 2 fold. When examining the trend with cold ischaemia there
were peak at 12 and 27 minutes where metabolite levels increase with increasing
cold ischemia time for the bench samples (roughly a 25 % increase with each 100
minute increase in time). These relationships are shown in figure 5-3 where the
trend is evident but with large amount of variation about the trend.
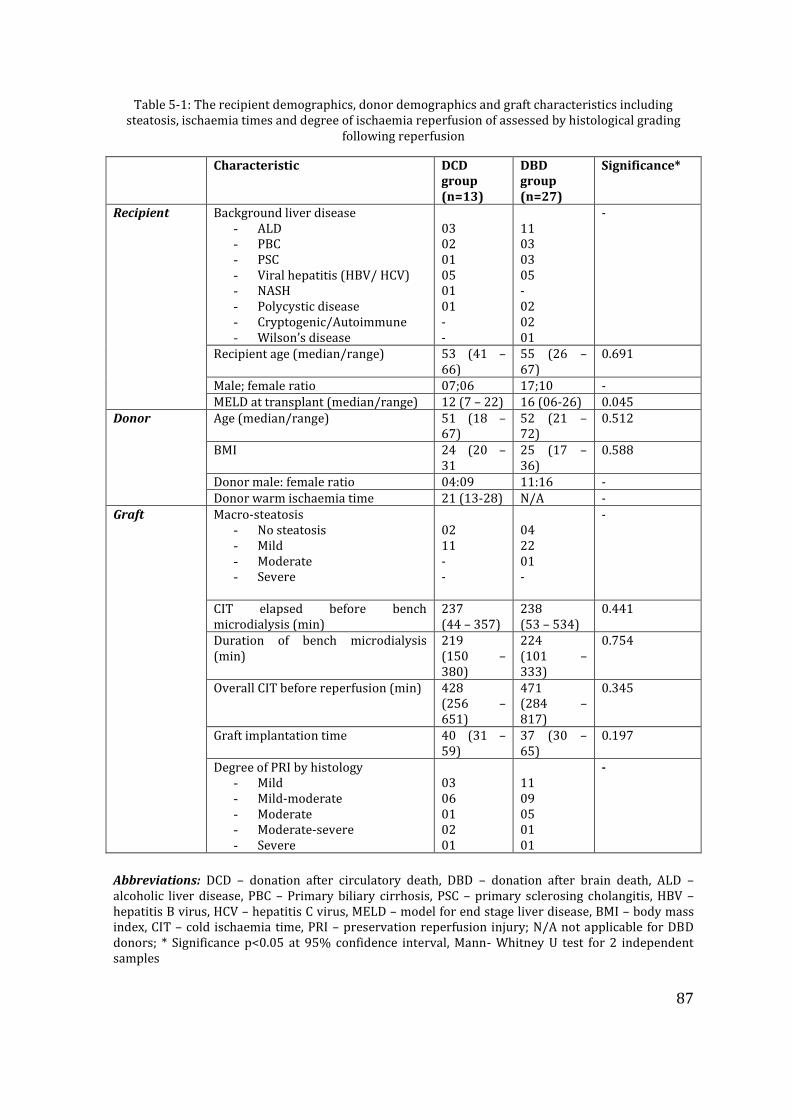
87
Table 5-1: The recipient demographics, donor demographics and graft characteristics including steatosis, ischaemia times and degree of ischaemia reperfusion of assessed by histological grading
following reperfusion
Characteristic DCD group (n=13)
DBD group (n=27)
Significance*
Recipient Background liver disease - ALD - PBC - PSC - Viral hepatitis (HBV/ HCV) - NASH - Polycystic disease - Cryptogenic/Autoimmune - Wilson’s disease
03 02 01 05 01 01 - -
11 03 03 05 - 02 02 01
-
Recipient age (median/range) 53 (41 – 66)
55 (26 – 67)
0.691
Male; female ratio 07;06 17;10 - MELD at transplant (median/range) 12 (7 – 22) 16 (06-26) 0.045
Donor Age (median/range) 51 (18 – 67)
52 (21 – 72)
0.512
BMI 24 (20 – 31
25 (17 – 36)
0.588
Donor male: female ratio 04:09 11:16 - Donor warm ischaemia time 21 (13-28) N/A -
Graft Macro-steatosis - No steatosis - Mild - Moderate - Severe
02 11 - -
04 22 01 -
-
CIT elapsed before bench microdialysis (min)
237 (44 – 357)
238 (53 – 534)
0.441
Duration of bench microdialysis (min)
219 (150 – 380)
224 (101 – 333)
0.754
Overall CIT before reperfusion (min) 428 (256 – 651)
471 (284 – 817)
0.345
Graft implantation time 40 (31 – 59)
37 (30 – 65)
0.197
Degree of PRI by histology - Mild - Mild-moderate - Moderate - Moderate-severe - Severe
03 06 01 02 01
11 09 05 01 01
-
Abbreviations: DCD – donation after circulatory death, DBD – donation after brain death, ALD – alcoholic liver disease, PBC – Primary biliary cirrhosis, PSC – primary sclerosing cholangitis, HBV – hepatitis B virus, HCV – hepatitis C virus, MELD – model for end stage liver disease, BMI – body mass index, CIT – cold ischaemia time, PRI – preservation reperfusion injury; N/A not applicable for DBD donors; * Significance p<0.05 at 95% confidence interval, Mann- Whitney U test for 2 independent samples
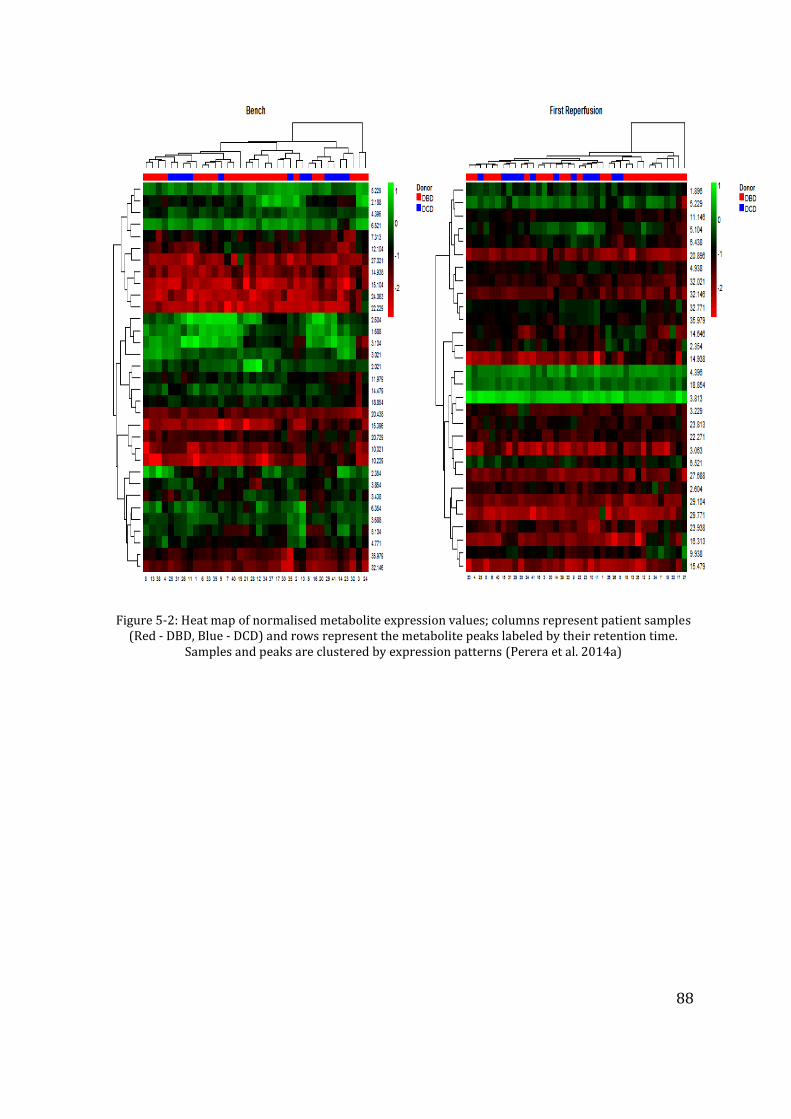
88
Figure 5-2: Heat map of normalised metabolite expression values; columns represent patient samples (Red - DBD, Blue - DCD) and rows represent the metabolite peaks labeled by their retention time.
Samples and peaks are clustered by expression patterns (Perera et al. 2014a)
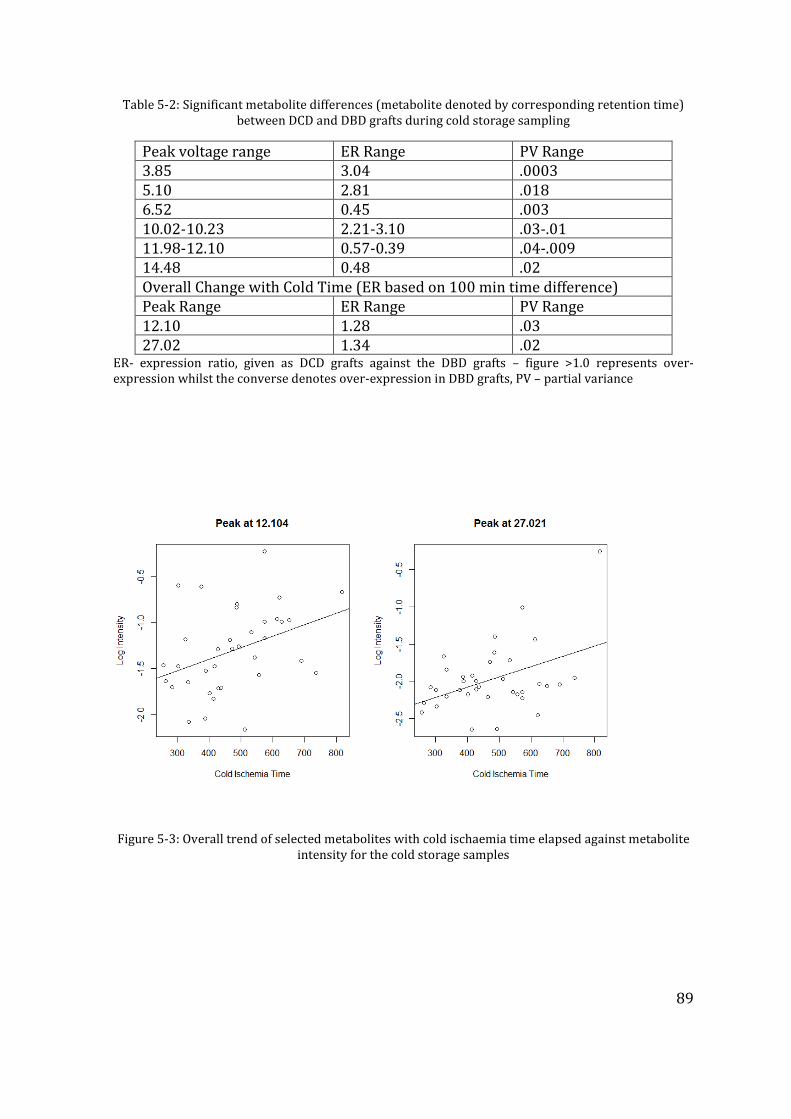
89
Table 5-2: Significant metabolite differences (metabolite denoted by corresponding retention time) between DCD and DBD grafts during cold storage sampling
Peak voltage range ER Range PV Range 3.85 3.04 .0003 5.10 2.81 .018 6.52 0.45 .003 10.02-10.23 2.21-3.10 .03-.01 11.98-12.10 0.57-0.39 .04-.009 14.48 0.48 .02 Overall Change with Cold Time (ER based on 100 min time difference) Peak Range ER Range PV Range 12.10 1.28 .03 27.02 1.34 .02
ER- expression ratio, given as DCD grafts against the DBD grafts – figure >1.0 represents over-expression whilst the converse denotes over-expression in DBD grafts, PV – partial variance
Figure 5-3: Overall trend of selected metabolites with cold ischaemia time elapsed against metabolite
intensity for the cold storage samples
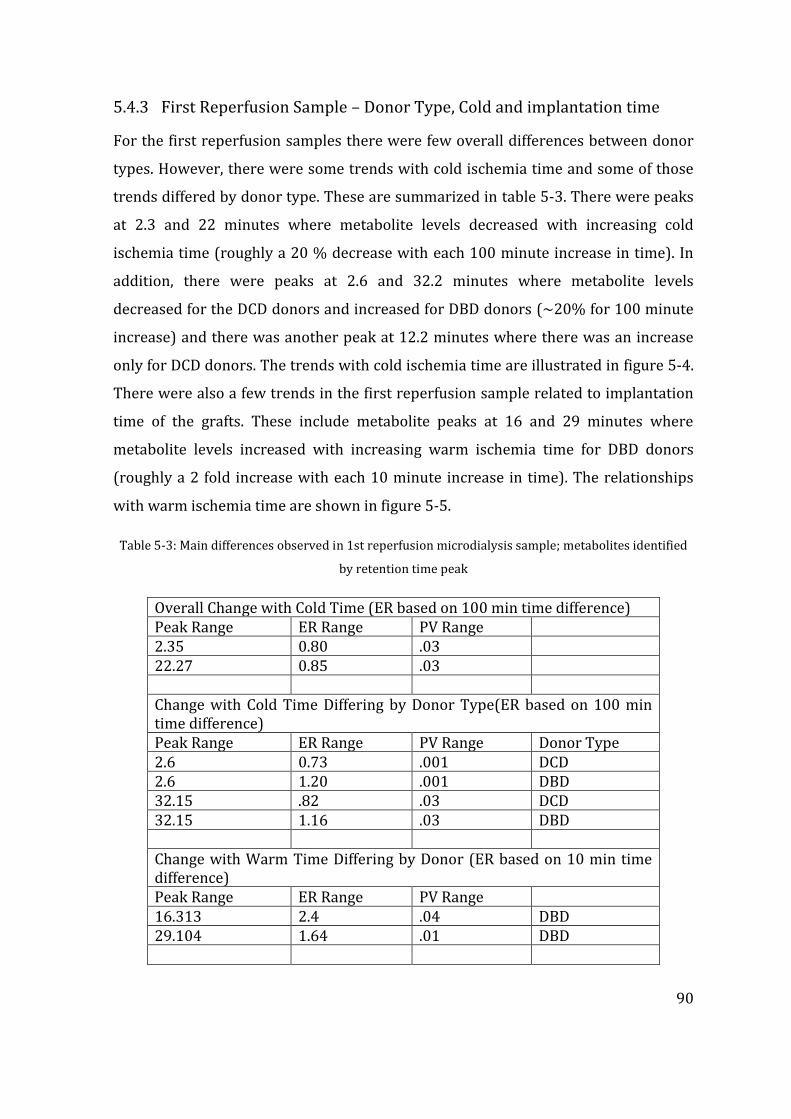
90
5.4.3 First Reperfusion Sample – Donor Type, Cold and implantation time
For the first reperfusion samples there were few overall differences between donor
types. However, there were some trends with cold ischemia time and some of those
trends differed by donor type. These are summarized in table 5-3. There were peaks
at 2.3 and 22 minutes where metabolite levels decreased with increasing cold
ischemia time (roughly a 20 % decrease with each 100 minute increase in time). In
addition, there were peaks at 2.6 and 32.2 minutes where metabolite levels
decreased for the DCD donors and increased for DBD donors (~20% for 100 minute
increase) and there was another peak at 12.2 minutes where there was an increase
only for DCD donors. The trends with cold ischemia time are illustrated in figure 5-4.
There were also a few trends in the first reperfusion sample related to implantation
time of the grafts. These include metabolite peaks at 16 and 29 minutes where
metabolite levels increased with increasing warm ischemia time for DBD donors
(roughly a 2 fold increase with each 10 minute increase in time). The relationships
with warm ischemia time are shown in figure 5-5.
Table 5-3: Main differences observed in 1st reperfusion microdialysis sample; metabolites identified
by retention time peak
Overall Change with Cold Time (ER based on 100 min time difference) Peak Range ER Range PV Range 2.35 0.80 .03 22.27 0.85 .03 Change with Cold Time Differing by Donor Type(ER based on 100 min time difference) Peak Range ER Range PV Range Donor Type 2.6 0.73 .001 DCD 2.6 1.20 .001 DBD 32.15 .82 .03 DCD 32.15 1.16 .03 DBD Change with Warm Time Differing by Donor (ER based on 10 min time difference) Peak Range ER Range PV Range 16.313 2.4 .04 DBD 29.104 1.64 .01 DBD
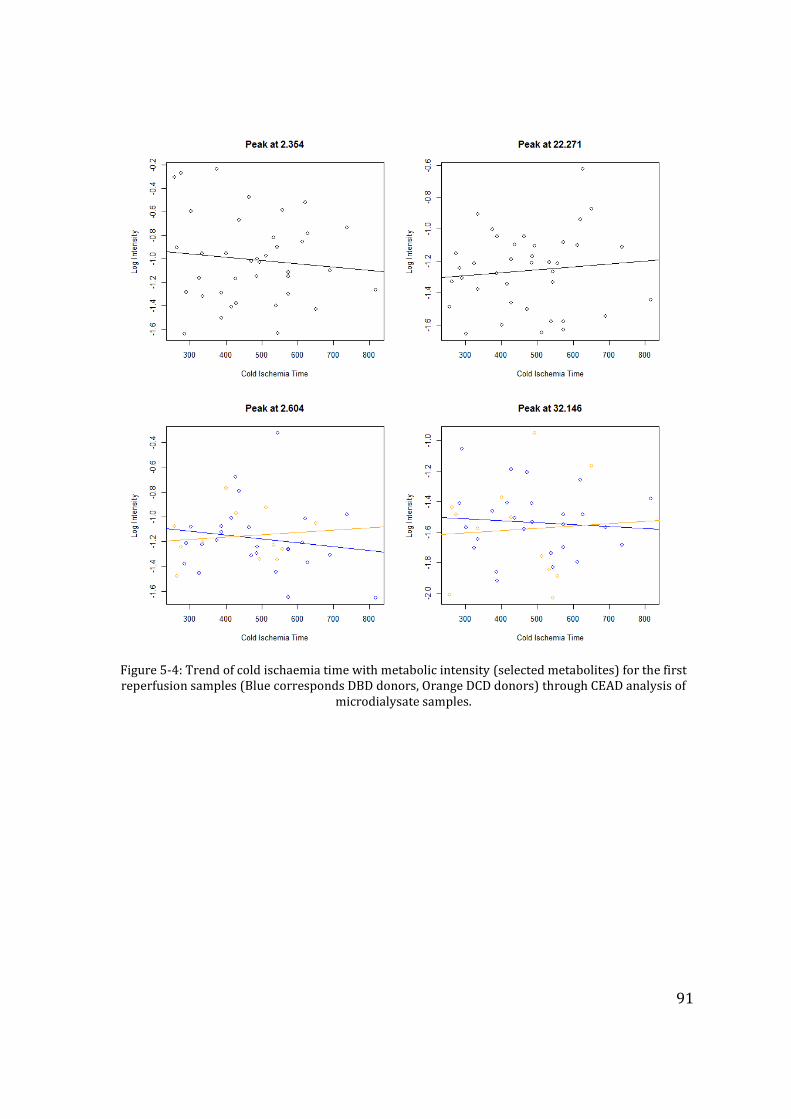
91
Figure 5-4: Trend of cold ischaemia time with metabolic intensity (selected metabolites) for the first reperfusion samples (Blue corresponds DBD donors, Orange DCD donors) through CEAD analysis of
microdialysate samples.
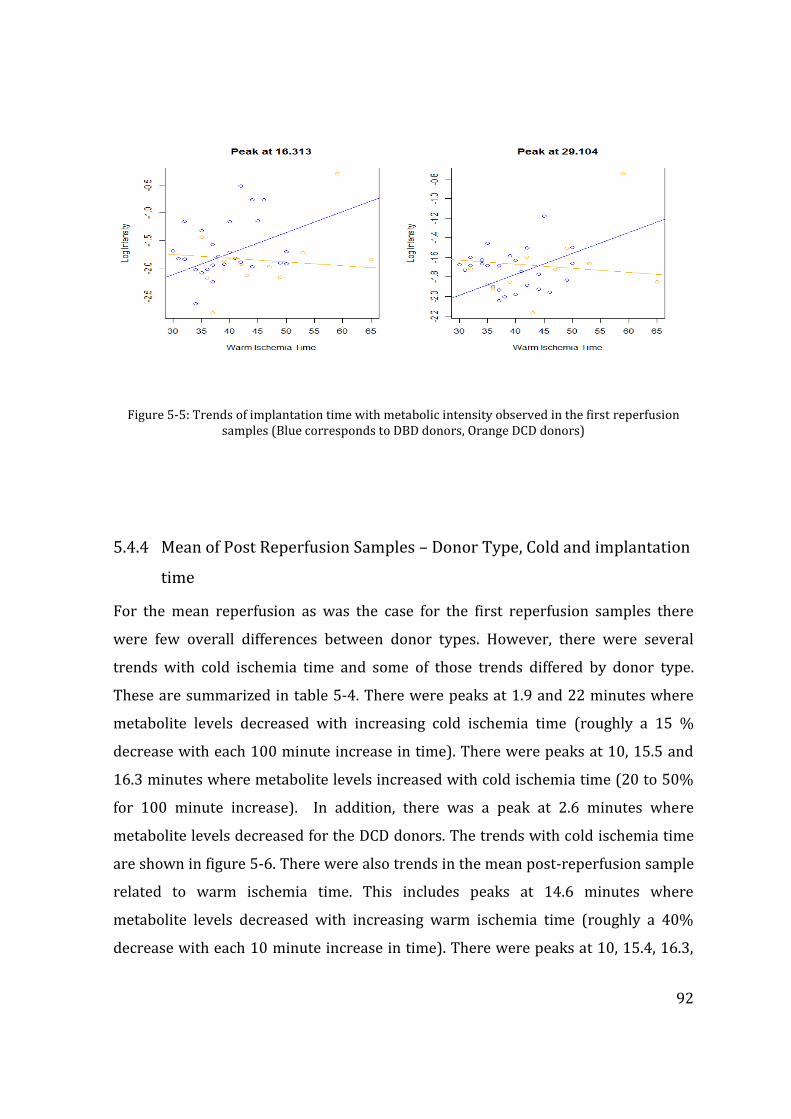
92
Figure 5-5: Trends of implantation time with metabolic intensity observed in the first reperfusion samples (Blue corresponds to DBD donors, Orange DCD donors)
5.4.4 Mean of Post Reperfusion Samples – Donor Type, Cold and implantation
time
For the mean reperfusion as was the case for the first reperfusion samples there
were few overall differences between donor types. However, there were several
trends with cold ischemia time and some of those trends differed by donor type.
These are summarized in table 5-4. There were peaks at 1.9 and 22 minutes where
metabolite levels decreased with increasing cold ischemia time (roughly a 15 %
decrease with each 100 minute increase in time). There were peaks at 10, 15.5 and
16.3 minutes where metabolite levels increased with cold ischemia time (20 to 50%
for 100 minute increase). In addition, there was a peak at 2.6 minutes where
metabolite levels decreased for the DCD donors. The trends with cold ischemia time
are shown in figure 5-6. There were also trends in the mean post-reperfusion sample
related to warm ischemia time. This includes peaks at 14.6 minutes where
metabolite levels decreased with increasing warm ischemia time (roughly a 40%
decrease with each 10 minute increase in time). There were peaks at 10, 15.4, 16.3,
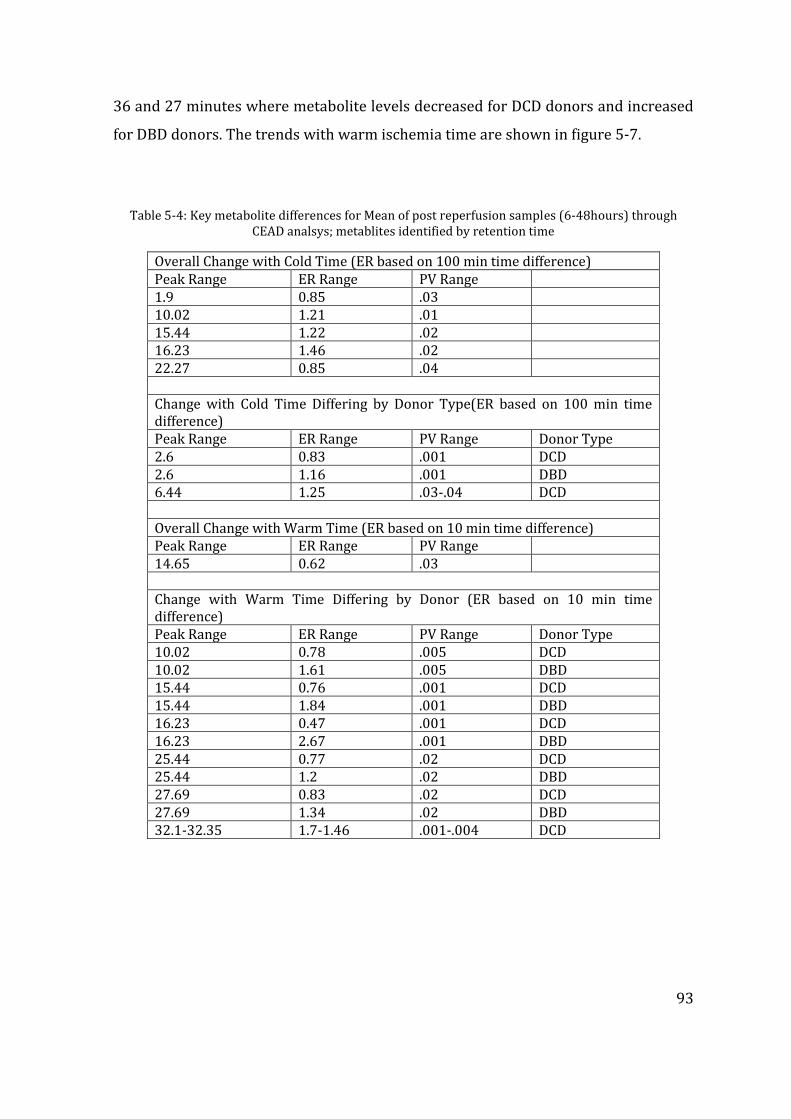
93
36 and 27 minutes where metabolite levels decreased for DCD donors and increased
for DBD donors. The trends with warm ischemia time are shown in figure 5-7.
Table 5-4: Key metabolite differences for Mean of post reperfusion samples (6-48hours) through CEAD analsys; metablites identified by retention time
Overall Change with Cold Time (ER based on 100 min time difference) Peak Range ER Range PV Range 1.9 0.85 .03 10.02 1.21 .01 15.44 1.22 .02 16.23 1.46 .02 22.27 0.85 .04 Change with Cold Time Differing by Donor Type(ER based on 100 min time difference) Peak Range ER Range PV Range Donor Type 2.6 0.83 .001 DCD 2.6 1.16 .001 DBD 6.44 1.25 .03-.04 DCD Overall Change with Warm Time (ER based on 10 min time difference) Peak Range ER Range PV Range 14.65 0.62 .03 Change with Warm Time Differing by Donor (ER based on 10 min time difference) Peak Range ER Range PV Range Donor Type 10.02 0.78 .005 DCD 10.02 1.61 .005 DBD 15.44 0.76 .001 DCD 15.44 1.84 .001 DBD 16.23 0.47 .001 DCD 16.23 2.67 .001 DBD 25.44 0.77 .02 DCD 25.44 1.2 .02 DBD 27.69 0.83 .02 DCD 27.69 1.34 .02 DBD 32.1-32.35 1.7-1.46 .001-.004 DCD
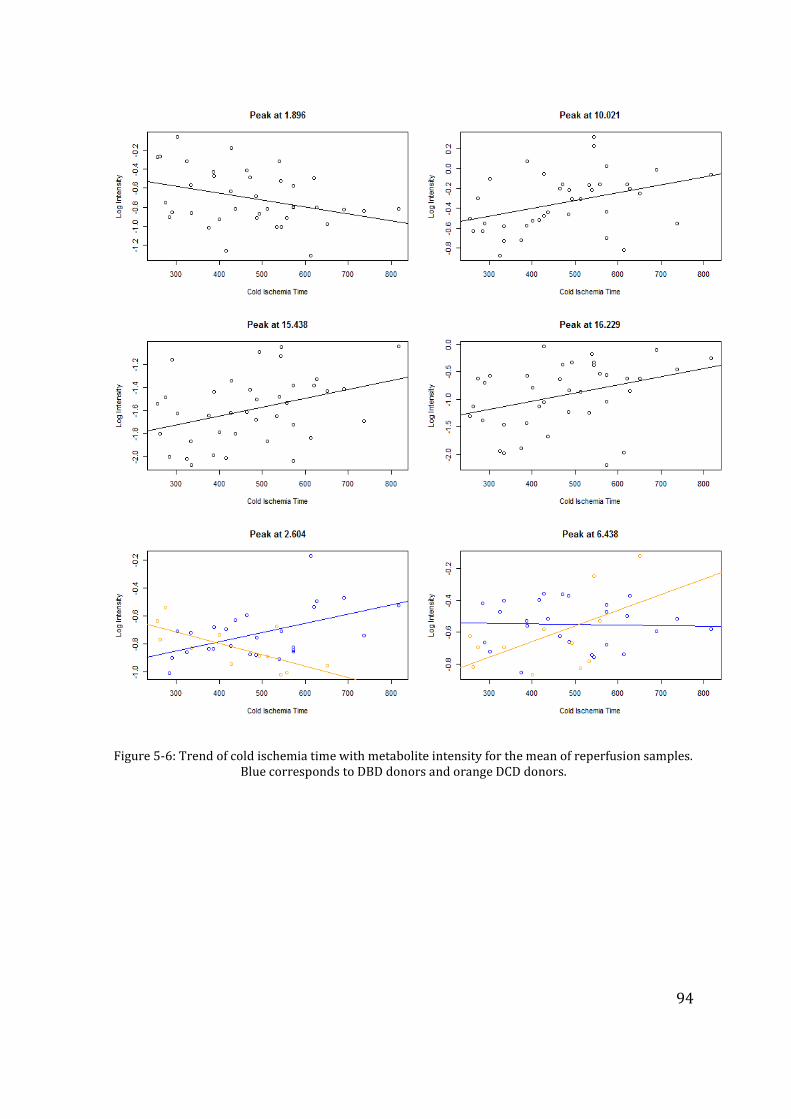
94
Figure 5-6: Trend of cold ischemia time with metabolite intensity for the mean of reperfusion samples. Blue corresponds to DBD donors and orange DCD donors.
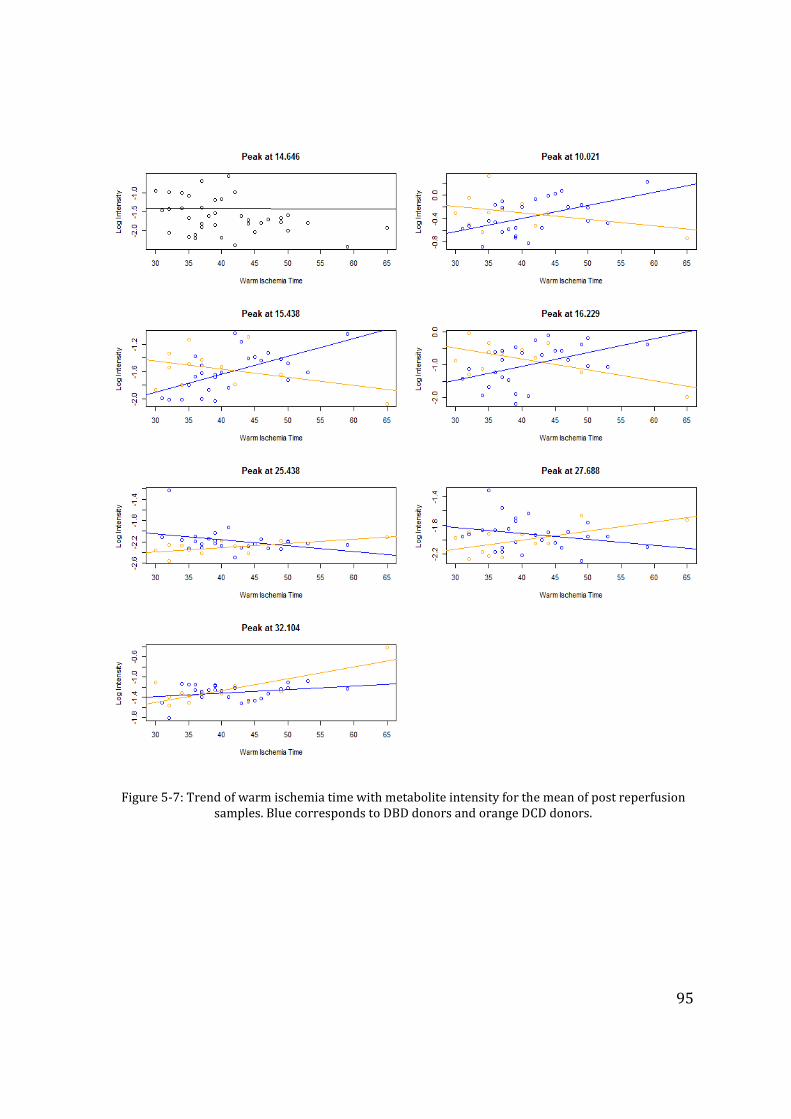
95
Figure 5-7: Trend of warm ischemia time with metabolite intensity for the mean of post reperfusion samples. Blue corresponds to DBD donors and orange DCD donors.
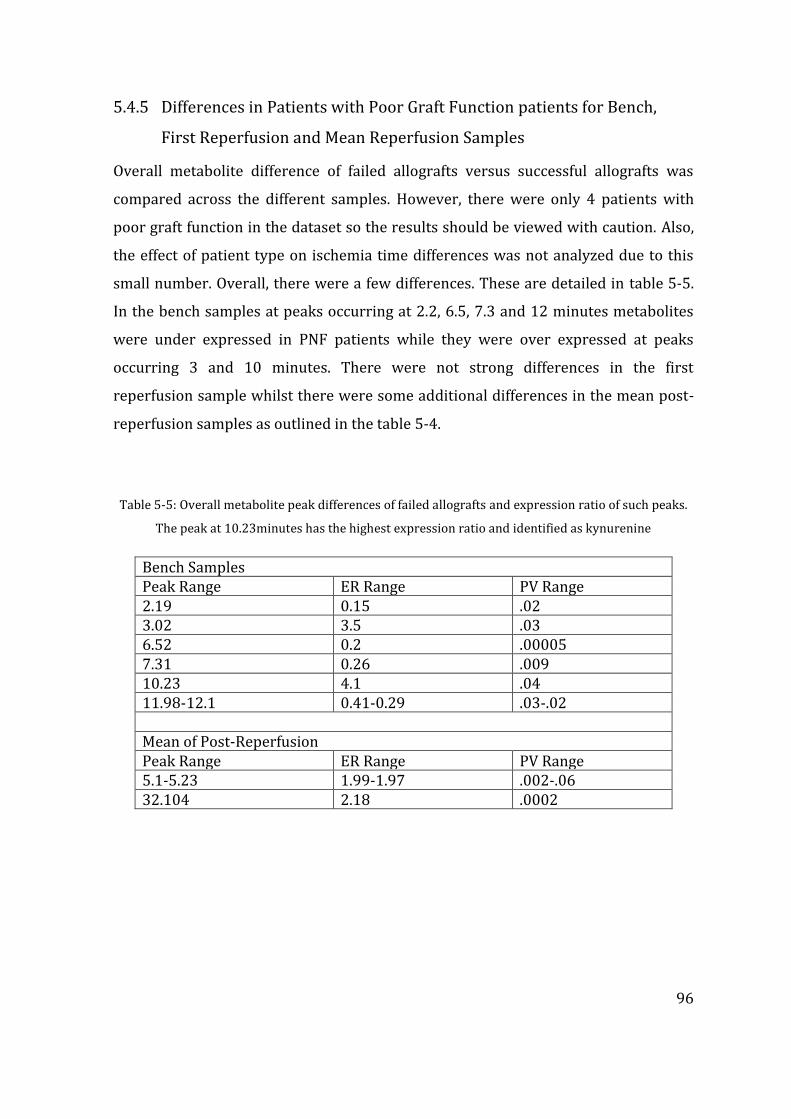
96
5.4.5 Differences in Patients with Poor Graft Function patients for Bench,
First Reperfusion and Mean Reperfusion Samples
Overall metabolite difference of failed allografts versus successful allografts was
compared across the different samples. However, there were only 4 patients with
poor graft function in the dataset so the results should be viewed with caution. Also,
the effect of patient type on ischemia time differences was not analyzed due to this
small number. Overall, there were a few differences. These are detailed in table 5-5.
In the bench samples at peaks occurring at 2.2, 6.5, 7.3 and 12 minutes metabolites
were under expressed in PNF patients while they were over expressed at peaks
occurring 3 and 10 minutes. There were not strong differences in the first
reperfusion sample whilst there were some additional differences in the mean post-
reperfusion samples as outlined in the table 5-4.
Table 5-5: Overall metabolite peak differences of failed allografts and expression ratio of such peaks.
The peak at 10.23minutes has the highest expression ratio and identified as kynurenine
Bench Samples Peak Range ER Range PV Range 2.19 0.15 .02 3.02 3.5 .03 6.52 0.2 .00005 7.31 0.26 .009 10.23 4.1 .04 11.98-12.1 0.41-0.29 .03-.02 Mean of Post-Reperfusion Peak Range ER Range PV Range 5.1-5.23 1.99-1.97 .002-.06 32.104 2.18 .0002
97
5.5 Summary of main metabolite differences
The reference metabolite table used in the CEAD analysis described in Chapter 2 and
the above mentioned metabolic peaks were identified and against the reference
table. Table 5-6 summarises the key metabolic differences between DCD and DBD
grafts. In summary, 3 patterns of metabolite expression could be seen – over
expression, concordant or discordant increase or decrease in metabolites in
relevance to the cold ischaemia time. Of the metabolites over expressed, Xanthine,
Uric acid and Kynurenine are over expressed nearly 3-fold in DCD grafts towards the
end of cold ischaemia; however the only putatively identifiable metabolites over
expressed in DBD grafts were 3-Nitrotyrosine (3-NT) and 4-Hydroxy-3-
methoxymandelic acid (HMMA). Differential expression of Methionine was noted in
the first reperfusion sample between the graft types, and two other unknown
metabolites (occurring at retention times 2.35 and 22.7minutes) gradually declined
with increasing cold ischaemia time. Both Xanthine and 3-NT gradually declined in
both graft types meanwhile Kynurenine showed a slow rise following reperfusion.
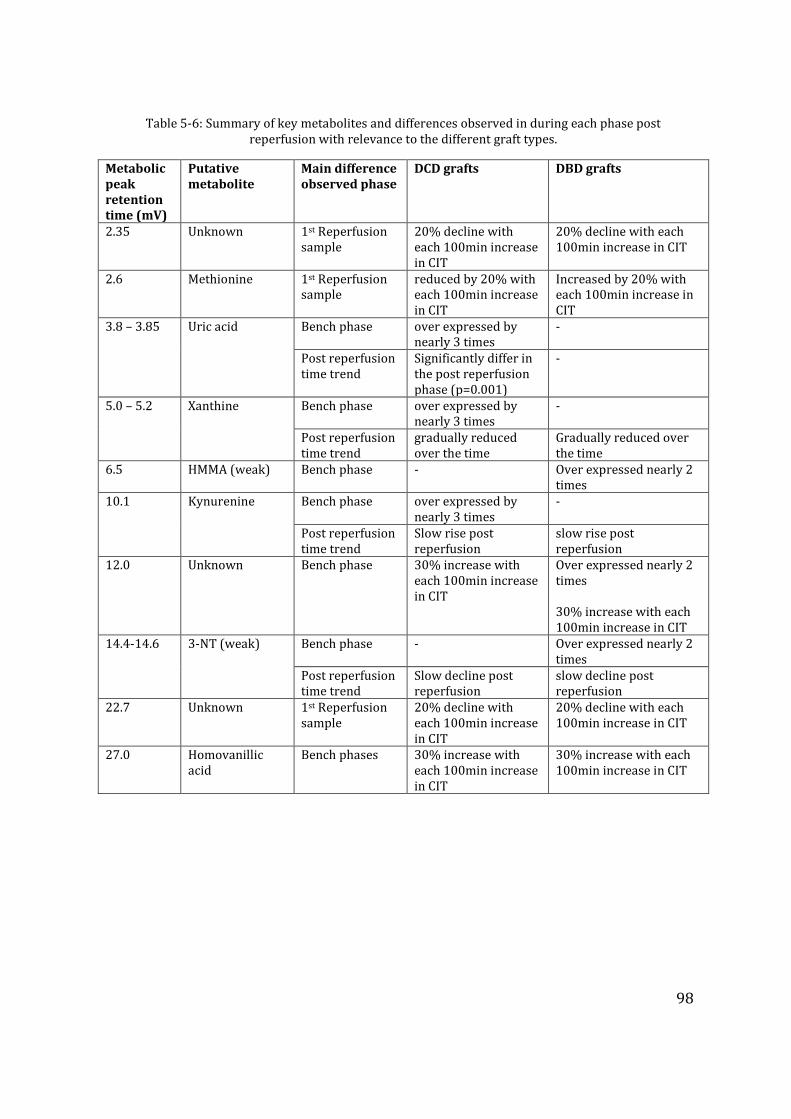
98
Table 5-6: Summary of key metabolites and differences observed in during each phase post
reperfusion with relevance to the different graft types.
Metabolic peak retention time (mV)
Putative metabolite
Main difference observed phase
DCD grafts DBD grafts
2.35 Unknown 1st Reperfusion sample
20% decline with each 100min increase in CIT
20% decline with each 100min increase in CIT
2.6 Methionine 1st Reperfusion sample
reduced by 20% with each 100min increase in CIT
Increased by 20% with each 100min increase in CIT
3.8 – 3.85 Uric acid Bench phase over expressed by nearly 3 times
-
Post reperfusion time trend
Significantly differ in the post reperfusion phase (p=0.001)
-
5.0 – 5.2 Xanthine Bench phase over expressed by nearly 3 times
-
Post reperfusion time trend
gradually reduced over the time
Gradually reduced over the time
6.5 HMMA (weak) Bench phase - Over expressed nearly 2 times
10.1 Kynurenine Bench phase over expressed by nearly 3 times
-
Post reperfusion time trend
Slow rise post reperfusion
slow rise post reperfusion
12.0 Unknown Bench phase 30% increase with each 100min increase in CIT
Over expressed nearly 2 times 30% increase with each 100min increase in CIT
14.4-14.6 3-NT (weak) Bench phase - Over expressed nearly 2 times
Post reperfusion time trend
Slow decline post reperfusion
slow decline post reperfusion
22.7 Unknown 1st Reperfusion sample
20% decline with each 100min increase in CIT
20% decline with each 100min increase in CIT
27.0 Homovanillic acid
Bench phases 30% increase with each 100min increase in CIT
30% increase with each 100min increase in CIT
99
5.6 Discussion
The technological advances made in the past decade on separation and identification
of small molecules, coupled with development of data analysis software paved the
way for the metabolomic studies(Wishart 2005b). These are increasingly applied in
both experimental and clinical medicine including identification of molecular targets
in cancer treatment, biomarker discovery in the diagnosis of disease, and therapeutic
drug monitoring (Bogdanov et al. 2008;Kaddurah-Daouk and Krishnan 2008;Rozen
et al. 2005). Similarly metabolomics has been applied to solid organ transplantation
although this is still in infancy (Clarke et al. 2003;Coca et al. 2007;Gok et al. 2003).
The Coularray is a High Performance Liquid Chromatography
(HPLC)/electrochemical detection system used for the analysis of redox-active
metabolites and thus is highly relevant in situations where oxidative stress may
occur including organ transplantation (Silva, Mirza, Buckels, Bramhall, Mayer,
Wigmore, Murphy, & Richards 2006a). CEAD offers two major advantages as an
analytical approach for metabolomics studies. The first is its very high sensitivity,
which is far greater than that of nuclear magnetic resonance (NMR) studies, and
superior to mass spectrometric (MS) studies. This allows it to detect metabolites
present at a very low concentration, but which may still be clinically significant. The
other advantage is its selectivity for redox-active metabolites, which may be of great
value in the study of situations where oxidative stress may be a contributory factor.
By avoiding the detection, and subsequent interference, of non-relevant metabolites
that may be present at far higher concentrations, a more selective group of clinically-
relevant metabolites may emerge. However, this may also be considered to be a
disadvantage as, by definition, the metabolome encompasses the full range of
metabolites present. However, there is no single analytical technique capable of
achieving this, at all levels of sensitivity, and metabolomics studies often encompass
more than one analytical approach (Koal and Deigner 2010).
100
Previously, through a proof of principle study we documented the applicability of
metabolomic studies in liver transplantation (Hrydziuszko et al. 2010b). Moving
further, this study examines the metabolomic changes in the process of human
orthotopic liver transplantation – covering the journey through the cold storage to
post reperfusion in a large study cohort. From a clinical and pathophysiological
perspective, the primary difference between the DCD and DBD grafts is the known
donor warm ischaemia time (dWIT) incurred by DCD donors prior to organ harvest
(Ikeda et al. 1992). The deleterious effects dWIT has on the performance of a graft
are such that DCD grafts are categorised as marginal grafts (Strasberg, Howard,
Molmenti, & Hertl 1994). It is well known that this difference exists due to energy
exhaustion prior to the organ preservation initiation, however in depth knowledge of
metabolic changes that occur in DCD grafts are required to explore the avenues of
maximizing the utility of this graft source (Minor et al. 1998). The data in this
manuscript attempts to bridge this information gap and to our knowledge this is the
first human study of metabolomics in liver transplantation comparing the key
differences between DBD and DCD grafts.
The donor characteristics between the two groups in this study are similar. Graft
steatosis has been previously reported to be a key parameter impacting the degree of
PRI and subsequent clinical outcomes; in this study there was a very low degree of
significant macro-steatosis, with one graft showing moderate macrosteatosis. In
addition, the CIT elapsed prior to the insertion of microdialysis catheter, duration of
bench sampling; the overall CIT and implantation times are comparable between the
groups. Hence it is reasonable to assume the metabolic changes discovered in DCD
and not DBD grafts are the result of or attributable to the dWIT superimposed on the
DCD grafts.
This study identified several key metabolites that differ between grafts. Xanthine,
Uric acid, and Kynurenine are the three significant metabolites that were over-
expressed by DCD grafts in the cold phase. Although the former two metabolites have
101
been extensively studied in the past in ischaemia-reperfusion model, the finding of
kynurenine is unique to our study. As the liver grafts have been perfused with
identical preservation techniques and cold stored for a comparable time period, it is
important to determine if these changes are indeed the result of warm ischaemic
damage to the liver grafts. The DBD grafts over-expressed HMMA and 3-NT although
it is not certain that the identification of these metabolites is correct. Other
significant metabolites in relevance to the field of ischaemia reperfusion injury are
those that increased with progressive increase in CIT. It could be speculated by
increasing the CIT by nearly 5 hours the expression of Homovanillic acid along with
another unidentified metabolite concentration may double, given the 30% rise for
each 100minute increment of cold storage time. HMMA and homovanillic acid
intermediary are end metabolic products of catecholamine metabolism, hence the
significance of these findings may not be relevant.
Kynurenine, an intermediate metabolite of essential amino acid tryptophan is
generated by two enzyme systems; this rate limiting step of tryptophan metabolism
is catalysed by indoleamine 2-3 dioxygenase (IDO) and tryptophan 2-3 dioxygenase
(TDO) (Knox 1951;Mehler and Knox 1950). IDO is virtually in almost all cellular
systems, however TDO is liver specific (Knox and Mehler 1950). The increased
expression of kynurenine in DCD grafts is therefore more likely to be due to
increased TDO activity, as all other enzymes downstream in the metabolic pathway
are present in abundance and TDO is the only inducible and rate limiting enzyme in
this pathway (Taylor and Feng 1991). TDO is inducible by an increased amount of
substrate itself, and also by hydrocortisone and glucocorticoids (Altman and
Greengard 1966). The grafts studied were procured from identical situations with
preservation solution devoid of tryptophan supplementation; in addition DCD
donors did not receive high doses of steroids such as are usually given to the DBD
donors. The slow rise in kynurenine in both types is probably explained by routine
prescription of hydrocortisone in the immunosuppression medication (Young
1981;Young and Sourkes 1975), but none of these explain the over-expression of this
metabolite in the cold stored DCD grafts. It is uncertain therefore if the TDO was
102
induced by hypoxia--to date no studies have confirmed this finding. A catecholamine
surge in the donor and induction of TDO during the agonal phase of organ donation
following the treatment withdrawal is a possibility. The immune- and cyto-protective
effects of both IDO and TDO by degradation of tryptophan have been documented
and further studies focusing this metabolite may be helpful (Mellor and Munn
2004;Terness et al. 2002).
Xanthine and Uric acid are formed by the enzyme xanthine oxidase through its action
on the substrate hypoxanthine and a major pathway of purine nucleoside catabolism.
Both these metabolites have been previously identified as biomarkers of ischaemic
injury (Vajdova et al. 2000). During oxidative stress the enzymatic action of xanthine
oxidase is increased with formation of reactive oxygen species (ROS) and uric acid.
Although uric acid may be regarded as a scavenger against tissue injury, it is not
known if uric acid is indeed the cause or effect. It is likely that the actual tissue
damage is caused by ROS itself rather than uric acid and the latter is the metabolic
by-product of an over-activated pathway. Several studies suggest uric acid as a
marker of ischaemic damage of the liver grafts (Clavien et al. 1992), including
occasional case studies reporting its increase in the presence of poor organ function
following LT (Serkova et al. 2007). It is likely that tissue hypo-perfusion and
hypoxaemia during the treatment withdrawal phase in DCD donors triggered the
conversion of more inert enzyme xanthine dehydrogenase to xanthine oxidase (Brass
et al. 1991). In this regard further investigation of enzyme xanthine oxidase during
organ preservation, with emphasis on modulation of its enzyme activity in DCD
donors could open avenues for further studies (Amador et al. 2007;Ishii et al.
1990;Wishart 2008).
A limitation of the present study is the failure to recognize three metabolite peaks
occurring at the retention times of 2.35, 12.0 and 22.7 minutes. However, these
metabolite peaks followed the similar trends in both types of liver grafts; therefore
the clinical significance of these may be less relevant. The lack of information it
103
provides regarding unknown peak identification is a disadvantage of CEAD for
metabolomics studies. Unlike NMR which may indicate functional groups present
and MS which may provide a mass number, the identification of CEAD peaks is reliant
on comparison of its chromatographic and electrochemical properties to known
electroactive compounds from reference databases. Peaks of interest not identified
by this process may be investigated further by fraction collection or replicating
chromatographic conditions with MS detection, for example. The future of
metabolomic studies in LT should probably focus on different approaches with
recognition of biomarkers in different biofluids and hepatic tissue. A shot-gun
approach to identify metabolites recognized in this study may be useful in further
investigations; certain limitations apply to different analytical techniques. A
combination of CEAD, NMR or FTICR mass spectrometry could be complementary to
each other (Wishart 2008).
To summarize our findings, this study investigates the use of CEAD as an analytical
platform to investigate metabolomic changes that occur through cold storage to post
reperfusion injury in cadaveric liver transplantation. These results provide, to date,
data for the largest human study group examined. The majority of the metabolomic
studies reported in the literature involved experimental models however the data
presented herein are accumulated through real transplantation settings. Moreover,
the metabolite differences that exist between the DCD and DBD liver grafts are the
key findings of this study, and in this regard the finding of kynurenine as a potential
marker of aggravated ischaemic injury over-expressed by DCD grafts is novel. These
findings have the potential to stimulate the scientific community to further explore
these differences, with the eventual objective of graft modulation for improved
outcomes. The authors aim to further analyze the significance of metabolites
identified in this study through correlation with clinical factors and their ability to
predict graft outcomes using statistical models. We have not presented the clinical
outcome data in the presented manuscript for a number of reasons; as this is the only
largest study on metabolomics in human liver transplantation, the primary objective
was set as identifying metabolic differences in each stage from cold storage to
104
reperfusion of liver allografts and those exist between DCD and DBD grafts. With this
view point, the focus was on presenting all the relevant data and results related to
the basic experiment and analysis.
105
CHAPTER 6 FTICR BASED MASS SPECTROMETRY ANALYSIS
OF DCD AND DBD LIVER GRAFTS USED IN CLINICAL
LIVER TRANSPLNATATION
The work outlined in this chapter amounts to collaborative work. The researcher
presenting the thesis was responsible for liver graft biopsy sampling during the
operative procedures, clinical data collection and participated in sample extraction and
analysis through FTICR, which was primarily carried out with collaboration with the
School of Biosciences by Olga Hrydziuszko under the tutelage of Jennifer Kirwan and
Professor Mark Viant. Biostatistics support was provided by the same research group at
the School of Biosciences in the clinical directions provided by the researcher
presenting this thesis under the supervision by Professor Darius Mirza and other
collaborators. This work is currently being prepared for publication.
6.1 Introduction
Identifying the metabolic differences between DCD and DBD liver grafts could
significantly improve current clinical practise by identifying biomarkers of poor graft
function prior to transplantation. Selection of grafts from donors that exhibit such
metabolic biomarkers could assist in clinical decision making and the exclusion of
those organs from transplantation, thereby preventing the adverse clinical sequelae
after transplantation. This would also help those transplant programs that are reliant
on cadaveric donor organs for transplantation by reducing the need to perform re-
transplant operations on those who had failed liver grafts, minimizing the burden
and demand for organs. Furthermore, identifying the metabolic differences between
DCD and DBD liver grafts could help to identify the metabolic modifications of livers
before and after the organ procurement from the donor that would improve the
organ quality, an approach called metabolic therapy. This approach is justified by the
106
nature of current organ donation practice. In the United Kingdom alone there has
been a steep rise in DCD donations in recent years. However, only 27% of liver grafts
from these donors are used in clinical transplantation, with approximately 8% of
these being excluded due to the high risk of primary non-function. In addition, the
majority of grafts are not even procured due to the increased time elapsed between
the treatment withdrawal phase and circulatory death, which is beyond the currently
accepted criteria of donor warm ischaemia time (30 minutes). Relating the metabolic
profiles of DCD and DBD liver grafts to the outcome of the transplantation could
supplement and expand the traditional methods to predict organ function, in
particular early on during the transplantation procedure.
Previous pilot study demonstrated the potential of Fourier transform ion cyclotron
resonance (FTICR) mass spectrometry to detect a few thousand metabolic features
(or peaks) in biopsies obtained from liver grafts in the cold and post-reperfusion
phases of orthotopic liver transplantation (Hrydziuszko, Silva, PR Perera, Richards,
Murphy, Mirza, & Viant 2010b). We observed and characterized changes in multiple
metabolic pathways showing a rapid resumption of biochemical function within the
grafts following reperfusion (Reich, Mulligan, Abt, Pruett, Abecassis, D' alessandro,
Pomfret, Freeman, Markmann, & Hanto 2009). The extended study described herein
represents a larger study group in comparison to the proof of principle study
described in the chapter 3. Here, we expand considerably upon this initial
investigation, specifically with the aim to investigate and characterize the metabolic
differences between DCD and DBD liver grafts during two key phases of the liver
transplantation, the cold storage phase (T1, CP) and post-reperfusion phase (T2, PR).
We seek to reveal the underlying metabolic pathways associated with the clinical
observation of reduced success of the DCD grafts.
107
6.2 Fourier Transform Ion Cyclotron Resistance – Direct Infusion
(FTICR-DI) mass spectrometry
6.2.1 Basis of FTICR
Mass spectrometry is a novel analytical platform applied in the investigation of the
metabolome and several techniques exist, and these include Fourier transform ion
cyclotron resonance mass spectrometry (FTICR-MS), Gas chromatography mass
spectrometry (GC-MS), liquid chromatography mass spectrometry (LC-MS) and
direct injection mass spectrometry (DIMS) (Dunn 2008;Dunn and Ellis 2005). FTICR
has the highest high resolution power compared with other analytical methods.
Resolution power could be simply described as the ability to separate two signal
peaks and for FTICR this is generally over 200 000(Guan et al. 1996;Ohta et al. 2010).
This enables the mass analyser to detect greater number of metabolites present
within a sample. The other advantage of the FTICR technique is the highest mass
accuracy (m calc – m exp /m calc x106), defined as the ability of a particular mass
spectrometry analyser to accurately assign its mass closest to the theoretical mass
value, and in the case of FTICR this could be in the range of less than 1 parts per
million (ppm)(Schmid et al. 2000). Owing to these two properties of the FTICR
technique, this increasingly being used to investigate complex biological systems and
is an ideal tool for biomarker and metabolomics/proteomic studies (Zhang et al.
2014). Rather than molecular mass itself, FTICR-MS measures compounds based on
their mass-to-charge ratio (m/z). The m/z ratio is calculated by measuring the
frequency at which the ion processes in a fixed magnetic field, that can simply be
described as the ion motion or the cyclotron frequency once excited in a magnetic
field (Dunn 2008). These frequencies, which typically are in the 100 KHz to MHz
range, can be very accurately measured as the ions pass near the detection plates
(electrodes). This is a fundamental difference between FTICR and other analytical
techniques is that, in most systems ions are detected as they hit the detection plates
whereas in FTICR the frequency of ion motion is detected as they pass near the
detection plates or electrodes. It is the modern electronics that makes it possible to
accurately determine the mass within 1ppm difference increasing its resolution
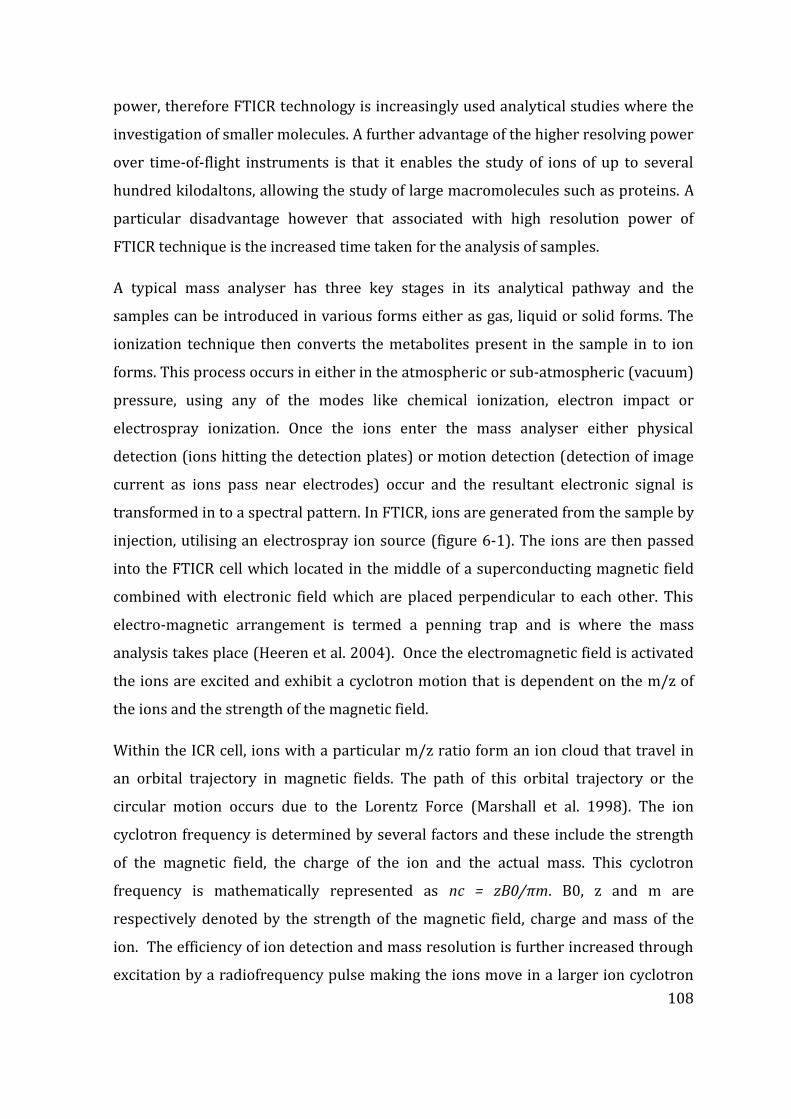
108
power, therefore FTICR technology is increasingly used analytical studies where the
investigation of smaller molecules. A further advantage of the higher resolving power
over time-of-flight instruments is that it enables the study of ions of up to several
hundred kilodaltons, allowing the study of large macromolecules such as proteins. A
particular disadvantage however that associated with high resolution power of
FTICR technique is the increased time taken for the analysis of samples.
A typical mass analyser has three key stages in its analytical pathway and the
samples can be introduced in various forms either as gas, liquid or solid forms. The
ionization technique then converts the metabolites present in the sample in to ion
forms. This process occurs in either in the atmospheric or sub-atmospheric (vacuum)
pressure, using any of the modes like chemical ionization, electron impact or
electrospray ionization. Once the ions enter the mass analyser either physical
detection (ions hitting the detection plates) or motion detection (detection of image
current as ions pass near electrodes) occur and the resultant electronic signal is
transformed in to a spectral pattern. In FTICR, ions are generated from the sample by
injection, utilising an electrospray ion source (figure 6-1). The ions are then passed
into the FTICR cell which located in the middle of a superconducting magnetic field
combined with electronic field which are placed perpendicular to each other. This
electro-magnetic arrangement is termed a penning trap and is where the mass
analysis takes place (Heeren et al. 2004). Once the electromagnetic field is activated
the ions are excited and exhibit a cyclotron motion that is dependent on the m/z of
the ions and the strength of the magnetic field.
Within the ICR cell, ions with a particular m/z ratio form an ion cloud that travel in
an orbital trajectory in magnetic fields. The path of this orbital trajectory or the
circular motion occurs due to the Lorentz Force (Marshall et al. 1998). The ion
cyclotron frequency is determined by several factors and these include the strength
of the magnetic field, the charge of the ion and the actual mass. This cyclotron
frequency is mathematically represented as nc = zB0/πm. B0, z and m are
respectively denoted by the strength of the magnetic field, charge and mass of the
ion. The efficiency of ion detection and mass resolution is further increased through
excitation by a radiofrequency pulse making the ions move in a larger ion cyclotron
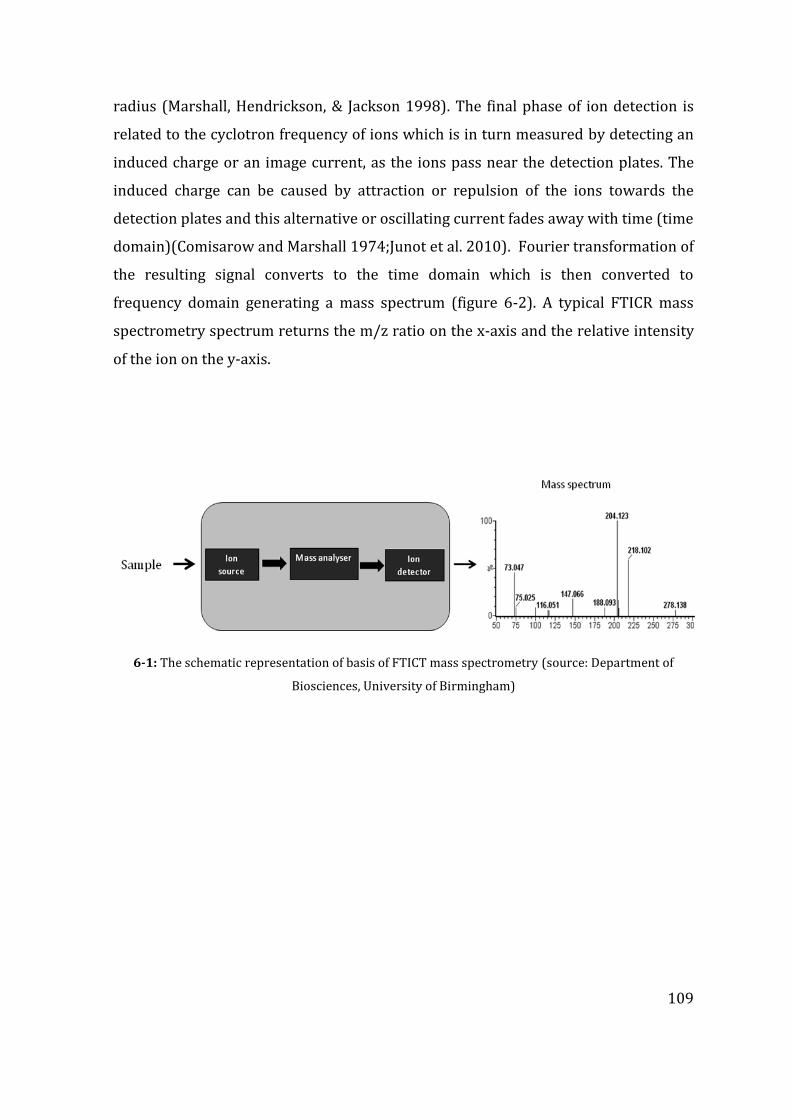
109
radius (Marshall, Hendrickson, & Jackson 1998). The final phase of ion detection is
related to the cyclotron frequency of ions which is in turn measured by detecting an
induced charge or an image current, as the ions pass near the detection plates. The
induced charge can be caused by attraction or repulsion of the ions towards the
detection plates and this alternative or oscillating current fades away with time (time
domain)(Comisarow and Marshall 1974;Junot et al. 2010). Fourier transformation of
the resulting signal converts to the time domain which is then converted to
frequency domain generating a mass spectrum (figure 6-2). A typical FTICR mass
spectrometry spectrum returns the m/z ratio on the x-axis and the relative intensity
of the ion on the y-axis.
6-1: The schematic representation of basis of FTICT mass spectrometry (source: Department of
Biosciences, University of Birmingham)
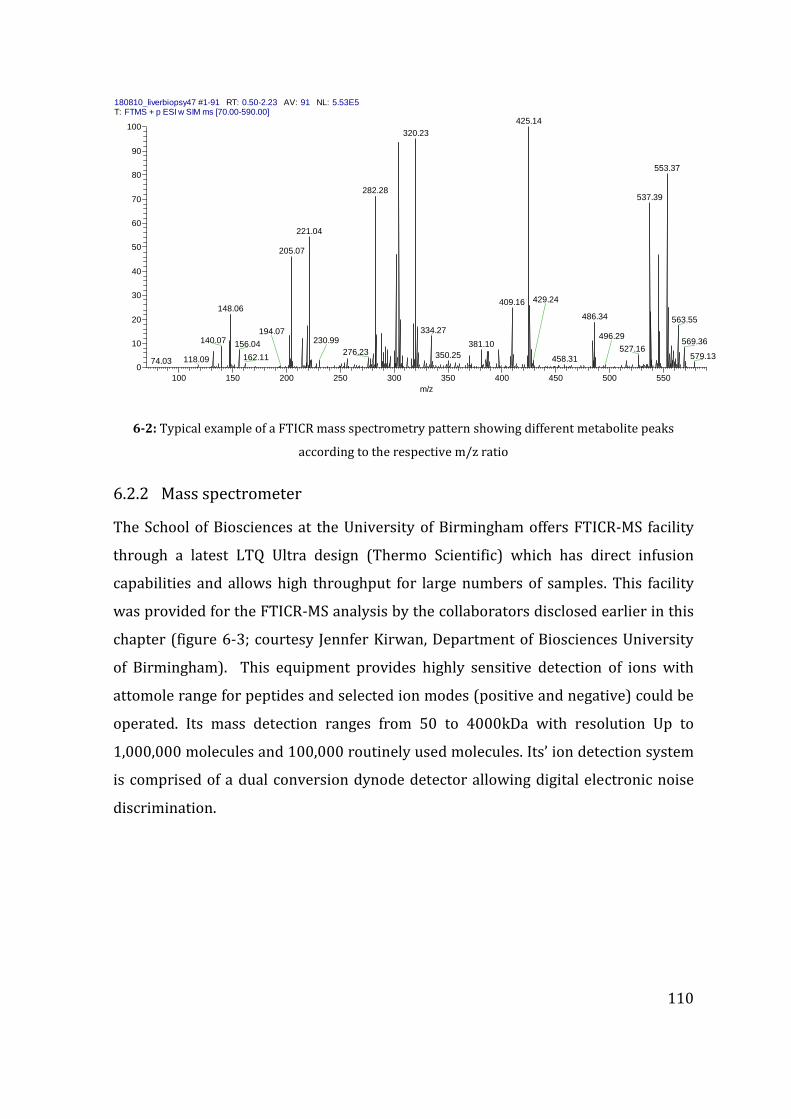
110
180810_liverbiopsy47 #1-91 RT: 0.50-2.23 AV: 91 NL: 5.53E5T: FTMS + p ESI w SIM ms [70.00-590.00]
100 150 200 250 300 350 400 450 500 550
m/z
0
10
20
30
40
50
60
70
80
90
100
Re
lative
Ab
un
da
nce
425.14
320.23
553.37
282.28537.39
221.04
205.07
409.16148.06
486.34 563.55
334.27
140.07 569.36156.04 381.10527.16276.23
429.24
230.99
350.25 579.13162.11 458.31
496.29
118.09
194.07
74.03
6-2: Typical example of a FTICR mass spectrometry pattern showing different metabolite peaks
according to the respective m/z ratio
6.2.2 Mass spectrometer
The School of Biosciences at the University of Birmingham offers FTICR-MS facility
through a latest LTQ Ultra design (Thermo Scientific) which has direct infusion
capabilities and allows high throughput for large numbers of samples. This facility
was provided for the FTICR-MS analysis by the collaborators disclosed earlier in this
chapter (figure 6-3; courtesy Jennfer Kirwan, Department of Biosciences University
of Birmingham). This equipment provides highly sensitive detection of ions with
attomole range for peptides and selected ion modes (positive and negative) could be
operated. Its mass detection ranges from 50 to 4000kDa with resolution Up to
1,000,000 molecules and 100,000 routinely used molecules. Its’ ion detection system
is comprised of a dual conversion dynode detector allowing digital electronic noise
discrimination.
111
Thermo LTQ FT ultra
Fourier Transform Ion Cyclotron Resonance (FT-ICR) mass
spectrometry facility in Birmingham
Ion trap
NanoMatechip-based electrospray
ICR detector
6-3: The Thermo LTQ FT Ultra mass spectrometer with key elements labeled (Image courtesy –
Jennifer Kirwan, Department of Biosciences, University of Birmingham)
6.2.2.1 Tissue extraction for FTICR Mass Spectrometry Analysis
Tissue extraction form the liver allograft biopsies was done according to the sample
extraction protocol designed for small samples (<10mg). This technique involves
Methanol:Chloroform:water to separate polar metabolites of the extracted tissue
following homogenisation of the tissue sample.
Equipment: Precellys 24 homogeniser
1.8ml glass vials with aluminium lined caps (Fisher TUL 520 006 J)
2ml Eppendorfs
Glass Pasteur Pipettes
Hamilton Syringes (Fisher 500µl)
Solvents: 100% MeOH (HPLC Grade)
100% CHCl3 (Pesticide Grade)
100% HPLC grade H20
112
6.2.2.2 Tissue Extraction Protocol:
The frozen tissue is stored in Precellys tubes with beads in -80 freezer and the
solvents used in the tissue extraction protocol were maintained at 4ºC and kept on
ice during the extraction phase. First MeOH is added at 32µl/mg of tissue and
12.8µl/mg of H20 keeping precellys tubes on ice, and then the tubes were placed in
the Precellys 24 homogeniser for 2 x 10s bursts at 6400 rpm. The homogenised
mixture is then removed into a clean 1.8ml glass vial using a Pasteur pipette whilst
maintaining the temperature of the glass vials on ice, 32µl/mg CHCl3 and 16µl/mg
H20 added to each vial. Subsequently Vortex vials on full power for 30s before
leaving on for further 10minutes. Finally the samples are centrifuged at 4000 rpm at
4ºC for 10 minutes. At the end of the centrifugal phase samples are set on bench at
room temperature for further 5 minutes that allow clear separation of the samples in
to a biphasic sample with protein debris separating the upper (polar) and lower
(non-polar) layers. Using a Hamilton Syringe, the polar phase is removed into 2 clean
eppendorfs (1 positive, 1 negative) and if required for analysis the non-polar phase is
also removed. Particular care is should be given here not remove any of the interface
region, (1-2mm either side of the protein layer). The extracted samples are then
dried using a Speed Vac Concentrator (~1h with no heat) and that can be stored at -
800C until needed.
6.2.3 FTICR data analysis
FTICR data was generated by the liver allograft biopsies that were prepared for
metabolomics analysis as described previously (Reich, Mulligan, Abt, Pruett,
Abecassis, D'alessandro, Pomfret, Freeman, Markmann, & Hanto 2009). In brief,
biopsies were extracted using a methanol:chloroform:water method, separating the
extracts into polar and non-polar fractions (Wu et al. 2008). In total, 80 samples liver
biopsy samples were extracted and from these one quality control (QC) sample was
prepared by pooling a fraction of each of the 80 extracts (which was then aliquoted
into 11 identical fractions). The polar metabolite fraction of each sample was
113
analysed by ultrahigh resolution direct infusion nanoelectrospray FT-ICR mass
spectrometry (Thermo Fisher Scientific, Pittsburgh, PA, USA; LTQ FT) from m/z 70 to
500, in positive ion mode, using the SIM-stitching approach (Southam, Payne, Cooper,
Arvanitis, & Viant 2007) (figure 6-4). Each sample was analysed in triplicate. To
minimise false positive metabolites in the data matrix (due to noise), only peaks
present in at least 2 of the 3 replicate measurements of each sample were retained,
and then only peaks present in at least 75% of all the samples were retained for
further analysis (Payne, Southam, Arvanitis, & Viant 2009). This data processing also
served to exclude any peaks in the mass spectra that arose from the drugs that were
known to be administrated to the donors and recipients. The final data matrix
consisted of 1260 reproducibly detected peaks (rows) and 91 variables (80 biopsies
and 11 quality control samples; columns). The matrix contained 9.29% of missing
data which was imputed using a weighted k-nearest neighbours algorithm (k = 5)
(Hrydziuszko and Viant 2012). Data were then normalized using the probabilistic
quotient method (Dieterle et al. 2006) and subject to a generalised log
transformation (prior multivariate analysis) to stabilise the technical variance across
the peaks and hence to avoid the highest abundance peaks from dominating the
multivariate analysis (Parsons et al. 2007). Putative metabolite names were assigned
to the peaks based on their mass-to-charge ratio and taking into account commonly
detected ions forms, including [M-e]+, [M+H]+, [M+Na]+, [M+39K]+, [M+41K]+, [M+2Na-
H]+, [M+239K-H]+ and [M+NH4]+.
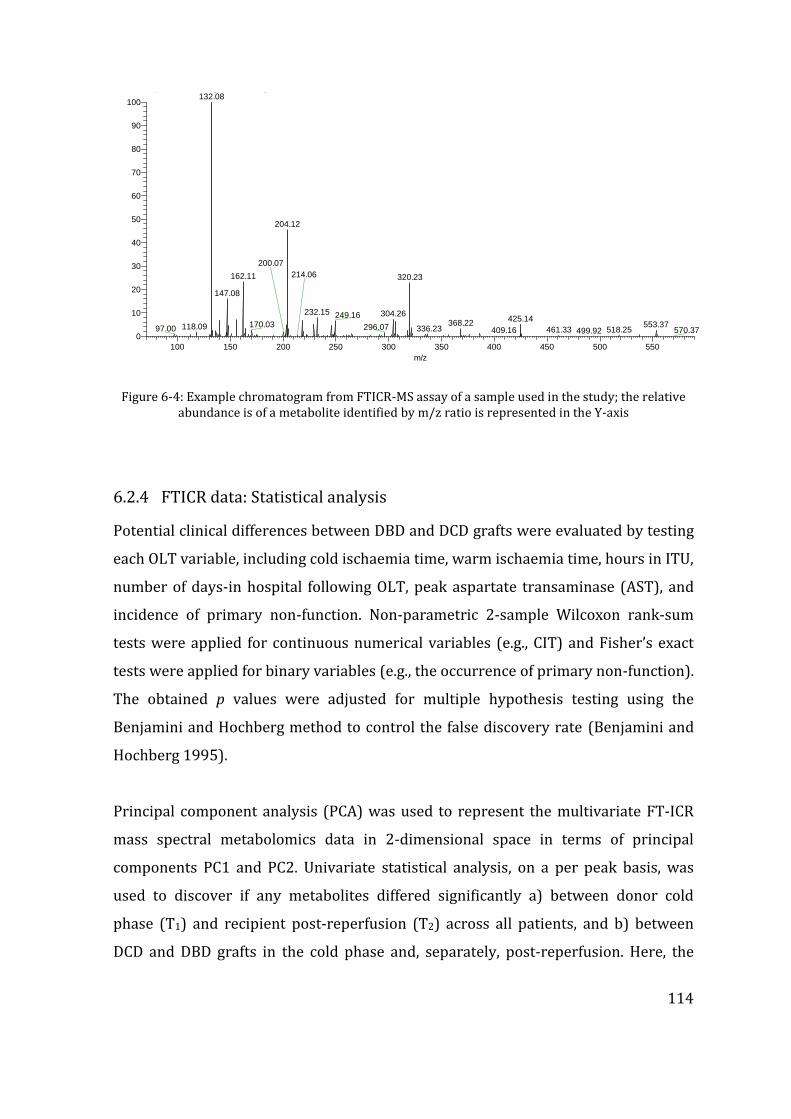
114
010411_repro_08 #1-87 RT: 0.50-2.24 AV: 87 NL: 1.58E6T: FTMS + p ESI w SIM ms [70.00-590.00]
100 150 200 250 300 350 400 450 500 550
m/z
0
10
20
30
40
50
60
70
80
90
100
Re
lative
Ab
un
da
nce
132.08
204.12
320.23162.11
147.08
232.15 304.26249.16 425.14368.22170.03 553.37
200.07
118.09 296.0797.00 336.23
214.06
461.33 518.25409.16 570.37499.92
Figure 6-4: Example chromatogram from FTICR-MS assay of a sample used in the study; the relative abundance is of a metabolite identified by m/z ratio is represented in the Y-axis
6.2.4 FTICR data: Statistical analysis
Potential clinical differences between DBD and DCD grafts were evaluated by testing
each OLT variable, including cold ischaemia time, warm ischaemia time, hours in ITU,
number of days-in hospital following OLT, peak aspartate transaminase (AST), and
incidence of primary non-function. Non-parametric 2-sample Wilcoxon rank-sum
tests were applied for continuous numerical variables (e.g., CIT) and Fisher’s exact
tests were applied for binary variables (e.g., the occurrence of primary non-function).
The obtained p values were adjusted for multiple hypothesis testing using the
Benjamini and Hochberg method to control the false discovery rate (Benjamini and
Hochberg 1995).
Principal component analysis (PCA) was used to represent the multivariate FT-ICR
mass spectral metabolomics data in 2-dimensional space in terms of principal
components PC1 and PC2. Univariate statistical analysis, on a per peak basis, was
used to discover if any metabolites differed significantly a) between donor cold
phase (T1) and recipient post-reperfusion (T2) across all patients, and b) between
DCD and DBD grafts in the cold phase and, separately, post-reperfusion. Here, the
115
Anderson-Darling test was used to evaluate normality assumptions, and since ca.
40% of the peaks did not follow a normal distribution, non-parametric statistical
methods were used, specifically a two-sample Wilcoxon rank-sum test and for its
extension to more groups, Kruskal-Wallis one-way analysis of variance, both with a
Benjamini and Hochberg false discovery correction. In addition, gain scores analysis
(Kruskal-Wallis on gain scores) was used to discover those metabolites that changed
in a significantly different manner from cold-phase to post-reperfusion between the
DCD and DBD grafts. All statistical analyses were carried out using R version 3.0.2, a
free programming language and software for statistical computing and graphics.
6.2.5 Putative assignment of metabolites
KEEG database contain very large number of genes and protein sequences, and is an
online resource which allows pathway mapping and identification of individual
metabolites that not only associated with humans, but also those from various other
biological cellular systems, as well as environmental pathways and pharmaceutical
compounds (http://www.genome.jp/kegg/pathway.html). The aim of this database
is to make functional and evolutionary hypothesis about genes or molecules that
researchers are interested. This database has been pioneered as a key resource for
scientists investigating complex large-scale bioinformatics molecular datasets such
as those generated by genomics, transcriptomics, proteomics, and metabolomics
(Kanehisa 2002). The database assists with pathway mapping of a large number of
biological systems, allows biological interpretation of higher-level systemic
functions. Initiated in 1995 under the human genome program of Ministry of
education in Japan, foreseeing the need for a computerised database this allowed the
interpretation of metabolic pathways (Kanehisa & Goto 2000). KEGG database is
comprised of large collection of manually drawn pathway maps representing
experimental knowledge on metabolism and various other functions of the cell and
the organism. The database originally consisted of pathways drawn in three broad
categories; genomes, pathways and ligand; however these were later expanded in
many other pathways(Kanehisa et al. 2006;Kanehisa & Goto 2000). Most of the
metabolomics studies are referenced to the pathways and ligand maps through a
116
“top-down” approach(Kanehisa 2002). With the advent of new experiments
involving the cellular systems these pathways are continuously amended and
extended. Each pathway map contains a large network of molecular interactions and
reactions and these pathways are designed to link genes in the genome to gene
products (mostly proteins) in the pathway (Kanehisa et al. 2008).
In our studies of FTICR based metabolomic study outlined in this chapter, the
putative assignment of metabolites was carried out with reference to the KEGG
database against the mass/charge ratio of each identified molecule, similar to the
methods described in our initial proof-of principle study (Hrydziuszko, Silva, PR
Perera, Richards, Murphy, Mirza, & Viant 2010b). One of the limitations of
identification of molecules detected by FTICR technique however, is difficulty of
computer based automated identification of molecules. This limitation is originating
from the high resolution power of the mass spectrometer, as a particular molecule
with a particular mass may be assigned to different empirical formulae resulting in
high false positive rates. School of Biosciences at the University of Birmingham uses
an approach called transformation mapping (TM) which increases the accuracy of
identification of metabolites (Weber and Viant 2010).
6.3 Patients and graft characteristics
The liver transplantation procedures were carried out in a similar manner for DBD
and DCD grafts and we did not notice any significant differences either at the
procedure level or the short-term outcomes. The mean CIT was 484.52 ± 143.59
(DBD) and 461.00 ± 116.97 (DCD), whereas the mean implantation time, when grafts
were exposed to further warm ischaemia until the circulation was restored, was
41.85 ± 6.94 (DBD) and 41.80 ± 9.77 (DCD). The recipients spent on average 95.04 ±
120.80 (DBD) and 123.22 ± 174.48 (DCD) hours in the intensive care unit. Table 6-1
depicts the basic demographics of the study population. The majority of transplants
were successful; three patients in the entire study group had peri-operative
mortality (n=2 in the DBD group). The causes of death were related to initial poor
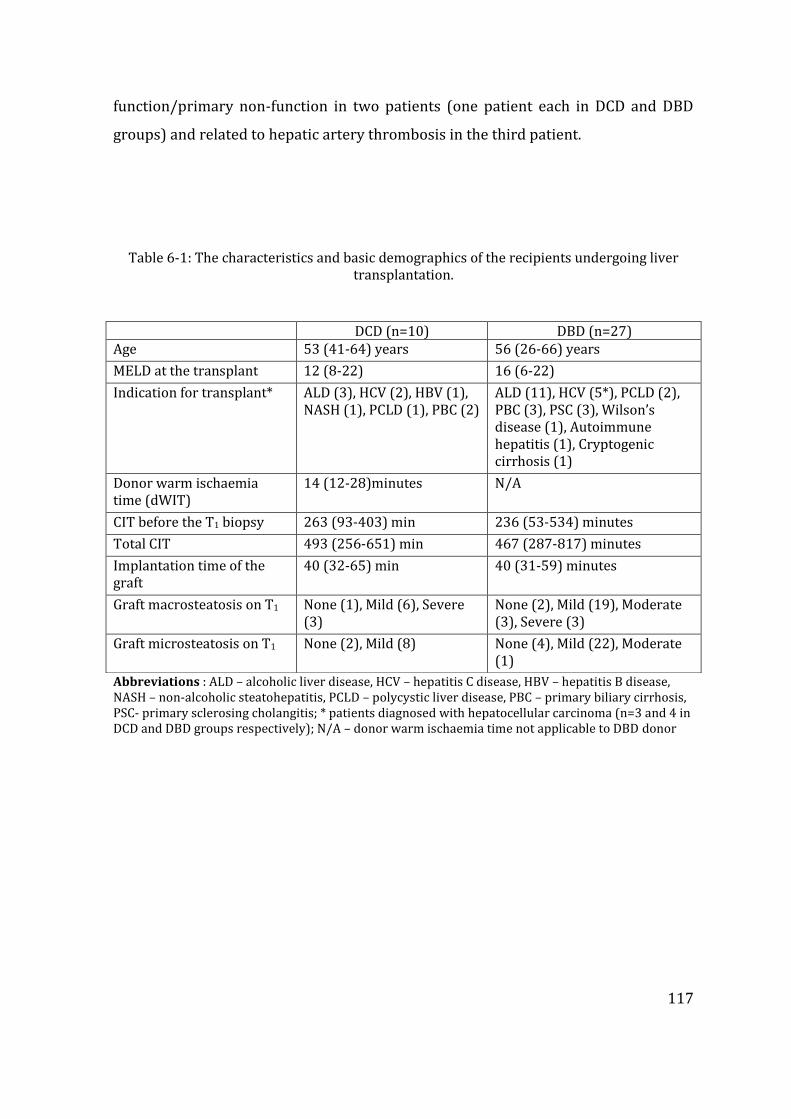
117
function/primary non-function in two patients (one patient each in DCD and DBD
groups) and related to hepatic artery thrombosis in the third patient.
Table 6-1: The characteristics and basic demographics of the recipients undergoing liver transplantation.
Abbreviations : ALD – alcoholic liver disease, HCV – hepatitis C disease, HBV – hepatitis B disease, NASH – non-alcoholic steatohepatitis, PCLD – polycystic liver disease, PBC – primary biliary cirrhosis, PSC- primary sclerosing cholangitis; * patients diagnosed with hepatocellular carcinoma (n=3 and 4 in DCD and DBD groups respectively); N/A – donor warm ischaemia time not applicable to DBD donor
DCD (n=10) DBD (n=27) Age 53 (41-64) years 56 (26-66) years
MELD at the transplant 12 (8-22) 16 (6-22)
Indication for transplant* ALD (3), HCV (2), HBV (1), NASH (1), PCLD (1), PBC (2)
ALD (11), HCV (5*), PCLD (2), PBC (3), PSC (3), Wilson’s disease (1), Autoimmune hepatitis (1), Cryptogenic cirrhosis (1)
Donor warm ischaemia time (dWIT)
14 (12-28)minutes N/A
CIT before the T1 biopsy 263 (93-403) min 236 (53-534) minutes
Total CIT 493 (256-651) min 467 (287-817) minutes
Implantation time of the graft
40 (32-65) min 40 (31-59) minutes
Graft macrosteatosis on T1 None (1), Mild (6), Severe (3)
None (2), Mild (19), Moderate (3), Severe (3)
Graft microsteatosis on T1 None (2), Mild (8) None (4), Mild (22), Moderate (1)
118
The few cases of initial poor function and ischaemic injury in this study precluded us
from searching for metabolic changes that are predictive of the problematic (graft
injury) or unsuccessful (primary non-function) outcomes. However, previous studies
on larger cohorts (n > 300) of DBD and DCD liver transplantations provide evidence
for the inferiority of the DCD donations, including increased incidence of primary
non-function, biliary complications as well as lower graft- and patient survival (Foley
et al. 2005;Monbaliu et al. 2012). Therefore, here, we focused on investigating the
metabolic alterations in the DCD grafts as compared to the more traditional method
of transplantation using DBD donors. Due to the lack of significant differences
between the DCD and DBD procedures and outcomes in our study, all grafts within
the DCD group were treated equally, as were the DBD-graft group. Any metabolic
dissimilarity between these groups should therefore be reflective of the inherent
molecular differences between DCD and DBD grafts.
6.4 Changes in hepatic metabolism during transplantation
FTICR mass spectra of the extracted biopsies contained 1260 reproducibly detected
peaks of which 448 (35.56%) were putatively annotated based upon accurate mass
measurements and the Kyoto Encyclopaedia of Genes and Genomes database.
Principal component analysis verified the high technical reproducibility of the mass
spectra, evidenced by the clustering of the measurements of the QC sample on the
PCA scores plot (Mateo et al. 2006). Furthermore, the PCA scores showed a clear
separation between the biopsies from the cold phase (CP, T1) and post reperfusion
(PR, T2) (figure 6-5). The clustering of the donor biopsies (D, T0; obtained from six
DBD grafts while the organs were still perfused with warm circulation) close to the
post-reperfusion biopsies (PR, T2), with both groups having very distinctive
metabolic profiles compared to the biopsies originating from the cold phase
sampling is a striking result. This signifies the distinctively different metabolism of
hepatocytes in the perfused state compared to those in cold storage. This metabolic
separation was confirmed by univariate testing that detected 688 (54.60%)
significantly different peaks between CP (T1) and PR (T2), 293 peaks (23.25%)
119
between donor (T0) and CP (T1) and only 124 peaks (9.84%) between CP (T1) and PR
(T2) (Kruskal-Wallis test, p < 0.05). In our previous proof-of-principle study, we
identified a plethora of metabolic responses in the post-reperfused grafts compared
to their cold-phase state and concluded that these changes reflected the rapid
resumption of the biochemical functions of hepatocytes following reperfusion,
including increased urea production, bile acid synthesis and clearance of the
preservation solution. Here, in addition to verifying these expected metabolic
responses, we observed additional key metabolic changes including, amongst others,
putatively annotated essential (threonine and valine) and non-essential (tyrosine,
serine and proline) amino acids, taurine (a major constituent of bile), and kynurenine
(a central compound in the tryptophan metabolism pathway) (table 6-2).
The close grouping of the donor and post-reperfusion biopsies along with their clear
separation from the cold-phase biopsies (along PC1) is further supportive of the
rapid resumption of the biochemical functions in the reperfused grafts and shows the
direction of metabolic changes through the patient journey and the OLT procedure -
from ‘healthy’ donor grafts through cold-phase to almost fully functional grafts
shortly following reperfusion.
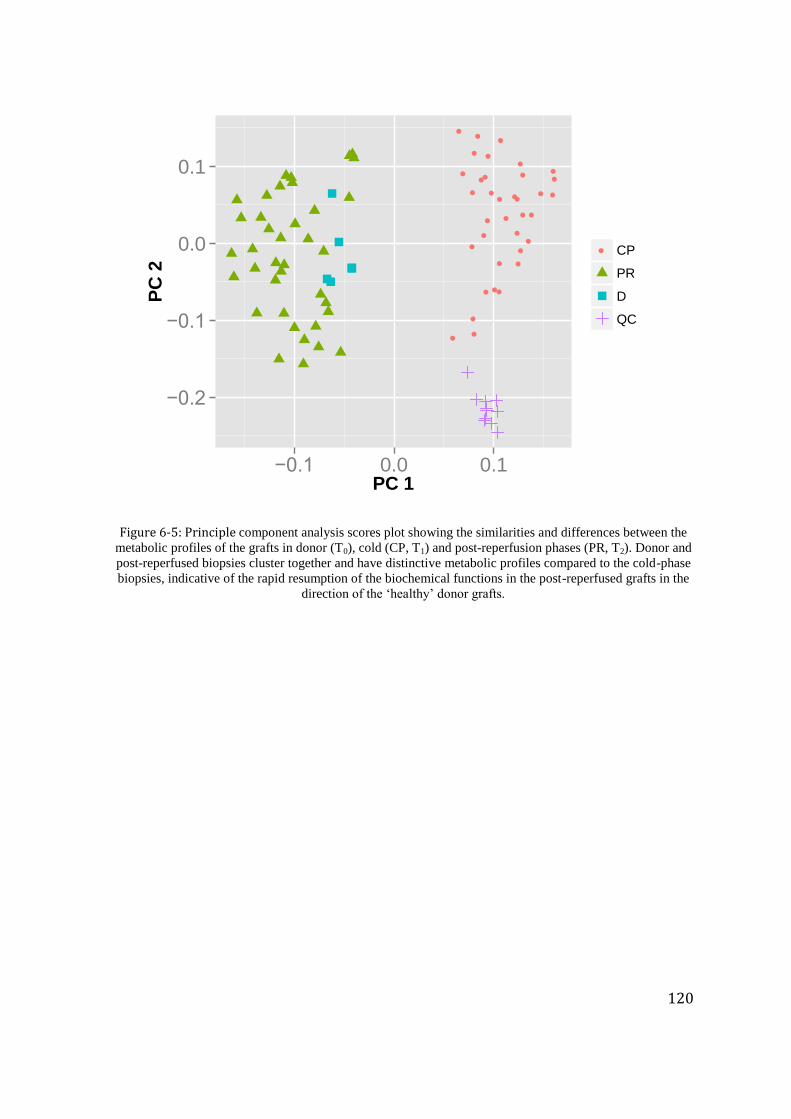
120
●
●
●
●
●
●
●
●
●
●
●
●
●
●●
●●
●
●
●
●
●
●
●
●
●●
●
●
●●
●
●
●
●
●
−0.2
−0.1
0.0
0.1
−0.1 0.0 0.1PC 1
PC
2
● CP
PR
D
QC
Figure 6-5: Principle component analysis scores plot showing the similarities and differences between the
metabolic profiles of the grafts in donor (T0), cold (CP, T1) and post-reperfusion phases (PR, T2). Donor and
post-reperfused biopsies cluster together and have distinctive metabolic profiles compared to the cold-phase
biopsies, indicative of the rapid resumption of the biochemical functions in the post-reperfused grafts in the
direction of the ‘healthy’ donor grafts.
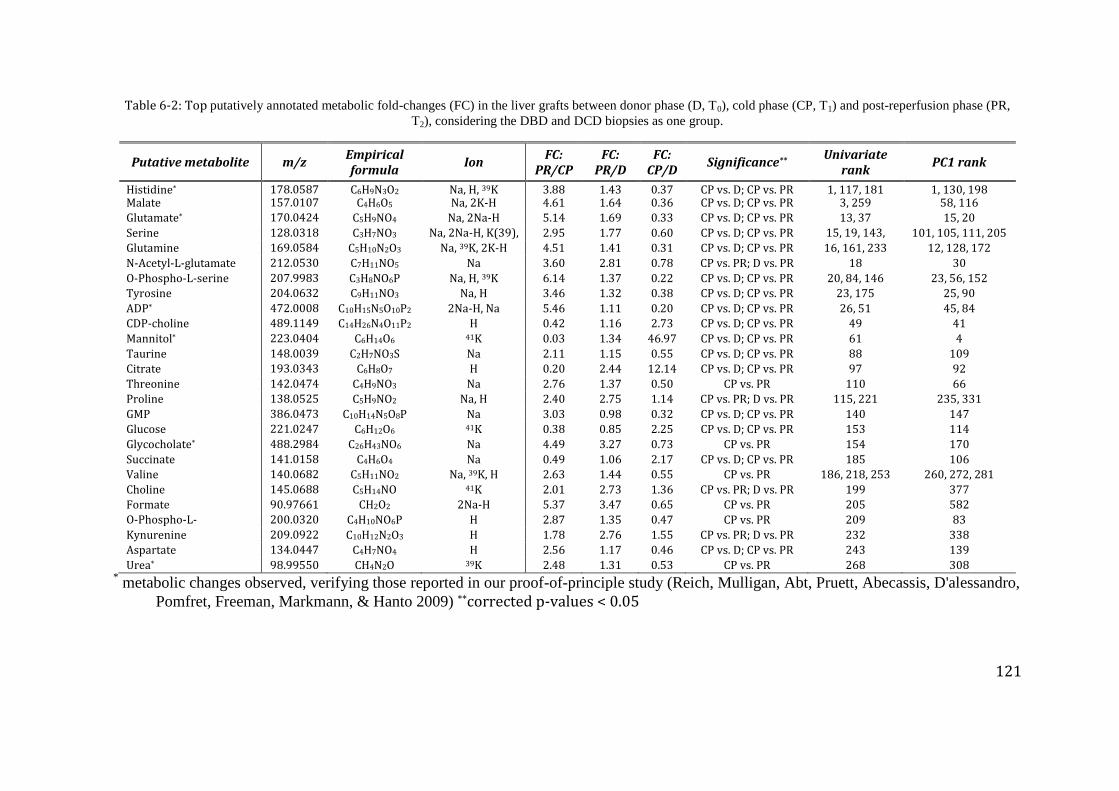
121
Table 6-2: Top putatively annotated metabolic fold-changes (FC) in the liver grafts between donor phase (D, T0), cold phase (CP, T1) and post-reperfusion phase (PR,
T2), considering the DBD and DCD biopsies as one group.
Putative metabolite m/z Empirical formula
Ion FC:
PR/CP FC:
PR/D FC:
CP/D Significance**
Univariate rank
PC1 rank
Histidine* 178.0587
6
C6H9N3O2 Na, H, 39K 3.88 1.43 0.37 CP vs. D; CP vs. PR 1, 117, 181 1, 130, 198 Malate 157.0107
9
C4H6O5 Na, 2K-H 4.61 1.64 0.36 CP vs. D; CP vs. PR 3, 259 58, 116
Glutamate* 170.0424
4
C5H9NO4 Na, 2Na-H 5.14 1.69 0.33 CP vs. D; CP vs. PR 13, 37 15, 20
Serine 128.0318
1
C3H7NO3 Na, 2Na-H, K(39),
H
2.95 1.77 0.60 CP vs. D; CP vs. PR 15, 19, 143,
203
101, 105, 111, 205
Glutamine 169.0584
2
C5H10N2O3 Na, 39K, 2K-H 4.51 1.41 0.31 CP vs. D; CP vs. PR 16, 161, 233 12, 128, 172
N-Acetyl-L-glutamate 212.0530
5
C7H11NO5 Na 3.60 2.81 0.78 CP vs. PR; D vs. PR 18 30
O-Phospho-L-serine 207.9983
5
C3H8NO6P Na, H, 39K 6.14 1.37 0.22 CP vs. D; CP vs. PR 20, 84, 146 23, 56, 152
Tyrosine 204.0632
1
C9H11NO3 Na, H 3.46 1.32 0.38 CP vs. D; CP vs. PR 23, 175 25, 90
ADP* 472.0008
3
C10H15N5O10P2 2Na-H, Na 5.46 1.11 0.20 CP vs. D; CP vs. PR 26, 51 45, 84
CDP-choline 489.1149
1
C14H26N4O11P2 H 0.42 1.16 2.73 CP vs. D; CP vs. PR 49 41
Mannitol* 223.0404
2
C6H14O6 41K 0.03 1.34 46.97 CP vs. D; CP vs. PR 61 4
Taurine 148.0039
0
C2H7NO3S Na 2.11 1.15 0.55 CP vs. D; CP vs. PR 88 109
Citrate 193.0343
5
C6H8O7 H 0.20 2.44 12.14 CP vs. D; CP vs. PR 97 92
Threonine 142.0474
8
C4H9NO3 Na 2.76 1.37 0.50 CP vs. PR 110 66
Proline 138.0525
6
C5H9NO2 Na, H 2.40 2.75 1.14 CP vs. PR; D vs. PR 115, 221 235, 331
GMP 386.0473
0
C10H14N5O8P Na 3.03 0.98 0.32 CP vs. D; CP vs. PR 140 147
Glucose 221.0247
8
C6H12O6 41K 0.38 0.85 2.25 CP vs. D; CP vs. PR 153 114
Glycocholate* 488.2984
4
C26H43NO6 Na 4.49 3.27 0.73 CP vs. PR 154 170
Succinate 141.0158
4
C4H6O4 Na 0.49 1.06 2.17 CP vs. D; CP vs. PR 185 106
Valine 140.0682
0
C5H11NO2 Na, 39K, H 2.63 1.44 0.55 CP vs. PR 186, 218, 253 260, 272, 281
Choline 145.0688
9
C5H14NO 41K 2.01 2.73 1.36 CP vs. PR; D vs. PR 199 377
Formate 90.97661 CH2O2 2Na-H 5.37 3.47 0.65 CP vs. PR 205 582
O-Phospho-L-
homoserine
200.0320
5
C4H10NO6P H 2.87 1.35 0.47 CP vs. PR 209 83
Kynurenine 209.0922
1
C10H12N2O3 H 1.78 2.76 1.55 CP vs. PR; D vs. PR 232 338
Aspartate 134.0447
9
C4H7NO4 H 2.56 1.17 0.46 CP vs. D; CP vs. PR 243 139
Urea* 98.99550 CH4N2O 39K 2.48 1.31 0.53 CP vs. PR 268 308 * metabolic changes observed, verifying those reported in our proof-of-principle study (Reich, Mulligan, Abt, Pruett, Abecassis, D'alessandro,
Pomfret, Freeman, Markmann, & Hanto 2009) **corrected p-values < 0.05
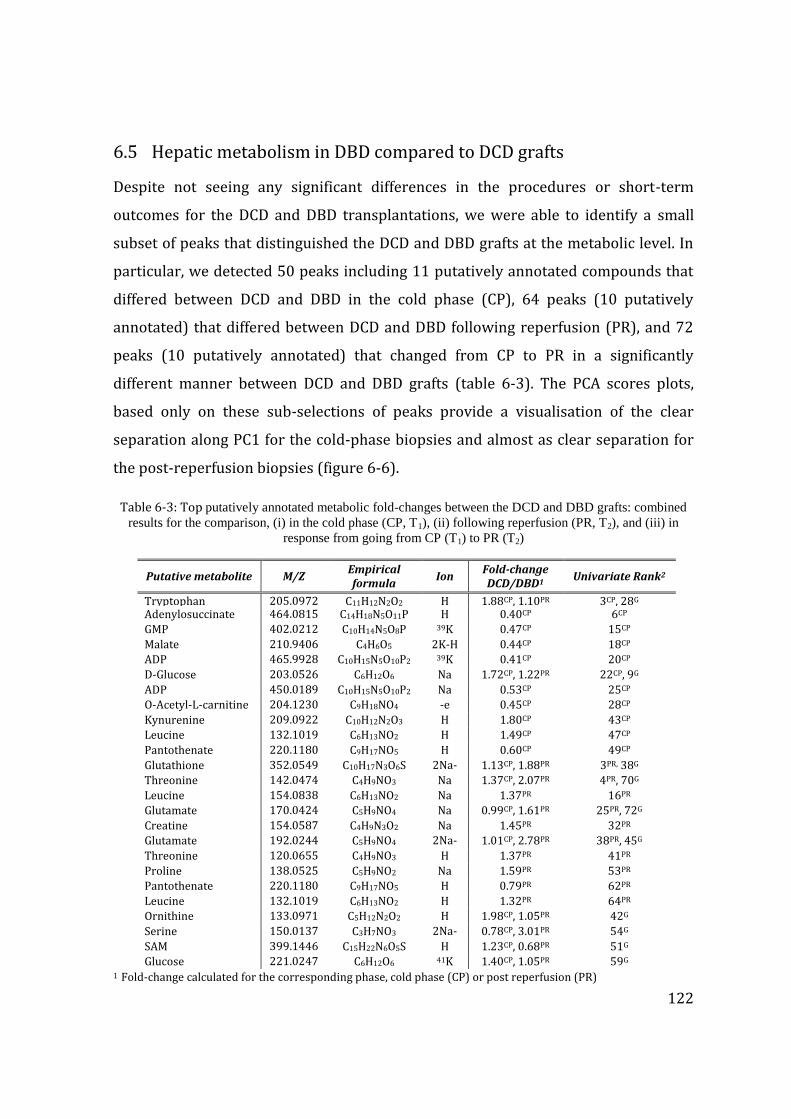
122
6.5 Hepatic metabolism in DBD compared to DCD grafts
Despite not seeing any significant differences in the procedures or short-term
outcomes for the DCD and DBD transplantations, we were able to identify a small
subset of peaks that distinguished the DCD and DBD grafts at the metabolic level. In
particular, we detected 50 peaks including 11 putatively annotated compounds that
differed between DCD and DBD in the cold phase (CP), 64 peaks (10 putatively
annotated) that differed between DCD and DBD following reperfusion (PR), and 72
peaks (10 putatively annotated) that changed from CP to PR in a significantly
different manner between DCD and DBD grafts (table 6-3). The PCA scores plots,
based only on these sub-selections of peaks provide a visualisation of the clear
separation along PC1 for the cold-phase biopsies and almost as clear separation for
the post-reperfusion biopsies (figure 6-6).
Table 6-3: Top putatively annotated metabolic fold-changes between the DCD and DBD grafts: combined
results for the comparison, (i) in the cold phase (CP, T1), (ii) following reperfusion (PR, T2), and (iii) in
response from going from CP (T1) to PR (T2)
1 Fold-change calculated for the corresponding phase, cold phase (CP) or post reperfusion (PR)
Putative metabolite M/Z Empirical formula
Ion Fold-change DCD/DBD1
Univariate Rank2
Tryptophan 205.0972
5
C11H12N2O2 H 1.88CP, 1.10PR 3CP, 28G Adenylosuccinate 464.0815
5
C14H18N5O11P H 0.40CP 6CP
GMP 402.0212
4
C10H14N5O8P 39K 0.47CP 15CP
Malate 210.9406
6
C4H6O5 2K-H 0.44CP 18CP
ADP 465.9928
4
C10H15N5O10P2 39K 0.41CP 20CP
D-Glucose 203.0526
1
C6H12O6 Na 1.72CP, 1.22PR 22CP, 9G
ADP 450.0189
5
C10H15N5O10P2 Na 0.53CP 25CP
O-Acetyl-L-carnitine 204.1230
5
C9H18NO4 -e 0.45CP 28CP
Kynurenine 209.0922
1
C10H12N2O3 H 1.80CP 43CP
Leucine 132.1019
0
C6H13NO2 H 1.49CP 47CP
Pantothenate 220.1180
6
C9H17NO5 H 0.60CP 49CP
Glutathione 352.0549
7
C10H17N3O6S 2Na-
H
1.13CP, 1.88PR 3PR, 38G
Threonine 142.0474
8
C4H9NO3 Na 1.37CP, 2.07PR 4PR, 70G
Leucine 154.0838
8
C6H13NO2 Na 1.37PR 16PR
Glutamate 170.0424
4
C5H9NO4 Na 0.99CP, 1.61PR 25PR, 72G
Creatine 154.0587
2
C4H9N3O2 Na 1.45PR 32PR
Glutamate 192.0244
0
C5H9NO4 2Na-
H
1.01CP, 2.78PR 38PR, 45G
Threonine 120.0655
1
C4H9NO3 H 1.37PR 41PR
Proline 138.0525
6
C5H9NO2 Na 1.59PR 53PR
Pantothenate 220.11806
C9H17NO5 H 0.79PR 62PR
Leucine 132.1019
0
C6H13NO2 H 1.32PR 64PR
Ornithine 133.09716
C5H12N2O2 H 1.98CP, 1.05PR 42G
Serine 150.01378
C3H7NO3 2Na-
H
0.78CP, 3.01PR 54G
SAM 399.14460
C15H22N6O5S H 1.23CP, 0.68PR 51G
Glucose 221.0247
8
C6H12O6 41K 1.40CP, 1.05PR 59G
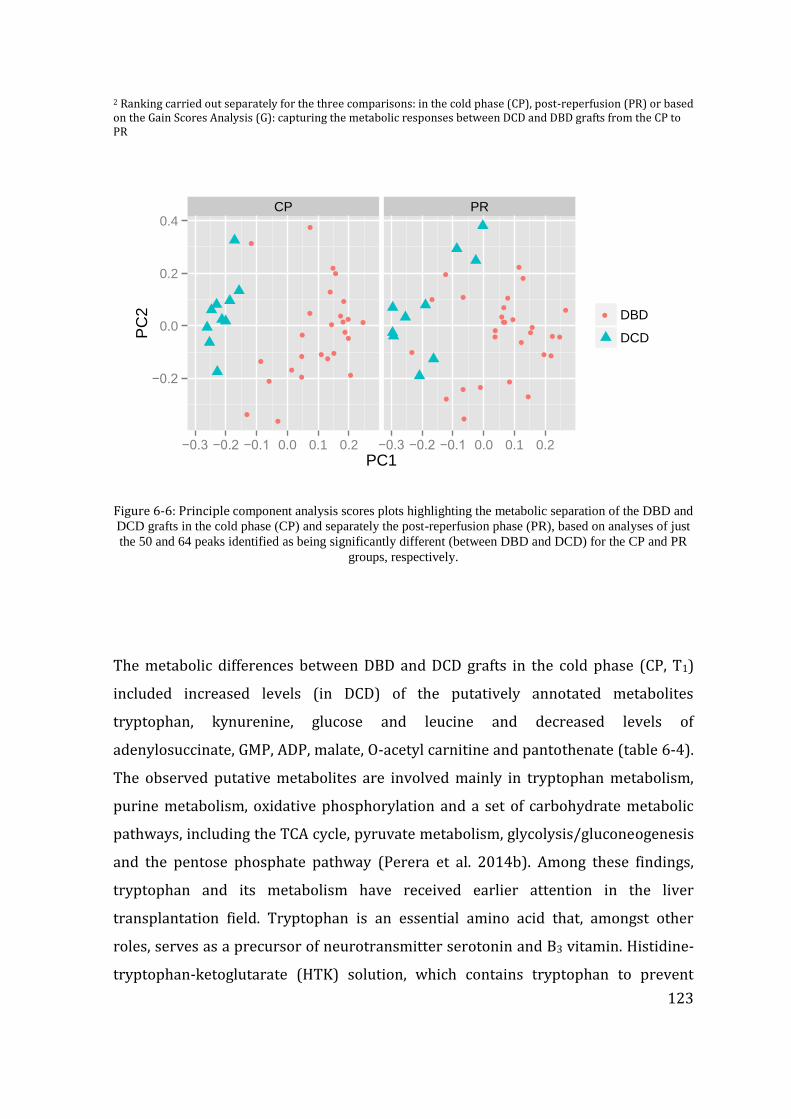
123
2 Ranking carried out separately for the three comparisons: in the cold phase (CP), post-reperfusion (PR) or based on the Gain Scores Analysis (G): capturing the metabolic responses between DCD and DBD grafts from the CP to PR
CP PR
●
●
●
●●●
●
●●●
●
●
●
●●
●●
●
●
●
●
●
●
●
●
●
●
●
●●
●
●
●
●
●
●
●
●
●●
●
●
●
●
●
●
● ●
●
●
●
●●
●
−0.2
0.0
0.2
0.4
−0.3 −0.2 −0.1 0.0 0.1 0.2 −0.3 −0.2 −0.1 0.0 0.1 0.2
PC1
PC
2 ● DBD
DCD
Figure 6-6: Principle component analysis scores plots highlighting the metabolic separation of the DBD and
DCD grafts in the cold phase (CP) and separately the post-reperfusion phase (PR), based on analyses of just
the 50 and 64 peaks identified as being significantly different (between DBD and DCD) for the CP and PR
groups, respectively.
The metabolic differences between DBD and DCD grafts in the cold phase (CP, T1)
included increased levels (in DCD) of the putatively annotated metabolites
tryptophan, kynurenine, glucose and leucine and decreased levels of
adenylosuccinate, GMP, ADP, malate, O-acetyl carnitine and pantothenate (table 6-4).
The observed putative metabolites are involved mainly in tryptophan metabolism,
purine metabolism, oxidative phosphorylation and a set of carbohydrate metabolic
pathways, including the TCA cycle, pyruvate metabolism, glycolysis/gluconeogenesis
and the pentose phosphate pathway (Perera et al. 2014b). Among these findings,
tryptophan and its metabolism have received earlier attention in the liver
transplantation field. Tryptophan is an essential amino acid that, amongst other
roles, serves as a precursor of neurotransmitter serotonin and B3 vitamin. Histidine-
tryptophan-ketoglutarate (HTK) solution, which contains tryptophan to prevent
124
membrane injury, was proposed as an alternative liver preservation solution to the
gold standard, University of Wisconsin solution. The systematic review to compare
the efficacy and safety of these two solutions did not show overall significant
differences, yet in some cases HTK was believed to perform better, especially in
terms of biliary tract flush and prevention of biliary complications (Feng et al. 2007).
Furthermore, tryptophan can be catabolised either via the kynurenine or serotonin
pathways, and hence kynurenine was studied previously to investigate tryptophan
metabolism in potential cirrhotic liver transplant recipients. The pre-transplant
serum levels of kynurenine as well as the kynurenine/tryptophan ratios were
positively correlated with the disease severity, while serum levels of tryptophan and
serotonin showed no correlation (Rossouw et al. 1977). The significantly higher
levels of tryptophan and kynurenine in DCD grafts during the cold phase in our study
appears to support the previous studies that identified tryptophan metabolism via
kynurenine pathways as a key metabolic changes in liver transplantation(Knox
1951).
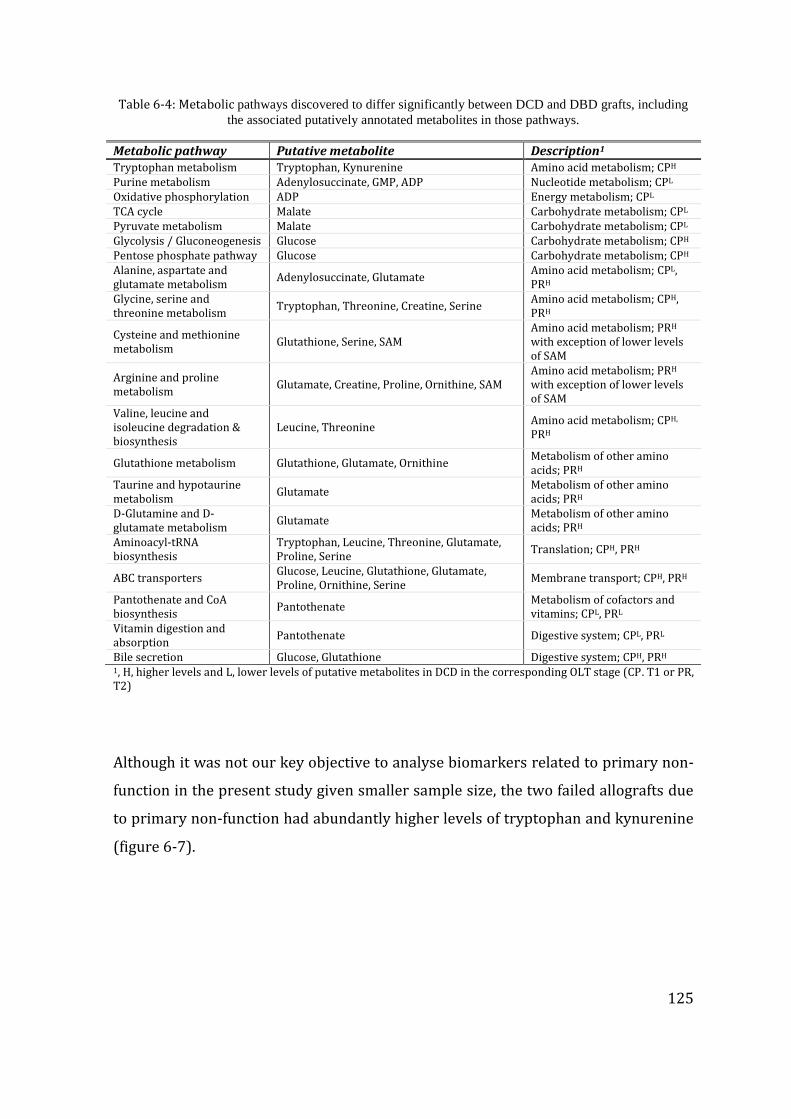
125
Table 6-4: Metabolic pathways discovered to differ significantly between DCD and DBD grafts, including
the associated putatively annotated metabolites in those pathways.
Metabolic pathway Putative metabolite Description1 Tryptophan metabolism Tryptophan, Kynurenine Amino acid metabolism; CPH Purine metabolism Adenylosuccinate, GMP, ADP Nucleotide metabolism; CPL Oxidative phosphorylation ADP Energy metabolism; CPL TCA cycle Malate Carbohydrate metabolism; CPL Pyruvate metabolism Malate Carbohydrate metabolism; CPL Glycolysis / Gluconeogenesis Glucose Carbohydrate metabolism; CPH Pentose phosphate pathway Glucose Carbohydrate metabolism; CPH Alanine, aspartate and glutamate metabolism
Adenylosuccinate, Glutamate Amino acid metabolism; CPL, PRH
Glycine, serine and threonine metabolism
Tryptophan, Threonine, Creatine, Serine Amino acid metabolism; CPH, PRH
Cysteine and methionine metabolism
Glutathione, Serine, SAM Amino acid metabolism; PRH with exception of lower levels of SAM
Arginine and proline metabolism
Glutamate, Creatine, Proline, Ornithine, SAM Amino acid metabolism; PRH
with exception of lower levels of SAM
Valine, leucine and isoleucine degradation & biosynthesis
Leucine, Threonine Amino acid metabolism; CPH, PRH
Glutathione metabolism Glutathione, Glutamate, Ornithine Metabolism of other amino acids; PRH
Taurine and hypotaurine metabolism
Glutamate Metabolism of other amino acids; PRH
D-Glutamine and D-glutamate metabolism
Glutamate Metabolism of other amino acids; PRH
Aminoacyl-tRNA biosynthesis
Tryptophan, Leucine, Threonine, Glutamate, Proline, Serine
Translation; CPH, PRH
ABC transporters Glucose, Leucine, Glutathione, Glutamate, Proline, Ornithine, Serine
Membrane transport; CPH, PRH
Pantothenate and CoA biosynthesis
Pantothenate Metabolism of cofactors and vitamins; CPL, PRL
Vitamin digestion and absorption
Pantothenate Digestive system; CPL, PRL
Bile secretion Glucose, Glutathione Digestive system; CPH, PRH 1, H, higher levels and L, lower levels of putative metabolites in DCD in the corresponding OLT stage (CP. T1 or PR, T2)
Although it was not our key objective to analyse biomarkers related to primary non-
function in the present study given smaller sample size, the two failed allografts due
to primary non-function had abundantly higher levels of tryptophan and kynurenine
(figure 6-7).
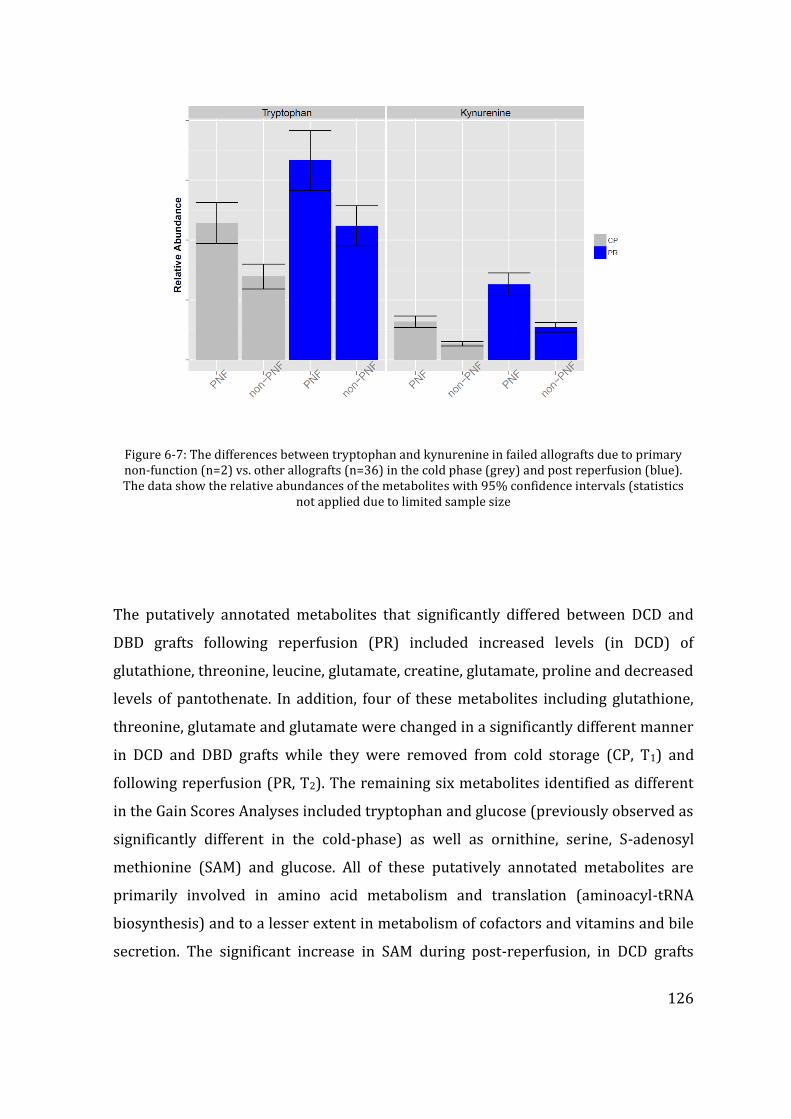
126
Figure 6-7: The differences between tryptophan and kynurenine in failed allografts due to primary non-function (n=2) vs. other allografts (n=36) in the cold phase (grey) and post reperfusion (blue). The data show the relative abundances of the metabolites with 95% confidence intervals (statistics
not applied due to limited sample size
The putatively annotated metabolites that significantly differed between DCD and
DBD grafts following reperfusion (PR) included increased levels (in DCD) of
glutathione, threonine, leucine, glutamate, creatine, glutamate, proline and decreased
levels of pantothenate. In addition, four of these metabolites including glutathione,
threonine, glutamate and glutamate were changed in a significantly different manner
in DCD and DBD grafts while they were removed from cold storage (CP, T1) and
following reperfusion (PR, T2). The remaining six metabolites identified as different
in the Gain Scores Analyses included tryptophan and glucose (previously observed as
significantly different in the cold-phase) as well as ornithine, serine, S-adenosyl
methionine (SAM) and glucose. All of these putatively annotated metabolites are
primarily involved in amino acid metabolism and translation (aminoacyl-tRNA
biosynthesis) and to a lesser extent in metabolism of cofactors and vitamins and bile
secretion. The significant increase in SAM during post-reperfusion, in DCD grafts
127
relative to DBD grafts, could have implications for DNA methylation given the
importance of this metabolite as a methyl donor(Mato and Lu 2007).
The increased level of glutathione in DCD grafts, following reperfusion, is also an
intriguing finding. Glutathione, owing its thiol group, is known as one of the most
effective antioxidants preventing cellular damage caused by reactive oxygen species,
as occur in ischaemia/reperfusion injury. Its precursors, acetylcysteine, has been
studied as a protective molecule in the peri-operative treatment of patients
undergoing liver transplantation (Clavien et al. 2007). Our findings show that not
only were glutathione levels increased but so were other intermediates of
glutathione metabolism such as glutamate and ornithine, indicative of disruption to
the glutathione pathway. While glutathione and glutamate shared similar responses
at the post-reperfusion time point, i.e. a rapid increase of levels in DCD compared to
DBD, ornithine levels were higher in the cold-phase and similar following
reperfusion. This could be due to ornithine being used up for the biosynthesis of
glutathione via the intermediate by-product of glutamate.
6.6 Discussion
Our dataset has for the first time identified key metabolic differences between DCD
and DBD liver grafts, which we attribute to the hallmark differences of organ
donation in these two donor types. Some of the identified biomarkers correlate with
our current understanding of the physiological changes surrounding DCD organ
donation, including an impact on glucose metabolism by donor warm ischaemia in
DCD grafts. However, our observed changes to the tryptophan/kynurenine axis in the
DCD grafts are novel findings (Smyth 2004). Both of these metabolites were
observed at ca. 2-fold higher concentration in the DCD grafts in the cold phase,
suggesting the possibility that these metabolites are responsible for, or at least could
be indicators of, the reported higher incidences of increased graft failures in DCD
128
grafts in the literature. Given the role of metabolomics as a hypothesis generating
tool, and not to determine whether this metabolic pathway is indeed the cause of
graft failure, we conclude that subsequent clinical investigations of DCD versus DBD
transplantations should employ a targeted analytical approach to robustly quantify
the metabolites in the tryptophan/kynurenine pathway in the pursuit of more
reliable biomarkers of graft function.
129
CHAPTER 7 CONCLUDING REMARKS AND FUTURE WORK
Interpretation of the work outlined in previous chapters led the researcher presenting
this thesis to conceptualise novel theories on energy metabolism and graft function,
which was studied in the clinical research setting leading to the publication annexed as
Appendix 4; Liver Int. 2014. doi: 10.1111/liv.12706.
This thesis outlines four studies performed in the setting of adult cadaveric liver
transplantation, aimed at identifying biomarkers and the evaluated different
biomaterial sampling protocols combined with more sophisticated analytical
platforms. Whilst the proof of principle concept outlined in chapter 3 provided us
with the necessary confidence to carry out more exhaustive and time consuming
wider study comparing the DCD and DBD liver grafts. Through the three main studies
outlined in chapters 4-6 we have demonstrated the primary differences between
these two types of donor liver allografts, and possible identification of biomarkers
that fulfil the objectives set out at the beginning of this thesis. Findings of these
studies give an in depth idea of how the metabolome of hepatocytes work during the
process of transplantation, and I have identified few key pathways that require
further study and proposed outline of future work.
7.1 Graft function and energy metabolism
All cellular systems are reliant on energy sources that drive metabolic processes for
survival. In humans, and in almost all other animals, the primary source of energy is
glucose or other forms of carbohydrate. Oxidative phosphorylation and ATP
generation are the keys to sustain vital functions of the human body. Constant
oxygen delivery to the tissues and supply of glucose is maintained in the living state,
but this process is temporarily halted on the transplantable solid organ once it is
retrieved from the donor. Although organ preservation is aimed at minimising
130
intracellular metabolism this occurs at a slow pace compared with the perfused state,
and the energy for the continued metabolism is originating form conversion of
intracellular energy stores. Stored intracellular energy is present in most cellular
types in the form of glycogen, although some of the tissue cells, for example neurons
in brain do not store intracellular glycogen making these more susceptible for
permanent and irreversible damage in the absence of constant energy supply (Brown
and Ransom 2007). Glycogen in the liver plays a key role in maintaining not only the
intra-hepatocytic energy demand but also the glucose homeostasis of the entire
body. In the fed state abundant glucose is converted to glycogen in the liver for the
use in future, fasted states that result in hypoglycaemia (Newsholme and Leech
1983). The role of intracellular glycogen in the setting of liver transplantation has
been studied in the somewhat early era of liver transplantation, but not in the
context of marginal donor or DCD graft setting (Cywes et al. 1992;Kukan and Haddad
2001). Meanwhile some other studies compared glycogen depletion in the liver
allografts preserved using different organ preservation solutions to claim superior
preservation in the presence of less glycogen depletion of the allografts (Fratte et al.
1991). It is well known that reperfusion causes a hypermetabolic state in the liver
due to activated Kupffer cells, thus increasing the demand for energy (Schemmer et
al. 2001). Therefore the role of glycogen as a primary energy source is pivotal in
maintaining intracellular energy and cell integrity, and should not be
underestimated.
Our study on energy metabolism suggested that those grafts from the DCD donors,
and the failed allografts were more likely to have moderate to severe glycogen
depletion, and evidence of continued anaerobic metabolism leading to high
intracellular lactate. As discussed under the relevant chapter these changes are the
likely result of continued anaerobic metabolism in the agonal state of organ donation.
This finding opens up more avenues for research involving marginal donors, not only
those from DCD donors, but also grafts with fatty change as outlined below.
131
7.1.1 Re-charging the energy status of liver grafts as an option for successful
liver transplantation
The last decade has seen dramatic changes in the field of solid organ transplantation,
and the concept of machine perfusion has been extensively researched using
different solid organs as the investigative front. Significant advances have been made
in the normothermic organ preservation techniques involving liver grafts.
Normothermic liver preservation has been studied both in the animal and human
liver in the laboratory setting, and currently some of these techniques are
incorporated in the clinical trials. From a theoretical point of view, normothermia
alleviates or mitigates cold ischaemia related damage, and continued oxygenated
perfusion provides an opportunity to feed the liver grafts with nutritional necessary
to replenish depleted intracellular energy stores. The Birmingham liver unit has
contributed significantly to some of the national trials involving continuous
normothermic preservation currently underway, and also piloted some of the
innovative techniques involving normothermic organ preservation. In the sequence
of organ donation to transplantation, normothermia could be applied in different
phases aiming at better organ preservation.
In DCD donors, in-situ organ resuscitation after cessation of circulatory function has
been described. The original application of this technique was in category II DCD
donors, who had sustained much longer periods of circulatory death and the early
results, though not hugely promising, showed acceptable degree of organ recovery
and successful transplantation carefully selected cases. Now termed “normothermic
regional perfusion”, this technique was pioneered in the Birmingham Liver unit
alongside two other centres. The rationale to use this technique in the United
Kingdom where category III DCD donation is the existing practice, is that the organs
could be revived and immediately after the circulatory death whilst organs are still
within the body cavity of the donor, allowing maximum energy re-charge of the liver
grafts for a pre-defined period prior to the commencement of cold preservation.
Continuous normothermic preservation has by far has made the biggest advance. In
132
this technique the organs are retrieved from the donor and transported in the
mechanically perfused state until the organ is transplanted in the recipient. Apart
from two brief periods of cold flush on either side of machine perfusion, this
technique maintains normothermic state throughout the organ is out of a human
body, this could be considered the best form of organ preservation from a biological
stand point. Final application of normothermia comes from a form of resuscitation
at the end of cold storage, compared to the two earlier described methods of pre-cold
storage and continues normothermic preservation techniques. Although research
has proved this is a viable option no clinical studies has been carried out so far. The
Birmingham liver unit however successfully transplanted the first liver graft
adopting such technique.
Our current understanding provides a platform to study the liver grafts for changes
of energy metabolism during normothermic and cold storage. The cornerstone of
ischaemia reperfusion injury has been attributed to the cold storage and ATP
depletion (St Peter et al. 2002), reversal of energy imbalance by normothermic
preservation by application of any of the above three techniques, either in isolation
or in combination would provided added insights into the superiority of
normothermia over hypothermia.
7.1.2 Insulin, insulin like growth factor-I (IGF-I) and liver
The influx of glucose in to the hepatocytes is dependent of the actions of insulin. The
role of insulin in liver transplantation is well established from the pioneering days of
this life saving operative procedure. It has been identified that the portal blood flow,
which carries insulin secreted by the pancreas is pivotal for the survival of the
transplanted liver graft. This is well documented by the experimental transplantation
in the bygone era where heterotrophic transplanted liver grafts failed to survive,
whilst establishment of portal inflow to the graft enabled survival. This was termed
the “hepatotropic” effects of the hormone insulin (Starzl et al. 1976). An important
133
notion which may be less established in our general thinking about both liver
disease, diabetes and insulin resistance as well as in the field of liver transplantation
is the central role of liver in the control over the actions of insulin and in regulation
of glucose metabolism. While pancreatic islet dysfunction and peripheral insulin
resistance are commonly recognized causes for diabetes and impaired glucose
tolerance, ‘hepatogenous’ diabetes has drawn less attention (Picardi et al. 2006).
Evidence suggests 7-15% of cirrhotic patients have overt diabetes, and another 60-
80% have impaired glucose tolerance.
The liver ensures glycogen storage in anabolic states and glycogenolysis and
gluconeogenesis in catabolic states. But several other ways in which the liver
controls body-wide glucose homeostasis are described, such as insulin clearance
from the portal circulation by the liver, hepatic insulin resistance and sensitivity, and
feedback mechanisms in growth hormone (GH) and insulin-like growth factor-1 (IGF-
1) signaling. These mechanisms have likewise been related to the occurrence of
diabetes and impaired glucose tolerance in liver disease. In portal hypertension or
portosystemic shunts the first-pass effect of the liver to clear insulin from the
circulation is reduced. The subsequent hyperinsulinaemia evokes an adaptive
response of compensatory insulin resistance, presumably by down regulation of
insulin receptor expression (Picardi, D'Avola, Gentilucci, Galati, Fiori, Spataro, &
Afeltra 2006). An acquired GH-resistance has been described in chronic liver
diseases, with reduced levels of IGF-1 (Sumida et al. 2014). Liver-specific deletion of
the GH receptor in mouse models leads to insulin resistance, glucose intolerance,
increased free fatty acids and steatosis. In chronic liver disease, these modulations of
the GH, IGF-1 and insulin occur next to direct effects of liver disease on pancreatic
islet cell dysfunction and increased peripheral insulin resistance (figure 7-1).
Insulin-like growth factor-1 (IGF-1) and its receptor IGF-1R are signal transducing
elements in one of the most crucial cellular pathways in life. In conjunction with
insulin and growth hormone (GH), they regulate protein synthesis, glucose
metabolism, cellular proliferation and differentiation which are fundamental to both
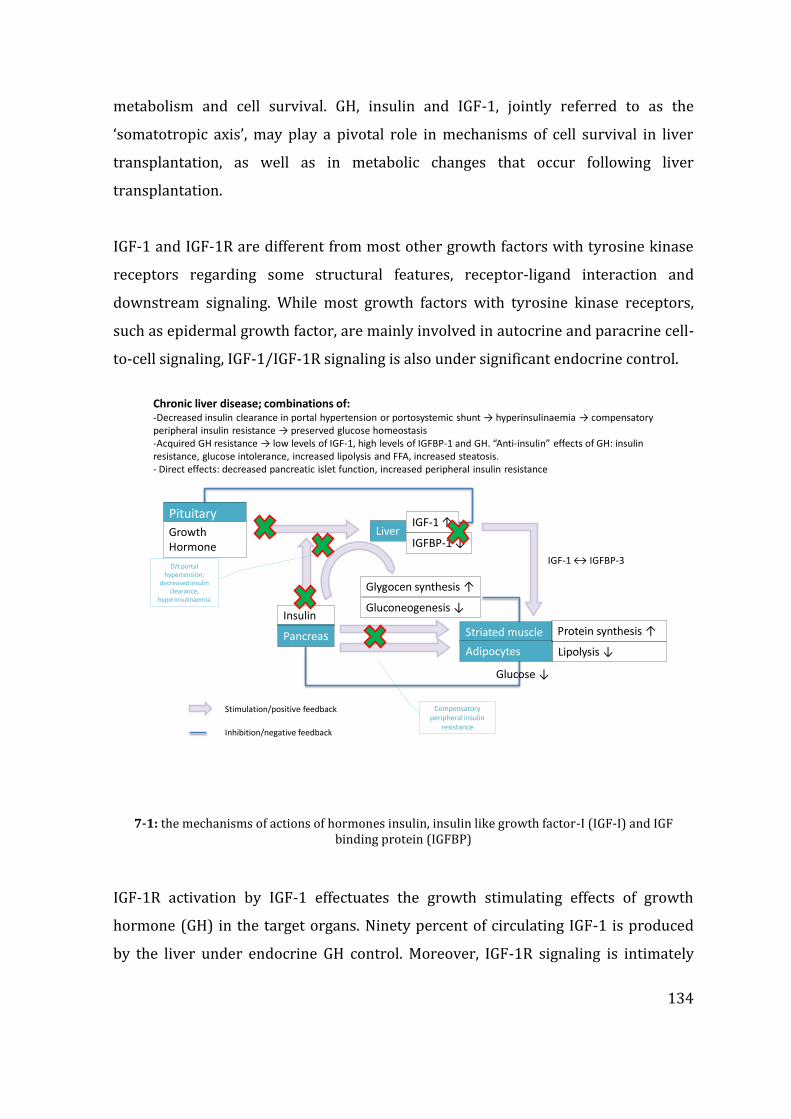
134
metabolism and cell survival. GH, insulin and IGF-1, jointly referred to as the
‘somatotropic axis’, may play a pivotal role in mechanisms of cell survival in liver
transplantation, as well as in metabolic changes that occur following liver
transplantation.
IGF-1 and IGF-1R are different from most other growth factors with tyrosine kinase
receptors regarding some structural features, receptor-ligand interaction and
downstream signaling. While most growth factors with tyrosine kinase receptors,
such as epidermal growth factor, are mainly involved in autocrine and paracrine cell-
to-cell signaling, IGF-1/IGF-1R signaling is also under significant endocrine control.
Stimulation/positive feedback
Inhibition/negative feedback
Chronic liver disease; combinations of:-Decreased insulin clearance in portal hypertension or portosystemic shunt → hyperinsulinaemia → compensatoryperipheral insulin resistance → preserved glucose homeostasis-Acquired GH resistance → low levels of IGF-1, high levels of IGFBP-1 and GH. “Anti-insulin” effects of GH: insulinresistance, glucose intolerance, increased lipolysis and FFA, increased steatosis. - Direct effects: decreased pancreatic islet function, increased peripheral insulin resistance
PituitaryglandGrowthHormone
LiverIGF-1 ↑
IGFBP-1 ↓
Glygocen synthesis ↑
Gluconeogenesis ↓
Pancreas
Insulin
Striated muscle
D/t portal hypertension:
decreased insulinclearance,
hyperinsulinaemia
Adipocytes
Compensatoryperipheral insulin
resistance
Protein synthesis ↑
Lipolysis ↓
Glucose ↓
IGF-1 ↔ IGFBP-3
7-1: the mechanisms of actions of hormones insulin, insulin like growth factor-I (IGF-I) and IGF binding protein (IGFBP)
IGF-1R activation by IGF-1 effectuates the growth stimulating effects of growth
hormone (GH) in the target organs. Ninety percent of circulating IGF-1 is produced
by the liver under endocrine GH control. Moreover, IGF-1R signaling is intimately
135
connected to the metabolic functions of insulin. Originating from a putative same
ancestor gene, the IGF-1R has specialized more in cell growth, survival and anabolic
functions, whereas the insulin receptor (IR) merely regulates metabolism, but these
receptors share a very similar molecular architecture and physiologically they still
have functional overlap.
Specialized functions of IGF-1R and IR are regulated by structural homogeneity,
diverging affinities and regulatory IGF binding proteins (IGFBP-1,2,3,4,5,6) within in
a ligand-activated receptor-signaling system. IGF-1 may exert its effects via insulin
receptors or hybrid insulin/IGF-1 receptors as well, although by with lower affinity.
IGF-1 is recognized as an insulin sensitizer at the liver, while IGFBP-3 is suggested to
oppose or inhibit IGF actions. Contrary to the high production of IGF-1, hepatocytes
express low levels of the IGF-1R. Over-expression of IGF-1R however has been
described in chronic hepatitis and liver cirrhosis. The autocrine and paracrine
functions of IGF-1 have extensively been studied in cancer models and show that IGF-
1 signaling through IGF-1R gives strong proliferation and survival signals. In models
of biliary damage (through biliary obstruction or ischaemia), up regulation with anti-
apoptotic and attenuating effects of IGF-1R and IGF-1 have been described (Munshi
et al. 2011;Onori et al. 2007). In GH-deficient models, liver regeneration is impaired
and both GH and IGF-1 are believed to protect against liver steatosis and fatty liver
disease. Improved preservation has been shown by adding IGF-1 to UW perfusion
solution during liver harvesting and preservation for transplantation (Zaouali et al.
2010). One study however, describes the complete opposite: a contrary involvement
of the IGF-1R in conferring oxidative stress leading to hepatic cell death and
promoting fibrosis in an in vivo liver-specific IGF-1R knock-out model with
cholestatic liver injury (Villeneuve et al. 2010). Several cohort studies have shown
early normalization of IGF-1, IGFBPs and GH levels after liver transplantation for
chronic liver disease (Bassanello et al. 2004;Weber et al. 2002). No associations of
these parameters with glucose intolerance or diabetes in liver transplantation have
been reported up till now.
136
7.1.3 Insulin resistance and liver transplantation
In clinical practice of our busy transplant unit we have detected the higher incidence
of new onset diabetes after transplantation (NODAT) in DCD liver graft recipients
(Hartog et al. 2014). NODAT occurs in 25-40% of liver transplant recipients and the
key risk factors for NODAT in liver transplant recipients are similar to standard risk
factors for type 2 diabetes and insulin resistance, such as older age, African-American
race, obesity and HCV infection (Kuo et al. 2010)(Zhao et al, Kuo et al). Use of
steroids and calicineurin inhibitors further increase the risk (Heisel et al. 2004;Yates
et al. 2012). Furthermore donor factors such as donor age (elderly donors), donor
diabetes status and use of deceased vs. living donors have likewise been linked to
higher incidence of NODAT (Kuo, Sampaio, Ye, Reddy, Martin, & Bunnapradist
2010;Yang et al. 2011). Whilst recent developments in liver transplantation include a
steep increase in the use of organs donated after circulatory death as practiced by
our centre, well-documented adverse outcomes of DCD grafts include primary non-
function or delayed graft function, ischaemic type biliary lesions and increased
incidence of renal injury as outlined in the introductory chapters (Callaghan et al.
2013;de Vera et al. 2009;Leithead et al. 2012).
The incidence of NODAT in liver transplant recipients of DCD grafts however, has not
been studied before. The findings in our clinical research, combined with the basic
science study outlined in the chapter 4 of this thesis led us hypothesize that the
insulin resistance is related to the liver graft function following liver transplantation.
We propose the NODAT is a subtle form of graft dysfunction increasingly seen in DCD
liver graft recipients, leading to transient changes in the glucose metabolism that
result in hyperglycaemia in the post transplant period. This may be driven by
aggravated insulin resistance during the warm ischaemic damage during the organ
donation process. One or several signaling mechanisms may be involved. Meanwhile
in the case of primary non-function leading to graft failures, the insulin resistance is
more likely to be more serious and irreversible. If the hepatocytes have consumed
intracellular glycogen during the cold storage the cells would be in a state where
complete energy discharge occurred and the hepatocytes unable to uptake glucose in
137
to the intracellular environment from the recipient circulation due to the presence of
severe insulin resistance. Based on this hypothesis we have already commence on
preliminary studies of identifying the receptor status of various types of liver grafts,
and this theory is open for investigation in the machine perfusion models.
7.1.4 Energy metabolism and Insulin resistance could be the cause of graft
failure in steatotic grafts
A further concept conceived from the findings from our results related to the energy
metabolism is the cause for unsuccessful outcomes in fatty liver grafts. In the studies
outlined here, the presence of macrovesicular steatosis was minimal, and may have
perhaps occurred by chance, as the recipients consented for the study did not receive
a steatotic graft. Therefore definitive links to energy metabolism cannot be made,
however based on the current scientific evidence it could be extrapolated that
increased graft failures from fatty liver grafts may be related to the changes in energy
metabolism and insulin resistance.
We have discussed in the introduction chapter that macrovesicular steatosis is more
abundant in the obese donor population, and has more relevance in the liver
transplantation setting compared with microvesicular steatosis that is more acute
phenomenon with less significance. Obesity is associated with both hepatic and
peripheral insulin resistance (Greenfield and Campbell 2004;Marchesini et al. 1999)
and extensive studies have been carried out in this front. This leads to myriad of
clinical problems collectively termed as metabolic syndrome (Kanda et al. 2006).
Therefore it is more likely that the steatotic liver grafts are originating from donors
with metabolic syndrome, thus there is presence of insulin resistance in these liver
grafts (Clark 2006;Urena et al. 1998;Williams et al. 2011). Some of these donors may
have progressed to the full spectrum of fatty liver disease, commonly referred to as
non-alcoholic steatohepatitis (NASH), and the pathophysiological changes are
described as a “two hit theory” (Burke and Lucey 2004), originating with insulin
resistance. Macroscopically therefore these grafts do not appear irreversibly
138
damaged apart from the presence of steatosis thus may be used in the
transplantation setting (Cheng et al. 2001).
It is widely known that the steatotic livers do not tolerate longer cold ischaemia
(Strasberg, Howard, Molmenti, & Hertl 1994) and successful outcomes may be
achieved through transplantation by minimizing the cold storage time (Yoo et al.
2003). It is therefore likely that the increased ischaemia causes the intracellular
glycogen stores depletion in steatosis liver grafts, and the insulin resistance present
in the donor steatotic liver graft further prevent the influx of glucose in to the
hepatocytes. These two aspects could be further studied in both experimental and
clinical model. Our hypothesis is supported by the evidence that steatotic liver grafts
are better preserved by normothermic machine preservation (Imber, St Peter,
Handa, & Friend 2002;Jamieson et al. 2011;Vogel et al. 2010). Based on the concepts
outlined in sections 7.1.3 and 7.1.4 in this chapter we have already initiated
preliminary studies to investigate insulin receptor axis in the liver transplantation
model.
7.2 Biomarkers of poor graft function
The metabolomics studies described in this thesis under chapters 5 and 6 outlined
the use of CEAD and FTICR based analysis of two different biomaterials from liver
allografts. Amongst the thousands of metabolites identified through these two
studies two metabolites, namely tryptophan and kynurenine have the potential to be
developed as biomarkers associated with severe graft injury. This conclusion is
arrived on the basis that tryptophan metabolism pathway was identified as an
affected pathway in our proof of principle study and also the both CEAD and FTICR
data confirming the increased presence of these metabolites in the DCD grafts which
were exposed to more ischaemic injury, along with even higher expression in the
failed liver allografts. The problem we are faced now is – if tryptophan and/or
139
kynurenine could be studied as novel and alternative biomarkers to conventionally
practiced liver enzymes to predict graft function.
Tryptophan is an essential amino acid that has unique biological and metabolic
properties in the central nervous system and the liver. Apart from an essential
building block in proteins, tryptophan has other important effects that regulate vital
biological mechanisms (Sidransky 1985). Although present in many proteins,
tryptophan is the least abundant amino acid in the hepatic proteins, and usually
degraded by two enzyme systems; indoleamine 2-3 dioxygenase (IDO) and
tryptophan 2-3 dioxygenase (TDO). The latter enzyme is present only in the liver,
therefore the kynurenine production which is in the downstream of the tryptophan
metabolism pathway should only be due to increased TDO activity. The increased
catalytic activity of TDO is determined by the substrate as a forward rate limiting
step meanwhile other factors may also influence its activity. Amongst the actions on
liver, tryptophan is known to cause induction hepatic alanine aminotransferase and
aspartate aminotransferase by unknown mechanisms (Sidransky 1985). Tryptophan
also has effect on the glucose metabolism in the liver and in isolated perfused liver in
the experimental models, hepatic glucose synthesis is reduced by tryptophan,
kynurenine and its metabolic products. Increased quinolinate and serotonin
production has been implicated although the exact mechanisms of this action are
unclear.
The above observations suggest that the increased hepatic transaminases seen
following liver transplantation in the setting of severe graft dysfunction or primary
non function may be related to increased activity of tryptophan-kynurenine pathway.
Coupled with observations related to the glucose metabolism it opens up avenues for
us to investigate this as a potential biomarker. The future work related to this aspect
of research includes analysis of serum samples from organ recipients for tryptophan
and kynurenine, and correlate these with the graft outcomes and conventionally
measured alanine and aspartate aminotraferases. Through this pilot study we aim to
140
propose the significance of this novel biomarker in the prediction of liver allograft
function in the post transplant period. Further option to study include monitoring of
these biomarkers in the prospective liver graft recipients from pre-transplant time
point to the post reperfusion period, which would eventually enable us decide on the
reliability of this as a novel biomarker that could be used in the clinical
transplantation setting.
7.3 Summary of future directions
To summarize the findings originating from our current studies, the DCD liver grafts
which are considered “marginal” by nature showed significant differences in
metabolic changes related to the primary energy metabolism, along with the grafts
that failed following transplantation. It is likely that this is the end result of energy
exhaustion, and further research on this aspect should be focused on replenishing
intrahepatocytic energy stores during organ preservation, and that the mechanisms
of study will involve insulin resistance and pathway analysis. Alongside, we propose
to develop tryptophan and kynurenine as a novel biomarker to predict graft function,
which may be directly or indirectly related to energy metabolism.
141
CHAPTER 8 END PAGES
8.1 APPENDICES
Appendix 1: Hrydziuszko O, Silva MA, Perera MTPR, Richards DA, Murphy N, Mirza
D, Viant MR.Application of metabolomics to investigate the process of human
orthotopic liver transplantation: a proof-of-principle study. OMICS. 2010
Apr;14(2):143-50. doi: 10.1089/omi.2009.0139
Appendix 2: Perera MTPR, Richards DA, Silva MA, Ahmed N, Neil DA, Murphy N,
Mirza DF. Comparison of energy metabolism in liver grafts from donors after
circulatory death and donors after brain death during cold storage and reperfusion.
British Journal of Surgery. 2014 Jun;101(7):775-83. doi: 10.1002/bjs.9478.
Epub 2014 Apr 28
Appendix 3: Biomarker differences between cadaveric grafts used in human
orthotopic liver transplantation as identified by Coulometric Electrochemical Array
Detection (CEAD) metabolomics. Perera MTPR, Higdon R, Richards DA, Silva MA,
Murphy N, Kolker E, Mirza DF. OMICS. 2014 Dec;18(12):767-77. doi:
10.1089/omi.2014.0094.
Appendix 4: Early occurrence of new-onset diabetes in liver transplant recipients is
potentially related to the type of liver graft and warm ischaemic injury. Hartog
H*,May C*, Corbett C, Murphy A, Peters L, Mirza DF, Tomlinson JW, Perera MTPR.
Liver Int. 2014 Oct 27. doi: 10.1111/liv.12706. [Epub ahead of print]

142
8.1.1 Appendix 1
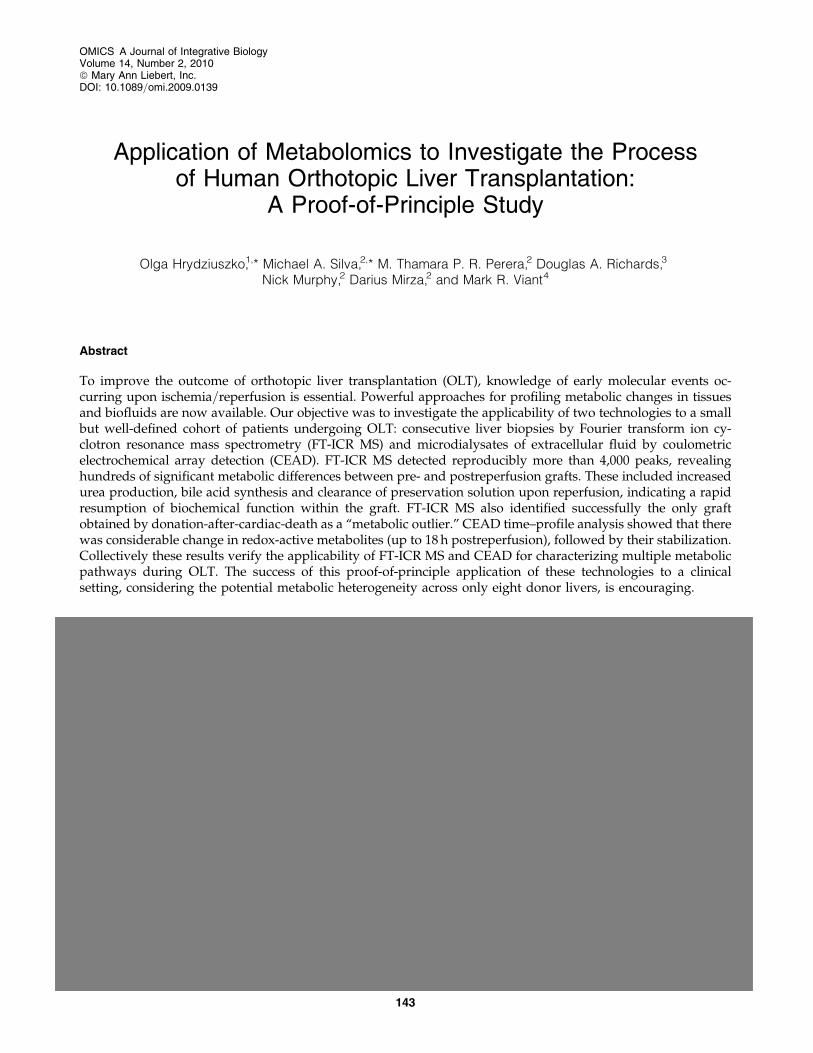
Application of Metabolomics to Investigate the Processof Human Orthotopic Liver Transplantation:
A Proof-of-Principle Study
Olga Hrydziuszko,1,* Michael A. Silva,2,* M. Thamara P. R. Perera,2 Douglas A. Richards,3
Nick Murphy,2 Darius Mirza,2 and Mark R. Viant4
Abstract
To improve the outcome of orthotopic liver transplantation (OLT), knowledge of early molecular events oc-curring upon ischemia=reperfusion is essential. Powerful approaches for profiling metabolic changes in tissuesand biofluids are now available. Our objective was to investigate the applicability of two technologies to a smallbut well-defined cohort of patients undergoing OLT: consecutive liver biopsies by Fourier transform ion cy-clotron resonance mass spectrometry (FT-ICR MS) and microdialysates of extracellular fluid by coulometricelectrochemical array detection (CEAD). FT-ICR MS detected reproducibly more than 4,000 peaks, revealinghundreds of significant metabolic differences between pre- and postreperfusion grafts. These included increasedurea production, bile acid synthesis and clearance of preservation solution upon reperfusion, indicating a rapidresumption of biochemical function within the graft. FT-ICR MS also identified successfully the only graftobtained by donation-after-cardiac-death as a ‘‘metabolic outlier.’’ CEAD time–profile analysis showed that therewas considerable change in redox-active metabolites (up to 18 h postreperfusion), followed by their stabilization.Collectively these results verify the applicability of FT-ICR MS and CEAD for characterizing multiple metabolicpathways during OLT. The success of this proof-of-principle application of these technologies to a clinicalsetting, considering the potential metabolic heterogeneity across only eight donor livers, is encouraging.
OMICS A Journal of Integrative BiologyVolume 14, Number 2, 2010ª Mary Ann Liebert, Inc.DOI: 10.1089=omi.2009.0139
143


143
8.1.2 Appendix 2
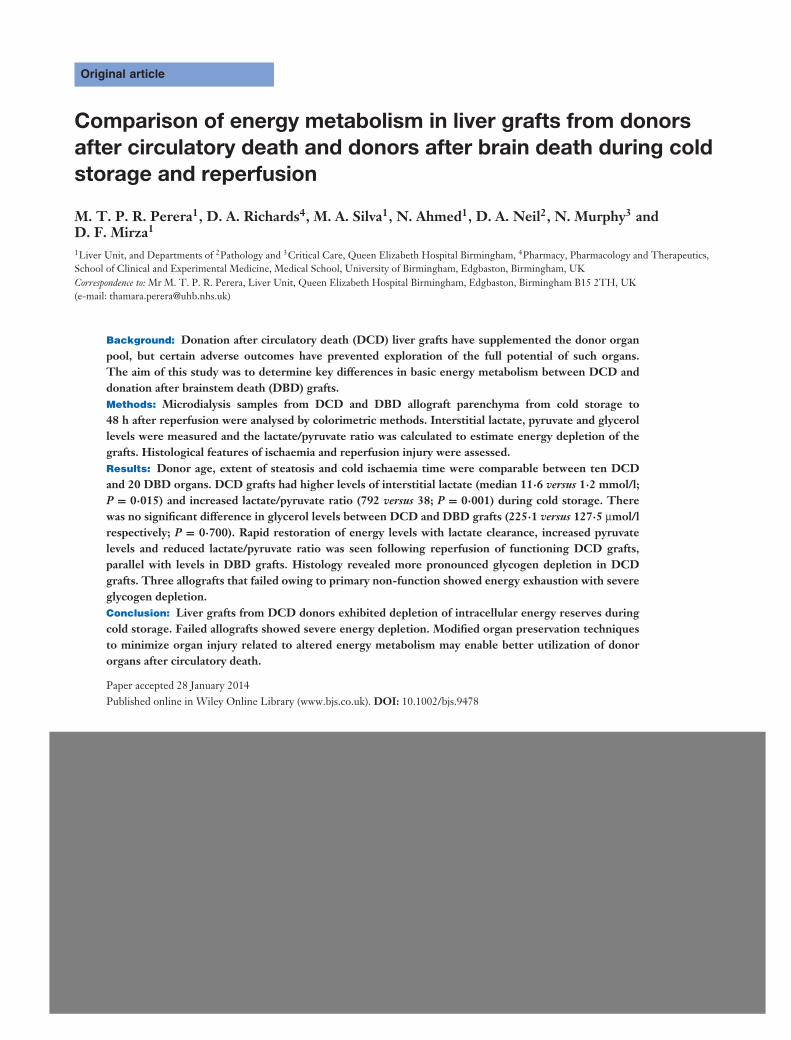
Original article
Comparison of energy metabolism in liver grafts from donorsafter circulatory death and donors after brain death during coldstorage and reperfusion
M. T. P. R. Perera1, D. A. Richards4, M. A. Silva1, N. Ahmed1, D. A. Neil2, N. Murphy3 andD. F. Mirza1
1Liver Unit, and Departments of 2Pathology and 3Critical Care, Queen Elizabeth Hospital Birmingham, 4Pharmacy, Pharmacology and Therapeutics,School of Clinical and Experimental Medicine, Medical School, University of Birmingham, Edgbaston, Birmingham, UKCorrespondence to: Mr M. T. P. R. Perera, Liver Unit, Queen Elizabeth Hospital Birmingham, Edgbaston, Birmingham B15 2TH, UK(e-mail: [email protected])
Background: Donation after circulatory death (DCD) liver grafts have supplemented the donor organpool, but certain adverse outcomes have prevented exploration of the full potential of such organs.The aim of this study was to determine key differences in basic energy metabolism between DCD anddonation after brainstem death (DBD) grafts.Methods: Microdialysis samples from DCD and DBD allograft parenchyma from cold storage to48 h after reperfusion were analysed by colorimetric methods. Interstitial lactate, pyruvate and glycerollevels were measured and the lactate/pyruvate ratio was calculated to estimate energy depletion of thegrafts. Histological features of ischaemia and reperfusion injury were assessed.Results: Donor age, extent of steatosis and cold ischaemia time were comparable between ten DCDand 20 DBD organs. DCD grafts had higher levels of interstitial lactate (median 11·6 versus 1·2 mmol/l;P = 0·015) and increased lactate/pyruvate ratio (792 versus 38; P = 0·001) during cold storage. Therewas no significant difference in glycerol levels between DCD and DBD grafts (225·1 versus 127·5 µmol/lrespectively; P = 0·700). Rapid restoration of energy levels with lactate clearance, increased pyruvatelevels and reduced lactate/pyruvate ratio was seen following reperfusion of functioning DCD grafts,parallel with levels in DBD grafts. Histology revealed more pronounced glycogen depletion in DCDgrafts. Three allografts that failed owing to primary non-function showed energy exhaustion with severeglycogen depletion.Conclusion: Liver grafts from DCD donors exhibited depletion of intracellular energy reserves duringcold storage. Failed allografts showed severe energy depletion. Modified organ preservation techniquesto minimize organ injury related to altered energy metabolism may enable better utilization of donororgans after circulatory death.
Paper accepted 28 January 2014Published online in Wiley Online Library (www.bjs.co.uk). DOI: 10.1002/bjs.9478


2014 BJS Society Ltd www.bjs.co.uk BJSPublished by John Wiley & Sons Ltd

144
8.1.3 Appendix 3
Biomarker Differences between Cadaveric GraftsUsed in Human Orthotopic Liver Transplantation
as Identified by Coulometric ElectrochemicalArray Detection (CEAD) Metabolomics
M. Thamara P.R. Perera,1* Roger Higdon,2,3* Douglas A. Richards,4 Michael A. Silva,1 Nick Murphy,5
Eugene Kolker,2,3,6,7 and Darius F. Mirza1
Abstract
Metabolomics in systems biology research unravels intracellular metabolic changes by high throughput methods,but such studies focusing on liver transplantation (LT) are limited. Microdialysate samples of liver grafts fromdonors after circulatory death (DCD; n = 13) and brain death (DBD; n = 27) during cold storage and post-reperfusion phase were analyzed through coulometric electrochemical array detection (CEAD) for identificationof key metabolomics changes. Metabolite peak differences between the graft types at cold phase, post-reperfusiontrends, and in failed allografts, were identified against reference chromatograms. In the cold phase, xanthine, uricacid, and kynurenine were overexpressed in DCD by 3-fold, and 3-nitrotyrosine (3-NT) and 4-hydroxy-3-methoxymandelic acid (HMMA) in DBD by 2-fold ( p < 0.05). In both grafts, homovanillic acid and methionineincreased by 20%–30% with each 100 min increase in cold ischemia time ( p < 0.05). Uric acid expression wassignificantly different in DCD post-reperfusion. Failed allografts had overexpression of reduced glutathione andkynurenine (cold phase) and xanthine (post-reperfusion) ( p < 0.05). This differential expression of metabolitesbetween graft types is a novel finding, meanwhile identification of overexpression of kynurenine in DCD graftsand in failed allografts is unique. Further studies should examine kynurenine as a potential biomarker predictinggraft function, its causation, and actions on subsequent clinical outcomes.
OMICS A Journal of Integrative BiologyVolume 18, Number 12, 2014ª Mary Ann Liebert, Inc.DOI: 10.1089/omi.2014.0094


145
8.1.4 Appendix 4
ORIG INAL ART ICLE
Early occurrence of new-onset diabetes after transplantation is relatedto type of liver graft and warm ischaemic injuryHermien Hartog1,*, Christine J.H. May2,*, Chris Corbett1, Angela Phillips2, Jeremy W. Tomlinson3, HynekMergental1, John Isaac1, Simon Bramhall1, Darius F. Mirza1, Paolo Muiesan1 and M. Thamara P.R. Perera1
1 Liver Unit, Queen Elizabeth Hospital Birmingham, Edgbaston, Birmingham, UK
2 Diabetes Center, Queen Elizabeth Hospital Birmingham, Edgbaston, Birmingham, UK
3 Institute of Biomedical research, University of Birmingham, Birmingham, UK
Keywords
diabetes mellitus – donation after circulatory
death – hyperglycaemia – liver
transplantation – NODAT
Abbreviations
BMI, body-mass index; DBD, donation after
brain death; DCD, donation after circulatory
death; DDLT, deceased donor liver
transplantation; HbA1c, glycated
haemoglobin; HCV, hepatitis C virus; IR,
insulin receptor; IRS, insulin receptor
substrate; LRLT, living-related liver
transplantation; LT, liver transplantation;
NODAT, new-onset diabetes after
transplantation; OPTN/UNOS, the organ
procurement and transplant network/united
network for organ sharing; PI3K,
phosphoinositide-3 kinase.
Correspondence
Thamara P.R. Perera, FRCS
Consultant Transplant Surgeon
Queen Elizabeth Hospital Birmingham
B15 2TH, Birmingham, UK
Tel: +44121 371 4637
Fax: +44 121 414 1833
e-mail: [email protected]
Received 14 August 2014
Accepted 20 October 2014
DOI:10.1111/liv.12706
AbstractBackground & Aims: We studied new-onset diabetes after transplantation(NODAT) in liver transplantation with grafts donated after brain death(DBD) or circulatory death (DCD), focusing on the early post-transplantperiod. Methods: A total of 430 non-diabetic primary liver transplant recipi-ents [DCD, n = 90 (21%)] were followed up for 30 months (range 5–69).NODAT was defined as the composite endpoint of one of following: (i) Twonon-fasting plasma glucose levels > 11.1 mmol/L ≥ 30 days apart, (ii) oralhypoglycaemic drugs ≥ 30 days consecutively (iii) insulin therapy ≥ 30 daysand (iv) HbA1c ≥ 48 mmol/L. Resolution of NODAT was defined as cessa-tion of treatment or hyperglycaemia. Results: Total of 81/430 (19%) patientsdeveloped NODAT. Incidence and resolution of NODAT over time showedsignificantly different patterns between DCD and DBD liver graft recipients;early occurrence, high peak incidence and early resolution were seen inDCD. In multivariate logistic regression including age, ethnicity, HCV,tacrolimus level and pulsed steroids, only DCD was independently associatedwith NODAT at day 15 post-transplant (OR 6.5, 95% CI 2.3–18.4,P < 0.001), whereas age and pulsed steroids were significant factors between30–90 days. Combined in multivariate Cox regression model for NODAT-free survival, graft type, age and pulsed steroids were each independent pre-dictor for decreased NODAT-free survival in the first 90-postoperativedays. Conclusion: Early peak of NODAT in DCD graft recipients is a novelfinding, occurring independently from known risk factors. Donor warmischaemia and impact on insulin sensitivity should be further studied andcould perhaps be associated with graft function.
Liver International ISSN 1478-3223


Liver International (2014)© 2014 John Wiley & Sons A/S. Published by John Wiley & Sons Ltd 9
146
8.2 BIBLIOGRAPHY
Abt, P., Crawford, M., Desai, N., Markmann, J., Olthoff, K., & Shaked, A. 2003. Liver transplantation from controlled non-heart-beating donors: an increased incidence of biliary complications. Transplantation, 75, (10) 1659-1663
Abt, P.L., Desai, N.M., Crawford, M.D., Forman, L.M., Markmann, J.W., Olthoff, K.M., & Markmann, J.F. 2004. Survival following liver transplantation from non-heart-beating donors. Annals of surgery, 239, (1) 87
Altman, K. & Greengard, O. 1966. Correlation of kynurenine excretion with liver tryptophan pyrrolase levels in disease and after hydrocortisone induction. Journal of Clinical Investigation, 45, (10) 1527
Amador, A., Grande, L., Marti, J., Deulofeu, R., Miquel, R., Sol+í, A., RodriguezGÇÉLaiz, G., Ferrer, J., Fondevila, C., & Charco, R. 2007. Ischemic PreGÇÉconditioning in Deceased Donor Liver Transplantation: A Prospective Randomized Clinical Trial. American journal of transplantation, 7, (9) 2180-2189
Angele, M.K., Rentsch, M., Hartl, W.H., Wittmann, B., Graeb, C., Jauch, K.W., & Loehe, F. 2008. Effect of graft steatosis on liver function and organ survival after liver transplantation. The American Journal of Surgery, 195, (2) 214-220
Attia, M., Silva, M.A., & Mirza, D.F. 2008. The marginal liver donorGÇôan update. Transplant international, 21, (8) 713-724
Axelrod, D.A., Schnitzler, M., Salvalaggio, P.R., Swindle, J., & Abecassis, M.M. 2007. The economic impact of the utilization of liver allografts with high donor risk index. American Journal of Transplantation, 7, (4) 990-997
Azoulay, D., Castaing, D., Adam, R., Savier, E., Delvart, V.r., Karam, V., Ming, B.Y., Dannaoui, M., Krissat, J., & Bismuth, H. 2001. Split-liver transplantation for two adult recipients: feasibility and long-term outcomes. Annals of surgery, 233, (4) 565
Baranski, A. 2009. Surgical technique of the abdominal organ procurement Springer.
Bassanello, M., De Palo, E.F., Lancerin, F., Vitale, A., Gatti, R., Montin, U., Ciarleglio, F.A., Senzolo, M., Burra, P., & Brolese, A. 2004. Growth hormone/insulinGÇÉlike growth factor 1 axis recovery after liver transplantation: A preliminary prospective study. Liver transplantation, 10, (5) 692-698
Belzer, F.O. & Southard, J.H. 1988. Principles of solid-organ preservation by cold storage. Transplantation, 45, (4) 673-676
Bendorf, A., Kerridge, I.H., Kelly, P.J., Pussell, B., & Guasch, X. 2012. Explaining failure through success: a critical analysis of reduction in road and stroke deaths as an explanation for Australia's low deceased organ donation rates. Internal medicine journal, 42, (8) 866-873
147
Benjamini, Y. & Hochberg, Y. 1995. Controlling the false discovery rate: a practical and powerful approach to multiple testing. Journal of the Royal Statistical Society.Series B (Methodological) 289-300
Bismuth, H., Ericzon, B.G., Rolles, K., Castaing, D., Otte, J.B., Ringe, B., & Sloof, M. 1987. Hepatic transplantation in Europe: first report of the European Liver Transplant Registry. The Lancet, 330, (8560) 674-676
Bogdanov, M., Matson, W.R., Wang, L., Matson, T., Saunders-Pullman, R., Bressman, S.S., & Beal, M.F. 2008. Metabolomic profiling to develop blood biomarkers for Parkinson's disease. Brain, 131, (2) 389-396
Bohra, R., Klepacki, J., Klawitter, J., Klawitter, J., Thurman, J.M., & Christians, U. 2013. Proteomics and metabolomics in renal transplantationGÇÉquo vadis? Transplant International, 26, (3) 225-241
Bontempo, F.A., Lewis, J.H., Van Thiel, D.H., Spero, J.A., Ragni, M.V., Butler, P., Israel, L., & Starzl, T.E. 1985. The relation of preoperative coagulation findings to diagnosis, blood usage, and survival in adult liver transplantation. Transplantation, 39, (5) 532
Borchert, D. H., Glanemann, M., Mogl, M., Langrehr, J., & Neuhaus, P. Adult liver transplantation using liver grafts from donors over 70 years of age, 2 edn, Elsevier, pp. 1186-1187.
Boutilier, R.G. 2001. Mechanisms of cell survival in hypoxia and hypothermia. Journal of Experimental Biology, 204, (18) 3171-3181
Brass, C.A., Narciso, J., & Gollan, J.L. 1991. Enhanced activity of the free radical producing enzyme xanthine oxidase in hypoxic rat liver. Regulation and pathophysiologic significance. Journal of Clinical Investigation, 87, (2) 424
Bravata, D.M., Olkin, I., Barnato, A.E., Keeffe, E.B., & Owens, D.K. 1999. HealthGÇÉrelated quality of life after liver transplantation: A metaGÇÉanalysis. Liver Transplantation and Surgery, 5, (4) 318-331
Brinkkoetter, P.T., Song, H., Losel, R., Schnetzke, U., Gottmann, U., Feng, Y., Hanusch, C., Beck, G.C., Schnuelle, P., Wehling, M., van der Woude, F.J., & Yard, B.A. 2008. Hypothermic injury: the mitochondrial calcium, ATP and ROS love-hate triangle out of balance. Cell Physiol Biochem., 22, (1-4) 195-204 available from: PM:18769046
Brockmann, J.G., Vaidya, A., Reddy, S., & Friend, P.J. 2006. Retrieval of abdominal organs for transplantation. British journal of surgery, 93, (2) 133-146
Brockmann, J., Reddy, S., Coussios, C., Pigott, D., Guirriero, D., Hughes, D., Morovat, A., Roy, D., Winter, L., & Friend, P.J. 2009. Normothermic perfusion: a new paradigm for organ preservation. Annals of surgery, 250, (1) 1-6
Brown, A.M. & Ransom, B.R. 2007. Astrocyte glycogen and brain energy metabolism. Glia, 55, (12) 1263-1271
148
Buis, C.I., Geuken, E., Visser, D.S., Kuipers, F., Haagsma, E.B., Verkade, H.J., & Porte, R.J. 2009. Altered bile composition after liver transplantation is associated with the development of nonanastomotic biliary strictures. Journal of hepatology, 50, (1) 69-79
Buis, C.I., Hoekstra, H., Verdonk, R.C., & Porte, R.J. 2006. Causes and consequences of ischemic-type biliary lesions after liver transplantation. Journal of hepato-biliary-pancreatic surgery, 13, (6) 517-524
Burke, A. & Lucey, M.R. 2004. Non-Alcoholic Fatty Liver Disease, Non-Alcoholic Steatohepatitis and Orthotopic Liver Transplantation. American Journal of Transplantation, 4, (5) 686-693
Busquets, J., Xiol, X., Figueras, J., Jaurrieta, E., Torras, J., Ramos, E., Rafecas, A., Fabregat, J., Lama, C., & Ibanez, L. 2001. The impact of donor age on liver transplantation: influence of donor age on early liver function and on subsequent patient and graft survival. Transplantation, 71, (12) 1765-1771
Callaghan, C.J., Charman, S.C., Muiesan, P., Powell, J.J., Gimson, A.E., & van der Meulen, J.H. 2013. Outcomes of transplantation of livers from donation after circulatory death donors in the UK: a cohort study. BMJ open, 3, (9) e003287
Calne, R.Y., Rolles, K., Thiru, S., McMaster, P., Craddock, G.N., Aziz, S., White, D.J.G., Evans, D.B., Dunn, D.C., & Henderson, R.G. 1979. Cyclosporin A initially as the only immunosuppressant in 34 recipients of cadaveric organs: 32 kidneys, 2 pancreases, and 2 livers. The Lancet, 314, (8151) 1033-1036
Cheng, Y.F., Chen, C.L., Lai, C.Y., Chen, T.Y., Huang, T.L., Lee, T.Y., Lin, C.L., Lord, R., Chen, Y., & Eng, H.L. 2001. Assessment of Donor Fatty Livers for Liver Transplantation1. Transplantation, 71, (9) 1221-1225
Cieslak, B., Lewandowski, Z., Urban, M., Ziarkiewicz-Wroblewska, B., & Krawczyk, M. Microvesicular liver graft steatosis as a risk factor of initial poor function in relation to suboptimal donor parameters, 8 edn, Elsevier, pp. 2985-2988.
Clark, J.M. 2006. The epidemiology of nonalcoholic fatty liver disease in adults. Journal of clinical gastroenterology, 40, S5-S10
Clarke, W., Silverman, B.C., Zhang, Z., Chan, D.W., Klein, A.S., & Molmenti, E.P. 2003. Characterization of renal allograft rejection by urinary proteomic analysis. Annals of surgery, 237, (5) 660
Clavien, P.A., Harvey, P.R., & Strasberg, S.M. 1992. Preservation and reperfusion injuries in liver allografts. Transplantation, 53, (5) 957-978
Clavien, P.A., Petrowsky, H., DeOliveira, M.L., & Graf, R. 2007. Strategies for safer liver surgery and partial liver transplantation. New England Journal of Medicine, 356, (15) 1545-1559
Coca, S.G., Yalavarthy, R., Concato, J., & Parikh, C.R. 2007. Biomarkers for the diagnosis and risk stratification of acute kidney injury: a systematic review. Kidney international, 73, (9) 1008-1016
149
Cohen, B., D'Amaro, J., Meester, J.D., & Persijn, G.G. 1997. Changing patterns in organ donation in Eurotransplant, 1990GÇô1994. Transplant international, 10, (1) 1-6
Colli, A., Fraquelli, M., Casazza, G., Massironi, S., Colucci, A., Conte, D., & Duca, P. 2006. Accuracy of ultrasonography, spiral CT, magnetic resonance, and alpha-fetoprotein in diagnosing hepatocellular carcinoma: a systematic review. The American journal of gastroenterology, 101, (3) 513-523
Comisarow, M.B. & Marshall, A.G. 1974. Fourier transform ion cyclotron resonance spectroscopy. Chemical physics letters, 25, (2) 282-283
Cywes, R.O.B.E., Greig, P.D., Sanabria, J.R., Clavien, P.A., Levy, G.A., Harvey, P.R., & Strasberg, S.M. 1992. Effect of intraportal glucose infusion on hepatic glycogen content and degradation, and outcome of liver transplantation. Annals of surgery, 216, (3) 235
D'Alessandro, A.M., Kalayoglu, M., Sollinger, H.W., Pirsch, J.D., Southard, J.H., & Belzer, F.O. 1991. Current status of organ preservation with University of Wisconsin solution. Archives of pathology & laboratory medicine, 115, (3) 306-310
D'Alessandro, A.M., Hoffmann, R.M., Knechtle, S.J., Odorico, J.S., Becker, Y.T., Musat, A., Pirsch, J.D., Sollinger, H.W., & Kalayoglu, M. 2000. Liver transplantation from controlled non-heart beating donors. Surgery, 128, (4) 579-588
de Vera, M.E., Lopez-Solis, R., Dvorchik, I., Campos, S., Morris, W., Demetris, A.J., Fontes, P., & Marsh, J.W. 2009. Liver transplantation using donation after cardiac death donors: long-term follow-up from a single center. Am.J.Transplant, 9, (4) 773-781 available from: PM:19344466
DeCarlis, L., Sansalone, C.V., Rondinara, G.F., Colella, G., Slim, A.O., Rossetti, O., Aseni, P., Volpe, A.D., Belli, L.S., & Alberti, A. 1996. Is the use of marginal donors justified in liver transplantation? Analysis of results and proposal of modern criteria. Transplant international, 9, (s1) S414-S417
Dieterle, F., Ross, A., Schlotterbeck, G., & Senn, H. 2006. Probabilistic quotient normalization as robust method to account for dilution of complex biological mixtures. Application in 1H NMR metabonomics. Analytical Chemistry, 78, (13) 4281-4290
Duarte, I.F., Stanley, E.G., Holmes, E., Lindon, J.C., Gil, A.M., Tang, H., Ferdinand, R., McKee, C.G., Nicholson, J.K., & Vilca-Melendez, H. 2005. Metabolic assessment of human liver transplants from biopsy samples at the donor and recipient stages using high-resolution magic angle spinning 1H NMR spectroscopy. Analytical chemistry, 77, (17) 5570-5578
Dunn, W.B. 2008. Current trends and future requirements for the mass spectrometric investigation of microbial, mammalian and plant metabolomes. Physical biology, 5, (1) 011001
Dunn, W.B. & Ellis, D.I. 2005. Metabolomics: current analytical platforms and methodologies. TrAC Trends in Analytical Chemistry, 24, (4) 285-294
Dutkowski, P., Odermatt, B., Heinrich, T., Schonfeld, S., Watzka, M., Winkelbach, V., Krysiak, M., & Junginger, T. 1998. Hypothermic oscillating liver perfusion stimulates ATP synthesis prior to transplantation. J.Surg.Res., 80, (2) 365-372 available from: PM:9878339
150
Dutkowski, P., Schlegel, A., Slankamenac, K., Oberkofler, C.E., Adam, R., Burroughs, A.K., Schadde, E., M++llhaupt, B., & Clavien, P.A. 2012. The use of fatty liver grafts in modern allocation systems: risk assessment by the balance of risk (BAR) score. Annals of surgery, 256, (5) 861-869
Feng, L., Zhao, N., Yao, X., Sun, X., Du, L., Diao, X., Li, S., & Li, Y. 2007. Histidine-tryptophan-ketoglutarate solution vs. University of Wisconsin solution for liver transplantation: A systematic review. Liver Transplantation, 13, (8) 1125-1136
Feng, S., Goodrich, N.P., Bragg-Gresham, J.L., Dykstra, D.M., Punch, J.D., DebRoy, M.A., Greenstein, S.M., & Merion, R.M. 2006. Characteristics associated with liver graft failure: the concept of a donor risk index. American Journal of Transplantation, 6, (4) 783-790
Foley, D.P., Fernandez, L.A., Leverson, G., Anderson, M., Mezrich, J., Sollinger, H.W., & D'Alessandro, A. 2011. Biliary complications after liver transplantation from donation after cardiac death donors: an analysis of risk factors and long term outcomes from a single center. Annals of surgery, 253, (4) 817
Foley, D.P., Fernandez, L.A., Leverson, G., Chin, L.T., Krieger, N., Cooper, J.T., Shames, B.D., Becker, Y.T., Odorico, J.S., & Knechtle, S.J. 2005. Donation after cardiac death: the University of Wisconsin experience with liver transplantation. Annals of surgery, 242, (5) 724
Fondevila, C., Busuttil, R.W., & Kupiec-Weglinski, J.W. 2003. Hepatic ischemia/reperfusion injury: a fresh look. Experimental and molecular pathology, 74, (2) 86-93
Fong, Y. & Blumgart, L.H. 2000. Surgery of the liver and biliary tract WB Saunders.
Fratte, S., Gendrault, J., Steffan, A., & Kirn, A. 1991. Comparative ultrastructural study of rat livers preserved in euroGÇÉcollins or university of wisconsin solution. Hepatology, 13, (6) 1173-1180
Frowein, R. A., Firsching, R., & Nanassis, K. 1989, "Diagnosis of brain death," In Head Injuries, Springer, pp. 237-239.
Fukumori, T., Ohkohchi, N., Tsukamoto, S., & Satomi, S. 1999. The Mechanism of Injury in A Steatotic Liver Graft During Cold Preservation1, 2. Transplantation, 67, (2) 195-200
Gok, M.A., Pelsers, M., Glatz, J.F., Shenton, B.K., Peaston, R., Cornell, C., & Talbot, D. 2003. Use of two biomarkers of renal ischemia to assess machine-perfused non-heart-beating donor kidneys. Clinical chemistry, 49, (1) 172-175
Gonzalez, F.X., Rimola, A., Grande, L., Antolin, M., Garcia-Valdecasas, J.C., Fuster, J., Lacy, A.M., Cugat, E., Visa, J., & Rodes, J. 1994. Predictive factors of early postoperative graft function in human liver transplantation. Hepatology, 20, (3) 565-573
Goode, H.F., Webster, N.R., Howdle, P.D., Leek, J.P., Lodge, J.P.A., Sadek, S.A., & Walker, B.E. 1994. Reperfusion injury, antioxidants and hemodynamics during orthotopic liver transplantation. Hepatology, 19, (2) 354-359
Greenfield, J.R. & Campbell, L.V. 2004. Insulin resistance and obesity. Clinics in dermatology, 22, (4) 289-295
151
Guan, S., Marshall, A.G., & Scheppele, S.E. 1996. Resolution and chemical formula identification of aromatic hydrocarbons and aromatic compounds containing sulfur, nitrogen, or oxygen in petroleum distillates and refinery streams. Analytical chemistry, 68, (1) 46-71
Guarrera, J.V. & Karim, N.A. 2008. Liver preservation: is there anything new yet? Current opinion in organ transplantation, 13, (2) 148-154
Gundlach, M., Broering, D., Topp, S., Sterneck, M., & Rogiers, X. 2000. SplitGÇÉcava technique: Liver splitting for two adult recipients. Liver transplantation, 6, (6) 703-706
Hartog, H., May, C., Corbett, C., Tomlinson, J., Bramhall, S., Mergental, H., Isaac, J., Muiesan, P., Mirza, D., & Perera, T. Early Occurrence of New-Onset Diabetes After Transplant Is Related to the Type of Liver Graft and Warm Ischaemic Injury, LIPPINCOTT WILLIAMS & WILKINS 530 WALNUT ST, PHILADELPHIA, PA 19106-3621 USA, p. 173.
Heeren, R.M.A., Kleinnijenhuis, A.J., McDonnell, L.A., & Mize, T.H. 2004. A mini-review of mass spectrometry using high-performance FTICR-MS methods. Analytical and bioanalytical chemistry, 378, (4) 1048-1058
Heidenhain, C., Pratschke, J., Puhl, G., Neumann, U., Pascher, A., Veltzke-Schlieker, W., & Neuhaus, P. 2010. Incidence of and risk factors for ischemic-type biliary lesions following orthotopic liver transplantation. Transplant international, 23, (1) 14-22
Heisel, O., Heisel, R., Balshaw, R., & Keown, P. 2004. New onset diabetes mellitus in patients receiving calcineurin inhibitors: a systematic review and meta-analysis. American Journal of Transplantation, 4, (4) 583-595
Higdon, R., Haynes, W., Stanberry, L., Stewart, E., Yandl, G., Howard, C., Broomall, W., Kolker, N., & Kolker, E. 2013. Unraveling the complexities of life sciences data. Big Data, 1, (1) 42-50
Hillered, L., Valtysson, J., Enblad, P., & Persson, L. 1998. Interstitial glycerol as a marker for membrane phospholipid degradation in the acutely injured human brain. Journal of Neurology, Neurosurgery & Psychiatry, 64, (4) 486-491
Hogberg, N., Carlsson, P.O., Hillered, L., Meurling, S., & Stenback, A. 2012a. Intestinal ischemia measured by intraluminal microdialysis. Scand.J.Clin.Lab Invest, 72, (1) 59-66 available from: PM:22103734
Hogberg, N., Carlsson, P.O., Hillered, L., Stenback, A., & Lilja, H.E. 2012b. Intraluminal intestinal microdialysis detects markers of hypoxia and cell damage in experimental necrotizing enterocolitis. J.Pediatr.Surg., 47, (9) 1646-1651 available from: PM:22974600
Holmgren, G., Steen, L., Suhr, O., Ericzon, B.G., Groth, C.G., Andersen, O., Wallin, B.G., Seymour, A., Richardson, S., & Hawkins, P.N. 1993. Clinical improvement and amyloid regression after liver transplantation in hereditary transthyretin amyloidosis. The Lancet, 341, (8853) 1113-1116
Hoofnagle, J.H., Lombardero, M., Zetterman, R.K., Lake, J., Porayko, M., Everhart, J., Belle, S.H., & Detre, K.M. 1996. Donor age and outcome of liver transplantation. Hepatology, 24, (1) 89-96
152
Horton, R.L. & Horton, P.J. 1990. Knowledge regarding organ donation: Identifying and overcoming barriers to organ donation. Social science & medicine, 31, (7) 791-800
Hoshino, T., Maley, W.R., Bulkley, G.B., & Williams, G.M. 1988. Ablation of free radical-mediated reperfusion injury for the salvage of kidneys taken from non-heartbeating donors. A quantitative evaluation of the proportion of injury caused by reperfusion following periods of warm, cold, and combined warm and cold ischemia. Transplantation, 45, (2) 284-289
Hrydziuszko, O., Silva, M.A., PR Perera, M.T., Richards, D.A., Murphy, N., Mirza, D., & Viant, M.R. 2010a. Application of metabolomics to investigate the process of human orthotopic liver transplantation: a proof-of-principle study. OMICS A Journal of Integrative Biology, 14, (2) 143-150
Hrydziuszko, O., Silva, M.A., PR Perera, M.T., Richards, D.A., Murphy, N., Mirza, D., & Viant, M.R. 2010b. Application of metabolomics to investigate the process of human orthotopic liver transplantation: a proof-of-principle study. OMICS A Journal of Integrative Biology, 14, (2) 143-150
Hrydziuszko, O. & Viant, M.R. 2012. Missing values in mass spectrometry based metabolomics: an undervalued step in the data processing pipeline. Metabolomics, 8, (1) 161-174
Ikeda, T., Yanaga, K., Kishikawa, K., Kakizoe, S., Shimada, M., & Sugimachi, K. 1992. Ischemic injury in liver transplantation: difference in injury sites between warm and cold ischemia in rats. Hepatology, 16, (2) 454-461
Imber, C.J., St Peter, S.D., Handa, A., & Friend, P.J. 2002. Hepatic steatosis and its relationship to transplantation. Liver transplantation, 8, (5) 415-423
Ishii, K., Suita, S., & Sumimoto, H. 1990. Effect of verapamil on conversion of xanthine dehydrogenase to oxidase in ischemic rat liver. Research in experimental medicine, 190, (1) 389-399
Iwatsuki, S., Starzl, T. E., Todo, S., Gordon, R. D., Esquivel, C. O., Tzakis, A. G., Makowka, L., Marsh, J. W., Koneru, B., & Stieber, A. Experience in 1,000 liver transplants under cyclosporine-steroid therapy: a survival report, 1 Suppl 1 edn, NIH Public Access, p. 498.
Iwatsuki, S.H.U.N., Gordon, R.D., Shaw Jr, B.W., & Starzl, T.E. 1985. Role of liver transplantation in cancer therapy. Annals of surgery, 202, (4) 401
Jaeschke, H. 2003. Molecular mechanisms of hepatic ischemia-reperfusion injury and preconditioning. American Journal of Physiology-Gastrointestinal and Liver Physiology, 284, (1) G15-G26
Jaeschke, H., Farhood, A., & Smith, C.W. 1990. Neutrophils contribute to ischemia/reperfusion injury in rat liver in vivo. The FASEB Journal, 4, (15) 3355-3359
Jamieson, R.W., Zilvetti, M., Roy, D., Hughes, D., Morovat, A., Coussios, C.C., & Friend, P.J. 2011. Hepatic steatosis and normothermic perfusionGÇöpreliminary experiments in a porcine model. Transplantation, 92, (3) 289-295
153
Jansson, K., Ungerstedt, J., Jonsson, T., Redler, B., Andersson, M., Ungerstedt, U., & Norgren, L. 2009. Human intraperitoneal microdialysis: increased lactate/pyruvate ratio suggests early visceral ischaemia.
Junot, C., Madalinski, G., Tabet, J.C., & Ezan, E. 2010. Fourier transform mass spectrometry for metabolome analysis. Analyst, 135, (9) 2203-2219
Kaddurah-Daouk, R. & Krishnan, K.R.R. 2008. Metabolomics: a global biochemical approach to the study of central nervous system diseases. Neuropsychopharmacology, 34, (1) 173-186
Kanda, H., Tateya, S., Tamori, Y., Kotani, K., Hiasa, K.i., Kitazawa, R., Kitazawa, S., Miyachi, H., Maeda, S., & Egashira, K. 2006. MCP-1 contributes to macrophage infiltration into adipose tissue, insulin resistance, and hepatic steatosis in obesity. The Journal of clinical investigation, 116, (6) 1494-1505
Kanehisa, M. 2002. The KEGG database. silico simulation of biological processes, 247, 91-103
Kanehisa, M. & Goto, S. 2000. KEGG: kyoto encyclopedia of genes and genomes. Nucleic acids research, 28, (1) 27-30
Kanehisa, M., Goto, S., Hattori, M., Aoki-Kinoshita, K.F., Itoh, M., Kawashima, S., Katayama, T., Araki, M., & Hirakawa, M. 2006. From genomics to chemical genomics: new developments in KEGG. Nucleic acids research, 34, (suppl 1) D354-D357
Kaste, M., Hillbom, M., & Palo, J. 1979. Diagnosis and management of brain death. British medical journal, 1, (6162) 525
Kim, W., Therneau, T.M., Benson, J.T., Kremers, W.K., Rosen, C.B., Gores, G.J., & Dickson, E.R. 2006. Deaths on the liver transplant waiting list: an analysis of competing risks. Hepatology, 43, (2) 345-351
Knox, W.E. 1951. Two mechanisms which increase in vivo the liver tryptophan peroxidase activity: specific enzyme adaptation and stimulation of the pituitary-adrenal system. British journal of experimental pathology, 32, (5) 462
Knox, W.E. & Mehler, A.H. 1950. The conversion of tryptophan to kynurenine in liver I. The coupled tryptophan peroxidase-oxidase system forming formylkynurenine. Journal of Biological Chemistry, 187, (1) 419-430
Koal, T. & Deigner, H.P. 2010. Challenges in mass spectrometry based targeted metabolomics. Current molecular medicine, 10, (2) 216-226
Koffron, A. & Stein, J.A. 2008. Liver transplantation: indications, pretransplant evaluation, surgery, and posttransplant complications. Medical Clinics of North America, 92, (4) 861-888
Kolker, E., Higdon, R., Haynes, W., Welch, D., Broomall, W., Lancet, D., Stanberry, L., & Kolker, N. 2012. MOPED: model organism protein expression database. Nucleic acids research, 40, (D1) D1093-D1099
Kompanje, E.J., de Groot, Y.J., & Bakker, J. 2011. Is organ donation from brain dead donors reaching an inescapable and desirable nadir? Transplantation, 91, (11) 1177-1180
154
Koneru, B. & Dikdan, G. 2002. Hepatic steatosis and liver transplantation current clinical and experimental perspectives. Transplantation, 73, (3) 325-330
Koning, O.H., Ploeg, R.J., Van Bockel, J.H., Groenewegen, M., van der Woude, F.J., Persijn, G.G., & Hermans, J. 1997. Risk factors for delayed graft function in cadaveric kidney transplantation: a prospective study of renal function and graft survival after preservation with University of Wisconsin solution in multi-organ donors. European Multicenter Study Group. Transplantation, 63, (11) 1620-1628
Kootstra, G. 1997. The asystolic, or non-heartbeating, donor. Transplantation, 63, (7) 917-921
Kukan, M. & Haddad, P.S. 2001. Role of hepatocytes and bile duct cells in preservationGÇÉreperfusion injury of liver grafts. Liver transplantation, 7, (5) 381-400
Kuo, H.T., Sampaio, M.S., Ye, X., Reddy, P., Martin, P., & Bunnapradist, S. 2010. Risk factors for new-onset diabetes mellitus in adult liver transplant recipients, an analysis of the Organ Procurement and Transplant Network/United Network for Organ Sharing database. Transplantation, 89, (9) 1134-1140
Leithead, J.A., Tariciotti, L., Gunson, B., Holt, A., Isaac, J., Mirza, D.F., Bramhall, S., Ferguson, J.W., & Muiesan, P. 2012. Donation after cardiac death liver transplant recipients have an increased frequency of acute kidney injury. American Journal of Transplantation, 12, (4) 965-975
Lemasters, J.J., Nieminen, A.L., Qian, T., Trost, L.C., Elmore, S.P., Nishimura, Y., Crowe, R.A., Cascio, W.E., Bradham, C.A., & Brenner, D.A. 1998. The mitochondrial permeability transition in cell death: a common mechanism in necrosis, apoptosis and autophagy. Biochimica et Biophysica Acta (BBA)-Bioenergetics, 1366, (1) 177-196
Maheshwari, A., Maley, W., Li, Z., & Thuluvath, P.J. 2007. Biliary complications and outcomes of liver transplantation from donors after cardiac death. Liver transplantation, 13, (12) 1645-1653
Makowka, L., Gordon, R. D., Todo, S., Ohkohchi, N., Marsh, J. W., Tzakis, A. G., Yokoi, H., Ligush, J., Esquivel, C. O., & Satake, M. Analysis of donor criteria for the prediction of outcome in clinical liver transplantation, 1 Pt 3 edn, NIH Public Access, p. 2378.
Mangus, R.S., Tector, A.J., Agarwal, A., Vianna, R., Murdock, P., & Fridell, J.A. 2006. Comparison of histidineGÇÉtryptophanGÇÉketoglutarate solution (HTK) and University of Wisconsin solution (UW) in adult liver transplantation. Liver transplantation, 12, (2) 226-230
Marchesini, G., Brizi, M., Morselli-Labate, A.M., Bianchi, G., Bugianesi, E., McCullough, A.J., Forlani, G., & Melchionda, N. 1999. Association of nonalcoholic fatty liver disease with insulin resistance. The American journal of medicine, 107, (5) 450-455
Marino, I.R., Doyle, H.R., Aldrighetti, L., Doria, C., McMichael, J., Gayowski, T., Fung, J.J., Tzakis, A.G., & Starzl, T.E. 1995. Effect of donor age and sex on the outcome of liver transplantation. Hepatology, 22, (6) 1754-1762
Markmann, J.F., Markmann, J.W., Markmann, D.A., Bacquerizo, A., Singer, J., Holt, C.D., Gornbein, J., Yersiz, H., Morrissey, M., & Lerner, S.M. 2001. Preoperative factors associated
155
with outcome and their impact on resource use in 1148 consecutive primary liver transplants. Transplantation, 72, (6) 1113-1122
Marshall, A.G., Hendrickson, C.L., & Jackson, G.S. 1998. Fourier transform ion cyclotron resonance mass spectrometry: a primer. Mass spectrometry reviews, 17, (1) 1-35
Marsman, W.A., Wiesner, R.H., Rodriguez, L., Batts, K.P., Porayko, M.K., Hay, J.E., Gores, G.J., & Krom, R.A. 1996. Use of fatty donor liver is associated with diminished early patient and graft survival. Transplantation, 62, (9) 1246-1251
Mateo, R., Cho, Y., Singh, G., Stapfer, M., Donovan, J., Kahn, J., Fong, T., Sher, L., Jabbour, N., & Aswad, S. 2006. Risk factors for graft survival after liver transplantation from donation after cardiac death donors: an analysis of OPTN/UNOS data. American Journal of Transplantation, 6, (4) 791-796
Mato, J.M. & Lu, S.C. 2007. Role of S-adenosyl-methionine in liver health and injury. Hepatology, 45, (5) 1306-1312
Mazzaferro, V., Chun, Y.S., Poon, R.T., Schwartz, M.E., Yao, F.Y., Marsh, J.W., Bhoori, S., & Lee, S.G. 2008. Liver transplantation for hepatocellular carcinoma. Annals of surgical oncology, 15, (4) 1001-1007
McCormack, L., Petrowsky, H., Jochum, W., Mullhaupt, B., Weber, M., & Clavien, P.A. 2007. Use of severely steatotic grafts in liver transplantation: a matched case-control study. Annals of surgery, 246, (6) 940-948
McLaren, A.J. & Friend, P.J. 2003. Trends in organ preservation. Transplant international, 16, (10) 701-708
Mehler, A.H. & Knox, W.E. 1950. The conversion of tryptophan to kynurenine in liver II. The enzymatic hydrolysis of formylkynurenine. Journal of Biological Chemistry, 187, (1) 431-438
Mellor, A.L. & Munn, D.H. 2004. IDO expression by dendritic cells: tolerance and tryptophan catabolism. Nature Reviews Immunology, 4, (10) 762-774
Minor, T., Saad, S., Nagelschmidt, M., K0tting, M., Fu, Z., Paul, A., & Isselhard, W. 1998. Successful Transplantation of Porcine Livers After Warm Ischemic Insult in Situ and Cold Preservation Including Postconditioning With Gaseous Oxygen. Transplantation, 65, (9) 1262-1264
Mirza, D.F., Gunson, B.K., Da Silva, R., Mayer, A.D., Buckels, J.A.C., & McMaster, P. 1994. Policies in Europe on" marginal quality" donor livers. The Lancet, 344, (8935) 1480-1483
Moers, C., Leuvenink, H.G., & Ploeg, R.J. 2007. NonGÇÉheart beating organ donation: overview and future perspectives. Transplant international, 20, (7) 567-575
Monbaliu, D., Libbrecht, L., De, V.R., Vekemans, K., Walter, H., Liu, Q., Heedfeld, V., Goossens, V., Pirenne, J., & Roskams, T. 2008. The extent of vacuolation in non-heart-beating porcine donor liver grafts prior to transplantation predicts their viability. Liver Transpl., 14, (9) 1256-1265 available from: PM:18756467
156
Monbaliu, D., Pirenne, J., & Talbot, D. 2012. Liver transplantation using donation after cardiac death donors. Journal of hepatology, 56, (2) 474-485
Muiesan, P., Girlanda, R., Jassem, W., Melendez, H.V., O'Grady, J., Bowles, M., Rela, M., & Heaton, N. 2005. Single-center experience with liver transplantation from controlled non-heartbeating donors: a viable source of grafts. Annals of surgery, 242, (5) 732
Munshi, M.K., Priester, S., Gaudio, E., Yang, F., Alpini, G., Mancinelli, R., Wise, C., Meng, F., Franchitto, A., & Onori, P. 2011. Regulation of biliary proliferation by neuroendocrine factors: implications for the pathogenesis of cholestatic liver diseases. The American journal of pathology, 178, (2) 472-484
Neuberger, J. 2004. Developments in liver transplantation. Gut, 53, (5) 759-768
Neuberger, J.M. 1989. Transplantation for alcoholic liver disease. BMJ: British Medical Journal, 299, (6701) 693
Newsholme, E.A. & Leech, A.R. 1983. Biochemistry for the medical sciences, 952 ed. Wiley Chichester.
Nilsson, O.G., Brandt, L., Ungerstedt, U., & Saveland, H. 1999. Bedside detection of brain ischemia using intracerebral microdialysis: subarachnoid hemorrhage and delayed ischemic deterioration. Neurosurgery, 45, (5) 1176
Nowak, G., Ungerstedt, J., Wernerman, J., Ungerstedt, U., & Ericzon, B.G. 2002a. Metabolic changes in the liver graft monitored continuously with microdialysis during liver transplantation in a pig model. Liver Transpl., 8, (5) 424-432 available from: PM:12004341
Nowak, G., Ungerstedt, J., Wernerman, J., Ungerstedt, U., & Ericzon, B. 2002b. Clinical experience in continuous graft monitoring with microdialysis early after liver transplantation. British journal of surgery, 89, (9) 1169-1175
Nowak, G., Ungerstedt, J., Wernerman, J., Ungerstedt, U., & Ericzon, B. 2002c. Metabolic changes in the liver graft monitored continuously with microdialysis during liver transplantation in a pig model. Liver transplantation, 8, (5) 424-432
Nowak, G., Ungerstedt, J., Wernerson, A., Ungerstedt, U., & Ericzon, B. 2003a. Hepatic cell membrane damage during cold preservation sensitizes liver grafts to rewarming injury. Journal of hepato-biliary-pancreatic surgery, 10, (3) 200-205
Nowak, G., Ungerstedt, J., Wernerson, A., Ungerstedt, U., & Ericzon, B. 2003b. Hepatic cell membrane damage during cold preservation sensitizes liver grafts to rewarming injury. Journal of hepato-biliary-pancreatic surgery, 10, (3) 200-205
O'Grady, J.G., Wendon, J., Tan, K.C., Potter, D., Cottam, S., Cohen, A.T., Gimson, A.E., & Williams, R. 1991. Liver transplantation after paracetamol overdose. BMJ: British Medical Journal, 303, (6796) 221
Ohta, D., Kanaya, S., & Suzuki, H. 2010. Application of Fourier-transform ion cyclotron resonance mass spectrometry to metabolic profiling and metabolite identification. Current opinion in biotechnology, 21, (1) 35-44
157
Onori, P., Alvaro, D., Floreani, A., Mancino, M., Franchitto, A., Guido, M., Carpino, G., De Santis, A., Angelico, M., & Attili, A.F. 2007. Activation of the IGF1 system characterizes cholangiocyte survival during progression of primary biliary cirrhosis. Journal of Histochemistry & Cytochemistry, 55, (4) 327-334
Park, G. 2004. Supply and demand of organs for donation. Intensive care medicine, 30, (1) 7-9
Parsons, H.M., Ludwig, C., Gunther, U.L., & Viant, M.R. 2007. Improved classification accuracy in 1-and 2-dimensional NMR metabolomics data using the variance stabilising generalised logarithm transformation. BMC bioinformatics, 8, (1) 234
Payne, T.G., Southam, A.D., Arvanitis, T.N., & Viant, M.R. 2009. A signal filtering method for improved quantification and noise discrimination in fourier transform ion cyclotron resonance mass spectrometry-based metabolomics data. J.Am.Soc.Mass Spectrom., 20, (6) 1087-1095 available from: PM:19269189
Perera, M.T., Higdon, R., Richards, D.A., Silva, M.A., Murphy, N., Kolker, E., & Mirza, D.F. 2014a. Biomarker differences between cadaveric grafts used in human orthotopic liver transplantation as identified by coulometric electrochemical array detection (CEAD) metabolomics. OMICS, 18, (12) 767-777 available from: PM:25353146
Perera, M.T.P.R., Richards, D.A., Silva, M.A., Ahmed, N., Neil, D.A., Murphy, N., & Mirza, D.F. 2014b. Comparison of energy metabolism in liver grafts from donors after circulatory death and donors after brain death during cold storage and reperfusion. British Journal of Surgery
Perez-Daga, J. A., Santoyo, J., Suarez, M. A., Fernandez-Aguilar, J. A., Ramirez, C., Rodriguez-Canete, A., Aranda, J. M., S+ínchez-P+®rez, B., Montiel, C., & Palomo, D. Influence of degree of hepatic steatosis on graft function and postoperative complications of liver transplantation, 8 edn, Elsevier, pp. 2468-2470.
Picardi, A., D'Avola, D., Gentilucci, U.V., Galati, G., Fiori, E., Spataro, S., & Afeltra, A. 2006. Diabetes in chronic liver disease: from old concepts to new evidence. Diabetes/metabolism research and reviews, 22, (4) 274-283
Ploeg, R.J., D'Alessandro, A.M., Knechtle, S.J., Stegall, M.D., Pirsch, J.D., Hoffmann, R.M., Sasaki, T., Sollinger, H.W., Belzer, F.O., & Kalayoglu, M.U.N.C. 1993. Risk factors for primary dysfunction after liver transplantation--a multivariate analysis. Transplantation, 55, (4) 807-813
Pokorny, H., Gruenberger, T., Soliman, T., Rockenschaub, S., Langle, F., & Steininger, R. 2000. Organ survival after primary dysfunction of liver grafts in clinical orthotopic liver transplantation. Transplant international, 13, (1) S154-S157
Reddy, S., Greenwood, J., Maniakin, N., Bhattacharjya, S., Zilvetti, M., Brockmann, J., James, T., Pigott, D., & Friend, P. 2005. Non-heart beating donor porcine livers: The adverse effect of cooling. Liver transplantation, 11, (1) 35-38
Reich, D.J., Mulligan, D.C., Abt, P.L., Pruett, T.L., Abecassis, M.M.I., D'alessandro, A., Pomfret, E.A., Freeman, R.B., Markmann, J.F., & Hanto, D.W. 2009. ASTS recommended practice guidelines for controlled donation after cardiac death organ procurement and transplantation. American Journal of Transplantation, 9, (9) 2004-2011
158
Reich, D.J., Munoz, S.J., Rothstein, K.D., Nathan, H.M., Edwards, J.M., Hasz, R.D., & Manzarbeitia, C.Y. 2000. Controlled non-heart-beating donor liver transplantation: a successful single center experience, with topic update. Transplantation, 70, (8) 1159-1166
Ridley, S., Bonner, S., Bray, K., Falvey, S., Mackay, J., & Manara, A. 2005. UK guidance for non-heart-beating donation. British journal of anaesthesia, 95, (5) 592-595
Rolinski, S., Horn, H., Petzoldt, T., & Paul, L. 2007. Identifying cardinal dates in phytoplankton time series to enable the analysis of long-term trends. Oecologia, 153, (4) 997-1008
Rossouw, J.E., Labadarios, D., Davis, M., & Williams, R. 1977. The degradation of tryptophan in severe liver disease. International journal for vitamin and nutrition research.Internationale Zeitschrift fur Vitamin-und Ernahrungsforschung.Journal international de vitaminologie et de nutrition, 48, (3) 281-289
Rozen, S., Cudkowicz, M.E., Bogdanov, M., Matson, W.R., Kristal, B.S., Beecher, C., Harrison, S., Vouros, P., Flarakos, J., & Vigneau-Callahan, K. 2005. Metabolomic analysis and signatures in motor neuron disease. Metabolomics, 1, (2) 101-108
Rull, R., Garcia Valdecasas, J.C., Grande, L.U.I.S., Fuster, J., Lacy, A.M., Gonz+ílez, F.X., Rimola, A., Navasa, M., Iglesias, C., & Visa, J. 2001. Intrahepatic biliary lesions after orthotopic liver transplantation. Transplant international, 14, (3) 129-134
Salizzoni, M., Franchello, A., Zamboni, F., Ricchiuti, A., Cocchis, D., Fop, F., Brunati, A., & Cerutti, E. 2003. Marginal grafts: finding the correct treatment for fatty livers. Transplant international, 16, (7) 486-493
Saudubray, J.M., Touati, G., Delonlay, P., Jouvet, P., Narcy, C., Laurent, J., Rabier, D., Kamoun, P., Jan, D., & Revillon, Y. 1999. Liver transplantation in urea cycle disorders. European journal of pediatrics, 158, (2) S055-S059
Schaubel, D.E., Sima, C.S., Goodrich, N.P., Feng, S., & Merion, R.M. 2008. The survival benefit of deceased donor liver transplantation as a function of candidate disease severity and donor quality. American Journal of Transplantation, 8, (2) 419-425
Schemmer, P., Enomoto, N., Bradford, B.U., Bunzendahl, H., Raleigh, J.A., Lemasters, J.J., & Thurman, R.G. 2001. Activated Kupffer cells cause a hypermetabolic state after gentle in situ manipulation of liver in rats. American Journal of Physiology-Gastrointestinal and Liver Physiology, 280, (6) G1076-G1082
Schemmer, P., Mehrabi, A., Friess, H., Sauer, P., Schmidt, J., B++chler, M.W., & Kraus, T.W. 2005. Living related liver transplantation: the ultimate technique to expand the donor pool? Transplantation, 80, (1S) S138-S141
Schmid, D.G., Grosche, P., Bandel, H., & nther Jung, G. 2000. FTICR-mass spectrometry for high-resolution analysis in combinatorial chemistry. BIOTECHNOLOGY AND BIOENGINEERING (COMBINATORIAL CHEMISTRY), 71, (2) 2001
Serkova, N.J., Zhang, Y., Coatney, J.L., Hunter, L., Wachs, M.E., Niemann, C.U., & Mandell, M.S. 2007. Early detection of graft failure using the blood metabolic profile of a liver recipient. Transplantation, 83, (4) 517-521 available from: PM:17318087
159
Serracino-Inglott, F., Habib, N.A., & Mathie, R.T. 2001. Hepatic ischemia-reperfusion injury. The American Journal of Surgery, 181, (2) 160-166
Shaw Jr, B.W., Martin, D.J., Marquez, J.M., Kang, Y.G., Bugbee Jr, A.C., Iwatsuki, S.H.U.N., Griffith, B.P., Hardesty, R.L., Bahnson, H.T., & Starzl, T.E. 1984. Venous bypass in clinical liver transplantation. Annals of surgery, 200, (4) 524
Sidransky, H.T. 1985. Unique actions by an essential amino acid. Marcel Dekker, New York 1-62
Silva, M.A., Mirza, D.F., Buckels, J.A., Bramhall, S.R., Mayer, D., Wigmore, S.J., Murphy, N., & Richards, D.A. 2006a. Arginine and urea metabolism in the liver graft: A study using microdialysis in human orthotopic liver transplantation. Transplantation, 82, (10) 1304-1311
Silva, M.A., Mirza, D.F., Murphy, N., Richards, D.A., Reynolds, G.M., Wigmore, S.J., & Neil, D.A. 2008. Intrahepatic complement activation, sinusoidal endothelial injury, and lactic acidosis are associated with initial poor function of the liver after transplantation. Transplantation, 85, (5) 718-725
Silva, M.A., Murphy, N., Richards, D.A., Wigmore, S.J., Bramhall, S.R., Buckels, J.A., Adams, D.H., & Mirza, D.F. 2006b. Interstitial lactic acidosis in the graft during organ harvest, cold storage, and reperfusion of human liver allografts predicts subsequent ischemia reperfusion injury. Transplantation, 82, (2) 227-233
Silva, M.A., Richards, D.A., Bramhall, S.R., Adams, D.H., Mirza, D.F., & Murphy, N. 2005. A study of the metabolites of ischemia-reperfusion injury and selected amino acids in the liver using microdialysis during transplantation. Transplantation, 79, (7) 828-835
Smyth, G.K. 2004. Linear models and empirical bayes methods for assessing differential expression in microarray experiments. Statistical applications in genetics and molecular biology, 3, (1)
Southam, A.D., Payne, T.G., Cooper, H.J., Arvanitis, T.N., & Viant, M.R. 2007. Dynamic range and mass accuracy of wide-scan direct infusion nanoelectrospray fourier transform ion cyclotron resonance mass spectrometry-based metabolomics increased by the spectral stitching method. Anal.Chem., 79, (12) 4595-4602 available from: PM:17511421
Southard, J.H. 1999. Organ preservation. Organ procurement and preservation.Landes Bioscience, Austin 63-79
St Peter, S.D., Imber, C.J., & Friend, P.J. 2002. Liver and kidney preservation by perfusion. The Lancet, 359, (9306) 604-613
Starzl, T. E., Iwatsuki, S., Esquivel, C. O., Todo, S., Kam, I., Lynch, S., Gordon, R. D., & Shaw Jr, B. W. Refinements in the surgical technique of liver transplantation, 4 edn, NIH Public Access, p. 349.
Starzl, T.E., Koep, L.J., Halgrimson, C.G., Hood, J., Schroter, G.P., Porter, K.A., & Weil III, R.I.C.H. 1979. Fifteen years of clinical liver transplantation. Gastroenterology, 77, (2) 375
160
Starzl, T.E., Porter, K.A., & Putnam, C.W. 1976. Insulin, glucagon, and the control of hepatic structure, function, and capacity for regeneration. Metabolism, 25, (11) 1429-1434
Straatsburg, I.H., Abrahamse, S.L., Song, S.W., Hartman, R.J., & van Gulik, T.M. 2002. Evaluation of rat liver apoptotic and necrotic cell death after cold storage using UW, HTK, and Celsior. Transplantation, 74, (4) 458-464
Strasberg, S.M., Howard, T.K., Molmenti, E.P., & Hertl, M. 1994. Selecting the donor liver: risk factors for poor function after orthotopic liver transplantation. Hepatology, 20, (4) 829-838
Sumida, Y., Yonei, Y., Tanaka, S., Mori, K., Kanemasa, K., Imai, S., Taketani, H., Hara, T., Seko, Y., & Ishiba, H. 2014. Lower levels of insulin-like growth factor1 standard deviation score are associated with histological severity of nonalcoholic fatty liver disease. Hepatology Research
Summers, D.M., Counter, C., Johnson, R.J., Murphy, P.G., Neuberger, J.M., & Bradley, J.A. 2010. Is the increase in DCD organ donors in the United Kingdom contributing to a decline in DBD donors? Transplantation, 90, (12) 1506-1510
Takada, Y., Taniguchi, H., Fukunaga, K., Yuzawa, K., Otsuka, M., Todoroki, T., Iijima, T., & Fukao, K. 1997. Hepatic allograft procurement from non-heart-beating donors: limits of warm ischemia in porcine liver transplantatio. Transplantation, 63, (3) 369-373
Tanaka, K., Uemoto, S., Tokunaga, Y., Fujita, S., Sano, K., Nishizawa, T., Sawada, H., Shirahase, I., Kim, H.J., & Yamaoka, Y. 1993. Surgical techniques and innovations in living related liver transplantation. Annals of surgery, 217, (1) 82
Taylor, M.W. & Feng, G.S. 1991. Relationship between interferon-gamma, indoleamine 2, 3-dioxygenase, and tryptophan catabolism. The FASEB Journal, 5, (11) 2516-2522
Taylor, N.S., Weber, R.J., Southam, A.D., Payne, T.G., Hrydziuszko, O., Arvanitis, T.N., & Viant, M.R. 2009. A new approach to toxicity testing in Daphnia magna: application of high throughput FT-ICR mass spectrometry metabolomics. Metabolomics, 5, (1) 44-58
TE STARZL, T.L., Von Kaulla, K.N., Hermann, G., Brittain, R.S., & Waddell, W.R. 1963. Homotransplantation of the liver in humans. Surgery, gynecology & obstetrics, 117, 659
Tekin, K., Imber, C.J., Atli, M., Gunson, B.K., Bramhall, S.R., Mayer, D., Buckels, J.A., Mcmaster, P., & Mirza, D.F. 2004. A simple scoring system to evaluate the effects of cold ischemia on marginal liver donors1. Transplantation, 77, (3) 411-416
Terness, P., Bauer, T.M., Rose, L., Dufter, C., Watzlik, A., Simon, H., & Opelz, G. 2002. Inhibition of allogeneic T cell proliferation by indoleamine 2,3-dioxygenase-expressing dendritic cells: mediation of suppression by tryptophan metabolites. J.Exp.Med., 196, (4) 447-457 available from: PM:12186837
Todo, S., Demetris, A.J., Makowka, L., Teperman, L., Podesta, L., Shaver, T., Tzakis, A., & Starzl, T.E. 1989. Primary nonfunction of hepatic allografts with preexisting fatty infiltration. Transplantation, 47, (5) 903
Todo, S., Fung, J.J., Starzl, T.E., Tzakis, A.N.D.R., Demetris, A.J., Kormos, R.O.B.E., Jain, A.S.H.O., Alessiani, M.A.R.I., Takaya, S.H.U.N., & Shapiro, R. 1990. Liver, kidney, and thoracic organ transplantation under FK 506. Annals of surgery, 212, (3) 295
161
Truog, R.D. & Robinson, W.M. 2003. Role of brain death and the dead-donor rule in the ethics of organ transplantation. Critical care medicine, 31, (9) 2391-2396
Urena, M.A.G.a., Ruiz-Delgado, F.C., Gonzalez, E.M., Romero, C.J.n., Garcia, I.G.a., Segurola, C.L., Gonzalez-Pinto, I., & Sanz, R.n.G.m. 1998. Hepatic steatosis in liver transplant donors: common feature of donor population? World journal of surgery, 22, (8) 837-844
Vajdova, K., Graf, R., & Clavien, P.A. 2002. ATP-supplies in the cold-preserved liver: A long-neglected factor of organ viability. Hepatology, 36, (6) 1543-1552 available from: PM:12447882
Vajdova, K., Smrekova, R., Mislanova, C., Kukan, M., & Lutterova, M. 2000. Cold-preservation-induced sensitivity of rat hepatocyte function to rewarming injury and its prevention by short-term reperfusion. Hepatology, 32, (2) 289-296 available from: PM:10915735
Veith, F.J., Fein, J.M., Tendler, M.D., Veatch, R.M., Kleiman, M.A., & Kalkines, G. 1977. Brain death: I. A status report of medical and ethical considerations. Jama, 238, (15) 1651-1655
Verran, D., Kusyk, T., Painter, D., Fisher, J., Koorey, D., Strasser, S., Stewart, G., & McCaughan, G. 2003. Clinical experience gained from the use of 120 steatotic donor livers for orthotopic liver transplantation. Liver transplantation, 9, (5) 500-505
Villeneuve, J., Lepreux, S., Mulot, A., Berard, A.M., Higa-Nishiyama, A., Costet, P., De Ledinghen, V., Bioulac-Sage, P., Balabaud, C., & Nurden, A.T. 2010. A protective role for CD154 in hepatic steatosis in mice. Hepatology, 52, (6) 1968-1979
Vogel, T., Brockmann, J.G., & Friend, P.J. 2010. Ex-vivo normothermic liver perfusion: an update. Current opinion in organ transplantation, 15, (2) 167-172
Vollmar, B., Glasz, J., Leiderer, R., Post, S., & Menger, M.D. 1994. Hepatic microcirculatory perfusion failure is a determinant of liver dysfunction in warm ischemia-reperfusion. The American journal of pathology, 145, (6) 1421
Wall, W.J., Mimeault, R., Grant, D.R., & Bloch, M. 1990. The use of older donor livers for hepatic transplantation. Transplantation, 49, (2) 377-381
Watts, R.W., Morgan, S.H., Danpure, C.J., Purkiss, P., Calne, R.Y., Rolles, K., Baker, L.R., Mansell, M.A., Smith, L.H., & Merion, R.M. 1991. Combined hepatic and renal transplantation in primary hyperoxaluria type I: clinical report of nine cases. The American journal of medicine, 90, (2) 179-188
Weber, M.M., Auernhammer, C.J., Lee, P.D., Engelhardt, D., & Zachoval, R. 2002. Insulin-like growth factors and insulin-like growth factor binding proteins in adult patients with severe liver disease before and after orthotopic liver transplantation. Hormone Research in Paediatrics, 57, (3-4) 105-112
Weber, R.J. & Viant, M.R. 2010. MI-Pack: Increased confidence of metabolite identification in mass spectra by integrating accurate masses and metabolic pathways. Chemometrics and Intelligent Laboratory Systems, 104, (1) 75-82
162
Wiesner, R.H. 1998. A long-term comparison of tacrolimus (FK506) versus cyclosporine in liver transplantation: a report of the United States FK506 Study Group. Transplantation, 66, (4) 493-499
Wilczek, H.E., Larsson, M., Yamamoto, S., & Ericzon, B. 2008. Domino liver transplantation. Journal of hepato-biliary-pancreatic surgery, 15, (2) 139-148
Williams, C.D., Stengel, J., Asike, M.I., Torres, D.M., Shaw, J., Contreras, M., Landt, C.L., & Harrison, S.A. 2011. Prevalence of nonalcoholic fatty liver disease and nonalcoholic steatohepatitis among a largely middle-aged population utilizing ultrasound and liver biopsy: a prospective study. Gastroenterology, 140, (1) 124-131
Wishart, D.S. 2005a. Metabolomics: the principles and potential applications to transplantation. American journal of transplantation, 5, (12) 2814-2820
Wishart, D.S. 2005b. Metabolomics: the principles and potential applications to transplantation. American journal of transplantation, 5, (12) 2814-2820
Wishart, D.S. 2008. Quantitative metabolomics using NMR. TrAC Trends in Analytical Chemistry, 27, (3) 228-237
Wu, H., Southam, A.D., Hines, A., & Viant, M.R. 2008. High-throughput tissue extraction protocol for NMR-and MS-based metabolomics. Analytical biochemistry, 372, (2) 204-212
Yang, J., Hutchinson, I.I., Shah, T., & Min, D.I. 2011. Genetic and clinical risk factors of new-onset diabetes after transplantation in Hispanic kidney transplant recipients. Transplantation, 91, (10) 1114-1119
Yates, C.J., Fourlanos, S., Hjelmesaeth, J., Colman, P.G., & Cohney, S.J. 2012. NewGÇÉOnset Diabetes After Kidney TransplantationGÇöChanges and Challenges. American Journal of Transplantation, 12, (4) 820-828
Yoglu, M., Stratta, R., Hoffmann, R., Sollinger, H., D'Alessandro, A., Pirsch, J., & Belzer, F. 1988. Extended preservation of the liver for clinical transplantation. The Lancet, 331, (8586) 617-619
Yoo, H.Y., Molmenti, E., & Thuluvath, P.J. 2003. The effect of donor body mass index on primary graft nonfunction, retransplantation rate, and early graft and patient survival after liver transplantation. Liver transplantation, 9, (1) 72-78
Young, S.N. 1981. Mechanism of decline in rat brain 5-hydroxytryptamine after induction of liver tryptophan pyrrolase by hydrocortisone: roles of tryptophan catabolism and kynurenine synthesis. Br.J.Pharmacol., 74, (3) 695-700 available from: PM:7296169
Young, S.N. & Sourkes, T.L. 1975. Tryptophan catabolism by tryptophan pyrrolase in rat liver. The effect of tryptophan loads and changes in tryptophan pyrrolase activity. J.Biol Chem., 250, (13) 5009-5014 available from: PM:1150652
Youngner, S.J., Landefeld, C.S., Coulton, C.J., Juknialis, B.W., & Leary, M. 1989. Brain death'and organ retrieval: a cross-sectional survey of knowledge and concepts among health professionals. Jama, 261, (15) 2205-2210
163
Zaouali, M.A., Padrissa-Altes, S., Mosbah, I.B., Abdennebi, H.B., Boillot, O., Rimola, A., Saidane-Mosbahi, D., & Rosello-Catafau, J. 2010. Insulin like growth factor-1 increases fatty liver preservation in IGL-1 solution. World journal of gastroenterology: WJG, 16, (45) 5693