Embed Size (px)
Citation preview
Outline Motivation Univariate charts Multivariate charts Conclusions References
The use of multivariate control charts for qualitycontrol
Trial lecture
Ingrid Hobæk Haff
Norsk Regnesentral/Norwegian Computing CenterStatistics for Innovation (sfi)2
September 10th, 2012
Ingrid Hobæk Haff The use of multivariate control charts for quality control
Outline Motivation Univariate charts Multivariate charts Conclusions References
Motivation and main concepts
Univariate control charts
Multivariate control charts
Conclusions
Ingrid Hobæk Haff The use of multivariate control charts for quality control

Outline Motivation Univariate charts Multivariate charts Conclusions References
Motivation and main concepts
Ingrid Hobæk Haff The use of multivariate control charts for quality control
Outline Motivation Univariate charts Multivariate charts Conclusions References
How it all started
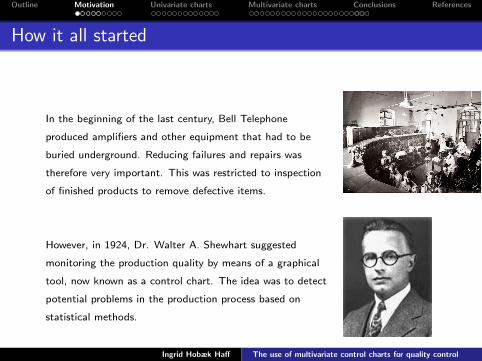
In the beginning of the last century, Bell Telephone
produced amplifiers and other equipment that had to be
buried underground. Reducing failures and repairs was
therefore very important. This was restricted to inspection
of finished products to remove defective items.
However, in 1924, Dr. Walter A. Shewhart suggested
monitoring the production quality by means of a graphical
tool, now known as a control chart. The idea was to detect
potential problems in the production process based on
statistical methods.
Ingrid Hobæk Haff The use of multivariate control charts for quality control
Outline Motivation Univariate charts Multivariate charts Conclusions References
Quality control
• Quality control, also called quality improvement, is animportant field in the manufacturing sector.
• It consists in monitoring certain quality characteristics of themanufactured products over time in order to
• ensure that the quality of the products is stable• identify problems in the production• improve the quality of the products.
• Statistical quality control is quality control using statisticalmethods.
• Control charts are one of the main tools for statistical qualitycontrol.
Ingrid Hobæk Haff The use of multivariate control charts for quality control
Outline Motivation Univariate charts Multivariate charts Conclusions References
Quality control
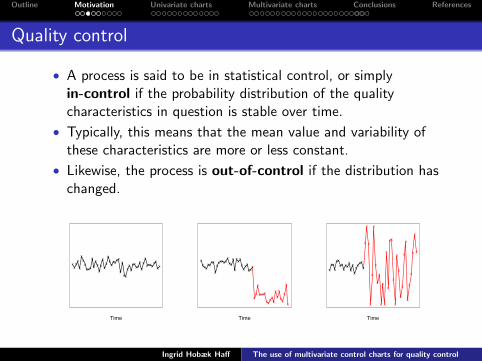
• A process is said to be in statistical control, or simplyin-control if the probability distribution of the qualitycharacteristics in question is stable over time.
• Typically, this means that the mean value and variability ofthese characteristics are more or less constant.
• Likewise, the process is out-of-control if the distribution haschanged.
Time
xxxx
x
xxxxxx
x
xxx
xx
x
xx
xxxxx
xx
x
x
xx
xxxxx
xxx
x
xx
xxxxxx
xx
Time
xxxx
xxxx
x
xxxxxx
xxx
x
x
xxx
xxxx
xxx
xx
x
xxxx
xxxx
x
x
x
x
xx
x
x
x
Time
xxx
x
xxxx
xxx
x
xx
xxxxx
x
x
x
x
x
x
x
x
x
x
x
x
x
x
x
xx
x
x
x
x
x
x
x
x
x
x
x
x
x
x
Ingrid Hobæk Haff The use of multivariate control charts for quality control

Outline Motivation Univariate charts Multivariate charts Conclusions References
Control charts
• A control chart is a time sequence plot of some measure ofquality, with added control or decision lines.
• The purpose is to determine whether the process in questionis in-control.
• The control lines are determined in such a way thatobservations outside these limits suggest that the process isout-of-control.
• If some points fall outside the control limits, the processshould be scrutinised in order to detect the source(s) of thechange.
Time
xxxx
x
xxxxxx
x
xxx
xx
x
xx
xxxxx
xx
x
x
xx
xxxxx
xxx
x
xx
xxxxxx
xx
Time
xxxx
xxxx
x
xxxxxx
xxx
x
x
xxx
xxxx
xxx
xx
x
xxxx
xxxx
x
x
x
x
xx
x
x
x
Time
xxx
x
xxxx
xxx
x
xx
xxxxx
x
x
x
x
x
x
x
x
x
x
x
x
x
x
x
xx
x
x
x
x
x
x
x
x
x
x
x
x
x
x
Ingrid Hobæk Haff The use of multivariate control charts for quality control
Outline Motivation Univariate charts Multivariate charts Conclusions References
Control charts
Although they were originally developed for industrial processes,control charts have been applied within a number of areas,including:
• hospital infection control (Sellick, 1993)
• prediction of business failures (Theodossiou, 1993)
• monitoring the impact of human disturbance of ecologicalsystems (Anderson and Thompson, 2004)
• quality management of higher education (Mergen et al., 2000)
• corroborating bribery (Charnes and Gitlow, 1995)
• improving athletic performance (Clark and Clark, 1997)
Ingrid Hobæk Haff The use of multivariate control charts for quality control
Outline Motivation Univariate charts Multivariate charts Conclusions References
Main concepts
• A control chart must contain an upper control limit (UCL)and potentially a lower control limit (LCL).
• The construction of control charts consists of two stages.
• Phase I is a retrospective data analysis to assess whether theprocess has been in-control in the past.
• Phase II consists in determining the control limits for futureobservations based on the past observations.
• If the Phase I analysis indicates that the process has beenin-control, one may proceed directly to Phase II, and use allthe observed data.
• Otherwise, one must try to detect the sources of the change.
Ingrid Hobæk Haff The use of multivariate control charts for quality control
Outline Motivation Univariate charts Multivariate charts Conclusions References
Main concepts
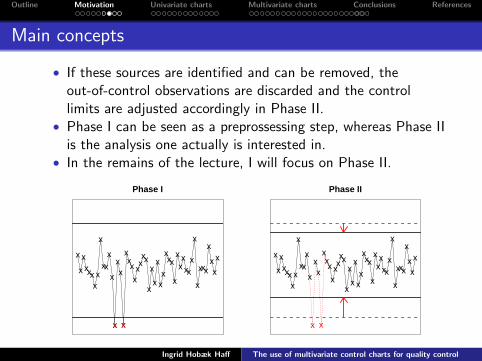
• If these sources are identified and can be removed, theout-of-control observations are discarded and the controllimits are adjusted accordingly in Phase II.
• Phase I can be seen as a preprossessing step, whereas Phase IIis the analysis one actually is interested in.
• In the remains of the lecture, I will focus on Phase II.
Time
x
x
xxxx
xx
x
xxx
x
x
xx
x
xxx
xxxxx
x
x
x
x
xx
xxx
x
xxxxx
x
x
x
xxx
x
xx
x
x x
Phase I
Time
x
x
xxxx
xx
x
xxx
x
xx
xxx
xxxxx
x
x
x
x
xx
xxx
x
xxxxx
x
x
x
xxx
x
xx
x
x x
Phase II
Ingrid Hobæk Haff The use of multivariate control charts for quality control
Outline Motivation Univariate charts Multivariate charts Conclusions References
Main concepts
• The average run length (ARL) is the expected time until apoint falls outside the control limit(s).
• By design, the probability of observing a point outside thecontrol limit(s) is very low when the process is in-control.
• However, as long as this probability is > 0, that will happenfrom time to time.
• The expected time until such a false alarm is called thein-control ARL.
• The expected time until a true change in the process isdetected is called the parameter-change ARL.
• These two ARLs constitute the ARL-properties of the chart.
• In practice, it is impossible to distinguish between a false andreal alarm just by looking at the data.
Ingrid Hobæk Haff The use of multivariate control charts for quality control
Outline Motivation Univariate charts Multivariate charts Conclusions References
Main concepts
• Ideally, one would like to minimise the parameter-change ARL(true parameter change), while maximising the in-control ARL(false alarm).
• Unfortunately, a decrease in the parameter-change ARL willusually entail a decrease in the in-control ARL.
• Likewise, if one attempts to reduce the number of false alarmsby increasing the in-control ARL, the chart will generallybecome less sensitive to changes in the process.
• The choice of control limits must therefore be a trade-offbetween these two concerns, and the optimal choice will besituation dependent.
Ingrid Hobæk Haff The use of multivariate control charts for quality control
Outline Motivation Univariate charts Multivariate charts Conclusions References
Univariate control charts
Ingrid Hobæk Haff The use of multivariate control charts for quality control

Outline Motivation Univariate charts Multivariate charts Conclusions References
Control charts for measurement data
• Measurement data follow a continuous probability distribution.
• They may be either product or process variables.
• Let X1,X2, . . ., be the measurements at time τ = 1, 2, . . ..
• These are assumed to• be independent• follow a normal distribution N(µτ , σ
2τ ).
• The measurements are divided into m subgroups in time, forinstance weekly, and one computes the average x̄t for eachsubgroup, representing time t.
Ingrid Hobæk Haff The use of multivariate control charts for quality control
Outline Motivation Univariate charts Multivariate charts Conclusions References
X̄ -chart
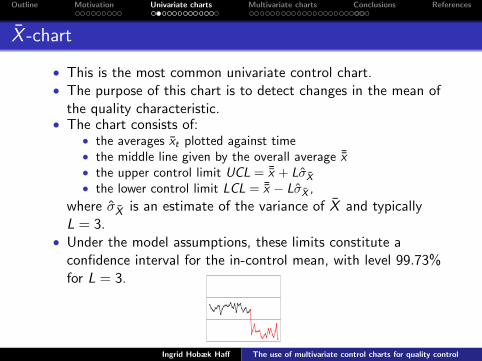
• This is the most common univariate control chart.• The purpose of this chart is to detect changes in the mean of
the quality characteristic.• The chart consists of:
• the averages x̄t plotted against time• the middle line given by the overall average ¯̄x• the upper control limit UCL = ¯̄x + Lσ̂X̄
• the lower control limit LCL = ¯̄x − Lσ̂X̄ ,
where σ̂X̄ is an estimate of the variance of X̄ and typicallyL = 3.
• Under the model assumptions, these limits constitute aconfidence interval for the in-control mean, with level 99.73%for L = 3.
Time
xxxx
xxxx
x
xxxxxx
xxx
x
x
xxx
xxxx
xxx
xx
x
xxxx
xxxx
x
x
x
x
xx
x
x
x
Ingrid Hobæk Haff The use of multivariate control charts for quality control
Outline Motivation Univariate charts Multivariate charts Conclusions References
S-chart
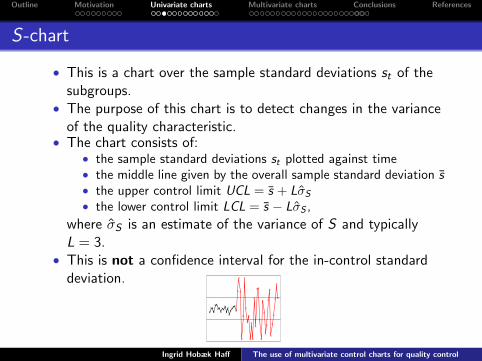
• This is a chart over the sample standard deviations st of thesubgroups.
• The purpose of this chart is to detect changes in the varianceof the quality characteristic.
• The chart consists of:• the sample standard deviations st plotted against time• the middle line given by the overall sample standard deviation s̄• the upper control limit UCL = s̄ + Lσ̂S
• the lower control limit LCL = s̄ − Lσ̂S ,
where σ̂S is an estimate of the variance of S and typicallyL = 3.
• This is not a confidence interval for the in-control standarddeviation.
Time
xxx
x
xxxx
xxx
x
xx
xxxxx
x
x
x
x
x
x
x
x
x
x
x
x
x
x
x
xx
x
x
x
x
x
x
x
x
x
x
x
x
x
x
Ingrid Hobæk Haff The use of multivariate control charts for quality control

Outline Motivation Univariate charts Multivariate charts Conclusions References
Strengths and weaknesses
• Strengths:• Shewhart-charts are easy to make and easy to interpret.• They are good at detecting large parameter shifts.
• Weaknesses:• They do not detect small and medium parameter shifts very
well.• They are quite sensitive to the model assumptions, in
particular independence between observations and normality.
• Deviations from normality may be amended by atransformation of the original data.
• To account for dependence between consecutive observations,one may
• filtrate the data with an adequate time series model andconstruct a control chart for the resulting residuals
• adjust the control limits.
Ingrid Hobæk Haff The use of multivariate control charts for quality control
Outline Motivation Univariate charts Multivariate charts Conclusions References
Sensitivity to parameter change
• The reason why Shewhart-charts have poor detection skills forsmaller shifts in the parameters is probably that they considereach observation (or subgroup) separately, instead ofaccumulating information as new observations are made.
• More specifically, the control limits from Phase I are keptconstant, instead of updating them according to newobservations.
• That is precisely what the following types of control charts tryto achieve.
Ingrid Hobæk Haff The use of multivariate control charts for quality control
Outline Motivation Univariate charts Multivariate charts Conclusions References
Cumulative sum (CUSUM) charts
• The aim of the cumulative sum (CUSUM) charts, originallydeveloped by Page (1954), is to decrease theparameter-change ARL for small to medium parameter shiftsrelative to Shewhart-charts, without substantially increasingthe in-control ARL.
• That is achieved by updating information by accumulationover past observations.
Ingrid Hobæk Haff The use of multivariate control charts for quality control

Outline Motivation Univariate charts Multivariate charts Conclusions References
CUSUM-charts for the mean
• Let
zt =x̄t − ¯̄x
σ̂X̄
for each subgroup t and
SHt = max{zt − k + SHt−1 , 0} (1)
SLt = min{zt + k + SLt−1 , 0}. (2)
• The CUSUM-chart is made by plotting• the values SHt and SLt against time• the upper control limit h for SHt
• the lower control limit −h for SLt .
Ingrid Hobæk Haff The use of multivariate control charts for quality control
Outline Motivation Univariate charts Multivariate charts Conclusions References
CUSUM-charts
• The reference value k is chosen as 1/2 the size of the meanshifts one wants to detect in σ units, typically k = 0.5.
• The limit h is chosen to optimise the ARL-properties of thechart, typically h = 4.
• CUSUM-charts are optimal for detecting mean shifts of size2kσ for k < 1.5, in terms of parameter-change ARL.
• Still, their in-control ARL is barely larger than for X̄ -charts.
Ingrid Hobæk Haff The use of multivariate control charts for quality control
Outline Motivation Univariate charts Multivariate charts Conclusions References
Exponentially weighted moving average (EWMA) charts
• Exponentially weighted moving average (EWMA) charts,originally proposed by Roberts (1959), are another option fordetecting small to medium sized parameter shifts.
• These are also based on accumulating information from pastobservations.
• Letwt = r x̄t + (1− r)wt−1
for each subgroup t, where 0 < r ≤ 1.
• Make the chart by plotting• wt against time• the upper control limit UCLt = ¯̄x + Lσ̂W ,t
• the lower control limit LCLt = ¯̄x − Lσ̂W ,t ,
where σ̂W ,t is an estimate of the standard deviation of Wt
under the assumption of normality.
Ingrid Hobæk Haff The use of multivariate control charts for quality control

Outline Motivation Univariate charts Multivariate charts Conclusions References
EWMA vs CUSUM
• The pair of parameters (r , L) is chosen to achieve the desiredARL-properties of the chart. The choice (r , L) = (1, 3) givesthe standard X̄ -chart.
• For good choices of (r , L), EWMA-charts are comparable toCUSUM-charts.
• The former are easier to interpret than the latter.
Ingrid Hobæk Haff The use of multivariate control charts for quality control
Outline Motivation Univariate charts Multivariate charts Conclusions References
Example
• As an illustration, I have constructed X̄ -, CUSUM- andEWMA-charts for a real data set.
• The data are measurements of a particular electricalcharacteristic that was involved in the assembly of electronicunits, observed in 7 strips in each of 11 ceramic sheets.
• These data were originally analysed by Ott (1949).
Ingrid Hobæk Haff The use of multivariate control charts for quality control

Outline Motivation Univariate charts Multivariate charts Conclusions References
Example
2 4 6 8 10
14.0
14.5
15.0
15.5
16.0
16.5
17.0
17.5
Time
xx
x x
x
x
x
x
x
x x
X−chart
2 4 6 8 10
−4
−2
02
4
Time
x xx
x x
x xx
x x xx x x x x
xx
x
x xx
CUSUM−chart
2 4 6 8 10
15.0
15.5
16.0
16.5
Time
x x
xx x
x xx
x x x
EWMA−chart
Ingrid Hobæk Haff The use of multivariate control charts for quality control
Outline Motivation Univariate charts Multivariate charts Conclusions References
Control charts for count data
• In some cases, the quality measures of interest concern thenumber of defective units or the number of defects on eachinspected unit.
• Then, the observed data follow a discrete distribution, that isassumed to be either the binomial or Poisson.
• Shewhart-charts are made using normal approximations.
• As for measurement data, Shewhart-charts for count datadetect large parameter shifts rather well, provided the normalapproximation is good.
• For small parameter shifts, these charts perform very poorly.
• CUSUM- and EWMA-charts can also be made for count data.
• These have better ARL-properties for smaller parameter shifts.
Ingrid Hobæk Haff The use of multivariate control charts for quality control
Outline Motivation Univariate charts Multivariate charts Conclusions References
Multivariate control charts
Ingrid Hobæk Haff The use of multivariate control charts for quality control

Outline Motivation Univariate charts Multivariate charts Conclusions References
Multivariate quality control
• In a research project on ambulatory monitoring, theMinnesota Supercomputing Institute has equipped severalsubjects with instruments that with regular intervals measureand record certain physiological variables that are risk factorsfor heart attacks and strokes.
• These variables are the systolic blood pressure, the diastolicblood pressure, the heart rate and the overall mean arterialpressure.
• The aim is to detect changes in the mean and variance of oneor several of these variables as quickly as possible.
• It should be taken into account that these are highlycorrelated.
Ingrid Hobæk Haff The use of multivariate control charts for quality control

Outline Motivation Univariate charts Multivariate charts Conclusions References
Why multivariate charts?
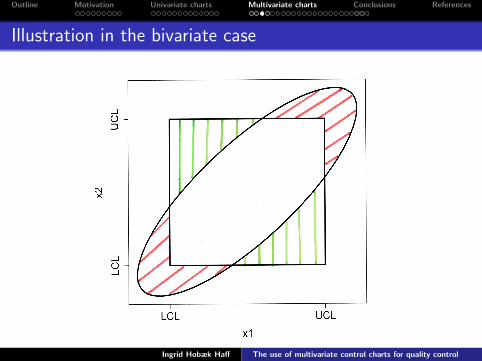
• The quality of most manufacturing processes depends onseveral, possibly related characteristics, rather than just one.
• In such cases, quality control requires the simultaneousmonitoring of all these characteristics.
• Constructing separate charts for the characteristics is notrecommended for several reasons:
1. If the characteristics are dependent, one risks both• not detecting when the process is out-of-control• falsely detecting the process as out-of-control when in fact
it is not.
2. Even when the characteristics are independent, the numberof false alarms becomes much larger.
3. If the number of characteristics is high, it is cumbersome,if not impossible, to monitor all the individual charts.
Ingrid Hobæk Haff The use of multivariate control charts for quality control
Outline Motivation Univariate charts Multivariate charts Conclusions References
Illustration in the bivariate case
Ingrid Hobæk Haff The use of multivariate control charts for quality control
Outline Motivation Univariate charts Multivariate charts Conclusions References
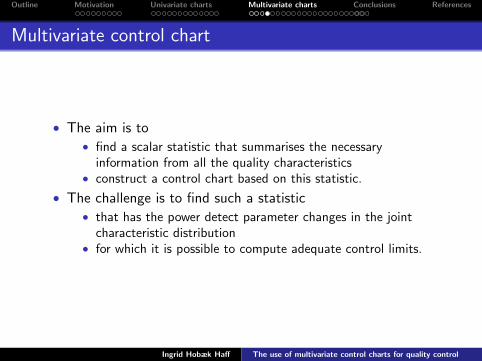
Multivariate control chart
• The aim is to• find a scalar statistic that summarises the necessary
information from all the quality characteristics• construct a control chart based on this statistic.
• The challenge is to find such a statistic• that has the power detect parameter changes in the joint
characteristic distribution• for which it is possible to compute adequate control limits.
Ingrid Hobæk Haff The use of multivariate control charts for quality control
Outline Motivation Univariate charts Multivariate charts Conclusions References
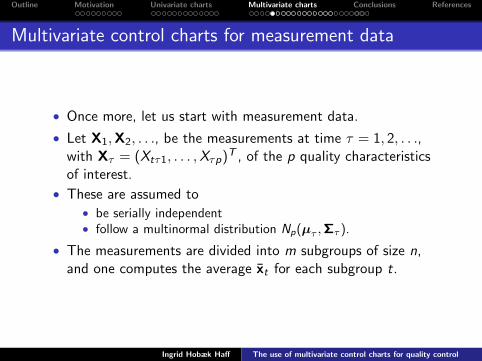
Multivariate control charts for measurement data
• Once more, let us start with measurement data.
• Let X1,X2, . . ., be the measurements at time τ = 1, 2, . . .,with Xτ = (Xtτ1, . . . ,Xτp)T , of the p quality characteristicsof interest.
• These are assumed to• be serially independent• follow a multinormal distribution Np(µτ ,Στ ).
• The measurements are divided into m subgroups of size n,and one computes the average x̄t for each subgroup t.
Ingrid Hobæk Haff The use of multivariate control charts for quality control
Outline Motivation Univariate charts Multivariate charts Conclusions References
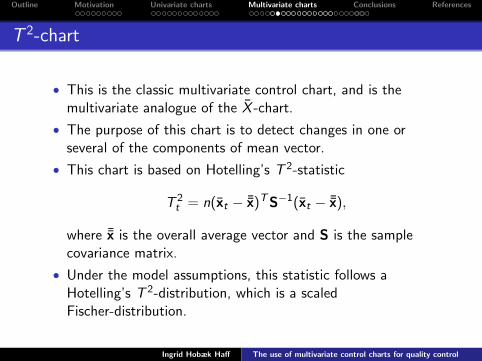
T 2-chart
• This is the classic multivariate control chart, and is themultivariate analogue of the X̄ -chart.
• The purpose of this chart is to detect changes in one orseveral of the components of mean vector.
• This chart is based on Hotelling’s T 2-statistic
T 2t = n(x̄t − ¯̄x)T S−1(x̄t − ¯̄x),
where ¯̄x is the overall average vector and S is the samplecovariance matrix.
• Under the model assumptions, this statistic follows aHotelling’s T 2-distribution, which is a scaledFischer-distribution.
Ingrid Hobæk Haff The use of multivariate control charts for quality control
Outline Motivation Univariate charts Multivariate charts Conclusions References
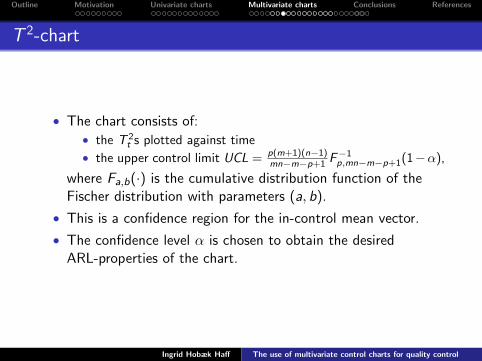
T 2-chart
• The chart consists of:• the T 2
t s plotted against time
• the upper control limit UCL = p(m+1)(n−1)mn−m−p+1 F−1
p,mn−m−p+1(1−α),
where Fa,b(·) is the cumulative distribution function of theFischer distribution with parameters (a, b).
• This is a confidence region for the in-control mean vector.
• The confidence level α is chosen to obtain the desiredARL-properties of the chart.
Ingrid Hobæk Haff The use of multivariate control charts for quality control
Outline Motivation Univariate charts Multivariate charts Conclusions References
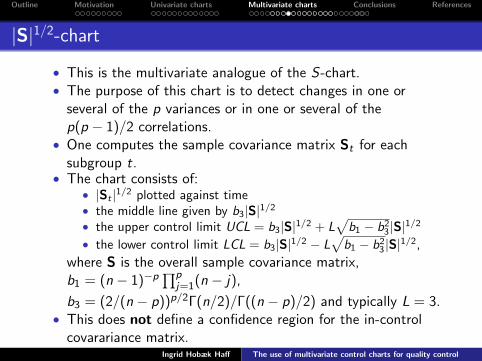
|S|1/2-chart
• This is the multivariate analogue of the S-chart.• The purpose of this chart is to detect changes in one or
several of the p variances or in one or several of thep(p − 1)/2 correlations.
• One computes the sample covariance matrix St for eachsubgroup t.
• The chart consists of:• |St |1/2 plotted against time• the middle line given by b3|S|1/2
• the upper control limit UCL = b3|S|1/2 + L√
b1 − b23|S|1/2
• the lower control limit LCL = b3|S|1/2 − L√
b1 − b23|S|1/2,
where S is the overall sample covariance matrix,b1 = (n − 1)−p
∏pj=1(n − j),
b3 = (2/(n − p))p/2Γ(n/2)/Γ((n − p)/2) and typically L = 3.• This does not define a confidence region for the in-control
covarariance matrix.Ingrid Hobæk Haff The use of multivariate control charts for quality control
Outline Motivation Univariate charts Multivariate charts Conclusions References
Strengths and weaknesses
Multivariate Shewhart-charts have the same strengths andweaknesses as the univariate equivalents:
• they detect large parameter shifts well,
• but are not effective for more subtle parameter changes.
Ingrid Hobæk Haff The use of multivariate control charts for quality control
Outline Motivation Univariate charts Multivariate charts Conclusions References
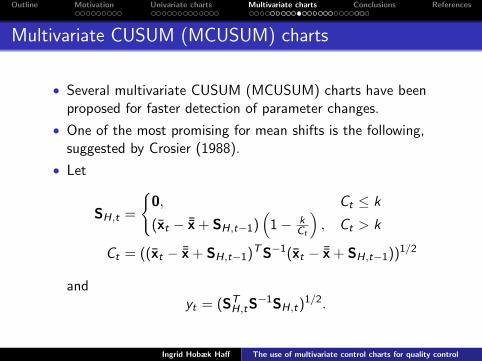
Multivariate CUSUM (MCUSUM) charts
• Several multivariate CUSUM (MCUSUM) charts have beenproposed for faster detection of parameter changes.
• One of the most promising for mean shifts is the following,suggested by Crosier (1988).
• Let
SH,t =
{0, Ct ≤ k
(x̄t − ¯̄x + SH,t−1)(
1− kCt
), Ct > k
Ct = ((x̄t − ¯̄x + SH,t−1)T S−1(x̄t − ¯̄x + SH,t−1))1/2
andyt = (ST
H,tS−1SH,t)1/2.
Ingrid Hobæk Haff The use of multivariate control charts for quality control
Outline Motivation Univariate charts Multivariate charts Conclusions References
MCUSUM-charts
• To construct the chart, plot• the yts against time• the upper control limit h.
• The reference value k determines the size of mean shifts forwhich the chart is optimal, and is typically chosen to be 0.5.
• The limit h is chosen to optimise the ARL-properties of thechart. The standard is h = 4.
Ingrid Hobæk Haff The use of multivariate control charts for quality control

Outline Motivation Univariate charts Multivariate charts Conclusions References
Multivariate EWMA (MEWMA) charts
• The first multivariate EWMA (MEWMA) chart was suggestedby Lowry et al. (1992).
• Letzt = R(x̄t − ¯̄x) + (I− R)zt−1,
where I is the p × p identity matrix and R is a p × p diagonalmatrix with diagonal entries 0 < ri ≤ 1.
• Moreover, let
w2t = zT
t Σ̂−1Z ,tzt ,
where Σ̂Z ,t is an estimate of the covariance matrix of Zt underthe assumption of a joint multivariate normal distribution.
Ingrid Hobæk Haff The use of multivariate control charts for quality control

Outline Motivation Univariate charts Multivariate charts Conclusions References
MEWMA-charts
• An MEWMA-chart for detecting changes in the mean vectoris then constructed by plotting
• the w2t s against time
• the upper control limit UCL = L.
• The parameters r1, . . . , rp and L are chosen to achieve thedesired ARL-properties of the chart.
• If r1 = . . . = rp = r , all the p quality characteristics are giventhe same weight. For r = 1, this chart is equivalent to aT 2-chart.
Ingrid Hobæk Haff The use of multivariate control charts for quality control
Outline Motivation Univariate charts Multivariate charts Conclusions References
Comparison
• As in the univariate case, the Shewhart-charts are good atdetecting large shifts in the parameters.
• On the other hand, MCUSUM- and MEWMA-charts aresuperior for smaller changes in the parameters.
• They all rely on the assumption of multinormally distributedand serially independent observations.
• If these assumptions are not fulfilled, transformations, timeseries models and adjustment of the control limits can beconsidered, but this is much more difficult in the multivariatesetting.
Ingrid Hobæk Haff The use of multivariate control charts for quality control
Outline Motivation Univariate charts Multivariate charts Conclusions References
Example
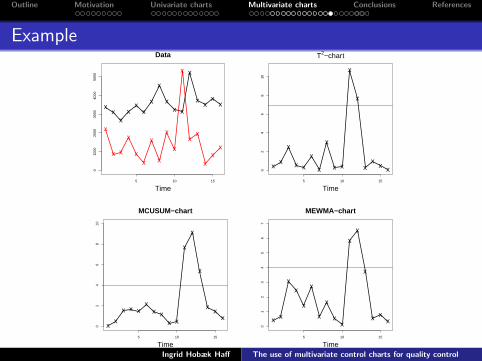
• As an illustration, I have constructed T 2-, MCUSUM- andMEWMA-charts for a real bivariate data set.
• The data consist of two different types of overtime hours forthe Madison, Wisconsin, police department.
• The first type is legal appearances and the second isextraordinary events.
• Each subgroup represents approximately half a year.
• These data were analysed by Johnson and Wichern (1998).
Ingrid Hobæk Haff The use of multivariate control charts for quality control
Outline Motivation Univariate charts Multivariate charts Conclusions References
Example
5 10 15
010
0020
0030
0040
0050
00
Time
xx
xx
xx
x
x
xx x
x
xx
xx
x
x x
x
xx
x
x
x
x
x
xx
xx
x
Data
5 10 15
02
46
810
Time
xx
x
x x
x
x
x
x x
x
x
xx
x x
T2−chart
5 10 15
02
46
810
Time
xx
x x xx
x xx x
x
x
x
xx
x
MCUSUM−chart
5 10 15
01
23
45
67
Time
x x
xx
x
x
x
x
xx
xx
x
x xx
MEWMA−chart
Ingrid Hobæk Haff The use of multivariate control charts for quality control
Outline Motivation Univariate charts Multivariate charts Conclusions References
Alternative multivariate control charts
There are several alternatives to the classic Shewhart-, MCUSUM-and MEWMA-charts, among those:
• Bayesian control charts (Wang, 2012)
• control charts based on neural networks (Psarakis, 2011)
• nonparametric control charts (Boone and Chakraborti, 2011).
Ingrid Hobæk Haff The use of multivariate control charts for quality control
Outline Motivation Univariate charts Multivariate charts Conclusions References
Multivariate charts for count data
• Multivariate charts for count data, also called multiattributecontrol charts (MACCs), have been much less studied thancharts for measurement data.
• Patel (1973) suggested multivariate extensions ofShewhart-charts for count data based on Hotelling’sT 2-statistic, using the normal approximation.
• MCUSUM- and MEWMA-charts for count data have alsobeen proposed (Yu et al., 2003; Somerville et al., 2002).
Ingrid Hobæk Haff The use of multivariate control charts for quality control
Outline Motivation Univariate charts Multivariate charts Conclusions References
Locating the sources of out-of-control signals
• One of the major challenges when using multivariate controlcharts is to identify the sources of an out-of-control signal.
• Since the joint quality characteristic distribution has beensummarised by a single statistic, there is no way of knowingwhich set of variables is responsible.
• Several approaches have been suggested, including• the construction of individual Bonferroni confidence intervals
(Alt, 1984)• analysis of the corresponding principal components (Lowry
et al., 1992)• partitioning the T 2-statistic into independent components
(Mason et al., 1994).
• However, this is still an open problem.
Ingrid Hobæk Haff The use of multivariate control charts for quality control
Outline Motivation Univariate charts Multivariate charts Conclusions References
Possible extensions
• Recall that most multivariate control charts are built on theassumption of multivariate normality.
• This implies that• all individual characteristics have the same type of marginal
distribution, namely normal• the dependence between each pair of characteristics is fully
described by the corresponding correlation.
• One possible extension is to replace the multivariate normaldistribution with another multivariate distribution.
Ingrid Hobæk Haff The use of multivariate control charts for quality control
Outline Motivation Univariate charts Multivariate charts Conclusions References
Multivariate control charts based on copulae
• Copulae are tools for constructing multivariate distributions.
• They can join univariate margins of (potentially) differenttypes.
• They may also account for non-linear dependencies betweenthe quality characteristics.
• Fatahi et al. (2012) have proposed a copula-based bivariatecontrol chart for monitoring rare events, i.e. count data.
• In the bivariate case, there are many different copula modelsto choose between.
• The selection is much more limited in higher dimensions.
• Pair-copula constructions (PCCs), that I have studied in mythesis, may be an alternative in higher dimensions.
Ingrid Hobæk Haff The use of multivariate control charts for quality control
Outline Motivation Univariate charts Multivariate charts Conclusions References
Multivariate control charts based on copulae
• In order to build a multivariate control chart based on a PCCor another type of copula, one must select an appropriatescalar statistic T (X1, . . . ,Xp).
• Once a statistic is chosen, control limits can be computed bysimulating from the estimated model.
• The main challenge is to find a statistic that• represents the joint characteristic distribution well• is able to detect changes in this distribution tolerably fast.
Ingrid Hobæk Haff The use of multivariate control charts for quality control
Outline Motivation Univariate charts Multivariate charts Conclusions References
Conclusions
Ingrid Hobæk Haff The use of multivariate control charts for quality control
Outline Motivation Univariate charts Multivariate charts Conclusions References
Summing up
• Control charts are one of the most important tools for qualitycontrol.
• They are widely used, also for non-manufacturingapplications, for instance in public health.
• In practice, the quality of most processes depends on several,possibly related quality characteristics, rather than just one.
• This requires multivariate control charts.
• Two of the main challenges related to the use of multivariatecontrol charts are:
• finding an adequate scalar statistic that summarises the jointcharacteristic distribution
• locating the sources of out-of-control signals.
Ingrid Hobæk Haff The use of multivariate control charts for quality control

Outline Motivation Univariate charts Multivariate charts Conclusions References
Other issues
• There are many important issues concerning the use of controlcharts, that I have not mentioned.
• These include• the impact of measurement errors• choosing the sample/subgroup size• process capability (six-sigma)• robust estimation of the parameters.
Ingrid Hobæk Haff The use of multivariate control charts for quality control
Outline Motivation Univariate charts Multivariate charts Conclusions References
Control charts in the future
• With the development of technology for acquiring data andthe increasing computing power, multivariate control chartsare likely to be even more relevant in the future.
• Most of the proposed methods so far are built on theassumption of multinormally distributed data.
• Natural extensions of control chart methods include the use ofother, more flexible multivariate distributions, for instancebuilt on copulae or even pair-copula constructions.
Ingrid Hobæk Haff The use of multivariate control charts for quality control
Outline Motivation Univariate charts Multivariate charts Conclusions References
Alt, F. (1984). Multivarate quality control. In Kotz, S., Johnson, N., and Read, C.,editors, The Encyclopedia of Statistical Sciences. John Wiley, New York.
Anderson, M. and Thompson, A. (2004). Multivariate control charts for ecological andenvironmental monitoring. Ecological Applications, 14:1921–1935.
Boone, J. and Chakraborti, S. (2011). Two simple shewhart-type multivariatenonparametric control charts. Applied Stochastic Models in Business and Industry.DOI: 10.1002/asmb.900.
Charnes, J. M. and Gitlow, H. (1995). Using control charts to corroborate bribery injai alai. The American Statistician, 49:386–389.
Clark, T. and Clark, A. (1997). Continuous improvement on the free throw line.Quality Progress, 30:78–80.
Crosier, R. (1988). Multivariate generalizations of cumulative sum quality controlschemes. Technometrics, 30:291–303.
Fatahi, A., Noorossana, R., Dokouhaki, P., and Moghaddam, B. (2012). Copula-basedbivariate zip control chart for monitoring rare events. Communications in Statistics- Theory and Methods, 41:2699–2716.
Johnson, R. and Wichern, D. (1998). Applied Multivariate Statistical Analysis.Prentice Hall, New Jersey, 4th edition edition.
Lowry, C. A., Woodall, W. H., Champ, C. W., and Rigdon, S. E. (1992). Amultivariate exponentially weighted moving average chart. Technometrics,34:46–53.
Mason, R., Tracy, N., and Young, J. (1994). Use of hotelling’s t2 statistic inmultivariate control charts. Presented at the Joint Statistical Meetings, SanFrancisco.
Ingrid Hobæk Haff The use of multivariate control charts for quality control
Outline Motivation Univariate charts Multivariate charts Conclusions References
Mergen, E., Grant, D., and Widrick, M. (2000). Quality management applied tohigher education. Total Quality Management, 11:345–352.
Ott, E. (1949). Variables control charts in production research. Industrial QualityControl, 6:30–31.
Page, E. (1954). Continuous inspection scheme. Biometrika, 41:100–115.
Patel, H. (1973). Quality control methods for multivariate binomial and poissondistributions. Technometrics, 15:103–112.
Psarakis, S. (2011). The use of neural networks in statistical process control charts.Quality and Reliability Engineering Journal. DOI: 10.1002/qre.1227.
Roberts, S. (1959). Control chart tests based on geometric moving averages.Technometrics, 1:239–250.
Sellick, J. J. (1993). The use of statistical process control charts in hospitalepidemiology. Infection Control and Hospital Epidemiology, 14:649–656.
Somerville, S., Montgomery, D., and Runger, G. (2002). Filtering and smoothingmethods for mixed particle count distributions. International Journal of ProductionResearch, 40:2991–3013.
Theodossiou, P. (1993). Predicting the shifts in the mean of a multivariate time seriesprocess: an application to predicting business failures. Journal of the AmericanStatistical Association, 88:441–449.
Wang, W. (2012). A simulation-based multivariate bayesian control chart for real timecondition-based maintenance of complex systems. European Journal of OperationalResearch, 218:726–734.
Yu, F., Low, C., and Cheng, S. (2003). Design for an sprt control scheme based onlinguistic data. International Journal of Production Research, 41:1299–1309.
Ingrid Hobæk Haff The use of multivariate control charts for quality control