Embed Size (px)
Citation preview
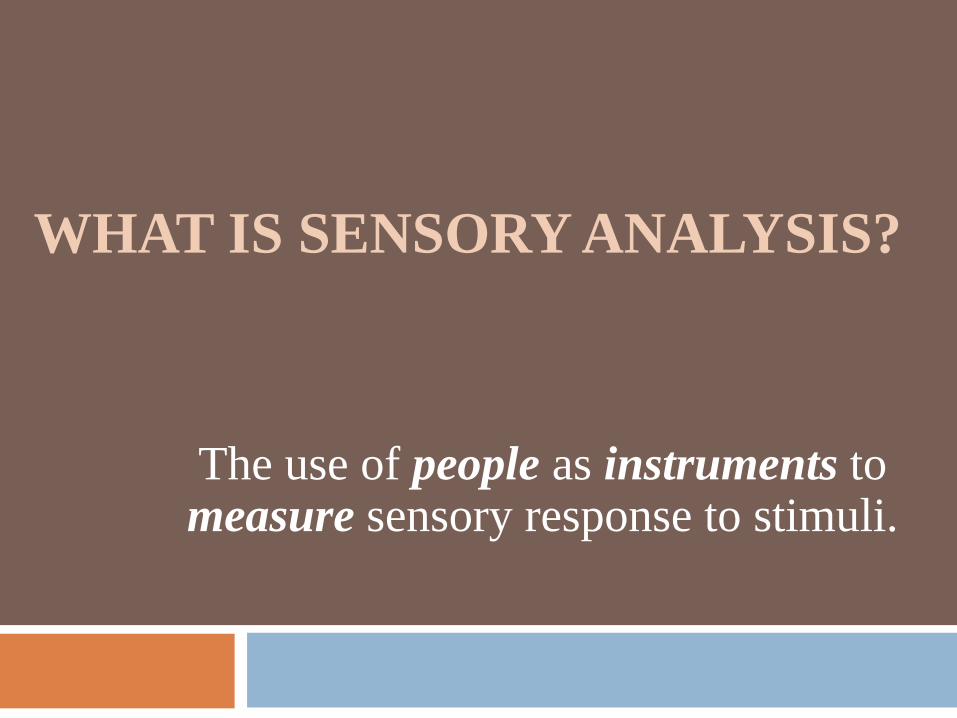
WHAT IS SENSORY ANALYSIS
The use of people as instruments to measure sensory response to stimuli
Flavor defined by Morton Meilgaard
ldquothe term used to describe the complex interaction of taste smell and chemical irritation of foods in the mouth that add to its mouth-feel such as carbonation the burn of chili peppers or the coolness of mentholrdquo
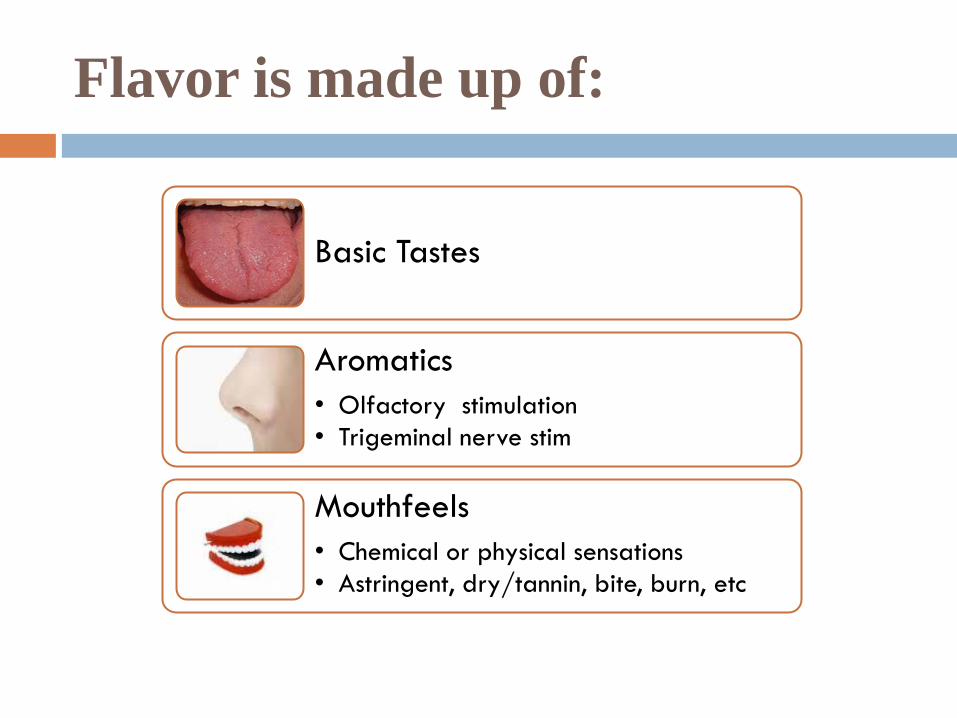
Flavor is made up of
Basic Tastes
Aromaticsbull Olfactory stimulationbull Trigeminal nerve stim
Mouthfeelsbull Chemical or physical sensationsbull Astringent drytannin bite burn etc
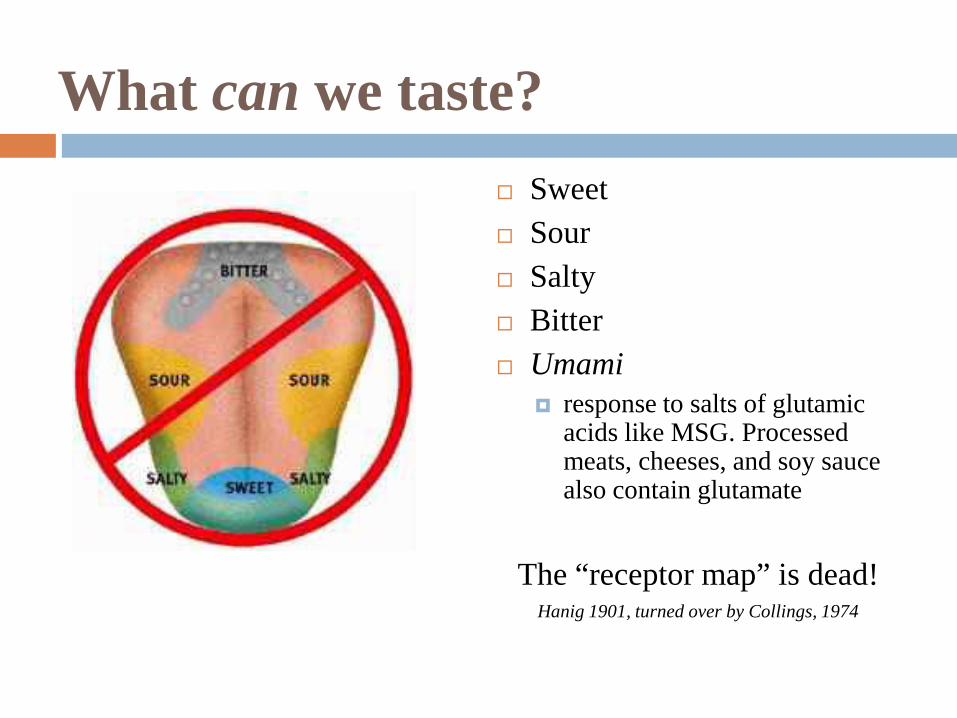
What can we taste Sweet Sour Salty Bitter Umami
response to salts of glutamic acids like MSG Processed meats cheeses and soy sauce also contain glutamate
The ldquoreceptor maprdquo is dead Hanig 1901 turned over by Collings 1974
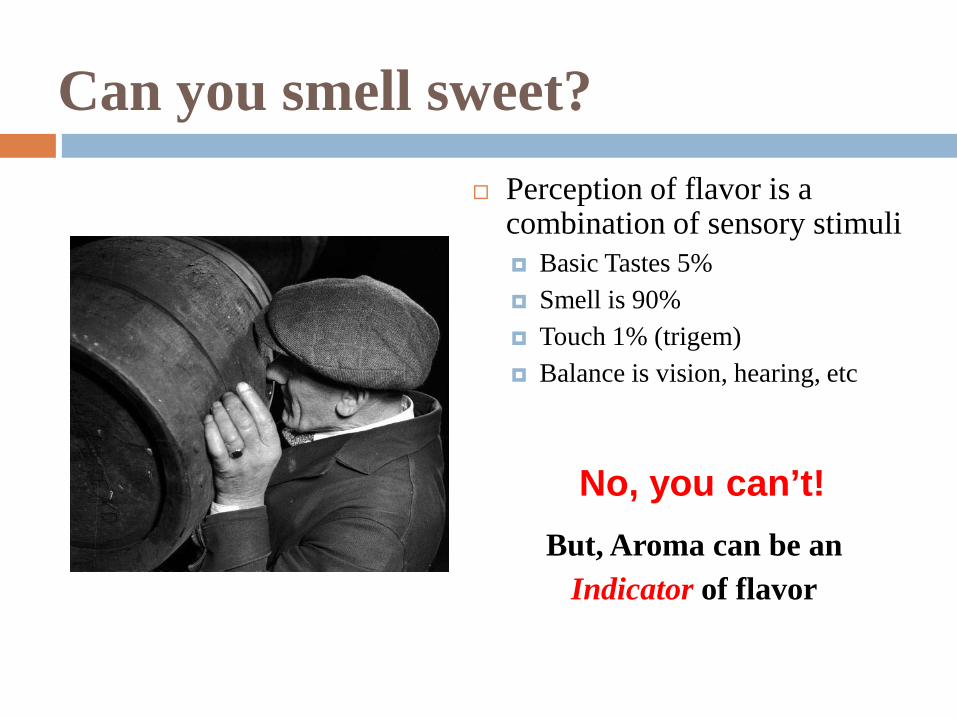
Can you smell sweet Perception of flavor is a
combination of sensory stimuli Basic Tastes 5 Smell is 90 Touch 1 (trigem) Balance is vision hearing etc
But Aroma can be an Indicator of flavor
No you canrsquot
Trigeminal amp Tactile Sensation
Carbonation Related to level partial pressure Pain Can increase perception of bitterness
Fullness Function of residual solids Dextrins and Oligosaccharides (complex sugars)
After feel Astringency Pain (chili peppers)
Aroma The human nose is very sensitive
More sensitive than a gas chromatograph
Perception changes based on situation
Smell with sniffs in short burst for 1-2 seconds After this receptors become saturated and can require 20 seconds +- to reset
Donrsquot forget to exhale
The Flavor Unit Concept introduced by Dr Morton Meilgaard
Recognized 100rsquos of compounds in beer There are different thresholds for chemicals we can taste
Example Ethanol 50 grams Liter (50000+ ppm) S-Methyl Mercaptan 4 nanograms per Liter
10-9 grams per Liter(0000001 ppm)
Need a way to compare One flavor unit = the starting threshold that a compound can be detected by
the olfactory Ethanol at 50 gramsLiter = 1 flavor unit S-Methyl Mercaptan at 8 nanograms per Liter = 2 flavor units
Allows apples to apples comparison
BASIC TRAININGWhat it comes down to is everyone who touches your beer should know how to talk about your beer
WHO
Beer school for all new hires Brewer Cellar Lab Packaging Sales Marketing Distributors Festivals Tours Promotions
HOW and WHEN Schedule Panels as Meetings Keep Consistent - same time and location Goal is Regular Attendance
Work it in so people look forward to it End of Meetings Shift Changes Break in the Day
BEER SCHOOL
WHAT MAKES YOUR BEERS SPECIAL
What is in it Appearance Aroma Taste Flavor Characteristics Aftertaste Style Alcohol IBU Availability Food Pairings
YOUR BEER
Know the aroma and flavor characteristics of all your beers MALTS HOPS YEASTS SPICES
Whatever is in it have available for reference
Vocabulary amp Recognition
Use reference standards ie spikes aroma vials malt hops
Repetition is the key to learning Donrsquot Rush It Build vocabulary slowly to take pressure off
Spikes These are your Lego Blocks
Teaching What and Why
Common off aroma flavor checks Diacetyl Rests
Aroma and tastings through-outthe brewing processes From Wort to Package
Technical Feedback True to Brand Consistency
BUILDING BLOCKS
No Pressure Panels Build up your own Attribute Library Everyone Participates Good Motivator
Lower threshold levels Different Styles Oxidation Stages Brand Recognition
Flavor Wheel
SETTING UP FOR SUCCESSTeach the Basics and Share as Much as Possible
APPEARANCE (Clarity and Chill Haze)AROMA
SERVE AT AN APPROPRIATE DRINKING TEMPERATURE
TASTE (Donrsquot DRINK)
Scoring SystemAFTERTASTE
We donrsquot spit beerBLIND TASTING (Fair and Good Practice)LIMIT THE NUMBER OF BEERS TO AVOID TASTEBUD BURNOUT
PALATE CLEANSERS (Plain Crackers and Water)
LEARN TEACH TO NOT FINISH THE WHOLE SAMPLE
MOTIVATION
Change things up variety Different types of PanelsAroma Vials Spikes Triangle Tests Preference
Everyone learns differently Positive Rewards Feedback and Guidance SERIOUS BUSINESS BUT FUN
TRAINING VALIDATION AND FEEDBACK OF A
PRODUCTIONMARKET RELEASE PANEL
Cathy Haddock
Sensory Specialist Quality Assurance Dept Sierra Nevada Brewing Co
CBC Annual Meeting 2011
Why is it important to have a trained and validated panel
A trained sensory panel is a valuable instrument each taster being a unique tool in the toolboxbull Can not rely on just 1 opinion Everyone has their own
sensitivities
Example Brew master who is blind to diacetyl is the sole taster for release of product to market Not good
What is a Production Release Panel
Production Release Panel-a trained panel that evaluates product to be release to market
Panel can use various quality control tests such as a go-no go inout yesno passfail quality ratings etc format
Training Process-Production Release Panel
If you are on the Production Release Panel you must be trained and validated
on off flavor recognition and brand attribute
What to train with
Train using spiking compounds Flavor Activhellipquick easy good shelf life but
costly cost varies per compound Seibel Training Kithellipquick easy shorter shelf life
(2 months-refrigerated) 25 vials for $180 Sigma Aldrich Flavor and Fragrances Kit-some
dilution prep work 22 vials for $473 No DMS or Acetaldehyde Good shelf life
Next Steps
Identify what key flavors and off flavors are important and train on those compounds
Recommend spiking and training with a flagship brand as well as any other brands if time and expense is available
A spiking in one brand can come across different in another brand
Types of Training and Test Methods
Types of TrainingValidation Methods Off Flavor Recognition Testing-present panelist with spiked
beer samples for evaluation and identification Recommend 6 samples in a session
Brand Attribute-training with pantry reference standards one-on-one and group exercises
Sensitivity Threshold Testing-provides training on how compounds are perceived at various concentrations as well as gain insight on panelist sensitivities
Tasters report from test session-taste panelists are known by a 4 digit code
667 667 667
833 833 833
1000 1000 1000 1000
00
100
200
300
400
500
600
700
800
900
1000Flavor Activ Friday-12-17-10
Panel average=850
Off Flavor Recognition- Spreadsheet
8132010 8272010 10152010 10222010 1152010 11192010 1232010 12172010 2010 avg 2009 avg 2009
2010avg626 726 acetaldehyde 395 558750 810 acetic acid 918 840
10000 972 alkaline 769 692750 681 butyric acid 597 637
538 capryllic acid 804 DIV08750 909 800 catty 917 7658750 889 900 778 chlorophenol 825 8098750 1000 863 diacetyl 972 975
6250 754 dms 781 5928750 1000 958 earthy 817 804
6250 543 ethyl butyrate 726 6808750 900 911 ethyl hexanoate 867 834
452 freshly cut grass 625 828570 633 geraniol 723 745
7500 444 486 grainy 570 4225000 455 594 indole 586 309
8750 778 769 isoamyl acetate 827 8136250 818 792 isovaleric acid 688 743
3750 444 700 491 leathery 597 50910000 1000 1000 lightstruck 944 972
3750 182 375 mercaptan 430 3237500 909 896 metallic 822 8813750 800 533 musty 695 629
2500 375 392 onion 361 3596250 875 800 852 papery 869 874
626 774 phenolic 614 3733750 386 plastic 235 335
5000 545 639 sour 642 4655000 635 lactic acid 666 6665000 687 ethyl acetate 650 650
929 methional 817 817500 sulphitic 625 584
6250 6875 6250 7053 6752 7592 6363 8500 703 642 648
easy 75-100mod 56-75 hard 0-55
Charts allow visualization of taste panel recognition abilities
The beers that are bottle conditioned at 62 deg F whether normal or elevated yeast pitch measured having higher levels of diacetyl
Brand Attribute Training
Determine what are the key attributes in your brand and associated descriptors
Find Reference Standards to demonstrate those attributes
Example Fruit note in Sierra Nevada Pale Ale is our yeast make yeast cake and serve side by side with the beer
As a Panel discuss changes in those attributes in different ages of beer
Threshold Testing-ASBC Method of Ascending Limits
bull 6 triangle testsbull Go from lowest to highest concentration with threshold
in the middlebull Test samples increase in concentration usually 2-foldbull Get Best Estimate Threshold of group geometric
mean of the highest concentration missed and next higher (adjacent) concentration
bull Get an individual and panel BET average bull Take into account amount of compound in beer matrix
Data collected at 2005 ASBC workshop by Everett Boiling
Number of Assessors 26Dilution Factor 2
6 Sample Form of Test Simple Aroma Only
0375 075 15 3 6 121 taster 1 N N Y Y Y Y 106 00262 taster 2 Y Y Y Y Y Y 027 -05763 taster 3 Y Y Y Y Y Y 027 -05764 taster 4 N Y N Y Y Y 212 03275 taster 5 N N N N Y Y 424 0628 fruity banana6 taster 6 N N Y Y Y Y 106 0026 banana7 taster 7 Y N Y Y Y Y 106 00268 taster 8 N N N Y Y Y 212 03279 taster 9 N N N Y Y Y 212 0327
10 taster 10 Y N N Y Y Y 212 032711 taster 11 N N Y Y Y Y 106 002612 taster 12 N N N Y Y Y 212 032713 taster 13 Y Y Y Y Y Y 027 -057614 taster 14 Y Y Y Y Y Y 027 -057615 taster 15 N Y Y Y Y Y 053 -027516 taster 16 N N Y Y Y Y 106 002617 taster 17 N Y N Y Y Y 212 032718 taster 18 N N Y Y Y Y 106 0026 Isoamyl acetate19 taster 19 N Y N N Y Y 424 0628 fruity banana20 taster 20 N N N Y Y Y 212 0327 fruity pear drop21 taster 21 N N N Y Y Y 212 032722 taster 22 N Y Y Y Y Y 053 -027523 taster 23 N N N N Y Y 424 062824 taster 24 N Y Y Y Y Y 053 -027525 taster 25 N N Y Y Y Y 106 002626 taster 26 Y Y Y Y Y Y 027 -0576
rving rder
NameConcentration ppm Individual
BET ppmThreshold Log 10
Description
THRESHOLD OF ISOAMYL ACETATEProcedure ASBC Sensory Analysis - 9 (Ascending Method of Limits)
Medium Miller High LifeScale Steps Isoamyl Acetate Aldrich Cat 112674 98
Statistical Summary
Group Best Estimate Threshold (BET) ppm = 109Sum Log 10 = 1114
Average Log 10 = 0056
Graph of Individual Tasters BET
More than Performance Feedbackhellipsay Thank You
It takes a time and commitment to be on panel A lot of training is involved
Say ldquoThank yourdquo with a helliphelliphellip Post-sensory treatsnack Rewards Program-gift certificates prizes etc
(Frequent Tasters Reward Program) End of the year parties Positive Feedback-be a cheer leader Free Beer
SENSORY STATISTICSTRANSFORM YOUR SUBJECTIVE
TASTE PANEL INTO AN OBJECTIVE MEASUREMENT
Beerrsquos job is to deliver 10 minutes of pleasurehellip So we need to
Understand your brandrsquos flavor profile TTB (trueness to brand) Know the difference between normal process variation process trends andor anomalies Consistency Identify and classify flavors and determine their desired levels for a given brand Then pinpoint their origins from grain to glassprocessing
Provide specific- technical- actionable flavor interpretations to help production correct flaws identify trends and better control the outcome of each brew
Keep it simple thorough repeatable reproducible test method and data analysis
What do I do with my production release data results
How bad is lsquotoo badrsquo Sellable vs non-sellable finished product
What is normalnatural process variation What is out of specification What warrants investigationHow can you avoid flavor shift over time Is the product defect enough to cause the consumer to
notice Complain RecallNeed to Move away from grading 1 out of 10 panelist (no go)
ne 90 A What about 3 of 20 85 B- 3 diacetyl comments
Move away from tests that generate limiting unactionable unrsquominersquoable data ndash scaling ttt Final score = 16- 76
(P)robability control charts-sleep well through the power of simple statistics
The perfect tool for Sensory Finished Product Release Panel Analysis
A p-chart (probability chart) is an attributes (ttb or not ttb) control chart that consists of points collected and plotted with the controlnatural process limits from data in subgroups of varying sizes (different number of and panelists every panel)
Think of the limits as the lsquovoicersquo of your process P-charts monitors normal variations whether your process is stable and predictable and determines whether a particular sample falls within the normal variation or falls outside and needs to be examined further Can also monitor the effects of process improvement theories (test brew validation) or spikes (panel validation)
P-charts can easily be created using simple excel add-ins that are pretty cheap and easy
Production Release Ballot and Data Entry
Check it out-probability charts in actionhellip Looks like your normal data entry spreadsheet
O
isual
aroma
lavor
outhfeel
verall
VAFM
Sample 1 2 3 4 5 6 7 8 9
CO
MM
EN
TS
Normal process variation
p-Chart
0000
0050
0100
0150
0200
0250
0300
0350
0400
0450
1 2 3 4 5 6 7 8 9 10 11 12 13 14 15 16 17 18 19 20 21 22 23 24 25
Observations (Sample Number)
Prop
ortio
n
Proportion p-bar UCL LCL
UCL
LCL
Out of Control data patterns- alert Your process is changing behavior
Is your panel lsquoplugged inrsquo Validation via spiked sample
aroma
tasteaftertaste
mouthfeelbody
overall flavor
clarity trend
Dec
ision
tree
-FY
IA
lert
-tr
end
In
vest
igat
e r
epor
t do
cum
ent
follo
w u
p
overall flavor out of control-not true to brand
diacetyl comments
Each lsquoout of specrsquo scenario needs to flow like this hellip Closed Loop Corrective Action Plan
Identify ProblemAttribute (diacetyl comments and red OOC in aroma and overall)
Assignable Cause (slow fermentation t-down too early)
Corrective Action (flag tank measure diacetyl before t-down)
Hold the gains (change SOGs train on new procedure)
Taste Panel vs Sensory Program1 ID process method measurement owners
2 Initial Measurement Validation (MSA)
3 Implement and maintain applicable SOGrsquos
4 Training Protocol amp Records
5 Establish appropriate charts (Pcharts)
6 On going Validation Method
7 Calibration
8 OOCOOS Action Plan DevelopmentDecision Trees
9 First Pass Analysis- using OOCOOS Action Plan
10 Document First Pass Analysis in control chart
11 Cleaning the data set- Brewmaster Ready
12 TrendsPareto Analysis and Recommendations
13 Present in Quality Meeting
14 Transition to ProjectInvestigation ideation
P CHART ADD-IN WEBSITES
bullhttpwwwisixsigmacomlibrarycontentn070223aaspbullhttpwwwqimacroscomqiwizardpcharthtmlbullhttpwwwpqsystemscomproductsSPCSQCpackbullwwwXLSTATcom
bullAll materials are sole property of New Belgium Brewing Company and should not be copied reproduced or used without permission
Flavor defined by Morton Meilgaard
ldquothe term used to describe the complex interaction of taste smell and chemical irritation of foods in the mouth that add to its mouth-feel such as carbonation the burn of chili peppers or the coolness of mentholrdquo
Flavor is made up of
Basic Tastes
Aromaticsbull Olfactory stimulationbull Trigeminal nerve stim
Mouthfeelsbull Chemical or physical sensationsbull Astringent drytannin bite burn etc
What can we taste Sweet Sour Salty Bitter Umami
response to salts of glutamic acids like MSG Processed meats cheeses and soy sauce also contain glutamate
The ldquoreceptor maprdquo is dead Hanig 1901 turned over by Collings 1974
Can you smell sweet Perception of flavor is a
combination of sensory stimuli Basic Tastes 5 Smell is 90 Touch 1 (trigem) Balance is vision hearing etc
But Aroma can be an Indicator of flavor
No you canrsquot
Trigeminal amp Tactile Sensation
Carbonation Related to level partial pressure Pain Can increase perception of bitterness
Fullness Function of residual solids Dextrins and Oligosaccharides (complex sugars)
After feel Astringency Pain (chili peppers)
Aroma The human nose is very sensitive
More sensitive than a gas chromatograph
Perception changes based on situation
Smell with sniffs in short burst for 1-2 seconds After this receptors become saturated and can require 20 seconds +- to reset
Donrsquot forget to exhale
The Flavor Unit Concept introduced by Dr Morton Meilgaard
Recognized 100rsquos of compounds in beer There are different thresholds for chemicals we can taste
Example Ethanol 50 grams Liter (50000+ ppm) S-Methyl Mercaptan 4 nanograms per Liter
10-9 grams per Liter(0000001 ppm)
Need a way to compare One flavor unit = the starting threshold that a compound can be detected by
the olfactory Ethanol at 50 gramsLiter = 1 flavor unit S-Methyl Mercaptan at 8 nanograms per Liter = 2 flavor units
Allows apples to apples comparison
BASIC TRAININGWhat it comes down to is everyone who touches your beer should know how to talk about your beer
WHO
Beer school for all new hires Brewer Cellar Lab Packaging Sales Marketing Distributors Festivals Tours Promotions
HOW and WHEN Schedule Panels as Meetings Keep Consistent - same time and location Goal is Regular Attendance
Work it in so people look forward to it End of Meetings Shift Changes Break in the Day
BEER SCHOOL
WHAT MAKES YOUR BEERS SPECIAL
What is in it Appearance Aroma Taste Flavor Characteristics Aftertaste Style Alcohol IBU Availability Food Pairings
YOUR BEER
Know the aroma and flavor characteristics of all your beers MALTS HOPS YEASTS SPICES
Whatever is in it have available for reference
Vocabulary amp Recognition
Use reference standards ie spikes aroma vials malt hops
Repetition is the key to learning Donrsquot Rush It Build vocabulary slowly to take pressure off
Spikes These are your Lego Blocks
Teaching What and Why
Common off aroma flavor checks Diacetyl Rests
Aroma and tastings through-outthe brewing processes From Wort to Package
Technical Feedback True to Brand Consistency
BUILDING BLOCKS
No Pressure Panels Build up your own Attribute Library Everyone Participates Good Motivator
Lower threshold levels Different Styles Oxidation Stages Brand Recognition
Flavor Wheel
SETTING UP FOR SUCCESSTeach the Basics and Share as Much as Possible
APPEARANCE (Clarity and Chill Haze)AROMA
SERVE AT AN APPROPRIATE DRINKING TEMPERATURE
TASTE (Donrsquot DRINK)
Scoring SystemAFTERTASTE
We donrsquot spit beerBLIND TASTING (Fair and Good Practice)LIMIT THE NUMBER OF BEERS TO AVOID TASTEBUD BURNOUT
PALATE CLEANSERS (Plain Crackers and Water)
LEARN TEACH TO NOT FINISH THE WHOLE SAMPLE
MOTIVATION
Change things up variety Different types of PanelsAroma Vials Spikes Triangle Tests Preference
Everyone learns differently Positive Rewards Feedback and Guidance SERIOUS BUSINESS BUT FUN
TRAINING VALIDATION AND FEEDBACK OF A
PRODUCTIONMARKET RELEASE PANEL
Cathy Haddock
Sensory Specialist Quality Assurance Dept Sierra Nevada Brewing Co
CBC Annual Meeting 2011
Why is it important to have a trained and validated panel
A trained sensory panel is a valuable instrument each taster being a unique tool in the toolboxbull Can not rely on just 1 opinion Everyone has their own
sensitivities
Example Brew master who is blind to diacetyl is the sole taster for release of product to market Not good
What is a Production Release Panel
Production Release Panel-a trained panel that evaluates product to be release to market
Panel can use various quality control tests such as a go-no go inout yesno passfail quality ratings etc format
Training Process-Production Release Panel
If you are on the Production Release Panel you must be trained and validated
on off flavor recognition and brand attribute
What to train with
Train using spiking compounds Flavor Activhellipquick easy good shelf life but
costly cost varies per compound Seibel Training Kithellipquick easy shorter shelf life
(2 months-refrigerated) 25 vials for $180 Sigma Aldrich Flavor and Fragrances Kit-some
dilution prep work 22 vials for $473 No DMS or Acetaldehyde Good shelf life
Next Steps
Identify what key flavors and off flavors are important and train on those compounds
Recommend spiking and training with a flagship brand as well as any other brands if time and expense is available
A spiking in one brand can come across different in another brand
Types of Training and Test Methods
Types of TrainingValidation Methods Off Flavor Recognition Testing-present panelist with spiked
beer samples for evaluation and identification Recommend 6 samples in a session
Brand Attribute-training with pantry reference standards one-on-one and group exercises
Sensitivity Threshold Testing-provides training on how compounds are perceived at various concentrations as well as gain insight on panelist sensitivities
Tasters report from test session-taste panelists are known by a 4 digit code
667 667 667
833 833 833
1000 1000 1000 1000
00
100
200
300
400
500
600
700
800
900
1000Flavor Activ Friday-12-17-10
Panel average=850
Off Flavor Recognition- Spreadsheet
8132010 8272010 10152010 10222010 1152010 11192010 1232010 12172010 2010 avg 2009 avg 2009
2010avg626 726 acetaldehyde 395 558750 810 acetic acid 918 840
10000 972 alkaline 769 692750 681 butyric acid 597 637
538 capryllic acid 804 DIV08750 909 800 catty 917 7658750 889 900 778 chlorophenol 825 8098750 1000 863 diacetyl 972 975
6250 754 dms 781 5928750 1000 958 earthy 817 804
6250 543 ethyl butyrate 726 6808750 900 911 ethyl hexanoate 867 834
452 freshly cut grass 625 828570 633 geraniol 723 745
7500 444 486 grainy 570 4225000 455 594 indole 586 309
8750 778 769 isoamyl acetate 827 8136250 818 792 isovaleric acid 688 743
3750 444 700 491 leathery 597 50910000 1000 1000 lightstruck 944 972
3750 182 375 mercaptan 430 3237500 909 896 metallic 822 8813750 800 533 musty 695 629
2500 375 392 onion 361 3596250 875 800 852 papery 869 874
626 774 phenolic 614 3733750 386 plastic 235 335
5000 545 639 sour 642 4655000 635 lactic acid 666 6665000 687 ethyl acetate 650 650
929 methional 817 817500 sulphitic 625 584
6250 6875 6250 7053 6752 7592 6363 8500 703 642 648
easy 75-100mod 56-75 hard 0-55
Charts allow visualization of taste panel recognition abilities
The beers that are bottle conditioned at 62 deg F whether normal or elevated yeast pitch measured having higher levels of diacetyl
Brand Attribute Training
Determine what are the key attributes in your brand and associated descriptors
Find Reference Standards to demonstrate those attributes
Example Fruit note in Sierra Nevada Pale Ale is our yeast make yeast cake and serve side by side with the beer
As a Panel discuss changes in those attributes in different ages of beer
Threshold Testing-ASBC Method of Ascending Limits
bull 6 triangle testsbull Go from lowest to highest concentration with threshold
in the middlebull Test samples increase in concentration usually 2-foldbull Get Best Estimate Threshold of group geometric
mean of the highest concentration missed and next higher (adjacent) concentration
bull Get an individual and panel BET average bull Take into account amount of compound in beer matrix
Data collected at 2005 ASBC workshop by Everett Boiling
Number of Assessors 26Dilution Factor 2
6 Sample Form of Test Simple Aroma Only
0375 075 15 3 6 121 taster 1 N N Y Y Y Y 106 00262 taster 2 Y Y Y Y Y Y 027 -05763 taster 3 Y Y Y Y Y Y 027 -05764 taster 4 N Y N Y Y Y 212 03275 taster 5 N N N N Y Y 424 0628 fruity banana6 taster 6 N N Y Y Y Y 106 0026 banana7 taster 7 Y N Y Y Y Y 106 00268 taster 8 N N N Y Y Y 212 03279 taster 9 N N N Y Y Y 212 0327
10 taster 10 Y N N Y Y Y 212 032711 taster 11 N N Y Y Y Y 106 002612 taster 12 N N N Y Y Y 212 032713 taster 13 Y Y Y Y Y Y 027 -057614 taster 14 Y Y Y Y Y Y 027 -057615 taster 15 N Y Y Y Y Y 053 -027516 taster 16 N N Y Y Y Y 106 002617 taster 17 N Y N Y Y Y 212 032718 taster 18 N N Y Y Y Y 106 0026 Isoamyl acetate19 taster 19 N Y N N Y Y 424 0628 fruity banana20 taster 20 N N N Y Y Y 212 0327 fruity pear drop21 taster 21 N N N Y Y Y 212 032722 taster 22 N Y Y Y Y Y 053 -027523 taster 23 N N N N Y Y 424 062824 taster 24 N Y Y Y Y Y 053 -027525 taster 25 N N Y Y Y Y 106 002626 taster 26 Y Y Y Y Y Y 027 -0576
rving rder
NameConcentration ppm Individual
BET ppmThreshold Log 10
Description
THRESHOLD OF ISOAMYL ACETATEProcedure ASBC Sensory Analysis - 9 (Ascending Method of Limits)
Medium Miller High LifeScale Steps Isoamyl Acetate Aldrich Cat 112674 98
Statistical Summary
Group Best Estimate Threshold (BET) ppm = 109Sum Log 10 = 1114
Average Log 10 = 0056
Graph of Individual Tasters BET
More than Performance Feedbackhellipsay Thank You
It takes a time and commitment to be on panel A lot of training is involved
Say ldquoThank yourdquo with a helliphelliphellip Post-sensory treatsnack Rewards Program-gift certificates prizes etc
(Frequent Tasters Reward Program) End of the year parties Positive Feedback-be a cheer leader Free Beer
SENSORY STATISTICSTRANSFORM YOUR SUBJECTIVE
TASTE PANEL INTO AN OBJECTIVE MEASUREMENT
Beerrsquos job is to deliver 10 minutes of pleasurehellip So we need to
Understand your brandrsquos flavor profile TTB (trueness to brand) Know the difference between normal process variation process trends andor anomalies Consistency Identify and classify flavors and determine their desired levels for a given brand Then pinpoint their origins from grain to glassprocessing
Provide specific- technical- actionable flavor interpretations to help production correct flaws identify trends and better control the outcome of each brew
Keep it simple thorough repeatable reproducible test method and data analysis
What do I do with my production release data results
How bad is lsquotoo badrsquo Sellable vs non-sellable finished product
What is normalnatural process variation What is out of specification What warrants investigationHow can you avoid flavor shift over time Is the product defect enough to cause the consumer to
notice Complain RecallNeed to Move away from grading 1 out of 10 panelist (no go)
ne 90 A What about 3 of 20 85 B- 3 diacetyl comments
Move away from tests that generate limiting unactionable unrsquominersquoable data ndash scaling ttt Final score = 16- 76
(P)robability control charts-sleep well through the power of simple statistics
The perfect tool for Sensory Finished Product Release Panel Analysis
A p-chart (probability chart) is an attributes (ttb or not ttb) control chart that consists of points collected and plotted with the controlnatural process limits from data in subgroups of varying sizes (different number of and panelists every panel)
Think of the limits as the lsquovoicersquo of your process P-charts monitors normal variations whether your process is stable and predictable and determines whether a particular sample falls within the normal variation or falls outside and needs to be examined further Can also monitor the effects of process improvement theories (test brew validation) or spikes (panel validation)
P-charts can easily be created using simple excel add-ins that are pretty cheap and easy
Production Release Ballot and Data Entry
Check it out-probability charts in actionhellip Looks like your normal data entry spreadsheet
O
isual
aroma
lavor
outhfeel
verall
VAFM
Sample 1 2 3 4 5 6 7 8 9
CO
MM
EN
TS
Normal process variation
p-Chart
0000
0050
0100
0150
0200
0250
0300
0350
0400
0450
1 2 3 4 5 6 7 8 9 10 11 12 13 14 15 16 17 18 19 20 21 22 23 24 25
Observations (Sample Number)
Prop
ortio
n
Proportion p-bar UCL LCL
UCL
LCL
Out of Control data patterns- alert Your process is changing behavior
Is your panel lsquoplugged inrsquo Validation via spiked sample
aroma
tasteaftertaste
mouthfeelbody
overall flavor
clarity trend
Dec
ision
tree
-FY
IA
lert
-tr
end
In
vest
igat
e r
epor
t do
cum
ent
follo
w u
p
overall flavor out of control-not true to brand
diacetyl comments
Each lsquoout of specrsquo scenario needs to flow like this hellip Closed Loop Corrective Action Plan
Identify ProblemAttribute (diacetyl comments and red OOC in aroma and overall)
Assignable Cause (slow fermentation t-down too early)
Corrective Action (flag tank measure diacetyl before t-down)
Hold the gains (change SOGs train on new procedure)
Taste Panel vs Sensory Program1 ID process method measurement owners
2 Initial Measurement Validation (MSA)
3 Implement and maintain applicable SOGrsquos
4 Training Protocol amp Records
5 Establish appropriate charts (Pcharts)
6 On going Validation Method
7 Calibration
8 OOCOOS Action Plan DevelopmentDecision Trees
9 First Pass Analysis- using OOCOOS Action Plan
10 Document First Pass Analysis in control chart
11 Cleaning the data set- Brewmaster Ready
12 TrendsPareto Analysis and Recommendations
13 Present in Quality Meeting
14 Transition to ProjectInvestigation ideation
P CHART ADD-IN WEBSITES
bullhttpwwwisixsigmacomlibrarycontentn070223aaspbullhttpwwwqimacroscomqiwizardpcharthtmlbullhttpwwwpqsystemscomproductsSPCSQCpackbullwwwXLSTATcom
bullAll materials are sole property of New Belgium Brewing Company and should not be copied reproduced or used without permission
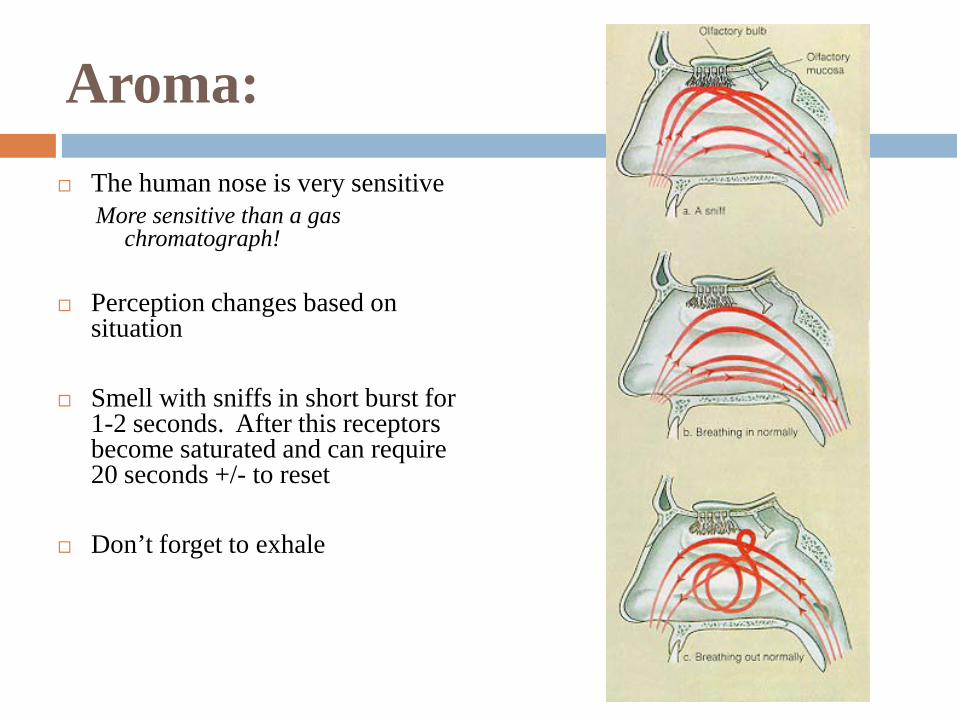
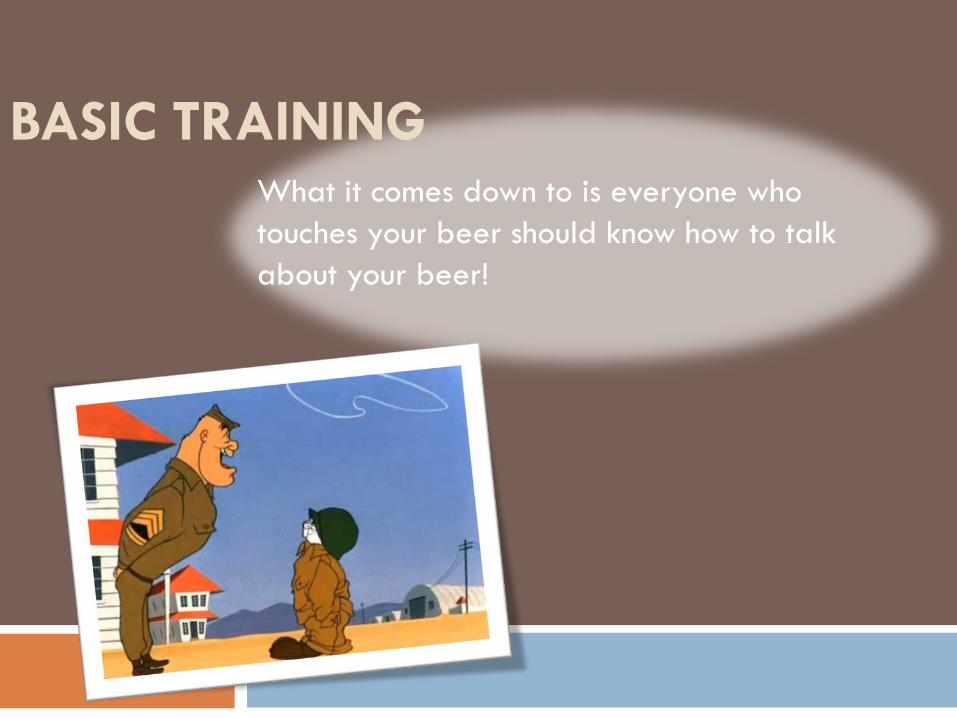
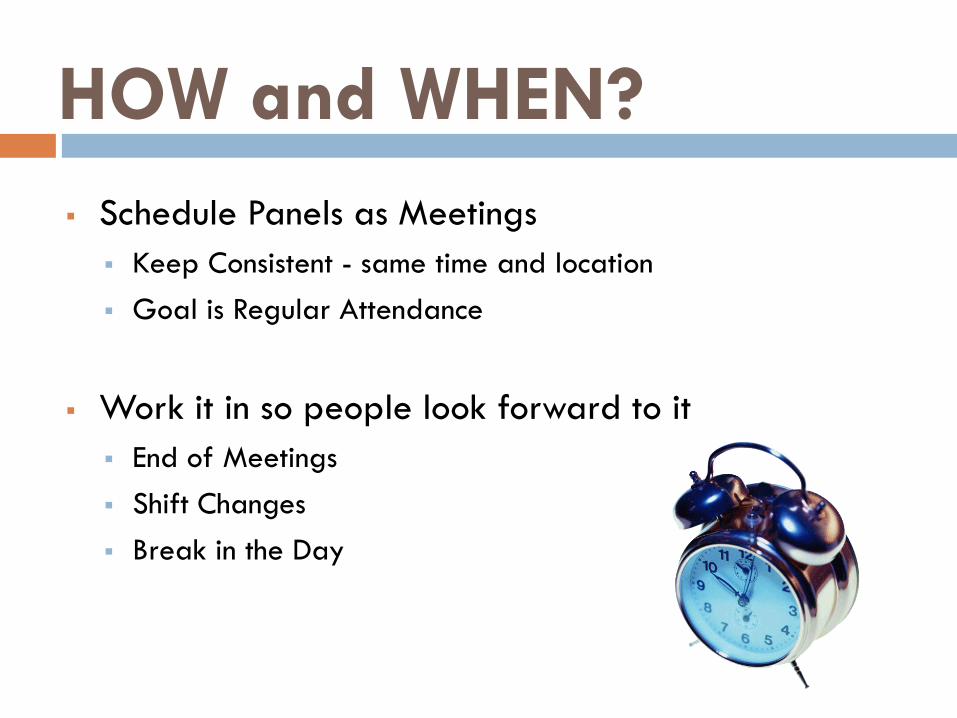
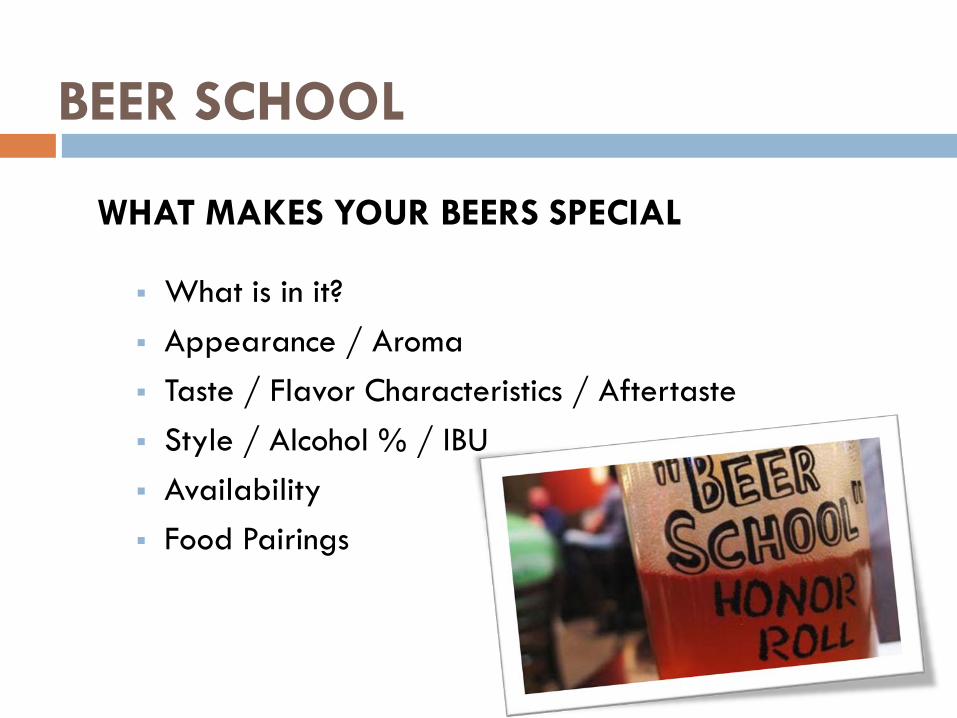
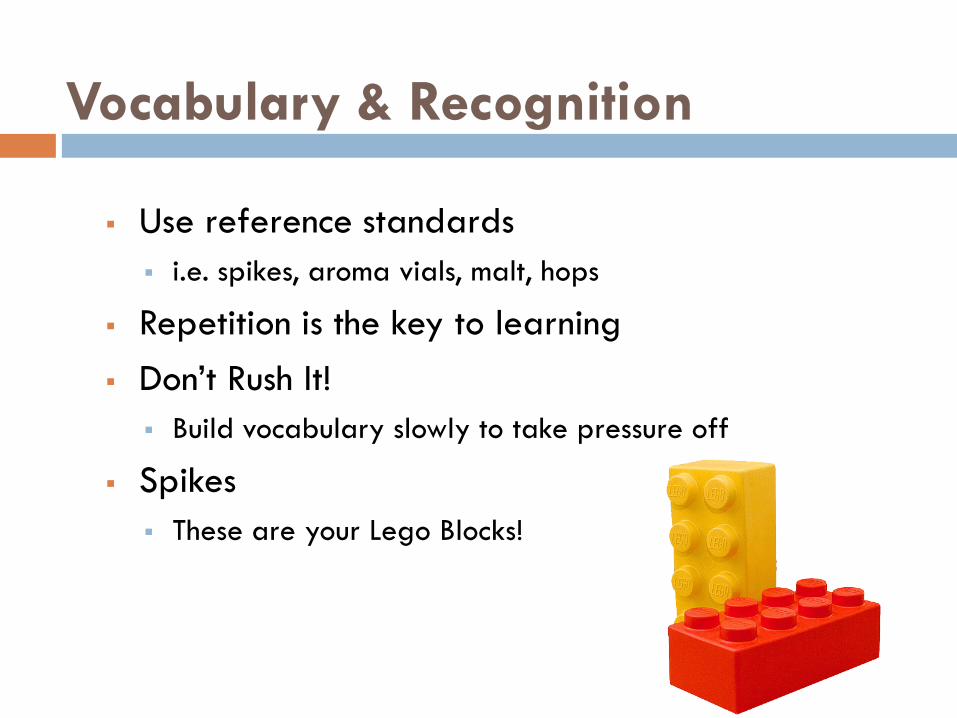
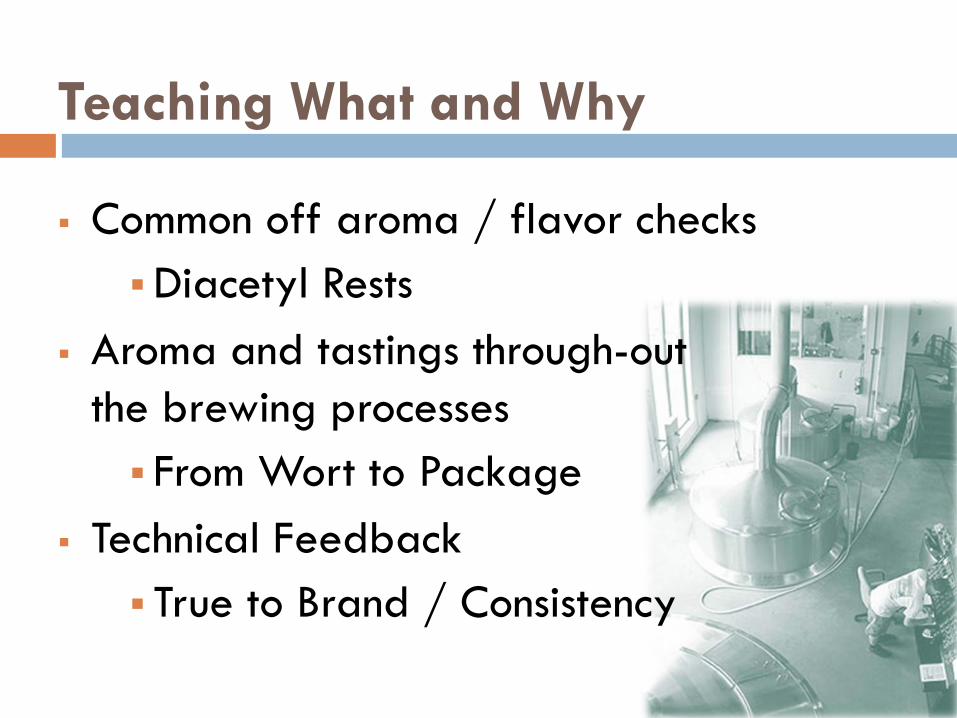
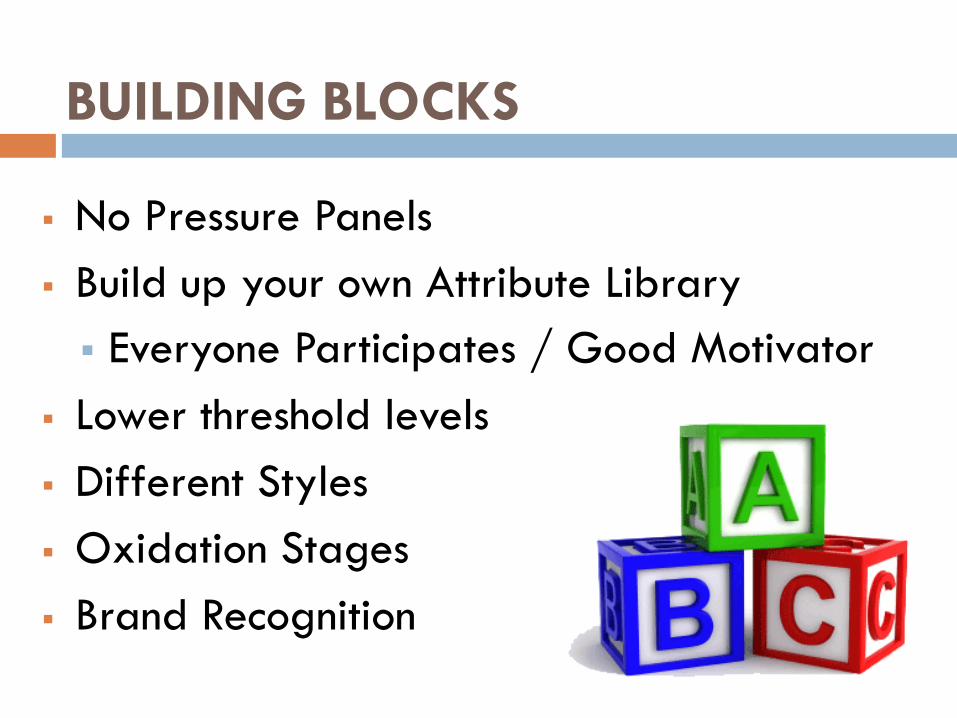
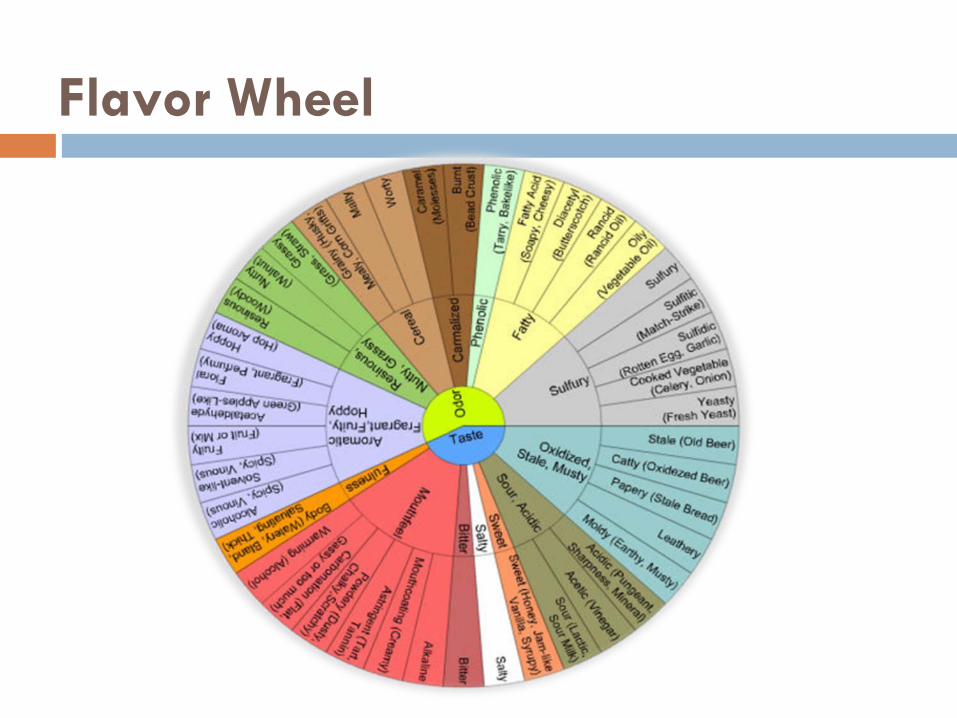
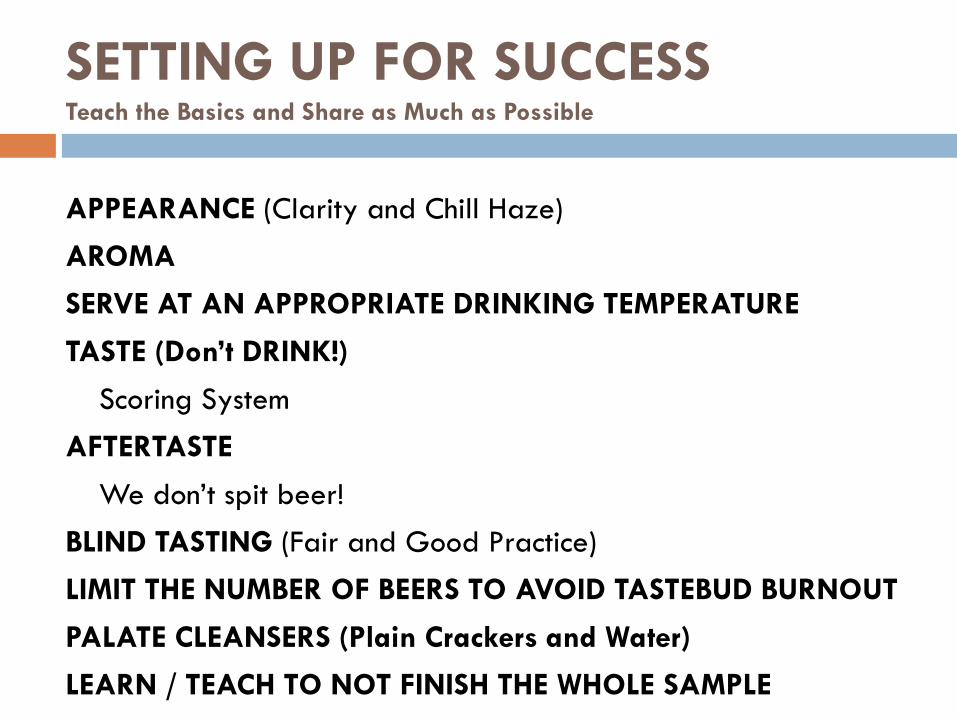
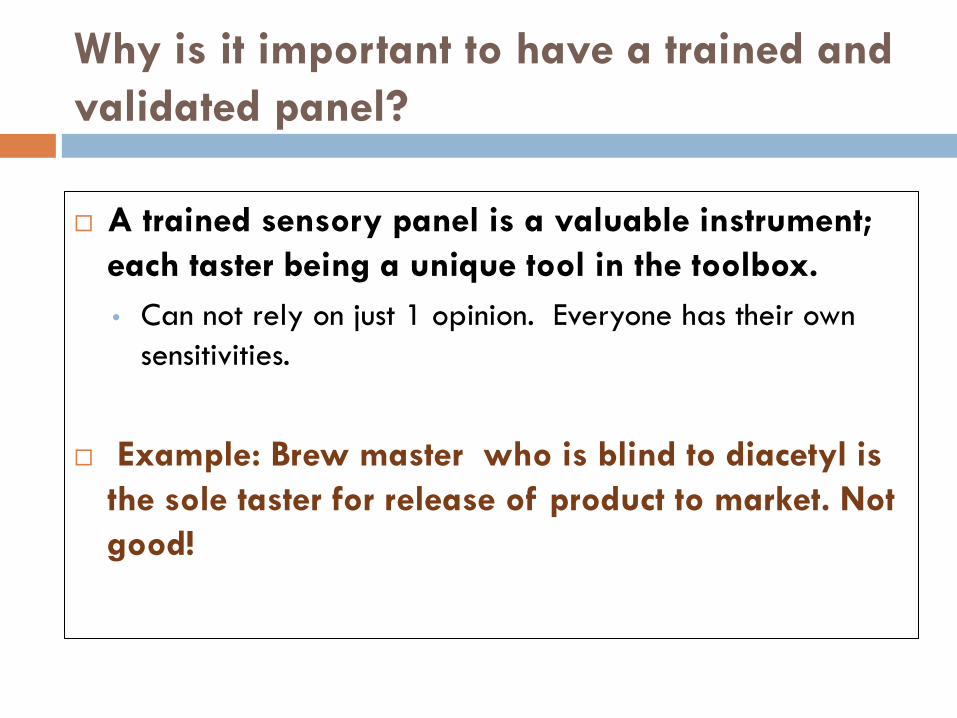
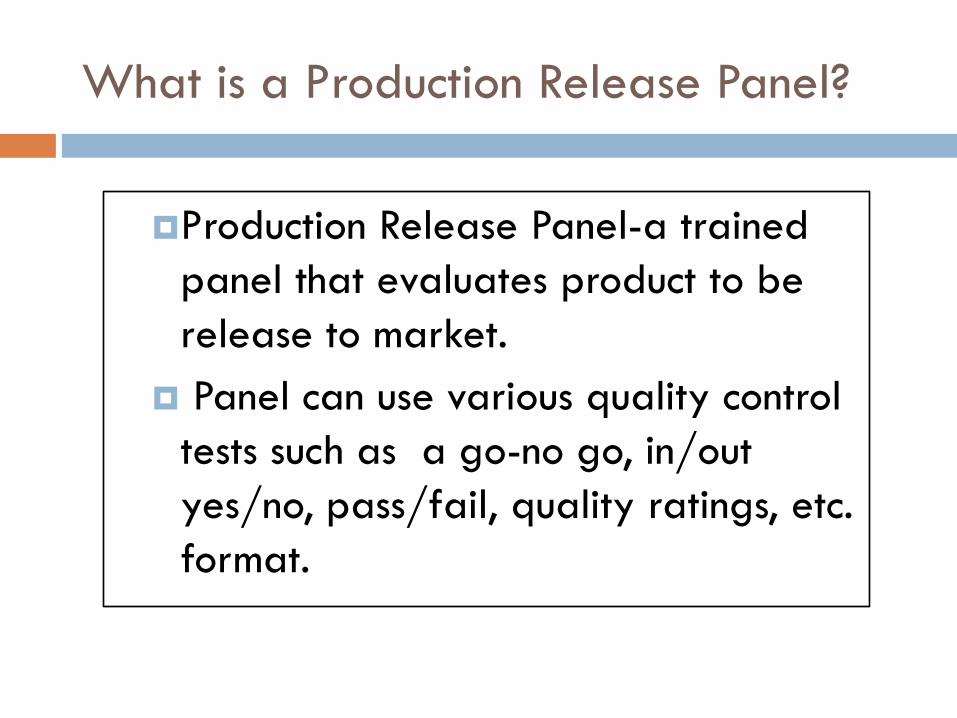
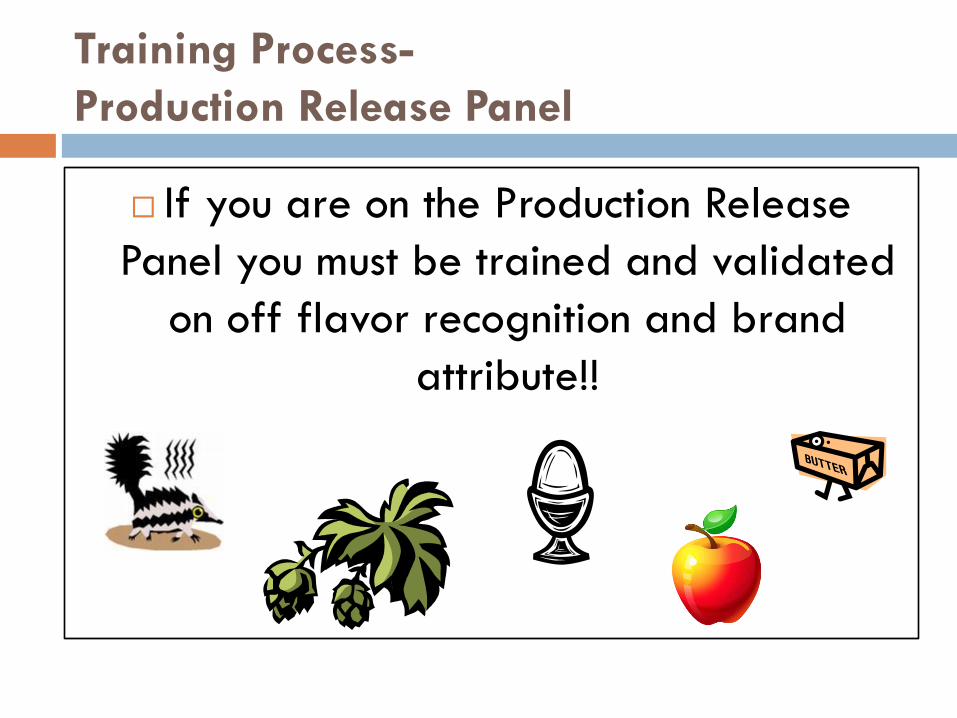
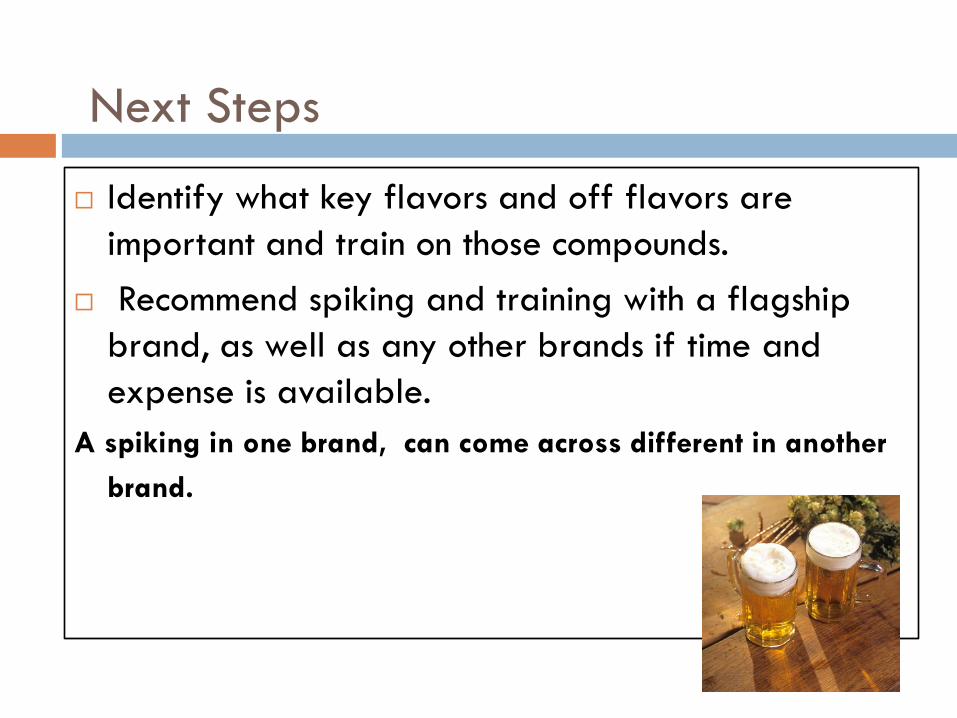
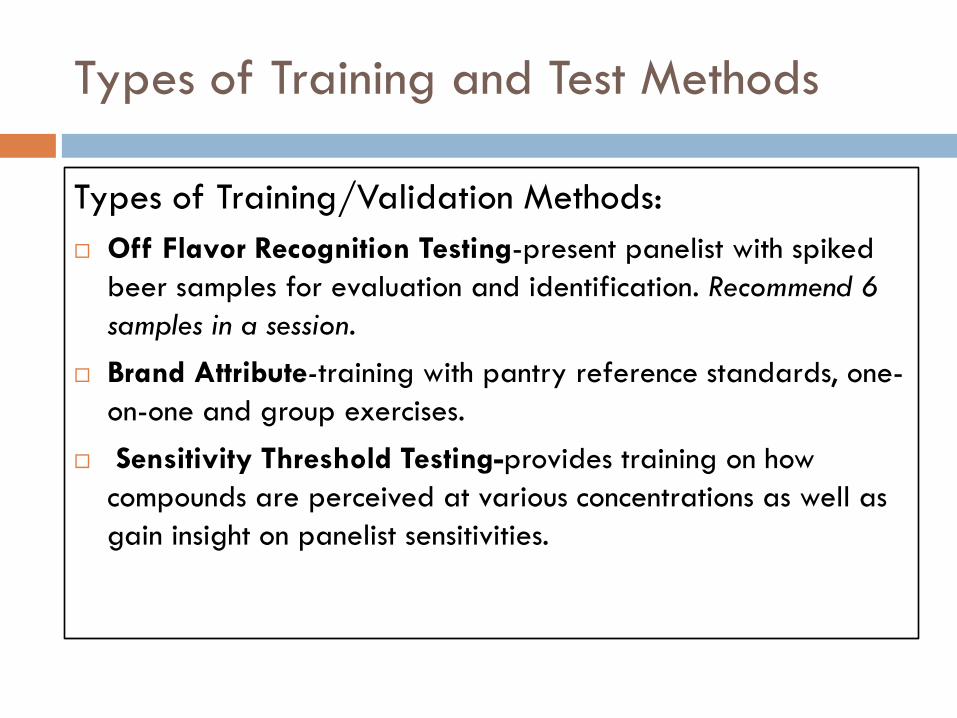
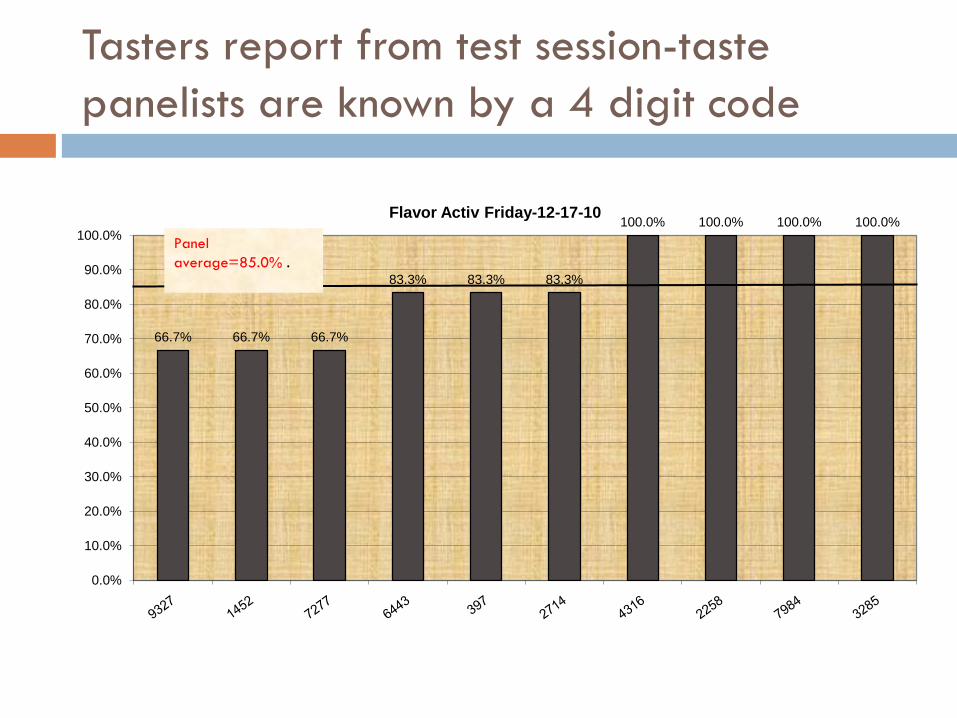
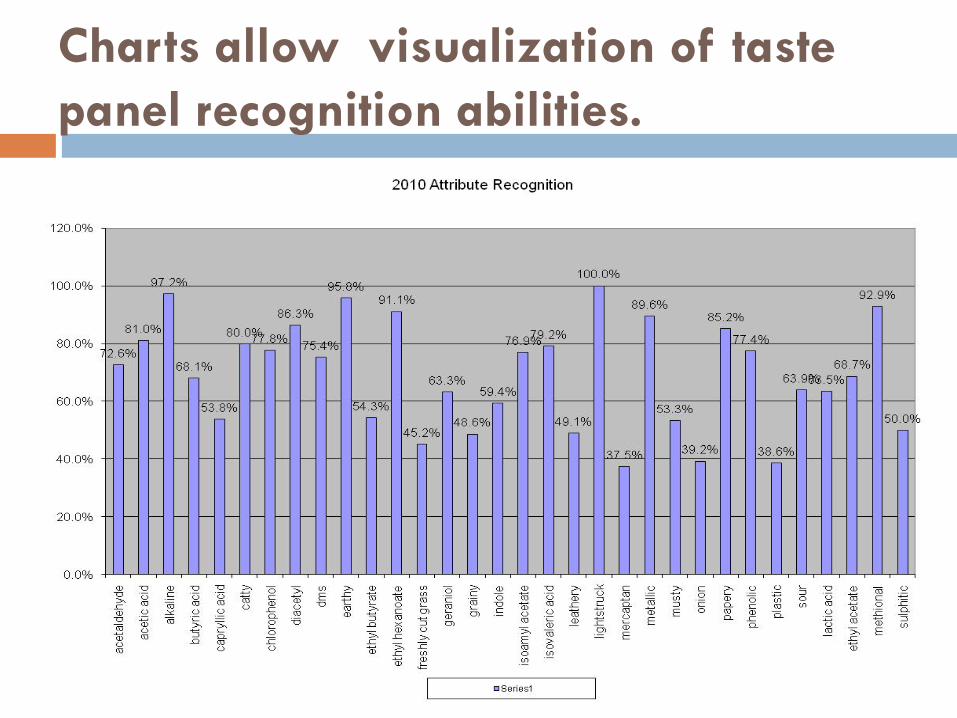
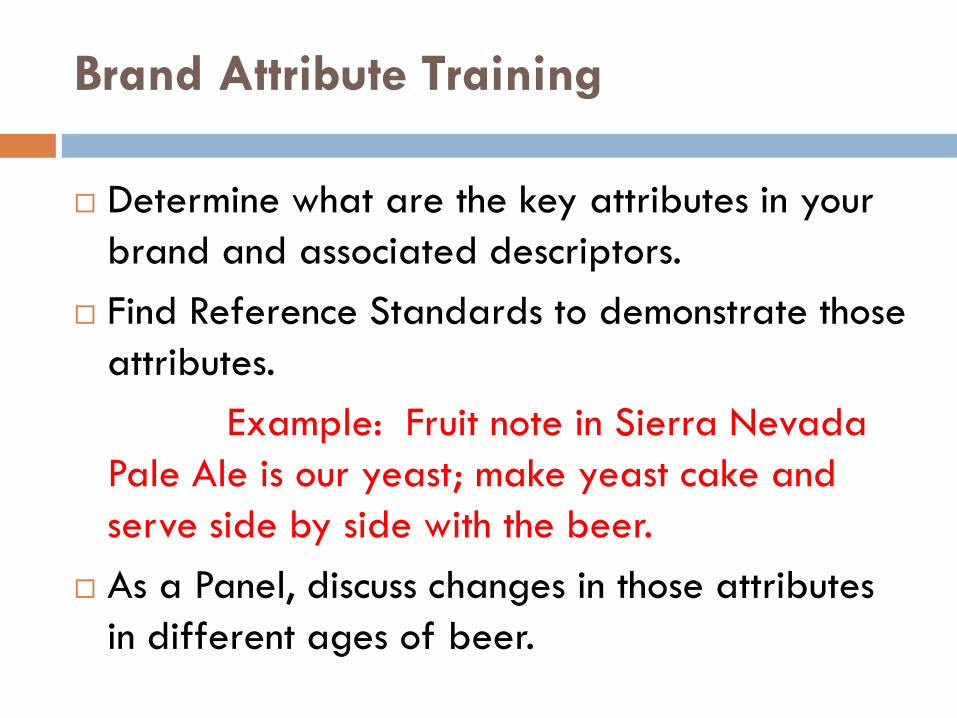
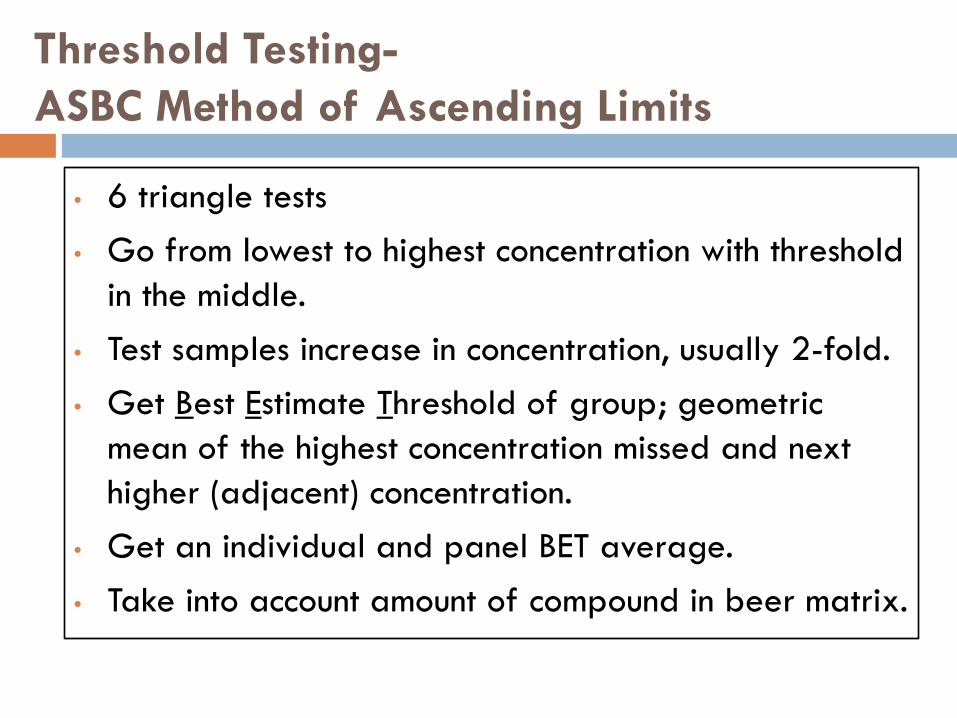
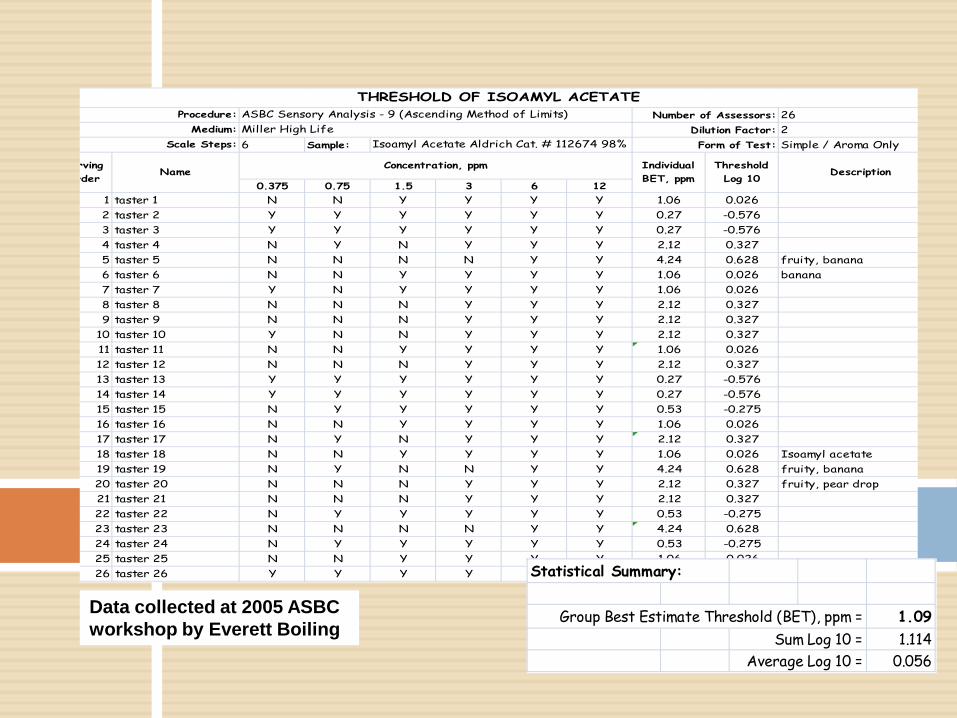
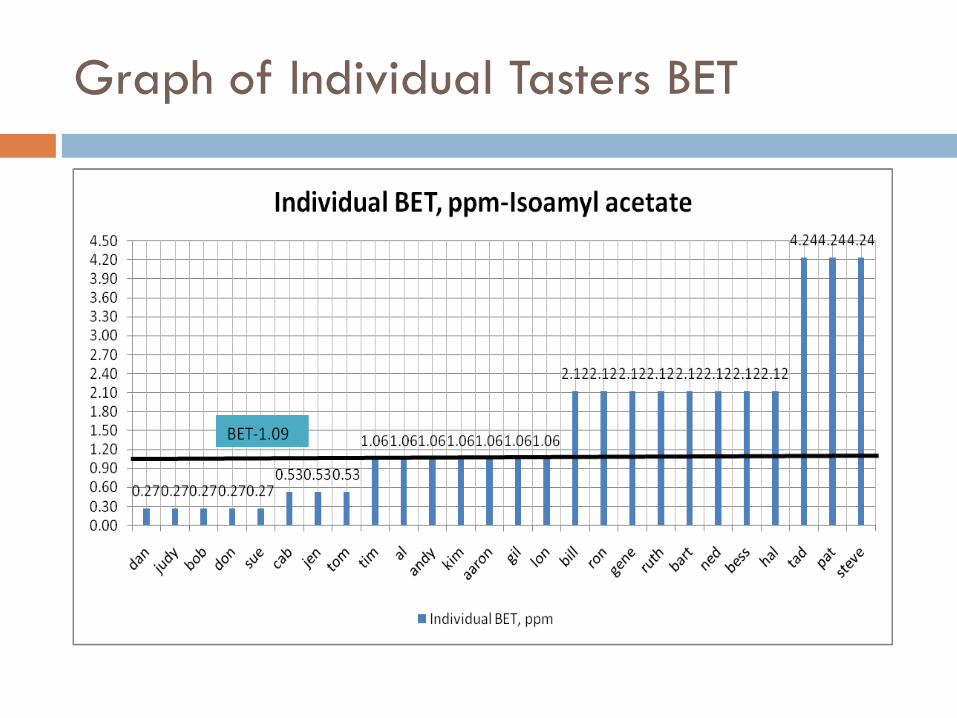
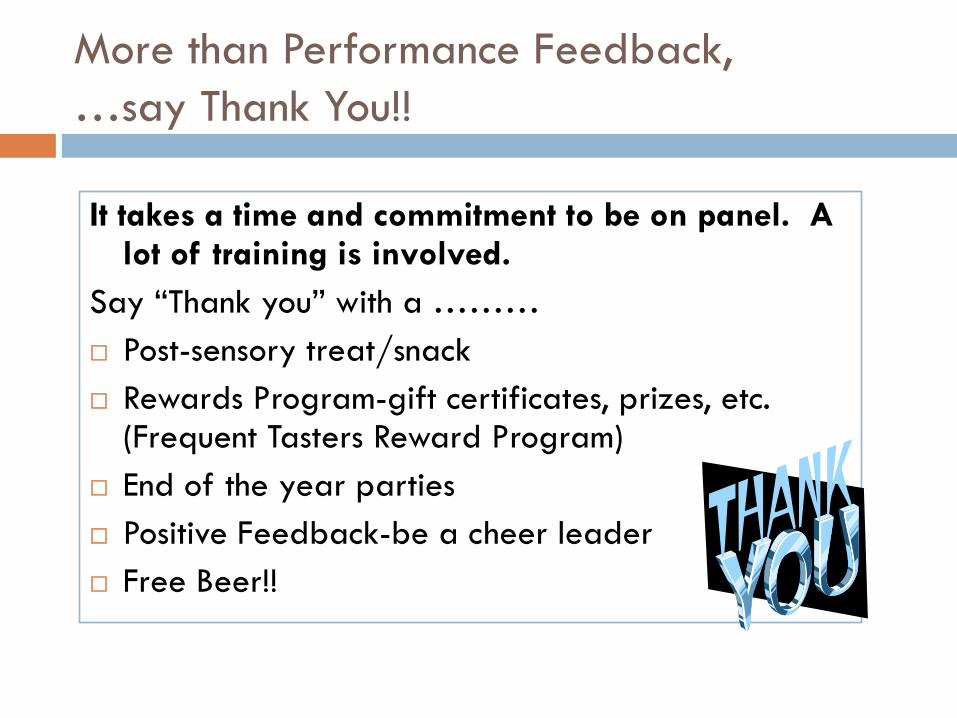
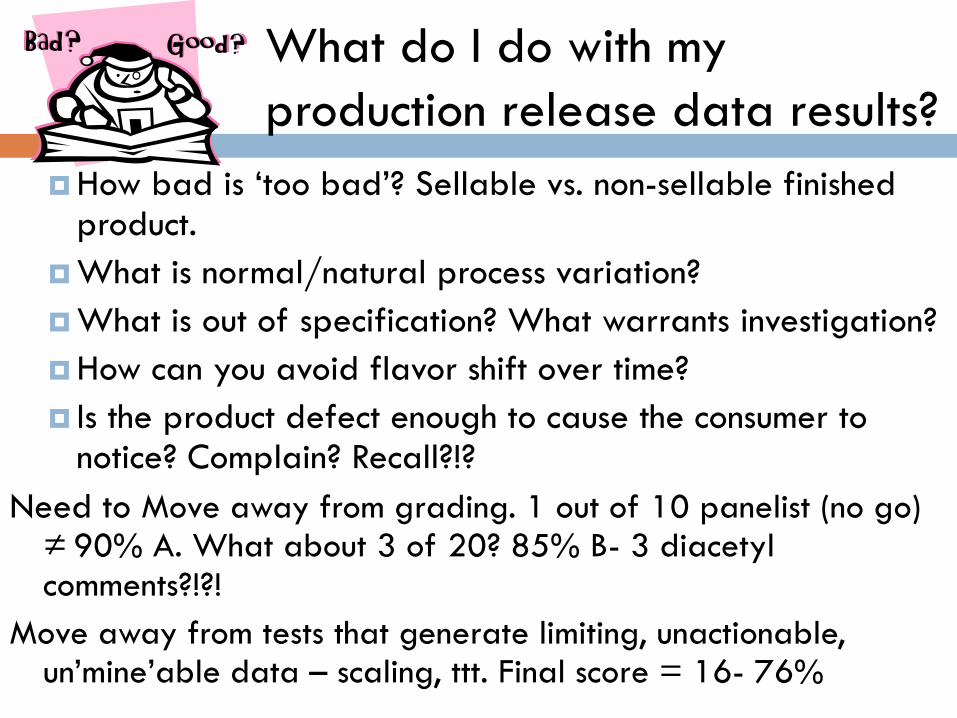
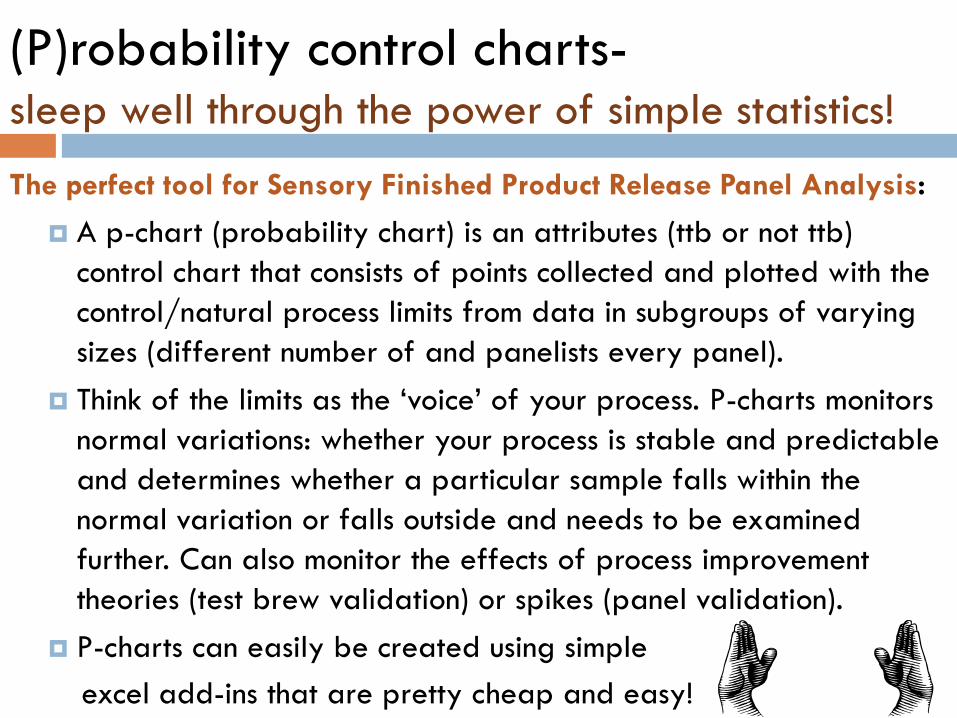
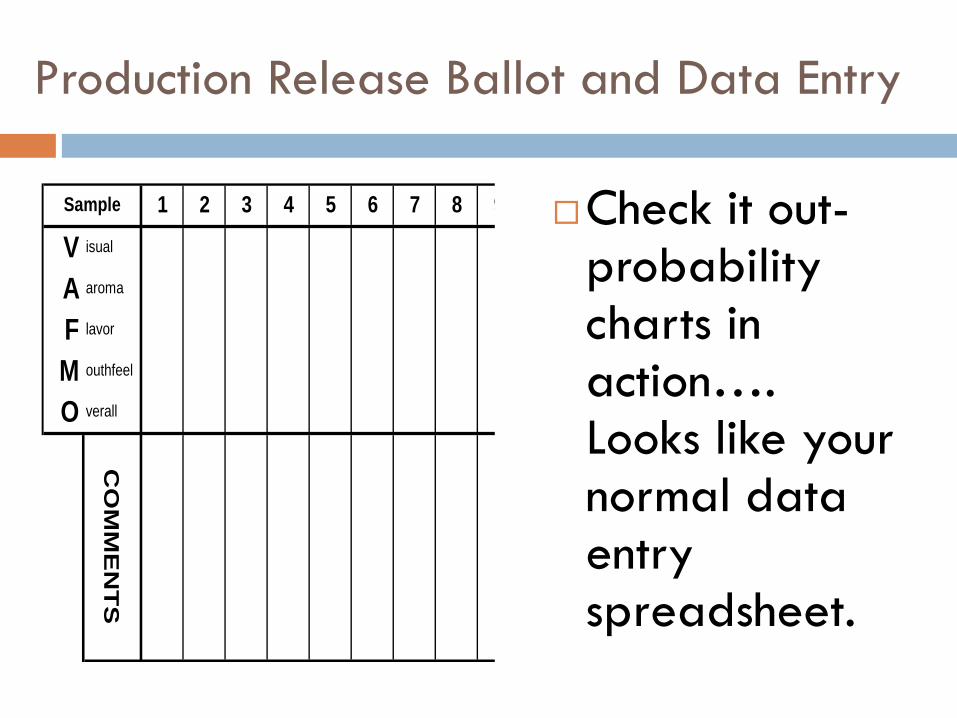
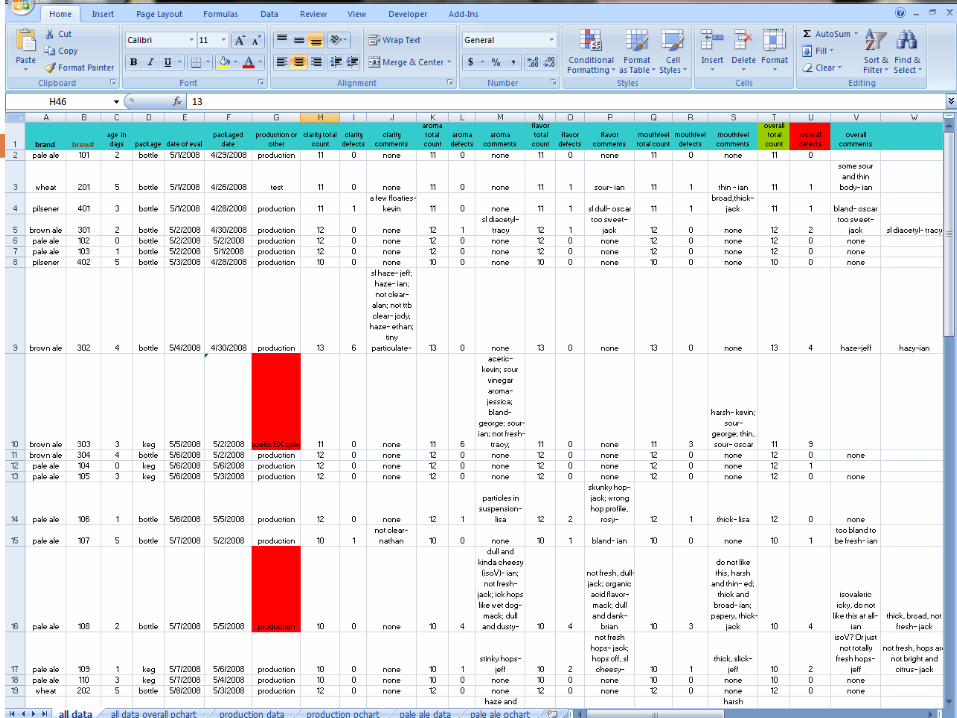
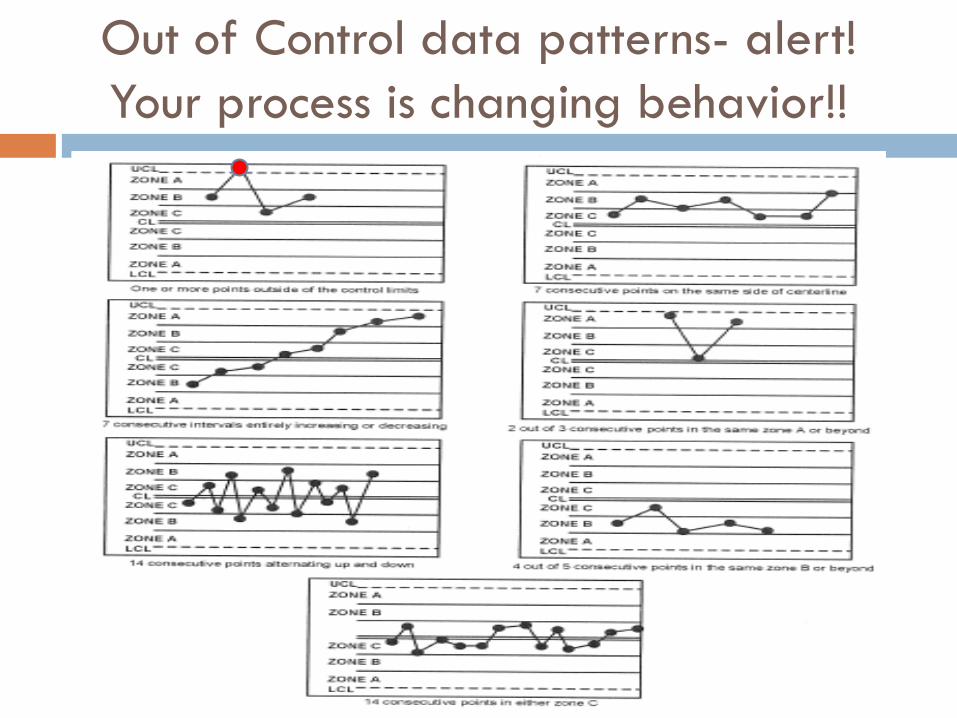
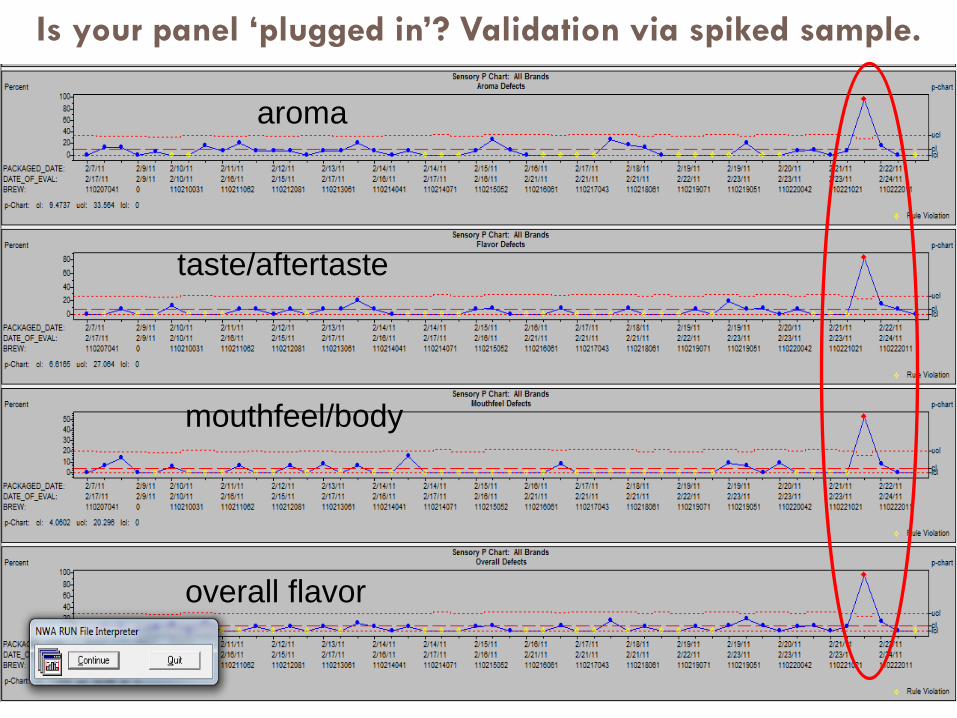
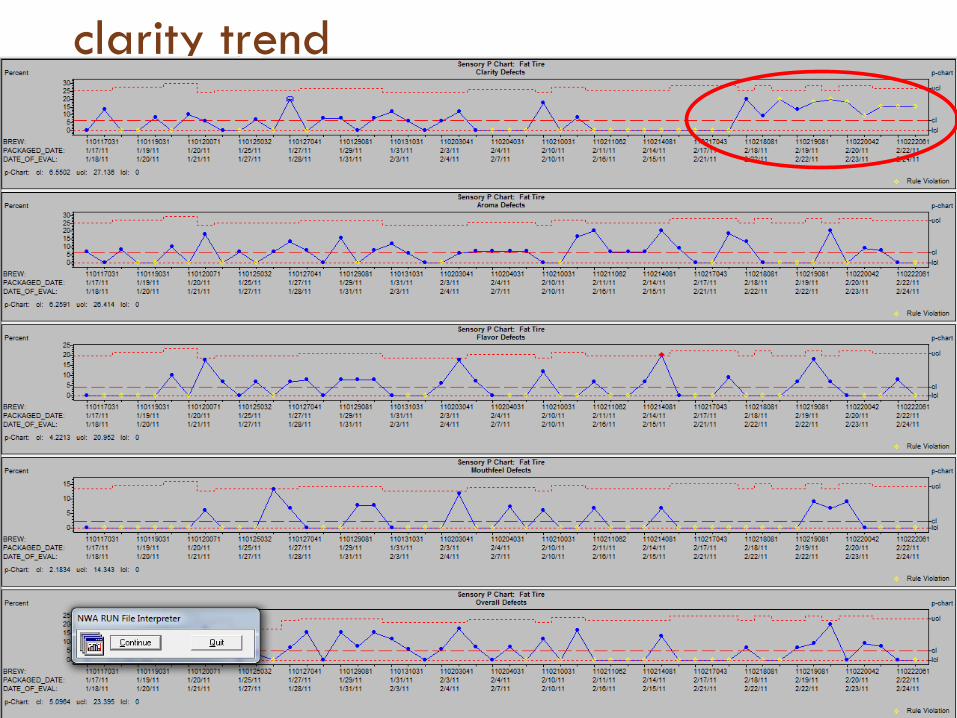
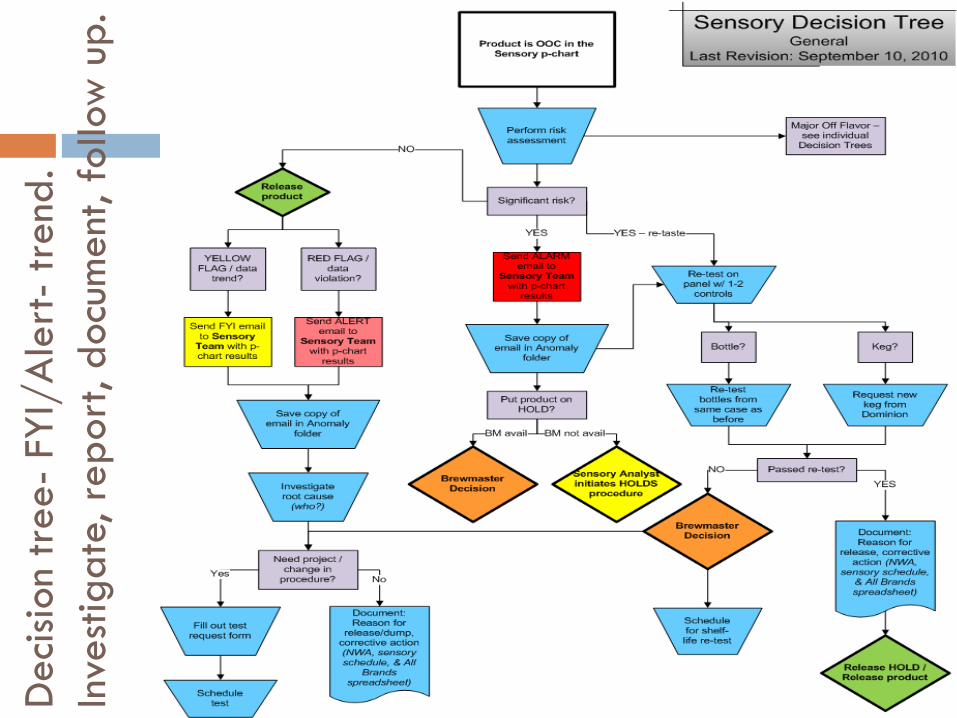
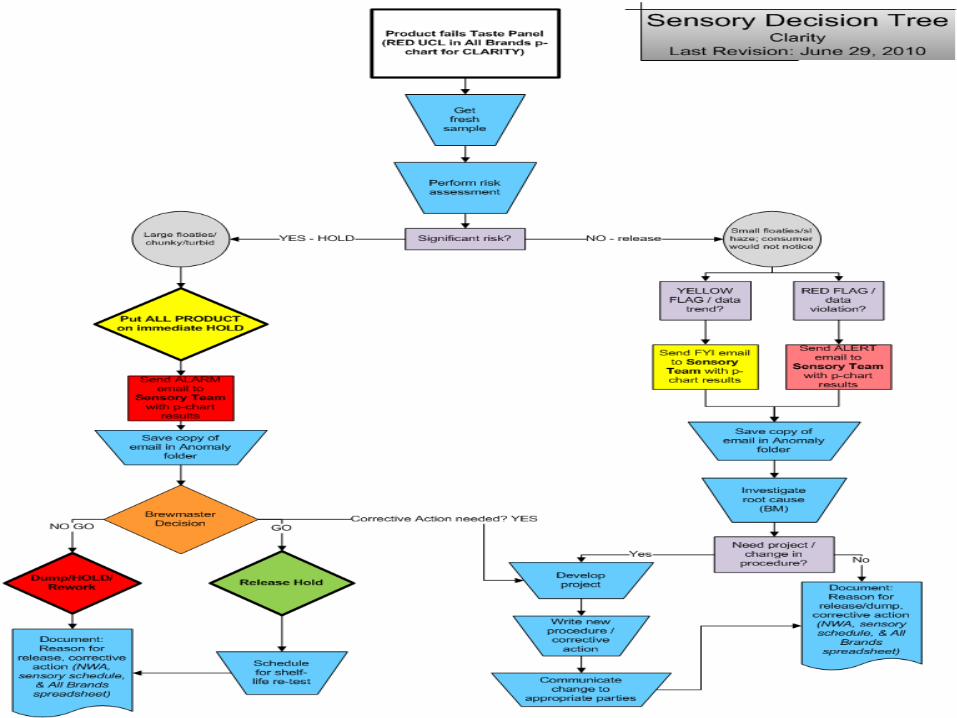
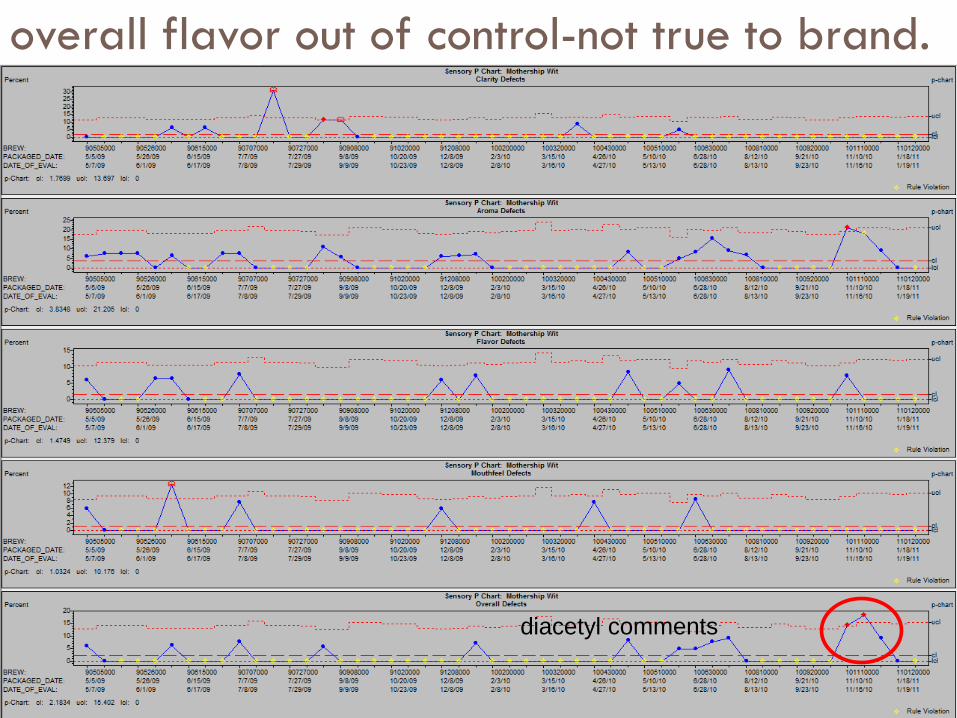
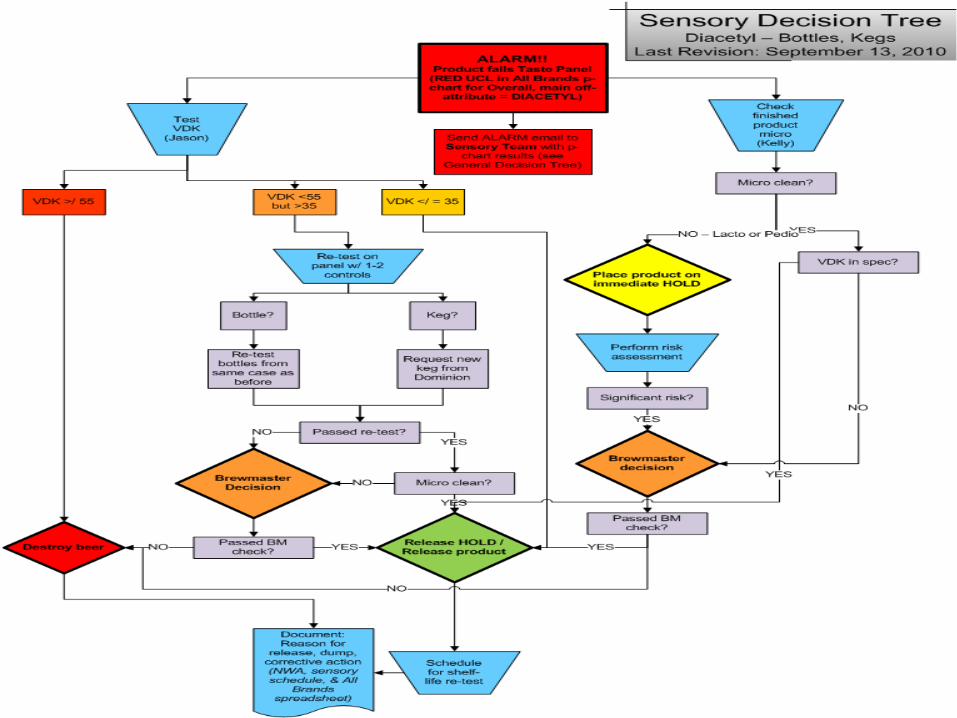
P CHART ADD-IN WEBSITES
bullhttpwwwisixsigmacomlibrarycontentn070223aaspbullhttpwwwqimacroscomqiwizardpcharthtmlbullhttpwwwpqsystemscomproductsSPCSQCpackbullwwwXLSTATcom
bullAll materials are sole property of New Belgium Brewing Company and should not be copied reproduced or used without permission