Embed Size (px)
Citation preview
The Use of Quality Control and Data Mining Techniques for Monitoring Scaled Scores: An Overview
Alina A. von Davier
October 2012
Research Report ETS RR-12-20
ETS Research Report Series
EIGNOR EXECUTIVE EDITOR James Carlson
Principal Psychometrician
ASSOCIATE EDITORS
Beata Beigman Klebanov Research Scientist
Brent Bridgeman Distinguished Presidential Appointee
Keelan Evanini Research Scientist
Marna Golub-Smith Principal Psychometrician
Shelby Haberman Distinguished Presidential Appointee
Gary Ockey Research Scientist
Donald Powers Managing Principal Research Scientist
Frank Rijmen Principal Research Scientist
John Sabatini Managing Principal Research Scientist
Joel Tetreault Managing Research Scientist
Matthias von Davier Director, Research
Rebecca Zwick Distinguished Presidential Appointee
PRODUCTION EDITORS
Kim Fryer Manager, Editing Services
Ruth Greenwood Editor
Since its 1947 founding, ETS has conducted and disseminated scientific research to support its products and services, and to advance the measurement and education fields. In keeping with these goals, ETS is committed to making its research freely available to the professional community and to the general public. Published accounts of ETS research, including papers in the ETS Research Report series, undergo a formal peer-review process by ETS staff to ensure that they meet established scientific and professional standards. All such ETS-conducted peer reviews are in addition to any reviews that outside organizations may provide as part of their own publication processes.
The Daniel Eignor Editorship is named in honor of Dr. Daniel R. Eignor, who from 2001 until 2011 served the Research and Development division as Editor for the ETS Research Report series. The Eignor Editorship has been created to recognize the pivotal leadership role that Dr. Eignor played in the research publication process at ETS.
October 2012
The Use of Quality Control and Data Mining Techniques for Monitoring Scaled Scores:
An Overview
Alina A. von Davier
ETS, Princeton, New Jersey
Associate Editor: Shelby Haberman
Copyright © 2012 by Educational Testing Service. All rights reserved.
ETS, the ETS logo, and LISTENING. LEARNING. LEADING., are registered trademarks of Educational Testing Service (ETS).
SAT is a registered trademark of the College Board.
As part of its nonprofit mission, ETS conducts and disseminates the results of research to advance
quality and equity in education and assessment for the benefit of ETS’s constituents and the field.
To obtain a PDF or a print copy of a report, please visit:
http://www.ets.org/research/contact.html
i
Abstract
Maintaining comparability of test scores is a major challenge faced by testing programs that have
almost continuous administrations. Among the potential problems are scale drift and rapid
accumulation of errors. Many standard quality control techniques for testing programs, which
can effectively detect and address scale drift for small numbers of administrations yearly, are not
always adequate to detect changes in a complex, rapid flow of scores. To address this issue,
Educational Testing Service has been conducting research into applying data mining and quality
control tools from manufacturing, biology, and text analysis to scaled scores and other relevant
assessment variables. Data mining tools can identify patterns in the data and quality control
techniques can detect trends. This type of data analysis of scaled scores is relatively new, and
this paper gives a brief overview of the theoretical and practical implications of the issues. More
in-depth analyses to refine the approaches for matching the type of data from educational
assessments are needed.
Key words: data mining, quality control, scale drift, scaled scores, time series, Shewhart control
charts, CUSUM charts, change-point models, hidden Markov models

ii
Acknowledgments
The author thanks Shelby Haberman, Peter van Rijn, and Yi-Hsuan Lee for their comments on
the earlier versions of the paper. The author also thanks Kim Fryer for her help with editing and
formatting this paper and Yi-Hsuan Lee, Zhiming Yang, and Long Luo for valuable input. The
opinions expressed in this paper are those of the author and not necessarily of Educational
Testing Service.
1
Maintaining comparability of test scores is a major challenge faced by testing programs
that have almost continuous administrations. Among the potential problems are scale drift and
rapid accumulation of errors, which can be exacerbated by a lack of time between these
administrations. Traditional quality control (QC) techniques available to psychometricians have
been developed for tests with only a small number of administrations per year, but while very
valuable and necessary, these techniques are not sufficient for catching changes in a complex and
rapid flow of scaled scores.
This paper gives a brief overview of several statistical tools used in other fields, such as
manufacturing, biology, and text analysis, that are potential useful for monitoring the reported
scores. Recent research conducted at Educational Testing Service (ETS) on these methodologies
is reviewed. In the past, psychometricians focused on the quality of the results from one
administration at a time, monitoring only a few variables. Nowadays, with the advances of
technology, one can capture more data than the responses of a candidate (process data, for
example). In addition, many assessments today have an almost continuous administration mode.
Once practitioners decide to analyze a vector of variables that describe a testing administration as
part of a system of test forms given at numerous administrations, they need to approach the data
analysis differently than they did previously. The variables now contain information ranging
from specific item-level statistics to test-level statistics and include process, background, and
collateral information, all of which is collected for each administration. The size of the data
matrix becomes too substantial for a simple visual inspection, and tools that can discover trends
and patterns in the data are desirable. The data sets from educational testing are significantly
smaller than those from text analysis and biology; nevertheless, they are large enough to be
overwhelming for evaluation without additional automatic analyses and appropriate models.1
Therefore, in order to preserve the quality of measurement and the validity of the test over time,
the review process needs to incorporate QC tools that look at the test score data as a time series
(eventually a multivariate time-series) in addition to the traditional QC tools. Monitoring and
maintaining the quality and stability of the scaled scores of a standardized assessment are
perhaps the most important goals of psychometricians’ work on an assessment. A scale that is
stable indicates that the meaning of the reported scores has been preserved over time.
Consequently, this stability supports the validity of the test for the intended use over time. Often,
the distribution of scaled scores might drift from the initial distribution due to socioeconomic and

2
other demographic factors that are not under the control of test developers and psychometricians.
If a situation such as this occurs, then the potential causes of the shifts have to be investigated
and addressed (see Dorans, 2002). If the test scores and the relevant demographic variables are
continuously monitored, then a continuous and minimal adjustment can be implemented as part
of the measurement process (see Duong & von Davier, 2012; Haberman & Yang, 2011; Qian,
von Davier, & Jiang, 2012). In addition to the shifts due to demographics, operational mistakes,
such as the computing or reporting of an incorrect score (one that is lower or higher than the
correct score), may have serious implications on the test validity in the context of educational
measurement. Operational mistakes might preclude a qualified candidate from being accepted to
college, lead to incorrect course placement, cause a misguided educational intervention, or result
in the granting of a professional license to a person who lacks the required qualifications.
Moreover, mistakes that cause real damage of this kind can precipitate legal action against the
testing company or the educational institution. “Finally, a high incidence of such mistakes will
have an adverse impact on test reliability and validity of the test” (Allalouf, 2007, p. 36). Other
causes of sudden changes in the test score distribution might be due to item exposure and
breaches in test security. If these changes are not detected, then the validity of the test can break
down.2 Allalouf (2007) discussed the definition of quality in the context of educational
measurement:
W.E. Deming, one of the founders of the philosophy and application of statistical
control of quality, defines it as follows: “Inspection with the aim of finding the bad
ones and throwing them out is too late, ineffective, and costly. Quality comes not from
inspection but from improvement of the process.” A relevant definition for the present
purposes is as follows: Quality control is a formal systematic process designed to
ensure that expected quality standards are achieved during scoring, equating, and
reporting of test scores. (p. 37)
I would modify the definition of quality as follows: Quality control in educational
measurement is a formal systematic process designed to ensure that expected quality standards
are achieved during scoring, equating, and reporting of test scores at each administration and
across administrations during the life of the test.
This paper reviews recent research that was conducted at ETS to enhance the use of data
analysis, monitoring, classification, and prediction techniques in evaluating equating results. The
3
perspective is that quality control and data mining tools from manufacturing, biology, and text
analysis can be successfully applied to scaled scores and other relevant variables of an
assessment. The quality control techniques may help with detecting trends, while the data mining
tools may help with identifying (useful) patterns in the data that accompany the scaled scores.
This type of data analysis of scaled scores is relatively new and, as with any new application, is
subject to the typical pitfalls: Are the appropriate variables included? Are the identified patterns
meaningful?
Approaches to Monitoring and Maintaining the Stability of Scaled Scores
Equating is a statistical procedure that allows for scores from different test forms of the
same standardized assessment to be used interchangeably. As with any statistical model, the
equating procedure has to balance bias and error. Bias can be introduced by the equating model
if the assumptions of the model are not well met and if the samples are not representative, and
error is introduced by fluctuations in the sample sizes and representativeness of test takers from a
target population and by fluctuations in the sample sizes and representativeness of items from a
population of possible items that cover the construct(s) to be measured (see also Zumbo, 2007).
The equating process is the primary tool for maintaining the stability of scaled scores. The
equating design, the statistical procedure, the selection of the common items, and the
composition of the equating sample all can contribute to the variance of the scores. As mentioned
earlier, for assessments with a large number of administrations each year, all these errors may
potentially cumulate over time.
Traditional Quality Control Approaches
In general, after each test administration, the results are evaluated at several levels. First,
a team of psychometricians will conduct the standard item, test, and equating analysis and insure
that no errors occurred at the administration level (Allalouf, 2007; Dorans, Moses, & Eignor,
2011). Then a second level of the evaluation will take place, where the results are considered as
part of a series of administrations over time. The team will carefully monitor the changes in
demographics over time, the seasonality of the test, the trends in the results, the results of
subgroups of test takers, the consistency among the sections of the test over time, and so on. One
can easily see that, without appropriate models, it is difficult in this situation to make sense of a
4
large amount of data in a short period of time (1 or 2 days) or to detect a perilous emerging
pattern or trend.
In recent years at ETS, researchers considered monitoring the following variables: means
and variances of the scaled and raw scores, means and variances of item parameters after they
were placed on a common item response theory (IRT) scale, IRT linking parameters over time
(the estimated slope and intercept of the linear relationship between the item/person parameters
from the old and new administrations or from the item bank and the new administration),
correlations among different sections of the tests, automatic and human scoring data, background
variables, and so on.
New Approaches to Quality Control
Some of the variables mentioned above have been investigated by the team responsible
for the quality of scores, but in the recent years, this investigation has focused more on patterns
over a long chain of administrations. We attempted to address these inquires by using Shewhart
control charts to visually inspect the data over time; time series models to model the
relationship of test difficulty and test scores means over time; harmonic regression to remove
seasonality, cumulative sum (CUSUM) charts, change-point models, and hidden Markov
models to detect sudden changes; and weighted mixed models and analysis of variance to detect
patterns in the data.
Methods of statistical process control, widely used in industrial settings for quality
assurance of mass production, were applied to the field of educational measurement in the last
few decades. Van Krimpen-Stoop and Meijer (2001) employed CUSUM control charts to
develop a person-fit index in a computer-adaptive testing environment. Armstrong and Shi
(2009) further developed model-free CUSUM methods to detect person-fit problems. Meijer
(2002) explored the statistical process control techniques to ensure quality in a measurement
process in operational assessments. Veerkamp and Glas (2000) used CUSUM charts to detect
drifts in item parameter estimates in a computer-adaptive testing environment. Omar (2010) used
statistical process control charts for measuring and monitoring temporal consistency of ratings.
However, the applications were different than those described here.
Next, three steps in analyzing the assessment data for quality control purposes are
reviewed: (a) the inspection of the data and the use of the traditional analyses, (b) the use of
control charts for detecting trends, and (c) the use of statistical models for detecting abrupt
5
changes and patterns in the data. These steps are defined by the chronological order in which the
procedures mention here will be applied: First we apply the traditional analyses at each test
administration; then we compare the results from this administration to the past administrations
in look for trends; and later on, we research the data for abrupt changes and patterns.
Inspection of the Data
The first step in monitoring the test results over time is to learn as much as possible about
the data matrix. How do different parts of the assessment relate to each other? Do they all tell the
same story? Li (2011) identified correlations between IRT linking parameters and specific
features of an administration, such as the difficulty of the test form, and proposed monitoring
these correlations over time. If something looks like an outlier, then one can look further into the
potential causes of these irregularities. Do the test results exhibit seasonality? How do the test
results depend on subgroups of test takers and how do these group dependencies look when
investigated over time? It is customary to have equating braiding plans in place for testing
programs. A braiding plan is a design for equating new test forms back to multiple old test forms
in order to avoid the accumulation of the seasonality effects over time and to reduce the potential
bias introduced by the item selection, especially by the item selection in the anchor sets.
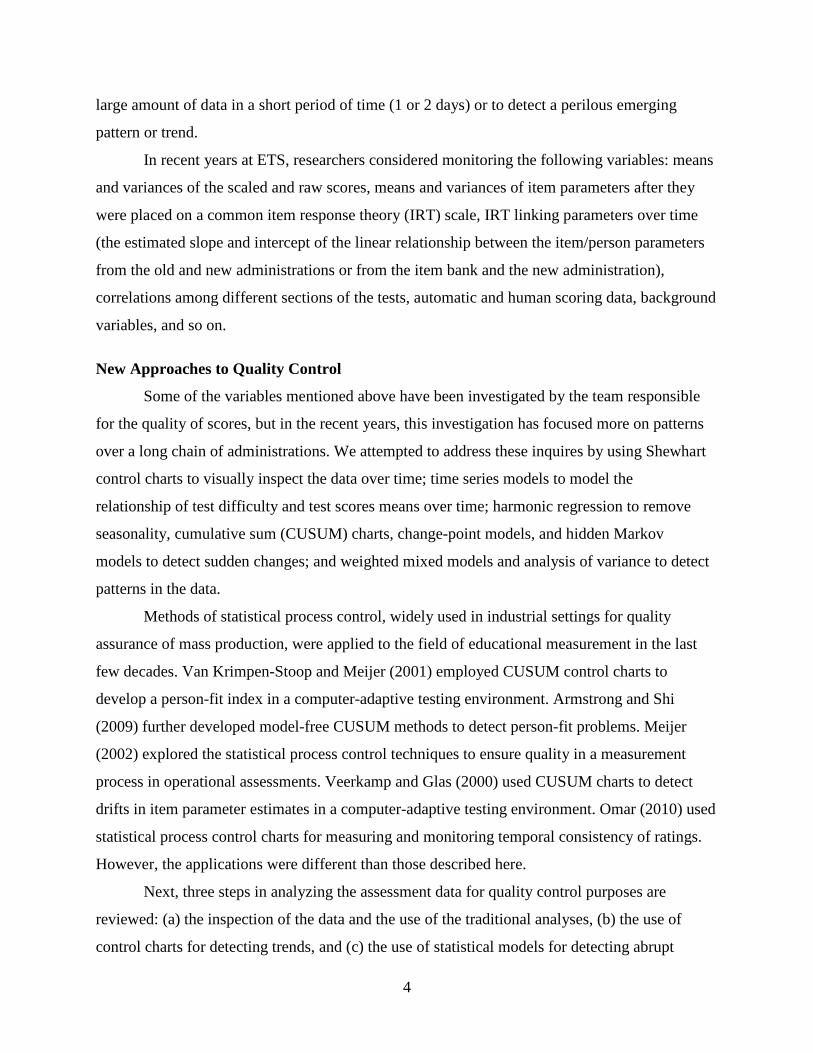
The means and variances of the test results are very visible to test users and are the first
variables to consider in a long-term analysis. Let us assume that one is interested in monitoring
the variable means of scaled scores for a test over time. Figure 1 displays four hypothetical
distributions of means of equated scores. Let Xt denote the scaled mean score of administration t,
t=1,…, T. Let σ be the standard deviation of mean scores across time. The sample mean of X1,…,
XT is denoted by X .
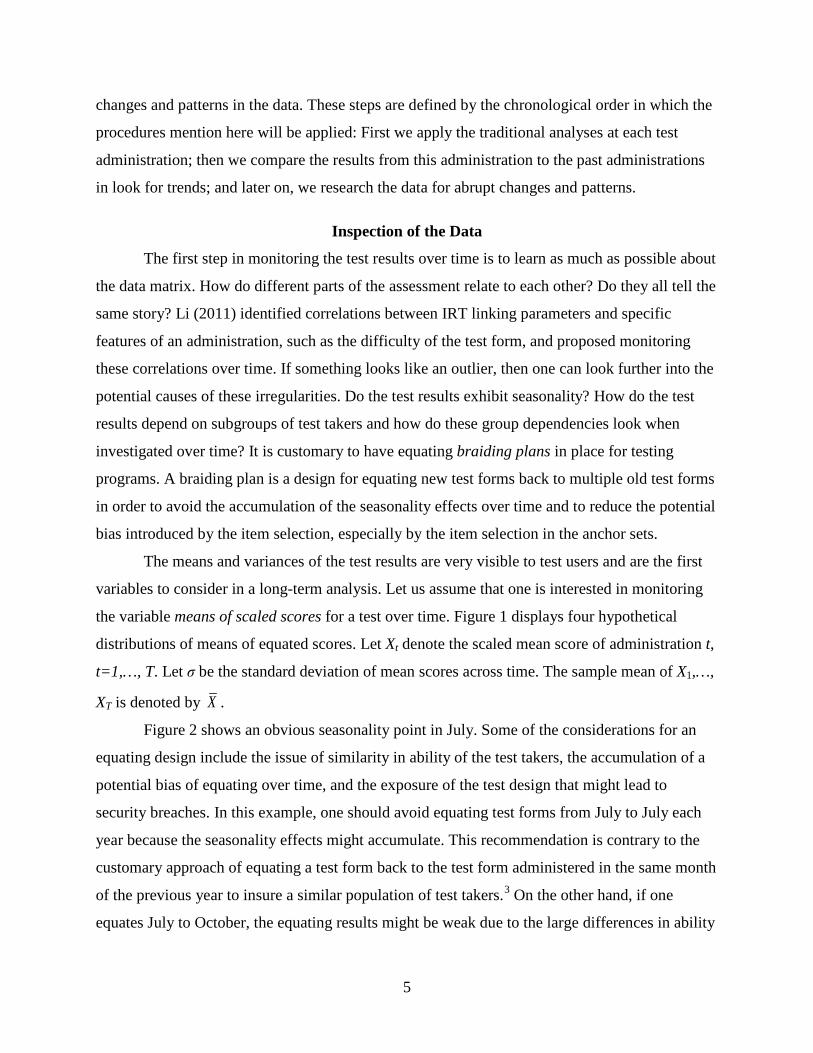
Figure 2 shows an obvious seasonality point in July. Some of the considerations for an
equating design include the issue of similarity in ability of the test takers, the accumulation of a
potential bias of equating over time, and the exposure of the test design that might lead to
security breaches. In this example, one should avoid equating test forms from July to July each
year because the seasonality effects might accumulate. This recommendation is contrary to the
customary approach of equating a test form back to the test form administered in the same month
of the previous year to insure a similar population of test takers.3 On the other hand, if one
equates July to October, the equating results might be weak due to the large differences in ability
6
Figure 1. Hypothetical plot of observed means of scaled scores of different tests.
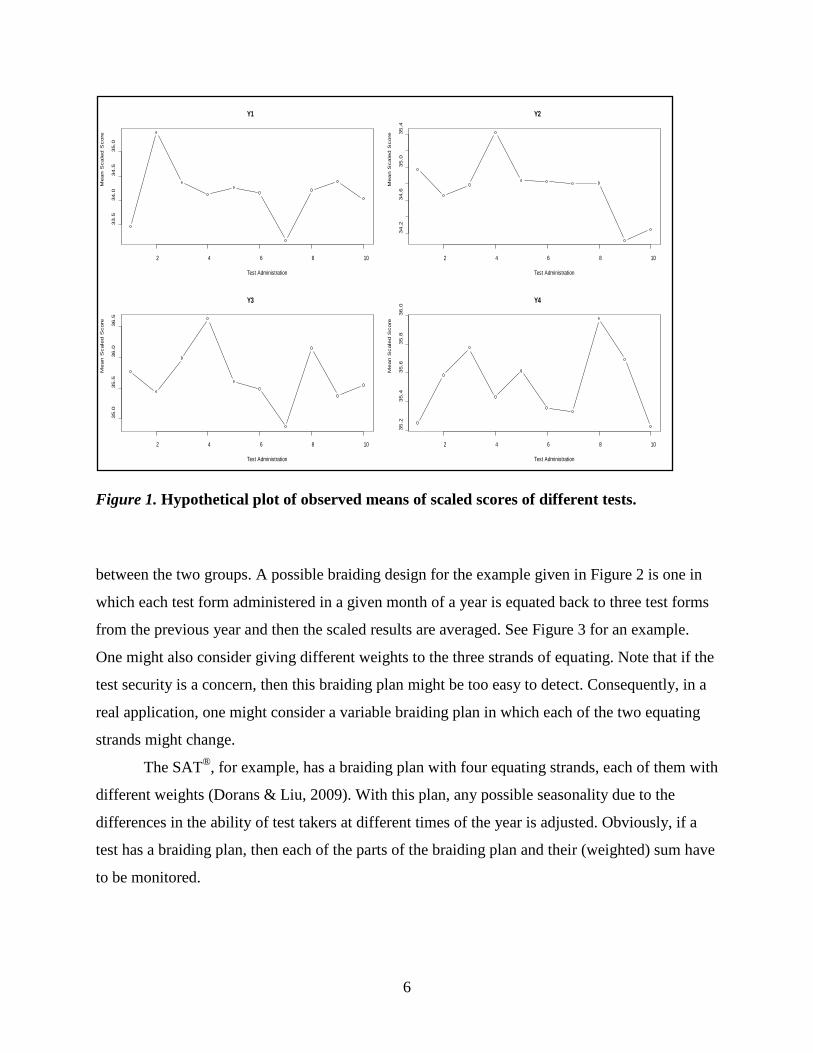
between the two groups. A possible braiding design for the example given in Figure 2 is one in
which each test form administered in a given month of a year is equated back to three test forms
from the previous year and then the scaled results are averaged. See Figure 3 for an example.
One might also consider giving different weights to the three strands of equating. Note that if the
test security is a concern, then this braiding plan might be too easy to detect. Consequently, in a
real application, one might consider a variable braiding plan in which each of the two equating
strands might change.
The SAT®, for example, has a braiding plan with four equating strands, each of them with
different weights (Dorans & Liu, 2009). With this plan, any possible seasonality due to the
differences in the ability of test takers at different times of the year is adjusted. Obviously, if a
test has a braiding plan, then each of the parts of the braiding plan and their (weighted) sum have
to be monitored.
2 4 6 8 10
33.5
34.0
34.5
35.0
Y1
Test Administration
Mean S
cale
d S
core
2 4 6 8 10
34.2
34.6
35.0
35.4
Y2
Test Administration
Mean S
cale
d S
core
2 4 6 8 10
35.0
35.5
36.0
36.5
Y3
Test Administration
Mean S
cale
d S
core
2 4 6 8 10
35.2
35.4
35.6
35.8
36.0
Y4
Test Administration
Mean S
cale
d S
core
7
Figure 2. An example of seasonality for a hypothetical test. In this example, the unit of the
scale is 10 (for illustration purposes) and the peak is due to a particular timing of an
administration. Other types of seasonality are also possible.
Figure 3. An example of one possible braiding plan for the hypothetical test in Figure 1. In
this example, the form given in July this year will be equated back to three old forms, two
from the previous year and one from earlier this year. The equating strands will have
different weights.
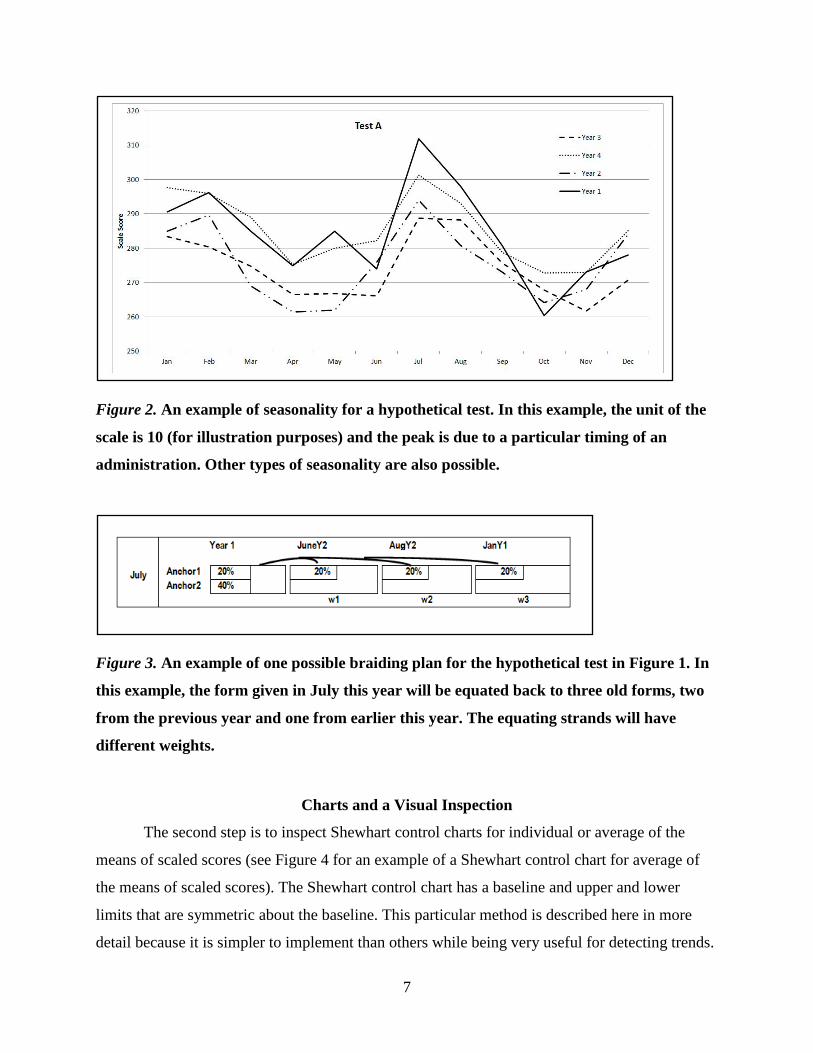
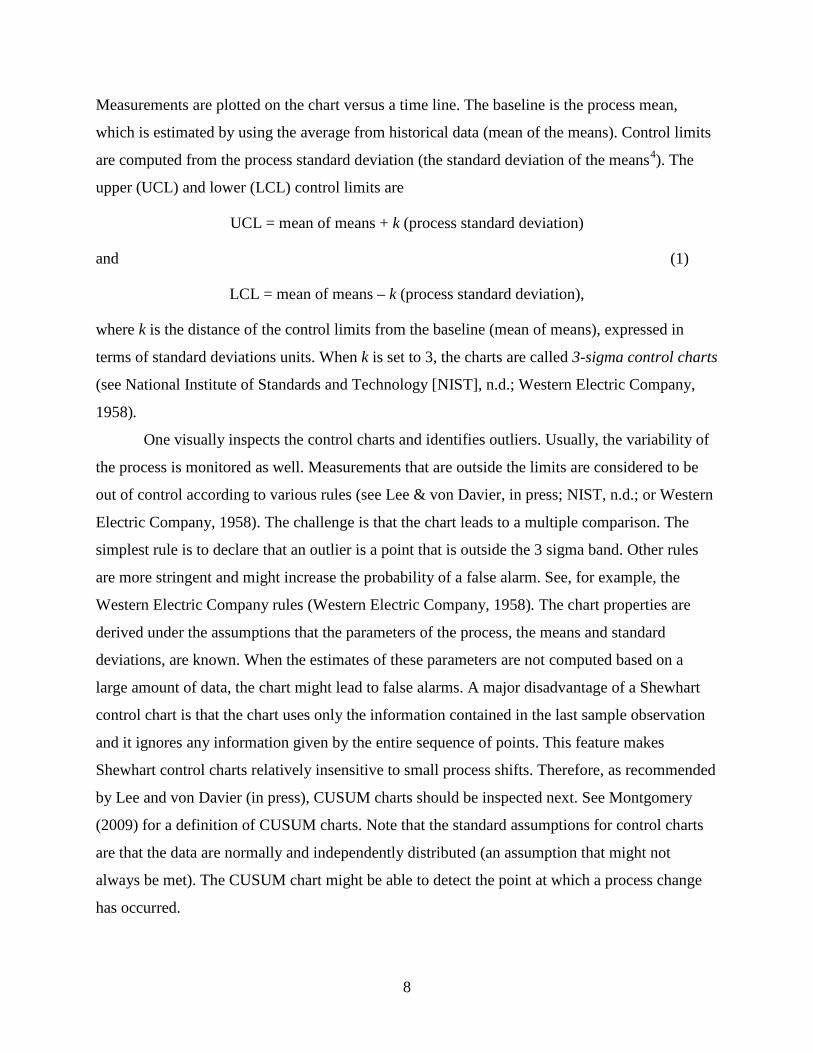
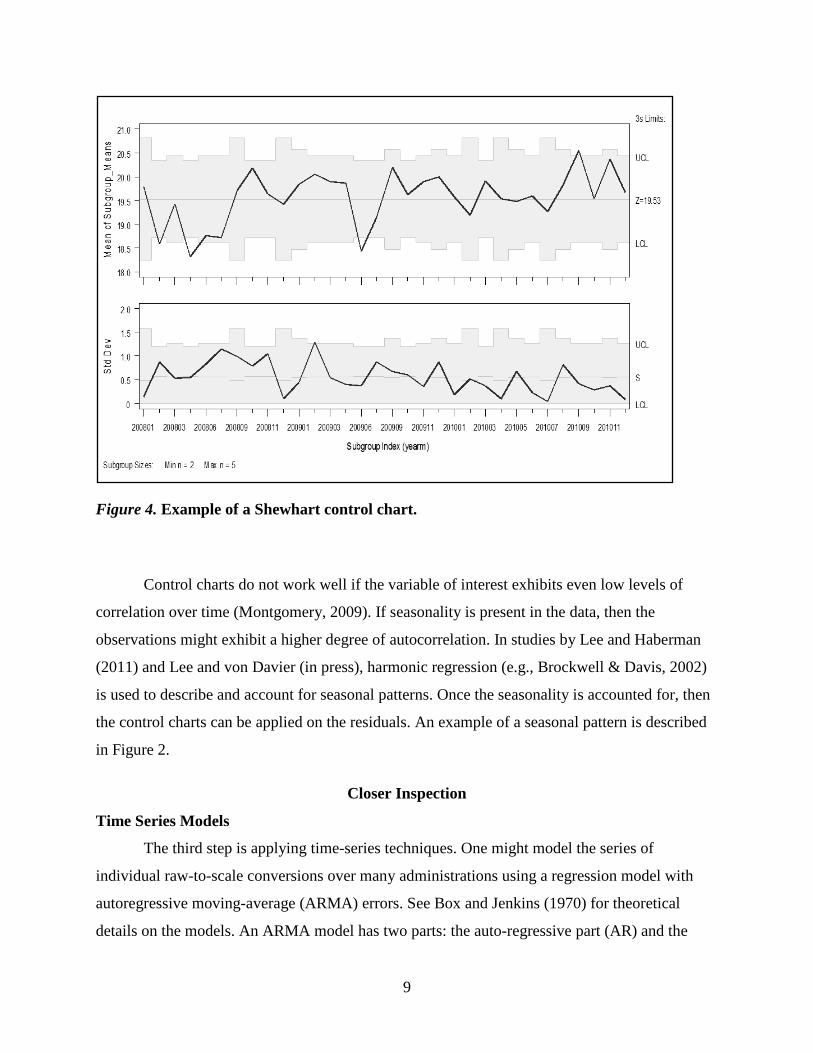
Charts and a Visual Inspection
The second step is to inspect Shewhart control charts for individual or average of the
means of scaled scores (see Figure 4 for an example of a Shewhart control chart for average of
the means of scaled scores). The Shewhart control chart has a baseline and upper and lower
limits that are symmetric about the baseline. This particular method is described here in more
detail because it is simpler to implement than others while being very useful for detecting trends.
8
Measurements are plotted on the chart versus a time line. The baseline is the process mean,
which is estimated by using the average from historical data (mean of the means). Control limits
are computed from the process standard deviation (the standard deviation of the means4). The
upper (UCL) and lower (LCL) control limits are
UCL = mean of means + k (process standard deviation)
and (1)
LCL = mean of means – k (process standard deviation),
where k is the distance of the control limits from the baseline (mean of means), expressed in
terms of standard deviations units. When k is set to 3, the charts are called 3-sigma control charts
(see National Institute of Standards and Technology [NIST], n.d.; Western Electric Company,
1958).
One visually inspects the control charts and identifies outliers. Usually, the variability of
the process is monitored as well. Measurements that are outside the limits are considered to be
out of control according to various rules (see Lee & von Davier, in press; NIST, n.d.; or Western
Electric Company, 1958). The challenge is that the chart leads to a multiple comparison. The
simplest rule is to declare that an outlier is a point that is outside the 3 sigma band. Other rules
are more stringent and might increase the probability of a false alarm. See, for example, the
Western Electric Company rules (Western Electric Company, 1958). The chart properties are
derived under the assumptions that the parameters of the process, the means and standard
deviations, are known. When the estimates of these parameters are not computed based on a
large amount of data, the chart might lead to false alarms. A major disadvantage of a Shewhart
control chart is that the chart uses only the information contained in the last sample observation
and it ignores any information given by the entire sequence of points. This feature makes
Shewhart control charts relatively insensitive to small process shifts. Therefore, as recommended
by Lee and von Davier (in press), CUSUM charts should be inspected next. See Montgomery
(2009) for a definition of CUSUM charts. Note that the standard assumptions for control charts
are that the data are normally and independently distributed (an assumption that might not
always be met). The CUSUM chart might be able to detect the point at which a process change
has occurred.
9
Figure 4. Example of a Shewhart control chart.
Control charts do not work well if the variable of interest exhibits even low levels of
correlation over time (Montgomery, 2009). If seasonality is present in the data, then the
observations might exhibit a higher degree of autocorrelation. In studies by Lee and Haberman
(2011) and Lee and von Davier (in press), harmonic regression (e.g., Brockwell & Davis, 2002)
is used to describe and account for seasonal patterns. Once the seasonality is accounted for, then
the control charts can be applied on the residuals. An example of a seasonal pattern is described
in Figure 2.
Closer Inspection
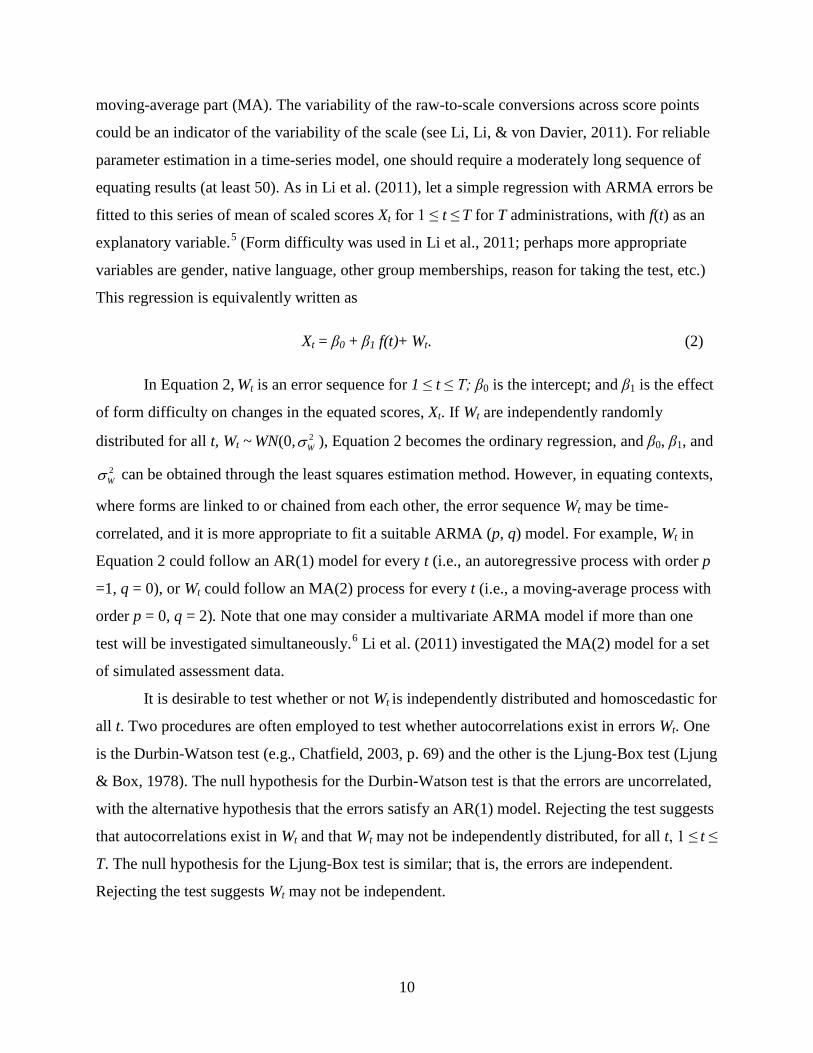
Time Series Models
The third step is applying time-series techniques. One might model the series of
individual raw-to-scale conversions over many administrations using a regression model with
autoregressive moving-average (ARMA) errors. See Box and Jenkins (1970) for theoretical
details on the models. An ARMA model has two parts: the auto-regressive part (AR) and the
10
moving-average part (MA). The variability of the raw-to-scale conversions across score points
could be an indicator of the variability of the scale (see Li, Li, & von Davier, 2011). For reliable
parameter estimation in a time-series model, one should require a moderately long sequence of
equating results (at least 50). As in Li et al. (2011), let a simple regression with ARMA errors be
fitted to this series of mean of scaled scores Xt for 1 ≤ t ≤ T for T administrations, with f(t) as an
explanatory variable.5 (Form difficulty was used in Li et al., 2011; perhaps more appropriate
variables are gender, native language, other group memberships, reason for taking the test, etc.)
This regression is equivalently written as
Xt = β0 + β1 f(t)+ Wt. (2)
In Equation 2, Wt is an error sequence for 1 ≤ t ≤ T; β0 is the intercept; and β1 is the effect
of form difficulty on changes in the equated scores, Xt. If Wt are independently randomly
distributed for all t, Wt ~ WN(0, 2
Wσ ), Equation 2 becomes the ordinary regression, and β0, β1, and
2Wσ
can be obtained through the least squares estimation method. However, in equating contexts,
where forms are linked to or chained from each other, the error sequence Wt may be time-
correlated, and it is more appropriate to fit a suitable ARMA (p, q) model. For example, Wt in
Equation 2 could follow an AR(1) model for every t (i.e., an autoregressive process with order p
=1, q = 0), or Wt could follow an MA(2) process for every t (i.e., a moving-average process with
order p = 0, q = 2). Note that one may consider a multivariate ARMA model if more than one
test will be investigated simultaneously.6 Li et al. (2011) investigated the MA(2) model for a set
of simulated assessment data.
It is desirable to test whether or not Wt is independently distributed and homoscedastic for
all t. Two procedures are often employed to test whether autocorrelations exist in errors Wt. One
is the Durbin-Watson test (e.g., Chatfield, 2003, p. 69) and the other is the Ljung-Box test (Ljung
& Box, 1978). The null hypothesis for the Durbin-Watson test is that the errors are uncorrelated,
with the alternative hypothesis that the errors satisfy an AR(1) model. Rejecting the test suggests
that autocorrelations exist in Wt and that Wt may not be independently distributed, for all t, 1 ≤ t ≤
T. The null hypothesis for the Ljung-Box test is similar; that is, the errors are independent.
Rejecting the test suggests Wt may not be independent.
11
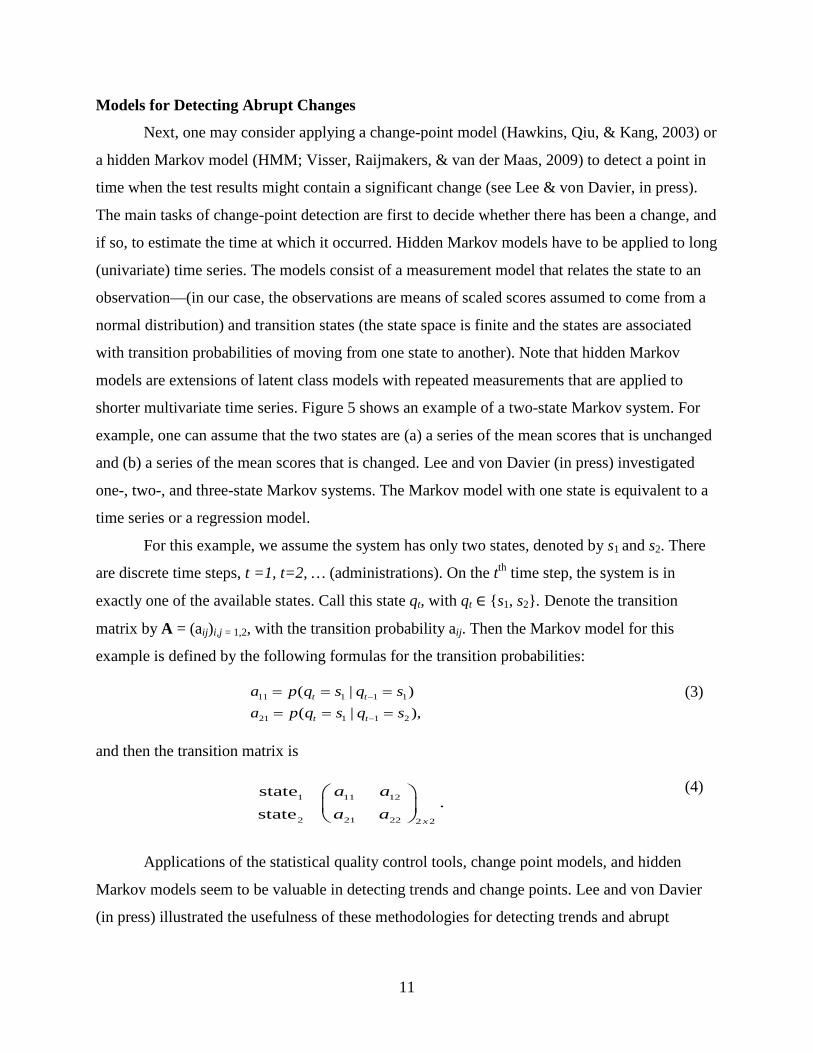
Models for Detecting Abrupt Changes
Next, one may consider applying a change-point model (Hawkins, Qiu, & Kang, 2003) or
a hidden Markov model (HMM; Visser, Raijmakers, & van der Maas, 2009) to detect a point in
time when the test results might contain a significant change (see Lee & von Davier, in press).
The main tasks of change-point detection are first to decide whether there has been a change, and
if so, to estimate the time at which it occurred. Hidden Markov models have to be applied to long
(univariate) time series. The models consist of a measurement model that relates the state to an
observation—(in our case, the observations are means of scaled scores assumed to come from a
normal distribution) and transition states (the state space is finite and the states are associated
with transition probabilities of moving from one state to another). Note that hidden Markov
models are extensions of latent class models with repeated measurements that are applied to
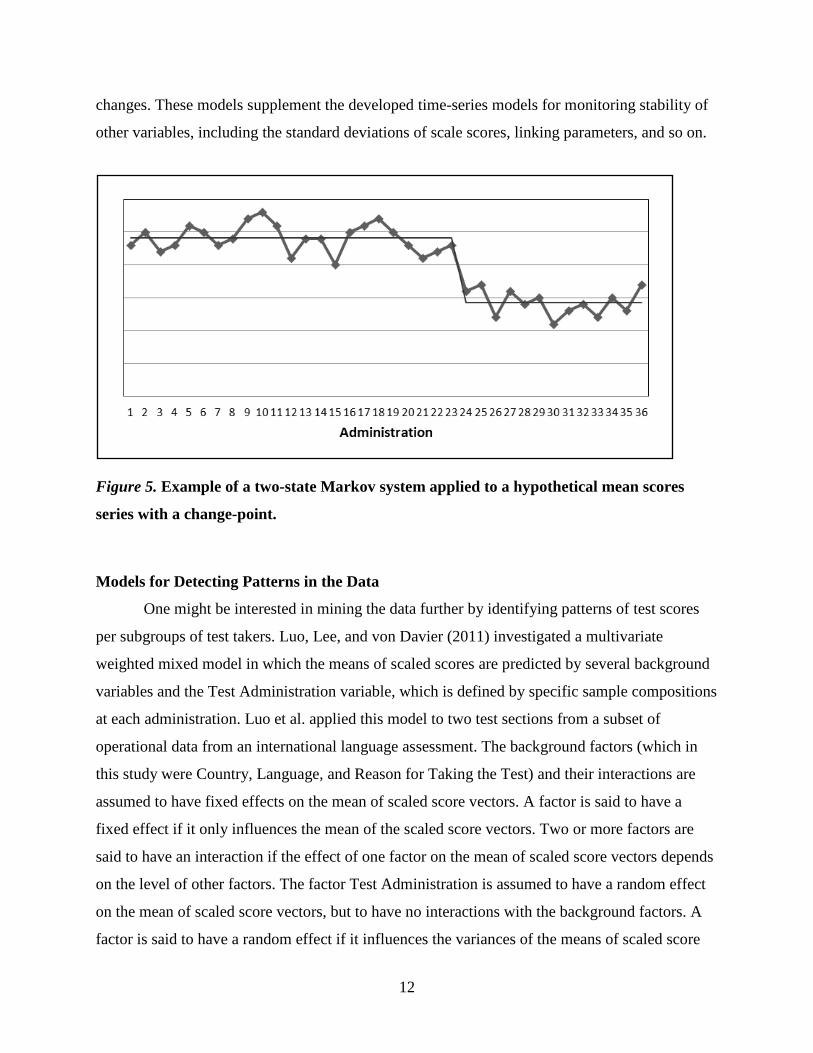
shorter multivariate time series. Figure 5 shows an example of a two-state Markov system. For
example, one can assume that the two states are (a) a series of the mean scores that is unchanged
and (b) a series of the mean scores that is changed. Lee and von Davier (in press) investigated
one-, two-, and three-state Markov systems. The Markov model with one state is equivalent to a
time series or a regression model.
For this example, we assume the system has only two states, denoted by s1 and s2. There
are discrete time steps, t =1, t=2, … (administrations). On the tth time step, the system is in
exactly one of the available states. Call this state qt, with qt ∈ {s1, s2}. Denote the transition
matrix by A = (aij)i,j = 1,2, with the transition probability aij. Then the Markov model for this
example is defined by the following formulas for the transition probabilities:
(3)
and then the transition matrix is
(4)
Applications of the statistical quality control tools, change point models, and hidden
Markov models seem to be valuable in detecting trends and change points. Lee and von Davier
(in press) illustrated the usefulness of these methodologies for detecting trends and abrupt
11 1 1 1
21 1 1 2
( | )( | ),
t t
t t
a p q s q sa p q s q s
−
−
= = == = =
1 11 12
2 21 22 2 2
state.
statex
a aa a
12
changes. These models supplement the developed time-series models for monitoring stability of
other variables, including the standard deviations of scale scores, linking parameters, and so on.
Figure 5. Example of a two-state Markov system applied to a hypothetical mean scores
series with a change-point.
Models for Detecting Patterns in the Data
One might be interested in mining the data further by identifying patterns of test scores
per subgroups of test takers. Luo, Lee, and von Davier (2011) investigated a multivariate
weighted mixed model in which the means of scaled scores are predicted by several background
variables and the Test Administration variable, which is defined by specific sample compositions
at each administration. Luo et al. applied this model to two test sections from a subset of
operational data from an international language assessment. The background factors (which in
this study were Country, Language, and Reason for Taking the Test) and their interactions are
assumed to have fixed effects on the mean of scaled score vectors. A factor is said to have a
fixed effect if it only influences the mean of the scaled score vectors. Two or more factors are
said to have an interaction if the effect of one factor on the mean of scaled score vectors depends
on the level of other factors. The factor Test Administration is assumed to have a random effect
on the mean of scaled score vectors, but to have no interactions with the background factors. A
factor is said to have a random effect if it influences the variances of the means of scaled score
13
vectors but not the mean of the means of scaled score vectors. The random effect accounts for
the variability in the sample composition across test administrations. The response of the model
is the mean of scaled scores of each cross-class group for each administration. Given the
composition of a test administration, the variances of the mean of scaled-score vectors for each
group are inversely proportional to their group sizes, and therefore, the weight used in the
weighted mixed model is the group size. Luo et al. concluded that the interaction of Language
and Reason has fixed effects on the mean of scaled scores of one of the test sections and that the
interaction of Country and Language has fixed effects on the mean of scaled scores of the other
test section. In addition, Luo et al.’s study seemed to indicate that the random effect of Test
Administration has a significant effect on the mean of scaled scores of the two test sections
separately. They hypothesized that the variability of the composition of the sample across
administrations is the source of this significant effect.
The results from the multivariate weighted mixed model can be further applied to identify
unusual results at a specific administration. A target population of all test takers has to be
defined. If the population is known and the samples at each administration are drawn from it,
then a prediction interval can be calculated. If for any of the analyzed tests, an observed mean of
scaled score is outside the prediction interval, this indicates that there might be some other
factors that might impact the mean of the scaled scores but are not accounted for in the model.
Hence, the Luo et al. study (2009) suggested that building a target population with a specific
composition provides a way to detect unusual test administrations. Specifying a target population
is a challenging undertaking for most educational assessments that do not have a sampling
scheme underlying the data collection. Survey assessments, on the other hand, do have a clear
target population, and various subgroups can be assigned weights appropriately. Defining a
target population for complex educational assessments and creating appropriate weights for its
subgroups is an area that needs further research. The studies conducted by Qian et al. (2012) and
Duong and von Davier (2012) are preliminary attempts to address these questions.
The study by Haberman, Guo, Liu, and Dorans (2008) examined trends in the SAT
means and consistency of SAT raw-to-scale conversions for about 54 SAT administrations
across 9 years. Descriptive statistics and analysis of variance were used. This method suggested a
reasonable upper bound on errors and provided information concerning the stability of test
construction, among other sources of variation.
14
Conclusions
This paper presents a new perspective on quality control in assessments that is
appropriate for the new generation of tests that have a continuous or almost continuous
administration mode and that are delivered on the computer (and therefore, allow for the
collection of additional information, such as response time). These types of assessments include
linear tests but also computer adaptive tests, multistage adaptive tests, and linear on-the-fly tests.
Moreover, the tools described here can be applied to other assessment variables of interest.
The perspective I take on scale maintenance is that equating designs, samples, and
common items should be monitored, tightly controlled, and regularly adjusted as needed to
ensure the preservation of the meaning of the test scores. This perspective follows the
recommendations of Dorans (2002), who described the scale of the reported scores as an
infrastructure of the test, which as with any infrastructure, needs careful and regular
maintenance. Consequently, the need to monitor and maintain the stability of the scale score
leads to new approaches for control and adjustment, such as tightening the control of the linking
parameters, adjusting the samples to match a target distribution, and investigating relevant
equating subgroups in order to obtain a better equating procedure (for details, see the papers of
Duong & von Davier, 2012; Haberman & Yang, 2011; Qian et al., 2012).
As with all new applications, the approaches described here require more in-depth
analyses to refine them for matching the type of data from educational assessments. Other
promising research investigates the usefulness of dynamic linear models applied to the
consistency of linked IRT parameters (Wanjohi, van Rijn, & von Davier, 2012) or the
application of linear mixed effects models applied to individual scores (Liu, Lee, & von Davier,
2012). Future research might use explorative data mining techniques on the response data and
background variables and process data from many test administration over several years. Yao,
von Davier, and Haberman (2012) are working on such an application. The theoretical and
practical implications of the issues discussed in this paper are crucial for all standardized
assessments with nontraditional equating designs and features.
15
References
Allalouf, A. (2007). An NCME instructional module on quality control procedures in the
scoring, equating, and reporting of test scores. Educational Measurement: Issues and
Practice, 26(1), 36–46.
Armstrong, R. D., & Shi, M. (2009). Model-free CUSUM methods for person fit. Journal of
Educational Measurement, 46, 408–428.
Box, G. E. P., & Jenkins, G. M. (1970). Time series analysis, forecasting, and control. Oakland,
CA: Holden-Day.
Brockwell, P. J., & Davis, R. A. (2002). Introduction to time-series and forecasting (2nd ed.).
New York, NY: Springer-Verlag.
Chatfield, C. (2003). The analysis of time-series: An introduction (6th ed.). London, England:
Chapman and Hall.
Dorans, N. J. (2002). Recentering and realigning the SAT score distributions: How and why.
Journal of Educational Measurement, 39, 59-84.
Dorans, N. J., Moses, T., & Eignor, D. (2011). Equating test scores: Towards best practices. In
A. A. von Davier (Ed.), Statistical models for test equating, scaling, and linking (pp. 21–
42). New York, NY: Springer-Verlag.
Dorans N. J., & Liu, J. (2009). Score equity assessment: Development of a prototype analysis
using SAT mathematics test data across several administrations (ETS Research Report
No. RR-09-08). Princeton, NJ: ETS.
Duong, M., & von Davier, A. A. (2012). Observed-score equating with a heterogeneous testing
population. International Journal of Testing, 12(3), 224–251.
Haberman, S. (2009). Linking parameter estimates derived from an item response model through
separate calibrations (ETS Research Report No. RR-09-40). Princeton, NJ: ETS.
Haberman, S., Guo, H., Liu, J., & Dorans, N. (2008). Consistency of SAT I: Reasoning score
conversions (ETS Research Report No. RR-08-67). Princeton, NJ: ETS.
Haberman, S., & Yang, Z. (2011, April). Regression-based simultaneous linkage of a large
number of test forms via item response theory. Paper presented at the meeting of the
American Educational Research Association, New Orleans, LA.
Hawkins, D. M., Qiu, P., & Kang, C. W. (2003). The change point model for statistical process
control. Journal of Quality Technology, 35, 355–366.
16
Lee, Y.-H., & Haberman, S. (2011). Application of harmonic regression to monitor scale
stability. Manuscript in preparation.
Lee, Y.-H., & von Davier, A. A. (in press). Monitoring scale scores over time via quality control
tools and time series techniques. Psychometrika.
Li, D. (2011, April). Asymptotic means and variances for IRT true score equating. Paper
presented at the meeting of the American Educational Research Association, New
Orleans, LA.
Li, D., Li, S., & von Davier, A. A. (2011). Applying time-series analysis to detect scale drift. In
A. A. von Davier (Ed.), Statistical models for test equating, scaling, and linking (pp.
327–346). New York, NY: Springer-Verlag.
Liu, M., Lee, Y.-H, & von Davier, A. A. (2012, July). Detection of unusual administrations
using a linear mixed effects model. Paper presented at the international meeting of the
Psychometric Society, Lincoln, Nebraska.
Ljung, G., & Box, G. (1978). On a measure of lack of fit in time-series models. Biometrika, 65,
297–303.
Luo, L., Lee, Y.-H., & von Davier, A. A. (2011, April). Pattern detection for scaled score means
of subgroups across multiple test administrations. Paper presented at the meeting of the
American Educational Research Association, New Orleans, LA.
Meijer, R. R. (2002). Outlier detection in high-stakes certification testing. Journal of
Educational Measurement, 39, 219–233.
Montgomery, D. C. (2009). Introduction to statistical quality control (6th ed.). Hoboken, NJ:
Wiley.
National Institute of Standards and Technology. (n.d.). NIST/SEMATECH e-handbook of
statistical methods. Retrieved from
http://www.itl.nist.gov/div898/handbook/pmc/section3/pmc32.htm
Omar, M. H. (2010). Statistical process control charts for measuring and monitoring temporal
consistency of ratings. Journal of Educational Measurement, 47, 18–35.
Qian, J., von Davier, A. A., & Jiang, Y. (2012, July). Weighting test samples in IRT linking and
equating. Paper presented at the international meeting of the Psychometric Society,
Lincoln, Nebraska,
17
Van Krimpen-Stoop, E. M. L. A., & Meijer, R. R. (2001). CUSUM-based person-fit statistics for
adaptive testing. Journal of Educational and Behavioral Statistics, 26, 199–217.
Veerkamp, W. J. J., & Glas, C. A.W. (2000). Detection of known items in adaptive testing with a
statistical quality control method. Journal of Educational and Behavioral Statistics, 25,
373–389.
Visser, I., Raijmakers, M. E. J., & van der Maas, H. L. J. (2009). Hidden Markov models for
individual time series. In J. Valsiner, P. C. M. Molenaar, M. C. D. P. Lyra, & N.
Chaudhary (Eds.), Dynamic process methodology in the social and developmental
sciences (pp. 269–289). New York, NY: Springer.
Wanjohi, R., van Rijn, P. & von Davier, A. A. (2012, July). A state space approach to modeling
IRT and population parameters from a long chain of test administrations. Paper
presented at the international meeting of the Psychometric Society, Lincoln, Nebraska.
Western Electric Company. (1958). Statistical quality control (2nd ed.). New York, NY: Author.
Yao, L., von Davier, A. A., & Haberman, S. (2012). Mining the assessment data. Manuscript in
progress.
Zumbo, B. D. (2007). Validity: foundational issues and statistical methodology. In C. R. Rao &
S. Sinharay (Eds.), Handbook of statistics: Vol. 26. Psychometrics (pp. 45–79). The
Netherlands: Elsevier Science B.V.

18
Notes
1 Note that the discussion provided in this paper is appropriate for tests for which the distribution
of the ability of the test takers is assumed to be unchanged over time (except for seasonality
effects that are discussed later in the paper). This assumption insures that the stochastic process
(resulted after the seasonality was accounted for) is stationary, which in turn, is a required
assumption for the time-series models. Therefore, this type of analysis is not appropriate for
longitudinal data or vertical scaling data.
2 Individual security breaches are also detrimental to test validity. Different procedures are used
additionally to detect those situations.
3 In most operational programs, equating is done under the assumption of similar ability
distributions across administrations.
4 The sample standard deviation might be biased. See the National Institute of Standards and
Technology (n.d.) for the appropriate formulas for the expected value of the sample standard
deviation and for the standard deviation of the sample standard deviation.
5 Item parameter estimates need to be put on the same IRT scale before score equating so that the
average form difficulty can be compared from one test form to another.
6 Equation 2 shows the use of a time-series model as a data mining tool; that is, as a tool for
detecting significant effects of factors of interests. The model in Equation 2is also called an
ARMA with an exogenous input model or an ARMAX model. One could apply the time-series
model directly to Xt, as is the case with the harmonic regression and with the hidden Markov
systems (with one state).