Embed Size (px)
Citation preview

Date: July 7, 2008 Contract No. 5020334
The Use of Randomized Field Experiments to Assess
the Effectiveness of Government Programs to Support Business Innovation: A Feasibility Study
Submitted To:
Industry Canada Submitted By:
Social Research and Demonstration Corporation
The views expressed in this report do not reflect those of Industry Canada or the Government of Canada.


-i-
Table of Contents
Page
Table of Contents ........................................................................................................................... i
Executive Summary .......................................................................................................................1
I. Introduction ................................................................................................................................5
The Policy Issue ...........................................................................................................................5 Tax CreDits ..................................................................................................................................7 Grants and Contributions .............................................................................................................7 Research Questions ......................................................................................................................8
II. Research Strategy ...................................................................................................................11
Survey Methods .........................................................................................................................11 Non-experimental methods using a comparison group .............................................................12
Regression Analysis ...............................................................................................................12 Matching ................................................................................................................................13 Natural Experiments ..............................................................................................................14
Experimental methods ...............................................................................................................15 Other Factors related to Field Experiments ...............................................................................17
External Validity ....................................................................................................................17 Sample Choice and Program Impacts ....................................................................................17 The Timing of Random Assignment......................................................................................18 The Length of Experimental Program and Program Impacts ................................................19 Experiments as a “Black Box” ...............................................................................................19 Risk of Contamination ...........................................................................................................20
Experiments with firms ..............................................................................................................20 Energy Experiments ...............................................................................................................20 Employment Programs...........................................................................................................20 Health-care Providers.............................................................................................................21 Daycare Providers ..................................................................................................................21 Tax-Credit Programs ..............................................................................................................22 Differences Between Experiments with Firms and Individuals ............................................23
Conclusion .................................................................................................................................23 III. Overview of potential experiments/programs ....................................................................25
Experiment I: Program that mimics an additional SR&ED refundable tax credit .....................25 Experiment II: A program that gives out additional R&D grants and/or contributions to selected firms .............................................................................................................................25 Experiment III: An experiment that compares the tax credit program with the grant/contribution program ........................................................................................................26
IV. Experiment I: SR&ED Tax Credit (Treatment A) ............................................................27
Overview of SR&ED tax credits................................................................................................27 A grant that mimics a refundable “tax credit” program .............................................................28
Figure 1: Experiment I — Tax Credits ..........................................................................29 Targeting ....................................................................................................................................30

-ii-
Advance Planning ......................................................................................................................31 Conclusion .................................................................................................................................31
V. Experiment II: Grants and Contributions (Treatment B) ..................................................33
Overview of Grants and Contributions ......................................................................................33 National Research Council Industrial Research Assistance Program (NRC-IRAP) .............33 The Atlantic Canada Opportunities Agency (ACOA) Atlantic Innovation Fund..................34 Provincial funds .....................................................................................................................34
The Experiment ..........................................................................................................................35 Figure 2: Experiment II — Grants .................................................................................36
conclusion ..................................................................................................................................36 conclusion ..................................................................................................................................37
VI. Experiment III: Comparing tax credits with grants and contributions
(Treatment A vs. Treatment B) ............................................................................................39
Figure 3: Experiment III — Tax Credits and Grants .....................................................40 Conclusion .................................................................................................................................40
VII. Measures and Data Sources ................................................................................................41
Output Measures ........................................................................................................................41 Innovation ..............................................................................................................................41 Patents ....................................................................................................................................43 Corporate Financial Output Measures ...................................................................................43
Input measures ...........................................................................................................................44 Data Sources ..............................................................................................................................45
Corporate Income Tax Data ...................................................................................................45 Program Management Information Systems (PMIS) Data ....................................................46 Surveys ...................................................................................................................................47
VIII. Sample Size .........................................................................................................................49
Table 1: Experiment Required for Experiment I – Tax credits .....................................50 Table 2: Sample Sizes Required for Experiment II – Grants .........................................51 Table 3: Sample Sizes required for Experiment III – Tax credits and grants ................52
IX. Timelines ................................................................................................................................53
Table 4: Timelines .........................................................................................................53 X. Budget ......................................................................................................................................55
Table 5: Budget Estimates for Experiment I – Tax Credit ............................................56 Table 6: Budget Estimates for Experiment II -- Grants .................................................56 Table 7: Budget Estimates for Experiment III ...............................................................57
XI. Conclusions ............................................................................................................................59
Annex I: Technical Aspects of Randomly Assigning Firms .....................................................63
Annex II: Definitions of Firms ....................................................................................................65
What is a firm? ...........................................................................................................................65 What is a small firm? .................................................................................................................66
References .....................................................................................................................................67

-1-
Executive Summary
Canada’s productivity growth has been lagging the United States. Canada also lags behind
many OECD countries in terms of private-sector R&D and patents. However, Canada provides
some of the highest government financial support for Research and Development (R&D). The
federal government spent $2.8 billion in R&D tax credits and $4.7 billion in direct R&D
subsidies in 2004. Yet, there is scarcity of rigorous evidence on the effectiveness of government
financial support to promote R&D expenditures and innovation.
Randomized field experiments are widely regarded as the “gold standard” of policy evidence.
A field experiment randomly divide study participants into a program group and a control group.
Random assignment ensures that there are no systematic differences in the characteristics of
these groups. The program group receives the program being tested while the control group does
not. As this is the only initial difference between the two groups, any subsequent differences in
outcomes between the two groups can reliably be attributed to the tested program.
Field experiments have been widely used to test the effect of various social-program
interventions on individuals. However, they have been less frequently used to test government
programs for firms and have never been used to test financial support for private-sector R&D.
This paper examines whether it is feasible to use field experiments to determine the effectiveness
of financial support programs to increase private-sector R&D.
This report focuses on incremental support for the R&D expenditures of smaller firms for
practical reasons of obtaining outcome measures, cost and sample size. The report focuses on
R&D expenditures because other measures of interest, such as innovation, are expensive to
collect, difficult to interpret and would require prolonging an already lengthy experiment. Large
firms are excluded due to the expected cost of the treatment and their relative rarity. The report
focuses on incremental support to avoid the cost of funding entire research projects. Firms that
have not received the appropriate type of support in the past are excluded because they will be
difficult to recruit and would require large samples to obtain enough firms willing to take
advantage of any R&D financial support. As a result, this report is primarily focused on
increasing the intensity of R&D expenditure among previous R&D performers rather than using
financial support to encourage R&D among firms who are not currently conducting R&D.

-2-
This report examines various technical aspects of the random assignment of firms, looks at
data availability and assesses technical feasibility. In order to assess financial feasibility, three
examples of potential field experiments are used to determine sample sizes required, timelines
involved and to derive budget estimates.
Experiment I would provide an additional refundable tax credit to program group members
who are eligible for the existing R&D refundable tax credits. Control group members would
receive the current tax credits. The experiment would test whether the offer of a more generous
refundable tax credit for R&D would increase private R&D expenditures.
Experiment II would randomly assign firms that are likely to apply for a direct government
grant for R&D, such as the Industrial Research and Assistance Program (IRAP). Members of the
control group with accepted grant proposals would receive the usual R&D grant that they are
eligible for. Those in the program group with accepted proposals would receive a more generous
grant. The difference between the two groups would determine the effect of the potential to
receive more generous R&D funding on private R&D expenditures.
Experiment III would essentially combine Experiment I and Experiment II into a single
experiment. Experiment III would have two program groups and one control group. Participants
would be firms that are eligible for tax credit and also be likely to apply for a grant for R&D.
One program group would receive an offer of an additional R&D tax credit as in Experiment I.
The other program group would be potentially eligible for a more generous grant as in
Experiment II. The additional funding for the two program groups would the same. The control
group would receive the tax credits and grants to which they would normally be entitled.
Comparing each program group individually to the control group would answer similar research
questions as Experiment I and Experiment II. A comparison of the R&D investments made by
the two program groups would determine the relative effectiveness of tax credits versus grants in
increasing R&D expenditures.
The paper concludes that it is technically feasible to conduct a field experiment on the effect
of a marginal increase in refundable R&D tax credits on R&D expenditures (Experiment I). This
is possible (without legislation) by using a program that would mimic most of the features of a
refundable tax credits. In addition, this program would be relatively simple to operate as it would
make extensive use of existing CRA tax administration.
-3-
A field experiment testing the effect of an extra grant/contribution subsidy for R&D,
Experiment II, is also technically feasible. As with the tax credit experiment, it would rely on the
infrastructure and client lists of an existing funding organization. This reliance gives a field
experiment several advantages. First, it reduces administration and set-up costs. Second, it
provides credibility for the proposal selection process which is, in part, idiosyncratic to each
organization. Third, it provides an established list of clients that would be willing to submit grant
proposals. However, this reliance on an existing funding organization requires the consent of that
organization. Assessing the feasibility of obtaining this consent is beyond the scope of this paper.
Experiment III has two program groups — one group receiving the offer of an extra tax
credit as in Experiment I and the other program group having the potential to receive additional
grants/contributions as in Experiment II. Experiment III is more administratively complex than
the other experiments. In addition, it requires the largest sample but has the smallest recruitment
pool. Participants must be eligible to both SR&ED tax credits and grants/contributions in order
to test the effect of extra credits or grant/contributions.
All three experiments would be lengthy. Several factors are contributing to increase the
length of such experiments. The first factor is the program operation time which would need to
recognize the planning time necessary for firms to prepare and execute an R&D project. A short
program operation period would not capture the longer run effects of R&D supports that are the
central interest of policy makers. The second factor is that corporate tax data — a central source
of information for firms’ R&D expenditures — are often not available several years after the end
of the firm’s taxation year.
Finally, all three experiments would be expensive. This paper has used a series of
assumptions to generate approximate budgets. The lowest cost field experiment, Experiment I,
would approach $25 million and Experiment III would cost at least twice that amount under
optimistic assumptions. While a $25-$50 million cost for an experiment may appear prohibitive
at first sight, it represents much less than 1% of the total amount of government aid provided
yearly to promote private sector R&D investment
One reason for the high cost is that R&D activities are expensive. A second reason is that an
experiment must run for a substantial period of time in order to capture the long-term effects of
the government support program. A third reason is that to run an experiment of this nature would

-4-
require a relatively large number of firms to participate due to the variability of R&D
expenditures from one firm to another.
In conclusion, this paper has demonstrated the technical feasibility of conducting field
experiments using firms. The central concerns over the feasibility of conducting a field
experiment involving R&D support measures are their length and their cost. Future research
could resolve the remaining issues such as precise variability of the data, firm sampling issues,
program operation expenses and other design issues.

-5-
I. Introduction
This paper examines the feasibility of using randomized field experiments to determine the
effectiveness of government financial support to encourage Research and Development (R&D)
investments. Government financial support — through grant/contributions or tax credits —
attempts to encourage R&D investments with a view to foster innovation. In turn, innovation is a
key a determinant of productivity, employment, trade and living standards. Many research
studies have tried to determine the effectiveness of government financial support in promoting
R&D and innovation. Yet, none have used the “gold standard” of evaluation — randomized field
experiments — for this purpose.
This study briefly reviews the policy issues surrounding innovation and R&D. Then it
reviews the merits of experimental and non-experimental research methods. The study then
reviews field experiments involving firms and outline three R&D support experiments. This is
followed by a review of specific outcome measures, data sources and sample frames. The final
chapters present sample sizes, timelines and budgets for the three experiments. A summary and
conclusions form the final section of this report.
THE POLICY ISSUE
Canada’s growth in productivity once led the United States but has fallen behind. Since 1984,
Canada’s productivity has decreased relative to the United States, especially in the post-2000
period. In 2004 Canada’s level of labour productivity relative to that of the United States was
73.7 per cent.
One determining factor of productivity growth is innovation. This explains the growing
interest in innovation, the need to define it, to measure it, and to promote it. For the purposes of
this paper, innovation is defined as a new or significantly improved product that can be either a
good or a service.. It is a firm output (as opposed to an input) and an ultimate objective of policy.
However, innovation is hard to define, hard to measure uniformly and, critically, hard to verify
objectively. The latter property means that it is hard to subsidize directly.

-6-
However, it is possible to subsidize R&D expenditures. R&D expenditure, an input measure,
can be financially supported by government because it is easier to define and verify than an
output measure such as innovation. R&D investments can produce innovation if they result in a
new or improved commercial process or product. These innovations can, in turn, lead to
productivity improvements and higher standards of living. The OECD has estimated that every
percentage point increase in business R&D expenditures as a proportion of GDP leads to a 12-
per-cent increase in income per person in the long run (OECD 2003).
Canada currently has some of the most generous government support in the form of targeted
tax measures or direct subsidies to promote R&D investments. For example, its Scientific
Research and Experimental Development (SR&ED) tax credits cost about $2.8 billion in 2004.
There was also $4.7 billion of direct federal spending on R&D in 2004 (Parsons and Phillips
2007). Its tax regime on R&D is among the top five in the OECD if provincial incentives are
included. In addition, Canada has one of the lowest marginal effective tax rates on R&D in the
OECD and the lowest in the G7 (Department of Finance 2007).
The disturbing fact is that Canada’s private-sector R&D investments as a proportion of GDP
fall below the levels prevailing in Japan, the United States, Germany, and France. Canada ranks
14th in business expenditures on R&D as a percentage of GDP among OECD countries.
Similarly, the number of patents produced in Canada is low compared with many other OECD
countries. Canadian firms also invest less in new machinery and equipment, which embody the
latest innovations, than do many of their competitors.
Given the importance of R&D, it is important to know what policies would increase the
amount of R&D done by private firms in Canada. If markets allowed firms to capture all of the
benefits of their R&D investment, then subsidizing R&D would lead to inefficiencies and lower
output for the economy as a whole. However, it is widely believed that individual firms cannot
capture all of the benefits of their private R&D. Some of those benefits spill over to other
members of society. Under these circumstances, private-sector R&D will be underprovided.
Government financial support or incentives may help achieve the optimal amount of R&D
spending.
This report focuses on two specific types of financial support measures for R&D
expenditures — tax credits and grants/contributions.

-7-
TAX CREDITS
The Scientific Research and Experiment Development (SR&ED) investment tax credit (ITC)
applies to taxes payable and is partially or fully refundable for smaller businesses. This paper
will focus on the refundable invest tax credit for smaller businesses because these credits are
given in small amounts to a large number of firms that will collect those credits quickly. These
properties provide the greatest potential for conducting a shorter, less expensive experiment with
sufficient participants. Small Canadian-controlled Private Corporations (CCPCs) can earn a 35
per cent refundable tax credit on their first $2 million of qualified expenses. Provincial
governments, with the exception of Alberta and Prince Edward Island, also have R&D tax
credits.
GRANTS AND CONTRIBUTIONS
A second type of government financial support to R&D is provided through direct grants
and/or contributions. In this model, firms submit proposals for R&D projects subsidies to a
government organization. Government officials then assess those proposals and fund the most
desirable combination of proposals that the funding organization can afford. However, there is
controversy over the government’s ability to correctly select the right proposals — to “pick
winners.” In addition, these programs often require considerable resources to select proposals
and ensure appropriate use of public funds. These selection and monitoring expenses are often
unrelated to the size of the subsidy. This means that administration costs can absorb a substantial
portion of any program that gives (relatively) small grants to small firms.
There are many government organizations that give subsidies for R&D, featuring different
areas of specialization and funding models. Some focus on a specialized field of research while
others have broad mandates. Some funding organizations combine funding with a development
model — funding plus collaborative work or funding plus advice. The largest federal
organization granting R&D subsidies to small and medium size businesses is the National
Research Council’s Industrial Research Assistance Program (IRAP), which combines technical
and managerial guidance along with financial assistance. In contrast, the Ontario Innovation
Demonstration Fund provides contingent loans on approved projects but does not provide advice
or other assistance.

-8-
In conclusion, many measures suggest that Canada, relative to its size, has lower productivity
growth, fewer patents and less private-sector R&D expenditures than comparable developed
economies. To increase R&D investments and, indirectly, productivity, Canadian policy makers
have created a multi-faceted system of subsidies for R&D at both the federal and provincial
levels. These include tax credits, grants/contributions or contingent loans. Despite these efforts,
Canada still has a low rate of private-sector R&D. Under these circumstances, questions arise as
to the effectiveness of the current business support for R&D investments and whether or not
there is a need to change the mix of instruments used to increase R&D expenditures.
RESEARCH QUESTIONS
This report will focus on two research questions that are policy relevant and have the greatest
potential to be answered with a randomized field experiment. These questions are:
What is the marginal effect of increased financial support on private-sector R&D
expenditures?
What is the relative marginal effectiveness of different policy instruments in promoting R&D
expenditures?
The first question seeks to find the marginal effect on R&D expenditures of increasing the
existing level of government financial support directed at R&D. This question would compare
the existing level of support in a program (such as the current level of tax credits or R&D
grants/contributions) with a more generous level of support (such as larger grants or tax credits)
in the same program. The answer would assist policy makers in determining whether spending
more money in a given program (tax credits or subsidies) would increase R&D expenditures and
by how much. To answer this question, it is important to hold other factors constant such the
level of technical support provided and the expertise in selecting proposals.
The second question would compare the marginal effect on R&D expenditures of increasing
the level of financial support in one R&D support program relative to a financially equivalent
increase in another support program. The answer to this question would assist policy makers in
deciding which program to promote R&D should benefit from additional funding, if such
funding is available.

-9-
As will be shown later, this report focuses on incremental support for the R&D expenditures
of smaller firms in order to reduce costs and sample size. The report focuses on R&D
expenditures because other measures of interest, such as innovations, are expensive to collect,
difficult to interpret and would require prolonging an already lengthy experiment. Large firms
are excluded due to cost of treatment and their relative rarity. Firms that have not received the
appropriate type of support in the past are excluded because they will be difficult to recruit and
would require large samples to obtain enough firms willing to take advantage of any R&D
financial support. As a result, this report is primarily focused on increasing the intensity of R&D
expenditure among previous R&D performers rather than using financial support to encourage
R&D among firms who are not currently conducting R&D.
Randomized field experiments are a proven method of providing rigorous evidence to many
research questions. The remainder of this paper is, for the most part, devoted to determining
whether it is feasible to answer some of these two research questions through randomized field
experiments. But first the next section reviews the different methods that have been used or
could be used to assess the effectiveness of government financial support to R&D.


-11-
II. Research Strategy
This section reviews research methods that might be used to determine the effect of business
subsidies on R&D expenditures. First, it reviews non-experimental methods of program
evaluation. Second, it gives an overview of field experiments including their strengths,
weaknesses and other factors that can influence their interpretation and applicability. Third, it
concludes with a review of previous field experiments involving firms and technical issues
related to experiments with firms.
SURVEY METHODS
One simple method for evaluating the effectiveness of R&D spending is to survey firms that
received government financial support and ask them whether, in the absence of the program, the
R&D project would have proceeded at all, proceeded less rapidly or proceeded at a smaller size.
This transparent method requires no comparison group and can be done retrospectively. Finance
Canada and Revenue Canada (1996) used such a survey to conclude that SR&ED tax credits
increased R&D expenditures by 32 per cent.
However, there are reasons to doubt the reliability of this method. First, firms’ responses
might be influenced by a desire to please, an aversion to being critical or a desire to maintain a
desired program. In addition, firms suffer from the same problem as evaluators — they do not
have a valid counterfactual with which to compare their own behaviour. The human respondent
may have an imperfect memory or knowledge of the decision processes that resulted in the R&D.
Their responses may be coloured by the subsequent success or failure of the program or research
project. Finally, a manager of research, thinking mainly of technical issues, might believe that
the project would have gone ahead without the government support while the firm’s accountants,
thinking mainly of financial issues, might believe the opposite. Black et al. (2003) found that self
assessments of participants own program impacts bore little relationship to their objective
impacts.
-12-
NON-EXPERIMENTAL METHODS USING A COMPARISON GROUP
Most research methods require a valid counterfactual to establish what would have happened
in the absence of the program. This is done by selecting a comparison group of individuals, or
firms in our case, that did not receive the program.
The validity of these methods depends on the initial differences between the two groups. If
the program group and the comparison group are similar in both observed and unobserved
characteristics, then they will react similarly to both the studied program and any external or
confounding factors. Under these circumstances and with appropriate data, any reasonable
statistical method may do a reasonable job at removing remaining differences because these
remaining differences are small to begin with. A failure to control for unobserved differences
will have little effect on the outcome because these differences are small in the original data.
However, the larger the differences in observed and unobserved variables between the two
groups, the larger are the negative consequences of using inappropriate assumptions and
techniques.
Regression Analysis
A number of methods select a comparison group of firms that did not receive the financial
support as the counterfactual. These methods use statistical techniques and assumptions to
remove any underlying differences between the two groups of firms. One such method is
regression analysis. With the appropriate variables and specification, regression analysis can
control for any observed differences between the comparison group and the program group. In
addition, regression analysis attempts to control for unobserved differences that cause some
firms, but not others, to take advantage of the program using such techniques as the Heckman
selection technique (Heckman, 1979). If these unobserved differences are not controlled for or
are controlled for incorrectly, their influence on outcomes measures may be incorrectly attributed
to the program. For example, the results of the Heckman selection technique rely on the
assumption of normality of the unobserved characteristics.
Regression analysis can be used to make different types of comparisons with different types
of comparison groups. For example, a “pre-post” design uses a comparison group consisting of
the program group members prior to entering the program. The central advantages of this method
are that it does not require data on non-participants in the program and it can difference out

-13-
constant, linear unobserved effects. However, the pre-post method is weak as its results are
sensitive to the selection of the “pre” and “post” period.
A more robust design is the Difference-in-Difference method. In this method, a comparison
group is selected from available firms who did not receive the program. There is no formal
method for the selection of the comparison group or rejecting unsuitable firms. The pre-post
difference in the program group and the pre-post differences in the comparison group are
calculated. The latter difference is subtracted from the former to obtain an estimate of the
program effect. This pre-post differencing of both groups removes the effect of any constant,
linear, unobserved heterogeneity between firms but not other types of unobserved heterogeneity.
These remaining types of unobserved heterogeneity can cause bias in the difference-in-difference
estimates of a program by giving each group a different trend overtime that can be confused with
the effect of the program. In addition, the remaining differences can wholly or partially affect
how each group reacts to different observed and unobserved environmental shocks. It is difficult
to control these effects by regression techniques because: 1. the environmental shocks are often
unobserved in practice and; 2. the effects of shocks must be removed when they are due to
underlying difference between the two groups and they must be retained when they are due to the
program being studied. As a consequence, it is sometimes difficult to identify the true effect of
the program.
In addition, other methods (Heckman and Singer 1984) attempt to control for these
unobserved differences by modelling them as two or three constant values (called mass points)
that remain the same for the duration of the study. These unobserved components may affect the
impact of the treatment even if they do not affect participation in the treatment. However, in
many cases, unobserved factors, such as motivation and management quality, change over time.
At best, the varying portion will induce non-standard error terms and, at the worst, bias the
equation.
Matching
One popular method for choosing a comparison group is propensity-score matching. The
propensity score is the estimated probability (or “propensity”) of an individual being observed in
the program group rather than in the comparison group given their observed characteristics.
Therefore, the propensity score serves as a composite indicator of multiple individual-specific

-14-
characteristics. For each program group member, the potential comparison group member(s)
with the closest propensity score is selected for the comparison group. If there are no close
matches for certain scores, then unmatched observations are excluded from the sample. These
exclusions are designed to ensure that only approximately similar participants, individuals or
firms, are used in the analysis. See Dehejia, R. H., & Wahba, S. (1999) for an important
application of matching.
Unfortunately, the technique assumes that selection into the program group is entirely due to
observed variables and not due to any variables that are not observed. Consequently, it requires a
baseline dataset that is extensive and comparable in relevant variables for both the program and
the potential comparison group. Even when this is so, there are always variables — firm morale,
management quality, etc. — which are rarely captured in databases. Nor is there any guarantee
that there will be sufficient overlap in propensity scores between the two groups for a
comprehensive evaluation. For example, there may be too few low propensity firms in the
program group and too few high propensity firms in the comparison group for a proper
comparison. Other times, when the model and the data are poor, the propensity score lacks the
power to distinguish between firms. As an example of the technique, Almus and Czarnitzki
(2003) use a matching procedure to evaluate the effect of grants on R&D spending in East
Germany.
Natural Experiments
Natural experiments are another method to estimate the effect of a treatment involving a
comparison group. Natural experiment is often combined with the difference-in-difference
estimation technique previously discussed. A natural experiment is a policy change that
researchers sometimes use in place of a randomized field trial. Researchers identify the
population, or a sub-population, of participants touched by the policy change and attempt to find
a naturally occurring comparison group. The value of the ‘natural experiment’ highly depends on
how closely this “natural comparison group” resembles the program group. Blundell and Costa
Dias (2002) view choosing a comparison group for natural experiments as “extremely difficult.”
For example, they point to the need for similar time trends in the comparison group and the
program group. They also point to the need for a lack of change in the composition of both
groups.

-15-
In addition, there is no guarantee that the two groups will have similar comparable datasets.
There may also be additional confounding policy changes during the same period that often
make it difficult to distinguish one change from another. The researcher must study those policy
questions which existing natural experiments can answer rather than the policy questions that the
researcher would like to answer. Finally, natural experiments require that the policy change has
already been made. Consequently, the natural experiment cannot inform that decision directly.
EXPERIMENTAL METHODS
Randomized field experiments are a method of constructing good data. As noted above, if the
program and comparison groups are initially similar, then few statistical techniques are necessary
to control for their small differences. These remaining differences are more easily controlled for
if there is extensive, common data for both groups. In other words, having very good data is
better than using statistical techniques to correct poor data. When the data is very good
(experimental), the simple technique of subtraction is sufficient to yield the central research
results.
Randomized field experiments assign firms or individuals at random to a program group that
is eligible to receive the intervention being tested or to a comparison group that is not eligible.
Random assignment ensures that the program and comparison groups are the same in terms of all
characteristics even if these characteristic are unobserved, unmeasurable or totally unknown to
researchers. The only way the two groups differ is that one group is eligible for the program and
the other is not. Therefore, any differences that are observed over time in the experiences of the
two groups can be attributed with confidence to the program.1
Another advantage of the field experiment is its transparency. In its simplest form, the impact
of a program is the simple difference between the mean outcomes of the program group and the
comparison group. The similarity of the program and control groups removes the need for
1 Strictly speaking, in a random assignment design the expected values of the averages for all pre-existing characteristics, or
covariates, of the program group and the comparison group are the same, although their actual values may differ somewhat, especially in small samples. Random assignment ensures that the two groups will not differ systematically, but it does not guarantee that they will be identical. However, larger sample sizes will reduce these chance differences. Data on the characteristics of the sample that are collected just prior to random assignment can be used subsequently in regression models to reduce these differences as well as improve the precision of the estimates. Statistical theory gives policy makers a positive reason to believe that the program group is the same as the comparison group. This is true even in the absence of key data. Other techniques rely on the absence of any evidence to show dissimilarity and, implicitly, place the onus of proof on any critic to demonstrate a difference.

-16-
complex techniques and assumptions to make the two groups similar. Consequently, it is
relatively simple to check to see if it was done well.
A final advantage to randomized field experiments is that they provide good data for other
studies that require more complex statistical methods.
There are disadvantages to randomized field experiments. First, they require advance
planning because random assignment cannot be done after the fact. In addition, they use pilot
projects which require time to set and operate. As a consequence, there can be a substantial lead
time between the start of a field experiment and the publication of the final results. As a result,
field experiments of complex programs have difficulty responding quickly to unexpected policy
priorities and short policy deadlines.
Other research methods sometimes appear faster because they “start the clock” after a
program has been running for a number of years and data have already been collected. They
finish in a shorter period of time because evaluation decision is made later rather than the process
of evaluation being faster. However, a consequence of this later evaluation decision is that
evaluations must use existing sets of data for a comparison group and outcome measures.
Unsurprisingly, the existing data are often not up to the task because they were not collected with
the evaluation in mind. As a consequence, evaluation quality suffers.
A second disadvantage of field experiments is often their cost. Randomized field experiment
need not be expensive but often are. First, expensive pilot programs are often chosen for
randomized field experiments because policy makers want a high standard of proof of
effectiveness for expensive programs. Program expenses usually make up the overwhelming part
of the total cost of these field experiments. The program costs of an “after-the fact” evaluation
come out of some other budget or are sunk costs. Second, field experiments usually have
extensive surveys and data collection. “After-the-fact” evaluation methods do not incur these
costs because it is often too late to incur them — irrespective of their cost-effectiveness or,
indeed, necessity.
Another disadvantage of field experiments is that sometimes it is unethical or impractical to
deny services to the comparison group. For example, it might be considered unethical to deny a
life-saving medical treatment, education, or a minimum level of support to the comparison
group. In these cases, experiments should not be done. Even though business subsidies for R&D
-17-
do not provoke strong ethical concerns, it would be difficult in practice to secure the recruitment
and co-operation of firms if the program were to lower business subsidies. Therefore it is not
feasible to test experimentally a voluntary program that would lower subsidies.
Finally, field experiments cannot capture “scale” effects in which the program would have a
greater or lesser effect simply because it is a full scale program rather than a pilot project. For
example, a randomized experiment cannot capture the general equilibrium effects of a policy
change though it can provide credible input for general equilibrium models.
OTHER FACTORS RELATED TO FIELD EXPERIMENTS
External Validity
Thus far, we have focused on how a field experiment can rigorously determine the impact of
the treatment on the actual program participants. This is known as internal validity. The results
of a field evaluation can also be valid estimates of the impact on a larger population if potential
program participants were selected randomly from a well-defined population and are sufficiently
willing to join the experiment. External validity may be possible at the start of an R&D
experiment because there is a well-defined population which would be offered a program with an
obvious benefit — additional money. However, it is possible that some external validity may be
lost over time as participating firms become inactive and new firms are created outside the
experiment.
Sample Choice and Program Impacts
Incorrect sample choice can render an experiment infeasible. It is immediately clear that no
affordable experiment can include large corporations. They are too expensive to influence. In
addition, there are too few of them to run a valid experiment by themselves. It would be difficult
to randomly assign these firms and ensure that the program group resembles the comparison
group. The actions of one large player — in either group — could determine the outcomes of the
experiment. Therefore, any experiment should target only small and medium-sized enterprises
(SMEs).
In addition, sample choice can restrict the ability of the experiment to capture some effects of
an R&D subsidy but increase its ability to capture other effects. For example, consider the
following: an R&D incentive can increase R&D expenditures “extensively” or “intensively.” An

-18-
“extensive” increase would come if the incentive caused more firms to do R&D than would have
without the incentive. These additional firms might be first-time performers or they might be
prior performers that, for whatever reason, would not do R&D currently. An “intensive’ increase
would come if the incentive induced some firms to increase their R&D expenditures above the
(positive) amount they would do without the incentive. The latter firms are usually, but not
always, firms that have done R&D in the recent past. In the short-run, a financial incentive
would probably have a greater intensive effect because these firms do not have the fixed costs of
entering the R&D business. Similarly, in the short-run, a financial incentive would probably have
a larger extensive effect on previous R&D performers than on never-performers.
It should be clear from the above that the selection of the recruitment frame can have a
dramatic effect on the questions answered by the experiment. For example, most small firms
have never performed R&D previously. If the experiment sample includes these firms then the
experiment will be able to capture the “extensive effect” of the never-performers. However, the
overwhelming majority of these firms would not perform R&D in the short-run and this would
likely swamp any remaining extensive or intensive effect on firms that had performed R&D in
the past.
In contrast, suppose the sample frame consisted of firms that were R&D performers in some
year prior to recruitment. This frame excludes never-performers and therefore cannot capture the
effect of the incentive on their R&D. However, it can capture the “extensive” effect on
previously performing firm that would not have conducted R&D without the incentive. It will
also capture the intensive effect of the subsidy on firms that would perform at least some R&D in
the absence of the financial incentive. These effects would not be dominated by large numbers of
never-performers. Consequently, for the purpose of a potential experiment, it seems reasonable
to restrict the recruitment sample to firms that have some previous record of R&D performance.
The Timing of Random Assignment
The timing of random assignment is a critical factor in determining the success of an
experiment. Suppose that an experimental program makes additional grants for R&D available to
firms submitting R&D investment projects. If random assignment occurred prior to the proposals
being received, then the treatment might affect the number of proposals, the amount of money
requested in the proposals and possibly the topic of the proposal. However, if random assignment
-19-
occurred after the proposals were submitted to the funding organization, the potential for the new
program to influence the content of the proposals, and therefore to change the level of R&D
investment would be much more limited.
The Length of Experimental Program and Program Impacts
Parsons and Phillips (2007) report that the non-experimental studies, for the most part, show
that the “long-term” effects of a one per cent change in the price of R&D will approximately
generate a one per cent change in R&D. In addition, they show that the “short-run” effects of tax
support are nearly always smaller than the “long-run” effects due to the length of time needed to
adjust to the new subsidy. Most of these short-run elasticity estimates range from about -0.1 to
about -0.3 per cent change in R&D for every per cent change in R&D price. This is important
because a subsidy introduced in a field experiment will initially measure “short-run” effects. The
program must run for a number of years in order to capture longer run effects. This requirement
will increase the length and expense of any experiment.
Experiments as a “Black Box”
A randomized field experiment can capture the effects of a specific program but, in itself,
cannot determine which portion of the program produced the effects or why the tested program
produced those effects. For example, if an R&D program combines both money and technical
advice, a field experiment could determine the overall effectiveness of two program elements
together but not the relative importance of each element separately. These cases require other
methods, such as regression analysis or qualitative studies, to open up this “black box.”
However, in other cases, straightforward conclusion can be drawn from a test of a
straightforward program. For example, additional subsidies are only plausible reason that a well-
run R&D subsidy program (with no other program elements) would increase R&D expenditures.
In these cases, there is no “black box” to open.
However, it is important to understand that random field experiments do not identify the
underlying decision process of participants. One gets a very good answer to the specific question
posed (say the impact of increasing tax credits by 10 percent), but not to another question (for
example, what if the increase was 5 percent). The experimental result may nonetheless provide
significant information about another question. To continue with the example above, if there is
-20-
very little response to a 10 percent increase in the tax credit, there is not likely to be much
response to a 5 percent increase.
Risk of Contamination
“Spillover” effects of the program into the comparison group may bias the experiment by
artificially reducing the difference between the program group and the comparison group.
However, the risk of spillovers into the comparison group is relatively small in an experiment
with firms that are diverse in industry and location. Spillover risk is somewhat greater in an
experiment in which the treatment and the comparison group frequently deal with the same grant
organization or have strong social ties.
EXPERIMENTS WITH FIRMS
In most field experiments, individuals are randomly assigned to treatment and comparison
groups. The methodology for doing this is well-established. There are a number of field
experiments that have randomly assigned institutions such as schools, and public housing units.
Field experiments with firms have been done but are less common. The following experiments
demonstrate the feasibility of the field experiment with firms in some cases.
Energy Experiments
In the 1980s, these experiments randomly assigned firms and commercial energy users in
order to test various methods of reducing electrical energy consumption. The Southern California
Edison Electricity Pricing Experiment randomly assigned 733 firms into six treatments. It tested
various pricing regimes in an attempt to reduce energy usage. Drop-out created some bias. As
well, high peak load firms usually declined to participate. Finally, the size of each of the six
treatment groups was small.
The Niagara Mohawk Hourly Integrated Pricing Program, conducted from 1987 to 1989, had
a similar goal. Its sample was extremely limited with only nine treatment firms and six
comparison group firms.
Employment Programs
The Wage Subsidy Variation Experiment tested the effects of two forms of wage subsidy.
About 1,100 firms were asked to participate but only 125 agreed.

-21-
The Wilkes-Barre Job Search Voucher Project randomly assigned 375 firms to test wage
subsidy vouchers. Employers were first stratified by size location and intensity of youth
employment and then randomly assigned within the strata. The stratification was an attempt to
improve the comparability of the program and comparison groups. Low take up made the results
of the experiment unusable (Greenberg and Shroder, 2004).
Health-care Providers
The National Home Health Prospective Payment Demonstration randomly assigned health
care agencies into two treatment groups. The program groups were paid a prospective per-visit
rate to determine its effects on cost and quality of care. Agencies varied widely in size from 120
visits to 333,000 visits per year. Consequently, the issue arose as to the relative weights on each
firm. With 47 agencies, the sample size was too small to separately estimate different types of
agencies (Brown et al. 1995). This experiment was replicated more successfully with 91 agencies
that were randomly assigned into one treatment group and one control group. Their experience
illustrates the need for adequate sample size in each treatment group and, potentially, the need to
exclude excessively large firms (Cheh, 2001).
Daycare Providers
The Miami-Dade County Project Upgrade randomly assigned daycares — including privately
owned firms — as part of an experiment to test childcare programs. The experiment initially
contacted 850 centres. Many declined to participate because they were committed to a particular
(faith-based) program. Other small businesses disliked taking part in a government sponsored
program. Finally, some centres did not have enough children of the right age or of the right
family income. This process eliminated about 550 firms. Further meeting eliminated more firms
that did not want to risk being in the comparison group or one of the treatment programs that
they did not like. Eventually, 180 centres were randomly assigned but some dropped out prior to
knowing their random assignment status. As a consequence, 164 centres participated in the
study. Of these, over the course of two years, seven centers left the study. Five left because the
center was closed or sold to an owner who chose not to participate; only two left because the
director decided not to continue with the curriculum to which they were assigned. Layzer et al.
(2007) concluded that center attrition was very low after random assignment and distributed
quite evenly across the three program groups and the comparison groups (Layzer, 2007).

-22-
Tax-Credit Programs
The above cases deal with random-assignment field experiments where random assignment
is used for research purposes. However, some of the most relevant cases come from on-going
government programs that use random assignment for operational reasons rather than research
reasons. The following are two examples of tax-credit programs that use random-assignment for
operational reasons.
The Missouri Neighbourhood Preservation Act is designed to provide a non-refundable tax
credit for property improvement in selected distressed areas. Both individuals and developers are
eligible for the credit. Taxpayers apply for the credit by submitting a form prior to the applicable
tax year. Applications are randomly assigned prior to reviewing the application. Various
financial limits apply to prevent tax expenditures from exceeding $16 million in a given year.
There are additional caps on the number of property applications that a taxpayer can submit.
Special rules apply to flow-through companies which must submit the names of their owners.
“Comparison” group members are automatically ineligible for the tax credit. “Program” group
members may be denied credits if their application is invalid or has missing information. Credits
can be used in the year that the construction is completed.
The Ohio Training Tax Credit is a tax credit given to firms for the purpose of encouraging
firm to train incumbent workers. It was started in 2000 with web-based applications that were
accepted on a first-come, first-served basis. This caused problems for the server so the program
switched to randomly selecting applications made during an application window. Ohio gets
about 1,200 applications per year for varying amounts. It randomly selects applications until its
$20 million budget is exhausted. In practice, about 350 applications are accepted per year with
special limits on larger firms and manufacturing firms. The manager of the program described
the random assignment process itself as simple and straightforward. Interested readers can learn
more technical information about how firms were randomly assigned in Ohio by referring to
Annex I.
In conclusion, the random assignment of firms has been done a number of times in the past
for research purposes and is being done now for operational reasons. This proves that it is
feasible to do field experiments with random assignment in at least some cases. However,

-23-
recruitment, sample size and retention are challenges that require attention with firms as well as
individuals.
Differences Between Experiments with Firms and Individuals
There are particular advantages to the random assignment of firms that are not present when
randomly assigning individuals. Firms using R&D subsidies are relatively more sophisticated
than the recipients of most social programs. These R&D firms can assess, understand and
respond to new and complex treatments in a manner that most individuals cannot. The central
motivation of firms — profit maximization — can be easier to understand than the many
motivations of individuals. Profit is directly observed, measured, audited and centrally collected
in a standard format. Utility is not. Finally, reasonably sized, on-going firms are easier to contact
and track than many recipients of social programs.
However, there are still substantial challenges to the random assignment of firms. Many of
the previous field experiments have used a relatively small number of stable, large firms such as
utility companies. These companies seldom go bankrupt and their location is almost always
known. The focus of many of the experiments is on what the firms in a single industry produce
for its customers. In contrast, a project on R&D subsidies may look at firms with diverse size,
diverse sophistication and diverse legal structures. Some will go bankrupt or become inactive.
The Miami-Dade experiment went to considerable lengths to get and maintain “buy-in” from
individual daycares. They were relatively successful with recruitment and had minimal drop
outs. Other experiments had problems with recruitment and maintaining their sample. Firms have
the capacity to respond to complex surveys but they may not have the will to respond. Other
technical aspects of randomly assigning firms, such as legal definitions of firms, are included in
Annex II.
CONCLUSION
This chapter reviewed non-experimental and experimental research methods. It showed that
non-experimental methods construct comparison groups by making dissimilar groups appear the
same though assumptions, specification and statistical adjustment. These methods have difficulty
in achieving this goal — particularly when it comes to unobserved characteristics. In contrast,
-24-
field experiments create a comparison group that has no systematic differences with the program
group. The similarity of the two groups renders many statistical techniques unnecessary.
The chapter then reviewed past field experiments that were conducted with firms. It also
showed how random assignment has been used in government operations to distribute tax
credits. Finally, it reviewed the advantages and disadvantages of randomly assigning firm
relative to randomly assigning individuals.
The chapter also served to identify a few desirable characteristics of an experiment involving
firms and testing means to increase R&D expenditures. First, any experiment should restrain its
recruitment to small or medium-sized firms. It would also be preferable to restrict the
recruitment sample to firms that have some previous record of R&D performance. In addition,
the program should run for a number of years in order to capture longer run effects.

-25-
III. Overview of potential experiments/programs
Section I introduced two potentially feasible research questions:
What is the marginal effect of increased business support programs on R&D expenditures?
What is the relative marginal effectiveness of different policy instruments in promoting R&D
expenditures?
This section gives an overview of field experiments that could potentially answer these
research questions.
EXPERIMENT I: PROGRAM THAT MIMICS AN ADDITIONAL SR&ED REFUNDABLE TAX CREDIT
Experiment I would create a program that mimics an additional SR&ED refundable tax
credit. Treatment A would see program-group firms with Qualifying SR&ED Expenditures
receive this artificial credit in addition to the currently available credits that they are entitled to.
Comparison group members would only receive the currently available SR&ED tax credit. A
comparison of Treatment A and the comparison group would answer Research Question 1 for
SR&ED refundable tax credits; it would show the extra effect on R&D expenditures of an offer
of an increased tax credit.
EXPERIMENT II: A PROGRAM THAT GIVES OUT ADDITIONAL R&D GRANTS AND/OR CONTRIBUTIONS TO SELECTED FIRMS
Treatment B is an additional grant/contribution funding for R&D investment. In this
treatment, a funding organization would accept proposals for R&D grants from both the program
and the control group. Organization officials would decide which proposals from either group
would receive funding. However, the program group would receive a more generous level of
funding compared to the control group. A comparison of Treatment B and the comparison group
will show the effect on R&D expenditures of the potential for additional grant/contribution
funding. Experiment II would answer Research Question 1 for a business subsidy taking the
form of a grant/contribution program.

-26-
EXPERIMENT III: AN EXPERIMENT THAT COMPARES THE TAX CREDIT PROGRAM WITH THE GRANT/CONTRIBUTION PROGRAM
Experiment III would essentially combine Experiment I and Experiment II into a single
experiment. Experiment III would have two program groups and one control group. Participants
would be firms that are eligible for the tax credit and also be likely to apply for an R&D grant
from a government organisation. One program group would be given Treatment A — the offer of
an additional R&D tax credit as in Experiment I. The other program group would have the
potential to receive a more generous grant/contribution — Treatment B as in Experiment II. The
level of funding for the two program groups would the same. The control group would receive
the tax credits and grants to which they would normally be entitled. Comparing each program
group individually to the control group would answer similar research questions as Experiment I
and Experiment II. A comparison of the two program groups would determine whether the extra
effect of increasing the level of financial support through R&D tax credits is greater or smaller
than the extra effect of a similar increase in support through additional direct grants for R&D
investment. Experiment III would answer Research Question 2.
Each potential experiment is examined in detail in Section IV through Section VII.

-27-
IV. Experiment I: SR&ED Tax Credit (Treatment A)
Experiment I would create a program that would mimic an addition to the SR&ED
refundable tax credit. Program-group firms would be eligible for this additional credit while
comparison group members could receive only the currently available SR&ED credits. The
difference in R&D expenditures between program group firms — that received the extra credit
— and comparison group members — that did not receive the extra credit — would show the
extra R&D expenditures generated by the additional tax credit.
OVERVIEW OF SR&ED TAX CREDITS
SR&ED is a federal tax incentive program to encourage Canadian businesses to conduct
R&D in Canada that will lead to new, improved, or technologically advanced products or
processes. Under the SR&ED program, qualifying businesses get money back in the form of a
refund, a reduction of taxes payable, or both. The SR&ED program is administered by CRA.
The SR&ED program is a major element in the federal government's Science and
Technology strategy. It is the largest single source of federal funding for Canadian industrial
R&D and is one of the most generous tax-based R&D support programs in the industrialized
world with about $2 billion in tax credits earned in 2006. Generally, a Canadian-controlled
private corporation (CCPC) can earn an investment tax credit (ITC) of 35% up to the first $2
million of qualified R&D expenditures carried out in Canada, and 20% on any excess amount.
Other Canadian corporations, proprietorships, partnerships, and trusts can earn an ITC of 20% of
qualified expenditures for R&D carried out in Canada.
A CCPC is considered a small firm if, in the previous year, it had income of $400,000 (or
less) and taxable capital of $10 million (or less). These small firms may receive a portion of the
ITC earned as a refund, after applying these tax credits against their taxes. The ITC earned by a
Canadian corporation that is not a CCPC is non-refundable, but may be used to reduce any taxes
payable.2
2 This paper does not consider the separate SR&ED income tax deduction.

-28-
To qualify for the SR&ED program, work must advance the understanding of scientific
relations or technologies, address scientific or technological uncertainty, and incorporate a
systematic investigation by qualified personnel. However, the tax credit does not apply to social
science and humanities research, commercial production, style changes or market research and
promotion. CRA has a large number of additional regulations that apply to this tax credit.
SR&ED administrators apply these rules to determine which expenditures qualify for the tax
credit. However, tax officials do not make judgements as to the merit of those expenditures. In
other words, the program does not “pick winners.” Instead, it relies on the judgement of firms to
invest their own funds in profitable ventures. This reliance on the firm’s judgement requires that
a substantial portion of the R&D investment comes from private sector funds in order to provide
an incentive for the firm to act prudently. This incentive diminishes if the tax credit is too large
relative to the money invested by the firm.
A GRANT THAT MIMICS A REFUNDABLE “TAX CREDIT” PROGRAM
SR&ED refundable tax credits are legally prescribed by tax legislation. As such, it is not
legal to do a field experiment with such tax credits without changes in that legislation.
Consequently, a randomized field experiment with literal tax credits is not feasible. However, it
is possible to design a grant program that will closely mimic a SR&ED refundable tax credit.
This “imitation” tax-credit program (described below) can be run without changes to tax
legislation and, therefore, can be used in a field experiment. This program would correspond to
Treatment A.
The program would work as follows. Firms in the program group would have the details of
extra tax credit explained to them shortly after random assignment. Ideally, this would take place
shortly before the beginning of their taxation year. The program-group firms would submit their
usual tax form to CRA. CRA would determine the firm’s SR&ED tax credits by their usual
methods. Once their tax return is settled, CRA would forward their return to the organization in
charge of the experimental program. The experimental program organization does not second
guess the figures sent by CRA. This organization simply calculates X percentage points of the
qualified R&D expenditures to determine the value of the grant or the additional imitation “tax
credit”. If the firm owes taxes, this grant would be sent to CRA. If not, the grant would be sent to
the firm. Disputes between CRA and the firm over taxes are handled by current tax

-29-
administrative structures. No program check is written until CRA is sufficiently satisfied to issue
its own refundable tax credit. This method relies on CRA’s existing expertise while creating little
additional work or administrative complexity for CRA.
Some elements of tax credits cannot be duplicated in an experiment. Unlike usual tax credits,
it may be the case that the program payments would be considered by CRA as ‘anticipated
government support’ for R&D. Under current tax rules, such support would reduce the firm’s
“real” SR&ED tax credits. Unless CRA ruled otherwise or granted an exemption, this means that
a program “credit” payment would have to be grossed up in order to leave the firm in the same
fiscal position as if their “real” credits had not been reduced.
Figure 1: Experiment I — Tax Credits
Experiment
Recruitment
Random
Assignment
Program
Group
Perform R&D
Receive Enhanced
Tax Credits
Program Group R&D Expenditures
Control Group R&D Expenditures
Average Impact
Control
Group
Perform R&D
Receive Regular
Tax Credits
-30-
It is expected that, in most cases, the program would follow the regulations of CRA. There
may be cases where this is not possible. For example, a finite field experiment cannot allow for
the “carry forward” of credits against future profits as is allowed under current tax legislation.
Under these circumstances, it seems reasonable to confine any experiment to refundable credits
which are the most likely to be claimed immediately.
This tax credit program is operationally simple and inexpensive to run. It does not depend on
the recruiting of scarce, highly qualified personnel such as SR&ED consultants. It does not
require the co-operation of an existing R&D grant organization.
As some firms will not perform R&D, the experiment would test the effect of the offer of the
additional tax credits rather than the effect of the receipt of the additional tax credits.
TARGETING
To conduct an experiment, one needs a list of potential participants that provides their names
and contact information. The most likely candidate is a CRA list of taxpaying SMEs that
received refundable tax credits in the year prior to the year of recruitment. These firms have a
demonstrated interest in R&D and a demonstrated capacity for it. A Finance consultation paper
noted that there were more than 15,000 firms that earned credits at the rate prescribed for CCPCs
(Finance, 2007). This large number of potential recruits ensures that a sufficient sample could be
recruited.
However, using a list of prior SR&ED credit recipients has implications for the questions that
can be answered by the experiment. The experiment would have no ability to test the effects of
an additional tax credit on those that have never previously applied for a tax credit. In this sense,
the experiment would have no ability to assess the effect of a tax credit on the extensive margin
(i.e., bringing new firms into R&D). Most of the effect of the credit would be on the intensive
margin — encouraging current R&D performers to increases their R&D expenditures.
The use of an alternative and more inclusive list — all SME tax filers — would allow the
experiment to capture both the intensive and extensive margins. However, this list would mostly
contain firms that have no intention of performing R&D. These firms would be difficult to
recruit and difficult to keep in the experiment. The presence of these firms would increase the
variability of R&D expenditures and lower the expected impact of the additional tax credit.
-31-
ADVANCE PLANNING
One unknown is in this program is how far in advance are R&D decisions made. If the firm’s
R&D decisions are effectively made several years in advance, then a few years of additional
financial incentives may have little or no effect on the firm’s R&D investments. However, if the
firm has a relatively short planning horizon, then financial incentives have at least the potential
to affect the firm’s R&D. The planning horizon of the firm would vary according to the industry
in which the firm operates, the firm size, the spare capacity of the firm and the supply constraint
of the market. As noted above, the effect of incentives is usually estimated to be much smaller in
the short-run than in the long run.
CONCLUSION
An experimental program could duplicate the central features of the SR&ED refundable tax
credit through the creation of a grant program that will closely mimic the operation of this tax
credit. The operation of such program appears administratively feasible with a minimum
collaboration of CRA. As well, there would be sufficient sample for a randomized field
experiment and subgroup analysis. The primary measure of interest would be R&D expenditures.
As will be argued later in this report, R&D expenditure would be captured in this experiment
with corporate tax data though survey data is a useful addition to any experiment. This section
concludes that it is technically feasible to test experimentally the offer of additional R&D tax
credits.


-33-
V. Experiment II: Grants and Contributions (Treatment B)
Experiment II would randomly assign firms that are prepared to apply for a direct
government grant for R&D. Those members of the control group with accepted grant proposals
would receive the usual R&D grant that they are eligible for. Those in the program group would
be eligible for a more generous grant. The difference in R&D expenditures between the two
groups would represent the effect of the potential to receive a more generous R&D grant.
OVERVIEW OF GRANTS AND CONTRIBUTIONS
One of the traditional methods of funding private sector R&D investment is to fund specific
projects on the basis of merit and other criteria. In general, a funding organization will accept
proposals for specific R&D projects that fall within its range of responsibility. These proposals
will be assessed by the organization for merit, consistency with the organization’s objectives,
and the ability of the business to carry out its proposals. In addition, it will assess the amount of
funding required in terms of the organization’s overall budget and the funding requirements of
other potential proposals. The funding organization selects the proposals that it feels best meet its
policy goals.
There is a wide variety of these funding organizations providing support to R&D. Some
provide a wide range of services in addition to providing funding. Others limit their role to
funding but do so in a specific technical area. These organizations vary in size and in their
funding methods. This is in major contrast with tax credit regimes where there is only one
national system (aside from provincial tax credits). What follows is a small selection of these
organizations.
National Research Council Industrial Research Assistance Program (NRC-IRAP)
The Industrial Research Assistance Program (IRAP) assists Canadian Small and Medium
Enterprises (SMEs) in using technology to commercialize services, products and processes in
Canadian and international markets. It does so with a wide range of services, networks and, if
deemed appropriate, funding.

-34-
Typically, IRAP officials will meet with businesses and assess their needs. The initial
emphasis is on the technical nature of the project. If the IRAP technical advisor believes the
company could benefit from financial assistance, the company will be invited to apply for
funding from the program. The financial contribution is a complement to other core services
being provided.
The Atlantic Canada Opportunities Agency (ACOA) Atlantic Innovation Fund
ACOA’s Atlantic Innovation Fund is designed to increase R&D carried out in Atlantic
Canada that leads to the launch of new products, processes and services; improves capacity to
commercialize R&D, and strengthens the region’s innovation system by supporting R&D and
commercialization partnerships and alliances among private sector, non-profit and public
organizations. Eligible costs could include wages, salaries, capital costs and other operating
expenses directly related to the research project. The Atlantic Innovation Fund can provide
assistance of up to 80% of total eligible costs for non-commercial projects and up to 75 per cent
of total eligible costs for commercial, private sector projects. However, the AIF support is
targeted toward the support of larger firms. Commercial applicants seeking funding of less than
$1 million are not eligible for funding.
ACOA’s Business Development Program does fund some commercial projects under its
innovation program. The Business Development Program provides interest-free, provisionally
repayable loans for a wide range of business activities. One of these programs, called
Innovations, funds costs related to researching and developing new or improved products,
services and processes such as the labour costs of expertise, materials, special equipment, testing
and patents. Interest-free provisionally repayable loans are provided for up to 75 per cent of the
cost of labour such as scientists, materials, special purpose equipment and other related costs. To
qualify, the project should introduce a new or improved service or product, have a good potential
for commercial success, contribute to the economy of the region and demonstrate the capacity to
repay the loan. Repayments could include payments based on royalties once the project is
successful.
Provincial funds
Provinces also have organizations that fund R&D projects. Ontario, for example, has many
— some quite specialized such as the Ontario Fuel Cell Innovation Program. Another program is

-35-
the Ontario Innovation Demonstration Fund. It provides contingency loans moving proven
technology into demonstration projects. A central theme of the IDF is that program officials are
given wide discretion over which applications to accept, what costs will be funded, and the
amount and form of that funding.
IDF’s central method of funding is the contingency loan where firms are forgiven repayment
of parts of loans as they meet agreed milestones. This funding format helps the enforceability of
the agreement. They have been in business for about two years and have only funded a small
number of projects.
THE EXPERIMENT
Experiment II focuses on testing the incremental effect on R&D expenditures of additional
grant/contribution funding. Experiment II would answer Research Question 1 for a
grant/contribution program.
In the proposed experiment, the clients (or potential clients) of an existing organization
would be recruited and randomly assigned into a control and a program group. The control group
would follow the standard procedures by submitting proposals that, if accepted, would receive
funding to cover part of their R&D costs. The program group would do the same but would
receive funding for an additional 10 per cent of their R&D costs if their proposal is accepted. For
example, the funding organization could fund 50 per cent of accepted control-group proposals
but 60 per cent of accepted program-group proposals. Rejected proposals from either group
would receive nothing. The difference between the program and control group would measure
the effect of potentially receiving an additional 10 per cent funding.
Several points are worth noting. First, randomly assigning firms prior to the acceptance of
their proposals allows program group firm’s to adjust the amount of their proposal to reflect the
availability of increased funding. However, randomization prior to proposal acceptance means
that some firms will not submit proposals and other firms will have their proposals rejected. As a
consequence, the experiment would test the potential to receive additional R&D funding rather
than the actual receipt of that funding. Second, the experiment is best suited for an “arms-length”
proposal submission. However, in some organizations, there may be substantial pre-proposal
discussion of the various needs of the firm including the topic, scope and funding levels of

-36-
proposal. The written funding proposal may in fact formalize the conclusion of a fuzzy
negotiation process rather than representing the start of the process. In this case, random
assignment may have to occur prior to these discussions. Third, the experiment design assumes
that all accepted proposals would normally receive funding for the same percentage of eligible
research costs (50 per cent, for example). However, suppose different groups of firms receive
different percentages of these costs in subsidies (say 25 per cent and 50 percent). Then the
program would have to ensure that a substantial portion of the program group benefited from the
additional funding. For example, the group of firms that usually receives a 25 per cent subsidy
would receive 35 per cent in the program group while the group of firms that usually receive 50
per cent would receive 60 per cent in the program group.
Figure 2: Experiment II — Grants
Firms Considering Proposals for R&D
Grants
Experiment Recruitment
Receive Enhanced
Grant
Receive Regular
Grant
Program Group R&D Expenditures
Control Group R&D Expenditures
Average
Impact
Submit Proposal
Submit Proposal
Proposal
Denied
Proposal
Accepted
Proposal
Denied
Proposal
Accepted
Random Assignment
Program Group Control Group
Do Not Submit Proposal
Do Not Submit Proposal

-37-
CONCLUSION
An experimental program to test the effect of the potential to receive more generous R&D
grants could be conducted using processes and rules already in place in funding organizations
providing support to R&D expenditures. To make this possible, however, would require the
collaboration of such a funding organization. R&D expenditures, the central measure of the
experiment, would be collected using survey data, as will be discussed later in this report.


-39-
VI. Experiment III: Comparing tax credits with grants and contributions (Treatment A vs. Treatment B)
A central policy issue is whether an increase in R&D support through grants/contributions
would generate more additional R&D expenditures than a similar increase in support through tax
credits (Research Question 2). To answer this question, Experiment III would create two
program groups. One program group would potentially be eligible for an additional tax credit
(Treatment A) while the other program group would potentially be eligible for an additional
grant or contribution (Treatment B). As noted in the discussions of Experiment I and Experiment
II, some members of each program group may not actually receive the enhanced funding.
Consequently, the experiment tests the potential to receive that funding rather than the receipt of
the funding itself. A control group would receive the usual support for which it is eligible.
Note that two program groups receiving similar funding would be twice as expensive as one
group. In addition, an experiment with two program groups and a control group requires a
sample that is 50 percent larger than a similar experiment with only one program group.
The larger sample may pose problems for recruitment as there are other factors that limit
firm’s eligibility for Experiment II. If one wishes to test the effect of incremental funding on two
existing programs, then the sample must be eligible for funding from both tax credits and grants.
As the criteria for eligibility are often different, this presents several problems that increase the
complexity of recruitment. For example, CRA restricts its refundable tax credits to CCPC firms
with $400,000 (or less) in taxable income and $10 million in taxable assets (or less) but makes
no restrictions on the number of employees. On the other hand, IRAP restricts its grants to firms
with less than 500 employees but has no restriction on earnings, assets or ownership structure. In
this example, an experiment would only recruit firms that meet the restrictions of both
organizations. This would pose a significant problem if the original recruitment frame was barely
adequate in terms of its size. In addition, the double eligibility requirement restricts the
recruitment sample to a group that is only partially applicable to the firms eligible for either
program. A related, but distinct, problem is the source of the recruits. The recruits should be
receiving or likely to be receiving subsidies from both sources so has to test the impact of
additional funding from each source. In practice, this means that the sample must be drawn from

-40-
a client list of the least used financial support program, which would probably be the grant
organization.
Figure 3: Experiment III — Tax Credits and Grants
CONCLUSION
This type of experiment would add rigorous, practical information about the real choices
faced by policy makers. It is technically feasible. However, this experiment requires funding and
sample members for two program groups. In addition, recruited firms must be likely to receive
subsidies from both grants and tax credits in order to test the incremental effect of additional
funding to each program. This would restrict the pool of potential recruits. Experiment III
involves substantial more risk and expense than Experiment I or Experiment II.
Firms
Recruitment
Experiment Participants
Random Assignment
Enhanced Tax Credit
Enhanced Grant
Control
No Regular Grant
Receive Regular Grant
No Enhanced
Grant
Receive Enhanced
Grant
No Regular Grant
Receive Regular Grant
Receive Enhanced Tax Credit
Receive Enhanced Tax Credit
Receive Regular
Tax Credit
Receive Regular
Tax Credit
Receive Regular
Tax Credit
Receive Regular
Tax Credit
Enhanced Tax Credit R&D Expenditures
Enhanced Grant R&D Expenditures
Control R&D Expenditures
-41-
VII. Measures and Data Sources
This section looks at what measures can be used to judge the effectiveness of business
subsidies for R&D as well as the data sources that might be used to construct those measures.
There are a vast number of output measures that could be potentially used to measure
objectively the effect of innovation on a specific product or process. Most scientific and
engineering projects include many of these measures for their individual research projects. For
example, there are a number of objective measures, such as the clock speed, used to determine
improvements to a computer. However, these measures are applicable to a limited range of
products or processes. The problem is finding output measures that are applicable to a wide
range of products and processes. In this way, a subsidy to a broad range of firms can use a
common outcome to assess its effectiveness.
OUTPUT MEASURES
Innovation
One potential output measure that is applicable across firms is “innovation.” However,
innovation is a difficult concept to define and measure. “Newness” is clearly part of the
definition but who must it be new to and when does it become “old” and no longer an
innovation? How much “new” does it have to have to be an innovation? Are all “new things”
innovations or are only “good new things” innovations? If the latter, what is the definition of
“good?” There are no unique answers to these questions and, consequently, a number of
plausible definitions. It is conceivable that a tested policy instrument may increase innovation by
one definition and not by another.
The OECD defines an innovation as “the implementation of a new or significantly improved
product (good or service), or process, a new marketing method, or a new organizational method
in business practices, workplace organization or external relations” (OECD, 2006). Innovations
with goods and processes are most relevant to the purposes of R&D subsidies.
An innovation must have been implemented. A new or improved product is implemented
when it is introduced on the market. New processes are implemented when they are brought into

-42-
actual use in the firm’s operations. These changes must be new at least to the firm. An
innovation is an output measure. It differs from R&D expenditures, which is a measure of inputs.
As an output measure, innovation offers a measure of the potential effect of business
subsidies. However, the task of measuring innovation is formidable. As currently designed,
innovation measures are categorical. Innovation measures cannot determine which of two
products is more innovative than the other. This property can cause problems if one type of
subsidy or granting organization concentrates generating a few, very good innovations while
another might concentrate on many, minor innovations.
Innovation measures are often collected by survey. Survey respondents are left with much of
the definitional work as to what is, or is not, an innovation. As a result, the definition of
innovation may vary from respondent to respondent.
Nonetheless, surveys can obtain the following measures of innovation:
• The number of new or significantly improved products/processes introduced by the
firm in a given period
• The number of these products that were first to the province, Canada, North America
or the world
• Whether product innovations were introduced prior to your competitors (first-to-
market)
• The percentage of sales derived from these first-to-market products
• The importance of innovative products on the increased range of goods and improved
quality of goods
• The importance of innovative processes on flexibility of production, speed of
production reduced labour costs, reduced energy and material costs and the
production capability or service provision
• The importance of innovative products and processes on productivity, expansion in
new markets, market share, profitability, and other measures.
A substantial delay may occur between the subsidized activity, R&D investment, and the
introduction of products and processes on a commercial basis. Innovation output measures are

-43-
obtainable if policy makers are prepared to wait for them. As we shall see toward the end of this
paper, there are also substantial delays in collecting R&D expenditures data especially from
corporate taxes.
Patents
A patent is a legal property right to an invention that is given by a patent office. A patent
statistics — both application and grants — can be used as an output measure for R&D activities.
The grant of a patent shows that an independent official agreed that a product or process was a
world-first. In addition, patents cover a wide range of products and processes and, consequently,
allows for broad comparisons across diverse firms.
However, some firms or industries are less likely to rely on patents for their less valuable
innovations while other innovations may have multiple patents. As a result, a subsidy may result
in more patents for some firms or industries even if the subsidy is equally effective across all
firms. Some have concluded that the examination of patents is best confined to relatively
homogenous firms. There is no guarantee that a patented product process will have any
technological or economic value. In addition, this will affect the feasibility of experiments in this
report because incremental increases in funding in a relatively short experiment are most likely
to result in incremental, and possibly unpatented, innovations. Data on patent applications and
patent grants can be obtained through administrative data from the Canadian Intellectual
Property Office.
Corporate Financial Output Measures
Private corporations have a number of financial methods for judging their own success.
These include profit, revenue, return on investment and a host of other financial measures.
Revenue and profits often vary for reasons unrelated to innovation and R&D. This variability
occurs within firms and between firms. The effect of incremental R&D support may be hard to
detect amid the natural variability that occurs in the market place. Despite these difficulties,
corporate tax data provides a high quality, audited measure of the important output measures of
profit and revenue.
In conclusion, the effect of business R&D supports is, in an ideal world, measured by the
indicators of the policy goals that the subsidy is designed to achieve. These indicators — output

-44-
measures — include measures of innovation, patents, copyright, revenue and profit. Some of
these, such as innovation, have definitional problems, are difficult to interpret and are inexact. In
addition, these measures are often not directly related to the proximate thing being subsidized —
usually R&D. Finally, most firms have a substantial time lag between the receiving the financial
support and the appearance of the measurable outputs such as patents, innovations, revenue and
profit. A properly designed experiment would need to run until most of these outputs had
materialized. Otherwise, it would risk not being able to distinguish between an increase in
outputs (such as innovation) and a mere change in the timing of those innovations. This delay
would substantially increase the length of an experiment that is already lengthy. As a result of
these problems, it is not recommended that the experiments focus on output measures such as
innovations. Instead, the focus of the experiment should be on input measures as described in the
next section.
INPUT MEASURES
The alternative to measuring output is to measure the inputs to innovation and technological
progress such as R&D expenditures. R&D expenditures have many advantages as a measure.
First, it is often the measure most proximate to the support (tax credits or grants) and is mostly
likely to be affected by the subsidy. Second, any effect on input measures will occur more
quickly than any effect on output measures. Third, R&D expenditures can be captured in large
part through administrative corporate tax data. This data is audited, has a high response rate and
low additional costs for the respondents, CRA, and Industry Canada. Fourth, it has considerable
detail on many, though not all, aspects of R&D expenditures. Fifth, R&D expenditures have been
much studied by other researchers and, consequently, will provide interesting direct comparisons
with other research work.
Through surveys, it is also possible to measure such things as R&D employment, various
types of R&D expenditures, regional breakdowns of R&D expenditures, and funding sources.
Through surveys and tax data it is possible to get a measure of privately funded R&D. This
measure will allow a field experiment to determine whether R&D financial support programs
cause firms to increase their own R&D expenditures or decrease them. The latter effect, known
as “crowding out,” would occur if additional government support causes firms to spend more
government funds on R&D but less of their own..

-45-
An additional advantage to the use of R&D expenditures is that it can be used to calculate
many traditional measures such as the elasticity of R&D spending with respect to price. Such
measures generated by R&D expenditures and other variables can be used as part of other more
complex models.
In conclusion, R&D expenditures and its associated measures should be the central measures
to determine the success or failure of any business subsidy for R&D.
DATA SOURCES
The previous section discussed output and input measures that might be used in an
experiment. This section discussed the data sources of those measures.
Administrative data provides a useful source of information that is structured, audited, and
inexpensive compared to survey data. In many cases, it is complete for all participants and does
not suffer from survey response bias. This is particularly important in longer projects as survey
response rates tend to decline due to bankruptcy, inactivity, mobility and cumulative response
burden.
Corporate Income Tax Data
Corporate Income Tax is a rich but complex source of information about firms. Filing such
information is required by law and audited by CRA. The information is sometimes burdensome
to collect by other means because of its complex and precise nature. Tax data have been audited
for accuracy; conformity to well defined rules and checked for internal consistency by CRA.
These conditions ensure a high quality of data.
In addition, many of the critical variables for a field experiment are contained in this data.
For example, SR&ED “Allowable Expenditures” are a tax measure of R&D expenditures.
“Qualified Expenditures” are an adjusted measure of the same thing that is used to calculate
SR&ED credits. The tax data can also provide detailed breakdowns of the types of R&D
expenditures. In addition, corporate tax data can be used to calculate other firm input variables
(investment, wages) and output measures (revenue and profits).
One of the disadvantages of tax data is that some firms do not apply for refundable SR&ED
credits that they are due because the costs of applying exceed the benefits. The R&D
-46-
expenditures of these firms would be missing for these firms. There is also the risk that an
additional tax credit subsidy might cause some of these currently missing firms to apply for their
due benefits and, artificially inflate the measures of R&D in corporate tax data even though the
firms have not increased their R&D expenditures. However, this risk can be minimized by
selecting firms from a list of prior SR&ED claimants. Finally, changes in CRA regulations and
auditing policy may change R&D expenditures as measured in the tax code even if there is no
real change in R&D expenditures by firms. However, most of the potential changes might be
expected to affect the program group and the control group in an approximately equal way.
Corporate tax data are complex. There is a large fixed cost to learning about and processing
these data. Under these circumstances, it may be efficient to use Statistics Canada to process and
prepare the data in their usual manner rather develop an independent system.
The delays in tax data are substantial and may be a critical factor in determining whether to
proceed with an experiment. For example, SR&ED tax credit claimants can submit their claim up
to 18 months after the end of their financial year. CRA must process and, in some cases, dispute
the tax claims of firms. The tax data are generally stable three years afterwards. So, currently
2004 data is useable in aggregate but revisions are continuing. This type of delay would prolong
the operation period of a tax-credit experiment and the publication of the final report.
In conclusion, tax data offer a high quality source of input and output measures but it suffers
from long delays.
Program Management Information Systems (PMIS) Data
Any R&D experiment would generate PMIS data through the operation of the experimental
program. It is expected that a Grants/Contributions program would have a more extensive data
set because the program would be monitored by the granting organisation. While these data
would keep track of proposals made by firms and payments made to these firms, they would not
provide information on R&D expenditures made by participating firms that did not submit
proposals to the organization responsible for the experimental program, or from firms that saw
their proposals rejected. Nor would they provide information on R&D expenditures that are tied
to another incentive program than the experimental program. In other words, PMIS data would
remain an incomplete data set for evaluating the impact of the increased incentive.

-47-
Surveys
Surveys are usually a central feature of field experiment because they allow the research
project to ask important questions that cannot be obtained from administrative data. For example,
surveys can obtain information about R&D that is unavailable from administrative data such as
firms’ views on program administration, R&D expenditures from firms that did not apply for tax
credits, innovations, and other information. It is rare that a field experiment is done without
surveys.
However, the critical limiting factor for surveys is the response rate. The Research and
Development in Canadian Industry (RDCI) survey is a mandatory, cross-sectional survey of
large R&D corporate performers conducted by Statistics Canada. The mandatory nature of this
survey favours a high response rate. Despite this feature, the RDCI achieved 75 per cent
response rate, which Statistics Canada described as a “good” response rate for surveys involving
firms. One can expect that a voluntary, longitudinal survey of small firms would achieve a lower
response rate.
In Canada, a pilot project for the Workplace and Employee Survey (WES) lost about 8 per
cent of firms because of inactivity or bankruptcy in a year. If that attrition rate approximately
held, then about 20 per cent to 25 per cent of firms might be lost over a three-year period. Both
the WES and the RDCI replenish their sample by bringing in new respondent firms. An
experiment cannot do this because new firms would not receive the treatment.
There are many ways of increasing response rates such as incentives and fielding the survey
for a longer period. In addition, many reluctant responders will not volunteer for a field
experiment and will not be counted in the non-response rates. In addition, many reluctant
responders will not volunteer for a field experiment and will not be counted in the non-response
rates. Finally, if non-response is known to be due to bankruptcy or inactivity, the firm’s R&D
expenditures, profits, revenue and innovations are also known to be zero after the firm's exit.
This may reduce the missing data on some outcome measures, but not on others. In addition, a
partial, but important, solution is to capture existing information about exiting firms before they
cease to exist. Preserving some measures of these firms is important for two reasons. First,
eliminating too many firms would reduce the size of the sample and reduce the ability of the
experiment to detect the impacts of the experimental program. Second, the experimental program

-48-
may affect the bankruptcy rate by allowing them to continue in and consequently control groups
may not be random. Bankruptcy from the sample would risk biasing the result if increased R&D
support has an effect on the rate of firm exit.
In conclusion, a longitudinal survey of small R&D firms faces substantial challenges but
these may be surmountable with sufficient time and resources. Surveys are expensive, have non-
response and can be less accurate than tax data. However, they provide data faster and can be
more readily adapted to the needs of research. If costs were not a consideration, an ideal
experiment would use both survey data and administrative data extensively. In a cost-constrained
experiment, it is often necessary to choose. Administrative tax data appears critical to
Experiment I but less critical to Experiment II. In addition, some firms in Experiment II may not
apply for SR&ED credits and would have no tax record of their R&D expenditures.
Consequently, the budget for Experiment I assumes that there will be only be a baseline survey
while the budgeting for Experiment II assumes a survey of firms. The budget for Experiment III
assumes the ideal situation where both tax data and administrative data are available. The
budgets of the experiments will be discussed in detail after a discussion of the sample sizes and
the timelines.

-49-
VIII. Sample Size
This section estimates the required sample size for two of the three proposed experiments. In
estimating a sample size, the first step is to choose the smallest (true) impact that the experiment
would be able to detect. This is known as the Minimum Detectable Effect (MDE). A smaller
MDE requires more firms in the sample which increases the cost of the experiment. A larger
MDE requires fewer firms in the sample but could not validate smaller impacts.
The next step is to obtain a measure of the variability (variance) of a key outcome measure.
In this case, the variance of the SME’s R&D expenditures is obtained from CRA tax data. The
variance is used in a standard formula to determine the number of firms needed to detect a
specific MDE (Bloom 2006).
Tables 1 and 2 below present sample sizes needed for Experiments I and II, respectively.
They both show that the sample sizes required are quite large even using very optimistic
assumptions. The reason for this is that the variance of R&D expenditures is very large.
Consequently, large samples are needed to detect any reasonable impacts of the experiment. The
variance of R&D expenditures is taken from data on R&D Allowable Expenditures from 2004
SR&ED tax claim filers. Large firms are excluded from the data by focusing on firms that
received only refundable tax credits at the 35 per cent rate. The assumptions behind Table 1
calculations are as follows:
Statistical techniques (regressions, stratification) and sample choice (choosing less volatile,
more homogenous firms) can reduce the variance of the R&D expenditures by either 50 or 75 per
cent. Note that these estimates of the sample size are necessarily approximate at this point.
Confirmation of these assumptions would be a research priority that would be necessary if
any of these experiments were to proceed.
The variance of the R&D expenditures does not increase over the course of the experiment.
This implicitly assumes that sample participants will not become non-performers or large
performers in future years. In contrast, Schellings and Galt (2006) showed that firms in a
relatively narrow range of R&D expenditures in one year can often become widely dispersed in
subsequent years.
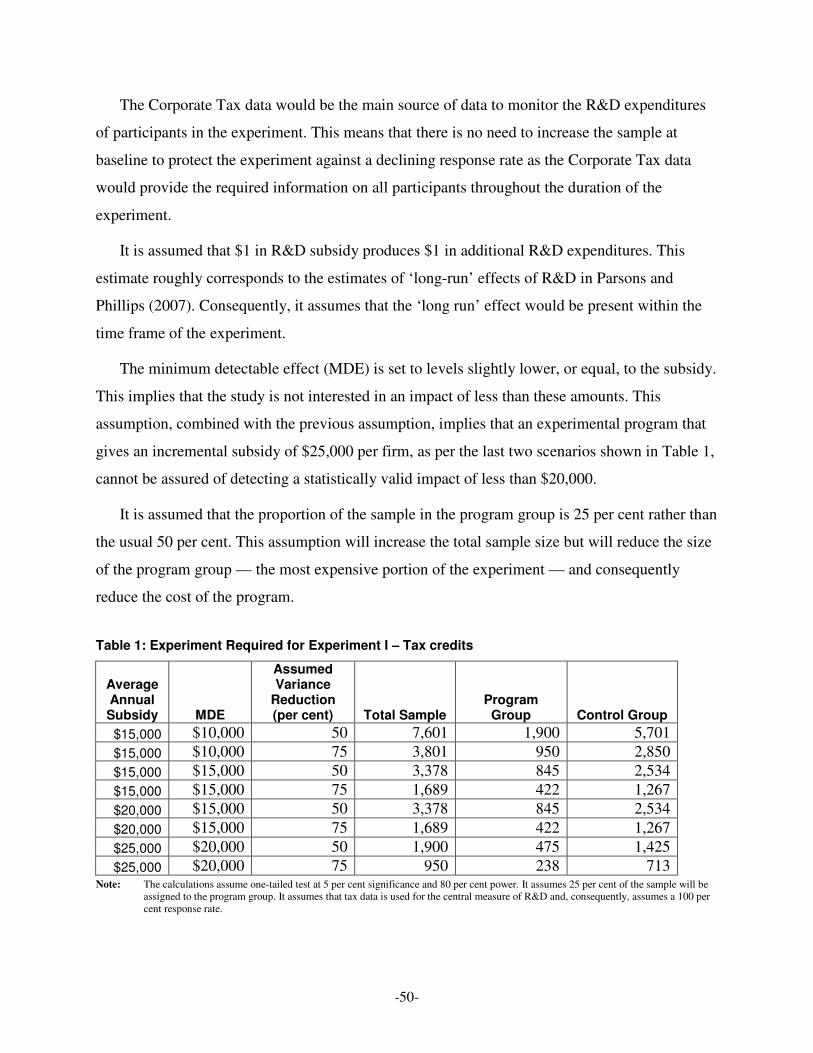
-50-
The Corporate Tax data would be the main source of data to monitor the R&D expenditures
of participants in the experiment. This means that there is no need to increase the sample at
baseline to protect the experiment against a declining response rate as the Corporate Tax data
would provide the required information on all participants throughout the duration of the
experiment.
It is assumed that $1 in R&D subsidy produces $1 in additional R&D expenditures. This
estimate roughly corresponds to the estimates of ‘long-run’ effects of R&D in Parsons and
Phillips (2007). Consequently, it assumes that the ‘long run’ effect would be present within the
time frame of the experiment.
The minimum detectable effect (MDE) is set to levels slightly lower, or equal, to the subsidy.
This implies that the study is not interested in an impact of less than these amounts. This
assumption, combined with the previous assumption, implies that an experimental program that
gives an incremental subsidy of $25,000 per firm, as per the last two scenarios shown in Table 1,
cannot be assured of detecting a statistically valid impact of less than $20,000.
It is assumed that the proportion of the sample in the program group is 25 per cent rather than
the usual 50 per cent. This assumption will increase the total sample size but will reduce the size
of the program group — the most expensive portion of the experiment — and consequently
reduce the cost of the program.
Table 1: Experiment Required for Experiment I – Tax credits
Average Annual Subsidy
MDE
Assumed Variance
Reduction (per cent)
Total Sample
Program Group
Control Group
$15,000 $10,000 50 7,601 1,900 5,701
$15,000 $10,000 75 3,801 950 2,850
$15,000 $15,000 50 3,378 845 2,534
$15,000 $15,000 75 1,689 422 1,267
$20,000 $15,000 50 3,378 845 2,534
$20,000 $15,000 75 1,689 422 1,267
$25,000 $20,000 50 1,900 475 1,425
$25,000 $20,000 75 950 238 713 Note: The calculations assume one-tailed test at 5 per cent significance and 80 per cent power. It assumes 25 per cent of the sample will be
assigned to the program group. It assumes that tax data is used for the central measure of R&D and, consequently, assumes a 100 per cent response rate.
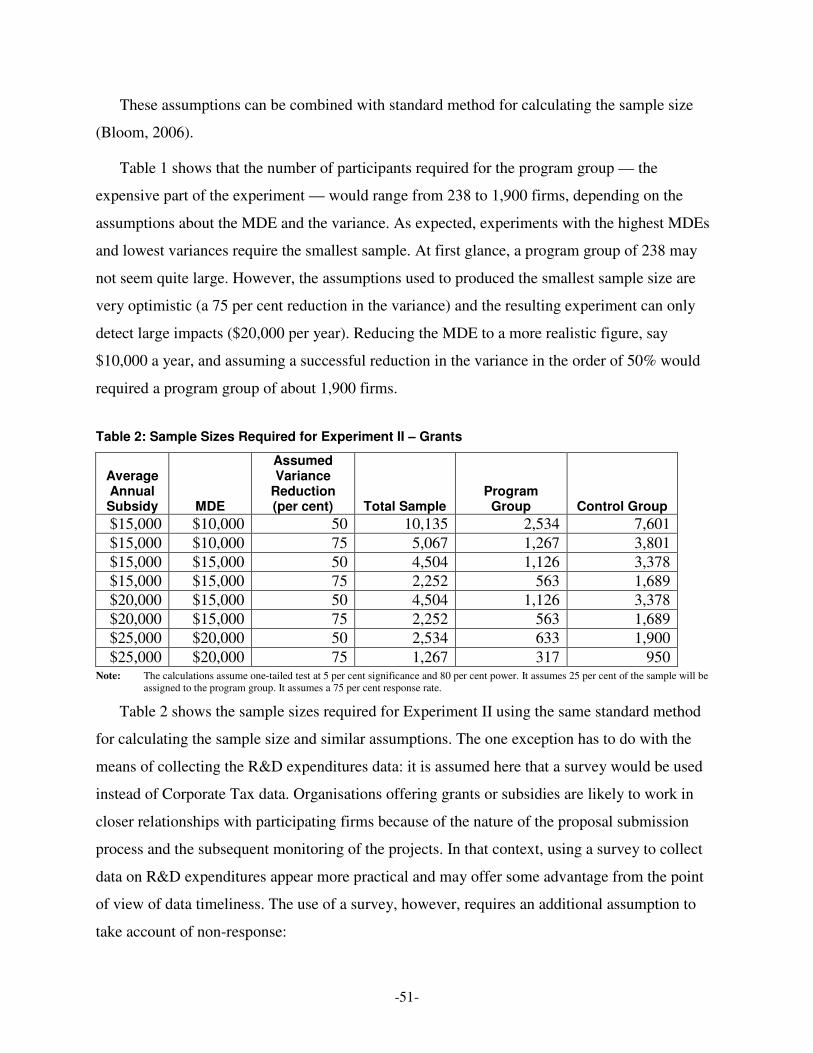
-51-
These assumptions can be combined with standard method for calculating the sample size
(Bloom, 2006).
Table 1 shows that the number of participants required for the program group — the
expensive part of the experiment — would range from 238 to 1,900 firms, depending on the
assumptions about the MDE and the variance. As expected, experiments with the highest MDEs
and lowest variances require the smallest sample. At first glance, a program group of 238 may
not seem quite large. However, the assumptions used to produced the smallest sample size are
very optimistic (a 75 per cent reduction in the variance) and the resulting experiment can only
detect large impacts ($20,000 per year). Reducing the MDE to a more realistic figure, say
$10,000 a year, and assuming a successful reduction in the variance in the order of 50% would
required a program group of about 1,900 firms.
Table 2: Sample Sizes Required for Experiment II – Grants
Average Annual Subsidy
MDE
Assumed Variance
Reduction (per cent)
Total Sample
Program Group
Control Group
$15,000 $10,000 50 10,135 2,534 7,601
$15,000 $10,000 75 5,067 1,267 3,801
$15,000 $15,000 50 4,504 1,126 3,378
$15,000 $15,000 75 2,252 563 1,689
$20,000 $15,000 50 4,504 1,126 3,378
$20,000 $15,000 75 2,252 563 1,689
$25,000 $20,000 50 2,534 633 1,900
$25,000 $20,000 75 1,267 317 950 Note: The calculations assume one-tailed test at 5 per cent significance and 80 per cent power. It assumes 25 per cent of the sample will be
assigned to the program group. It assumes a 75 per cent response rate.
Table 2 shows the sample sizes required for Experiment II using the same standard method
for calculating the sample size and similar assumptions. The one exception has to do with the
means of collecting the R&D expenditures data: it is assumed here that a survey would be used
instead of Corporate Tax data. Organisations offering grants or subsidies are likely to work in
closer relationships with participating firms because of the nature of the proposal submission
process and the subsequent monitoring of the projects. In that context, using a survey to collect
data on R&D expenditures appear more practical and may offer some advantage from the point
of view of data timeliness. The use of a survey, however, requires an additional assumption to
take account of non-response:

-52-
• The survey response rate at the end of the experiment is assumed to be 75 per cent —
the rate achieved in RDCI cross-sectional survey discussed in the previous chapter.
The sample size is increased to take into account non-response and ensure that there
is an adequate MDE among the responding firms at the end of the experiment.
Under this scenario, the program group would range from 317 to 2,534, and the minimum
total sample size would be 950 firms.
Table 3 provides estimates of the sample required to conduct Experiment III which combines
Treatment A and Treatment B in the way proposed in Section VI. All the assumptions made for
Experiment I and II are combined in this case, reflecting the assumption that the experiment
would be using both the Corporate Tax Data and a survey of participating firms. This experiment
would require sample sizes twice as large as Experiment II.
Table 3: Sample Sizes required for Experiment III – Tax credits and grants
Average Annual Subsidy
MDE
Assumed Variance
Reduction (per cent)
Total Sample
Program Group
Control Group
$15,000 $10,000 50 20,270 5,067 15,202
$15,000 $10,000 75 10,135 2,534 7,601
$15,000 $15,000 50 9,009 2,252 6,757
$15,000 $15,000 75 4,504 1,126 3,378
$20,000 $15,000 50 9,009 2,252 6,757
$20,000 $15,000 75 4,504 1,126 3,378
$25,000 $20,000 50 5,067 1,267 3,801
$25,000 $20,000 75 2,534 633 1,900 Note: The calculations assume one-tailed test at 5 per cent significance and 80 per cent power. It assumes 25 per cent of the sample will be
assigned to the program group. It assumes a 75 per cent response rate.
These samples sizes are used to construct the budget estimates presented in Section X below.

-53-
IX. Timelines
This section looks at a rough timeline for a tax credit experiment (Experiment I). It assumes
that the program group is given three years of extra credits in order to capture the long-run
effects of R&D support. The projections assume a three year delay in obtaining data that is
usable. However, some claims will still be under revision at this point. The schedule allows only
one year of follow-up to test for any post-program effects. Table 4 shows that this experiment
would take nine years to complete.
Table 4: Timelines
Project begins April 1, 2009
Pre-recruitment start up
� design report
� preparation of documents
� hiring of staff
� program start-up
� co-ordination with various government departments
April 1 2009 to March 31, 2010
Recruitment of firms begins April 1, 2010 to June 30, 2010
Program operations (subsidies available) April 1, 2010 to March 31, 2013
Baseline tax data available for analysis 2013
Program wrap up and wind down April 1, 2013 to March 31, 2017
Firm’s last date to file SR&ED claim eligible for subsidy
September 30, 2014
Tax data from March 31, 2013 2016
Tax data from March 31, 2014 2017
Final report March 31, 2018

-54-
A grant/contribution experimental program as per Experiment II would require more time for
negotiations, proposal writing by firms and proposal assessment by the granting organization.
However, a grant/contribution experiment would be better suited to the use of a survey for
collecting data on R&D expenditures and the time necessary to collect and process these data
would be less than the time required to receive usable corporate tax data. Broadly speaking, both
experiments would take about the same time.

-55-
X. Budget
This section gives approximate potential budgets for the three experiments. These budget
estimates are based on the sample sizes described in Section XIII. The budgets assume subsidies
ranging from $10,000 to $25,000 per program group member.
Program costs, shown in the fourth columns of Table 5 to 7 below, are arrived at by simply
multiplying the number of firms in the program group by the size of the subsidy used in each
scenario. Operating costs vary from one experiment to another depending on the staff cost
involved in setting up and monitoring the system of payments to the participants. Under
Experiment I, these costs would be slightly higher as the equivalent of a new staff person would
need to be hired to set up and run the system of payments to firms in parallel to CRA. Under
Experiment II, it is assumed that program operations would be conducted by the granting
organisation and provision has been made for set up costs only. Higher operating costs for
Experiment III reflect the added complexity of running Treatment A and Treatment B into one
experiment.
The program costs are the net costs to government as a whole. In other words, the budget
estimates do not include any amount necessary to top up the program credit payment in order to
compensate for the fact that, under current legislation, CRA would deduct any government
support from their estimate of the firm’s Qualified Expenditure on R&D, thereby reducing the
value of the actual SR&ED tax credit payment. It is assumed that a regulation exemption would
allow CRA not to charge these taxes or that an internal government arrangements between
Finance, CRA and Industry Canada would take place to transfer the additional taxes collected
from CRA to the Department paying for the top-ups.
For simplicity, the program costs also assume that all program group firms in Experiment I
and Experiment III receive some additional SR&ED tax credits. Similarly, it also assumes that
all program group firms in Experiment II and Experiment III receive some enhanced grant
money. In other words, there are no rejected proposals.
Research expenditures for a typical random assignment project include a full-time manager
and two research associates. A detailed budget would depend on the chosen experiment and the

-56-
specific research plan. However, experience has shown that research staff budgets for field
experiments range between $700,000 and $900,000 per year. For the purposes of this budget,
these costs are assumed more in the range of $500,000 to $600,000 per year for Experiment I and
Experiment II for a total of $5 million over a nine-year period. As Experiment III implies a larger
sample size, the research costs are assumed to reach $6 million over a nine-year experiment.
In addition to these staff research costs, allowances were made for fees paid to Statistics
Canada. Under Experiment I, it is assumed that Statistics Canada would charge about $1 million
over the duration of the experiment to process the corporate tax data from CRA, raising the total
research costs for this experiment to $6 million. Under Experiment II, Statistics Canada would
run a survey and would be paid accordingly. Estimates of fees paid to Statistics Canada are based
on previous SRDC experiences with sub-contracting survey projects to the statistical agency.
These charges vary according to the size of the sample sizes involved.
Table 5: Budget Estimates for Experiment I – Tax Credit
MDE
Assumed Variance
Reduction (per cent)
Average Annual Subsidy
Program Group
Program
Costs (millions)
Operating
Costs (millions)
Research
Costs (millions)
Total Costs
(millions)
$10,000 50 $15,000 1,900 $85.5 $0.3 $6.0 $91.8
$10,000 75 $15,000 950 $42.8 $0.3 $6.0 $49.1
$15,000 50 $15,000 845 $38.0 $0.3 $6.0 $44.3
$15,000 75 $15,000 422 $19.0 $0.3 $6.0 $25.3
$15,000 50 $20,000 845 $50.7 $0.3 $6.0 $57.0
$15,000 75 $20,000 422 $25.3 $0.3 $6.0 $31.6
$20,000 50 $25,000 475 $35.6 $0.3 $6.0 $41.9
$20,000 75 $25,000 238 $17.8 $0.3 $6.0 $24.1
Table 6: Budget Estimates for Experiment II -- Grants
MDE
Assumed Variance
Reduction (per cent)
Average Annual Subsidy
Program Group
Program
Costs (millions)
Operating
Costs (millions)
Research
Costs (millions)
Total Costs
(millions)
$10,000 50 $15,000 2,534 $114.0 $0.2 $10.3 $124.5
$10,000 75 $15,000 1,267 $57.0 $0.2 $8.3 $65.5
$15,000 50 $15,000 1,126 $50.7 $0.2 $8.1 $59.0
$15,000 75 $15,000 563 $25.3 $0.2 $7.2 $32.8
$15,000 50 $20,000 1,126 $67.6 $0.2 $8.1 $75.9
$15,000 75 $20,000 563 $33.8 $0.2 $7.2 $41.2
$20,000 50 $25,000 633 $47.5 $0.2 $7.3 $55.1
$20,000 75 $25,000 317 $23.8 $0.2 $6.8 $30.8

-57-
Under these assumptions, Table 5 sets out the program expenditures for Experiment I and
Table 6 for Experiment II. Table 7 shows that Experiment III would cost twice as much because
it involves two program groups — one with Treatment A and one with Treatment B. Recall that
budget estimates for Experiment III assume that both the corporate tax data and a survey would
be used to track information from participating firms.
Table 7: Budget Estimates for Experiment III
MDE
Assumed Variance
Reduction (per cent)
Average Annual Subsidy
Program Group
Program
Costs (millions)
Operating
Costs (millions)
Research Costs
Total Costs
$10,000 50 $15,000 5,067 $228.0 $0.7 $16.18 $244.9
$10,000 75 $15,000 2,534 $114.0 $0.6 $12.29 $126.9
$15,000 50 $15,000 2,252 $101.3 $0.6 $11.86 $113.8
$15,000 75 $15,000 1,126 $50.7 $0.5 $10.13 $61.3
$15,000 50 $20,000 2,252 $135.1 $0.6 $11.86 $147.5
$15,000 75 $20,000 1,126 $67.6 $0.5 $10.13 $78.2
$20,000 50 $25,000 1,267 $95.0 $0.5 $10.35 $105.9
$20,000 75 $25,000 633 $47.5 $0.5 $9.37 $57.4
What comes out of these tables is that the minimum cost for running such an experiment
would approach $25 million. Costs are extremely sensitive to the size of the subsidy and to
sample size. In turn the sample size is determined largely by the variance observed in R&D
expenditures. Eliminating a good part of this variance, using statistical techniques or by
excluding the largest firms that are probably responsible for the large variations, would be a
prerequisite to the financial feasibility of any of these experiments.
While a $25-$50 million cost for an experiment may appear prohibitive at first sight, it is
certainly not that large of an amount when compared to the scale of the government financial
support currently provided to private sector R&D investment. Indeed, such a sum would
represent only a very small fraction – less than 1% – of the total annual expenditures devoted to
such support (about $7.5 billion in credits and grants). It is also worth mentioning that several
large scale experiments have been run in Canada and the U.S. that had a much steeper price tag.


-59-
XI. Conclusions
Policy makers see innovation as a critical element for ensuring Canada’s productivity and
prosperity. Canada has some of the most generous private-sector R&D support measures in the
world with a view to fostering innovation. In turn, innovation helps increase Canada’s
productivity, employment, trade and living standards. Yet, Canada’s record shows relatively low
private-sector R&D expenditures. It is unclear why this is. Is this because government financial
support measures are incorrectly designed, incorrectly targeted or totally ineffective? It is critical
that policy makers have access to rigorous evidence to determine where to put scarce resources.
To that end, this study examined whether it is feasible to conduct randomized field
experiments — the gold standard of policy evidence — on the effectiveness of government
financial support for innovation and R&D expenditure. This study examined the general issues
applicable to all field experiments involving research subsidies to firms including the unit of
analysis, potential measures of success and data sources. This paper also looked at issues
surrounding the design of specific experiments on R&D tax credits and R&D
grants/contributions.
There are two types of feasibility that are necessary for a field experiment. The first is
technical feasibility which determines whether is it feasible to perform a field experiment and
draw relevant results if time and money were not factors. The second type of feasibility,
budgetary feasibility, looks at the approximate costs and timeframes of technically feasible
experiments.
For reasons of budget and sample size, the paper focuses on incremental increases in
financial support to smaller firms that have received financial support in the past. The paper also
focuses on R&D expenditure as a central measure of the experiment. Other important measures,
such as innovations, are rejected because their collection would excessively prolong an already
lengthy experiment.
This paper concludes that it is technically feasible to conduct a field experiment on the effect
of a marginal increase in refundable R&D tax credits on R&D expenditures (Experiment I). This
is possible (without legislation) using a program that would mimic most, but not all, of the

-60-
features of a refundable tax credits. In addition, this program would be relatively simple and
inexpensive to operate as it would make extensive use of the CRA tax administration system.
Testing the effect of an extra grant/contribution subsidy for R&D, Experiment II, is also
technically feasible. As with the tax experiment, it would rely on the infrastructure and client
lists of a funding organization. This reliance gives a field experiment several advantages. First, it
reduces administration and set-up costs. Second, it provides credibility for the proposal selection
process which is idiosyncratic to each organization. Third, it provides an established list of
clients that would be willing to submit grant proposals. However, this reliance on an existing
funding organization requires the consent of that organization. The feasibility of obtaining this
consent is beyond the scope of this paper.
Experiment III has two program groups — one group receiving an extra tax credit and the
other receiving additional grants/contributions. Experiment III is more administratively complex
than the other experiments. In addition, it requires the largest sample but has the most restrictive
sample pool. Participants must be receiving both SR&ED credits and grants/contributions in
order to test the effect of extra credits or grant/contributions.
Apart from technical feasibility, all three experiments will be lengthy. The first factor in
determining the length is the planning time necessary for firms to prepare and execute an R&D
project. As a consequence of this and, possibly other factors, the short-run effects of R&D
support measures are usually estimated to be substantially lower than the long-run effects. A
short program operation period would be less expensive and cheaper but would only capture
these short-run effects. However, these temporary short-run effects are not the primary concern
of policy makers. The second factor is that corporate R&D tax data — a central source of firm
R&D data — is often delayed by many years after the end of the firm’s taxation year.
Finally, all three experiments would be expensive. This paper has used a series of relatively
“optimistic” assumptions to generate approximate budgets. The lowest cost field experiments,
Experiment I and Experiment II, cost close to $25 million. Experiment III would cost at least
twice as much. As mentioned earlier, these costs are not that large when considering the
$7.5 billion expenditures spent on government financial support to promote private R&D.
In conclusion, the central concerns over the feasibility of a field experiment into R&D
support measure are their length and their cost. Future research, if approved, can resolve

-61-
remaining issues such as precise variability of the data, firm sampling issues, program operation
expenses and other issues.


-63-
Annex I: Technical Aspects of Randomly Assigning Firms
Jeff Borelli is the Manager of the Ohio Training Tax Credit. In an interview, he explained
how his program randomly assigns firms. This technical information demonstrates the step-by-
step feasibility of randomly assigning firms.
The Ohio Training Tax Credit Program was started in about 2000. It initially operated on a
first-come first-served basis which caused problems for the server. Three years ago, they moved
to a lottery-type assignment to address this congestion problem. They get about 1,200
applications during a 10-day annual application period. There is one application allowed per
Federal Employer Identification Number (EIN), a number used by the U.S. Internal Revenue
Service (IRS) to identify business tax accounts. Companies that are distinct enough to have
different EIN can submit separate applications. As a consequence, a very large group of
companies with multiple EINs, such as Ford Motor Company, could theoretically file a large
number of tax credit applications. However, in practice, the Program does not receive that many
applications from related companies.
Firms must fill out part of their application prior to random assignment in order to limit
paperwork for unsuccessful candidates. These initial applications include estimates of their
expenses, which firms are not held to. Once all the applications are received, the applications are
given a random number using a simple random number generator and are ranked by that number.
Applications are assigned in order of the ranked number until their $20 million tax-credit budget
is gone. There are several caps with special amount set aside for small and non-manufacturing
industries. Borelli described this process as simple and straightforward.
Following the random assignment process, the unselected companies go on a waiting list in
the order of their random number. There is a review process to ensure that documentation and
other paperwork is in place. If a company fails to provide appropriate documentation or cannot
be reached, then their application is voided. The firm with the highest random number on the
waiting list is then asked to submit their application as funds have become available. About
30 applications per year are re-assigned for these or similar reasons.

-64-
To be eligible for the credit, firms must be in good standing with government regulations and
have no outstanding monies owed in taxes. Borelli said that after an application has been
accepted, companies are given a grace period to settle any dispute over taxes.
The legislation said that firms must be in viable economic condition to receive the credit.
Borelli stated that clear and explicit rules or legislation are needed to deny bankrupt companies
access to credits. However, this problem has happened only on one occasion. The more usual
case is that a financially troubled firm will voluntarily withdraw from the program or will be
persuaded to withdraw. The funds are then re-assigned to other companies in the order of their
lottery numbers.

-65-
Annex II: Definitions of Firms
WHAT IS A FIRM?
The firm is the unit of random assignment and the exclusive unit of interest in a field
experiment about financial support for R&D. However, there are a number of different firm legal
structures and definitions for a firm. Firms have legal subsidiaries, common owners and other
related or associated firms.
Fortunately, both CRA and Statistics Canada have developed extensive rules, typologies and
principles for classifying the many types of firms. Unfortunately, both systems are complex and
different from each other.
For example, all firms that pay taxes have a Business Number (BN). This is the primary unit
of taxation and storage of tax data. However, CRA recognizes that many firms entertain various
levels of relationships with each other. For example two firms might be “related” or “associated”
with each other — two distinct, well-established terms in tax law.
Statistics Canada also classifies firms according to whether they are enterprises, companies,
the establishment or the location. R&D statistics are classified by enterprise. A separate concept
is the reporting unit which is the corporate entity that responds to surveys for possibly many
firms and many BNs. The reporting unit is the primary unit of collecting survey data, the BN is
the natural unit for collecting tax data and the enterprise is the natural unit for reporting R&D
data.
However, several factors can reduce this apparent complexity. First, most small firms have
simple structures in which all definitions are equivalent. These firms will be the focus of any
experiment and, consequently, many of the potential complexities may occur, at most, rarely.
Rare cases in a finite experiment can often be handled by simple one-off rules. Second, once the
unit of analysis has been decided, it is possible to make additional rules for random assignment.
For example, it might be the case that the appropriate unit of analysis is the BN but all of
associated firms in the experiment should be jointly assigned to either the treatment or control
group.

-66-
In conclusion, the unit of analysis requires additional work after the essentials of the program
have been settled. However, there is no reason to believe that there are insurmountable problems
in this respect.
WHAT IS A SMALL FIRM?
This report focuses exclusively on experiments involving smaller firms. However, various
organizations define smaller firms in different ways to suit their own purposes. CRA gives
SR&ED refundable credits to Canadian Controlled Private Corporations that, in the previous
year, had taxable income not exceeding $400,000 and taxable capital of $10 million or less. In
contrast, IRAP restricts its grants of firms with less than 500 employees but has no restriction on
earnings, assets or ownership structure. Statistics Canada surveys firms with large R&D
expenditures but uses tax data for firms with small R&D expenditures. By this definition, a
“small” firm can be very large by the CRA or IRAP definitions provided the firm has low R&D
expenditures.
Each definition is reasonable for its own purposes. Consequently, any experiment would first
select programs that it wishes to study and then adopt the definition of small firm that is used in
that type of program. So, a tax-credit experiment would use the CRA definition and a grant
experiment might use an employee-based definition. However, this approach may cause
problems when several programs or organizations are involved. An experiment comparing
additional grants with additional tax credits would recruit from firms that meet both definitions
and, consequently, be less applicable to the entire clientele served by either organization.

-67-
References
Almus, Matthias and Dirk Czarnitzki (2003), “The effects of public R&D subsidies on firms’ innovation activities: The case of Eastern Germany,” Journal of Business & Economic
Statistics 21, pp. 226-236.
Black, Dan, Jeffrey Smith, Mark Berger, and Brett Noel. (2003). Is the Threat of Reemployment Services More Effective than the Services Themselves? Evidence from Random Assignment in the UI System. American Economic Review 93(4): 1313-1327.
Bloom, Howard. (2006). The Core Analytics of Randomized Experiments for Social Research. MDRC
Brown, R, Phillips, B., Bishop, C. Klein, Ritter, G., Thorton, C., Schochet, P. and Skwara, K. (1995). The Effects of Predetermined Payments for Home Health Care. Mathematica Policy Inc.
Blundell, R., and Costa Dias, M. (2002). Alternative Approaches to Evaluation in Empirical Microeconomics, cemmap working paper CWP10/02
Cheh, V. (2001). The Final Evaluation Report on the National Home Health Prospective
Payment Demonstration: Agencies Reduce Visits While Preserving Quality. Mathematica Policy Inc.
Department of Finance (2007). Tax Incentives for Scientific Research and Experimental
Development. Department of Finance Consultation Paper.
Dehejia, R. H., & Wahba, S. (1999). Causal effects in nonexperimental studies: Reevaluating the evaluation of training programs. Journal of the American Statistical Association, 94: 1053–1062.
Greenberg, D. and Shroder, M. (2004). Digest of Social Experiments, Third Edition. Urban Institute.
Heckman, J. (1979). Sample Selection Bias as a Specification Error. Econometrica, 47, 153-61
Heckman, J. and Singer, B. (1984). A Method for Minimizing the Impact of Distributional Assumptions in Econometric Models for Duration Data, Econometrica, Econometric Society, vol. 52(2), pages 271-320, March.
Layzer, J., Layzer, C., Goodson, B., and Price, C. (2007). Evaluation of Child Care Subsidy
Strategies: Findings from Project Upgrade in Miami-Dade County. Abt Associates Inc.
OECD (2006). Oslo Manual, Third Edition.
OECD (2003). The Sources of Economic Growth in OECD Countries.
Parsons, M. and Phillips, N. (2007). An Evaluation of the Federal Tax Credit for Scientific
Research and Experimental Development. Department of Finance Working Paper.
Sharpe, Andrew (2006). Lessons for Canada from the International Productivity Experience. Centre for the Study of Living Standards, Research Report 2006-02, p. 5.

-68-
Schellings, R. and Galt, F. (2006). Size and Persistence of R&D Performance in Canadian Firms
1994 to 2002. Statistics Canada.