Embed Size (px)
Citation preview

Deep Mining 2017: Eighth International Conference on Deep and High Stress Mining – J Wesseloo (ed.) © 2017 Australian Centre for Geomechanics, Perth, ISBN 978-0-9924810-6-3
Deep Mining 2017, Perth, Australia 537
The use of soft computing methods for the prediction of rock
properties based on measurement while drilling data
H Basarir The University of Western Australia, Australia
J Wesseloo Australian Centre for Geomechanics and The University of Western Australia, Australia
A Karrech The University of Western Australia, Australia
E Pasternak The University of Western Australia, Australia
A Dyskin The University of Western Australia, Australia
Abstract
Due to recent technological advancements drilling operations conducted for different purposes such as exploration, blasting and even grouting are not considered as auxiliary operations any longer. On the contrary, nowadays onsite drilling operations are considered as important resources for getting more information about rock properties. Many researchers have been working on measurement while drilling (MWD) techniques and their possible use for the prediction of rock mass properties.
This paper presents a literature survey on the use of MWD technology for the prediction of rock mass properties. The survey indicates that the analysis and interpretation of MWD data is as important as recording the data. Both blackbox modelling such as regression and soft computing or grey-box modelling techniques are used as a tool for the analysis and interpretation of MWD data. This paper presents a case study showing the integration of soft computing methods such as adaptive fuzzy inference system (ANFIS) with MWD data for the prediction of rock mass properties such as rock quality designation (RQD). The results indicated that such soft computing methods can successfully be used as an analysis and interpretation tool.
Keywords: measurement while drilling (MWD), adaptive neuro fuzzy inference system (ANFIS), rock quality designation (RQD), soft computing
1 Introduction
Drilling is used in many mining operations, ranging from exploration to blasthole drilling. In general, drill monitoring is used to record the data from measurement while drilling (MWD). One of the main reasons behind the monitoring is the possibility of the prediction of rock properties needed for the geotechnical engineering design of projects. Once such rock properties are estimated, it will be possible to make tactical planning decisions as mining progresses.
There is a close relationship between MWD parameters and rock properties, as indicated by the increasing number of publications on different mining engineering operations such as ground characterisation, blasthole design and excavatability. It is also possible to find reports and papers relating to MWD parameters to some other interesting applications such as the determination of strong and weak rock zones in open pits, the prediction of the location of hard lenses, and the detection of the top of a coal seam.
The MWD technique has been widely used in the oil and gas industry since 1911. Since 1970, the system had been extended to mining operations, mainly in open pit bench drilling (Li et al. 2014; Segui & Higgins 2002). Early MWD systems, like pen strip recorders, generated long reports, but the use of data was minimal (Vynne 1997) due to the exhausting data preparation stage. Fortunately, nowadays the use of modern computers allows for advanced analysis techniques and filtering of information. Traditional regression modelling is the most widely used technique as an interpretation and analysis tool. More recently, some other modelling tools, such as soft computing methods, have gained popularity. One of the
doi:10.36487/ACG_rep/1704_36_Basarir
The use of soft computing methods for the prediction of rock properties based on measurement H Basarir et al. while drilling data
538 Deep Mining 2017, Perth, Australia
new evolving soft computing methods is the adaptive neuro fuzzy inference system (ANFIS) modelling. It is considered a suitable modelling tool for geosciences, since it can deal with uncertainty and cope with changing environments (Basarir et al. 2014).
For almost two decades, there has been a growing interest in MWD techniques and their use in surface mines. One important application of the technique is the interpretation of ground conditions (Scoble et al. 1989). As emphasised by Scoble and Peck (1987), once ground characteristics are determined it would be possible to make real-time tactical decisions, such as blast design. Kahraman et al. (2016) made a review of ground characterisation using instrumented drills for underground mining and construction. They indicated that MWD is used more in surface and shallow mining than in underground mining (Kahraman et al. 2016). In their study, the importance of a reliable drilling system was emphasised and requirements for such systems were listed (Kahraman et al. 2016). As it can be understood from previous research and current trends, there are opportunities that exist to utilise MWD technology particularly in deep mining environments.
Mozafferi (2007) claims that the MWD data enables a determination of rock mass strength and structure by correlating drill performance parameters with changes in intact rock strength, lithology and frequency of fractures more accurately than costly and time consuming conventional geological core logging (Mozaffari 2007).
As indicated by Clark (1982), the actual measurement and recording of parameters using MWD is the least complicated task. The difficulty arises during the interpretation and correlation of the drilling variables with the known geological conditions. To overcome this issue, soft computing methods have been used in recent years. In this paper, one of the evolving soft computing methods, ANFIS, is used for the interpretation and analysis of MWD Data. Moreover, the development procedure of an ANFIS model is illustrated in a case study.
2 MWD parameters
MWD parameters can be divided into three main groups, namely measured, calculated and inferred parameters (Segui & Higgins 2002). In this section, a comprehensive literature survey on measured and calculated parameters and the application areas are briefly introduced.
2.1 Measured parameters
All the measured parameters are necessary for the estimation of other calculated and inferred MWD parameters. Gonzalez (2007) lists the most commonly measured parameters as depth (m), drilling time (s), rotary speed (RPM), pull down force (kgf), and flushing medium pressure (kgf/cm2). Recently, some other parameters such as the vibration (in Nm/s) (Liu & Karen 2001; Smith 2010) and sound level (in dB) are also considered as measured parameters (Rajesh Kumar et al. 2013a, 2013b).
2.1.1 Depth and drilling time
As depth (cm) of the final drilled hole is necessary for the estimation of other MWD parameters it should be recorded accurately. Just like depth, drilling time (min) is used for the prediction of other MWD parameters, i.e. the penetration rate (PR, cm/min). The advancement time in very weak broken rock mass and hard massive rock mass will be different, therefore, drilling time is considered as an important measured parameter.
2.1.2 Rotary speed
Rotary speed represents the number of full rotations of the bit in a minute (RPM). It has a direct effect on calculated parameters such as penetration rate. It may not be used alone as a rock type indicator and may not reflect changes in geology (Scoble et al. 1989).

Rock mass characterisation
Deep Mining 2017, Perth, Australia 539
2.1.3 Pull down force
It is the axial pull down force (kgf) on the bit and it increases with the strength of rock. Any changes in the force directly affects the penetration rate (PR). This force is strongly influenced by the drill-rig operator, nonetheless, it can be used as an indicator of rock type (Beattie 2009). Scoble et al. (1989) observed that the operator decreases the pull down force in soft rock transitions and increases it in harder-stronger transitions.
2.1.4 Flushing medium pressure
The flushing medium is used to remove the cuttings from the hole and its pressure (kg/cm2) varies based on the structure of rock mass, such as joints, fracture zones and joint fillings (Mozaffari 2007). It is claimed that the records of flushing pressure variation, and their calibration with changing ground conditions, can be used for detecting discontinuities (Rai et al. 2016). Guzek et al. (2015) noticed that the vibration can depend on the drill string stiffness and the flushing fluid rheology. Furthermore, it was stated that the fluctuations in pressure can be caused by a mismatch between the drill string stiffness and the effective stiffness of the rock drill bit interface (Guzek et al. 2015).
2.1.5 Vibration
As expected, during drilling, there will be vibration (Nm/s) while the bit is passing through different layers with variable strength. Liu and Karen (2001) performed a study where they found a relationship between vertical vibrations and torque (correlation coefficient = 0.49) and horizontal vertical vibrations and penetration rate (correlation coefficient = 0.43). The MWD studies conducted in Australian gold mines using the Aquila system (CATERPILLAR 2016a), indicated that vibration was another alternative for characterising the rock mass (Smith 2010).
2.2 Calculated parameters
These parameters are calculated from the measured parameters and are widely used in MWD systems. The well-known calculated parameters are penetration rate (PR), torque (TQ) and specific energy (SE).
2.2.1 Penetration rate
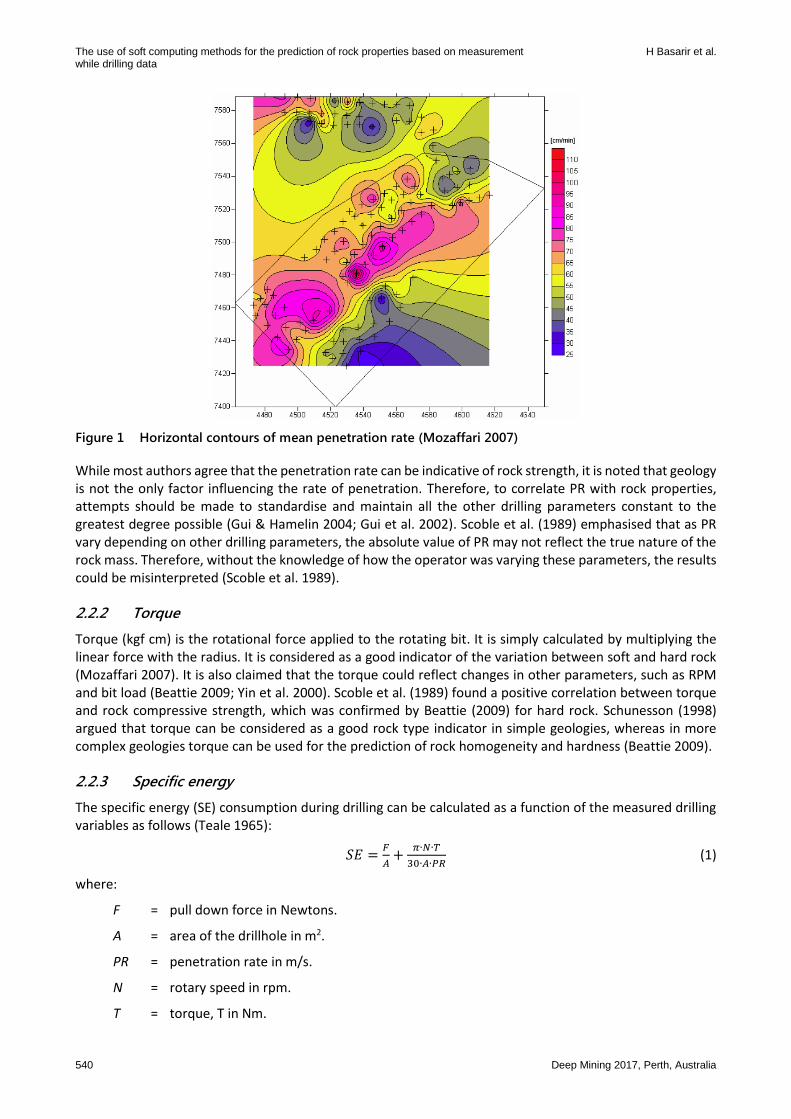
Penetration rate, or drilling speed (PR, cm/min), is normally considered as the most important MWD parameter. The combination of PR and other parameters can also yield additional significant information about rock properties (Brown et al. 1984). The results of MWD studies at the Aitik mine, Sweden indicates that PR seems to be the best MWD parameter to correlate with the rock conditions (Mozaffari 2007; Turtola, 2001). The penetration rate is also selected for convenience; it is easy to measure and analyse with little computer power. The contour map showing the average PR for each blasthole (Figure 1) was prepared and used as a tool for assessing rock strength variation (Mozaffari 2007).
Kahraman et al. (2003) used the black box modelling techniques, i.e. linear regression, to correlate penetration rate with various measures of rock strength, i.e. uniaxial compressive strength, which showed a good correlation. Hagan and Reid (1983) suggested that a continuous readout of either penetration rate or rotary torque would provide immediate indication of the variability of the rock mass. Scoble et al. (1989) determined that the instantaneous penetration rate alone was useful for the detection of abrupt changes in ground conditions, such as large voids.
Some other researchers indicated a relationship between rock quality designation (RQD) or discontinuity frequency and penetration rate. It is claimed that in the formulas used for the PR prediction, RQD or fracture frequency, which could account for the effect of discontinuities (Basarir & Karpuz 2016; Basarir et al. 2014; Scoble & Peck 1987), should be included. In a similar manner it was found that a relationship between the penetration rate and joint spacing can be established (Adebayo & Bello 2014).
The use of soft computing methods for the prediction of rock properties based on measurement H Basarir et al. while drilling data
540 Deep Mining 2017, Perth, Australia
Figure 1 Horizontal contours of mean penetration rate (Mozaffari 2007)
While most authors agree that the penetration rate can be indicative of rock strength, it is noted that geology is not the only factor influencing the rate of penetration. Therefore, to correlate PR with rock properties, attempts should be made to standardise and maintain all the other drilling parameters constant to the greatest degree possible (Gui & Hamelin 2004; Gui et al. 2002). Scoble et al. (1989) emphasised that as PR vary depending on other drilling parameters, the absolute value of PR may not reflect the true nature of the rock mass. Therefore, without the knowledge of how the operator was varying these parameters, the results could be misinterpreted (Scoble et al. 1989).
2.2.2 Torque
Torque (kgf cm) is the rotational force applied to the rotating bit. It is simply calculated by multiplying the linear force with the radius. It is considered as a good indicator of the variation between soft and hard rock (Mozaffari 2007). It is also claimed that the torque could reflect changes in other parameters, such as RPM and bit load (Beattie 2009; Yin et al. 2000). Scoble et al. (1989) found a positive correlation between torque and rock compressive strength, which was confirmed by Beattie (2009) for hard rock. Schunesson (1998) argued that torque can be considered as a good rock type indicator in simple geologies, whereas in more complex geologies torque can be used for the prediction of rock homogeneity and hardness (Beattie 2009).
2.2.3 Specific energy
The specific energy (SE) consumption during drilling can be calculated as a function of the measured drilling variables as follows (Teale 1965):
𝑆𝐸 =𝐹
𝐴+
𝜋∙𝑁∙𝑇
30∙𝐴∙𝑃𝑅 (1)
where:
F = pull down force in Newtons.
A = area of the drillhole in m2.
PR = penetration rate in m/s.
N = rotary speed in rpm.
T = torque, T in Nm.
Rock mass characterisation
Deep Mining 2017, Perth, Australia 541
Teale’s work, followed by others, concludes that other factors such as hole size, mode of rock breakage and bit type could all effect specific energy (Rabia 1982; Vardhan et al. 2009). The latter information was used by industry to estimate strata recognition and blastability index (CATERPILLAR 2016a, 2016b; Lilly 1986).
It was found that the specific energy and penetration rate, representing the degree of difficulty in rock drilling, were closely related to each other (Li et al. 2014). Liu and Karen (2001) simply accepted SE together with the penetration rate as a drill performance indicator. Some other researchers indicate that the specific energy can be used as an indicator of rock strength (Dunn et al. 1993; Jain & Singh 1993; Mellor 1972; Smith 2010).
Scoble et al. (1989) concluded that the variation in specific energy of drilling, determined through an empirical equation relating penetration rate, thrust on bit, rotary speed, rotary torque and hole area, provided the best correlation with the changing rock properties. They did mention that the rock strength, degree of fracturing, condition of drill bit, drill settings, and experience of the operator are factors that influence the measured values of SE.
Although SE is widely used, it is claimed that it should be used with great care, especially for the reliable determination of rock strength. The drill settings must be tuned and known before calculation of SE (Beattie 2009). Smith (2010) used the Aquila MWD system in an Australian copper mine and observed a correlation between the vibration and the specific energy.
3 An example of the soft computing method ANFIS
The literature presented in the previous section indicated that the different drilling parameters are interrelated. These interrelationships need to be considered when drilling parameters are correlated with geotechnical conditions. For this reason multiple parameters need to be measured to obtain reliable correlations.
In recent years, soft computing or grey box modelling methods such as fuzzy logic and neural network have been widely used in geotechnical applications. Due to its learning/pattern recognition capacity, ANFIS modelling, one of the evolving soft computing (grey box modelling) methods, are well suited for capturing the complex interrelationship between drilling parameters and correlating these with geotechnical conditions. The advantages of fuzzy logic is the incorporation of human knowledge and experience to deal with uncertainty, whereas a neural network has the advantage of recognising patterns to cope with the changing environment. To take the advantages of both methods, they are integrated and named as the adaptive neuro fuzzy inference system (ANFIS). The ANFIS method has been used in earth science studies by many researchers in recent years (Dagdelenler et al. 2011; Kucuk et al. 2011; Singh et al. 2007; Yilmaz & Kaynar 2011; Yilmaz & Yuksek 2009). A concise review about ANFIS and its applications in geotechnical engineering can be found in Cabalar et al. (2012). A brief introduction on ANFIS modelling is given below, whereas interested readers are referred to Jang (1993) and Jang et al. (1997) to find detailed and comprehensive information about ANFIS.
3.1 General information on ANFIS modelling
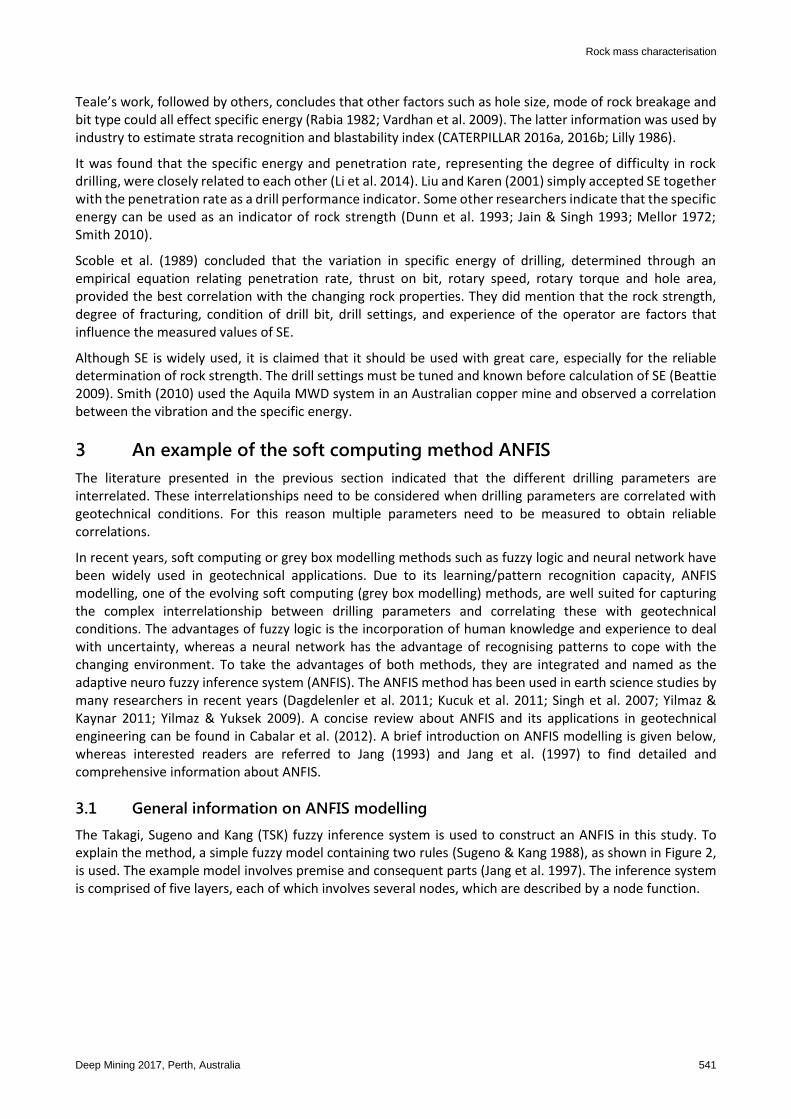
The Takagi, Sugeno and Kang (TSK) fuzzy inference system is used to construct an ANFIS in this study. To explain the method, a simple fuzzy model containing two rules (Sugeno & Kang 1988), as shown in Figure 2, is used. The example model involves premise and consequent parts (Jang et al. 1997). The inference system is comprised of five layers, each of which involves several nodes, which are described by a node function.
The use of soft computing methods for the prediction of rock properties based on measurement H Basarir et al. while drilling data
542 Deep Mining 2017, Perth, Australia
Figure 2 An adaptive network and a fuzzy inference system
The system has two input variables, x and y, and an output variable f. In fuzzy systems every input variable is described by fuzzy sets. In the example, A1 and A2 are the fuzzy sets for the x variable, and B1 and B2 are the fuzzy sets for the y variable.
A fuzzy set A(x) is represented by the constituent elements x and their associated membership values µA(x) (the degree of belongingness).
𝐴(𝑥) = {(𝑥, 𝜇𝐴(𝑥)), 𝑥 ∈ 𝑋} (2)
where:
X = the universal set consisting of all possible elements.
µA(x) = the membership function ranging between 0 and 1.
In an ANFIS model the relationship between input and output is expressed by means of ‘if-then’ rules. The example model involves 2 fuzzy ‘if-then’ rules as follows:
Rule 1 IF (𝑥 is 𝐴1) AND (𝑦 is 𝐵1) THEN 𝑓1 = 𝑝1𝑥 + 𝑞1𝑦 + 𝑟1 (3)
Rule 2 IF (𝑥 is 𝐴2) AND (𝑦 is 𝐵2) THEN 𝑓2 = 𝑝2𝑥 + 𝑞2𝑦 + 𝑟2 (4)
where:
p1, q1, r1 and p2, q2, r2 are the consequent parameters.
A1, B1 and A2, B2 are the linguistic labels, which are represented by fuzzy sets as shown in Figure 2.
Each layer containing the node functions is described below.
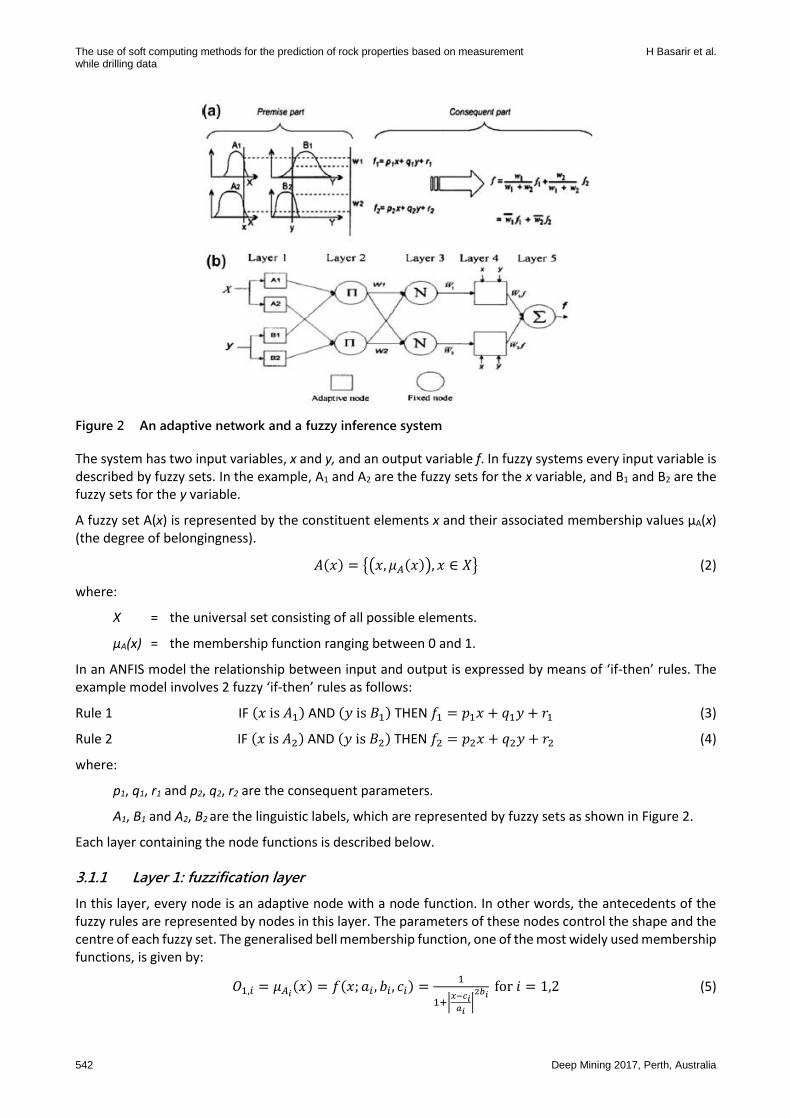
3.1.1 Layer 1: fuzzification layer
In this layer, every node is an adaptive node with a node function. In other words, the antecedents of the fuzzy rules are represented by nodes in this layer. The parameters of these nodes control the shape and the centre of each fuzzy set. The generalised bell membership function, one of the most widely used membership functions, is given by:
𝑂1,𝑖 = 𝜇𝐴𝑖(𝑥) = 𝑓(𝑥; 𝑎𝑖 , 𝑏𝑖, 𝑐𝑖) =
1
1+|𝑥−𝑐𝑖
𝑎𝑖|2𝑏𝑖
for 𝑖 = 1,2 (5)

Rock mass characterisation
Deep Mining 2017, Perth, Australia 543
where:
O1,i = the output functions.
x = the input node i.
Ai = the linguistic label associated with this node (i.e. hard, medium, soft etc.).
a, b, c = the parameter set that changes the shape of the membership function. a, b, c are referred as premise parameters.
3.1.2 Layer 2: rule layer
In this layer, the nodes whose output is the product of all the incoming signals are fixed. In this layer, each node calculates the firing strength of each rule via multiplication. Each rule is assigned a firing strength, measuring the degree to which the rule matches the inputs. The number of the nodes in this layer equals the number of if-then rules, i.e. two for the explained example.
𝑂2,𝑖 = 𝑤𝑖 = 𝜇𝐴𝑖(𝑥) ∙ 𝜇𝐵𝑖
(𝑥) for 𝑖 = 1,2 (6)
where:
O2,I = denotes the output of layer 2.
wi = the firing strength.
3.1.3 Layer 3: normalisation layer
The nodes in this layer are the fixed nodes as in the previous layer. The ratio of the ith rule’s firing strength to the sum of all rules firing strength is calculated by the nodes in this layer.
𝑂3,𝑖 = �̅�𝑖 =𝑤𝑖
𝑤1+𝑤2 for 𝑖 = 1,2 (7)
where:
O3,I = the output of this layer called as normalised firing strength (�̅�𝑖).
3.1.4 Layer 4: defuzzification layer
Node function is given by:
𝑂4,𝑖 = �̅�𝑖 ∙ 𝑓𝑖 = �̅�𝑖(𝑝𝑖𝑥 + 𝑞𝑖𝑦 + 𝑟𝑖) for 𝑖 = 1,2 (8)
where:
�̅�𝑖 = a normalised firing strength from layer 3.
pi, qi, ri = the consequent parameter set of this node.
fi = can either be first order polynomial as shown in the example or pre-defuzzified constant.
3.1.5 Layer 5: output layer
The single node in this layer is a fixed node labelled as . The overall output, as the summation of all input from layer 4, is computed by a fixed node. Overall output is given by:
𝑂5,𝑖 = ∑ �̅�𝑖 ∙ 𝑓𝑖𝑖 =∑ 𝑤𝑖∙𝑓𝑖𝑖
∑ 𝑤𝑖𝑖 for 𝑖 = 1,2 (9)
A fuzzy inference system and functionally equivalent adaptive network are shown in Figure 2 (a) and (b), respectively.

The use of soft computing methods for the prediction of rock properties based on measurement H Basarir et al. while drilling data
544 Deep Mining 2017, Perth, Australia
4 A case study
The previously published information (Basarir et al. 2014), collected from seven exploration drilling activities conducted by the Mineral Research and Exploration Institute of Turkey (MTA) (Akun 1997), is used as a case study. The boreholes were drilled at six different regions around four cities of Turkey; the Kilimli, Bartin, and Kandilli regions are located near the Zonguldak city hard coal basin. Other regions include Kinik, Maldan and Dodurga which are located near the cities of Izmir, Manisa and Ankara, respectively.
During the drilling operation, the lithological description of rock units was continuously identified and recorded. A wide range of rock units such as mudstone, claystone, conglomerate, sandstone, limestone, volcanic, greywacke, agglomerate, and siltstone was identified in the field. For each lithological unit the RQD values were determined from the cores of the field drilling operation as a percentage of the drill core pieces in lengths of 10 cm or more. Here it should be noted that RQD depends on the direction of drilling. Therefore, in order to make a true correlation, multiple drill hole orientations would be required. Operational parameters such as bit load (BL) and bit rotation (BR) were recorded from the respective measurement gauges on the rig. The penetration rate was also continuously recorded during drilling. The total length of logged drill core covered in the database is over 1 km. The statistical summaries of input variables such as BR, BL, PR and dependent parameter, RQD, are given in Table 1.
Table 1 Statistical summaries of recorded and calculated parameters
BR
(RPM)
BL
(kg)
PR
(cm/min)
RQD
Mean 377 1,227 3.8 48.8
Std. deviation 79 370 2.16 23.3
Minimum 200 486 0.20 5
Maximum 550 2,268 11.4 100
4.1 Selection of model parameters and analyses of data
The effective parameters to be used in the modelling studies were determined by considering the presented literature survey, experience and statistical evaluations. During drilling operations, either the BL or BR is increased while keeping the other constant to get higher penetration rate for a certain depth of advance. As it was emphasised in the presented literature survey, rock properties are closely related to the penetration rate (PR). Therefore, PR was selected as one of the dependent variables in the developed models. More recent studies indicated that all of the selected variables were the most responsive to changing geological conditions (Zhou et al. 2011). The histograms showing the distributions of MWD parameters and RQD are shown in Figure 3.
To explore the relationship between the selected parameters and the RQD, Pearson’s correlation chart, given in Table 2, is used. PR is the most significant parameter with the correlation coefficient of 0.76. Bit rotation (BR) is the second important parameter with a coefficient of 0.54. Although the correlation coefficient of BL is lower than others, 0.22, the parameter is still considered as statistically significant.

Rock mass characterisation
Deep Mining 2017, Perth, Australia 545
Table 2 Pearson’s correlation chart
RQD BR BL PR
RQD 0.54 -0.02 0.76
BR Moderate -0.01 0.32
BL Weak Weak -0.22
PR Strong Weak Weak
Figure 3 Histograms of MWD parameters and RQD
4.2 Construction of ANFIS model for the prediction of RQD
After initialisation, the ANFIS model was trained by MATLAB (2011), using the data obtained from the aforementioned drilling activities. TSK type fuzzy inference system and neural network structure were incorporated by means of ANFIS. The three inputs BL, BR and PR data were trained by a hybrid learning algorithm (MATLAB 2011) and RQD was predicted as output data. The sequential network architecture of the developed ANFIS model is given in Figure 4.
Figure 4 The structure of constructed ANFIS model

The use of soft computing methods for the prediction of rock properties based on measurement H Basarir et al. while drilling data
546 Deep Mining 2017, Perth, Australia
For all MWD parameters or input variables the number of membership functions was experimentally determined as two, by developing various models. In ANFIS, the number of rules is determined by the number of membership functions. In the developed model containing three input parameters with two membership functions, the number of rules was determined as eight. After training, final membership functions were obtained.
In fuzzy modelling, a linguistic expression or fuzzy proposition was assigned for each of the membership functions. The linguistic expressions for BL are heavy (H) and light (L). The fuzzy propositions for BR are fast (F) and slow (S), whereas, the linguistic expressions assigned for PR are high (H) and low (L). Using the trained model, the training and validation datasets are simulated. These linguistic terms are also used to describe the input-output relations through the fuzzy if-then rules. The linguistic terms and corresponding trained membership function parameters or premise parameters are given in Table 3 and the functions are shown in Figure 5.
Figure 5 Trained membership functions
Table 3 Linguistic terms and premise parameters
Parameter Linguistic term Parameters of membership function
a b c
BR Fast 175 4.227 550
Slow 174.9 1.394 199.9
BL Heavy 891 3.139 2,268
Light 891 1.737 486
PR High 5.332 5.266 9.666
Low 5.328 2.154 -0.374

Rock mass characterisation
Deep Mining 2017, Perth, Australia 547
The rules were developed by ANFIS considering the data obtained from drillholes. The rule base contains eight fuzzy if-then rules as shown in Table 4:
To develop the model, the overall data set consisting of 182 records was divided randomly into two sets as training and checking data sets. The training dataset was composed of 80% of the available database, whereas 20% of the available database was used to check the developed model.
𝑓𝑖 = 𝑝𝑖𝐵𝐿 + 𝑞𝑖𝐵𝑅 + 𝑟𝑖𝑃𝑅 + 𝑠𝑖 (10)
The values of consequent parameters in the output functions are presented in Table 4 for the different combinations of premise function classes.
Table 4 The output functions and consequent parameters
Premise Parameter class Output function i =
Consequent parameters
BR BL PR p q r s
Slow Low Low 1 -0.0639 -0.0091 11.75 22.78
Slow Low High 2 0.0741 -0.0229 3.15 26.32
Slow High Low 3 -0.0131 -0.0014 621.2 20.57
Slow High High 4 0.3781 -0.0849 4.85 61.44
Fast Low Low 5 -0.0004 0.0271 -3.27 22.1
Fast Low High 6 -0.192 -0.0193 7.08 130.1
Fast High Low 7 0.0817 -0.0453 70.99 -43.23
Fast High High 8 -0.0682 -0.1936 32.95 97.84
The final stage of the constructed ANFIS model is the defuzzification stage, or the obtainment of a crisp value, which can be expressed as a linear combination of the consequent parameters. For a certain set of MWD parameters, each rule leads to a RQD value. Then the average and range of calculated values yield the RQD predicted by the model. An example sketch showing the calculation of RQD for BR = 350 rpm, BL = 1,400 kg and PR = 6 cm/min is given in Figure 6.
4.3 The performances of the developed model
In this section, the performance of the developed model is assessed by means of two, commonly used, statistical indicators; the variance account for (VAF) and root mean square error (RMSE) defined as follows:
𝑉𝐴𝐹 = (1 −𝑣𝑎𝑟(𝑦−�̂�)
𝑣𝑎𝑟(𝑦)) ∙ 100 (11)
𝑅𝑀𝑆𝐸 = √1
𝑁∙ ∑ (𝑦 − �̂�)2𝑁
𝑖=1 (12)
where:
var = the variance.
y = the measured value.
�̂� = the predicted value.
N = number of samples.
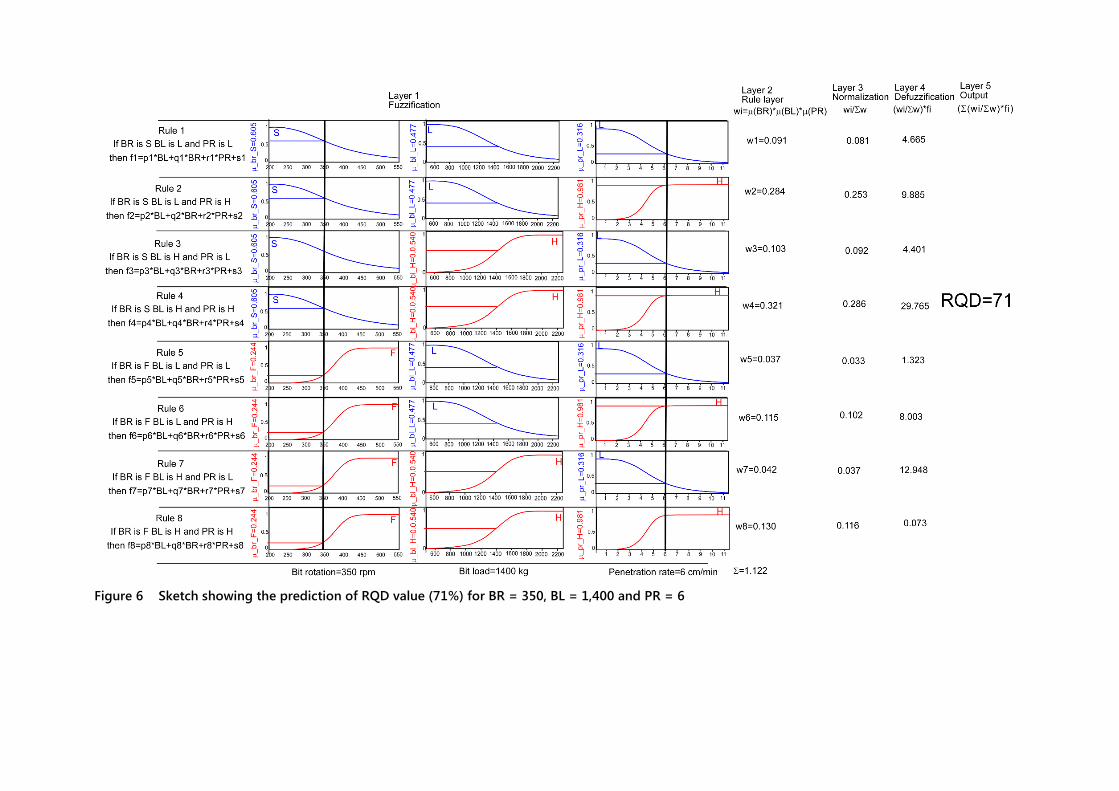
Figure 6 Sketch showing the prediction of RQD value (71%) for BR = 350, BL = 1,400 and PR = 6

Rock mass characterisation
Deep Mining 2017, Perth, Australia 549
The VAF performance index is used to investigate to what degree the model can explain the variance in data. To verify the correctness of a model, VAF is often used by comparing the measured values (y) with the estimated output of the model (�̂�).The higher the VAF the better the model performs. If the measured and predicted values are exactly the same, VAF is equal to 100%.
The model performance increases as RMSE decreases. Unlike to VAF, the bias in the model is also accounted for by means of RMSE. The value indicating the perfect prediction performance for RMSE is 0.
The calculated RMSE and VAF performance indicators of ANFIS model for training, validation and overall data sets are presented in Table 5. Both performance indicators prove that ANFIS models can successfully predict RQD.
Table 5 The calculated RMSE and VAF indicators of ANFIS model
Data set Performance indicator
Training VAF 83.88 %
RMSE 9.36
Validation VAF 81.90 %
RMSE 9.88
Overall VAF 84.49%
RMSE 8.39
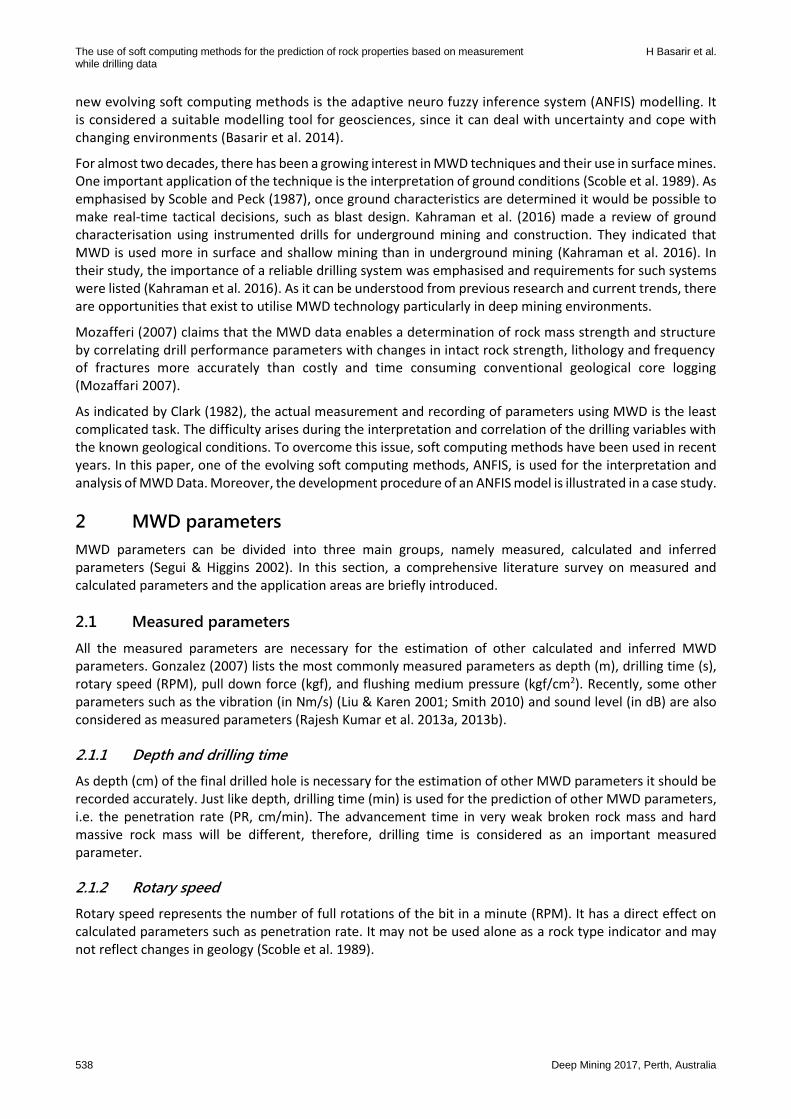
To visualise the performance of the developed model a plot of the predicted and calculated RQD, together with a 1:1 gradient line for training, checking and overall data set, are given in Figure 7.
Figure 7 Cross correlation graphs for training, checking and all data sets
5 Conclusion
A literature review on the subject of MWD indicated that the different drilling parameters are interrelated. These interrelationships need to be considered when drilling parameters are correlated with geotechnical conditions. For this reason, multiple parameters need to be measured to obtain reliable correlations.
Based on the presented literature review and our own experience, in our opinion, MWD parameters coming from either diamond bit drilling, or other drilling operations, have great potential for being correlated with other rock mass properties, such as rock mass strength and deformation modulus.
As MWD technology improves, more reliable data becomes available, which allows for more in-depth studies of the relationship between MWD parameters internally, and the correlations with geotechnical conditions.

The use of soft computing methods for the prediction of rock properties based on measurement H Basarir et al. while drilling data
550 Deep Mining 2017, Perth, Australia
Due to its learning/pattern recognition capacity, ANFIS modelling, one of the evolving soft computing (grey box modelling) methods, are well suited for capturing the complex interrelationship between drilling parameters and correlating these with geotechnical conditions.
In this study, ANFIS modelling was used for developing a model relating MWD parameters to RQD. The measurement while drilling parameters such as bit load, bit rotation and penetration rate are used as model input parameters. Statistical performance indicators show that ANFIS modelling is suitable for obtaining and quantifying complex correlations between MWD parameters and geotechnical conditions. In this particular application a good correlation with RQD was obtained. Initial estimation of the RQD can be obtained based on MWD parameters.
With the approach presented in this paper, the drill bit information can be used in supplementing conventionally obtained RQD to be employed in many mining engineering applications such as rock mass classification systems, excavatability assessment and blast design.
The modelling methodology shown here appears to be reliable, but the model developed can be improved by adding new cases and new data of similar nature.
References
Adebayo, B & Bello, WA 2014, ‘Discontinuities effect on drilling condition and performance of selected rocks in Nigeria’, International Journal of Mining Science and Technology, vol. 24, doi:10.1016/j.ijmst.2014.07.008, pp. 603–608.
Akun, M, 1997, Effect of operational parameters and formation properties on drillability in surface set diamond core drilling, PhD thesis, Middle East Technical University, Ankara.
Basarir, H & Karpuz, C 2016, ‘Preliminary estimation of rock mass strength using diamond bit drilling operational parameters’, International Journal of Mining, Reclamation and Environment, vol. 30, doi:10.1080/17480930.2015.1025561, pp. 145–164.
Basarir, H, Tutluoglu, L & Karpuz, C 2014, ‘Penetration rate prediction for diamond bit drilling by adaptive neuro-fuzzy inference system and multiple regressions’, Engineering Geology, vol. 173, doi:10.1016/j.enggeo.2014.02.006, pp. 1–9.
Beattie, N 2009, Monitoring-While-Drilling for Open-Pit Mining in a Hard Rock Environment: An Investigation of Pattern Recognition Techniques Applied to Rock Identification, PhD thesis, Queen’s University, Kingston.
Brown, E, Carter, P & Robertson, W 1984, ‘Experience with a prototype instrumented drilling rig’, Geodrilling, February 1984, pp. 10–14.
Cabalar, AF, Cevik, A & Gokceoglu, C 2012, ‘Some applications of Adaptive Neuro-Fuzzy Inference System (ANFIS) in geotechnical engineering’, Computers and Geotechnics, vol. 40, doi:10.1016/j.compgeo.2011.09.008, pp. 14–33.
CATERPILLAR 2016a, CAT Aquila, WesTrac, Midland, Western Australia, viewed 17 August 2016, http://www.westrac.com.au/equipmentmanager/mining_technology/pages/terrain.aspx
CATERPILLAR 2016b, CAT Terrain, WesTrac, Midland, Western Australia, viewed 7 November 2016, http://www.cat.com/en_US/support/operations/technology/cat-minestar/terrain/terrain-for-drilling.html
Clark, G, 1982, ‘Principles of rock drilling and bit wear, Part 1’, Colorado School of Mines Quarterly, Colorado School of Mines, Colorado.
Dagdelenler, G, Sezer, EA & Gokceoglu, C 2011, ‘Some non-linear models to predict the weathering degrees of a granitic rock from physical and mechanical parameters’, Expert Systems with Applications, vol. 38, doi:10.1016/j.eswa.2010.12.076, pp. 7476–7485.
Dunn, P, Roberts, C & Ballardin, B 1993, ‘The use of specific energy as a drillability index’, in T Szwedzicki (ed.), Geotechnical Instrumentation and Monitoring in Open Pit and Underground Mining, CRC Press, Bota Raton, Florida, pp. 125–132.
Gui, M & Hamelin, J 2004, ‘Development of An instrumented borehole drilling system for ground investigation’, Electronic Journal of Geotechnical Engineering, vol. 9, pp. 350.
Gui, M, Soga, K, Bolton, M & Hamelin, J 2002, ‘Development of an instrumented borehole drilling system for ground investigation’, Journal of Geotechnical and Geoenvironmental Engineering, vol. 128, pp. 283–291.
Guzek, A, Shufrin, I, Pasternak, E & Dyskin, A 2015, ‘Influence of drilling mud rheology on the reduction of vertical vibrations in deep rotary drilling’, Journal of Petroleum Science and Engineering, vol. 135, pp. 375–383.
Gonzalez, J 2007, Application of Pattern Recognition Techniques to Monitoring-While-Drilling on a Rotary Electric Blasthole Drill at an Open-Pit Coal Mine, Queen’s University, Kingston, Ontario.
Hagan, T & Reid, I 1983, ‘Performance monitoring of production blasthole drills--a means of increasing blasting efficiency’, Proceedings of the 2nd International Surface Mining and Quarrying Symposium, Institution of Mining and Metallurgy, Bristol, pp. 245–254.
Hagan, T & Reid, I 1983, ‘Performance monitoring of production blasthole drills--a means of increasing blasting efficiency’, Transactions of the Institution of Mining and Metallurgy, vol. 92, pp. A171–A179.
Jain, A & Singh, D 1993, ‘Specific energy as a criterion for drillability of rocks – a laboratory study’, in T Szwedzicki (ed), Geotechnical Instrumentation and Monitoring in Open Pit and Underground Mining, CRC Press, Bota Raton, Florida, pp. 253-263.

Rock mass characterisation
Deep Mining 2017, Perth, Australia 551
Jang, JSR 1993, ‘ANFIS: Adaptive-Network-Based Fuzzy Inference System’, IEEE Transactions on Systems, Man and Cybernetics, vol. 23, doi:10.1109/21.256541, pp. 665–685.
Jang, JSR, Chuen-Tsai, S & Mizutani, E, 1997, Neuro-Fuzzy and Soft Computing, Prentice-Hall, Upper Saddle River, New Jersey. Kahraman, S, Bilgin, N & Feridunoglu, C 2003, ‘Dominant rock properties affecting the penetration rate of percussive drills’,
International Journal of Rock Mechanics and Mining Sciences, vol. 40, doi:10.1016/S1365-1609(03)00063-7, pp. 711–723. Kahraman, S, Rostami, J & Naeimipour, A 2016, ‘Review of ground characterization by using instrumented drills for underground
mining and construction’, Rock Mechanics and Rock Engineering, vol. 49, doi:10.1007/s00603-015-0756-4, pp. 585–602. Kucuk, K, Aksoy, CO, Basarir, H, Onargan, T, Genis, M & Ozacar, V 2011, ‘Prediction of the performance of impact hammer by adaptive
neuro-fuzzy inference system modelling’, Tunnelling Underground Space Technology Including Trenchless Technology Research, vol. 26, doi:10.1016/j.tust.2010.06.011, pp. 38–45.
Li, Z, Itakura, K & Ma, Y 2014, ‘Survey of measurement-while-drilling technology for small-diameter drilling machines’, Electronic Journal of Geotechnical Engineering, vol. 19, pp. 10267–10282.
Lilly, P 1986, ‘An empirical method of assessing rock mass blastability’, in J Davidson (ed.) Proceedings of the Large Open Pit Mine Conference, The Australasian Institute of Mining and Metallurgy, Carlton South, pp. 88–92.
Liu, H & Karen, YK 2001, ‘Analysis and interpretation of monitored rotary blast hole drilling data’, International Journal of Surface Mining, Reclamation and Environment, vol. 15, pp. 177–203.
MATLAB 2011, Software for technical computing and model-based design, The MathWorks, Inc., Massachusetts, https://www.mathworks.com/products/matlab.html
Mellor, M 1972, ‘Normalization of specific energy values’, International Journal of Rock Mechanics and Mining Sciences, vol. 9, pp. 661–663.
Mozaffari, S 2007, Measurement While Drilling System in Aitik Mine, PhD thesis, Luleå University of Technology, Luleå. Rabia, H 1982, ‘Specific energy as a criterion for drill performance prediction’, International Journal of Rock Mechanics and Mining
Sciences & Geomechanics Abstracts, vol. 19, pp. 39–42. Rai, P, Schunnesson, H, Lindqvist, P-A & Kumar, U 2016, ‘Measurement-while-drilling technique and its scope in design and prediction
of rock blasting’, International Journal of Mining Science and Technology, vol. 26, doi:10.1016/j.ijmst.2016.05.025, pp. 711–719.
Rajesh Kumar, B, Vardhan, H, Govindaraj, M & Saraswathi, PS 2013a, ‘Artificial neural network model for prediction of rock properties from sound level produced during drilling’, Geomechanics and Geoengineering, vol. 8, doi:10.1080/17486025.2012.661469, pp. 53–61.
Rajesh Kumar, B, Vardhan, H, Govindaraj, M & Vijay, GS 2013b, ‘Regression analysis and ANN models to predict rock properties from sound levels produced during drilling’, International Journal of Rock Mechanics and Mining Sciences, vol. 58, doi:10.1016/j.ijrmms.2012.10.002, pp. 61–72.
Schunnesson, H 1998, ‘Rock characterisation using percussive drilling’, International Journal of Rock Mechanics and Mining Sciences, vol. 35, doi:10.1016/S0148-9062(97)00332-X, pp. 711–725.
Scoble, M & Peck, J 1987, ‘A technique for ground characterization using automated production drill monitoring’, International Journal of Surface Mining, Reclamation and Environment, vol. 1, doi:10.1080/09208118708944101, pp. 41–54.
Scoble, MJ, Peck, J & Hendricks, C 1989, ‘Correlation between rotary drill performance parameters and borehole geophysical logging’, Mining Science and Technology, vol. 8, doi:10.1016/S0167-9031(89)90448-9, pp. 301–312.
Segui, J & Higgins, M 2002, ‘Blast design using measurement while drilling parameters’, Fragblast, vol. 6, doi:10.1076/frag.6.3.287.14052, pp. 287–299.
Singh, TN, Sinha, S & Singh, VK 2007, ‘Prediction of thermal conductivity of rock through physico-mechanical properties’, Building and Environment, vol. 42, doi:10.1016/j.buildenv.2005.08.022, pp. 146–155.
Smith, B 2010, ‘Improvements in blast fragmentation using measurement while drilling parameters’, Fragblast, vol. 6, doi:10.1076/frag.6.3.301.14055, pp. 301–310.
Sugeno, M & Kang, G 1988, ‘Structure identification of fuzzy model’, Fuzzy Sets and Systems, vol. 28, doi:10.1016/0165-0114(88)90113-3, pp. 15–33.
Teale, R 1965, ‘The concept of specific energy in rock drilling’, International Journal of Rock Mechanics and Mining Sciences, vol. 2, pp. 57–73.
Turtola, H 2001, Utilization of measurement while drilling to optimise blasting in Large Open Pit mining, Luleå University of Technology, Luleå.
Vardhan, H, Adhikari, GR & Govinda Raj, M 2009, ‘Estimating rock properties using sound levels produced during drilling’, International Journal of Rock Mechanics and Mining Sciences, vol. 46, 604–612. doi:10.1016/j.ijrmms.2008.07.011.
Vynne, J 1997, ‘The application and economic benefits of blasthole drill monitors’, Proceedings ISEE 23rd Annual Conference on Explosives and Blasting Technique, International Society of Explosives Engineers, Cleveland, pp. 635–646.
Yilmaz, I & Kaynar, O 2011, ‘Multiple regression, ANN (RBF, MLP) and ANFIS models for prediction of swell potential of clayey soils’, Expert Systems with Applications, vol. 38, doi:10.1016/j.eswa.2010.11.027, pp. 5958–5966.
Yilmaz, I & Yuksek, G 2009, ‘Prediction of the strength and elasticity modulus of gypsum using multiple regression, ANN, and ANFIS models’, International Journal of Rock Mechanics and Mining Sciences, vol. 46, doi:10.1016/j.ijrmms.2008.09.002, pp. 803–810.
Yin, K, Liu, H & Yang, H 2000, ‘Extracting information from drill data’, Fragblast, vol. 4, doi:10.1080/13855140009408064, pp. 83–99. Zhou, H, Hatherly, P, Ramos, F & Nettleton, E 2011, ‘An adaptive data driven model for characterizing rock properties from drilling
data’, 2011 IEEE International Conference on Robotics and Automation, Institute of Electrical and Electronics Engineers, pp. 1909–1915.

The use of soft computing methods for the prediction of rock properties based on measurement H Basarir et al. while drilling data
552 Deep Mining 2017, Perth, Australia