Embed Size (px)
Citation preview
The use of the GAINS_Italy Model for Impact Assessment
T. Pignatelli, G. Vialetto
ENEA – Technical Unit for Environmental Technologies (UTTAMB) Atmospheric Pollution Laboratory
24th CCE Workshop and 30th Task Force Meeting – Rome, Italy 7-10, April, 2014
Historical hints
The history of the LRTAP Convention shows as the effects of Air Pollution on ecosystems have been studied for a long time and are now much better known.
The need for a tool suitable for scientifically underpinning the development of environmental policies for the protection of the ecosystems became clear in the past decades.
The Integrated Assessment Models are powerful instruments to accomplish the task of providing the policy makers with the most comprehensive and adequate information to develop cost-effective policies.
24th CCE Workshop and 30th Task Force Meeting – Rome, Italy 7-10, April, 2014
Concept of Integrated Approach
24th CCE Workshop and 30th Task Force Meeting – Rome, Italy 7-10, April, 2014
The “Philosophy” behind the Integrated Approach is inspired by the following principles:
Address Air Pollution from different perspectives simultaneously
Analyse and define the inter-connections among basic atmospheric science, technology, economics, health effects, environmental impact, social impact, etc.
Provides all the useful elements to identify the most appropriate solution, bearing in mind the ultimate objectives of the environment and human health protection, social equity and economic growth, while adopting the cost-effectiveness approach.
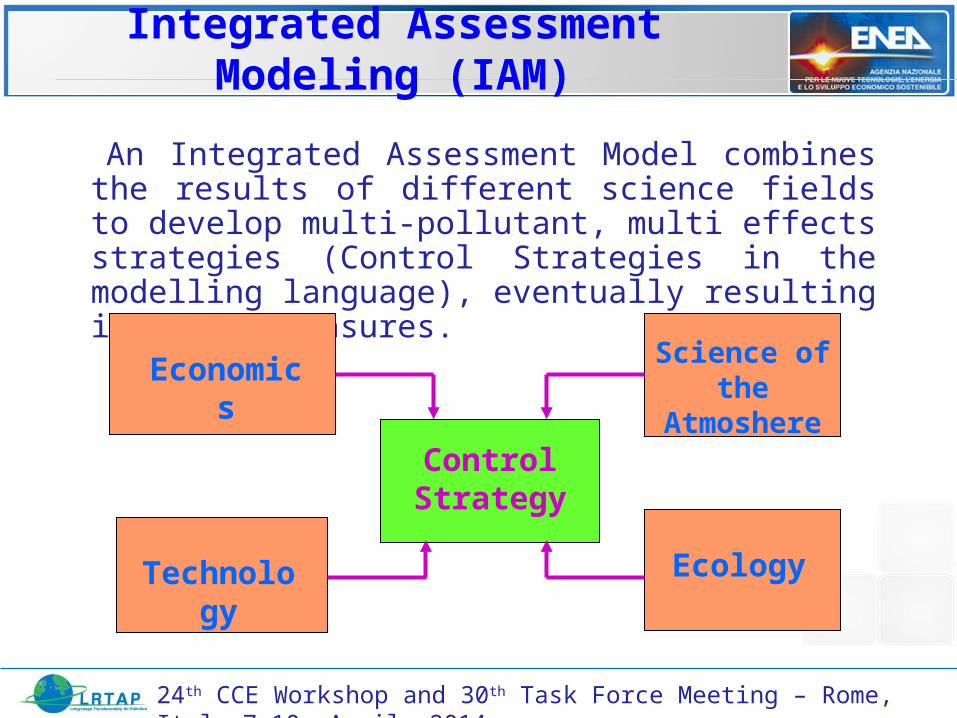
Integrated Assessment Modeling (IAM)
An Integrated Assessment Model combines the results of different science fields to develop multi-pollutant, multi effects strategies (Control Strategies in the modelling language), eventually resulting in policy measures.
Science of theAtmoshere
Economics
Technology
Control Strategy
Ecology
24th CCE Workshop and 30th Task Force Meeting – Rome, Italy 7-10, April, 2014
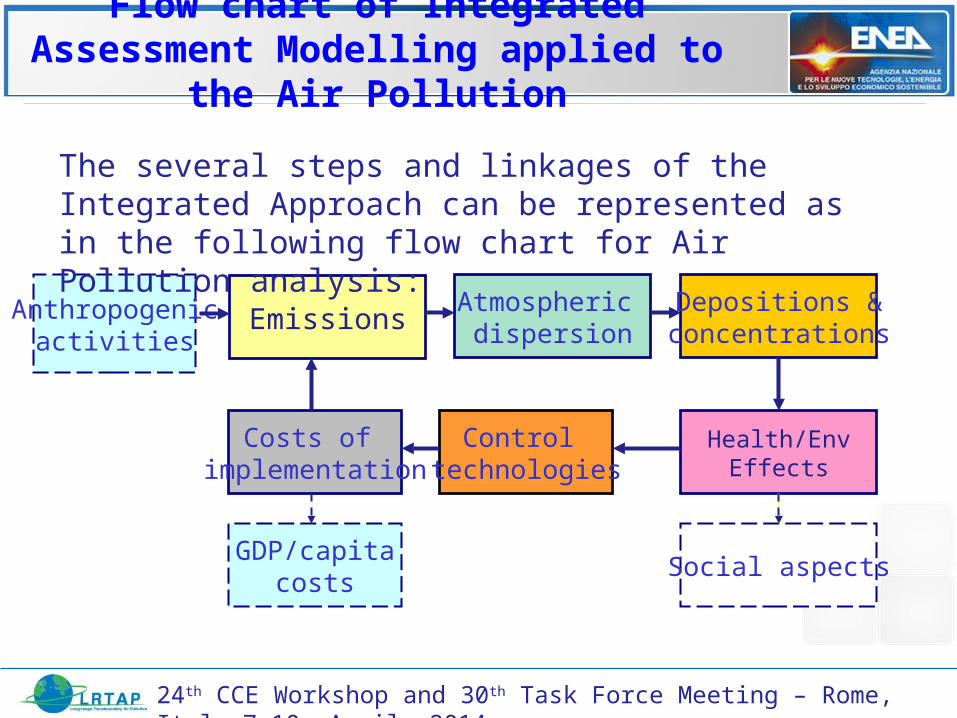
Flow chart of Integrated Assessment Modelling applied to the Air Pollution
24th CCE Workshop and 30th Task Force Meeting – Rome, Italy 7-10, April, 2014
EmissionsAtmospheric
dispersionDepositions &concentrations
Health/EnvEffects
Control technologies
Costs of implementation
Social aspectsGDP/capita
costs
Anthropogenicactivities
The several steps and linkages of the Integrated Approach can be represented as in the following flow chart for Air Pollution analysis:
Integrated Assessment Models in Europe
Several Countries have adopted IAM Systems (ASAM, IMAGE, UKIAM, etc.)
In the frame of UN-ECE LRTAP and the European Union the GAINS-Europe Model represents the most relevant example of application of IAM approach for the develolpment of environmental policies, legally binding in international Treaties.
In Italy, with the financial support provided by the Italian Ministry for the Environment, since 2002, ENEA has developed, in cooperation with IIASA and Arianet S.r.l. Milan, the Model GAINS_Italy as national version of GAINS_Europe.GAINS_Italy is now part of the larger Project MINNI (National Integrated Model to support Internationa Negotiation on A. P.)24th CCE Workshop and 30th Task Force Meeting – Rome, Italy 7-10, April, 2014
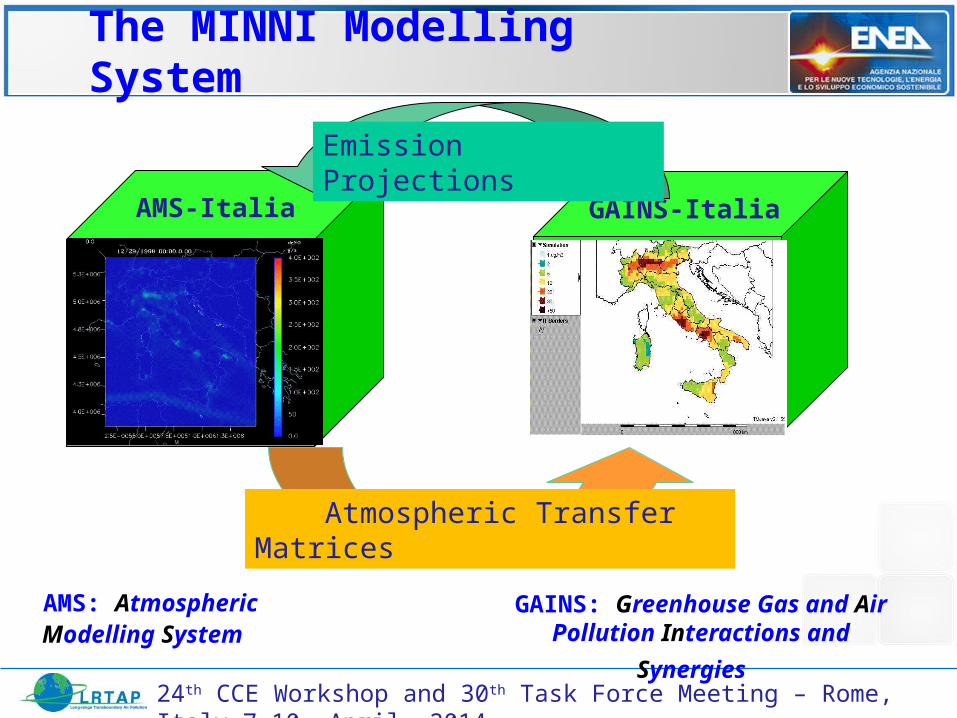
The MINNI Modelling System
Atmospheric Transfer Matrices
AMS: Atmospheric Modelling System
AMS-Italia GAINS-Italia
GAINS: Greenhouse Gas and Air
Pollution Interactions and Synergies
Emission Projections
24th CCE Workshop and 30th Task Force Meeting – Rome, Italy 7-10, April, 2014
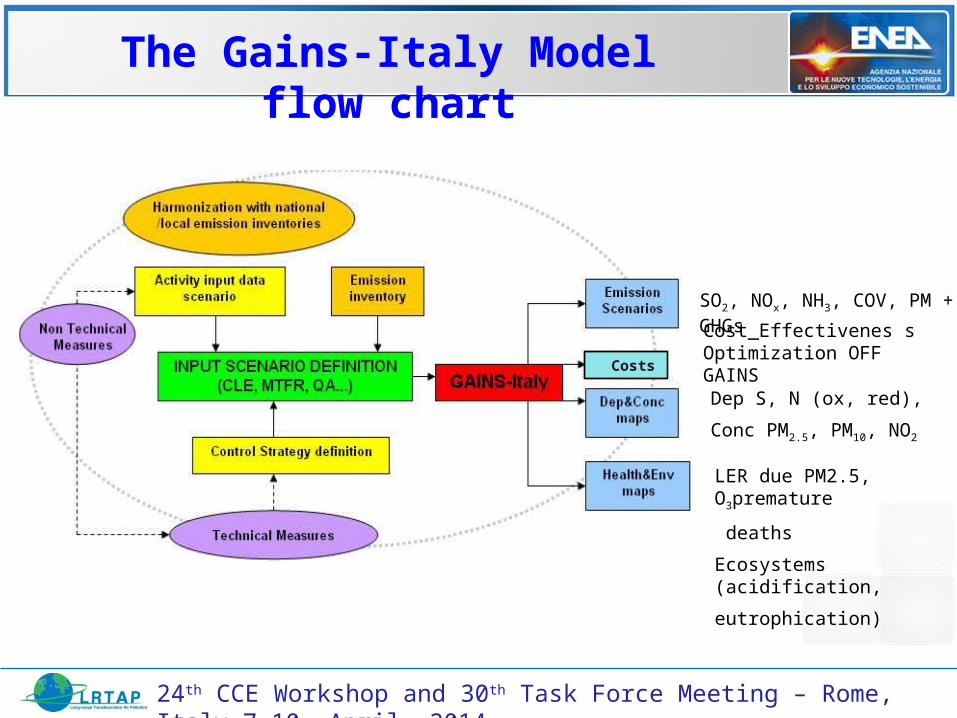
The Gains-Italy Model flow chart
SO2, NOx, NH3, COV, PM + 6 GHGs
Dep S, N (ox, red),
Conc PM2.5, PM10, NO2
LER due PM2.5, O3premature
deaths
Ecosystems (acidification,
eutrophication)
Cost_Effectivenes s Optimization OFF GAINS
24th CCE Workshop and 30th Task Force Meeting – Rome, Italy 7-10, April, 2014
Costs
Gains-Italy on line
24th CCE Workshop and 30th Task Force Meeting – Rome, Italy 7-10, April, 2014
In the frame of the agreement between ENEA and Italian Ministry for the Environment, GAINS_Italy is now available online for Users like the Administrative Regions Experts, to allow them to develop their own emission scenarios, autonomously. As well GAINS_Italy is open to the general public to disseminate the results of the ENEA analyses on air pollution, and experts from other Research Institutions (e.g. Konkuk University and NIER – South Korea) for joint researches with ENEA
Links to GAINS_Italy : http://gains-it.bologna.enea.it/gains/IT/index.login?login From the MINNI Project homepage http://www.minni.org
Impact Analysis
24th CCE Workshop and 30th Task Force Meeting – Rome, Italy 7-10, April, 2014
Similarly to GAINS_Europe the Impact Indicators in GAINS_Italy are related to :
Impact on Ecosystems in terms of Acidification and eutrofication
Impact on Human health in terms of Life Expectancy reduction for exposure of the population to PM2.5 and premature deaths due to exposure to Ozone
The impact is strongly related with the meteorology and therefore in GAINS_Italy 4 ATMs are implemented ( 1999, 2003, 2005, 2007) plus the average (AVG) ATM
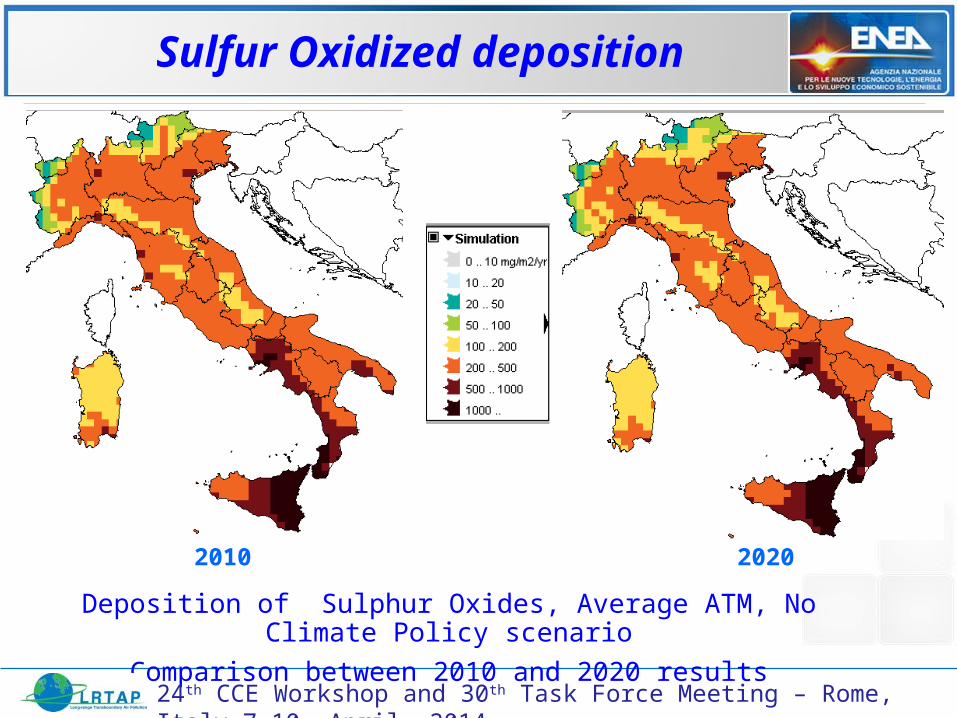
Sulfur Oxidized deposition
Deposition of Sulphur Oxides, Average ATM, No Climate Policy scenario
Comparison between 2010 and 2020 results
2010 2020
24th CCE Workshop and 30th Task Force Meeting – Rome, Italy 7-10, April, 2014
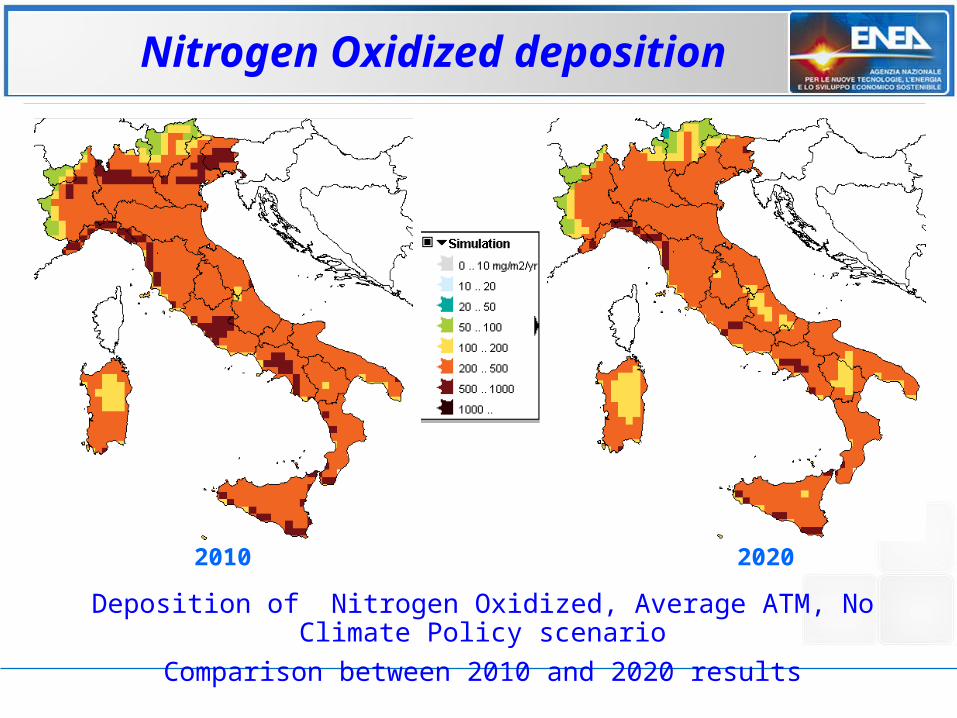
Nitrogen Oxidized deposition
2010 2020
Deposition of Nitrogen Oxidized, Average ATM, No Climate Policy scenario
Comparison between 2010 and 2020 results
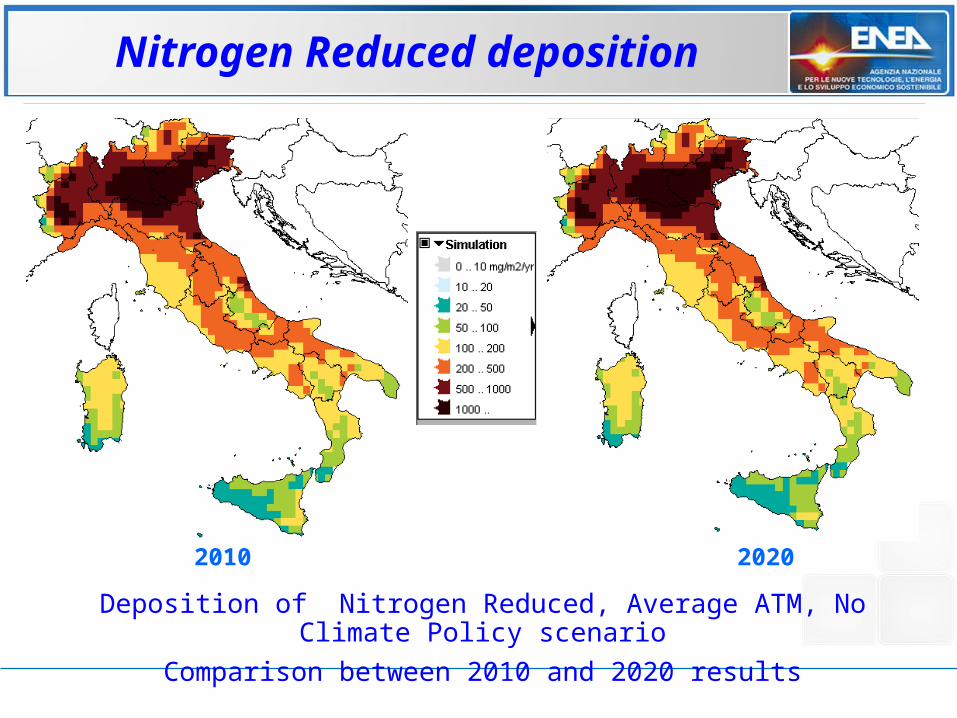
Nitrogen Reduced deposition
2010 2020
Deposition of Nitrogen Reduced, Average ATM, No Climate Policy scenario
Comparison between 2010 and 2020 results
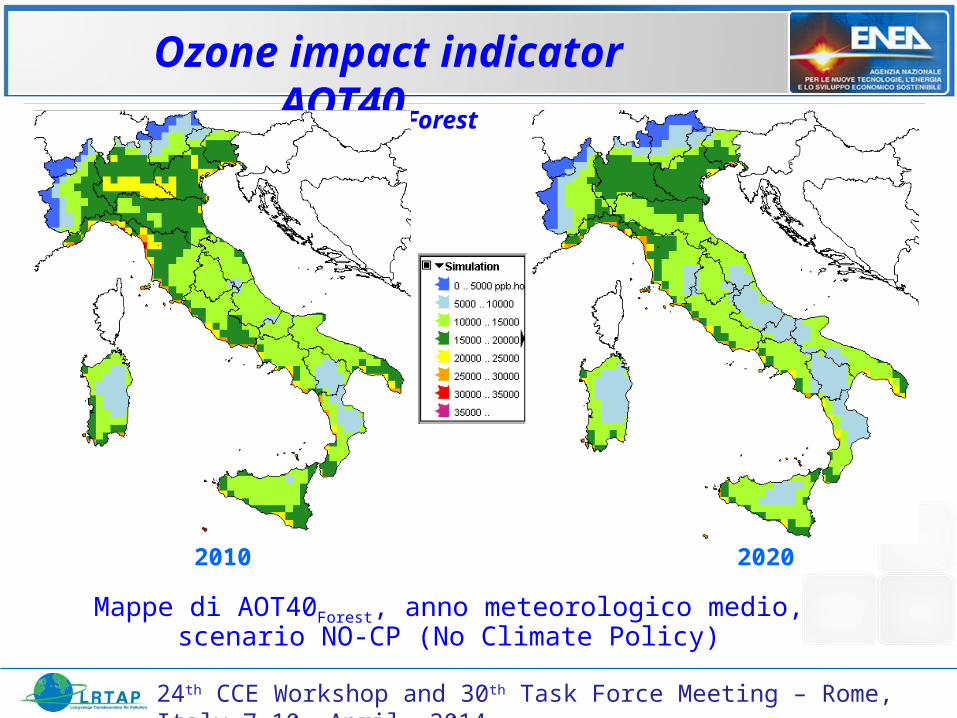
Ozone impact indicator AOT40Forest
Mappe di AOT40Forest, anno meteorologico medio, scenario NO-CP (No Climate Policy)
2010 2020
24th CCE Workshop and 30th Task Force Meeting – Rome, Italy 7-10, April, 2014
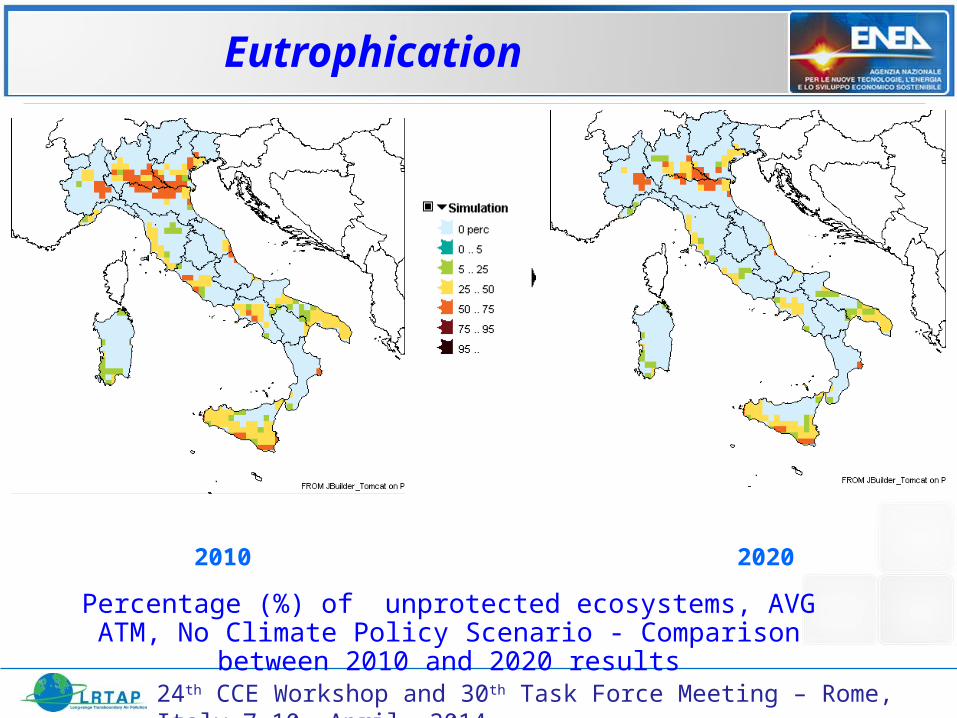
Eutrophication
Percentage (%) of unprotected ecosystems, AVG ATM, No Climate Policy Scenario - Comparison between 2010 and 2020 results
2010 2020
24th CCE Workshop and 30th Task Force Meeting – Rome, Italy 7-10, April, 2014
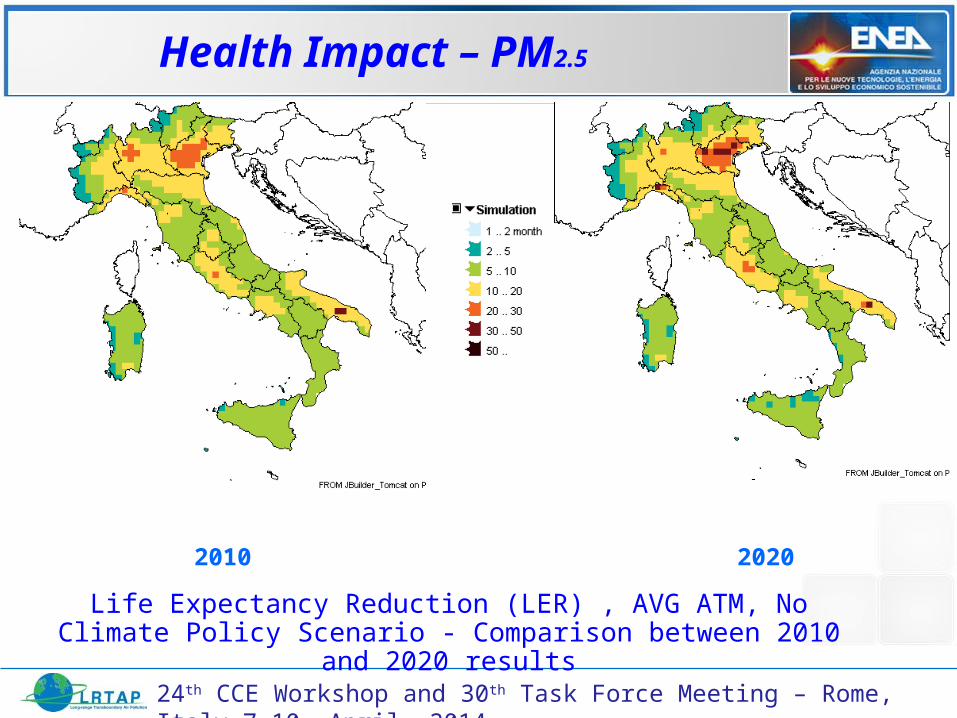
Health Impact – PM2.5
Life Expectancy Reduction (LER) , AVG ATM, No Climate Policy Scenario - Comparison between 2010 and 2020 results
2010 2020
24th CCE Workshop and 30th Task Force Meeting – Rome, Italy 7-10, April, 2014
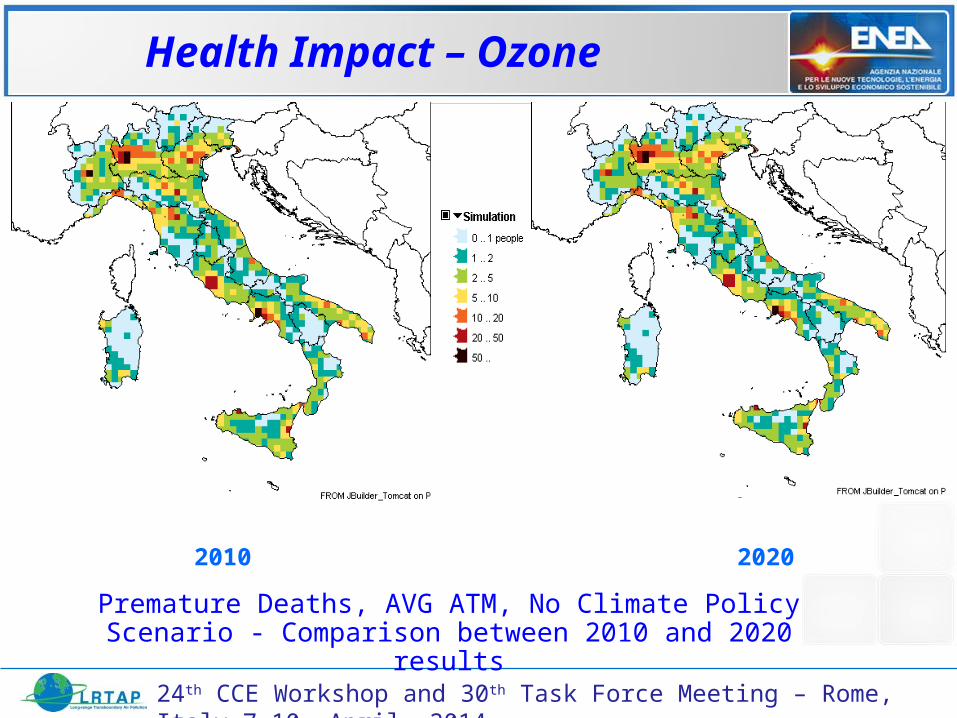
Health Impact – Ozone
Premature Deaths, AVG ATM, No Climate Policy Scenario - Comparison between 2010 and 2020 results
2010 2020
24th CCE Workshop and 30th Task Force Meeting – Rome, Italy 7-10, April, 2014
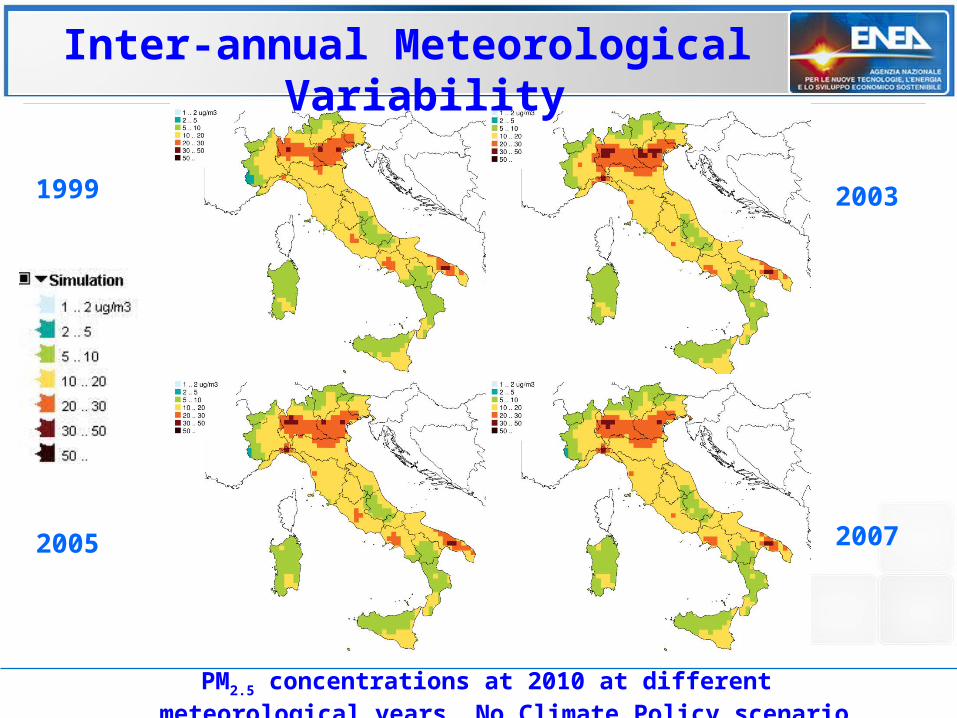
2007
Inter-annual Meteorological Variability
20031999
2005
PM2.5 concentrations at 2010 at different meteorological years, No Climate Policy scenario
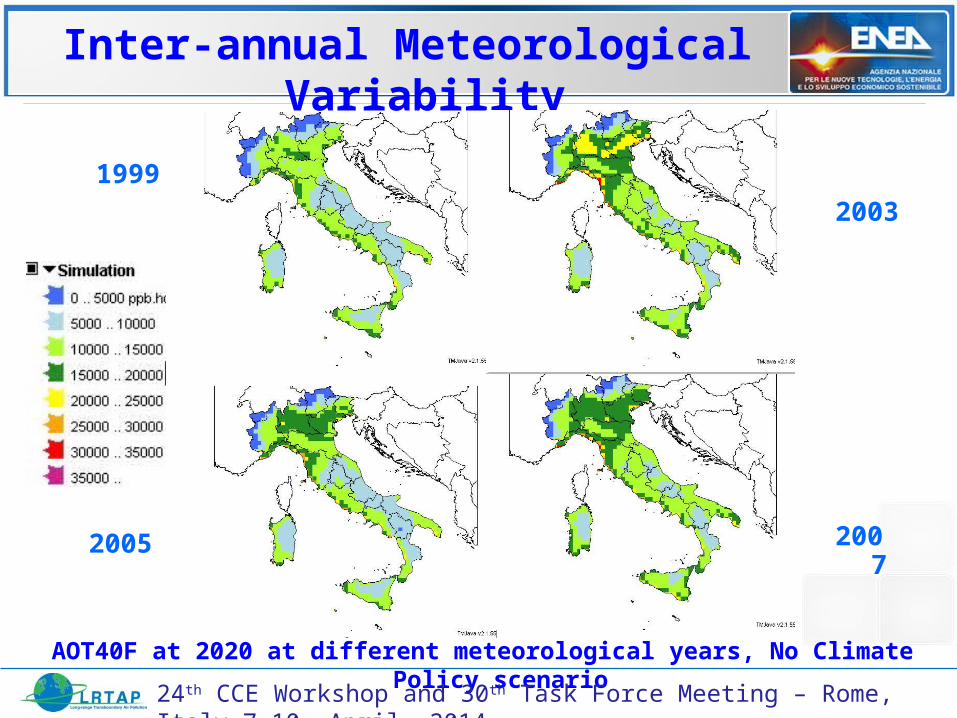
2007
Inter-annual Meteorological Variability
2003
1999
2005
AOT40F at 2020 at different meteorological years, No Climate Policy scenario
24th CCE Workshop and 30th Task Force Meeting – Rome, Italy 7-10, April, 2014
Conclusions
Integrated Assessment Modelling is a powerful instrument to analyse the effects of Air Pollution on the environment and the human Health, from different perspectives and simultaneously.
IAM allows to highlight national peculiarities and focus the attention on the issues of major impact, also identifying the areas of the country where the impact is higher and therefore more effective measures are needed.
IAM allows the experts to provide the policy makers with useful elements, scientifically underpinned, to develop more cost-effective policies to combat the adverse effects of Air Pollution.
24th CCE Workshop and 30th Task Force Meeting – Rome, Italy 7-10, April, 2014