Embed Size (px)
Citation preview

Centre for Automotive Management The University of Buckingham Business School www.buckingham.ac.uk/cam
A REPORT FOR BCA
The Used Car Market Report 2013

The Used Car Market – a report by BCA
3
Foreword
We are delighted to bring you
this 23rd edition of the BCA
Used Car Market Report.
This year's report looks at how
nearly five years of financial
anxiety has affected motorists'
decisions on buying a used car
and the impact of prolonged,
low new car market volumes on
the used car industry.
Our editor, Professor Peter N C Cooke, the Professor of Automotive
Management, the Centre for Automotive Management at The University of
Buckingham is a well-known commentator on the motor industry.
Professor Cooke spent over 20 years in the motor industry and has taught,
researched and written about the industry at business schools for a similar
period. He has undertaken much work on the fleet, used car and LCV sectors
and edited the BCA Used Car Market Report for several years.
The Buckingham Automotive team has sought to retain the key aspects of
this highly-regarded report, and has undertaken new analysis on the changing
shape of the used car market.
Given early signs of economic recovery, the BCA Used Car Market Report
2013 also looks at the prospects for sustained growth in the UK's automotive
industries.
Jon Olsen
CEO
BCA Vehicle Remarketing

Contents
Foreword 3
Introduction 6
Overview
New and used car market volumes rise The new car market The used car market Consumer perspective
7
789
10
UK Market Review
Used car volumes top seven million Used:new car ratios Used car market segments Dealers’ used car sales Private-to-private used car sales 6-8 year-old cars outpace the market UK car market value reaches new high Dealer/private sector used car market value Used car selling prices Used car prices at auction Average age of cars reaches a 30-year high Three-quarters of cars reach 12 years The ‘parc turn’ indicator Car parc ageing effect Encouraging signs on the horizon
12
121212131516161718191920212223
Consumer Perspective
Part One – What Used Car to Buy? What used car to consider buying? Influences on search for car 'Crunch factors' Part Two – Where to Buy From? Which used car retailer to buy from? Buying from franchised and non-franchised dealers Three-quarters of motorists buy a used car Seven out 10 households own a car Hatchbacks most popular Buying a used car rather than new? Sales of used diesels rise Used car satisfaction remains very high Part Three – Car Owners' Options and Buying Intentions Buying a car in the next year? What type of car to buy next? Where to buy the next car? Low or 0% interest next time? Sell your car 'for cash' next time? Reasons for selling 'for cash' Part Four – Economic Recovery, Running Costs, and Keeping in Touch What car to buy during economic uncertainty? Steps already taken to cut car running costs
24
2525262628282929303132323335353536363739404041

Contents
Regional Review
'Personal experience' tops the list in nine regions When to buy the next car? Where to buy the next car? What car to buy next? Satisfied used car owners Major influences on car search Selling your car 'for cash' Buying a new car instead of used
42
4243444445464647
European Overview
New car market volumes Western European markets New member states Used car volumes Car parc Parc turn percentage Used:new volume ratios Used car sales per 1,000 population United Kingdom, Germany. Italy France, Spain
49
4950515253545656575859
Macroeconomics Behind the Used Car Industry
UK economic recovery versus other countries UK economic recovery Changes in GDP CPI and RPI Implications of macroeconomic issues? A new economic policy? What does the future hold?
61
61626364666666
Unique New and Used Car Market – Purple Patch or Grey Mist?
The European new car market The UK new car market UK car market developments New and used car market relationships Used car volume and value The professional used car retailer Future profitability?
67
67687071727273
Used LCVs – Where Would We be Without Them?
Economic growth and demand for used LCVs Used LCV supply Role of the LCV dealer Developing used LCV sourcing Used LCV market profile Short and medium-term supply resolution It could become critical
74
74757777788080
BCA – Partnering with Buyers and Sellers to Power the Market
BCA Network
Statistical Data
Research

The Used Car Market – a report by BCA
6
Introduction
The BCA Used Car Market Report 2013 aims to provide the same valuable insight
into the latest developments in the UK used car market that each of our previous
reports have done.
The UK Market Review is based on statistical information from national sources. This
is updated and compared with previous years’ data to provide an authoritative view
on volume and value trends in the used car market.
The Consumer Perspective section of the report is based on a BMRB International
survey of UK car owners. This comprises a review of the key issues that influence
used car buyers when deciding which car to buy, where to buy from and what car
owners expect when buying and owning a used car.
This year, respondents were asked if they had taken any steps to reduce their car
running costs and, if the economic recovery remains slow, what type of car they
might consider buying next. They were also asked if they might consider selling their
car directly 'for cash' and whether the offer of 'low or 0% new car finance' might
persuade them to buy a new car instead of a used one when they change their car.
The European section of the Used Car Market Report contains updated trend
information on Europe’s new and used car markets.
Other sections include 'A Unique New and Used Car Market' looking at the UK's
niche market position in Europe, highlighting some caveats as the economy moves
forward – and the 'United Kingdom Economic Situation' considering the impact of the
economy on the country's new and used markets.
The report also looks briefly at the used LCV market and the key issues driving this
important automotive sector.
BCA is pleased to provide its Used Car Market Report 2013 to all those closely
associated with the UK automotive industry.

The Used Car Market – a report by BCA 7
Overview
New and used car market volumes rise
Higher new and used car volumes in 2012 saw combined car sales exceed the nine
million mark for the first time in five years.
Market volumes new vs. used; 2003 – 2012
2.02.02.12.42.32.42.62.6
1.9 2.0
6.66.36.7
7.17.47.3
6.87.2
6.77.1
9.59.49.8 9.79.7
8.88.3 8.6 8.6
9.1
1
2
3
4
5
6
7
8
9
10
2003 2004 2005 2006 2007 2008 2009 2010 2011 2012
Mill
ions
New Used Total
Source: SMMT/BMRB
New car sales recovered to 2.04 million units last year, but remained well behind the
volumes achieved prior to the start of recession.
Weak sales elsewhere in Europe saw the UK's share of Western Europe's new car
market climb 2.2% to 17.4% in 2012, reclaiming second place in the European new
car sales league – 146,000 units ahead of third-placed France. Much stronger private
sector sales saw UK new car volumes rise 5.3% and 103,000 units to 2.04 million in
2012.
UK used car volumes fell during the height of recession to 6.3 million in 2009, edging
up to 6.7 million units in 2011 before reaching 7.1 million in 2012.
Overview
The Used Car Market – a report by BCA 8
The new car market
The new car market value climbed significantly to £32.3 billion in 2012 close to pre-
recession levels as selling prices rose and new car sales staged a modest recovery.
Following several years comfortably over £30 billion, the UK new car market value
dropped to £28.1 billion in 2008, making little headway over the next three years as
new car volumes settled below two million units – before rising to £32.3 billion in
2012.
New car market volume and value; 2003 – 2012
2.42.4
2.62.6
2.3
2.1
1.9
1.7
2.01.9
32.3
29.028.728.028.1
33.032.432.232.4
33.5
1.0
1.2
1.4
1.6
1.8
2.0
2.2
2.4
2.6
2.8
3.0
2003 2004 2005 2006 2007 2008 2009 2010 2011 2012
Mill
ions
20
25
30
35
£ b
illion
Volume Value Scrappage deals
0.30.1
Source: SMMT//BMRB
UK new car registrations, which settled around 2.5 million units between 2001 and
2005, fell steeply during recession and economic uncertainty to a 17-year low of 1.94
million units in 2011.
A rise of 12.9% and 106,300 units in private sector sales helped push overall new car
volumes up 5.3% to 2.04 million in 2012. New cars sales to the 25-plus fleet sector
were stable at 1.03 million units last year, falling to 50.2% of the market from 52.5%
in 2011.
As the country's economy begins to show signs of recovery, new car volumes
continue to grow in 2013 – up 10% to 1.163 million units for the first six months of
the year, fuelled by a 17.1% year-on-year rise in private sector sales.
Year-to-date new car sales are running just 9% below 2007's pre-recession level,
and are expected to remain relatively strong in the second half of 2013. The SMMT's
latest forecasts show the new car market growing by 8.4% to 2.216 million units for
the full year 2013 and by a further 1% to 2.239 million in 2014.

Overview
The Used Car Market – a report by BCA 9
The used car market
UK used car sales hit a 10-year high of 7.4 million in 2006, dropping over the next
three years to 6.3 million units, as recession and financial pressures eroded
consumer confidence. Since then, used car volumes have recovered much of the lost
ground reaching 7.1 million units in 2012.
Used car market value reached a new record level of £38.1 billion in 2012, having
risen steadily from 2008's figure of £32.4 billion.
Used car market volume and value; 2003 – 2013
7.1
6.66.7
7.1
7.47.3
6.8
7.2
6.7
6.332.0
30.0 32.3
33.933.3
32.4
34.2 35.035.7
38.1
4
5
6
7
8
2003 2004 2005 2006 2007 2008 2009 2010 2011 2012
Mill
ions
20
25
30
35
40
£ b
illion
Volume Value
Source: BMRB
Strong sales of 6-8 year-old cars and recovery in the 0-2 year and 3-5 year sectors
pushed used car volumes up by 430,000 to 7.1 million units in 2012.
Dealers' and the private sector's used car sales both grew in 2012 – the former by
8.9% to 4.07 million and the latter by 3.7% to 2.73 million units.
Sales of 0-2 year-old cars rose by 18.6% (120,000 units) to 762,000 in 2012,
their share of the used car market up to 10.7% from 9.6% the previous year.
Sales of cars in the 3-5 year age band increased last year, by 6.1% (104,000
units) to 1.83 million, the segment's market share stable at 25.7%.
Sales of 6-8 year-old cars rose for the fifth year running in 2012, by 11.2% to
1.99 million units, pushing this sector's market share up 1.4% to an all-time high
of 28%.
9 years-plus used car volumes were flat at 2.53 million units, their share of the
market dropping 2.2% to 35.2%.

Overview
The Used Car Market – a report by BCA 10
Consumer perspective
Twenty-six per cent of car owners in this year's survey had bought a new or used car
during the past two years compared with 24% last year – three-quarters of them
opting to buy a used rather than a new vehicle. The same percentage of men and
women had bought a car over the past 24 months, with 75% of men and 77% of
women buying a used car instead of a new one.
'Personal experience of make and model' was the strongest influence when
considering what used car to buy, mentioned by 29% of respondents in this
year's survey ahead of 'view of friends and family' (26%). Taking a 'test drive'
rose from 15% of responses to 21% year on year – while 'Internet
shopping/consumer sites' (14%) and 'used car showrooms/sites' (13%) play an
increasingly key role when buyers decide which used car to look for next.
Car owners were asked for the first time what issues have the biggest influence
on the way they conduct their search for a suitable used car. Nearly two-thirds
(64%) of car owners cited 'price range' as the main driving force, while two out of
five motorists said 'brand' and 'model range' were foremost in their mind during
the search.
'Price' (41%), and 'low mileage' and 'make and model', cited by 30% of car
owners, remain top of car buyers' shopping list when deciding which particular
used car to buy.
The 'right car at the right price' from a 'reliable and trustworthy dealer', climbed
car buyers' shopping list in this year's survey when deciding which used car
retailer to deal with – the former up 8% to 37% and the latter 5% higher at 19%
of respondents. Three out of 10 consumers expect 'a good deal', while a fifth of
car buyers place considerable emphasis on being able to 'trade in' their car.
Hatchbacks increased in popularity in this year's survey, 4% more car owners
(51%) choosing this option at the expense of saloons which saw their market
share drop by 5% to 17%. MPVs' share of the used car market slipped to 7%
from 10% a year earlier.
Diesel-engined cars’ share of the used car market rose 3% to 36% in this year's
survey to a level last seen in 2010, as growing numbers of diesels entered the
used car supply chain.
Used car owners' satisfaction with their used car hit 95% for the second year
running – those 'very satisfied' reaching an all-time high of 71%, with a further
24% of motorists saying they were 'quite satisfied' with their car.
This year's research saw a rise in the number of car owners who said they will
'certainly' or 'quite likely' buy a car in the next 12 months – up 4% to 14% year
on year. The number of motorists, who think there is a '50:50 chance' they will
be in the market for a car, rose one point to 10%.

Overview
The Used Car Market – a report by BCA 11
More than three-quarters (78%) of motorists intend to buy a used car when they
next change, 37% of used car buyers favouring a diesel compared with 30% in
last year's survey.
The number of respondents saying they intended to deal with a 'franchised
dealer' slipped two points to 48% this year, 57% of them planning to trade in
their existing car. A third of potential used car buyers plan to by from 'a family
member or a friend', 16% from a 'non-franchised used car retailer' and 9% from
an 'Internet trader' – 2% more than last year.
Low or 0% finance would tempt 17% of potential car buyers to 'certainly'
consider a new car instead of used one next time they change. A further 23%
said it was 'quite likely' they would give buying a new car some thought.
A half of men and two out of five women said 'Yes' – when asked 'would you
consider selling your car directly for cash?' While this 'opportunity' seems to
appeal more to 35-45 year-old and wealthier car owners, it is of much less
interest to older drivers.
Having lived through the longest, deepest economic downturn on record, only
one in 10 respondents said they would 'buy the same type car again', a 50%
drop over the past three years.
Four out of five respondents said they had already taken steps to cut their car
running costs – 'keeping tyres at the right pressure', 'driving more slowly',
'avoiding heavy braking', 'accelerating less quickly' and having 'a more fuel-
efficient car' were at the forefront of measures adopted.

The Used Car Market – a report by BCA 12
UK Market Review
Used car volumes top seven million
Lower inflation, lower fuel
costs, rising employment
and a more stable economy
helped restore car buyers'
confidence somewhat in
2012.
This helped push new car
sales up 5.3% to 2.04
million units last year;
private sector sales rising
12.9% to 929,000 units.
An even greater rise was
recorded in used car sales
which climbed 6.4% to 7.1 million units in 2012.
Used:new car ratios
The ratio of used car sales to new car sales
increased for the third year running to 3.5:1 in
2012, as the rise of 6.4% in used car volumes to
7.1 million units outpaced the growth in new car
sales.
Used car market segments
Strong sales of 6-8 year-old
cars and a recovery in the
0-2 year and 3-5 year age
groups helped overall used
car volumes grow by
430,000 units to 7.1 million
in 2012.
Dealers' and the private
sector's used car sales both
rose last year – the former
by 8.9% to 4.07 million and
the latter 3.7% higher at
2.73 million units.
Car volume trends; 2008 – 2012
2.1 2.0 2.0 2.0 2.0
6.76.3
6.6 6.77.1
0
1
2
3
4
5
6
7
8
2008 2009 2010 2011 2012
Mill
ions
New Used
Source: SMMT/BMRB
Used:new car ratios; 2008 – 2012
2008 3.2:1
2009 3.2:1
2010 3.3:1
2011 3.4:1
2012 3.5:1
SMMT/BMRB
Volume of used car sales by source; 2008 – 2012
0.4
2.7
3.6
6.7
0.6
2.2
3.5
6.3
0.5
2.4
3.7
6.6
0.3
2.6
3.7
6.7
0.3
2.7
4.1
7.1
0.0
1.0
2.0
3.0
4.0
5.0
6.0
7.0
8.0
Mill
ions
2008 2009 2010 2011 2012
Other/Auction Private Dealers Total
Source: BMRB
Used car sales climbed to 7.1 million in 2012

UK Market Review
The Used Car Market – a report by BCA 13
Looking at sales in the key age groups shows the used car market continued to
evolve in 2012;
Sales of 0-2 year-old cars rose by 120,000 units (18.6%) to 762,000 in 2012.
This segment's share of the used car market rose to 10.7% from 9.6% the
previous year.
Sales of cars in the 3-5 year age band increased last year, by 104,000 to 1.83
million units, the group's market share stable at 25.7%.
Used car market volumes by age of car; 2008 – 2012
762642
978
762710
18301725
184018841882
15831481
1669
1993
1793
2208 2174
2352
25342529
500
1000
1500
2000
2500
3000
2008 2009 2010 2011 2012
Tho
usan
ds
0-2 3-5 6-8 9+ yrs
Source: BMRB
Sales of 6-8 year-old cars rose for the fifth year running in 2012, by 201,000
units (11.2%) to 1.99 million, pushing this sector's market share up 1.4% to an
all-time high of 28%.
9 years-plus used car volumes were flat at 2.53 million units, their share of the
market dropping 2.2% to 35.2%.
Dealers’ used car sales
Stronger sales of cars up to 8 years old saw used car retailers' volumes outpace the
market, rising 8.9% (333,000 units) to 4.07 million, their share of the used car market
up 1.3 points to a new high of 57.2% (see overleaf).
Retailers' sales of 0-2 year-old cars increased by 76,000 units (14.2%) to
611,000.
Used car retailers' volumes outpaced the market in 2012

UK Market Review
The Used Car Market – a report by BCA 14
Dealers’ used car volumes and market share; 2003 – 2012
4.07
3.743.67
3.533.61
3.97
3.66
3.874.01
3.87
53.6 53.6 53.3
54.8
56.3
54.3
56.0 55.8 55.9
57.2
2.0
2.5
3.0
3.5
4.0
4.5
5.0
2003 2004 2005 2006 2007 2008 2009 2010 2011 2012
% M
arket share
40
45
50
55
60
Mill
ions
Millions Market share
Source: BMRB
Dealers' volumes in the 3-5 year age group rose by 11% (145,000 units) to 1.47
million, their market share up 3.5 points to 80.3%, reportedly retailing a higher
number of trade-ins resulting from last year's much higher private sector new car
sales.
Used car retailers' sales of 6-8 year-old cars continued to grow in 2012, up
125,000 units (11.1%) to 1.25 million, with their share of the market remaining at
62.7%. Dealers continue to focus more on older used cars to mitigate the
uncertain supply of younger vehicles.
Dealers’ used car volume by age of car; 2008 – 2012
543
663
856
535611
14621358
1302 1325
1470
1126
1250
10631034
780755 741759
473513
0
200
400
600
800
1000
1200
1400
1600
1800
2008 2009 2010 2011 2012
Tho
usan
ds
0-2 3-5 6-8 9+yrs
Source: BMRB
Dealers continue to focus more on older used cars

UK Market Review
The Used Car Market – a report by BCA 15
Dealers' volumes in the 9 years-plus used car segment dipped 1.4% to 741,000
last year, their market share slipping from 29.9% to 29.2% year on year.
Dealers strengthened their
grip on the 0-8 year-old
used car sector last year,
their sales rising 346,000 to
3.3 million units, accounting
for 81.8% of their used car
business a rise of 2% on the
previous year.
Used car retailers' success
in older segments has seen
their used car volumes in
the 6-8 year age group rise
285,000 units to 1.25 million
over the past five years –
accounting for 31% of their
business in 2012 compared with 24% in 2007.
Private-to-private used car sales
While the private sectors' used car sales rose 3.7% (98,000 units) to 2.73 million in
2012, they failed to keep pace with market growth, their share of the market dropping
one point year on year to 38.3%.
Private-to-private used car volumes by age of car; 2008 – 2012
1016065 47 93
281281278317
326
708
348442
573513
1774 17751644
15061594
0
200
400
600
800
1000
1200
1400
1600
1800
2000
2008 2009 2010 2011 2012
Tho
usan
ds
0-2 3-5 6-8 9+yrs
Source: BMRB
Volume share of dealers’ used car sales, by age of car 2012
6-8 years31%
3-5 years36%
0-2 years15%
9+years18%
Source: BMRB
Retailers' sales in the 6-8 year age group rose to 1.25 million units over the past five years

UK Market Review
The Used Car Market – a report by BCA 16
Private-to-private sales of 0-2 year-old cars climbed 40,000 units to 101,000 in
2012, accounting for 13.2% of sales in this segment.
The private sector's volumes in the 3-5 year age group were flat at 281,000
units, its share of the market dropping one point to 15.3% last year.
Private-to-private sales of 6-8 year old cars rose 11.7% (60,000 units) to 573,000
in 2012, their share of the this market sector stable at 28.7%.
Private sector sales and share of the of the 9 years-plus age sector were 1.78
million units and 70% respectively in 2012.
6-8 year-old cars outpace the market
A faster parc churn, stimulated by trade-ins from the sale of 100,000 additional
private sector new cars, helped push sales of cars in the 3-5 year age band up 6%
and 104,000 units to 1.83 million last year.
However, as the number of units in 3-5 year old car parc segment dropped to a 15-
year low of 5.8 million units, 200,000 more used car buyers bought a car in the 6-8
year age group in 2012 – 1.99 million in total.
UK car market value reaches new high
The overall value of the UK's new
and used car markets climbed £5.7
billion to a record £70.4 billion in
2012 – some £4 billion higher than
2007's pre-recession figure of
£66.3 billion.
The value of the new car market
rose £3.3 billion in 20`12 reflecting
103,000 extra new car sales and a
modest rise in new car selling
prices.
A 430,000 rise in used car sales last year offset flat selling prices to drive the used
car market value up £2.4 billion to an all-time high of £38.1 billion – £5.8 billion higher
than the new car market value.
New and used car market values; 2008 – 2012
£ billions 2008 2009 2010 2011 2012
New 28.1 28.0 28.7 29.0 32.3
Used 32.4 34.2 35.0 35.7 38.1
Total 60.5 62.2 63.7 64.7 70.4
Used % * 53.6 55.0 54.9 55.2 54.1
* as % of total market value
Source: BMRB
Value of UK's new and used car markets climbed to a record £70.4 billion

UK Market Review
The Used Car Market – a report by BCA 17
Dealer/private sector used car market value
Dealers' used car market value increased by £1.5 billion to £28.3 billion in 2012; as
volumes climbed, average sales values fell and dealers sold greater numbers of
lower-value, older used cars. The private sector's used car market value also went up
last year, by £0.5 billion to £7.9 billion, reflecting a moderate rise in both used car
volumes and average selling prices.
Value of used car sales by source; 2008 – 2012
1.43.4
1.5 1.91.7
5.67.0 6.8 7.4 7.9
24.025.2
26.5 26.828.3
32.434.2 35.0 35.7
38.1
0
5
10
15
20
25
30
35
40
2008 2009 2010 2011 2012
£ B
illio
ns
Other/Auction Private Dealers Total
Source: BMRB
Share of used car market value; 2003 – 2012
75.376.374.2 75.5 77.074.475.175.6
73.774.0
19.5 18.2 17.8 17.6 17.721.6
16.419.3 20.7 20.7
0
10
20
30
40
50
60
70
80
90
2003 2004 2005 2006 2007 2008 2009 2010 2011 2012
%
Franchised/non-franchised Private to private
Source: BMRB

UK Market Review
The Used Car Market – a report by BCA 18
Franchised and non-franchised used car retailers retained their traditional three-
quarters share (74.4%) of used car market value in 2012; while the private sector's
share was flat at 20.7% as a slightly higher number of used car owners bought from
auction or other sources last year.
Used car selling prices
Overall average used car selling prices edged up to £5,352 in 2012 from £5,336 a
year earlier. Dealers’ average used car selling prices fell for the second year, from
£7,169 in 2011 to £6,972 last year as their used car sales mix aged – while the
private sector saw its average used car price rise from £2,815 to £2,896 year on
year.
The following chart shows the relationship between dealers' used car selling prices
and the Retail Price Index (RPI) over the past 25 years. While the two indices have
followed a similar trend for much of this period, dealers' selling prices tend to be
lower than RPI for some considerable time following recession and a period of
economic uncertainty.
Average dealers' used car selling prices; 1998 - 2012
230.9
164.8162.1
223.9
199.2
147.3
142.8139.5
134.8131.6129.6
124.9
118.0
107.8
152.4154.7
159.3
174.6169.6
179.6185.3
193.3
203.9
213.7
198.0
203.6
186.0
148.4
138.6
117.4 103.7
120.9
120.6
121.3
132.8
101.4
162.4158.1
164.5163.0166.7
174.1177.5
178.3178.0183.6
202.9
207.2
100
110
120
130
140
150
160
170
180
190
200
210
220
230
240
1988
1989
1990
1991
1992
1993
1994
1995
1996
1997
1998
1999
2000
2001
2002
2003
2004
2005
2006
2007
2008
2009
2010
2011
2012
RPI Dealers' used car selling price
Source: ONS/BCA Used Car Market Report
The current gap between selling prices and RPI is wider than the last recession in
1991. This is symptomatic of the recent recession being much deeper than its
immediate three predecessors – and the exceedingly slow pace of recovery which
continues to restrict disposable earnings and erode consumer confidence– see BCA
Broad View Report April 2013.
While the Retail Price Index is expected to slow over the next two years, it will be
some time before enough first-time used cars reach the market to trigger a significant
recovery in dealers' average used car selling prices.
Franchised and non-franchised retailers retained three-quarters share of market value

UK Market Review
The Used Car Market – a report by BCA 19
Used car prices at auction
Average used car prices at auction fell steeply during recession to £4,836 at the end
of 2008, making a strong recovery in 2009 before reaching £7,361 in December 2012
– a rise of £2,525 over the four year period.
Average used car prices at auction; 2008 – 2013
£7,361
£6,451
£5,905
£6,188
£4,836
£7,000
£5,880
£4,000
£4,500
£5,000
£5,500
£6,000
£6,500
£7,000
£7,500
Jan-08
Apl July Oct Jan-09
Apl July Oct Jan10
Apl July Oct Jan-11
Apl July Oct Jan-12
Apl July Oct Jan-13
Apl
Source: BCA
Apart from a 'traditional' dip around Easter, auction prices remain remarkably
consistent in 2013, suggesting supply and demand are relatively well balanced – with
fleet and lease values rising to £8,860 in June this year, up 10.1% on the same point
in 2012. Dealers' part-exchange values climbed to £3,692 in June 2013 registering a
year-on-year rise of 28.4% on the same month the previous year.
While average age and mileage of fleet and lease cars have dropped somewhat, there
is still some concern regarding quality of stock reaching the marketplace – with
buyers' interest focusing on 'retail ready' units that continue to outstrip price guide
expectations and boost average sale values.
Average age of cars reaches a 30 year high
The number of cars in the UK car parc has been flat around 30 million for the past
eight years and will rise very slowly until new car sales substantially exceed the two
million mark – see overleaf.
The average age of cars on the country's roads fell to 6.69 years in 2004, before
reaching a 30-year high of 7.59 years in 2012 – reflecting prolonged, low new car
volumes. The SMMT's current new car market forecasts mean the car parc will
continue to age until much higher new car volumes enter the parc for several years to
offset the impact of the record high new car volumes of the early 2000s hitting the
10-years plus mark.
Fleet and lease values up 10.1% on the same point in 2012

UK Market Review
The Used Car Market – a report by BCA 20
UK car parc – average age of car; 2000 – 2015
30.4 30.5 30.7 30.9 31.130.327.2 29.429.028.527.8 29.8 29.9 30.2 30.3 30.1
7.817.69
7.257.06
6.736.706.69
6.887.01
6.78
7.11
6.796.93
7.557.597.44
10.0
15.0
20.0
25.0
30.0
35.0
2000
2001
2002
2003
2004
2005
2006
2007
2008
2009
2010
2011
2012
2013
2014
2015
Mill
ions
5.00
5.50
6.00
6.50
7.00
7.50
8.00
Averag
e age years
Millions Average age
Source: SMMT
Three-quarters of cars reach 12 years
Three-quarters
(76.3%) of cars
now make their
twelfth birthday
and more than half
(51.6%) are
reaching the 14-
year mark –
testimony to better
build quality and
owners perhaps
keeping their cars
a little longer
during financial
hard times.
Around 350,000
cars were
scrapped during their 15th year in 2012, leaving two million cars aged 15 years or
over in the parc, accounting for 7% of the cars on the country's roads.
UK car parc survival rate; 2012 vs. 2003
30
40
50
60
70
80
90
100
1 2 3 4 5 6 7 8 9 10 11 12 13 14 15
Years
Sur
viva
l rat
e %
2012 2003
Source: SMMT
Three-quarters of cars now make their twelfth birthday
UK Market Review
The Used Car Market – a report by BCA 21
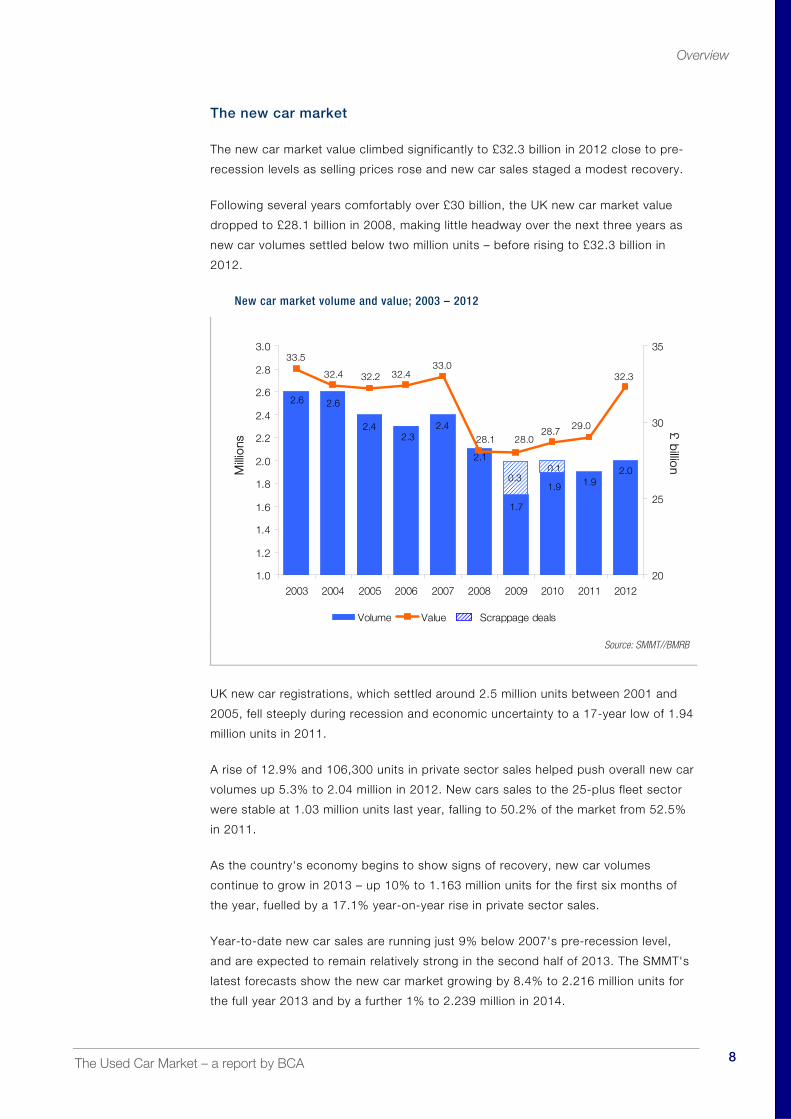
The ‘parc turn’ indicator
The ‘parc turn’
indicator, which
expresses annual
new and used car
volumes as a
percentage of the
UK car parc, is a
valuable way of
monitoring car
sales trends.
While the overall
parc turn rose 1.6
points to a five-
year high of 29.9%
in 2012, it was 4%
below the figure
recorded 10 years earlier. 2012's ratio reflects higher new and used car volumes of
9.1 million versus a flat car parc of 30.5 million units.
The new car parc turn went up to 6.6% in 2012 from 6.3% the previous year,
reflecting a rise of 5.3% and 103,000 units in new car volumes.
The used car parc
also recorded a
marked rise last
year, up 1.4 points
to 23.4% thanks to
a 6.4% (430,000)
lift in used car
volumes.
Franchised and
non-franchised
retailers' used car
parc turn climbed
to 13.5% in 2012
from 12.2% the
previous year, while
the private-to-private sector's share edged up 0.3 points to 8.9%.
Car parc turn; 2003 – 2012
22.1 20.9 21.8 22.023.423.5
24.824.823.1
24.5
6.66.36.66.66.97.97.78.08.89.0
29.928.328.427.6
29.0
33.832.0 32.5 31.532.5
0
5
10
15
20
25
30
35
2003 2004 2005 2006 2007 2008 2009 2010 2011 2012
%
Used % parc New % parc Total
Source: SMMT/BMRB
Dealer vs. private sector used car parc turn; 2003 – 2012
11.911.6
12.1 12.2
13.513.213.713.5
12.513.1
8.98.6
8.1
7.3
8.98.9
9.710.19.6
10.3
5.0
7.5
10.0
12.5
15.0
2003 2004 2005 2006 2007 2008 2009 2010 2011 2012
%
Dealer % of parc Private % of parc
Source: SMMT/BMRB
The used car parc recorded a marked rise last year – to 23.4%
UK Market Review
The Used Car Market – a report by BCA 22
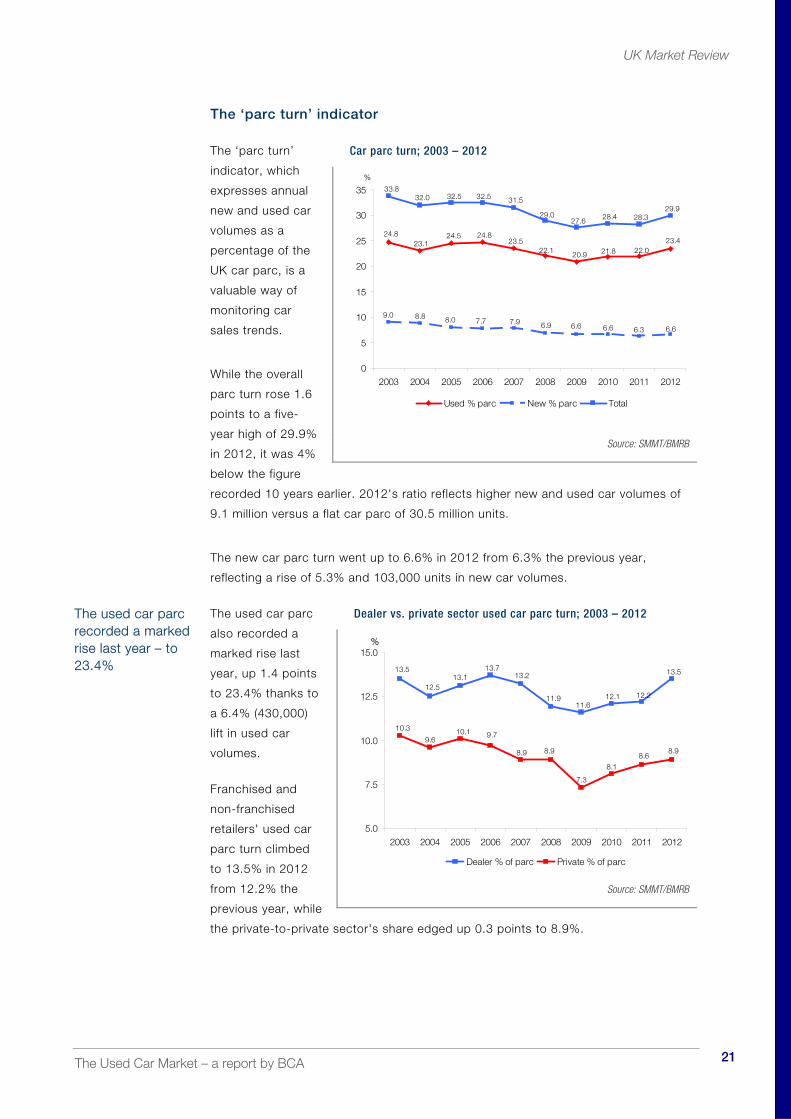
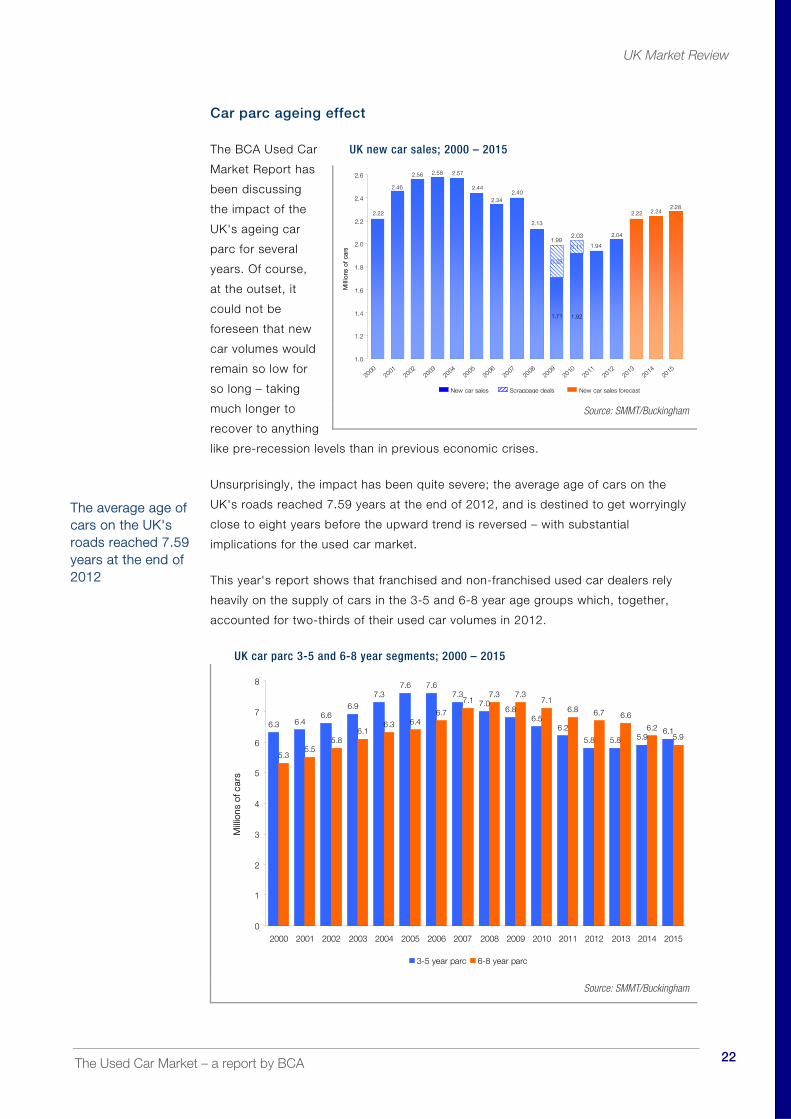
Car parc ageing effect
The BCA Used Car
Market Report has
been discussing
the impact of the
UK's ageing car
parc for several
years. Of course,
at the outset, it
could not be
foreseen that new
car volumes would
remain so low for
so long – taking
much longer to
recover to anything
like pre-recession levels than in previous economic crises.
Unsurprisingly, the impact has been quite severe; the average age of cars on the
UK's roads reached 7.59 years at the end of 2012, and is destined to get worryingly
close to eight years before the upward trend is reversed – with substantial
implications for the used car market.
This year's report shows that franchised and non-franchised used car dealers rely
heavily on the supply of cars in the 3-5 and 6-8 year age groups which, together,
accounted for two-thirds of their used car volumes in 2012.
UK car parc 3-5 and 6-8 year segments; 2000 – 2015
6.3 6.46.6
6.9
7.37.6 7.6
7.37.0
6.86.5
6.2
5.8 5.8 5.96.1
5.35.5
5.86.1
6.3 6.46.7
7.17.3 7.3
7.16.8 6.7 6.6
6.25.9
0
1
2
3
4
5
6
7
8
2000 2001 2002 2003 2004 2005 2006 2007 2008 2009 2010 2011 2012 2013 2014 2015
Mill
ions
of c
ars
3-5 year parc 6-8 year parc
Source: SMMT/Buckingham
UK new car sales; 2000 – 2015
0.28
0.11
2.22
2.04
2.24
2.582.56
2.46 2.44
2.57
2.40
2.13
1.71 1.92
1.94
2.282.22
2.34
1.0
1.2
1.4
1.6
1.8
2.0
2.2
2.4
2.6
2000
2001
2002
2003
2004
2005
2006
2007
2008
2009
2010
2011
2012
2013
2014
2015
Mill
ions
of
cars
New car sales Scrappage deals New car sales forecast
2.031.99
Source: SMMT/Buckingham
The average age of cars on the UK's roads reached 7.59 years at the end of 2012

UK Market Review
The Used Car Market – a report by BCA 23
2.6 million fewer cars
The chart on the previous page shows the parc for 3-5 year-old cars dropped to 5.8
million units at the end of 2012, some 1.5 million units lower that 2007's pre-
recession figure – and, based on the latest SMMT forecasts, is likely to remain
relatively flat for the next three years or so.
The parc of 6-8 year-old cars reached an all-time high of 7.3 million units in
2008/2009, falling steeply thereafter, as cars from the record high sales of the early
2000s passed through this age group – continuing to drop to around 5.9 million units
by 2015. In other words, there will be 2.6 million fewer cars between three and eight
years old in 'used vehicle stock' in 2015 than the start of the recession.
A major concern for used car dealers is the further decline of three-quarters of a
million cars in the 6-8 year parc over the next three years – a sector dealers have
come to rely on more heavily as supply of good quality, younger vehicles became less
reliable.
Encouraging signs on the horizon
While it is impossible to miraculously conjure up more cars in the country's 3-8 year
car parc (used car stock), achieving a significantly higher 'stock turn' will help protect
dealers' used car volumes.
An encouraging development on this front is the much stronger private sector new
car sales over the past 18 months – the vast majority of which will drive a part-
exchange vehicle into the used car market and spur further used car sales down the
chain.
Private new car sales rose by 106,000 units year on year in 2012, and are 81,000
units higher than the previous year for the first six months of 2013 – the badly-
needed impetus the used car market needs following five years of depressed new car
volumes.
Much stronger private sector new car sales over the past 18 months

The Used Car Market – a report by BCA 24
The Consumer Perspective
The Consumer Perspective section of the BCA Used Car Market Report looks at the
pattern of car ownership in the United Kingdom and the key issues that drive
motorists' decision on what used car to buy and where to buy from.
BCA commissioned BMRB International to carry out face-to-face interviews with
4,000 car owners in the UK to identify their priorities and experiences in buying and
owning a used car – what convinced them to buy their latest used car, what
influenced their choice of seller, what type of car they might buy next, who they might
buy from and when.
This year, car owners were also asked if they would consider selling their car directly
'for cash' and whether the availability of low or 0% interest new car finance might
persuade them to buy a new car instead of a used one when they change their
vehicle. The consumer research also looked at what steps motorists had taken to
substantially reduce their car running costs and, if economic recovery remains slow,
what car they might look for when they replace their vehicle.
Fieldwork for the BMRB consumer research took place during April 2013.
The Consumer Experience section is split into four parts;
What Used Car to Buy? – looks at the sources of information that affect used car
buyers’ decision on what car to consider buying, what factors have the strongest
influence on the way they conduct their search for a suitable vehicle – and the critical
points when deciding which specific used car to buy.
What Car to Buy and Where From? – this part of the report considers what factors
concern car owners when choosing which dealer to buy their used car from, and
what influences them most when dealing with a franchised or non-franchised used
car retailer. It also looks at the pattern of car ownership across the country, why
motorists buy a used instead of a new car, the type of used car they bought – and
how satisfied they are with their vehicle.
Car Owners' Intentions and Options – focuses on when motorists might replace
their car next, what type of car they plan to buy and where they might buy from. This
part of the report also looks at whether low or 0% interest new car finance might
persuade car buyers to opt for a new car instead a used car next time – and in what
circumstances car owners might sell their car 'for cash'.
Economic Uncertainty and Car Running Costs – examines what type of car
motorists might think about buying next in the face of ongoing economic uncertainty,
and what steps car owners have taken already to reduce their motoring costs.

The Consumer Perspective
The Used Car Market – a report by BCA 25
Part One – What Used Car to Buy?
What used car to consider buying?
'Personal experience of make and model' was the strongest influence when
considering what used car to buy, mentioned by 29% of respondents in this year's
survey ahead of 'view of friends and family' (26%).
Influences on type of used car considered
2
3
5
5
7
8
8
10
10
13
14
21
29
26
Facebook/Twitter
Car Manf Advs
Dealer advice
Car TV shows
Dealer websites
Motoring magazines
Cars on street
Consumer reports
Classified used car websites
Used car showrooms/sites
Internet shopping/consumer sites
Testdrive
Views family friends
Personal experience make/model %
Source: BMRB
Taking a 'test drive' rose from 15% of responses to 21% year on year – while
'Internet shopping/consumer sites' (14%), 'used car showrooms/sites' (13%) and
'classified used car websites' (10%), all play a key role when used car buyers decide
which used car to look for next.
As in previous surveys, used car buyers are less likely to pay too much attention to
'car TV shows, 'dealer advice' or 'car manufacturers' adverts' when thinking about
what car to search for, while 'social media' (Facebook/Twitter) is hardly in the frame
during this first stage of the buying process.
'View of friends and family' (28%) tops the list for women, when deciding what car to
consider, whereas men are more likely to take heed of 'personal experience of make
or model' (31%), a 'test drive' (24%) or 'motoring magazines' (10%) when thinking
about what car they might buy.
'Personal experience of make or model' far outstrips all other considerations for 45-
54 year-old and wealthier car buyers, and owners of used cars costing between
£10,000 and £15,000. Wealthier car owners are also more likely than others to take
note of 'consumer reports/programmes', 'motoring magazines' and 'car TV shows',
when taking this first step in replacing their vehicle.
Taking a 'test drive' rose from 15% to 21% of responses

The Consumer Perspective
The Used Car Market – a report by BCA 26
Influence on search for car
Car owners were asked for the first time what issues have the biggest influence on
the way they actually approach their search for a suitable used car.
Nearly two-thirds (64%) of car owners cited 'price range' as the driving force in this
process, while two out of five motorists said 'brand' and 'model range' were foremost
in their mind during the search.
Other factors, that
influenced car owners
when searching for a
car, were 'type of
used car seller'
(24%), 'variant and
specification' (17%),
and how far they were
prepared to travel to
view a car
('location/distance') at
11%.
There is little
difference between
men and women and
across age and social groups on which factors influence their car search most – 'type
of used car seller' is important to 65 years-plus car buyers, while 'price range'
outstrips all other considerations for low-income motorists.
On the purchase price front, 'price range' and 'brand' are the top issues for owners
of cars over the £15,000 mark, while 'type of seller' is very much on the radar of
buyers of cars costing £20,000 plus.
'Crunch factors'
'Price' (41%), and 'low mileage' and 'make and model' cited by 30% of car owners,
remain top of car buyers' shopping lists when deciding which particular used car to
buy, while 'engine size' stepped up two points to 20% of respondents this year – see
overleaf.
Men and women think much alike when deciding which used car to buy, although
'engine size' has more influence with women (23%) than men (17%), who take more
notice of 'specification' (12%) than their female counterparts (6%).
While 'price' surpasses all other considerations for half of 17-34 year-olds and low-
income car owners, it is of very little concern for older and wealthier motorists – who
are more influenced by 'make and model of vehicle' than other car buyers.
Strongest influences on carrying out search for car
11
17
24
37
39
64
Location/distance
Variant/specification
Type of used carseller
Model Range
Brand
Price range %
Source: BMRB
Nearly two-thirds of car owners cited 'price range' as the driving force

The Consumer Perspective
The Used Car Market – a report by BCA 27
Critical factors in choosing a particular used car
41
30 30
20
1715
14
119 9 8
3
0
5
10
15
20
25
30
35
40
45%
Price
Low m
ileag
e
Make/
mod
el
Engin
e siz
e
Body t
ype
Age
Fuel
optio
n
Insura
nce
Specif
icatio
n
Safety
Colour
Enviro
nment
al
Source: BMRB
Unsurprisingly, 'price' is a major issue for car owners who bought a car for less than
£3,000. It also concerns half of motorists who paid between £15,000 and £20,000 for
a used car last time, who are equally swayed by 'make and model'.

The Consumer Perspective
The Used Car Market – a report by BCA 28
Part Two – Where to Buy From?
Which used car dealer to buy from?
When deciding which used car retailer to deal with, the 'right car at the right price'
from a 'reliable and trustworthy dealer', climbed car buyers' shopping list in this
year's survey – the former up 8% to 37% and the latter 5% higher at 19% of
respondents. Three out of 10 consumers expect 'a good deal', while a fifth of car
buyers place considerable emphasis on being able to 'trade in' their existing car.
Factors influencing choice of dealer
3
3
4
4
6
7
9
10
15
15
16
17
19
22
30
37
Read about dealer
Showroom facilities
Low finance
Quick delivery
Recommended
Easy negotiation
Aftersales
Wide choice
Friendly,helpful
Warranty
Bought before
Local
Reliable, trustworthy
Trade-in
Good deal
Right car, price %
Source: BMRB
'Dealing locally' (17%) with a dealer they have 'bought from before (16%) and 'friendly
and helpful staff' (15%) also rate highly with used car buyers.
More men favour 'getting a good deal' (37%) than women (23%), whereas a quarter
of women rely on being able to 'trade in' their car compared with just a fifth of men.
Half of younger buyers value negotiating a 'good deal' on the car and buying from a
'reliable and trustworthy dealer', two-thirds of them preferring to 'deal locally'.
A half of owners of cars costing more than £10,000 expect their selling dealer to have
'the right car at the best possible price', while buyers of cars over the £20,000 mark
expect much more. Many of them look for a strong blend of 'price', a 'good deal',
'ability to trade in' and 'deal locally' from a 'reliable and trustworthy dealer' with
'friendly, reliable and helpful staff'.
Three out of 10 consumers expect a 'good deal'

The Consumer Perspective
The Used Car Market – a report by BCA 29
Buying from franchised and non-franchised dealers
Used car buyers' expectations of franchised dealers selling the same make of car are
well established. Two out of five motorists want 'the right car at the right price'
followed by 'a good deal' (29%), the ability to 'trade in their car' (27%) and to do
business with a 'reliable and trustworthy dealer' (25%). A fifth of car owners also like
to deal with a 'local retailer', one they 'have bought from before', and value
negotiating with 'friendly, reliable and professional staff'.
Factors influencing choice of dealer
12
7
6
4
2
33
28
18
13
11
9
10
6
4
2
1
4
3
2
22
20
20
13
13
23
25
39
29
27
12
Right car right price
Got a good deal
Trade-in
Reliable/trustworthy
Bought before
Local
Friendly, helpful
Warranty
Range of choice
Aftersales
Lack of pressure
Quick delivery
Recommendation
Showroom facilities
Low finance
%
Franchised dealer same make
Used car retailer
Source: BMRB
A third of car buyers who bought from a non-franchised used car retailer sought 'the
right car at the right price', while nearly three out of 10 expected to strike a 'good
deal'. Although a fifth of non-franchised dealers' customers look to 'trade in' their
car, and 13% expect 'reliable and trustworthy' treatment, they are deemed less
critical aspects.
Three-quarters of motorists buy a used car
Twenty-six per cent of car owners in this year's survey had bought a new or used car
during the past two years compared with 24% last year – three-quarters of them
opting to buy a used rather than a new vehicle (see overleaf).
The same amount of men and women (26%) had bought a car over the past 24
months, 75% of men and 77% of women buying a used car instead of a new one.
Twenty-six per cent of car owners had bought a new or used car in the past two years

The Consumer Perspective
The Used Car Market – a report by BCA 30
Cars bought over past two years – by age group
26 26 26
14
3034 34
17
28
76 77
70
8582
7875
6365
0
10
20
30
40
50
60
70
80
90
All ages Men Women 17-24 25-34 35-44 45-54 55-64 65+
Age
%
% bought car in last two years % of these bought used
Source: BMRB
A third of survey respondents in the 35-54 year age group had bought a car in the
past two years, compared to just 14% of 17-24 year-olds and 17% of 65 years-plus
motorists.
Car owners in the 25-34 year age group were the biggest buyers of used cars, 85%
of them opting for a used vehicle, as did 82% of 35-44 year-olds, in contrast to only
63% of 55 years-plus motorists who made a similar decision.
While a third of wealthier respondents had bought a new or used car in the past two
years, just one in 10 of low-income motorist had followed suit – 72% of the former
and 80% of the latter choosing a used car last time.
Seven out of 10 households own a car
For the third year running, 72% of families own at least one car, some way short of
the 77% of households in 2010's BCA consumer survey (see overleaf).
Households of 45-54 year-old respondents have the most cars, 79% of them have at
least one, while 42% of them own two or more vehicles. At the other end of the scale,
just 59% of the 17-34 year age group and 66% of low-income households have a car
at all, just 16% of the former and 10% of the latter in the two-car bracket.
Ninety per cent of wealthier families have at least one car, a half of them owning two
or more cars – while seven out of 10 owners of £20,000 plus vehicles have two cars,
12% of them with three or more cars in the household.
Car owners in the 25-34 year group were the biggest buyers of used cars

The Consumer Perspective
The Used Car Market – a report by BCA 31
Recession and the
agonisingly slow
economic recovery
continue to take its toll
on car ownership in the
2013; households
without a car rising 5%
to 28% over the past
three years. Two-car
families which dropped
3% to 22% in 2012
edged up one point to
23% this year, while the
number of three or
more car families
remains at 5% of
households compared with 8% three years earlier.
Hatchbacks most popular
Hatchbacks increased
in popularity in this
year's survey, 4% more
car owners (51%)
choosing this option –
at the expense of
saloons which saw their
market share drop 5%
to 17%. MPVs' share of
the used car market
slipped to 7% from
10% a year earlier,
while Sport/Coupe's
edged up 2% to 6% of
the market.
Men (53%) have a slightly bigger appetite for hatchbacks than women (49%) who
favour a Micro/City Car (6%) more than their male counterparts at a lowly one per
cent. While three out of 10 motorists in the 65 years-plus group opted for a Saloon
last time they changed, one in 10 younger car owners chose to buy a Sports/Coupe.
On the price front, hatchbacks accounted for three out of five cars in the £5,000 to
£10,000 band – while Saloons and Sports/Coupes made up a quarter of used car
purchases in the £10,000 to £20,000 band.
Cars in the household
Two23%Three or more
5%
One44%
None28%
Source: BMRB
Type of used car bought
Hatchback51%
Saloon17%
Prestige1%
Micro/City4%
MPV7%
Sports/Coupe6%Off-road
5%
Other2%
Estate8%
Source: BMRB
Households without a car rose 5% to 28% over the past three years

The Consumer Perspective
The Used Car Market – a report by BCA 32
Buying a used car rather than new
Three per cent
more car owners
than last year
(37%) said they
'couldn't afford a
new car' was the
chief reason for
buying a used car
– whereas a fifth
believe 'they offer
better value for
money'.
While a quarter of
men and a fifth of
women are
convinced 'used
cars offer better value for money', they are of a similar mind on the 'couldn't afford a
new car' front.
Forty per cent of car owners in the 17 to 54 year age bracket said they bought a
used vehicle because they 'couldn't afford a new car', in contrast to just a quarter of
65 years-plus motorists who expressed the same view.
Wealthier car owners believe more strongly than others that 'used cars provide better
value for money' (30%) and 'there is lower depreciation' (25%) – as do those who
bought cars in the £5,000 to £10,000 bracket.
Sales of used diesels rise
Diesel-engined cars’ share of the used car market rose 3% to 36% in this year's
survey to a level last seen in 2010, as growing numbers of diesels reach the used car
supply chain.
Diesel new car volumes accounted for 50% of the new car market in 2011 and 2012;
a rise of some 15% in five years. They are forecast to settle around this level for the
foreseeable future, suggesting sales of used diesels will rise steeply over the next few
years as much higher volumes of diesel-powered units enter the used car market.
Forty per cent of men bought a used diesel when they changed their car compared to
just 31% of women. While 44% of 35-44 year-old motorists bought a diesel-engined
used car last time, only a fifth of younger and 65 years-plus motorists made the same
decision.
Buying new or used?
3
6
10
16
22
37
More choice
Needed quickly
Always buy used
Depreciation
Better value
Couldn't afford new %
Source: BMRB
A quarter of men and a fifth of women are convinced 'used cars offer better value for money'

The Consumer Perspective
The Used Car Market – a report by BCA 33
Diesel cars
become more
prevalent as
volumes rise in the
£10,000 to
£15,000 used car
price bracket. Half
the vehicles
bought in this price
band run on diesel,
as do two-thirds of
used cars costing
between £15,000
and £20,000.
Although 'better
fuel consumption' remains the foremost reason for buying a diesel-powered car, the
number of respondents citing this aspect dropped to 52% this year, compared with
57% in the 2012 survey and 68% in 2011. A third of used car owners think diesels
are 'cheaper to run', while 15% are convinced they have a 'more reliable engine'.
Used car satisfaction remains very high
Used car owners'
satisfaction with their
used car hit 95% for
the second year
running – those 'very
satisfied' reaching an
all-time high of 71%,
with a further 24% of
motorists saying they
were 'quite satisfied'
with their car.
While men and women
are equally 'satisfied'
(95%) with their used
car, the number of 17-
24 year-old motorists
'very satisfied' with
their car dropped nine points to 59% this year, a further 31% of them in the 'quite
satisfied' category.
Reasons for buying diesel
52
33
15
10 109
8 7
0
10
20
30
40
50
60
%
Fuelconsumption
Cheaper torun
More reliableengine
Maintainsvalue
Environment High mileage Engine lastslonger
Lower CO2
Source: BMRB
Used car satisfaction
Very satisfied71%
Quite satisfied24%
Neither3%
Quite dissatisfied
2%
Source: BMRB
Used car owners' satisfaction with their used car hit 95% for the second year running
The Consumer Perspective
The Used Car Market – a report by BCA 34
Satisfaction high in 45-54 year sector
'Satisfaction' for all other age groups tops 90%; and is particularly high in the 45-54
year sector at 99% – 84% 'very satisfied' and 15% 'quite satisfied'. While
'satisfaction' of wealthier respondents was steady at 97%, low-income used car
owners dropped three points to 89% this time, just 57% claiming to be 'very
satisfied' and 32% 'quite satisfied' with their vehicle – a sign perhaps that many in
this group run older, out-of-warranty cars.
As in previous surveys, the number of car owners ‘satisfied’ with their used car rises
much in line with purchase price – reaching 97% for cars costing between £5,000
and £15,000 and 100% for cars priced over the £20,000 mark.

The Consumer Perspective
The Used Car Market – a report by BCA 35
Part Three – Car Owners' Options and Buying Intentions
Buying a car in the next year?
A somewhat less
gloomy economic
outlook, higher
unemployment and
lower inflation saw
a rise in the
number of car
owners who said
they will 'certainly'
or 'quite likely' buy
a car in the next
12 months – up
4% to 14% year on
year. The number
of motorists, who
think there is a '50:50 chance' they will be in the market for a car, rose one point for
the second year running to 10%.
Fifteen per cent of men felt they would 'certainly' or 'quite likely' buy a car in the next
year, as did 12% of women. While a fifth of motorists in the 17-24 year age group
and 16% of wealthier car owners feel they might buy a car in the next 12 months, just
7% of motorists over the age of 55 feel the same way.
What type of car to buy next?
More than three-
quarters (78%) of
motorists intend to
buy a used car
next time they
change their car.
Of those who
intend to buy a
used car, 37%
plan to buy a
diesel compared
with 30% in last
year's survey –
short, though, of
diesels' current
50% share of the
new car market.
Likelihood of buying a car in the next year
5
9 10
26
20
28
3
0
5
10
15
20
25
30
%
Certainlywill
Quitelikely
50:50chance
Unlikely Certainlynot
Won'tbuy again
Don'tknow
Source: BMRB
Next car bought will be
42
26
31
3 26
3
12
0
5
10
15
20
25
30
35
40
45
%
Used
car p
etrol
Used
car d
iesel
Used
car h
ybrid
Used
car a
ltern
ative
Nearly
new
pet
rol
Nearly
new
dies
el
New ca
r petr
ol
New ca
r dies
el
Don't
Know
Source: BMRB
Rise in number of car owners who said they will 'certainly' or 'quite likely' buy a car in the next 12 months

The Consumer Perspective
The Used Car Market – a report by BCA 36
The biggest prospective group of buyers of used cars are 25-44 year-old (83%) and
middle-income motorists (80%). More male (40%) than female (33%) used car buyers
intend to buy diesel next time – as are two out of five wealthier car owners and 90%
of those in the market for a car over £15,000.
Where to buy the next car?
Although some car owners might consider more than one option, the number of
respondents saying they planned to deal with a 'franchised dealer' slipped two points
to 48% this time, 57% of them planning to trade in their existing car. A third of
potential used car buyers plan to by 'privately' or from 'a family member or a friend',
16% from a non-franchised used car retailer and 9% from an 'Internet trader'.
Men (36%) are
more likely to buy
'privately' than
women (30%),
while a 'car
supermarket' is
preferred by 35-54
year-old car buyers
and owners of
used cars in the
£15,000 to
£20,000 price
band.
A half of 17-24
year-olds and low-
income car buyers
say they will buy
'privately' or from 'a friend or member of their family' on the next occasion, while only
12% of 65 years-plus are of a similar mind. Three out of five owners of cars costing
between £10,000 and £15,000 are intent on doing business with a 'franchised
dealer'.
Low or 0% interest next time?
Respondents to this year's consumer survey were asked 'If low or 0% interest finance
is available next time you change your car would you consider buying a new car
instead of a used one?'
This option seems a distinct possibility for 17% of potential car buyers, who said they
would 'certainly' consider buying a new car instead of used one, if low or 0% interest
finance is available at the time of their next change (see overleaf) – while a further
23% said it was 'quite likely' they would give this some thought.
Where next car will be bought
16
10
9
7
5
4
10
23
48
Don't know
Other
Auction
Car supermarket
Internet trader
Family friend
Used car dealer
Private
Franchised dealer %
Source: BMRB
17% of potential car buyers would 'certainly' consider buying a new car instead of new

The Consumer Perspective
The Used Car Market – a report by BCA 37
Low or % interest; new instead of used car purchase
6
17
23
24
30
Don't know
Certainly
Quite likely
Unlikely
Certainly not %
Source: BMRB
Twenty-two per cent of wealthier and 45-54 year-old potential used car buyers said
low or 0% interest finance could 'certainly' tempt them to think about buying a new
car instead of a used one, compared to just 11% of older and low-income motorists.
Two out of five owners of cars in the £15,000 to £20,000 group said it is 'quite likely'
they could be persuaded to think about such a proposition.
Sell your car for cash next time?
A half of men and two out of five women said 'Yes' – when asked 'would you
consider selling your car directly for cash?'
Consider selling car 'for cash'
45
49
42
47
5356
43
38 37
0
10
20
30
40
50
60
All ages Men Women 17-24 25-34 35-44 45-54 55-64 65+
%
Source: BMRB International

The Consumer Perspective
The Used Car Market – a report by BCA 38
While this opportunity seems to appeal more to 35-45 year-old and wealthier car
owners, and those with cars costing between £15,000 and £20,000, it is of much
less interest to older drivers. Auto Trader was cited as the most likely route of
'converting a car into cash' – favoured by two out of five of car owners who said they
might consider this option in this year's survey.
A quarter of respondents said they might consider 'eBay', while around a fifth of
motorists might look to a 'local newspaper ad/website', 'small local garage' or 'used
car trader'.
There is little difference between men and women and across age and social groups
on how best to sell a car 'for cash'. Auto Trader is favoured by a quarter of car
owners in the 17-44 year age group and a fifth of wealthier motorists, but has less
appeal for older and low-income drivers.
A similar pattern to Auto Trader exists for eBay. Older car owners (55-64 year-olds)
are more likely to use a 'local newspaper advert/website' and those in the 45-64 age
group lean towards selling to a 'small local garage' more than others.
Channels for selling car 'for cash'
1
2
5
6
6
7
8
15
18
18
19
25
39
Friend/family
Private sale
National newspaper ad/website
Used car supermarket
Auction
Non--franchised used car dealer
webuyanycar.com etc.
Franchised dealer
Used Car Trader
Small local garage
Local newspaper ad/website
Ebay
Auto Trader %
Source: BMRB International
When it comes to price, selling 'for cash' through Auto Trader appeals more to
owners of cars initially costing between £3,000 and £10,000, and eBay for cars
valued between £2,000 and £5,000. On the other hand, owners of cars bought for
between £15,000 and £20,000 are more likely to try to sell 'for cash' through
'franchised dealers', 'car supermarkets' or 'auction'.
Auto Trader was cited as the most likely route of 'converting a car into cash'

The Consumer Perspective
The Used Car Market – a report by BCA 39
Reasons for selling for cash
Reasons for selling 'for cash''
3
6
13
16
23
30
32
Use alternative transport
Cash for other reasons
Not afford to run car
Part deposit forreplacement
No longer need car
Negotiate better deal
Better price than tradingin the car
%
Source: BMRB International
Car owners' reasons for considering selling their car 'for cash' provide an interesting
insight into the benefits motorists anticipate from this when replacing their car, rather
than trading it for a new or used vehicle.
A third of motorists believe they 'will achieve a better price than trading in their car', a
similar number think 'they will be able to negotiate a better deal on a new or used
car'— while nearly a quarter (23%) of motorists feel they would sell 'for cash' when
'they no longer need a car'.
While men (38%) believe more strongly than women (28%) that selling their car 'for
cash' obtains 'a better price than trading in their car', a third of both believe this will
allow them to 'negotiate a better deal on a new or used car'.
A fifth of 25-34 year-olds and low-income car owners would take the cash route if
'they could no longer run or maintain their car', while 21% of drivers in the 45-54 year
age group would think about 'retaining part of their car's value in cash and use part
as a deposit for a replacement vehicle'.
A half of cars owners, who bought a used car for between £10,000 to £15,000 and
two-thirds in the £20,000 plus band, are sure they 'will achieve a better price' if they
sell their existing car 'for cash' rather than trading it in.
A third of motorists believe they 'will achieve a better price than trading in their car'

The Consumer Perspective
The Used Car Market – a report by BCA 40
Part Four – Economic Recovery and Car Running Costs
What car to buy during an economic uncertainty?
Having lived through the longest, deepest economic downturn on record, suffered
five years of financial pressures, with little hope of a swift recovery – what type of
vehicle might car owners think about buying next time they replace their car?
Buying a car during slow economic recovery
3
3
5
5
9
9
10
10
14
14
15
22
29
Bigger car
Lower specification
Low interest loan
Lower depreciation
Best part-exchange price
Used instead of new
Same type of car
Lower CO2
Lower maintenance
Smaller car
Best purchase price
Lower road tax
Better fuel consumption %
Source: BMRB International
Only one in 10 respondents said they would 'buy the same type of car again', half as
many as three years earlier – with 90% of car owners planning to look for a different
type of car when they change.
Changing to a car with 'better fuel consumption' was cited by 29% of motorists,
while 22% were looking for a model with 'lower road tax'. 'Best purchase price', 'a
smaller car' and 'lower maintenance' were other prominent features that motorists
might take into account when deciding which car to buy next time round.
Men (31%) are more focused on finding a car with 'better fuel consumption' than
women (26%), whereas only a fifth of younger motorists have this in their sights. Car
owners, in the 45-54 year age group, are more interested than others in finding a car
with blend of 'better fuel consumption', 'lower road tax', 'lower CO2' and perhaps a
'smaller car'.
Only one in 10 respondents said they would 'buy the same type of car again'

The Consumer Perspective
The Used Car Market – a report by BCA 41
People who own used cars that cost more than £20,000 are the most determined to
change their type of vehicle next time – in terms of 'better fuel consumption', 'lower
road tax', 'best possible purchase price', 'lower maintenance costs' and 'lower
depreciation'.
Steps already taken to cut car running costs
As average household income continues to run below inflation, many car owners have
had to find some way of controlling their car running costs.
Steps taken to substantially cut car running costs
2
4
5
5
6
7
9
9
10
12
13
15
15
21
15
Lower cost service provider
Fewer cars in the household
DIY service\repairs
Change to car lower insurance
Close windows when possible
Shorter trips
Use public transport
Switch off air conditioning
Lower insurance premium
Bought a smaller car
More fuel efficient car
Accelerate less quickly
Avoid heavy breaking
Drive more slowly
Tyres at right pressure %
Source: BMRB
Seventy eight per cent of respondents this year said they had already taken steps to
cut their car running costs – a rise of 8% over last year's survey. Motorists will clearly
adopt a range of these measure and, taken together, 'keeping tyres at the right
pressure' (22%), driving more slowly' (15%), 'avoiding heavy braking' (15%)
'accelerating less quickly' (15%) and 'a more fuel-efficient car' (13%), will produce big
savings.
Similar to last year, men are far more determined than women to introduce cost-
cutting measures, as are car owners in the 35 to 54 year group – whereas very few
younger motorists have 'cutting car running costs' on their agenda.
Men are more determined than women to introduce cost-cutting measures

The Used Car Market – a report by BCA 42
Regional Review
The BCA consumer research provides a valuable insight into the pattern of car
owners' buying and owning experiences across the various regions in the UK.
This year's survey shows that Northern motorists (35%) were the biggest buyers of a
new or used car during the past two years, with South Western, Welsh, East Anglian,
East and West Midlands' car owners not far behind. Just a quarter of South Eastern
and Scottish car owners had bought a car over the past two years, while London
remains the lowest car buying region of all, only 12% of respondents buying a new or
used car in the past 24 months, 3% fewer than the previous year.
Car bought over past two years
12
25
32
31
31
29
30
27
26
35
25
London
South East
South West
Wales
East Anglia
East Midlands
West Midlands
Yorks/Humb
North West
North
Scotland
%
Source: BMRB
When choosing between a new and used car, Yorkshire and Humberside topped the
used car buying league; 83% of car buyers opting for a used vehicle, as did 80% of
East Midland car owners. Three-quarters of West Midlands and Welsh car owners
had bought a used car in the past two years as did two-thirds of Scottish car buyers.
‘Personal experience' tops the list in nine regions
‘Personal experience of make/model' is the most influential factor in nine of the UK's
11 regions when considering what car to buy next – cited by two out of five
respondents in Yorkshire/Humberside and a third of motorists living the South West,
East Anglia, East and West Midlands and the North (see overleaf).
'The views of friends and family' resonate most with car owners in the South West
(32%) and the East Midlands (30%), but much less so with East Anglian car owners at
just 19%. Taking a 'test drive' is important to nearly three out of 10 Londoners, while
'independent Internet sites' are favoured most in the West Midlands.
Northern motorists were the biggest buyers of a new or used car during the past two years

Regional Review
The Used Car Market – a report by BCA 43
Considering what car to look for
282323
14
21
14
10
15
17
34
24
17
26
35
34
26
38
34
33
24
26
32
25
19
30
29
23
24
24
9
20
28
21
28
17
24
21
12
21
11
11
13
15
17London
South East
South West
Wales
East Anglia
East Midlands
West Midlands
Yorks/Humb
North West
North
Scotland
%
Personal experience Friends/Family Test drive Internet
Source: BMRB
When to buy the next car?
Welsh car owners (16%) are most likely to buy a car in the next year as are 15% of
South Eastern respondents – in contrast to just 10% of their Northern counterparts.
Buying a car in the next 12 months
3
6
5
5
3
6
1
4
3
5
4
6
7
10
9
11
9
9
10
7
8
9
6
9
11
9
11
9
13
7
10
14
13
79
75
78
78
81
82
71
74
77
78
75London
South East
South West
Wales
East Anglia
East Midlands
West Midlands
Yorks/Humb
North West
North
Scotland
%
Certainly Quite likely 50/50 Unlikely/Not
Source: BMRB
Fourteen per cent of East Anglian and 13 % of Welsh car owners said there was a
50/50 chance they would buy a car in the next 12 months, whereas 82% of Scottish
motorists felt they were unlikely or wouldn't follow suit in the coming year.
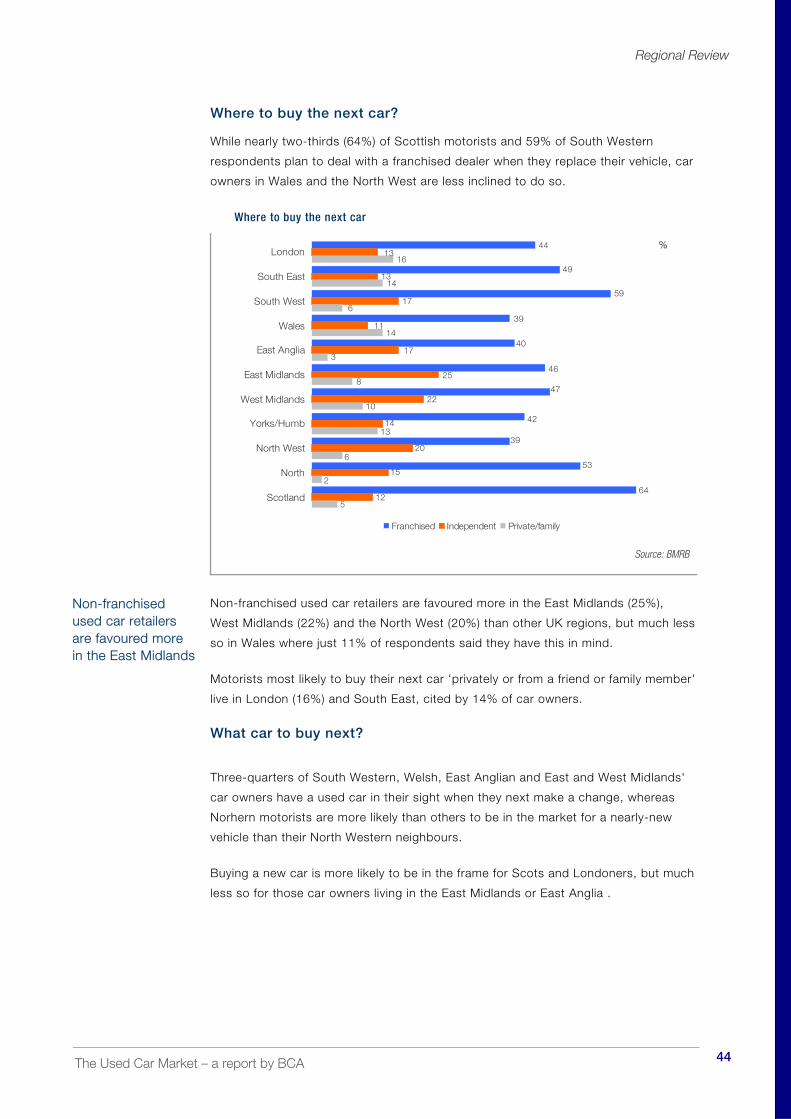
Regional Review
The Used Car Market – a report by BCA 44
Where to buy the next car?
While nearly two-thirds (64%) of Scottish motorists and 59% of South Western
respondents plan to deal with a franchised dealer when they replace their vehicle, car
owners in Wales and the North West are less inclined to do so.
Where to buy the next car
6412
5
46
47
42
39
53
40
39
44
49
59
15
20
14
22
25
17
11
17
13
13
2
6
13
10
8
16
14
6
3
14
London
South East
South West
Wales
East Anglia
East Midlands
West Midlands
Yorks/Humb
North West
North
Scotland
%
Franchised Independent Private/family
Source: BMRB
Non-franchised used car retailers are favoured more in the East Midlands (25%),
West Midlands (22%) and the North West (20%) than other UK regions, but much less
so in Wales where just 11% of respondents said they have this in mind.
Motorists most likely to buy their next car 'privately or from a friend or family member'
live in London (16%) and South East, cited by 14% of car owners.
What car to buy next?
Three-quarters of South Western, Welsh, East Anglian and East and West Midlands'
car owners have a used car in their sight when they next make a change, whereas
Norhern motorists are more likely than others to be in the market for a nearly-new
vehicle than their North Western neighbours.
Buying a new car is more likely to be in the frame for Scots and Londoners, but much
less so for those car owners living in the East Midlands or East Anglia .
Non-franchised used car retailers are favoured more in the East Midlands

Regional Review
The Used Car Market – a report by BCA 45
What type of car next?
67
76
72
69
76
76
61
67
70
76
76
7
6
6
8
1
9
7
6
8
1
15 12
15
10
8
4
13
10
9
5
11
16
12
10
12
10
7
12
12
13
10
12
17
London
South East
South West
Wales
East Anglia
East Midlands
West Midlands
Yorks/Humb
North West
North
Scotland
%
Used car Nearly new New car Don't know
Source: BMRB
Satisfied used car owners
The most satisfied motorists in this year's consumer survey live in Yorkshire and
Humberside, where 90% were 'very satisfied' with their used car and a further 9%
were 'quite satisfied' with their purchase. The lowest satisfaction level was recorded
in East Anglia at 90%.
Four out of five Northern and three-quarters of South Western and North Western
used car buyers confirmed they were 'very satisfied' with their car, in contrast to just
53% of Londoners and 62% of South Eastern cars owners who felt the same way .
Very satisfied and quite satisfied used car owners
67
81
76
90
69
67
70
72
75
62
53
25
11
17
9
30
29
20
26
23
31
39
Scotland
North
North West
Yorks/Humb
West Midlands
East Midlands
East Anglia
Wales
South West
South East
London %
Very satisfied Quite satisfied
Source: BMRB
The most satisfied motorists live in Yorkshire and Humberside

Regional Review
The Used Car Market – a report by BCA 46
Major influences on car search
When asked what most influenced the way they conduct their search for a car, 77%
of West Midlands' car buyers were driven mostly by 'price range', as were 69% of
Northern, East Midlands and South Western car owners – in contrast to Londoners
(59%) and South Eastern (60%) respondents who were less preoccupied by price.
Searching for car influences
59
60
69
67
61
69
77
62
56
69
64
38
40
40
36
41
41
33
37
46
47
30
38
36
34
45
32
32
41
43
34
31
37
London
South East
South West
Wales
East Anglia
East Midlands
West Midlands
Yorks/Humb
North West
North
Scotland%
Price Brand Model
Source: BMRB
At 47% and 46% respectively, the North and the North West top other regions for the
influence that 'brand' has on the way car buyers search for the car of their choice. In
contrast, just three out of 10 Scottish motorists chose 'brand as a significant factor.
Welsh used car buyers (45%) were driven more by 'model range' than other motorists
as were 43% of Yorkshire/Humberside car shoppers.
Selling your car 'for cash'
Selling their car 'directly for cash' appeals most to Londoners and West Midlands' car
owners; 57% of the former and 55% of the latter indicating they would consider doing
so when they came to replace or dispose of their existing vehicle.
Selling 'for cash' is a less attractive proposition for car owners in the North of
England, however – just 33% of Northerners and 37% North Western motorist were
prepared to consider selling for cash.
Selling their car 'directly for cash' appeals most to Londoners and West Midland's car owners

Regional Review
The Used Car Market – a report by BCA 47
Sell car for cash
57
43
48
43
46
41
55
49
37
33
46
London
South East
South West
Wales
East Anglia
East Midlands
West Midlands
Yorks/Humb
North West
North
Scotland %
Source: BMRB
Buying a new car instead of used
Buying a new car rather than used
29
11
12
19
6
12
20
16
19
13
30
25
26
21
12
25
23
21
24
22
20
22
21
34
23
30
19
24
19
24
18
23
19
25
29
44
39
50
41
40
36
41
44
29
London
South East
South West
Wales
East Anglia
East Midlands
West Midlands
Yorks/Humb
North West
North
Scotland
Certainly Quite likely Unlikely Certainly not
Source: BMRB

Regional Review
The Used Car Market – a report by BCA 48
East Anglians not in the frame
More than half of London (54%) and Scottish (52%) survey respondents said they
would 'certainly' or 'quite likely' consider buying a new car instead of a used one if a
'low or 0% interest new car finance deal' was available next time they change their
car.
On the other hand, 'low or 0% new car finance' is much less likely to persuade East
Anglian car owners to think about buying a new rather than used car – just 6% of
them would 'certainly' and 25% 'quite likely' consider this prospect, half of them
declaring it is 'certainly not' in the frame as far as they are concerned.

The Used Car Market – a report by BCA 49
European Overview This section of the Used Car Market Report looks at new and used car markets in key
European countries that make up the EU27, plus the three European Free Trade
Association countries (EFTA). Western Europe is the original EU15 states plus EFTA.
EU15 Austria, Belgium, Denmark, Finland, France, Greece, Germany, Ireland, Italy,
Luxembourg, the Netherlands, Portugal, Spain, Sweden, the UK
EU25 EU15 plus the Czech Republic, Estonia, Hungary, Latvia, Lithuania, Poland,
Slovakia, Slovenia
EU27 EU 25 plus Bulgaria, Romania
EFTA3 Iceland, Norway, Switzerland
Western Europe EU15 plus EFTA3
Europe has a population of 504 million and a car parc of some 239 million passenger
cars, 202 million of them in Western European countries. According to ACEA (European
Automobile Manufacturers Association), Europe has two million people directly involved
in automotive manufacturing and a further 4.6 million jobs in related manufacturing and
services sectors.
New car market volumes
Europe's new car registrations peaked at 16 million units in 2007. Despite the support of
wide-spread scrappage incentive schemes in 2009 and 2010, new car volumes dropped
to 12.5 million over the past five years– some three million units lower than pre-recession
levels.
European new car volumes; EU27 plus EFTA 2003 – 2012
15.8
12.5
15.115.3 15.3
13.613.8
14.514.7
16.0
10
11
12
13
14
15
16
17
2003 2004 2005 2006 2007 2008 2009 2010 2011 2012
Mill
ions
of ca
rs
Source: ACEA
Europe's new car volumes dropped to 12.5 million over the past five years

European Overview
The Used Car Market – a report by BCA 50
Western Europe's (EU15/EFTA) new car sales, which accounted for 94% of the
overall European total, tumbled 8.1% and one million units to a 20-year low of 11.8
million in 2012.
Western European markets
Of Europe's major markets, only the UK saw its new car volumes rise in 2012, by
5.3% to 2.04 million units. While Germany's new car sales slipped 2.9% to 3.08
million, the remaining major markets suffered a more marked decline as they
struggled with recession – France (-13.9%), Italy (-19.9%) and Spain (-13.4%).
EU15 new car registrations; 2012
3.08
2.041.90
1.40
0.700.50 0.49
0.34 0.280.17 0.11 0.08 0.06 0.05 0.03
0.00
0.50
1.00
1.50
2.00
2.50
3.00
Mill
ions
German
y UK
Fran
ce Italy
Spain
Nethe
rland
s
Belgium
Austri
a
Sweden
Denmar
k
Finlan
d
Irelan
d
Greece
Luxe
mbu
rg
Portug
al
Source: ACEA
Apart from the UK, and Denmark and Luxembourg (where new car markets were flat
last year), all other Western European countries saw their new car volumes drop in
2012, most notably Greece (-40.1%), Portugal (-37.9%), Belgium (-14.9%) and
Ireland (-11.5%).
While German new car market volumes slipped 2.9% to 3.08 million units in
2012, they remain in touch with pre-recession levels. French new car sales,
which had remained relatively strong during several years of financial uncertainty,
fell 13.9% and 305,000 units to 1.9 million in 2012, dropping to third place in the
EU new car sales league.
Italy's and Spain's new car sales struggled in 2012. Italy recorded the biggest fall
of the EU's major new car markets, dropping 350,000 units (19.9%) to 1.75
million – 1.1 million less than 2007's pre-recession figure. Spain's new car
volumes continued their steep downward trend, falling a further 13.4% (108,000
units) to 700,000 – less than half the volumes recorded in the mid 2000s.
Italy's and Spain's new car sales struggled in 2012

European Overview
The Used Car Market – a report by BCA 51
New car sales major EU markets; 2003 – 2012
1.90
2.202.25
2.01 2.01 2.072.00
2.06 2.05
2.27
3.083.17
2.92
3.24 3.27 3.323.47
3.153.09
3.81
1.40
1.75
2.25 2.26 2.242.33
2.50
2.16
1.96
2.16
0.700.81
0.98
1.52
1.381.53
1.63 1.61
1.16
0.95
2.041.94
2.34
2.40
2.442.572.58
2.032.13
1.99
0.00
0.50
1.00
1.50
2.00
2.50
3.00
3.50
4.00
2003 2004 2005 2006 2007 2008 2009 2010 2011 2012
Mill
ions
of
units
France Germany Italy Spain United Kingdom
Source: ACEA
UK new car volume growth outpaced the European market by some distance in
2012, rising 103,000 to 2.04 million units, regaining second place in Europe's
new car sales table.
The major markets' (France, Germany, Italy, Spain and the UK's) share of the EU's
new car business was stable at 72.9% last year, thanks to the significant rise in UK
new car sales and Germany's volumes dropping less than the overall EU market.
New member states
New car sales new EU member states, 2012
273.6
174.0
69.3 66.453.0 48.6
19.4 17.3 12.2 10.7
0
50
100
150
200
250
300
Polan
d
Czech
Rep
l
Slov
akia
Roman
ia
Hunga
ry
Slov
enia
Bulgar
ia
Esto
nia
Lithu
ania
Latvi
a
Tho
usan
ds
Source: ACEA

European Overview
The Used Car Market – a report by BCA 52
Apart from Romania (-18.7%) and Slovenia (-16.7%), which saw their new car sales
fall substantially last year, all other Eastern European countries outpaced overall EU
performance. While Hungary's new car volumes rose 17.6% to 53,000 units in 2012,
and the Czech Republic's volumes remained flat at 174,000 – the CEE's largest new
car market, Poland, experienced a fall of just 1.4% to 273,600 units.
Used car volumes
Overall European used car volumes are considerably higher than EU new car sales;
the six biggest markets in this report accounting for over 25 million used car sales
last year.
Used car volumes, 2012
7.16.9
5.4
2.5
1.8 1.6
1 0.8 0.7 0.5 0.4
0
1
2
3
4
5
6
7
8
Mill
ions
UK
German
y
Fran
ce Italy
Nethe
rland
sSpain
Sweden
Austri
a
Belgium
Denmar
k
Portug
al
Source: National Trade Bodies
The major used car market trends' chart shows UK used car volumes dropped from
7.4 million to 6.3 million units in 2009 during a period of recession and economic
downturn, recovering over the past three years to 7.1 million in 2012 – maintaining
the UK's position as Europe's largest used car market.
While Germany's used car sales continued their recovery, rising half a million units to
6.9 million in 2012, French and Spanish used car volumes have been flat for several
years.
Italian used car sales, which had been surviving the country's serious economic woes
relatively well, slipped some 300,000 units to 2.5 million in 2012, some way short of
pre-recession levels.
Maintaining the UK's position as Europe's largest used car market

European Overview
The Used Car Market – a report by BCA 53
Used car volumes major markets, 2003 – 2012
5.25.4
5.65.55.45.45.3 5.5 5.5 5.4
6.06.16.3
6.76.6
6.86.8
6.4 6.4
6.9
2.9 2.8
3.23.23.12.92.93.0
2.82.5
1.41.51.71.61.6
1.21.4
1.7 1.6
1.6
6.3
6.7 6.6
7.2
6.8
7.37.1
7.4
6.7
7.1
0
1
2
3
4
5
6
7
8
2003 2004 2005 2006 2007 2008 2009 2010 2011 2012
Mill
ions
France Germany Italy Spain United Kingdom
Source: National Trade Bodies
Car parc
Seven out of 10 of Europe’s 239 million cars are located in the five main markets of
France, Germany, Italy, Spain and the United Kingdom. Car ownership varies
considerably across Europe.
Parc sizes, 2011
42.9
36.5
31.4 30.5
22.0
7.6
5.2 4.5 4.4 4.32.1
0
5
10
15
20
25
30
35
40
45
Mill
ions
German
yIta
ly
Franc
eUK
Spain
Nether
lands
Belgium
Portug
al
Austria
Sweden
Denmar
k
Source: Eurostat

European Overview
The Used Car Market – a report by BCA 54
Germany has the highest car density of the large markets, at 517 per 1,000
inhabitants, followed by France with 502 and the UK's 470 per 1,000 of the
population. There are 477 cars per 1,000 population for Europe as a whole,
compared with 461 cars per 1,000 people in the USA, 456 in Japan and just 32 in
China.
The average age of cars on European roads is 8.3 years. The UK has the youngest
car parc of the EU’s major markets at 7.6 years compared with Germany's 8.3,
France's 8.2.
Parc turn percentage
The dynamism of any car market can be measured by the churn in the marketplace
i.e. – the number of vehicles changing hands each year relative to the country's car
parc – known as the ‘parc turn’. Countries, with a well-developed wholesale
infrastructure for used cars, and tax-friendly treatment of used car sales, generally
have a much higher churn of vehicles.
Parc turn percentages, 2012
33.8
30.1 29.9 29.6
26.2
23.4 23.2 23.1
12.110.7 10.3
0.0
5.0
10.0
15.0
20.0
25.0
30.0
35.0
%
Denmark UK
Netherl
ands
Sweden
Austria
Belgium
German
y
Franc
e
Portug
alIta
lySpain
Source: ACEA/National Trade Bodies
With combined new and used car sales of 9.1 million units, the United Kingdom
remains the most dynamic of Europe's major car markets with a parc turn of 30.1% in
2012, some seven points ahead of Germany's figure of 23.2 % and France’s 23.1%.
This underlines the UK’s highly-developed infrastructure of the country's used car
sector and strong wholesale market.
The UK has the youngest car parc of the EU's major markets

European Overview
The Used Car Market – a report by BCA 55
Italy's parc turn tumbled to 10.7% in 2012 from 12.5% in 2011, as its combined new
and used car volumes fell by nearly half a million units last year. Spain’s parc turn
continued to drop in 2012, by a further 0.6% to 10.3% driven by a 174,000 downturn
in new car volumes.
Parc turn percentage major markets, 2003 – 2012
2324
2526
25 25 25 2524
25
2322
2322
22 22 22
20
22
24
1112
15
15 15
1516
15
1314
1011
12
15
14
16
15
16
1211
30
28
33
31
3332
34
292928
5
10
15
20
25
30
35
2003 2004 2005 2006 2007 2008 2009 2010 2011 2012
%
France Germany Italy Spain United Kingdom
Source: ACEA/National Trade Bodies
The UK's parc turn, which dropped from 34% in 2003 to settle at 28%/29% during
the country's longest and deepest economic crisis, rose to 30% in 2012, as new and
used car volumes showed signs of recovery. Apart from a dip in 2007, the German
parc turn has been relatively flat over the past 10 years, hitting 24% in 2009 due to
higher scrappage incentivised new car volumes.
The French parc turn remained remarkably steady until 2011, slipping to 23% in 2012
as its new car volumes dipped by 305,000 units. Italy's parc turn has been almost in
'free fall', dropping from 16% in 2007 to just 11% in 2012, as its new and used car
volumes fell steeply over the past five years.
A roughly similar picture exists for Spain, which has seen its parc turn slide six points
since 2007 to 10%, as its new car sales more than halved during this period.
Spain has seen its parc turn slide six points since 2007

European Overview
The Used Car Market – a report by BCA 56
Used:new volume ratios
The UK's used:new volume ratio edged up a further decimal point to 3.5:1 in 2012,
heading the EU's other major car markets by some distance. France's figure rose
from 2.4:1 to 2.8:1 year on year, reflecting a marked drop in new car sales rather a
lift in used car volumes.
In much the same vein, Italy's and Spain's used:new car ratios also rose in 2012, to
1.8:1 and 2.2:1 respectively, as their new car volumes fell sharply. While Germany's
ratio remained at 2.2:1 for the second year running, the Netherland's used:new ratio
rose two points to match the UK's at 3.5:1. Portugal's 4.6:1 used:new car ratio is a
reflection of the collapse of the indigenous new car market.
Used:new volume ratios, 2012
1.5
1.8
2.2
2.2
2.4
2.8
3.2
3.5
3.5
3.5
4.6
Belgium
Italy
Germany
Spain
Austria
France
Denmark
UK
Netherlands
Sweden
Portugal
Source: ACEA/ National Trade Bodies
Used car sales per 1,000 population
The UK continues to top the 'used car per 1,000 population' rankings, its ratio up
four points to 113 in 2012 – leaving the EU's other large car markets very much in its
wake. Germany's used car per 1,000 inhabitants rose from 79 to 84 year on year,
while France's dropped three points to 82.
While Spain's figure remained flat with a poor score of 34, Italy's used car sales per
1,000 people was down from 47 in 2011 to 41 in 2012.
The UK continues to top the 'used car per 1,000 population' rankings

European Overview
The Used Car Market – a report by BCA 57
Used car sales per 1,000 population, 2012
113
106
105
98
96
84
82
66
42
41
34
UK
Netherlands
Sweden
Denmark
Austria
Germany
France
Belgium
Portugal
Italy
Spain
Source: National Trade Bodies
United Kingdom
While UK new car sales rose
103,000 units to 2.04 million in
2012, they remained some half
a million less than those
recorded in the early 2000s.
However, UK new car volumes
have been gathering pace
during the first half of 2013 and
are forecast by the SMMT to
reach 2.22 million units for the
full year.
The UK’s used car volumes
rose 430,000 to 7.1 million units in 2012; its performance ratios of a 30% parc turn, a
3.5:1 used:new volume ratio, and used car sales of 113 per 1,000 inhabitants,
outstripping those of the other major EU used car markets.
UK used car sales; 2008 – 2012
6.76.3
6.6 6.77.1
0
2.5
5
7.5
2008 2009 2010 2011 2012
Mill
ions
Source: National Trade Bodies
UK new car volumes have been gathering pace during the first half of 2013

European Overview
The Used Car Market – a report by BCA 58
Germany
Although Germany's new car volumes dropped 90,000 to 3.08 million last year; it
maintains a lead of around one million units over its nearest rival, the UK, in the EU
new car sales rankings.
Germany’s used car volumes
recovered from a recessionary
low of six million in 2009, rising
half a million units to a new
high of 6.9 million in 2012,
challenging the UK's long-held
position at the top of the used
car sales tree.
Germany saw its used car
performance ratios improve
considerably last year – its parc
turn rose 0.8% to 23.2%,
used:new ratio was up from
2.0:1 to 2.2:1, and its used car
sales per 1,000 people reached an all-time high of 84.
Italy
Italy's car market suffered a 'double whammy' in 2012. Its new car and used car
sales both tumbled – the former by 350,000 to a lowly 1.75 million and the latter by
300,000 to 2.5 million units.
Italy’s already very low
performance indicators
suffered accordingly, its parc
turn dropping 1.8% to 10.7%
and used car sales per 1,000
inhabitants down from 47 to 41
year on year.
A 19.9% fall in new car sales
versus a lower drop of 10.7%
in used car volumes saw Italy's
used:new volume ratio rise
from 1.6:1 in 2011 to 1.8:1 in
2012.
German used car sales; 2008 – 2012
6.1 6.06.4 6.4
6.9
0.0
2.5
5.0
7.5
2008 2009 2010 2011 2012M
illio
ns
Source: National Trade Bodies
Italian used car sales; 2008 – 2012
3.0 2.92.8 2.8
2.5
0.0
2.0
2008 2009 2010 2011 2012
Mill
ions
Source: National Trade Bodies
Germany saw its used car performance ratios improve considerably last year

European Overview
The Used Car Market – a report by BCA 59
France
French new car market
volumes fell for the second
year in 2012, by 305,000 to 1.9
million units – surrendering
second place to the UK in the
EU's new car sales rankings.
French used car sales held up
reasonably well in 2012,
slipping just 2.1% to 5.36
million as France entered
recession in the second half of
the year.
The marked decline in France's
new car volumes saw its parc
turn drop 1.3% to 23.1%. and its used:new volume ratio rise from 2.5:1 in 2011 to
2.8:1 in 2012. The French used car sales per 1,000 population of 85 was relatively
flat year on year.
Spain
Spain's new car market
remains under pressure as the
country continues to fight
recession with little or no
respite in sight.
While Spanish new car
volumes fell by 108,000 to a
low of 700,000 in 2012, its
used car sales remained
stable at 1.57 million units.
Spain's used car sales per
1,000 people held steady at
34 last year, while its
used:new volume ratio went
up from 2.0:1 in 2011 to 2.2:1 in 2012. The country's parc turn, on the other hand,
dipped from 10.9% to 10.3%, the lowest in Western European
French used car sales; 2008 – 2012
5.45.2
5.5 5.5 5.4
0
2
4
6
2008 2009 2010 2011 2012
Mill
ions
Source: National Trade Bodies
Spanish used car sales; 2008 – 2012
1.51.4
1.71.6 1.6
0
0.5
1
1.5
2
2008 2009 2010 2011 2012
Mill
ions
Source: National Trade Bodies
Spain's new car market remains in pretty dire straights

European Overview
The Used Car Market – a report by BCA 60
Additional sources include:
ACEA (Association des Constructeurs Européens d’Automobiles)
Office for National Statistics
Verband der Automobilindustrie e.v.
Statistisches Bundesamt Deutschland
Zentralverband des dt. KFZ-Gewerbes
Ministerie de l’Equipement, des Transports et du Logement
CCFA (Comité des Constructeurs Français d’Automobiles) France
Centraal Bureau voor de Statistiek, Nederland
FederAuto, Belgium
National Institute for Statistics, Belgium
Danish Automobile Federation
Danmarks Statistik
ANFIA - Studies & Statistics, Italy
INE, España
GANVAM, España
Marketing Systems Iberia
ACAP (Associacão do Comércio Automóvel de Portugal)
Statistik Austria

The Used Car Market – a report by BCA 61
Macroeconomics Behind the Used Car Industry
Professor Peter N C Cooke
The UK used vehicle industry is influenced by a complex mix of external
macroeconomic factors as well as consumer demand for used cars.
Macroeconomics is rather like a long train journey. One looks through the window
gathering little more than a hazy appreciation of what you see whizzing by. Not until
the train stops can one can take in a deeper view of a microcosm of the journey.
This section of the report considers some of the wider influences; politics, the
economy, position in the economic cycle, surrounding countries – and their effect on
the new car industry which, in turn, impacts on the used car market. It also updates
some of the economic data presented in the BCA Broad View Report published in
April 2013.
Given the inter-relationship and complexity of the global automotive industry, changes
far away increasingly influence what happens in the UK.
UK economic recovery versus other countries
There is little doubt the UK economy has recovered less quickly and less robustly
from recession than other major economies – which, of course, has knocked through
to new and used car sales performance.
Profile of UK economic downturn vs. leading world economies; 2006 - 2013
106.4
99.2
101.3
91.3
98.8
96.1
103.5
97.4
85
90
95
100
105
110
2006
Q1 Q3
2007
Q1 Q3
2008
Q1 Q3
2009
Q1 Q3
2010
Q1 Q3
2011
Q1 Q3
2012
Q1 Q3
2013
Q1
Q1 2008 = 100
Canada France Germany Italy
Japan United Kingdom Revised USA United Kingdom Previous
Source: ONS
There is little doubt the UK economy has recovered less quickly than other major economies

Macroeconomics Behind the Used Car Industry
The Used Car Market – a report by BCA 62
The economies of Canada, Germany, and the USA have more then made up the
ground lost due to recession, with Canada performing the strongest. Japan's,
France's and the UK's economies have yet to recover to the level of output at the
start of the economic crisis, while Italy's output continues to contract.
The most recent revisions to the UK's GDP, in the Blue Book 2013, show the country
had a deeper initial downturn than initially reported, greater than all the countries
shown except Japan. The UK is also recovering more slowly than all but Italy,
languishing at just 96.1% of Quarter 1 2008's output – 21 quarters below the pre-
recession 'Plimsoll Line' so far.
UK economic recovery
Rarely a day goes by without some commentary on the rate of the UK's economic
recovery. Maybe, as many economists like to state, ‘the current recovery is different –
it’s based on a recession of our own making’. Of course, one might argue that
recovery should be of our own making too.
However, there is no denying the country's economic recovery has been slow
compared with other recessions. In the first quarter of 2013, the volume of output
was 4.1% below the pre-recession peak – a bigger gap than the first published
shortfall of 3%. The downturn in 2008/2009 was deeper than first thought, and the
pace of recovery has also been significantly slower than previously estimated.
Profile of current UK economic downturn compared with past three recessions
104.6
103.4
107.8
97.0
95.9
90
95
100
105
110
1 2 3 4 5 6 7 8 9 10 11 12 13 14 15 16 17 18 19 20
Pre-recession peak = 100
Q2 1973
Q2 1979
Q2 1990
Q1 2008 - Previous
Q1 2008 - Revised
Source: ONS
The chart shows that, in the economic downturns in the 1970s, 1980s and 1990s,
output recovered to its pre-recession peak between 12 and 14 quarters after the start
of the downturns. Both the previously published and revised estimates by the ONS
suggest that the UK's output remains some considerable way below this benchmark
following the 2008/2009 recession – at the 21 quarter stage.
The UK is recovering more slowly than all but Italy

Macroeconomics Behind the Used Car Industry
The Used Car Market – a report by BCA 63
The practical implications of this unprecedented trend?
Given that recovery from the previous recessions was driven partly by increased
house building, rises in house prices, and the government’s current policies of
encouraging house building with subsidised mortgages, is it reasonable to expect a
more rapid economic recovery?
Changes in GDP
At a more mundane level, the following chart illustrates how gross domestic product
(GDP) has changed over the past seven years. The orange line indicates the quarter
by quarter by change versus the previous year, while the blue columns show changes
versus the previous quarter.
UK GDP Growth vs. pervious quarter and previous year; 2006 - 2013
1.3
0.8 1.
2
-1.5
-0.2
0.4
0.4 0.
6
-0.4
0.5
-0.1
0.7
-0.20.
0
0.7
0.3
-1.8
0.6
0.6
-0.5
-0.9
0.10.2
1.21.3
0.4 0.5 0.7
0.1
-2.1
-5.4
-3.3
1.5
0.3
-2.5
0.0
2.4
0.1
0.0
1.11.0
3.7
2.7
2.12.0
2.6
3.6
4.6
3.8
2.7
1.1
-6.1
-2.4
0.5
2.0 1.8
0.8
1.7
-4.6
0.6
-7.0
-6.0
-5.0
-4.0
-3.0
-2.0
-1.0
0.0
1.0
2.0
3.0
4.0
5.0
2006
Q1
2006
Q3
2007
Q1
2007
Q3
2008
Q1
2008
Q3
2009
Q1
2009
Q3
2010
Q1
2010
Q3
2011
Q1
2011
Q3
2012
Q1
2012
Q3
2013
Q1
-7.0
-6.0
-5.0
-4.0
-3.0
-2.0
-1.0
0.0
1.0
2.0
3.0
4.0
5.0
vs.Previous Quarter vs. Quarter previous year
Source: ONS
The overall message is again one showing a slow, uncertain economic recovery. The
challenge is whether GDP has yet pulled into a positive and sustainable pattern, and
if the slow move towards economic recovery is yet sufficient to generate sustainable
growth and encourage consumers back into the market.
Such a historic pattern is hardly inspiring yet, as is presented in the individual car and
LCV chapters, the more recent marked rise in sales has perhaps been driven by
short-term market conditions and incentives; a message which has confounded the
best of forecasters.
Is it reasonable to expect a more rapid economic recovery?

Macroeconomics Behind the Used Car Industry
The Used Car Market – a report by BCA 64
CPI and RPI
One of the most immediate and important pointers for new and used car buyers is the
rate of inflation. Will their incomes keep up with higher costs and will would-be buyers
be able to afford a new or younger used a car?
CPI and RPI; 2006 - 2013
3.1
2.8
-2.0
-1.5
-1.0
-0.5
0.0
0.5
1.0
1.5
2.0
2.5
3.0
3.5
4.0
4.5
5.0
5.5
6.0
Jan
2006
Jan
2007
Jan
2008
Jan
2009
Jan
2010
Jan
2011
Jan
2012
Jan2
013
%
% c
hang
e o
n p
revi
ous
yea
r
RPI CPI
GovernmentCPI Target
Source: ONS
CPI is regarded as the benchmark for inflation – portraying the rise in the cost of
goods and services. The figures show a steep drop in prices at the depth of the
economic downturn, which have since recovered and are now running close to a 3%
rise year on year – compared with the Bank of England's CPI inflation target of a 2%
growth per annum.
The new Governor of the Bank of England may well have different ideas in terms of
helping to promote economic recovery, perhaps taking a greater hit on inflation.
Average wage rates rises are currently running in the region of 1% per annum – so
individuals and families are having their real spending power eroded. Quite simply,
they are able to buy less and less with their incomes. The age of austerity?
The chart overleaf shows the quantity of goods bought in the retail sector (retailing
sales volumes) and the amount spent (retailing sales values).
The volume and the value of retail sales grew steadily between Quarter 1 2004 and
Quarter 1 2008. The former rose by 11.4%, and the latter by 14.5%, the difference
due to price rises, CPI having increased by 9.3% over the same period. At the same
time, gross domestic product (GDP) grew by 11.6%.
The volume and value of retail sales grew steadily

Macroeconomics Behind the Used Car Industry
The Used Car Market – a report by BCA 65
UK retailing volumes and values; 2008 - 2013
103.5
110.6
90
95
100
105
110
115
2008
Jan
2008
Apr
2008
Jul
2008
Oct
2009
Jan
2009
Apr
2009
Jul
2009
Oct
2010
Jan
2010
Apr
2010
Jul
2010
Oct
2011
Jan
2011
Apr
2011
Jul
2011
Oct
2012
Jan
2012
Apr
2012
Jul
2012
Oct
2013
Jan
2013
Apr
Index level 2010 = 100
Volume Value
Source: ONS
Between Quarter 1 2008 and Quarter 1 2013, the volume of retail sales grew by just
1.2%. The value of retail sales rose by 12.8% during this time, highlighting the extent
that prices have risen since the start of the economic downturn – CPI up by 17.8%.
Average UK household disposable income; 2009 - 2013
£155
£157
£154
£162
£165
£159
140
145
150
155
160
165
170
175
Jan-
09 Mar
May Ju
lySep
tNov
Jan-
10 Mar
May Ju
lySep
tNov
Jan-
11 Mar
May Ju
lySep
tNov
Jan-
12 Mar
May Ju
lySep
tNov
Jan-
13 Mar
£ p
er w
eek
curr
ent
pric
es e
xcl b
onu
ses
Source: Asda/Centre for Economics and Business Research
One further chart in this sequence, taken from the monthly Asda Income Tracker,
shows how much average household disposable income has been eroded over the
past five years. Given that used cars are acquired almost exclusively by private
buyers, the importance of household disposable income is crucial.
Macroeconomics Behind the Used Car Industry
The Used Car Market – a report by BCA 66
Implications of the macroeconomic Issues?
Some of the problems the macroeconomic environment has created for the European
motor industry are having an impact on the UK new car sector;
The steep fall in new car sales in many Eurozone markets has seen a number of
manufacturers offering substantial discounts and exceptional finance deals to
boost volumes in the more buoyant UK market.
Discounting and pre-registration measures could persuade some potential used
car buyers to opt for a lower specification, lower-priced, smaller new car rather
than a used one, with implications for dealer used car operations.
It is possible that the new car sales decline in mainland EU markets may have a
longer-term effect on model mix and brand volumes in the UK, as well as ongoing
service business.
A new economic policy?
The new Governor of the Bank of England, Mark Carney, has delivered his first and
much-trailed press briefing on his planned policy. The intention is to hold interest
rates at their current level until unemployment drops to 7%, to help reduce
unemployment and kick start economic recovery.
However, this strategy could be at the expense of inflation and return on savings –
resulting in savers, pensioners and others on fixed incomes taking the biggest hit. It
will be interesting to see how politically acceptable this approach is with a general
election looming.
What does the future hold?
The effect of the new Governor's policy will take time to emerge and, at the time of
writing, the jury is still out on its impact.
Recent forecasts suggest the United Kingdom, if not the Eurozone, has started the
long, slow climb back to economic recovery. However, there is still more austerity to
come and government expenditure has to be cut still further. While the Chancellor
has unveiled the need for a further £11 billion of cuts in public sector expenditure,
independent economists are already debating a further £15-20 billion reduction.
Although discussions have tended to focus on cost reduction, the real need is for
expansion in production and services – which is discussed in the next chapters.
The message, looking at the macroeconomic indicators in the foregoing paragraphs,
suggest that as the economy starts to recover there may be a shortage of used cars
to satisfy a potentially pent-up demand. While the used car and used LCV sectors
have been able to cope with the decline in demand so far, the challenge will come as
the economy starts to recover.
There is still more austerity to come

The Used Car Market – a report by BCA 67
Purple Patch or Grey Mist?
A Unique New and Used Car Market
Professor Peter N C Cooke
The prolonged economic problems caused by the banking crisis and, latterly, the
Euro crisis have created a unique new and used car market situation in Europe and
the United Kingdom in particular.
These notes seek to analyse the new car market situation and highlight the niche
market in the United Kingdom in 2013 – and offer some caveats as the economy
moves forward.
The European new car market
The automotive industry is global and one needs to review at least the European new
car situation and the way it is currently influencing the UK market to understand the
present market situation.
The EU, particularly the Eurozone, has been hit by a double whammy. Firstly, the
banking crisis destabilised the banking system which, in turn, exposed the underlying
weakness of the Eurozone. Secondly, some states have been borrowing against the
strength of the Euro and their economic performance has failed to support the
borrowings – hence the current retrenchment.
This long-term economic uncertainty has led to a relative implosion in European new
car market volumes. The concern is the steep fall in new car sales over the past five
years (see page 49) which is continuing in 2013, and forecasters predict it will be
2014 or later before any meaningful recovery starts.
European new car registrations; 2012 - 2013
1,00
1
923
1,50
0
1,06
3
1,15
0
1,25
3
970
723
1,13
3
998
965
838
918
829
1347
1081
1083
1175
.4
-6.3-8.5-7.2
-9.3
-6.7 -6.4
-1.9
-7.7-8.1
-11.1
-4.9
-10.1
-15.8
-8.3-10.2-10.2
1.7
-5.8
0
100
200
300
400
500
600
700
800
900
1000
1100
1200
1300
1400
1500
1600
Jan-12
Feb Mar Apl May Jun Jul Aug Sep Oct Nov Dec Jan-13
Feb Mar Apl May June
1,00
0 un
its
-20
-15
-10
-5
0
5
10
15
20
% inc/d
ec previous year
Source: ACEA
The Eurozone has been hit by a double-whammy

Purple Match or Grey Mist?
The Used Car Market – a report by BCA 68
The chart on the previous page shows EU new car registrations recorded a year on
year drop in 17 of the 18 months leading up to June 2013, and are sitting at a 20-
year-low for Western Europe at the end of the first six months in 2013.
Any such medium or longer-term change in the European new car market triggers
two immediate concerns for motor manufacturers;
Review of markets which may offer ongoing sales opportunities in the short and
medium term.
Strategic review of manufacturing capacity and a plan to balance supply, demand
and production facilities rationalisation.
In the former, the United Kingdom has been identified as the market offering short-
term sales opportunity, even if substantial direct and indirect incentives are required
to attract higher numbers of new car buyers.
The latter strategy, which involves plant and model rationalisation has started to
emerge, albeit manufacturers have to contend with EU legislation and national politics
which restricts some of their more radical proposals.
The UK new car market
UK new car sales have also suffered from recession and economic pressures, sitting
around the two million mark for the past five years (see page 8). In complete contrast
to the scene across most of Europe, UK new car volumes are now showing clear
signs of recovery, with a marked rise for 15 out of the past 18 months.
UK new car registrations; 2012 - 2013
128.
9
61.9
372.
8
142.
3
162.
3
189.
5
143.
9
59.4
359.
6
151.
3
149.
2
123.
6
143.
6
66.7
394.
6
163.
4
180.
1
214.
9
5.9
14.813.4
11.0
11.3
7.9
11.5
3.7
12.1
8.2
0.1
9.3
3.53.3
1.8
-2.5
0.0
7.9
0
50
100
150
200
250
300
350
400
Jan12
Feb Mar Apl May Jun Jul Aug Sep Oct Nov Dec Jan13
Feb Mar Apl May June
1,0
00
uni
ts
-10.0
-7.5
-5.0
-2.5
0.0
2.5
5.0
7.5
10.0
12.5
15.0
% inc/d
ec previo
us year
Source: SMMT
UK new car volumes are now showing clear signs of recovery

Purple Match or Grey Mist?
The Used Car Market – a report by BCA 69
The inevitable consequence of prolonged, low new car volumes is a rise in the
average age of cars in the car parc, which has climbed steeply over the past eight
years – see page 19.
UK car parc, average age of cars; 2000 - 2015
30.4 30.5 30.7 30.9 31.130.327.2 29.429.028.527.8 29.8 29.9 30.2 30.3 30.1
7.817.69
7.257.06
6.736.706.69
6.887.01
6.78
7.11
6.796.93
7.557.597.44
10.0
15.0
20.0
25.0
30.0
35.0
2000
2001
2002
2003
2004
2005
2006
2007
2008
2009
2010
2011
2012
2013
2014
2015
Mill
ions
5.00
5.50
6.00
6.50
7.00
7.50
8.00
Averag
e age years
Millions Average age
Source: SMMT/Buckingham
This trend will continue until significantly higher new car volumes enter the parc for
several years to offset the impact of the ageing record-high new car volumes of the
early 2000s.
UK new car registrations; 2008/2012 versus 2004/2008 (0-5 year car parcs)
-400,000 -300,000 -200,000 -100,000 0 100,000 200,000
Volvo
Volkswagen
Vauxhall
Toyota
Suzuki
Skoda
SEAT
Renault
Peugeot
Nissan
MINI
Mercedes
Mazda
Land Rover
Kia
Jaguar
Hyundai
Honda
Ford
Fiat
Citroen
Chevrolet
BMW
Audi
Alfa Romeo
Source: SMMT/Buckingham

Purple Match or Grey Mist?
The Used Car Market – a report by BCA 70
One further strategic issue regarding the UK car parc is the way that some
franchises' parc has changed more than others – depending on how their new car
sales were affected by recession, a flagging economy and the impact of the
2009/2010 scrappage scheme which boosted the sale of smaller, cheaper cars.
The chart on the previous page shows how volume brands' 0-5 year car parcs have
contracted since 2008 with the steep fall in new car volumes – and retailers face
fewer used cars of this age reaching the used car market.
UK car market developments
Although UK new car sales have been encouraging for some months, and forecasts
continue to be more optimistic, the economy is still 'not out of the woods', inflation is
rising and unemployment refuses to register a marked decline.
This apparent contradiction in the UK new car market versus economic conditions,
and the European experience might be tracked down to a number of factors;
A considerable number of motorists have received windfall cash from PPI and
other mis-selling programmes. While exact sums are difficult to establish, it is
considered to be well in excess of £8 billion to date – with much more to come.
Recipients can use such a windfall to pay off credit cards or, if there is sufficient,
‘change their car’. This may be a new car if the price and/or finance deal is right,
or a younger used car.
Historically low interest rates on savings, invariably negative rates when inflation
is taken into account, have tempted some consumers to spend their savings –
and aggressively attractive car and finance deals sometimes prove irresistible.
Given the recent resurgence in mortgage availability and signs of a developing
housing market, one must ask if this trend will continue.
New car and pre-registration car prices are astoundingly attractive with big
discounts from sticker prices – as manufacturers seek sales to help keep plants
running as a result of the poor markets in Europe.
Fuel prices continue to escalate and, with a weakening pound, may not fall
quickly. As new cars generally offer radically improved fuel consumption versus
older models, many car owners may decide to change to a new, often smaller
car.
Private motorists may well be tempted to replace their ageing cars ‘before they
start giving problems’ – entering the market for a new or younger used car.
The economy is still 'not out of the woods'
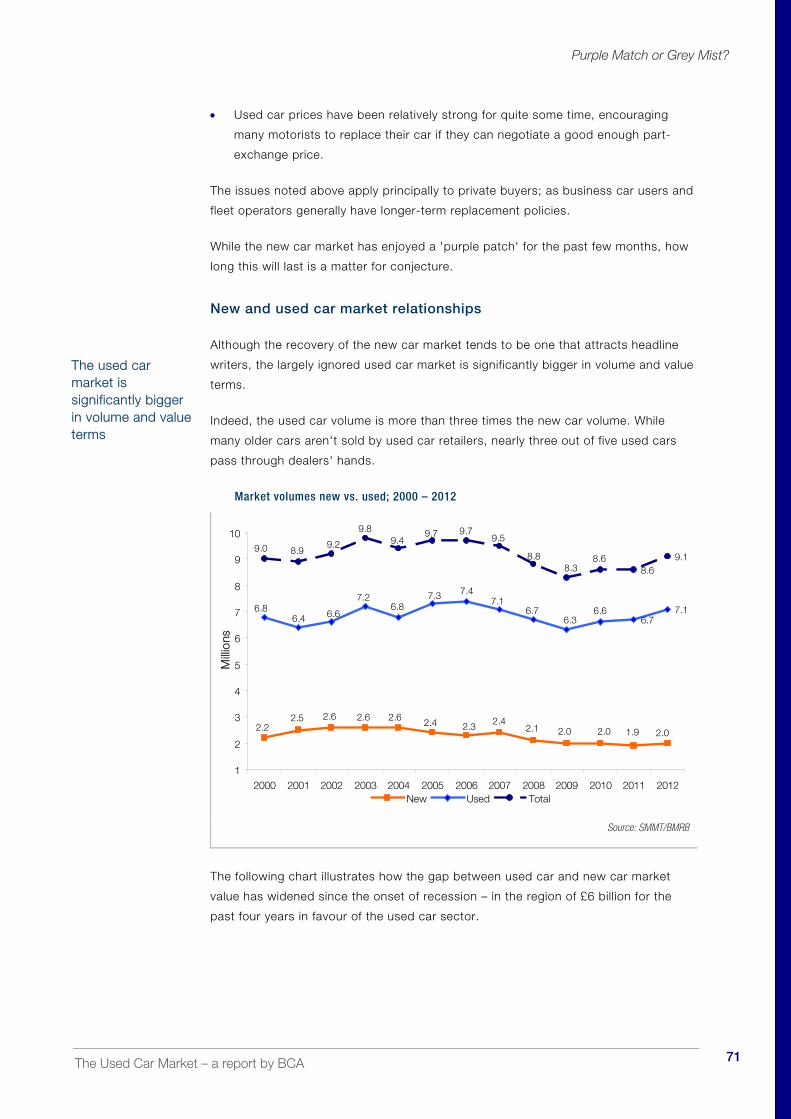
Purple Match or Grey Mist?
The Used Car Market – a report by BCA 71
Used car prices have been relatively strong for quite some time, encouraging
many motorists to replace their car if they can negotiate a good enough part-
exchange price.
The issues noted above apply principally to private buyers; as business car users and
fleet operators generally have longer-term replacement policies.
While the new car market has enjoyed a 'purple patch' for the past few months, how
long this will last is a matter for conjecture.
New and used car market relationships
Although the recovery of the new car market tends to be one that attracts headline
writers, the largely ignored used car market is significantly bigger in volume and value
terms.
Indeed, the used car volume is more than three times the new car volume. While
many older cars aren't sold by used car retailers, nearly three out of five used cars
pass through dealers' hands.
Market volumes new vs. used; 2000 – 2012
6.77.1
8.69.1
2.01.92.02.42.32.42.62.62.62.5
2.2 2.1 2.0
6.67.1
7.47.36.8
7.2
6.66.46.8 6.7
6.3
8.6
9.48.99.0
9.8
9.29.7 9.7
9.5
8.88.3
1
2
3
4
5
6
7
8
9
10
2000 2001 2002 2003 2004 2005 2006 2007 2008 2009 2010 2011 2012
Mill
ions
New Used Total
Source: SMMT/BMRB
The following chart illustrates how the gap between used car and new car market
value has widened since the onset of recession – in the region of £6 billion for the
past four years in favour of the used car sector.
The used car market is significantly bigger in volume and value terms

Purple Match or Grey Mist?
The Used Car Market – a report by BCA 72
New and used car market value; 2000 - 2012
32.3
29.028.7
32.4
29.8
27.5
33.532.4
28.028.1
33.0
32.4
32.2
38.1
35.735.0
27.3 25.4
28.1
32.0
30.0
32.3
33.933.3
32.4
34.2
24
26
28
30
32
34
36
38
40
2000 2001 2002 2003 2004 2005 2006 2007 2008 2009 2010 2011 2012
£ b
illio
n
New Used
Source: BMRN
Used car volume and value
The relative shortage of younger used cars coming to market has been reflected in a
number of ways;
The remarketing industry has reported rising average mileages on cars sold,
although that trend appears to be reversing.
Quality of used cars; regular anecdotal reports of used vehicles coming to market
being in poorer condition than has been the case.
Uncertain used car supply is making dealers rethink used vehicle acquisition, in
many cases changing the focus of the used car sales manager's role to ensure
sustainable used car supply.
The professional used car retailer
Consider some of the issues that used car retailers may need to take on board;
Used car sourcing; given that good quality, younger used cars are likely to remain
in short supply for the foreseeable future, it is vital dealers secure sustainable
supply routes;
Ensure there are strong links with the manufacturers to source nearly-new and
delivery mileage vehicles.
Uncertain used car supply is making dealers rethink used vehicle acquisition

Purple Match or Grey Mist?
The Used Car Market – a report by BCA 73
Determine a clear policy with regard to trade-ins – what will be retailed and what will
be traded.
Agree a sensible internal strategy for equitable sharing of costs and profit on
refurbishing used cars.
Develop a clear policy for auctions, electronic and physical, and decide how they can
be best exploited.
Create a clear plan regarding the inventory and sales profile; what will be the
target markets; what stock will be required; pricing strategy and who will have
overall responsibility for managing and monitoring the policy.
Establish appropriate finance sources for used car buyers so they have access to
alternative sources of funding should one be unwilling to accept their initial
proposition.
Review used vehicle presentation and trading strategies for cars not selling, and
guidelines regard pricing or moving to another site or rapid disposal if necessary.
Establish a profile of historic and targeted used car buyers and their expectations
– and stock against that profile.
Careful analysis of the used car sector is likely to reveal a market parallel to the new
car sector in many ways but, with the added dimension of heterogeneous quality,
age, mileage and condition. It is a more complex market than the new car sector.
Future profitability?
The grey mists of used car operations, which once encouraged some car retailers to
restrict their involvement in this sector, should have long gone.
For the foreseeable future, it is likely the car market will be heavily influenced by the
used car sector – albeit the new car private sector is in a bit of a 'purple patch' at
this point in time.
Successful, profit-oriented franchised dealers will be well advised to strike a clear
balance between new and used car sales. And, in future, may well revert to historical
values of seeking value-added at every opportunity, taking profit a little but often
rather than purely from the initial sale of the vehicle.
Establish finance sources for used car buyers

The Used Car Market – a report by BCA 74
Used LCVs; Where Would We be Without Them?
Professor Peter N C Cooke
Politicians may forget to their peril that economic recovery starts at the bottom.
Economics and business development are not a grand collection of statistics and
trends. Rather, they are about what happens with individuals starting new ventures,
small businesses having the confidence to seek more work – and others willing to buy
their products and services. To accomplish this, SMEs often need mobility, for
themselves, for their tools, for materials. Nothing too grand to start with, but they
need to get started. Only then, will the economic juggernaut start to roll.
LCVs can be a critical lubricant to start that whole system rolling. Not new LCVs, they
are too expensive, but a used LCV with its age, condition and mileage determining
the price.
While small businesses and new start-ups may complain about the lack of capital and
access to funds, perhaps the critical issue is really ‘what are these funds for?’ In
many instances, the requirement is for ‘wheels’ – as likely as not a used LCV.
It's perhaps an exaggeration, but the supply of used LCVs of different ages and
prices can be such an important element in economic recovery.
Economic growth and demand for used LCVs
Small businesses, as a group, are able to respond quickly to changes in demand
which, in turn, knocks through to their supply chain – including the supply of used
LCVs. It is, therefore, interesting to watch changes in the overall economy and the
way this affects LCV demand.
Start-up small businesses (SMEs) have been a driving force over the past few years.
More than half a million new businesses were created in the past year alone. Of
course, not all of these need LCVs or any type of vehicles. However, the CBI has
forecast a steady growth in the services sector, one that may well require additional
LCVs.
The industries that may well be expected to grow in the second half of 2013 and
during 2014 will include housing and house building, driven by government
underwriting of mortgages – with trades that form an integral part of this sector –
plumbing, electrics, bricklaying and carpentry, typically SMEs needing to provide
mobility for their workers. And, who wants to take a new LCV on to a building site?
There is invariably a challenge for SMEs to source used LCVs very quickly once
business opportunities open up.
SMEs need mobility for themselves, for their tools, for materials

Used LCVs – Where Would We be Without Them?
The Used Car Market – a report by BCA 75
Used LCV supply.
Used LCV supply is ultimately driven by operators changing their once-new vehicles.
Given a downturn in the economy the conventional buyers of new LCVs will seek to
cut their costs, which may mean retaining existing LCVs, reducing mileage and
perhaps cutting service. The overall impact will be for new LCV buyers to acquire
fewer units.
UK new LCV sales rose steeply to a record high of 338,000 in 2007 – plummeting by
150,000 units to 186,000 two years later in the face of recession.
UK new LCV registrations; 2000 - 2015
239
254266
304
330323 327
338
289
186
223
260
275265
240
262
100
150
200
250
300
350
2000
2001
2002
2003
2004
2005
2006
2007
2008
2009
2010
2011
2012
2013
2014
2015
Tho
usan
ds
of
units
Source: SMMT/Buckingham
Following a recovery in 2010 and 2011, LCV volumes dropped back once more to
240,000 units last year. Although LCV volumes have grown 11.2% year on year for
the first six months of 2013, it will be several years before they reach anything like
pre-recession levels.
While the latest SMMT forecasts see the new LCV market reaching 265,000 units in
2014, there could yet be pressures brought on the market through extreme pricing
action and attractive finance deals – driven by weak European economies and the
collapse of new LCV sales in Europe as shown overleaf.
Such a strategy appears to be already in place in the new car market. However, a
price-driven sales programme for LCVs may not be as effective, as major LCV
operators already enjoy exceptional price deals and manufacturers may be reluctant
to offer such largesse to SMEs or even mid-size firms.
It will be several years before they reach anything like pre-recession levels

Used LCVs – Where Would We be Without Them?
The Used Car Market – a report by BCA 76
European new LCV registrations; 2003 - 2015
1.83
2.012.07 2.09
2.22
1.41
1.54
1.66
1.54
1.42
1.501.55
1.99
1.00
1.25
1.50
1.75
2.00
2.25
2003 2004 2005 2006 2007 2008 2009 2010 2011 2012 2013 2014 2015
Mili
on u
nits
Source: ACEA/Buckingham
The chart shows European new LCV volumes over the past decade and
Buckingham's forecast for the following three years. The clear message is the way
the market crashed in 2009 and has failed to recuperate since. European LCV sales
have continued to fall in 2013, down by 5.8% year on year at the end of June, putting
an end to any hopes of a marked recovery any time soon.
While major players in the sector may extend replacement cycles often supported by
revised preventative maintenance programmes, SMEs and used LCV buyers will
generally make do and mend. Overall, as is born out by auctions, used LCVs,
particularly post-second users, are coming to market with higher mileage, greater age
and commonly lower quality.
UK new LCV registrations; 2000 – 2015 and supply gap
239
254266
304
330323 327
338
289
186
223
260
275265
240
262
100
150
200
250
300
350
2000
2001
2002
2003
2004
2005
2006
2007
2008
2009
2010
2011
2012
2013
2014
2015
Tho
usan
ds
of
units
Supply Gap
Source: ACEA/Buckingham

Used LCVs – Where Would We be Without Them?
The Used Car Market – a report by BCA 77
A ‘used LCV supply gap’ has opened up over the past few years and, assuming that
historically supply and demand were in broad equilibrium, there is a potential
shortage of younger used LCVs in the region 300,000 units – which will take several
years to flush through the system.
While the exact size of the LCV used supply gap may be open to discussion, the fact
it exists and cannot be filled quickly is significant. There is no way used vehicles can
be conjured up overnight. Such a gap may be of purely academic interest in a
continuing period of economic recession or marginal growth, as operators may ‘make
do and mend’ with their existing vehicles.
The concern arises when the economy starts to recover more strongly and there is an
upturn in demand for used LCVs – units that will not be readily available. The problem
could also be accentuated by recovery in Europe or plant closures restricting the free
supply of new units.
Role of the LCV dealer
Conventionally, the role of used LCV dealers has been to buy, refurbish and sell used
LCVs at a profit. Given the current status of the used LCV market, this role is
changing, albeit subtly, and their role becomes more proactive in a period of potential
used LCV famine.
The first issue is the shortage of younger used LCVs. Such a big shortfall changes
LCV dealers' role to become a 'true trader' balancing supply and demand.
Economic recovery raises two important questions for used LCV retailers;
What is my true customer base and how might it develop with economic
recovery?
How many used LCVs will I need to source, of what type, age, mileage and price
– and when?
The luxury of ‘supply and demand equilibrium’ may disappear to be replaced by one
of more professional and sustainable sourcing. For dealers to have to source short-
term purely from the market could be a recipe for adversity?
Developing used LCV sourcing
With any free market supply potentially very tight, it’s fair to assume prices at auction
or trade-in will rise which is likely to be reflected in sales prices. Equally, there may
be a need for vehicle refurbishment if units are older, have higher mileage or have not
been maintained to an acceptable standard during their working life.
The first issue is the shortage of younger used LCVs

Used LCVs – Where Would We be Without Them?
The Used Car Market – a report by BCA 78
As with used cars, a new or strengthened function may be needed in some
circumstances – a 'Used LCV Sourcing Specialist'. Such a position will have a far
wider role than merely ‘acquiring nice used LCVs’. It will need to establish sustainable
sources, ensure quality is fitting, know how many units are required – and when.
A broad range of used LCV sources might be tapped and exploited – such as;
Trade-in units against replacement
Direct acquisition from volume sellers
Dealer to dealer exchange
Acquire through closed/open auctions
Buy through electronic auctions
Manufacturer-sourced demonstrators, pre-registration units
Dealer demonstrators, rental stocks
While the list is high level, it gives a broad indication on the sourcing issues to be
resolved by a 'Supply Specialist'. He or she may also be involved in negotiating used
LCV supply deals with major volume sellers as well as arranging refurbishment
programmes and costing exercises.
He or she may also need to arrange links and participate in online auctions to
broaden the used LCV supply chain to sustain an adequate supply.
Used LCV market profile
LCV dealers may also have the opportunity or, indeed, the need to deal in older units.
The following two charts show how the LCV parc has aged rapidly due to five years
of desperately low new LCV volumes. Historically, franchised dealers focused largely
on younger used LCVs.
The first chart shows how the average age of LCVs on the country's roads climbed
from 6.87 years in 2007 to 7.4 years in 2012 as many fewer new LCVs entered the
supply chain, and will continue to rise until new LCV volumes approach 300,000 units
once more.
Given the fast-ageing parc and willingness or necessity of customers to accept older
units, these vehicles might provide a important opportunity.
Negotiating used LCV supply deals with major volume sellers

Used LCVs – Where Would We be Without Them?
The Used Car Market – a report by BCA 79
UK LCV parc, average age of vehicles; 2007 - 2015
3.39 3.513.473.453.42 3.52 3.55 3.58 3.63
7.587.406.696.837.01 7.086.87
7.79 8.01
1.00
1.50
2.00
2.50
3.00
3.50
4.00
2007
2008
2009
2010
2011
2012
2013
2014
2015
Mill
ions
0.00
1.00
2.00
3.00
4.00
5.00
6.00
7.00
8.00
9.00
Average age
Millions Average age
a
Source: SMMT/Buckingham
The chart below shows just how much the LCV parc age mix has changed since
2007– and will continue to do so over the next two or three years.
UK LCV parc by age segment; 2000 - 2015
0
500
1000
1500
2000
2500
3000
3500
4000
2000 2001 2002 2003 2004 2005 2006 2007 2008 2009 2010 2011 2012 2013 2014 2015
Tho
usan
d u
nits
0-2 3-5 6-8 9 plus
Source: SMMT/Buckingham
Economic recovery will put a strain on the used LCV sector but, even with rapid
economic improvement, the market will not change significantly for several years to
come.
Used LCVs – Where Would We be Without Them?
The Used Car Market – a report by BCA 80
Short and medium-term supply resolution
While there may be a dearth of younger used LCVs entering the market in the short
term, the extent of any scarcity will undoubtedly be linked to the speed of economic
recovery – the faster the recovery the bigger the shortage.
A number of short or medium-term actions might be considered;
Daily rental development; extended LCV rental services to make vehicles
available. However, the cost of these could mean they would be relatively
expensive for SMEs and would need to be hired on a daily or weekly basis. From
SMEs' point of view, this may mean more disciplined business management and
timing. Equally important from rental companies' point of view, perhaps retaining
vehicles longer or having used LCVs on fleet may allow them to offer lower-priced
rental.
LCV micro rental; the short-term rental of LCVs may be an option during a
period of recovery, when the vehicle may be hired for an hour or two when
required, thus offering the opportunity for more than one user to hire the vehicle
during the working day.
Vehicle sharing; may be possible between businesses with partners having a
vehicle for say one or two days a week, then passing it on to another member of
the syndicate. While there may be administration and cost-sharing issues to be
resolved, it could be practical in some circumstances.
LCV manufacturer supply, f inance and pricing; given the extraordinary low
demand for new LCVs across Europe, it may be reasonable to expect
manufacturers to promote LCVs harder in the UK market. As such, attractive,
tailored finance deals may be necessary.
It could become critical
The role of used LCVs in a period of economic recovery is an area that has not been
widely explored. However, given a supply gap of some 300,000 younger units, it may
become a crucial factor, providing LCV retailers with an opportunity to establish a
strong position and build a reputation for professionalism and profitability.
So far, the paucity of used LCVs has been a nuisance rather than a serious problem
but, once genuine economic recovery starts, it could very well become critical.
The short-term rental of LCVs may be an option during a period of recovery

The Used Car Market – a report by BCA 81
BCA – Partnering with Buyers and Sellers to Power the Market
BCA is Europe’s largest vehicle remarketing company with 19 UK remarketing
centres and a dedicated administrative hub and data centre, plus a further 26
Mainland European facilities. BCA employs over 2,100 well-trained and highly
motivated staff delivering a wide range of services to buyers and sellers of used
vehicles.
BCA sells around 600,000 vehicles annually in the UK, with a further 200,000 sold in
Europe through a variety of physical and online channels.
BCA – Growth and innovation
The changing shape of the remarketing and automotive markets is delivering new
challenges and opportunities and BCA has delivered a wealth of initiatives to make it
easier for our customers to buy and sell more vehicles.
In the physical and online remarketing arenas, BCA is investing to deliver a
comprehensive service. Recent announcements have included the acquisition of We
Buy Any Car, ensuring the BCA market place remains the largest, most effective and
efficient, delivering residual value performance for our vendors and supplying a good
stock mix for our buyers. BCA also acquired nkl automotive ltd, the vehicle logistics
specialists based in Goole, Yorkshire, enhancing the range of services we offer our
customers with additional storage and refurbishment services in the UK.
New developments announced for 2013 include a Buyer Funding facility, a new Video
Appraisal service and an all-new online sales initiative that will deliver a range of
buying and selling opportunities.
BCA has its finger on the pulse of the industry
BCA is leading the field in the use of business intelligence data and remarketing
analytics to help our customers buy and sell vehicles more efficiently. This includes
looking at a wider range of data to inform reserve price setting, such as daily,
condition adjusted vehicle valuations, vehicle demand data and utilising consumer
data such as retail market pricing and demand information.
BCA also analyses data around the benefits of vehicle preparation, mechanical
checks, vehicle movements and other activities in the remarketing process.
Combined with other BCA information, such as inspection costs, appraisal images/
grades, number of days in stock, Auction View interest and performance/market data
of similar vehicles, all inform our customers to make the right remarketing decisions.

BCA – Partnering with Buyers and Sellers to Power the Market
The Used Car Market – a report by BCA 82
This data is used to plan sales activity from the most appropriate sales channel
through to a realistic pricing strategy. It is also used to ensure that the right buyers
are aware of the vehicles and attending the sales, physically or online. All of this will
help both buyers and sellers achieve their objectives, with BCA providing value in
between.
BCA sets the pace for online sales
The use of Internet channels to remarket used vehicles is now so well established
that it is hard to imagine how we ever got by without online bidders. In the 13 years
since BCA introduced the Live Online concept to the UK market, the annual volume
bought by BCA online bidders has gone from a few dozen manufacturer cars to
round 150,000 plus units annually and growing.
Our customers tell us they want to buy and sell used vehicles online 24/7, 365 days a
year. To gain a competitive edge BCA offers a choice of online routes to market –
Live Online, Bid Now, Buy Now and e-Auction– and vehicles can be Offsite or Onsite
when they are offered for sale.
Our sales are supported with a sophisticated logistics operation, accounting for
around 850,000 collections and deliveries and 120,000 end-of-life inspections in the
UK alone, while 732,000 vehicles are pre-sale prepared using a range of specialist
services.
The critical factor for online success is to have the tools and processes that make
buyers feel as comfortable buying via their laptop or mobile device as they do seeing
the vehicle being driven through an auction hall. Quality of information and objectivity
is key to this.
BCA’s online video appraisals have met with positive buyer feedback, and that
technology will have an increasing importance in the remarketing sector to meet the
needs of online buyers.
Clever technology
In today’s demanding environment, it is important to be ‘easy to do business with’
and BCA does much more than sell used vehicles. We offer a range of bespoke
outsourced services that go much further.
These include managing all the remarketing for volume sellers as a business partner,
managing upstream Affinity Sales and Driver Sales, running manufacturer Stock
Market and Fleet Repatriation Services, delivering full service de-fleet management,
operating as a Pan-European remarketing partner delivering a structured sales
programme across multiple markets, running Offsite Sales Programmes for a range of
vendors and handling all ‘end of life’ vehicle movements as a Logistics Partner.

BCA – Partnering with Buyers and Sellers to Power the Market
The Used Car Market – a report by BCA 83
BCA’s Inventory Management system (IMS) gives the seller complete control over the
remarketing process and can include document management, logistics management
including inspection and collection, storage and refurbishment, and selling through a
range of high performance online remarketing channels, Tele-sales and physical
auction channels, and multi-point marketing. BCA has also developed a white label e-
sales platform that fully integrates with the Inventory Management system, allowing
vehicles to be sold instantly in a closed environment.
For the dealer sector, the award winning Appraise Value and Sell online tool delivers a
range of business benefits and is being adopted by some of the biggest names in the
industry. Comprising three modular components for used car sellers, it generates
consistent and objective appraisals, powered by BCA Autograde, accurate real-time
valuations – BCA Marketprice – using the UK’s largest used vehicle databank and
Smart Sell – a seamlessly linked remarketing process. Sellers can use just one, two
or all three functions and as a web-based tool the product can be used by any
computer with an Internet connection – from tablet to desktop.
BCA – we’re easy to do business with
BCA is innovative and adaptive to changing market conditions and has listened to its
customers to focus on delivering services that meet their needs, whether they are a
buyer or seller. By constantly measuring customer satisfaction and benchmarking
service levels, BCA works with its customers to deliver effective outcomes in a highly
competitive marketplace.

The Used Car Market – a report by BCA 84
BCA Network

The Used Car Market – a report by BCA 85
Statistical Data
This section of the Used Car Market Report includes data taken from the 2013 BMRB
International survey of 4,000 UK car owners, providing an insight into their views and
preferences in buying or owning a used car.
It supplies background information on the Consumer Experience and Regional
sections of the report, and allows readers to draw comparisons with their own views
and experience of the UK used car market.
NB All responses are percentages.

Statistical Data
The Used Car Market – a report by BCA 86
Q How many cars are in your household?
Total Men Women 17-24 25-34 35-44 45-54 55-64 65+ AB C1 C2 D E
One 44 44 45 34 40 48 37 47 55 43 48 47 43 29
Two 23 24 22 16 23 28 34 28 10 39 23 19 10 3
Three or more 5 5 5 8 3 4 8 6 1 8 5 4 2 1
None 28 28 28 41 34 20 21 19 34 10 23 29 45 67
Scotland North Yorks & Humb
North West
West Mids
East Mids
East Anglia
Wales South West
South East
London
One 37 44 49 43 42 53 33 41 46 44 47
Two 24 29 20 25 29 23 50 25 26 20 7 Three or more 2 1 2 7 5 2 7 9 10 5 3
None 36 26 29 24 24 21 10 25 18 30 43
Q Have you bought a new or used car recently?
Total Men Women 17-24 25-34 35-44 45-54 55-64 65+ AB C1 C2 D E
Yes, new in 2008 or earlier 3 2 3 - 1 4 2 5 4 4 2 2 2 2
Yes, new in 2009 1 1 1 - 0 2 1 2 2 1 2 1 1 1
Yes, new in 2010 3 4 1 1 2 3 4 4 3 5 2 2 1 1
Yes, new in 2011 3 3 2 1 2 3 3 2 3 4 3 2 2 1
Yes, new in 2012 3 4 3 3 2 4 3 6 2 5 4 2 1 1
Yes, new in 2013 1 1 1 0 1 1 1 3 1 1 2 1 1 1
Yes, used in 2008 or earlier 7 7 7 6 6 8 10 8 6 9 7 7 5 4
Yes, used in 2009 4 4 4 2 3 6 3 7 3 5 4 4 4 1
Yes, used in 2010 5 7 4 2 5 6 10 5 3 9 4 5 4 2
Yes, used in 2011 6 6 7 3 8 8 9 7 4 8 6 8 6 1
Yes, used in 2012 10 10 10 4 16 14 15 7 4 14 11 8 8 5
Yes, used in 2013 4 4 4 3 5 6 5 4 1 5 4 4 3 2
No 52 51 54 76 50 40 41 45 63 36 50 56 65 81
Scotland North Yorks & Humb
North West
West Mids
East Mids
East Anglia
Wales South West
South East
London
Yes, new in 2008 or earlier 4 2 6 2 1 3 - 3 2 3 2
Yes, new in 2009 3 1 1 1 1 4 2 1 - 1 0
Yes, new in 2010 4 6 3 4 1 2 - 6 2 3 1
Yes, new in 2011 4 3 2 5 5 1 - 3 2 2 1
Yes, new in 2012 4 3 1 4 5 3 - 5 5 3 1
Yes, new in 2013 0 1 0 2 2 1 - - 2 2 -
Yes, used in 2008 or earlier 4 6 10 7 10 11 6 9 10 6 2
Yes, used in 2009 4 6 4 4 4 4 7 4 8 3 1
Yes, used in 2010 5 4 5 3 6 4 4 6 6 8 3
Yes, used in 2011 6 5 6 6 8 5 7 9 11 7 3
Yes, used in 2012 8 16 14 8 10 11 24 11 14 7 5
Yes, used in 2013 3 7 4 3 3 4 7 4 3 5 2
No 53 41 49 54 51 49 42 45 40 51 78

Statistical Data
The Used Car Market – a report by BCA 87
Q What most strongly influences the type of used car you would consider buying?
Total Men Women 17-24 25-34 35-44 45-54 55-64 65+ AB C1 C2 D E Personal experience of particular make \ model
29 31 26 15 28 32 39 33 22 37 27 25 23 13
Views of friends or family 26 23 28 34 29 25 21 27 19 25 28 23 25 30
Test drive 21 24 18 20 25 23 18 24 16 23 21 24 17 16 Internet shopping, consumer advice sites
14 16 13 21 18 15 12 13 7 16 11 17 14 9
Used car showroom\sites 13 13 13 10 12 10 15 12 21 10 13 17 13 10
Consumer reports \ programmes (e.g. Which?, Watchdog)
10 10 11 8 9 15 12 11 7 17 11 5 6 4
Classified used car websites 10 11 9 15 12 11 13 5 4 8 12 12 11 9
Motoring magazines 8 12 4 5 8 7 9 13 5 8 7 10 8 4
Cars you see on the street 8 7 8 13 6 7 10 7 3 4 9 10 11 7
Franchised \ used car dealer websites
7 7 8 7 7 9 8 8 6 6 9 10 5 5
Advice from the selling franchised \ used car dealer
5 5 6 6 7 3 6 8 3 6 4 5 7 5
Car TV shows 5 7 3 10 5 4 4 6 1 4 4 5 7 5
Car manufacturer adverts 3 4 3 4 2 6 1 4 2 1 4 3 4 6
Social Media (i.e. Facebook, Twitter)
2 2 2 4 4 1 2 - 0 1 1 2 5 3
Other 9 7 10 3 7 10 7 7 19 8 7 11 8 10
Scotland North Yorks & Humb
North West
West Mids
East Mids
East Anglia
Wales South West
South East
London
Personal experience of particular make \ model
28 34 38 26 34 33 35 26 34 24 17
Views of friends or family 23 24 23 24 29 30 19 25 32 26 24
Test drive 23 21 21 12 24 17 20 9 28 21 28 Internet shopping, consumer advice sites
11 15 14 10 21 14 11 11 13 15 17
Used car showroom\sites 20 18 9 7 12 12 12 15 16 13 12
Consumer reports \ programmes (e.g. Which?, Watchdog)
10 4 14 8 7 13 12 7 17 9 11
Classified used car websites 7 11 17 8 14 13 9 8 10 8 11
Motoring magazines 5 3 8 12 7 8 4 7 8 8 10
Cars you see on the street 3 8 10 8 9 9 9 8 11 7 6
Franchised \ used car dealer websites
11 5 5 7 7 5 7 9 10 7 8
Advice from the selling franchised \ used car dealer
3 9 6 5 8 6 - 9 7 3 6
Car TV shows 9 3 6 4 3 7 - 4 2 5 7
Car manufacturer adverts 5 5 4 2 6 5 - 1 2 2 4
Social Media (i.e. Facebook, Twitter) 1 3 3 1 1 3 - 5 0 2 3
Other 15 6 10 10 4 11 14 14 8 7 5
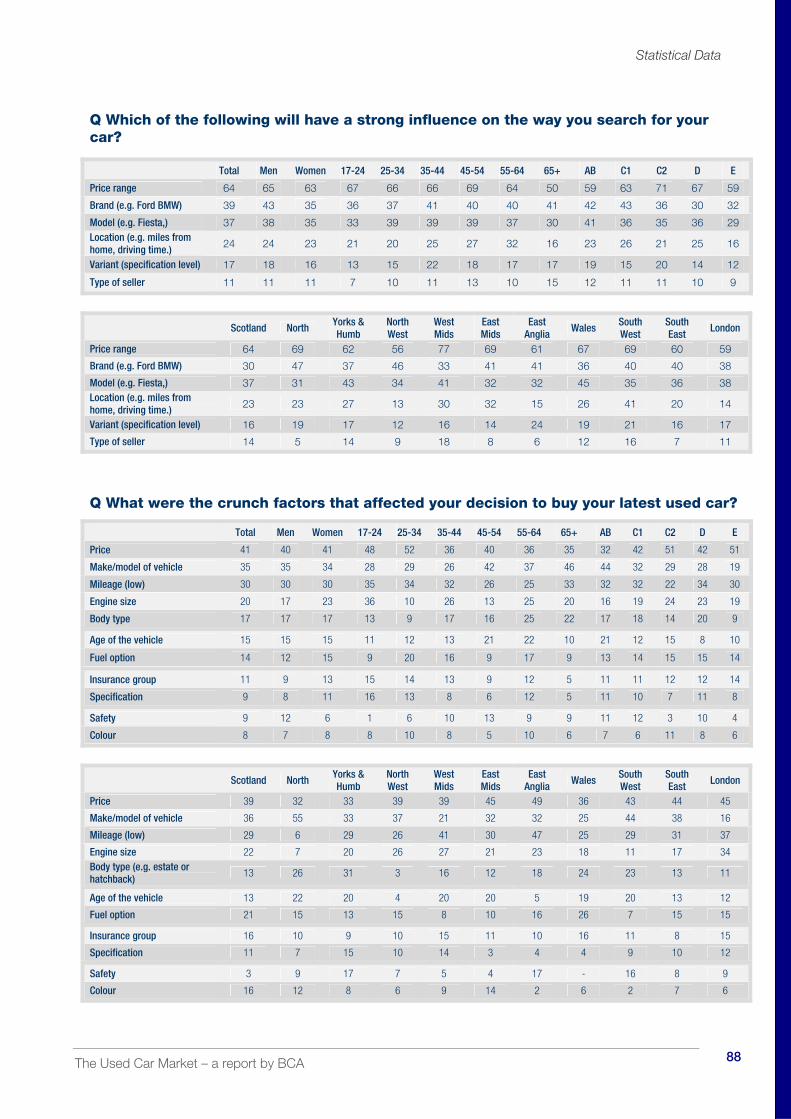
Statistical Data
The Used Car Market – a report by BCA 88
Q Which of the following will have a strong influence on the way you search for your car?
Total Men Women 17-24 25-34 35-44 45-54 55-64 65+ AB C1 C2 D E
Price range 64 65 63 67 66 66 69 64 50 59 63 71 67 59
Brand (e.g. Ford BMW) 39 43 35 36 37 41 40 40 41 42 43 36 30 32
Model (e.g. Fiesta,) 37 38 35 33 39 39 39 37 30 41 36 35 36 29 Location (e.g. miles from home, driving time.) 24 24 23 21 20 25 27 32 16 23 26 21 25 16
Variant (specification level) 17 18 16 13 15 22 18 17 17 19 15 20 14 12
Type of seller 11 11 11 7 10 11 13 10 15 12 11 11 10 9
Scotland North Yorks & Humb
North West
West Mids
East Mids
East Anglia
Wales South West
South East
London
Price range 64 69 62 56 77 69 61 67 69 60 59
Brand (e.g. Ford BMW) 30 47 37 46 33 41 41 36 40 40 38
Model (e.g. Fiesta,) 37 31 43 34 41 32 32 45 35 36 38 Location (e.g. miles from home, driving time.) 23 23 27 13 30 32 15 26 41 20 14
Variant (specification level) 16 19 17 12 16 14 24 19 21 16 17
Type of seller 14 5 14 9 18 8 6 12 16 7 11
Q What were the crunch factors that affected your decision to buy your latest used car?
Total Men Women 17-24 25-34 35-44 45-54 55-64 65+ AB C1 C2 D E
Price 41 40 41 48 52 36 40 36 35 32 42 51 42 51
Make/model of vehicle 35 35 34 28 29 26 42 37 46 44 32 29 28 19
Mileage (low) 30 30 30 35 34 32 26 25 33 32 32 22 34 30
Engine size 20 17 23 36 10 26 13 25 20 16 19 24 23 19
Body type 17 17 17 13 9 17 16 25 22 17 18 14 20 9
Age of the vehicle 15 15 15 11 12 13 21 22 10 21 12 15 8 10
Fuel option 14 12 15 9 20 16 9 17 9 13 14 15 15 14
Insurance group 11 9 13 15 14 13 9 12 5 11 11 12 12 14
Specification 9 8 11 16 13 8 6 12 5 11 10 7 11 8
Safety 9 12 6 1 6 10 13 9 9 11 12 3 10 4
Colour 8 7 8 8 10 8 5 10 6 7 6 11 8 6
Scotland North Yorks & Humb
North West
West Mids
East Mids
East Anglia
Wales South West
South East
London
Price 39 32 33 39 39 45 49 36 43 44 45
Make/model of vehicle 36 55 33 37 21 32 32 25 44 38 16
Mileage (low) 29 6 29 26 41 30 47 25 29 31 37
Engine size 22 7 20 26 27 21 23 18 11 17 34 Body type (e.g. estate or hatchback)
13 26 31 3 16 12 18 24 23 13 11
Age of the vehicle 13 22 20 4 20 20 5 19 20 13 12
Fuel option 21 15 13 15 8 10 16 26 7 15 15
Insurance group 16 10 9 10 15 11 10 16 11 8 15
Specification 11 7 15 10 14 3 4 4 9 10 12
Safety 3 9 17 7 5 4 17 - 16 8 9
Colour 16 12 8 6 9 14 2 6 2 7 6

Statistical Data
The Used Car Market – a report by BCA 89
Q What influenced your decision to buy your used car from that particular dealer?
Total Men Women 17-24 25-34 35-44 45-54 55-64 65+ AB C1 C2 D E Right car at best possible price
37 37 38 40 58 38 39 34 24 41 34 46 19 15
Got a good deal on the car 30 37 23 52 15 32 28 31 35 28 26 38 30 50
Could trade in my old car 22 18 26 - 20 10 24 33 23 15 26 29 26 19 Dealer reliable and trustworthy
19 23 15 54 27 6 15 26 20 24 16 13 27 9
Local and convenient 17 18 16 67 14 11 14 19 18 19 17 17 11 6 Have bought a used car from them before
16 15 18 22 11 5 19 24 16 19 14 15 13 10
Staff friendly, helpful and professional
15 13 17 51 11 2 10 29 14 19 15 16 - -
Offered a warranty or vehicle had warranty
15 14 16 29 21 6 18 18 10 17 16 19 - -
Wide choice of vehicles 10 9 11 37 10 4 10 12 11 8 12 8 16 -
Good aftersales service 9 7 11 14 12 1 8 14 8 11 9 7 - 6 Easy negotiation, lack of sales pressure
7 7 8 36 12 2 - 10 11 8 6 9 5 -
Recommended by friend 6 7 6 51 10 3 2 7 5 6 9 5 3 -
They had the car\make of car I wanted
5 3 6 16 - 3 7 5 3 4 5 7 - -
Scotland North Yorks & Humb
North West
West Mids
East Mids
East Anglia
Wales South West
South East
London
Right car at best possible price
30 28 50 27 50 24 29 52 44 40 43
Got a good deal on the car 40 36 34 34 45 40 24 14 22 17 41
Could trade in my old car 46 43 29 4 21 24 24 27 9 13 26 Dealer reliable and trustworthy
24 5 31 7 50 10 26 - 24 16 15
Local and convenient 14 21 10 7 18 19 8 13 34 13 3 Have bought a used car from them before
24 23 6 17 10 8 41 14 13 21 -
Staff friendly, helpful and professional
16 27 16 9 7 20 20 14 14 12 11
Offered a warranty or vehicle had warranty
16 21 22 4 25 16 8 - 23 9 -
Wide choice of vehicles 16 - 9 4 18 17 8 27 7 6 14
Good aftersales service 8 14 24 8 - - 8 14 12 8 - Easy negotiation, lack of sales pressure
5 6 20 4 25 3 8 - 3 7 -
Recommended by friend - 5 - 14 10 9 - 7 4 12 -
They had the car\make of car I wanted
8 8 - - 9 - 10 - 3 8 -
Q What type of car did you last purchase?
Total Men Women 17-24 25-34 35-44 45-54 55-64 65+ AB C1 C2 D E
Off road/4 x 4 5 6 4 3 6 2 8 6 4 5 8 2 3 8
Saloon 17 17 17 14 10 16 17 18 30 20 13 19 13 18
Estate 8 9 6 - 6 11 8 12 3 8 5 9 8 10
Hatchback 51 53 49 58 55 51 49 47 51 46 51 55 61 53
M.P.V/People carrier 7 5 9 - 11 9 6 5 5 9 6 5 7 -
Sports car/coupe 6 5 6 11 5 5 7 4 3 7 6 5 4 2
Prestige e.g. Jaguar 1 0 1 2 - - - 3 - 1 1 - - -
Micro/City Car 4 1 6 5 4 3 5 2 2 3 5 2 3 6
Other 2 3 1 2 2 2 1 3 1 1 4 1 1 3

Statistical Data
The Used Car Market – a report by BCA 90
Q What type of car did you last purchase?
Scotland North Yorks & Humb
North West
West Mids
East Mids
East Anglia
Wales South West
South East
London
Off road/4 x 4 7 10 8 7 3 1 7 1 9 3 3
Saloon 24 12 16 25 12 21 17 22 14 16 10
Estate 7 9 5 8 8 4 1 13 5 11 9
Hatchback 52 48 52 43 66 57 47 43 46 52 54
M.P.V/People carrier 3 3 6 5 3 7 17 7 14 7 -
Sports car/coupe - 15 4 6 7 7 7 8 4 4 6
Prestige e.g. Jaguar - 4 - - - - - - 2 1 -
Micro/City Car 3 - 5 3 1 4 4 6 3 4 6
Other 5 - 3 4 1 - - - 2 0 6
Q Which of these reasons influenced you to buy a used car rather than a new car?
Total Men Women 17-24 25-34 35-44 45-54 55-64 65+ AB C1 C2 D E
Couldn't afford a new car 37 36 38 43 43 45 40 30 26 30 35 45 40 41
Used better value for money 22 26 19 20 22 28 25 24 17 33 22 21 16 8 Lower depreciation with used cars
16 16 15 11 11 15 22 22 12 25 18 11 7 3
Always buy used cars 10 11 10 4 8 12 14 14 10 12 10 11 10 7
Needed a car quickly 6 6 6 7 9 7 7 3 2 5 6 7 5 3 More choice when buying a used car
3 3 2 3 4 3 2 3 2 3 4 2 2 2
Scotland North Yorks & Humb
North West
West Mids
East Mids
East Anglia
Wales South West
South East
London
Couldn't afford a new car 33% 27% 31% 28% 37% 49% 32% 40% 35% 41% 46%
Used better value for money 14% 30% 21% 20% 31% 22% 26% 23% 35% 20% 16% Lower depreciation with used cars
17% 23% 15% 10% 22% 17% 18% 14% 31% 11% 7%
Always buy used cars 13% 12% 11% 6% 11% 12% 9% 16% 19% 8% 6%
Needed a car quickly 7% 4% 6% 6% 8% 4% 7% 6% 6% 7% 2% More choice when buying a used car
2% 4% 2% 1% 4% 2% 2% 2% 8% 3% 1%
Q How likely is it you or a member of your family will buy a car in the next year?
Total Men Women 17-24 25-34 35-44 45-54 55-64 65+ AB C1 C2 D E
Certainly will 5 5 4 8 5 6 6 2 1 6 5 4 5 1
Quite likely 9 10 7 13 11 9 9 6 5 10 9 10 6 4
50:50 chance 10 10 9 14 11 12 10 8 4 10 11 10 9 5
Unlikely 26 27 26 23 28 31 30 29 19 37 24 24 21 15 Certainly not in the next 12 months
20 20 20 20 19 21 22 21 18 17 22 20 22 18
Won't be buying a car in the future
28 26 30 17 23 20 21 32 51 19 25 28 36 55
Don't Know 2 2 3 4 3 1 2 1 3 2 3 2 3 2

Statistical Data
The Used Car Market – a report by BCA 91
Q How likely is it you or a member of your family will buy a car in the next year?
Scotland North Yorks & Humb
North West
West Mids
East Mids
East Anglia
Wales South West
South East
London
Certainly will 6 1 6 3 4 3 6 5 4 5 5
Quite likely 6 9 7 8 10 9 11 11 9 10 7
50:50 chance 6 9 9 11 11 9 14 13 10 7 13
Unlikely 24 26 19 26 32 34 13 34 27 26 26 Certainly not in the next 12 months
20 19 26 18 15 17 19 12 25 21 22
Won't be buying a car in the future
35 34 32 30 26 28 32 25 22 27 25
Don't Know 2 1 1 2 1 1 5 - 2 4 3
When you come to buy a car is it most likely to be:
Total Men Women 17-24 25-34 35-44 45-54 55-64 65+ AB C1 C2 D E
Used car, petrol 42 39 44 47 42 37 40 34 50 36 43 47 41 43
Used car, diesel 26 29 23 19 30 35 27 28 14 28 23 27 27 23
Used car, hybrid 3 4 3 2 5 3 4 1 2 3 5 1 1 4
Used car, alternative fuel 1 1 1 1 1 1 1 1 0 0 1 1 1 - Nearly new (up to 9 months old) used car, petrol
3 3 4 3 3 2 4 4 4 4 3 5 2 2
Nearly new (up to 9 months old) used car, diesel
2 3 2 - 2 4 1 5 1 3 4 1 - --
New car, petrol 6 6 7 4 5 6 5 9 11 9 6 4 6 4
New car, diesel 3 4 2 4 3 3 3 4 3 5 3 1 3 3
New car, hybrid 1 1 1 1 - 1 1 1 1 0 1 1 - -
Don't Know 12 11 13 18 10 6 11 13 13 10 11 11 15 19
Scotland North Yorks & Humb
North West
West Mids
East Mids
East Anglia
Wales South West
South East
London
Used car, petrol 38 39 40 36 46 55 30 39 42 42 42
Used car, diesel 28 22 25 25 23 20 46 36 31 26 21
Used car, hybrid 1 - 4 3 6 1 - - 2 4 5
Used car, alternative fuel - - 1 3 1 - - 1 1 0 1 Nearly new (up to 9 months old) used car, petrol
2 10 5 - 3 3 - 1 4 4 6
Nearly new (up to 9 months old) used car, diesel
4 5 3 1 3 3 9 - 2 2 -
New car, petrol 7 6 9 10 5 1 5 5 6 7 6
New car, diesel 5 6 1 3 3 1 - 4 3 3 5
New car, hybrid 2 - - 1 - 1 - 2 - - 1
Don't Know 8 13 13 17 11 12 10 11 8 12 13
Q If low or 0% interest (finance) is available would you consider buying a new car instead of a used one next time you change?
Total Men Women 17-24 25-34 35-44 45-54 55-64 65+ AB C1 C2 D E
Certainly 17 19 16 19 17 18 22 16 11 21 15 18 17 11
Quite likely 23 24 22 27 30 22 25 20 10 21 22 27 20 23
Unlikely 24 24 24 25 21 28 24 20 24 24 27 20 24 19
Certainly not 30 30 30 17 28 29 25 40 47 29 30 29 30 40
Don't know 6 4 8 13 5 3 5 4 8 5 6 5 9 8
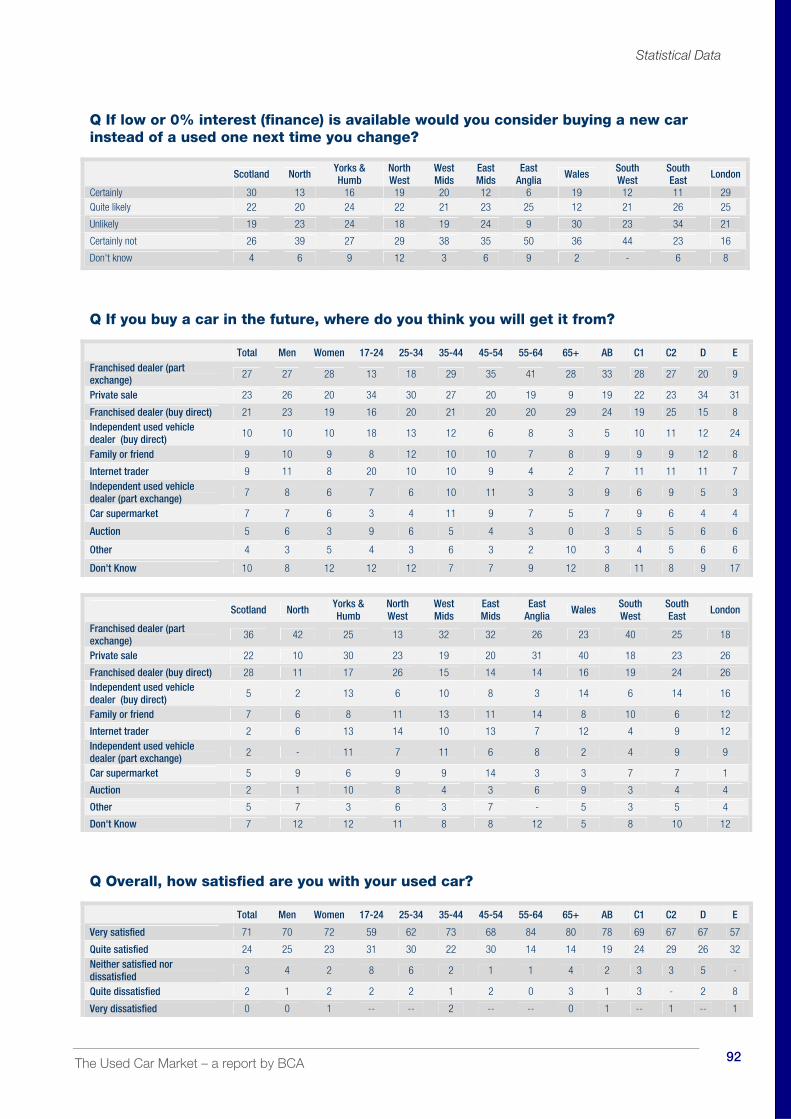
Statistical Data
The Used Car Market – a report by BCA 92
Q If low or 0% interest (finance) is available would you consider buying a new car instead of a used one next time you change?
Scotland North Yorks & Humb
North West
West Mids
East Mids
East Anglia
Wales South West
South East
London
Certainly 30 13 16 19 20 12 6 19 12 11 29 Quite likely 22 20 24 22 21 23 25 12 21 26 25
Unlikely 19 23 24 18 19 24 9 30 23 34 21
Certainly not 26 39 27 29 38 35 50 36 44 23 16
Don't know 4 6 9 12 3 6 9 2 - 6 8
Q If you buy a car in the future, where do you think you will get it from?
Total Men Women 17-24 25-34 35-44 45-54 55-64 65+ AB C1 C2 D E Franchised dealer (part exchange)
27 27 28 13 18 29 35 41 28 33 28 27 20 9
Private sale 23 26 20 34 30 27 20 19 9 19 22 23 34 31
Franchised dealer (buy direct) 21 23 19 16 20 21 20 20 29 24 19 25 15 8 Independent used vehicle dealer (buy direct)
10 10 10 18 13 12 6 8 3 5 10 11 12 24
Family or friend 9 10 9 8 12 10 10 7 8 9 9 9 12 8
Internet trader 9 11 8 20 10 10 9 4 2 7 11 11 11 7 Independent used vehicle dealer (part exchange)
7 8 6 7 6 10 11 3 3 9 6 9 5 3
Car supermarket 7 7 6 3 4 11 9 7 5 7 9 6 4 4
Auction 5 6 3 9 6 5 4 3 0 3 5 5 6 6
Other 4 3 5 4 3 6 3 2 10 3 4 5 6 6
Don't Know 10 8 12 12 12 7 7 9 12 8 11 8 9 17
Scotland North Yorks & Humb
North West
West Mids
East Mids
East Anglia
Wales South West
South East
London
Franchised dealer (part exchange)
36 42 25 13 32 32 26 23 40 25 18
Private sale 22 10 30 23 19 20 31 40 18 23 26
Franchised dealer (buy direct) 28 11 17 26 15 14 14 16 19 24 26 Independent used vehicle dealer (buy direct)
5 2 13 6 10 8 3 14 6 14 16
Family or friend 7 6 8 11 13 11 14 8 10 6 12
Internet trader 2 6 13 14 10 13 7 12 4 9 12 Independent used vehicle dealer (part exchange)
2 - 11 7 11 6 8 2 4 9 9
Car supermarket 5 9 6 9 9 14 3 3 7 7 1
Auction 2 1 10 8 4 3 6 9 3 4 4
Other 5 7 3 6 3 7 - 5 3 5 4
Don't Know 7 12 12 11 8 8 12 5 8 10 12
Q Overall, how satisfied are you with your used car?
Total Men Women 17-24 25-34 35-44 45-54 55-64 65+ AB C1 C2 D E
Very satisfied 71 70 72 59 62 73 68 84 80 78 69 67 67 57
Quite satisfied 24 25 23 31 30 22 30 14 14 19 24 29 26 32 Neither satisfied nor dissatisfied
3 4 2 8 6 2 1 1 4 2 3 3 5 -
Quite dissatisfied 2 1 2 2 2 1 2 0 3 1 3 - 2 8
Very dissatisfied 0 0 1 -- -- 2 -- -- 0 1 -- 1 -- 1

Statistical Data
The Used Car Market – a report by BCA 93
Q Overall, how satisfied are you with your used car?
Scotland North Yorks & Humb
North West
West Mids
East Mids
East Anglia
Wales South West
South East
London
Very satisfied 67 81 90 76 69 67 70 72 75 62 53
Quite satisfied 25 11 9 17 30 29 20 26 23 31 39 Neither satisfied nor dissatisfied
6 5 1 3 - 2 6 2 - 3 8
Quite dissatisfied 1 2 1 4 1 2 - - 2 2 -
Very dissatisfied 1 -- -- -- -- -- 4 -- -- 1 --
Q If economic recovery remains slows, what might you look for when you change car?
Total Men Women 17-24 25-34 35-44 45-54 55-64 65+ AB C1 C2 D E Car with better fuel consumption
29 31 26 19 29 32 35 32 23 32 30 26 24 23
Car with lower road tax 22 21 22 18 27 18 27 23 17 23 22 21 20 19
Best possible purchase price 15 15 15 12 15 17 16 14 14 17 11 18 14 12
Smaller car 14 14 13 14 10 15 16 15 12 11 12 17 17 21 Car with lower maintenance costs
14 14 15 17 14 14 18 17 7 16 12 14 17 10
Car with lower CO2 10 10 10 9 11 13 8 12 8 11 11 9 8 8
Same type of car 10 9 11 4 6 10 13 12 13 9 11 11 11 13
Used car instead of new car 9 10 8 8 7 10 9 11 8 11 8 9 7 8
Best possible part--exchange price
9 9 10 5 6 10 10 14 9 9 10 10 9 8
Car with lower depreciation 5 6 5 7 8 4 6 7 2 6 6 6 3 6
Low interest finance 5 5 4 4 7 7 4 5 2 5 5 6 3 1
Lower specification\ performing car
3 4 3 3 3 3 7 2 1 3 5 3 1 7
Bigger car 3 4 3 7 7 4 1 1 1 3 3 4 4 1
Car finance loan 2 2 2 6 4 1 2 1 1 3 2 2 3 -
New car instead of used car 2 3 1 3 2 2 2 1 2 2 2 2 1 1
Scotland North Yorks & Humb
North West
West Mids
East Mids
East Anglia
Wales South West
South East
London
Car with better fuel consumption
27 43 34 19 30 24 22 37 34 31 21
Car with lower road tax 32 30 22 11 22 18 8 27 25 25 17
Best possible purchase price 15 16 14 10 18 20 10 14 21 14 11
Smaller car 12 14 12 10 12 19 10 21 20 12 18 Car with lower maintenance costs
11 15 14 18 9 20 11 11 9 14 17
Car with lower CO2 8 16 7 9 17 9 11 16 10 11 5
Same type of car 11 7 8 10 12 6 8 17 10 9 13
Used car instead of new car 10 11 9 4 13 14 11 7 8 10 7 Best possible part--exchange price
12 8 12 4 15 13 - 9 11 10 2
Car with lower depreciation 8 1 11 1 8 1 - 10 6 6 7
Low interest finance 5 6 2 6 3 4 - 5 5 4 12 Lower specification\ performing car
4 5 2 3 - 3 - 4 2 4 8
Bigger car 3 - 2 4 5 4 2 4 2 2 8
Car finance loan 4 1 - 1 - - 1 6 2 4 4
New car instead of used car 2 1 1 5 1 - - 3 2 1 4

Statistical Data
The Used Car Market – a report by BCA 94
Q Would you consider selling your car directly for cash from any of the following channels?
Auto Trader 18 19 16 26 23 25 19 11 5 20 16 16 20 9
Ebay 11 12 10 18 16 17 7 9 4 11 11 13 12 7 Local newspaper advert\website
9 9 8 5 7 10 7 13 8 10 9 6 8 10
Used Car Trader 8 9 7 10 12 12 8 5 5 9 9 6 10 5
Small local garage 8 9 7 6 8 9 11 6 9 9 8 8 6 10
Franchised dealer 7 7 6 6 11 7 5 5 7 9 5 5 7 6 webuyanycar.com or similar service
4 4 4 5 3 6 3 3 3 3 4 3 4 3
Non--franchised used car dealer
3 4 3 1 3 5 5 1 3 4 4 2 2 2
Used car supermarket 3 3 2 4 3 3 5 1 1 3 2 4 2 2
Auction 3 4 1 3 2 3 4 2 1 2 2 4 2 5
National newspaper advert\website
2 2 2 3 2 3 4 0 2 2 3 4 0 1
No 48 46 50 38 43 37 55 57 54 45 51 48 45 51
Don't know 7 5 8 15 4 7 2 5 9 5 6 10 8 3
Scotland North Yorks & Humb
North West
West Mids
East Mids
East Anglia
Wales South West
South East
London
Auto Trader 18 20 19 19 20 10 13 13 17 15 26
Ebay 14 8 15 7 9 9 8 13 14 9 21 Local newspaper advert\website
12 3 9 3 11 5 13 15 14 8 7
Used Car Trader 8 7 11 6 12 6 4 17 6 9 7
Small local garage 6 10 8 3 4 10 12 9 13 8 10
Franchised dealer 7 7 5 5 9 4 7 0 10 7 9 webuyanycar.com or similar service
6 2 2 2 7 2 2 1 3 2 9
Non--franchised used car dealer
1 2 5 1 3 4 4 6 2 3 5
Used car supermarket - 1 4 2 4 2 2 1 1 2 9
Auction 1 1 3 2 3 6 2 4 2 3 1 National newspaper advert\website
3 1 1 1 2 3 2 3 5 3 1
No 52 65 45 52 40 48 41 51 48 52 33
Don't know 2 2 6 11 5 11 13 6 4 5 10
Q Which, if any, of the following reasons explains why you would consider selling your car for cash?
Total Men Women 17-24 25-34 35-44 45-54 55-64 65+ AB C1 C2 D E
A better price than trading in the car
32 36 28 29 27 36 38 37 26 32 34 32 34 25
Negotiate a better deal on new/used car
30 29 31 24 32 31 36 32 22 31 28 35 26 24
No longer needed a car 23 21 27 38 21 21 21 17 26 26 26 13 26 26 To realise part of the car's value in cash\part as deposit
16 14 18 10 16 12 21 19 18 18 13 15 20 14
Could not afford to run or maintain car
13 14 12 9 21 13 13 14 6 9 13 18 14 23
Needed cash for household expenses\other reasons
6 5 7 10 8 7 4 4 1 2 8 5 10 10
Using alternative forms of transport instead of a car
3 3 2 1 5 2 - 1 4 5 1 1 2 -

Statistical Data
The Used Car Market – a report by BCA 95
Q Which of the following reasons explains why you would consider selling your car for cash?
Scotland North Yorks & Humb
North West
West Mids
East Mids
East Anglia
Wales South West
South East
London
A better price than trading in the car
25 32 43 36 27 32 39 40 26 38 31
Negotiate a better deal on new/used car
24 26 42 31 15 28 38 13 28 34 32
No longer needed a car 26 26 23 22 30 22 12 19 10 30 26 To realise part of the car's value in cash\part as deposit
14 20 10 19 20 17 23 17 11 23 7
Could not afford to run or maintain car
23 12 7 7 10 6 12 9 26 1 19
Needed cash for household expenses\other reasons
10 10 - 8 8 2 4 - 7 - 6
Using alternative forms of transport instead of a car
- - 6 2 - 4 - - 9 1 2
Q Have you taken any steps to substantially reduce your car running costs?
Total Men Women 17-24 25-34 35-44 45-54 55-64 65+ AB C1 C2 D E
Tyres at correct pressure 21 23 19 11 21 20 25 24 22 22 21 20 22 19
Avoid heavy breaking 15 19 11 11 14 14 16 21 14 17 14 13 14 19
Drive more slowly 15 18 12 8 14 14 16 20 15 16 12 18 15 14
Accelerate less quickly 15 17 12 10 12 13 20 16 15 18 14 13 12 10
More fuel--efficient car 13 15 12 6 16 17 13 17 10 16 13 14 7 9
Nothing\none\no action 12 12 12 16 10 14 14 8 12 14 14 10 9 9
Bought a smaller car 12 11 13 6 8 15 15 13 11 12 11 14 11 8
Lower cost insurance 10 11 9 3 7 11 16 16 7 11 10 10 10 8 Use public transport more frequently
9 8 10 6 7 6 8 10 14 8 9 7 13 14
Switch off air conditioning 9 11 7 3 11 7 12 11 7 10 9 7 9 8
Opted for shorter trips 7 8 6 2 7 5 8 9 8 4 7 9 7 10 Close windows when possible
6 8 5 5 8 4 4 8 7 7 6 5 5 2
Do-it-yourself service 5 7 4 3 6 8 7 4 3 5 4 7 7 7
Lower insurance premium 5 5 5 6 3 5 8 5 3 5 4 5 9 5
Reduced number of cars 4 3 4 2 4 4 3 4 4 4 4 2 4 3
Scotland North Yorks & Humb
North West
West Mids
East Mids
East Anglia
Wales South West
South East
London
Tyres at correct pressure 31 17 17 21 19 29 15 26 23 21 14
Avoid heavy breaking 14 10 14 14 21 15 3 9 22 16 14
Drive more slowly 14 14 11 12 22 18 13 11 13 19 13
Accelerate less quickly 12 13 17 13 20 18 13 11 17 17 6
More fuel--efficient car 16 20 12 11 10 11 13 20 21 14 4
Nothing\none\no action 15 10 11 11 7 9 22 10 5 13 25
Bought a smaller car 16 10 12 8 18 12 2 18 14 14 5
Lower cost insurance 10 15 7 7 13 10 2 11 12 11 11 Use public transport more frequently
17 5 7 7 8 14 4 3 7 8 15
Switch off air conditioning 7 13 8 8 11 11 8 11 12 8 5
Opted for shorter trips 12 9 6 10 8 10 6 12 3 3 3
Close windows when possible 5 4 6 3 10 7 3 8 7 9 3
Do-it-yourself service 6 4 9 4 7 7 - 10 7 4 3
Lower insurance premium 7 5 4 3 9 4 4 6 8 4 3
Reduced number of cars 4 1 2 3 5 4 - - 6 4 6

The Used Car Market – a report by BCA 96
Research
The BCA Used Car Market Report is based on information from the Society of Motor
Manufacturers and Traders (SMMT) and many other trade and industry sources in the
UK and across Europe.
In addition, a consumer survey was carried out by BMRB International, based on
interviews with 4,000 respondents, representative of the UK adult population aged 17
years and over. Fieldwork for this research was undertaken in April 2013.
The Used Car Market Report was written and produced for BCA Vehicle Remarketing
by Professor Peter N C Cooke and the automotive group at The Centre for
Automotive Management, University of Buckingham Business School, The University
of Buckingham, Buckingham, MK18 1EG
Copyright BCA 2013
Any part of this report may be reproduced for non-commercial purposes subject to
acknowledgement.
Any organisation wishing to use this report --- in part or in whole --- for commercial
gain, should firstly obtain permission from the Public Relations Department at BCA.
Telephone: +44 (0) 1252 878555. Fax: +44 (0) 1252 743447
Web site: http://www.bca-europe.com
E-mail: [email protected]


![CCM”) · Malay Sino, 258,000 , 60% • Company B [PERCENT AGE] Company A 8% Size: 430,000 MT/Year (a) Caustic Soda Competitive Landscape Room to grow in the CSL market - either](https://img.pdfslide.net/doc/110x75/6071f350f5588609b1697314/ccma-malay-sino-258000-60-a-company-b-percent-age-company-a-8-size.jpg)