Embed Size (px)
Citation preview

UNIVERSITY OF NAPLES FEDERICO II
DEPARTMENT OF ECONOMICS, MANAGEMENT, INSTITUTIONS
A Thesis Submitted to Obtain the Degree of Doctor of Philosophy in
Management
(Field of Accounting)
THE USEFULNESS OF MANAGEMENT REPORT
ON INVESTMENTS DECISION-MAKING IN EGYPT
Academic Year 2017-2018
Supervisor
Prof. ALESSANDRA ALLINI
Coordinator
Prof. CRISTINA MELE
Candidate
MOSTAFA K.A. MOHAMED
PhD student (Full Time)
XXXI Cycle

1
DEDICATION
To my beloved parents, my siblings and parents in law for their never ending-sacrifices
To my beloved wife for her support, sacrifices, and patience
To my dearest daughters: Nesreena and Farida
To my supervisor, Professor Alessandra Allini, for kindness and co-operation

2
DECLARATION
At no time during the registration for the degree of Doctor of Philosophy, the author has
been registered for any other University award without prior agreement of the PhD
Committee at University of Naples Federico II.
Relevant conferences were regularly attended in order to present and discuss this research
project, namely:
1- The 41st Annual Congress of the European Accounting Association (EAA), Milan, Italy 30th
May to 1st June 2018.
2- The British Accounting and Finance Association (BAFA) Annual Conference with
Doctoral Masterclasses, Westminster, London 9th to 11th April 2018.
3- The International Accounting Symposium XIII - Current Trends on Accounting Research,
Madrid, Spain from 3rd to 7th of July 2017

3
ACKNOWLEDGMENTS
IN THE NAME OF ALLAH, THE GOD, THE MERCIFUL, THE
COMPASSIONATE
In carrying out this research and presenting the results in this thesis, the support and
assistance of a number of people must be gratefully acknowledged.
Foremost, I would like to express my sincere gratitude to my supervisor, Professor
Alessandra Allini, for her co-operation and encouragement. Her assistance and insightful
comments are gratefully and proudly acknowledged.
I am greatly indebted to Professor Amalia Carrasco for her help and advice during my
visiting period at the University of Seville, Spain. This thesis has benefited from her
guidance and encouragement.
Also, I admit the valuable help from Professor Khaled Hussainey at Portsmouth University,
The UK, and Mr. Elhassan Radwan at Assiut University, Egypt.
Thanks must also be extended to the staff of the Department of Economics, Management,
Institutions at the University of Naples Federico II for their help.
I acknowledge, also, the invaluable comments received from the participants at the 41st
Annual Congress of the European Accounting Association (EAA), Milan, 30th May to 1st
June 2018; the British Accounting and Finance Association (BAFA) Annual Conference
with Doctoral Masterclasses, Westminster, London 9th to 11th April 2018; and The
International Accounting Symposium XIII - Current Trends on Accounting Research,
Madrid, Spain from 3rd to 7th of July 2017.
Finally, I would like to thank my family for their patience, support, and encouragement.

4
ABSTRACT
The main aim of this study is to investigate the investors’ perceptions on the usefulness of
disclosure provided in the Management Report in supporting their investment decisions, in
the context of the 2014 new listing rules’ requirements in the Egyptian market.
Thus, the users’ preferences were compared with the disclosure level in the MRs prepared
by the listed companies in order to understand the level of coherence.
Prior literature suggested that the financial crisis in 2008 has highlighted the inadequacy of
the financial report in matching the users’ needs, while the narrative and commentary
sections in MR can play an important role in maximizing the usefulness of accounting
information.
A mixed method approach was adopted in accordance with the following steps;
In the first step, a survey was carried out by formulating questions that cover both mandatory
and voluntary disclosures items in the MR. The targeted sample of respondents included all
Egyptian banks and insurance companies (as institutional investors) along with the financial
analysts who worked at the stockbrokerage firms. The collected responses consisted of
thirty-six of respondents who were working in institutional investors firms, and seventy-
eight of respondents who were working as financial analysts. The main findings of the
survey revealed that some voluntary information was more useful than the mandatory
information, which highlights a gap between the regulation requirements and the users’
information needs. Moreover, the respondents considered the information related to
ownership structure to be more important than the information on risks and forward-looking
performance, while the information related to board composition, audit committee, and CSR
and environmental performance were regarded as less useful items in the MR.
In the second step, we analysed 782 MRs that cover five years; two years under the old
regulation and three years under the new regulation. This analysis was aimed to compare
the users’ needs (as obtained in the previous model) with disclosure level provided in MRs.
The findings showed that the general level of disclosure in MR has increased significantly
after switching to the new regulation. However, the results indicated that the companies do
not fully commit to requirements of the mandatory disclosure, as that listed companies do
not disseminate that many of the ‘very useful’ information in MR, even if voluntarily. While
the results clearly showed that level of mandatory disclosure has increased after applying
the new regulation, the contrast was noticed in the voluntary disclosure. These contrasts in
the findings refer to the initial role of regulatory bodies in matching the users’ needs through
increasing the extent of mandatory disclosure to include much of the items seen to be very
useful to them.
Lastly, to provide further understanding, an additional regression model was carried out to
examine the impact of firm-characteristics on disclosure level in MRs. The results showed
that the presence of state ownership, cross-listing, and manufacturing activities have
significant positive impacts on the disclosure provided in MR and its main sections and
subsections. On the other hand, the age, size, profitability, and leverage had mixed findings
throughout the different sections and subsections of MR

5
TABLE OF CONTENTS
DEDICATION ...................................................................................................................... 1
DECLARATION .................................................................................................................. 2
ACKNOWLEDGMENTS .................................................................................................... 3
ABSTRACT .......................................................................................................................... 4
TABLE OF CONTENTS ...................................................................................................... 5
LIST OF TABLES ................................................................................................................ 9
LIST OF ABBREVIATIONS ............................................................................................. 10
INTRODUCTION .............................................................................................................. 11
CHAPTER ONE: The Usefulness of Accounting Information: Overview ........................ 18
1. 1 Introduction .................................................................................................................. 18
1.2 Framing the Accounting information ............................................................................ 18
1.3 The Accountability theory ............................................................................................ 20
1.4 Decision-Usefulness Approach ..................................................................................... 23
1.5 Reviewing the relevant literature regarding the users’ perceptions on the usefulness of
the annual report .................................................................................................................. 27
1.5.1 The Studies in the Developing and Emerging Markets .......................................... 27
1.5.2 The Studies in the Developed Markets ................................................................... 37
1.5.3 The Lack of Usefulness in the Financial Report: Overview .................................. 46
SUMMARY ........................................................................................................................ 50
CHAPTER TWO: The Usefulness of Management Report and the Development of
Research Questions ............................................................................................................. 52
2.1 Introduction ................................................................................................................... 52
2.2 Definition and Importance of the Management Report in the International Accounting
Standards Boards ................................................................................................................. 52
2.3 Elements of the Management Report ............................................................................ 54
2.4 The Usefulness of the Management Report: Some Insights from International
Accounting Bodies .............................................................................................................. 56
2.5 Reviewing the Studies on the Usefulness of the Management Report ......................... 60
2.6 Discussion on the Prior Studies of the Usefulness of Management Report .................. 62

6
2.7 Background of the Egyptian Context ............................................................................ 65
2.7.1 Culture .................................................................................................................... 65
2.7.2 The Accounting Standards and Practices ............................................................... 66
2.7.2.1 The Egyptian Uniform Accounting System..................................................... 67
2.7.2.2 The Egyptian Accounting Standards (EAS) .................................................... 68
2.7.3 The Regulation System .......................................................................................... 69
2.7.4 Capital Stock Market and Control Bodies .............................................................. 70
2.8 The Egyptian Regulation Regarding the Disclosure in MR.......................................... 72
2.8.1 The Content of MR in the Egyptian Market ........................................................... 72
2.8.2 The requirements of the mandatory disclosure under The Egyptian regulation .... 73
2.8.3 Discussing the Disclosure Requirements in the Egyptian MR ............................... 75
2.9 Theoretical Framework and developing the research questions ................................... 77
SUMMARY ........................................................................................................................ 83
CHAPTER THREE: The Users’ Perceptions Regarding the Usefulness of MR on
Investments Decision-Making ............................................................................................ 85
3.1 Introduction ................................................................................................................... 85
3.2 The Methodology design .............................................................................................. 85
3.3 Identifying the User-Groups for the Current Study ...................................................... 91
3.3.1 The Financial Analysts ........................................................................................... 92
3.3.2 The Institutional investors ...................................................................................... 93
3.4 Distributing and Collecting the Questionnaires ............................................................ 94
3.5 Identifying the Used Statistical Tests ............................................................................ 95
3.6 Reliability and Validity ................................................................................................. 96
3.6.1 Reliability ............................................................................................................... 97
3.6.2 The validity ............................................................................................................. 99
3.6.3 Discrimination ...................................................................................................... 101
3.7 The respondents’ profile ............................................................................................. 102
3.8 Results ......................................................................................................................... 102
3.8.1 Users’ perceptions on the usefulness of MR disclosure according to the new
regulation ....................................................................................................................... 103

7
3.8.2 Users’ perceptions regarding the usefulness of different kinds of information in
MR ................................................................................................................................. 105
3.8.3 User’ perceptions on the usefulness of mandatory and proposed voluntary items in
MR ................................................................................................................................. 111
3.9 Discussion of Results .................................................................................................. 112
3.9.1 The perceived usefulness of MR by the users ...................................................... 112
3.9.2 The perceived usefulness of different kinds of information in MR ..................... 113
3.9.3 The perceived usefulness of mandatory and proposed voluntary items in MR ... 115
SUMMARY ...................................................................................................................... 115
CHAPTER FOUR: Measuring the Disclosure in Management Reports and the Impact of
Firm-Characteristics on Disclosure Level ......................................................................... 117
4.1 Introduction ................................................................................................................. 117
4.2 The Disclosure Index .................................................................................................. 117
4.3 Sample Selection ......................................................................................................... 119
4.4 Analysing and Coding Items of the Disclosure Index ................................................ 121
4.5 Results and Discussion of Measuring the Disclosure Level in MR ............................ 122
4.5.1 Results of Measuring the Disclosure Level in MR .............................................. 122
4.5.2 Discussion ............................................................................................................ 124
4.6 Multiple Linear Regression Model ............................................................................. 126
4.6.1 Independent Variables .......................................................................................... 126
4.6.1.1 The Governmental Ownership (State-Ownership) ........................................ 127
4.6.1.2 Cross Listing .................................................................................................. 128
4.6.1.3 The Industry Type .......................................................................................... 129
4.6.1.4 The Listing-Age ............................................................................................. 130
4.6.1.5 The Firm Size................................................................................................. 131
4.6.2 Control Variables ................................................................................................. 132
4.6.2.1 The Regulation Type ..................................................................................... 132
4.6.2.2 The Profitability ............................................................................................. 132
4.6.2.3 The Leverage ................................................................................................. 133
4.7 Descriptive Statistics ................................................................................................... 134

8
4.8 Results ......................................................................................................................... 138
4.8.1 Firm-Characteristics and Aggregated Disclosure in MR ..................................... 139
Discussion on the impact of firm-characteristics on the aggregated disclosure in MR 139
4.8.2 Firm-Characteristics and Usefulness level of Disclosure: Usefulness level and
Commitment level ......................................................................................................... 141
4.8.2.1 Firm-Characteristics and the Usefulness Level of Disclosure ....................... 142
4.8.2.2 Firm-characteristics and the commitment level of disclosure: Mandatory
disclosure and Voluntary disclosure .......................................................................... 143
4.8.2.3 Discussion ...................................................................................................... 143
4.8.3 Discussion on the Impact of Firm-Characteristics on Disclosure Level in MR
Sections and Subsections ............................................................................................... 146
SUMMARY ...................................................................................................................... 151
CONCLUSION ................................................................................................................. 152
REFERENCES .................................................................................................................. 156
APPENDICES .................................................................................................................. 180
Appendix One: The Questionnaire ................................................................................ 180
Appendix Two: The Disclosure Index .......................................................................... 185
Appendix Three: Comparing the Disclosure on the Management Report’s Items under
the Old Regulation and the New Regulation ................................................................. 187
9
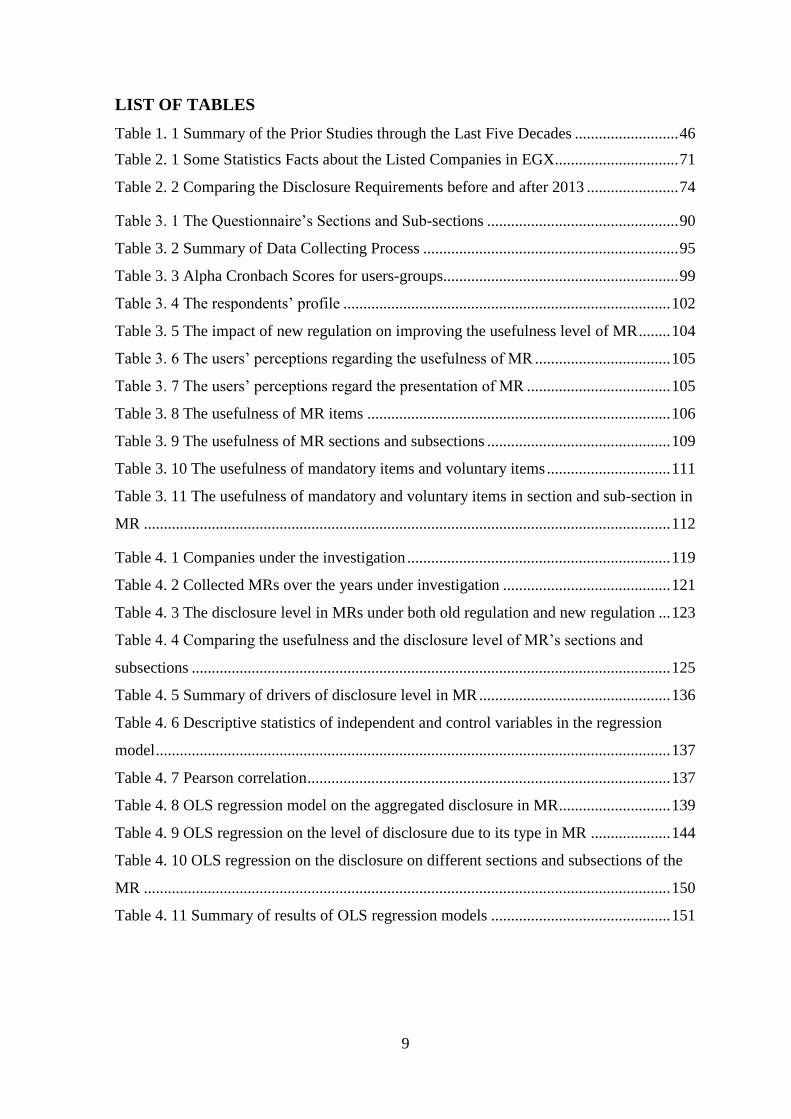
LIST OF TABLES
Table 1. 1 Summary of the Prior Studies through the Last Five Decades .......................... 46
Table 2. 1 Some Statistics Facts about the Listed Companies in EGX............................... 71
Table 2. 2 Comparing the Disclosure Requirements before and after 2013 ....................... 74
Table 3. 1 The Questionnaire’s Sections and Sub-sections ................................................ 90
Table 3. 2 Summary of Data Collecting Process ................................................................ 95
Table 3. 3 Alpha Cronbach Scores for users-groups........................................................... 99
Table 3. 4 The respondents’ profile .................................................................................. 102
Table 3. 5 The impact of new regulation on improving the usefulness level of MR ........ 104
Table 3. 6 The users’ perceptions regarding the usefulness of MR .................................. 105
Table 3. 7 The users’ perceptions regard the presentation of MR .................................... 105
Table 3. 8 The usefulness of MR items ............................................................................ 106
Table 3. 9 The usefulness of MR sections and subsections .............................................. 109
Table 3. 10 The usefulness of mandatory items and voluntary items ............................... 111
Table 3. 11 The usefulness of mandatory and voluntary items in section and sub-section in
MR .................................................................................................................................... 112
Table 4. 1 Companies under the investigation .................................................................. 119
Table 4. 2 Collected MRs over the years under investigation .......................................... 121
Table 4. 3 The disclosure level in MRs under both old regulation and new regulation ... 123
Table 4. 4 Comparing the usefulness and the disclosure level of MR’s sections and
subsections ........................................................................................................................ 125
Table 4. 5 Summary of drivers of disclosure level in MR ................................................ 136
Table 4. 6 Descriptive statistics of independent and control variables in the regression
model ................................................................................................................................. 137
Table 4. 7 Pearson correlation ........................................................................................... 137
Table 4. 8 OLS regression model on the aggregated disclosure in MR ............................ 139
Table 4. 9 OLS regression on the level of disclosure due to its type in MR .................... 144
Table 4. 10 OLS regression on the disclosure on different sections and subsections of the
MR .................................................................................................................................... 150
Table 4. 11 Summary of results of OLS regression models ............................................. 151

10
LIST OF ABBREVIATIONS
AICPA The American Institute of Certified Public Accountants
ASA The Egyptian Accountability State Authority
ASB Accounting Standard Board
CA The Egyptian Companies’ Act 159/1981
CAO The Egyptian Central Auditing Organisation
CMA The Egyptian Capital Market Authority
CSR Corporate Social Responsibility
e.g. exempli gratia (for example)
EGX Egyptian Capital Market (Egypt Exchange)
FA & I Financial Analysts and Institutional Investors
FASB Financial Accounting Standards Board
FLPD Forward-Looking Performance Disclosure
FRA The Egyptian Financial Regulatory Authority
IASB International Accounting Standards Board
ICAEW The Institute of Charted Accountants of England and Wales
IFRS International Financial Reporting Standards
KPIs Key Performance Indicators
MD&A Management Discussion & Analysis
MC Management Commentary
MR Management Report
OLS Ordinary Least Squares
SOX Sarbanes-Oxley Act
UAS The Egyptian Uniform Accounting System
UK United Kingdom
US United States

11
THE USEFULNESS OF MANAGEMENT REPORT ON
INVESTMENTS DECISION-MAKING IN EGYPT
INTRODUCTION
In the stock capital markets, every listed company has to present the financial annual
report that illustrates its performance and financial situation to external users. As a part of
the annual report, the financial report represents the main financial statements and their main
notes, which were prepared in accordance with the requirements of the accounting
standards. Patel and Dallas (2002) argue that the current practice of accounting reporting
includes preparing the financial reports in compliance with a set of standards with limited
disclosure requirements, while many important nonfinancial information are unrequired to
be included in the financial report. Therefore, an additional narrative report, “The
Management Report”, is required to be disseminated along with the financial report. The
increased criticisms on the content of the financial report have highlighted the important
role played by the management report (hereafter, MR) as a complementary document that
covers the weakness of the financial report, particularly in matching the needs of both the
investors and financial analysts (Hüfner 2007). Therefore, MR focuses on narrative
information; as it includes different kinds of information e.g., operations, risks, key
performance indicators, forward-looking performance (Clarkson et al. 1999). The
usefulness of information provided in the MR has been questioned recently, after the
financial crisis in 2008, with suggestions that the disclosure is incompatible with users’
needs of information in making risk evaluations and investment decisions (Caplan and Dutta
2016). However, according to other authors, there is lack of studies on this issue, especially
after the financial crisis (Ballwieser 2004; Hüfner 2007).
The regulatory bodies and standards setters have played vigorous efforts to improve
the quality of the information disclosed in MR. Indeed, in The U.S., Sarbanes-Oxley Act
(SOX) demanded drastic changes to the content of annual reports with forcing listed
companies to provide more information in their annual reports, under the Management
Discussion and Analysis section (Sarbanes-Oxley Act, 2002, sections 401:409). In addition,
the Securities and Exchange Commission (SEC) added new requirements under the
Regulation S-K 303 to increase the trust and the usefulness in the information disseminated
by the companies in order to make the annual reports more comprehensive. Regulation S-K
303 aims to increase the disclosure on different kinds of information, such as liquidity,
forward-looking performance, and the internal control disclosure (SEC 2003; Hüfner 2007).

12
Likewise, in the UK, wide amendments were made in the Companies Act in 2013 as
precaution against any financial crisis. According to the new changes in this Act, all listed
companies have to prepare a new report called “the strategic report”, as a separate part of
the directors’ report, which is affected also by the Corporate Governance Code disclosure.
For example, the listed firms in London Stocks market must report its future strategy, risks,
employees, corporate social responsibility (CSR), and environmental disclosure. Specific
sections of these requirements must be disclosed in the board of directors’ report, while the
remains must be included in the strategic report (FRC 2012). Furthermore, in 2010, the
International Accounting Standards Board has issued guidelines that represent useful and
comprehensive information in the management commentary. All these efforts reflect the
high concern given to the role that MR plays in enhancing investments decisions.
Many studies on accounting disclosure suggests that MR is a useful source of
information for investments decision-making compared to other sections in the annual
report (e.g., Barron et al. (1999); Tavcar (1998)). This is mainly because MR represents a
variety of information that covers several issues related to the firm’ performance and any
going concerns. However, so far, evidence regarding the usefulness extent of MR is still
inconsistent.
On one hand, some studies documented that MR has a moderate or slight relevance
for investors (e.g., Anderson (1981); Anderson and Epstein (1995); Baker and Haslem
(1973); Bartlett and Chandler (1997); Hines (1982); Lee and Tweedie (1975a);Wilton and
Tabb (1978)). On the other hand, some studies provided evidence suggesting that the value-
relevance of the financial information has decreased by time, while non-financial
information has become more relevant to the users (e.g., Bartlett and Chandler (1997);
Beretta and Bozzolan (2004); Robb et al. (2001). For example, Orens and Lybaert (2007)
reported that the accuracy of the financial analysts’ forecasts is positively associated with
the extent of non-financial information availability. However, many previous studies mainly
attempted to test the usefulness of MR against the market model, supposing that the
usefulness of information will be reflected automatically on the securities prices. Instead,
users’ views, in this matter, remain underexplored.
Furthermore, the majority of the studies that were conducted in the developing
countries show how several differences related to the legal and cultural environment can
exist in the developed countries (e.g., Acedo-Ramírez and Ruiz-Cabestre (2014); Antonczyk
and Salzmann (2014); Belkhir et al. (2016)). For example, Perera (1989) referred to the

13
effect of cultural differences between developed markets and emerging markets; therefore,
empirical evidence from the developed countries may not be applicable to the emerging
ones (Dahawy et al. 2002; Gray 1988). The current study aims to address this gap in the
literature with giving the financial statements’ users the opportunity to say what they think
about the content of the MR. As far as we know, there has not been any previous study that
aimed to investigate the usefulness of MR from the users’ standpoint in Egypt, as an
example of an emerging market.
This market is distinguished by two features, which may prevent the generalization
of the prior research. Firstly, it is a relatively less efficient market compared to the developed
markets (Allini et al. 2018). Secondly, as Egypt has a civil-law system, the information
asymmetry is more stringent than it is within the developed markets (Ebaid 2009; Eldomiaty
and Ismail 2009). La Porta et al. (2006) found that the common-law based-countries oblige
the companies to disclose more information than the civil-law based-countries, which
increases the markets’ transparency.
In Egypt, the MR is a mandatory report and it includes information basically
regarding corporate governance structure, firms’ past and future performance, risks, and
sustainability. This report is subject to two different regulations; the Companies’ Act
(159/1981) and the 2002 listing rules in the Egyptian Stock Market (hereafter, EGX).
Consequently, the MR is an official tool to disclose mandatory financial and non-financial
information, in addition to any voluntary disclosure. The Egyptian Financial Regulatory
Authority (hereafter, FRA) has realized the increased importance of the MR as an effective
tool in enhancing transparency and, in particular, attracting domestic and foreign investors.
Thus, in January 2014, new listing rules have been issued by the FRA to replace the old
ones that were issued in 2002. The new regulation added new mandatory information
requirements. This information is integrated with other mandatory disclosure required by
the Regulation of the Companies’ Act (159/1981) on operations, forward-looking
performance, and corporate social responsibility (CSR).
Since the new regulation requires disclosing more information comparing with the
previous version, it is expected that the usefulness of MR in decision-making is improved.
However, this expectation requires empirical evidence, which the current study aiming to
achieve. This study aims to explore whether financial analysts and institutional investors
(hereafter FA&I) perceive the information provided by Egyptian listed firms in the new MR
to be useful for their investments decisions. More specifically, this study focused on FA&I,

14
as they are the primary users of the accounting information. This study adopts mixed
methods to investigate the usefulness of MR in the Egyptian market; we employed a survey-
questionnaire and an analysis of the content of MR over a period (before and after switching
to the new listing rules) to present a rigorous comparison between what the users need and
what the practical disclosure in MR provides. In addition, in order to investigate the effect
of firm-characteristics on the volume of information disclosed in MR, if any, a regression
model based on content analysis was undertaken.
This study provides two main contributions to the knowledge. First, while prior
studies have focused on the usefulness of the MR in the developed markets (especially in
US), this study represents the first investigation made on the perceived usefulness of the
MR content in an emerging market. Second, prior studies have focused mostly on the
usefulness of several sections of the annual report, whilst this study provides greater
understanding about the usefulness of the different kinds of information included in the MR
in particular. Our investigation can add to the body of knowledge in the voluntary disclosure
theory by providing the users’ views. More specifically, this study addresses the gap in the
literature regarding giving the opportunity to the financial statements’ users to say what they
think about the content of the MR.
Furthermore, the current study provides two practical contributions. Findings of this
study should be considered by regulators in order to improve the current weaknesses of the
disclosure to meet the users’ information needs. What should be noted is that this study can
also benefit other emerging markets that have similar cultural, social, and economic features
(i.e., Middle-East region and North African countries). Thus, our results could also be useful
for the managers and accountants in encouraging them to increase the degree of voluntary
information that is perceived to be useful by investors.
This thesis is structured in four chapters as follow;
First chapter explains the most relevant theories in illustrating the usefulness of
accounting disclosure from the users’ perspective; Accountability theory, and Decision-
Usefulness theory. The chapter also provides a review on the literature of the usefulness of
information, while distinguishing between studies in the developed markets and studies in
the emerging and developing markets. It could be argued that the majority of prior studies
focused on assessing the usefulness of different sections in the annual report through asking
the users to indicate the impact of every section on investments decision-making.
Furthermore, empirical evidence from these studies indicates that most users disagree on

15
the usefulness of annual report’s sections, which means that these sections have different
levels of usefulness in making economic decisions. However, the evidence regarding the
usefulness of the narrative sections in the annual reports is full with mixed results, which
can considered a research gap to be filled by an evidence from an emerging market in the
current study.
The second chapter focuses on the management report. First, the definition and
importance of MR are presented, in addition, the role of MR as a complement to the financial
report is highlighted. Previous literature suggests that the role of MR in enhancing the
accounting disclosure has significantly increased, particularly after the financial crisis in
2008. Second, this chapter also discusses the main elements that should be considered in
MR based on the views of regulatory bodies in developed markets such as the UK and the
U.S, in addition to the framework on management commentary presented by IASB in 2010.
Then, we examine the essential kinds of information that are required/suggested to be
disseminated in MR, while comparing that information with the requirements of the
Egyptian regulation. This comparison showed that the mandatory disclosure in MR in Egypt
still far from its counterparts in the developed markets and the IASB’s framework. Finally,
the research questions were developed and a full description of the Egyptian context has
been presented.
According to the previous review, this thesis aims to investigate the usefulness of
MR through examining three research questions covering three main aspects:
- The perceived usefulness of MR as a complement to the financial report;
- The perceived usefulness of the different kinds of information provided in MR; and
- The perceived usefulness of mandatory disclosure and the suggested voluntary items to be
disclosed in MR.
The chapter concludes with addressing a gap between the regulation requirements
and the users’ needs of information.
The third chapter is devoted to the research design and collecting data regarding the
users’ perceptions. A questionnaire survey is designed; it includes thirty-nine financial and
nonfinancial information divided into eight sections and sub-sections, in addition to eight
general information on MR. The sections and sub-sections namely are Ownership Structure,
Board Structure, Audit Committee, Risk Management and internal Control, Key
Performance Indicators, Changes on Fixed Assets, Forward-Looking performance, and CSR

16
and Environmental performance. The financial analysts (hereafter FA) and institutional
investors (hereafter I) have been chosen as two user-groups who are targeted by survey.
Results of chapter three revealed that FA&I consider that the new regulation has
improved the disclosure in MR slightly, and that they still of need more information in order
to be able to make investment decisions. Especially, results documented that information on
ownership structure, internal control and risk management, forward-looking performance,
and financial performance indicators are perceived useful or very useful, while information
on CSR is a less important section. Surprisingly, the ownership structure is ranked first by
both user-groups, which suggests that the political connections of the blockholders may
affect the firm performance and market prices as it is suggested by Maaloul et al. (2018).
The findings confirm that some mandatory information is perceived of moderate usefulness,
while several individuals indicated that voluntary information is of high usefulness. These
findings also highlight the shortcoming of the new regulation in determining the content of
the MR.
At last, Chapter four focusses on measuring the disclosure level provided in MR.
This chapter aims to present two different empirical evidence regarding that matter. The
main objective of this chapter is to compare the disclosure level under both the old
regulation and the new one and identify to what extent the new regulation has increased the
volume of information in MR. Then, the chapter represents a comparison between the users’
needs, that were concluded from chapter three, and the actual disclosure practices in MR.
This comparison aims to highlight the level of coherence between the users’ needs and what
the listed companies provide in their MRs. Therefore, a disclosure index is performed using
the same items included in the survey in chapter three, which includes thirty-nine items. The
sample of collected management reports included only MRs issued by the nonfinancial
listed companies for five fiscal years from 2011 to 2016, while taking into consideration the
exclusion of 2013. The final sample included 782 report-year of which have been collected.
The findings illustrate that the disclosure level in MR has increased significantly
under the new regulation issued in January 2014. The level of mandatory disclosure
increased from 17%, under the old regulation, to 76%. Despite this major improvement in
the disclosure level, this finding indicates a weak commitment to the regulations’
requirements. Furthermore, the disclosure on the suggested voluntary items is very weak
and doesn’t exceed 9.3% under the old regulation, while this level has decreased again,
when switching to the new regulation, to only 8%. The disclosure on the very useful items

17
recorded 39%, while that on the moderate useful items recorded 35%, which suggests that
more efforts still needed to enhance usefulness of the MR’s content. To summarise, the
current disclosure in MR does not provide enough useful information to the users.
Secondly, a linear regression model has been designed to examine any effect to firm-
characteristics on the disclosure level in MR. The regression model included the disclosure
level as a dependent variable, and five independent variables; Ownership structure, Cross
listing, Industry sector, Age, and Size, and three control variables; the Regulation type,
ROE, and Leverage. The results revealed that the ownership structure (the presence of state-
ownership), cross-listing, and the industry type all have significant impact on the overall
disclosure level in MR. Other regression models were also developed in order to identify
the effect of firm-characteristics on mandatory and voluntary disclosure, disseminating
useful information, and disseminating moderate useful information. As well as, a regression
model was employed to investigate what drives the disclosure on every kind of information
in MR.
The last section of the thesis is devoted to make conclusions on the research.

18
CHAPTER ONE: The Usefulness of Accounting Information: Overview
1. 1 Introduction
The accounting disclosure is an essential tool to provide information to the external
parties. The need of information emerges from the uncertainty condition that probably
should be reduced by the disclosure (Wagenhofer 2004). Therefore, the disclosure increases
the user’s ability to better understand and assess the firms’ performance and risks. Both of
the disclosure literature and the professional bodies support a common thought that the
investors are the main users of the accounting reports (Elliott and Elliott 2011).
Understanding the accounting disclosure from the users’ aspect is an important issue that
can indicate the success of the communications made between the entities (via their reports)
and the users (through knowing how they perceive these reports).
The users’ views about the entities’ disclosure depend on the purpose behind using
the information. In that point, there are two primary objectives of the financial reporting,
the accountability and decision-making. Each objective is considered as independent
theoretical approach that is can be used in assessing and explaining the users’ needs of
information. This chapter presents a discussion around these objectives and highlights the
theoretical framework of the current study, in addition to developing the research questions.
1.2 Framing the Accounting information
In the users’ perceptions strand, a theory helps in understanding and explaining why
the disclosure on specific information is important to the users and the effect of a specific
information on the users’ decisions. Understanding the importance of accounting
information correlates primary with the purpose of using it, which also indicates why some
information is needed, while other information is considered less important or even useless.
According IFRS’s framework (IFRS 2018), the financial reporting is the most important
tool that is available to the vast majority of the investors, lenders, and creditors. As it known,
many of these parties do not have the prerogative to demand the entities to disclose specific
information directly; instead, they depend heavily on the general-purpose reports.
Therefore, IFRS’s framework considers that the essential objective of the accounting report
is to provide useful information to these parties (IFRS 2018).
The usefulness is the primary objective of the accounting information, whatever the
purpose of using this information was. The usefulness means that the external users desire

19
adequate and understandable information that covers the firm’s performance. Indeed, the
financial report provides information about the entity to the contracting parties and the
current, potential, and other shareholders as well. Ballwieser (2004) argues that the
accounting reporting highlights the firm performance and future planning, this manner,
however, indicates the management’s accountability and enables the investors and the
lenders to make their investments’ decisions. However, the importance of providing useful
information is not only limited to the direct investors and lenders, but it also extends to their
advisors too (FASB 1978).
In the disclosure literature, the debate on the main objective of presenting the
accounting reports still unresolved; whether it would be the decision usefulness,
accountability (Stewardship), or both together. In an interview-based study, Hjelström et al.
(2014) document that financial analysts find that the accounting reporting is useful in
making investment decisions, which means that they consider the decision-usefulness to be
the main objective of representing accounting information. While, others think that the
content of the accounting reports differs depending on the objective of presenting them (i.e.,
for decision-usefulness or for accountability) (Ijiri 1983). However, Cascino et al. (2013)
argued that both objectives should be considered in the preparation and representation of
the accounting reports. While the accountability objective focuses more on the information
related to the past performance and transactions, decision-usefulness objective requires
more information on the forward-looking performance (Cascino et al. 2013).
However, the main purpose of using the accounting information seems to be variable
by the time. Indeed, according to the IASB’s conceptual framework, the accounting report
has several objectives, but the priority concerns are always on providing useful information
that helps users make economic decisions, and on enhancing the management’s
accountability to the investors (IFRS 2018). Each of these objectives has a theoretical
background that helps in explaining the relevance of the accounting information based on
the purpose of using it. Therefore, choosing a specific theory in the disclosure research is
very important because this theory will influence the structure of the study, the design of
the relevant methods, and the explaining of the final findings.
Collison et al. (1993) explain the relationship between the understanding and
analysis of the annual report on one hand, and the specific purpose of them on another as
follow:

20
“Any deductive analysis of financial reporting ideally starts with specification
of the purpose that financial statements serve. Such specification is
problematic, because there appear to be two major alternatives, which could
generate different analyses and conclusions. These are "decision usefulness"
and "accountability". The latter might be alternatively described as
"control" or "stewardship".
The next section discusses the two common theories in the usefulness of accounting
disclosure studies; the accountability (stewardship) theory and decision-usefulness theory.
1.3 The Accountability theory
The roots of accountability “stewardship” theory are inherited in psychology and
sociology research, as its main concern is on the human behavior that takes place when one
person manages the utilities of others (Davis et al. 1997). Hence, the main aim of the
accountability approach is to improve the efficiency of the contracting agreements. The
accountability is used as a means to justify the behaviors of one party to another, according
to the responsibility principle. In other words, the true accountability means that the first
party is believed to be responsible for the second party's interests, and that all the decisions
and the outcomes, of these decisions, should be presented fairly to the other party in order
to aid it in assessing the efforts carried out by that first party (Lerner and Tetlock 1999;
Vance et al. 2015). A number of scholars define accountability as “a process in which a
person has a potential obligation to explain his/her actions to another party who has the right
to pass judgment on those actions and to administer potential positive or negative
consequences in response to them” (Vance et al. (2015), p: 347).
In the fields of accounting and finance, accountability is a common concept that
refers to organizing the agreements between the managers and the investors. In a joint-stock
entity, the owners, as principles (accountee), have the right to elect managers, as the
stewards (accountor) (Gray et al. 1991; Ijiri 1983). On the one hand, the owners delegate
the management of the entity’s assets and resources, and, in return, they expect that the
managers will do their best to make returns on the shares, as well as, to safekeep and
maximize the entity’s value in the mid-term and long-term. On the other hand, the
management’s responsibilities include protecting the enterprise’ resources and setting
strategies and plans to guarantee more resources to face the unfavorable economic
fluctuations (FASB (2006): OB27).
21
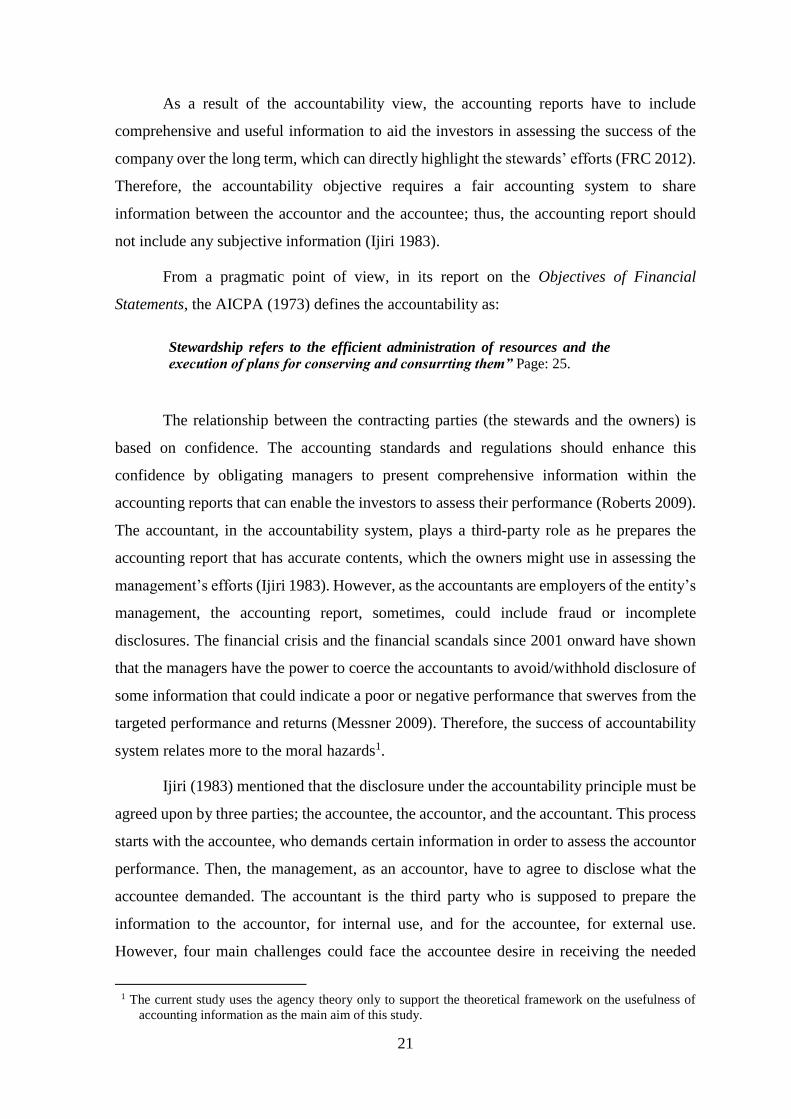
As a result of the accountability view, the accounting reports have to include
comprehensive and useful information to aid the investors in assessing the success of the
company over the long term, which can directly highlight the stewards’ efforts (FRC 2012).
Therefore, the accountability objective requires a fair accounting system to share
information between the accountor and the accountee; thus, the accounting report should
not include any subjective information (Ijiri 1983).
From a pragmatic point of view, in its report on the Objectives of Financial
Statements, the AICPA (1973) defines the accountability as:
Stewardship refers to the efficient administration of resources and the
execution of plans for conserving and consurrting them” Page: 25.
The relationship between the contracting parties (the stewards and the owners) is
based on confidence. The accounting standards and regulations should enhance this
confidence by obligating managers to present comprehensive information within the
accounting reports that can enable the investors to assess their performance (Roberts 2009).
The accountant, in the accountability system, plays a third-party role as he prepares the
accounting report that has accurate contents, which the owners might use in assessing the
management’s efforts (Ijiri 1983). However, as the accountants are employers of the entity’s
management, the accounting report, sometimes, could include fraud or incomplete
disclosures. The financial crisis and the financial scandals since 2001 onward have shown
that the managers have the power to coerce the accountants to avoid/withhold disclosure of
some information that could indicate a poor or negative performance that swerves from the
targeted performance and returns (Messner 2009). Therefore, the success of accountability
system relates more to the moral hazards1.
Ijiri (1983) mentioned that the disclosure under the accountability principle must be
agreed upon by three parties; the accountee, the accountor, and the accountant. This process
starts with the accountee, who demands certain information in order to assess the accountor
performance. Then, the management, as an accountor, have to agree to disclose what the
accountee demanded. The accountant is the third party who is supposed to prepare the
information to the accountor, for internal use, and for the accountee, for external use.
However, four main challenges could face the accountee desire in receiving the needed
1 The current study uses the agency theory only to support the theoretical framework on the usefulness of
accounting information as the main aim of this study.

22
useful information. The first challenge relates to the accountor’s willingness to disclose
what the accountee needs, which is considered a moral issue. The second challenge relates
to the capability of the accounting system to produce information that typically matches
with what the accountee requires, which is considered a technical accounting issue. Third,
the accountee right to know information is not always guaranteed especially if the accountor
believed that disclosing such information can threaten the privacy of the company or its
competitive benefits (Ijiri 1983). Lastly, identifying who the accountee is/are is, in itself, a
dilemma. More specifically, the accountee concept can be a wide one that includes all the
shareholders, even those who own one single share, while it can also refer to the
blockholders who have the interest or the power to question the managers. These challenges
should be considered by both the accountee and the accountor.
Since the managers are the ones to decide what information to be disclosed, the
accounting report should include information that reflects their efforts in achieving profits
and growth, which can influence the users’ ability to favorably assess the stewardship and
management performance (FASB (2006): OB27). To achieve this goal, the accounting
report should provide enough information to answer several clear questions such as: Are the
assets protected? Were the plans achieved? Did the plans affect the performance positively?
Are the returns reasonable? How the entity will expand its activity in the future? (Elliott and
Elliott 2011). The answers to these questions help the investors in evaluating the
management’s efforts. Therefore, the owners can decide whether the managers are trusted
stewards and can lead the enterprise successfully, or there is a necessary need to replace the
current management very soon.
It could be argued that the major conflict in the accountability system takes place
when the managers decide to avoid disclosing useful information to the accountee. Ijiri
(1983) argues that disclosure for accountability purposes does not necessarily mean that the
management disseminates all information the owners require. Furthermore, the stewards can
avoid the disclosure on specific information when this information threatens the interests of
the management regardless of the usefulness of that information for the owners (Ijiri 1983).
Respecting the managers’ interests in that way puts their interests over the interests of the
owners, who entrusted the managers to control the entity hoping that they will lead it to
better performance and growth. However, the claim of giving the managers the right to
determine what information will or will not be disclosed is still a problematic issue; since,

23
this notion would provide a loophole to the managers to protect their interest even if it would
be against the interests of the entity that they work for.
Consequently, to establish a successful accountability system, the regulatory bodies
should adopt more strict rules that protect the accountants and auditors and prohibit any
managerial fraud. Ijiri (1983) also suggests that building accountability-based framework
should include both the accounting reports and the accounting records, which help in
verifying the independence of the accounting information. Indeed, the British Companies
Act takes into consideration the special type of relation between the owners (the investors),
and steward (the management) (Elliott and Elliott 2011). This act enforces the managers to
disclose information that would help the owners in assessing the steward decisions
regarding the firm’s resources, and whether the steward’s strategy considers any going
concern or not.
More recently, Lennard (2007) claimed that the debate about the accountability
approach should be steered toward a different matter. While the traditional view that the
accountability focuses on assessing the stewards’ performance and protecting the resources,
Lennard 2007 (p.52) suggests that the accountability should be seen as “the provision of
information that provides a foundation for a constructive dialogue between management
and shareholders”. As the traditional thought focuses on the accountability role as a control
mechanism that utilizes the voting rights to change the management, the modern form of
the accountability focuses on the conservations between the investors and the management
regarding the risks, opportunities, strategies, and corporate governance, which means that
the owners can play an important role in presenting valuable suggestions and advices to the
management (FRC 2012).
1.4 Decision-Usefulness Approach
The decision-usefulness approach states mainly that the disclosure affects the
shares’ prices in the capital markets (Scott 1997). This effect, generally, comes from the
messages that the users perceive by reading and analyzing the accounting report. The
process of reading and analyzing the report depends on some factors which includes: a)
Whether the report provides enough and clear information?; b) What is the general trend on
the entity’s performance? ; c) Are the same conditions will continue in the future?; and,
probably the most important factor, d) Is the user qualified to understand the messages that
can be concluded from the report?. This means that making the right decisions requires

24
providing information that has a significant influence on the user’s perception, which should
be reflected on making the decisions of buying, selling, or holding the shares or the bonds.
According to Edwards (1989) and Scott (1997), the decision-usefulness has become
the prevalent approach in accounting research since 1968. This could be due to the rapid
changes in the business environment in the last five decades; for example, the following
changes (e.g., AICPA (1994); Elliott and Elliott (2011); FEE (2015); Hjelström et al.
(2014)) can be noted :
- The wide prevalence of the joint-stock firms and the existence of some foreign
investors who cannot attend every year’s general assembly yet they desire
information to make investment decisions.
- The increased complexity in the business environment has reflected on the users’
needs to know some information about the challenges and the opportunities.
- The growth of the entities’ activities and its effect on the society has attracted new
users-groups who seek additional types of information.
- The rapid spread of the new technology, and its effect on reducing the costs of
producing and publishing the accounting report.
- Many potential investors and creditors now desire more information to help them in
understanding the entity’s current performance, and to what extent the performance
will be changed in the future.
Furthermore, the development in identifying the users-groups who use the
accounting reports has reflected on the rethinking of the main objective of presenting the
accounting report and how to increase the usefulness of its content. Unlike the accountability
approach that adopts a narrow concern limited only to the owners, increasing the usefulness
of the accounting report aims to serve the needs of several users-groups. Despite that the
decision-usefulness gives priority to the investors’ viewpoint as it enables them to make
right investment decisions (Elliott and Elliott 2011), it also helps other user-groups in
receiving a more relevant information compared with the accountability approach. For a
share/bond holder, useful information enhances his understanding regarding the future of
the company that he/she invests money in. Such information is useful too for the prospective
investor who desire to make an investment decision based on true information which enables
him to evaluate, for example, whether the company X or the company Z would be the best
choice. Thus, the decision-usefulness has a wide range of aims that make the trading of

25
shares and bonds to be more transparent. Accordingly, the accountability has become less
important objective compared with the that of the decision-usefulness, as a reference in
presenting the accounting reports (Elliott and Elliott 2011).
The above-mentioned changes in the business environment have been also reflected
on the accounting bodies by making them focus more on the efficiency of accounting
disclosure in serving the users’ needs to make better investment decisions. Several efforts
were carried out to improve the quality of the accounting report as the main vehicle of
transferring information from the entity to the external users. Indeed, The American Institute
of Certified Public Accountants (AICPA) issued its report of the “Objectives of financial
statements” in 1973 (also known as Trueblood report). This report has helped replacing the
main objective of the accounting report from the accountability to the decision-usefulness
(Son et al. 2006); since it states that:
The basic objective of financial statements is to provide information useful
for making economic decisions. AICPA (1973): p.13.
In 1994, AICPA undertook a study on investors and creditors needs of information,
which aimed to assess whether the disclosure in accounting reports meets the users’ desires.
The results showed that the financial report does not include all the information needed by
the users, and that additional information is still required to help them in making investment
decisions (AICPA 1994). These efforts by AICPA were directed toward the maximization
of the usefulness of accounting information and the assurance that the users’ needs are
considered to the maximum extent.
Furthermore, in their common framework, IASB and FASB concluded that the
decision-usefulness is the main objective of the accounting reporting, as it states that:
“The objective of general purpose financial reporting1 is to provide financial
information about the reporting entity that is useful to existing and potential
investors, lenders and other creditors in making decisions about providing
resources to the entity. Those decisions involve buying, selling or holding
equity and debt instruments, and providing or settling loans and other forms of
credit.” (FASB 2010; IASB 2010a) Paragraph OB2
However, the Financial Reporting Council (FRC) in the UK recognises the duality
of the accounting report objectives; the decision-usefulness and the accountability. Despite

26
the slight different view of FRC, the decision-usefulness objective comes first, which makes
it a higher priority than the accountability objective. It states:
“The purpose of the annual report is to provide shareholders with relevant
information that is useful for making resource allocation decisions and
assessing the directors’ stewardship” FRC (2014): Paragraph 3.2
The IFRS foundation issued its latest framework in March 2018 emphasising that
the accounting report have to include useful information for investment decisions. In this
view, managers of any entity’s should not prepare the accounting reports while considering
the needs of current investors only, but they should consider the needs of the potential
investors who read these reports to make investment decisions as well (IFRS 2018). It is
therefore a rational proposition that a company that disseminates higher volume of useful
information is likely to attract more investors than the company that discloses the minimum
volume of information, assuming that the profits of both companies and other surrounded
conditions are close.
Till now, there have not been agreed-upon criteria to identify the extent to which the
accounting report is useful. The recent accounting standards (e.g., standards issued by IASB/
IFRS, and FASB) have expanded the requirements of disclosure in the financial report. This
expansion in the accounting report means that it would include more pages, which might
distract the readers with its immense information and, therefore, might negatively affect the
usefulness of its content (Hjelström et al. 2014). It is true that high a volume of information
would involve more declaration on the items included in the financial report; however, a too
long report is a real challenge to its readability. FRC calls this case as “Clutter”, which
means that the users cannot acquire a useful information despite that the accounting report
includes much of it (FRC 2011). To this point, we believe that more research on the users’
needs can help both the standards setters and regulators to identify the useful information
and how to highlight it in the accounting report in order for it to be more interesting and
readable to the users. Moreover, different levels of usefulness of information indicate that
the users have priorities in their needs, and the accounting system should present at least all
information that is seen as more useful to the users. Generally, The framework of accounting
standards addresses that the users are the target of accounting reporting, therefore, standards
setters should assure that the users’ perceptions are considered (Harding and McKinnon
1997), which enhances the role of accounting disclosure in economies.

27
1.5 Reviewing the relevant literature regarding the users’ perceptions on the
usefulness of the annual report
The users’ perceptions regarding the usefulness of the disclosure have been
increasingly investigated during the last four decades. This trend has appeared as a new one
during the seventies of the last century in the studies of Baker and Haslem (1973), Chandra
(1974), and Lee and Tweedie (1975a), (1975b) where the researchers tried to explore the
decision-usefulness of the annual report’s sections in the eyes of its users, whereas MR had
taken place as one of these sections. However, many studies in the developed countries later
followed this trend and tried to compare their findings with others in order to highlight what
should the annual report comprise to be useful to its users. On the other hand, in the
emerging markets, an overdue attention was given to the exploration of the users’
perceptions when Wallace (1988) presented his investigation in Nigeria. Nevertheless, led
by the raised competition, the enormous development in technology, and the spread of the
join stock entities, huge changes were noted in the user’s needs of information in evaluating
investment decisions (AICPA 1994).
In the last two decades, some scholars have focused more on asserting the usefulness
of the management report, as a separate section in the annual report. In their viewpoint, MR
have several more information which are more recent than in the financial report’s content
(Clarkson et al. 1999; Hüfner 2007).
Following this argument, the current study seeks to elucidate the most relevant
studies of which are in line with the current study aims. Two main categories of prior studies
can be distinguished; the first category focuses on the studies in the developing and
emerging markets, while the second category includes studies in the context of developed
countries.
1.5.1 The Studies in the Developing and Emerging Markets
One of the foremost studies in the less developed markets regarding the usefulness
of the annual report was carried out by Wallace (1988) in Nigeria. Wallace investigated the
viewpoints of six user-groups; namely, chartered accountants (individuals who are likely to
be accountants and prepare the annual reports for the listed firms or for external auditors),
investors, financial managers, senior civil servants, financial analysts, and a group of some
professionals in several fields. Using a survey questionnaire, 1200 users were invited to fill
the survey; however, the collected usable responses were 485. The questionnaire consisted

28
of 109 items, and the respondents were asked to scale the usefulness of every item. The
results revealed that the accountants showed low agreement with the other users’ groups,
which could be an evidence of a gap in the perception of the usefulness of the information
between the prepares and the other users. However, that study focused mainly on examining
the consensus between the users’ groups rather than investigating the usefulness of the items
itself.
In the Middle East, Solas and Ibrahim (1992) undertook a comparison study between
the users’ perceptions in Jordan and Kuwait. Solas and Ibrahim prepared a questionnaire
included twenty-three financial information and distributed it on two user-groups; the
institutional investors and the individual investors. The number of the returned
questionnaires were eighty-nine out of 218 in total distributed. The respondents were asked
to indicate the reliability of every piece of information in the questionnaire and its effect on
their investment decisions. The findings showed that the Kuwaiti investors find that the
questionnaire items are less useful and reliable than what the Jordanian investors think.
However, this study had many limitations. First, they made absolute comparison between
the Kuwaiti investors and the Jordanian investors, without classifying them into institutional
investors and individual investors; they neglected to make any comparison between the two
users’ groups within each country as an in-depth investigation. Second, it focused only on
the financial disclosure, while the nonfinancial information sections were completely
ignored. Finally, the authors did not arrange the items according to its usefulness, which, if
they did, could have helped in identifying the most important items to the users.
Ibrahim and Kim (1994) also used a questionnaire survey that included forty-two
items in order to explore the discrepancy level between four user-groups in Egypt (as cited
in Alrazeen, 1999). The user-groups included the investors, financial analysts, managers,
and accountants. The results showed that the consensus level was around 57% within the
entire groups, while the highest agreement was between the accountants and the managers
(67%). Furthermore, the lower consensus percentage was between the investors and the
financial analysts with only 26%. Despite that the findings of this study reflected high
degree of dispersion between the users, it did not focus on the usefulness of the items in
general. Furthermore, the study did not present any suggestion to improve the disclosure
usefulness or the items that recorded high consensus between the users in general.

29
Abu-Nassar and Rutherford (1996) investigated the perceptions of five external
user-groups to the financial reports in Jordan. The groups they included in the study were
the individual investors, institutional investors, bank loan officers, stockbrokers, and the
academics. Abu-Nassar and Rutherford used a questionnaire survey and distributed 463
questionnaires, while the returned were 224. The results showed that the individual investors
indicated less importance to the annual report than the other groups. The authors explained
this as a reflection to their, the individual investors, lack of accounting knowledge.
Moreover, out of eight sections in the annual report, the respondents chose MR as the third
most section in to be understood; while, MR was ranked eighth in the readability, relevance,
and reliability.
In Saudi Arabia, Al-Mubarak (1997) investigated the usefulness of the annual report
from the investment analysts’ point of view. He carried out a questionnaire survey. His
sample included 249 investment analysts and the collected questionnaires were only 126.
The respondents were asked to scale the usefulness of seven sections in the annual report.
The results showed that MR was ranked as the least useful section. In addition, the findings
suggested that 51% of the respondents have some doubt about using the annual report
information in making the investment decision, which refers to the lack of transparency and
communications between the firms’ management and the users. Interestingly, Al-Mubarak
asked the respondents to mention the information that were not mandatorily disclosed yet
has high usefulness and effect on their investment decisions. He concluded that that the
respondents seek more disclosure on the future returns and growth. These findings represent
another evidence on the ambiguity of MR content, which is clearly different from country
to another due to the domestic regulations.
Almahmoud (2000) carried out another study in Saudi Arabia. While Al-Mubarak
(1997) focused on one user-group, Almahmoud investigated the usefulness of the annual
reports’ sections from the viewpoint of three user-groups; the individual investors,
institutional investors, and financial analysts. Almahmoud designed a different vesrion of
the questionnire for each use-group. The returned questionnaires were 326 questionnires out
of 680 distributed. The respondents were asked to indicate whether they well understand the
annual report’s content. The responses showed that the individual investors had some
problems in understanding the content of the reports, which supports the results of many
prior studies. However, as there was another question that measures the usefulness of the
annual report’s sections, the results indicated that MR was seen as a moderate useful source

30
of information. In a further investigation, the questionnaire included one more question to
explore how to improve the usefulness of the annual reports. The results showed that the
users seek to know more financial ratios that reflect the entity’s performance and its
financial sitiuation. At last, overall, the findings indicated some weakness in the current
disclosure in MR, meaning that if certain more information was mandatorily required to be
disclosed, at the time, the usefulness of MR would be more significant. Nonetheless, this
study sought to evaluate the usefulness of the annual report’s sections by titles only; without
asking the respondents on the usefulness of every section’s details.
Ho and Wong (2001) as well focused on the perceptions of two user-groups; the
chief financial officers, as preparers, and the financial analysts, as users. Ho and Wong
prepared two different versions of questionnaires. The first version included forty-four items
and was distributed to the preparers, while the second version included twenty-third
questions and was distributed to the users. In total, the usable returned questionnaires were
ninety-two. The results showed that the chairman’s letter and MR were seen to be moderate
useful sources of information. Furthermore, the respondents pointed out that the entities’
management try to make decisions on which items to be disclosed in the annual reports
without considering the efficiency and adequacy of this information in meeting the users’
needs. Furthermore, while the preparers believed that the current disclosure need only slight
improvements, the financial analysts require more information and believe that the current
disclosure need major reform. Nevertheless, the respondents suggested that improving the
disclosure quality cannot be done by the regulation only and that the most efficient way in
doing so would be by improving the communications between the firms’ management and
the users; via the investors’ relations, and increasing the voluntary disclosure.
In Malaysia, Rahman (2001) tried to shed the light on the accountants’ perceptions
regarding the usefulness of the annual report. He sent a postal questionnaire to 150 certified
accountants, however, the received responses were only fifty-five. The vast majority of the
respondents (85%) mentioned that the main purpose of using the annual report is to provide
advice to their clients, as 78% of them use the annual reports to make decisions regard their
clients’ investments, while 71% of the accountants use this information to manage their own
investments and decision-making. Furthermore, the respondents considered the financial
report and its notes as the most important sections in the annual report and that MR has a
moderate usefulness. Rahman indicated that the last finding would be due to the

31
accountants’ quality since they are the ones who produce the accounting numbers and
explain it in the notes.
Naser et al. (2003) tried to establish several aspects regarding the usefulness of the
annual report and the necessary characteristics that should be considered to describe it as a
useful source of information. Naser et al. surveyed eight user-groups in Kuwait; including,
the institutional investors, individual investors, bank loan officers, government officials,
auditors, financial analysts, stockbrokers, and academics. They distributed fifty
questionnaires on each user-group (400 in total) and received back 306 questionnaire in
total. Naser et al. asked the respondents about the extent that they find the annual reports’
sections to be useful, in addition to indicate the usefulness level of fifty-six items; twenty-
four mandatory and thirty-two voluntary information. The results revealed that the users
depend on the annual report information to make investment decisions and compare the
performance of the different companies within the same sector as well. However, the
individual investors were found to have some difficulties in understanding the annual
reports, therefore, they would depend more on the direct communications with the firm’s
management. Moreover, MR was ranked as third, out of four sections, in the
understandability, whereas it was considered as an important source of information and has
a high degree of creditability. The most contrasted/criticised finding of this study is the
contrast between MR importance, as it was chosen by the respondents, and the usefulness
of the voluntary items, as the users see it. The usefulness of the voluntary items showed that
the future-related information is very important; however, that information is always
disclosed in MR. This finding may reflect the low awareness of the respondents on MR
content or the regulations or/and that the firms’ mangers do not pay much care on voluntarily
providing what the users’ needs.
Still in the Arab region, Al-Razeen and Karbhari (2004) investigated the usefulness
of the annual report’s sections based on the perceptions of the users by surveying five user-
groups in Saudi Arabia. The user-groups they included were the institutional investors,
individual investors, creditors, financial analysts, and government officials. The authors
collected 303 questionnaires out of 636 that were distributed. The questionnaire included
some questions that aimed to assess the usefulness of seven sections in the annual reports.
The findings suggested that the users consider the financial statements to be more important
than the narrative sections in the annual report. However, the respondents considered that
MR has a moderate level of usefulness.

32
In Iran, Mirshekary and Saudagaran (2005) explored the usage of the information
disclosed in the annual reports. Mirshekary and Saudagaran referred to the lack of
mandatory disclosure’s requirements in Iran, which considers a barrier to the users in
evaluating the firms’ performance. The authors used a questionnaire to survey seven user-
groups; namely, bank loan officers, bank investment officers, tax officers, stockbrokers,
institutional investors, auditors, and academics. They distributed 500 questionnaires and
collected back 245 one. The results revealed that the financial statements provide very useful
information, while the other sections, including the notes on the financial statements, MR,
and the auditor report, contain less important information. However, one of the limitations
in this study is the weak consensus between many users’ groups, which makes its results
still need for deeper investigation.
In South Africa, Stainbank and Peebles (2006) conducted a descriptive study based
on a postal questionnaire. Their sample included two user-groups; the financial managers
as preparers, and the institutional investors as users of the annual reports. The responses
were 50 out of 172 distributed questionnaires. The respondents were asked to determine the
readability of twenty sections in the annual report, which would serve as an indicator to the
usefulness of every section. The results demonstrated that the preparers consider the annual
report’s sections to be less important compared to what the users think. Furthermore, the
users chose the directors’ report; the chairman’s review and the future forecasts, as moderate
useful sources of information. Nevertheless, the users considered that corporate governance
disclosure has a slight usefulness, whereas CSR and environment disclosures scored the
least means by both the users and the preparers. However, the low response rate of the user-
group (17%) makes the findings of this study to be difficult to generalise.
Alattar and Al-Khater (2008) provided another evidence regarding the usefulness of
the annual report in Qatar. Their study utilized surveys to indicate the perceptions of five
user-groups; institutional investors, individual investors, financial analysts, bankers, and
governmental officers. Alattar and Al-Khater divided the annual report into eight sections
and asked the respondents to indicate the usefulness of every section and its effect on the
investments decision-making. The distributed questionnaires were 220, while the returned
ones were 150. The findings showed that the respondents considered the chairman’s report
and MR as useful sources of information, with no significant differences between the users’
groups regarding those two sections.

33
Al-Ajmi (2009) focused on the individual investors in order to explore the usefulness
of the annual report in Bahrain, through identifying the effect of the annual report’s parts on
the investments decision-making. He sent a total of 800 questionnaires to individual
investors and received back only 341 one. Al-Ajmi asked the respondents to indicate the
usefulness of nine sections in the annual report. The results revealed that MR was of a
moderate importance. In addition, Al-Ajmi found that the future-related items are very
important and affect the users’ investments decisions.
In the Egyptian context, Hassan and Power (2009) adopted a survey questionnaire
to describe the financial analysts’ perceptions regarding the usefulness of 115 piece of
information. The authors sent the questionnaires to 200 financial analysts, but received
twenty-three responses only. Although the findings showed that the financial analysts find
the information about the entity’s future performance to be useful, the respondents also
consider the historical information to be more useful than the forward-looking performance
information. Furthermore, the results revealed that the quantitative information are more
useful than the qualitative information; as the mandatory disclosure is more useful than the
voluntary disclosure. Hassan and Power argued that these findings can be due to the low
mature level of the market and the limited disclosure requirements under the Egyptian
accounting standards. However, with a response rate of 11.5% only, the findings of this
study can still be criticised and cannot be generalized.
Kribat (2009) aimed to compare between the users’ needs and the disclosure level
in the Libyan banks’ annual reports. He first designed two different questionnaires then he
sent the first version to the preparers of the banks’ annual reports and the other to different
seven user-groups. The user-groups included the individual investors, institutional
investors, external auditors, bankers, central bank officers, tax officers, and academics.
However, the individual investors were excluded later because Kribat was not able to find
any contact details to them. Seventy-five questionnaires were sent to the preparers and 125
to the users, while the returned questionnaires were fifty-four and eighty-one respectively.
The results suggested that both of the preparers and the users consider MR as a useful source
for information, despite that the users scored it higher than the preparers did. In addition,
the results showed that the users considered that MR content is likely to be more
understandable than the balance sheet and the statement of cash flow. However, MR was
ranked as the least reliability section out of eight sections in the annual report. The author
sought also to explore the problems that shape the usefulness of the annual report. The

34
respondents indicated many weakness points in the annual reports, such as the irrelevant
information and the lack of information quantity, reliability, understandability, and
comparability. In the later stage, Kribat analyzed the annual reports of the Libyan banks for
the period between 2000 and 2006 (seven fiscal years). He prepared a disclosure index that
did not depend on the survey results. The analysis showed that the actual disclosure on the
management aspects still weak and that only less than 30% of the Libyan banks provide
information related to it. Moreover, while only few banks disclosed on its strategies and
keys of financial performance, there was no disclosure on the risks by any bank.
Chatterjee et al. (2010) also offered recent evidence on the Iranian users’ perceptions
on the voluntary disclosure by the listed firms. Chatterjee et al. used a questionnaire survey
that covered the usefulness of three narrative categories of information in the annual report;
the present, analytical and prospective related-information. The financial analysts were the
target users to run the survey; while, 51 questionnaires were collected out 60 distributed.
The results suggested that the users seek all the three types of information, but they give
higher priority to the prospective related-information that reflects the firm’s management
expectations to the future performance and the entity’s ability in creating value. Chatterjee
et. al. compared as well between the users’ needs and the Iranian entities actual disclosure.
They used the survey results in preparing a disclosure index; however, the results referred
to a diversity among the entities’ disclosure practices. The authors found that the prospective
items’ disclosure seem to be, on average, the most disclosed items, followed by the present
information, while the analytical items were the less disclosed. Chatterjee et al. argued that
the Iranian firms attempt to make balance in its disclosure to be more relevant to the
stakeholders in general.
De Zoysa and Rudkin (2010) presented the first evidence on the usefulness of the
annual report from the viewpoint of seven user-groups in Sri Lanka. The users’ groups were
accountants, executives, bankers, tax officers, academics, financial analysts, and investors.
A questionnaire survey was conducted on 575 users and the collected ones were 264. The
participants were asked to indicate the importance of eleven sections within the annual
report. The findings showed that there were significant disagreement between the users’
groups regarding the importance of eight out of ten sections. In addition, the chairman’s
report and MR were regarded as slightly important sources of information in decision-
making. However, the findings of this study can still be criticised. It measured, same like
many prior studies, the usefulness of the annual report’s sections based on titles only without

35
investigating the information types that were disclosed under every section of the annual
report.
In a recent study in Egypt, Dahawy and Samaha (2010) divided the annual report
into eight sections and surveyed the usefulness of these sections from the viewpoints of six
users-groups. The selected users-groups were as the same used in the study Mirshekary and
Saudagaran (2005). Seventy-two responses were received, out of three hundred distributed,
and the results indicated that the auditor report was the highest useful part in the annual
report, while MR had a slight useful level. However, the majority of users had difficulties
accessing the annual reports of the listed companies, since many of these companies do not
make their reports to be available online. In addition, the study highlighted that the users
were not satisfied with the requirements of mandatory disclosure. The users were seeking
information that covers the future growth and profits. Despite that the findings of this study
referred to the inadequacy of mandatory disclosure in meeting the users’ needs, the low
numbers of responses received from the users-groups makes these findings hard to be
generalised (sixteen questionnaires were the highest number of responses received from one
users-group, while some responses, from another users-group, were only of six
questionnaires)
In United Arab Emirates, Alzarouni et al. (2011) explored the usefulness of the
annual reports’ sections for making investment decisions. Through using a questionnaire
survey that included eighty-four items, eight user-groups were surveyed; namely, the
institutional investors, individual investors, governmental investors, stock market brokers,
fund managers, bank credit officers, government representatives, and professional
accountants and auditors. The participants were asked to indicate whether the annual report
is enough and sufficient in decision-making, as they were asked to assess the relying that
they make on seven different sections within the annual report. The distributed
questionnaires were 512, while the usable returned questionnaires were 395. The results
revealed that 56% of the respondents perceive the current disclosure in the annual report, in
general, as not useful. Furthermore, MR were considered as a moderate useful source of
information, as its content has a moderate level of understandability and relevance.
Alzarouni et al. used the survey results in comparing the existed disclosure in the annual
reports of the listed firms. The results showed that the current disclosure covers only 61%
of the users’ needs, which reflects a disclosure gap. Alzarouni et al. explained this gap as a
result of the weakness of the obligation made by authorities. However, the findings of this

36
study highlight some interesting aspects. Firstly, the study aimed to investigate the
usefulness of the mandatory disclosure only; surprisingly, the results referred to some
doubts about the credibility and relevance of this information, which rises some questions
about efficiency of the regulation and capital market authority. Secondly, the study showed
that the individual investors were the least group in using the annual report as a primary
source of information, which emphasise that the knowledge of the individual investors is
still weak, as many of the previous studies indicated.
Al-Maliki et al. (2015) provided another insight on the usefulness of the annual
report in Qatar using a questionnaire survey. Four-hundred questionnaires were sent to the
individual investors, while the usable returned questionnaires were 313. The participants
were asked to determine the importance of several sources of information that were common
in the financial markets and also to mention their main purpose of using the annual report’
information. The results illustrated that the financial analysts’ reports were ranked as the
first useful source of information, followed by the annual report. Related to the usefulness
of the annual report’ sections, MR is considered as of a moderate usefulness. In addition,
the respondents seek additional information on the entity’s liquidity, performance, profits,
and investments plans. However, as many prior studies, this study focused only on the
usefulness of the main sections of the annual report based on titles, without providing any
deeper analysis on the usefulness of detailed information.
Biswas and Bala (2016) also highlighted the perceptions of the individual investors
on the annual report in Bangladesh. A questionnaire survey was carried out and distributed
on five-hundred individual investors, while the authors collected only 316 that were
completed. The questionnaire aimed to rank the usefulness of eighteen sections in the annual
report. The findings suggested that the audit committee disclosure is very useful, while MR
and its related items, the chairman’s review, directors’ report, and corporate governance
report were seen as moderate useful sources of information. On the other hand, the
environmental disclosure was found to have a slight usefulness. Biswas and Bala found also
that one-third of the respondents always review the annual reports for the investments
decision-making’s purposes. They tried to explore the possible reasons of this matter,
however, it was found that many of the respondents believe that the lack of interesting
information is one of the major challenges in maximizing the usefulness of the annual report.
Nevertheless, the same criticism that were noted on several prior studies still applies here;

37
it is not enough to measure the usefulness by only asking the users about the titles of the
annual report’s sections without investigating the usefulness of their content as well.
More recently, Dawd et al. (2018) split the annual report into eight sections and
collected one-hundred and thirty-seven questionnaires from the preparers and the financial
analysts in Kuwait. The results indicated that the management report is a moderate useful
source of information to the investments decisions. Nevertheless, the participants encounter
some insufficiency in the information disclosed in the annual report. For example, they
considered that the disclosure on KPIs is essential to support their investments decision-
making; however, companies are not interested in disseminating this kind of information.
1.5.2 The Studies in the Developed Markets
The pioneering studies on the usefulness of the accounting reporting attempted to
provide an evidence regarding the differences in the perceived usefulness of the annual
report’s sections by investigating the effect of every section on the investments decision-
making. Baker and Haslem (1973) adopted a survey questionnaire that included thirty-three
items; the same items that were used by the financial analysts in USA. They distributed the
on a sample of individual investors in Washington, however and collected 851
questionnaires. The results suggested that the individual users find the information on the
future performance to be likely to affect their investment decisions more than the other
information in the annual report. Moreover, as the questionnaire was prepared based on the
useful information that is in accordance with the American financial analysts’ viewpoint,
the findings indicated that the individual users evaluate the information in a different way
compared with the financial analysts.
Chandra (1974) investigated the annual reports’ usefulness from the viewpoints of
two different parties; the public accountants, as preparers of the accounting reporting, and
the financial analysts, as one of the main users (the study used the term ‘Security analysts’).
Chandra used a survey questionnaire that included fifty-eight items and submitted it to one-
thousand respondents. The results showed some differences between the two categories,
which was related, according to the authors, to the lack of the communication between the
two parties in identifying the users’ needs. In addition, it was found that the users seek more
information that covers different aspects of the firm performance, while the preparers still
follow the mandatory and the traditional disclosure’s requirements. These findings reinforce
that the accounting standards may not be enough to meet the users’ needs.

38
The disclosed information provide the users with the ability to estimate the future
performance rather than focusing only on the present performance. This was the main driver
for Lee and Tweedie (1975a) to investigate the usefulness of the firms’ disclosure. A postal
survey questionnaire was distributed on 1594 individual investors, who were already
investors in a British listed company. The collected questionnaires were 374, where the
respondents were asked to indicate their viewpoint on the usefulness of annual report’s
sections, which included seven sections, and to score the usefulness of several information
regardless of the section that it was disclosed in, such as the historical information and future
forecasts.
The results suggested that the chairman’s report was the highest read part since
95.7% of the respondents read it completely or briefly, while 78.3% of the respondents read
MR regularly, which was ranked as third among the sections. Regarding the usefulness
aspect, the chairman report was ranked as the second with a great useful content, while MR
came forth and considered moderate-important source of information. On other hand, the
respondents’ choices regard the usefulness of different types of information showed that
future forecasts, income information, and liquidity were the most useful information,
respectively. The findings of this study were pioneering as they highlighted many interesting
aspects in understanding the user’s preferences of information; especially the last result
related to the most useful types of information.
Lee and Tweedie (1975b) also presented another evidence regarding the
understandability of the annual report’s content. They suggest that the relevance of the
accounting information is dependent on whether the information reflect the entity’s
performance in a clear way. By surveying the same sample of their pervious study (Lee and
Tweedie 1975a), the findings revealed that the shareholders think that the chairman’s
statement and MR are the highest understandable sections, and that they read and depend
on their information when making investment decision. However, they found that the users
have some problems in understanding the accounting information; this result was applicable
also on the investors who hold an accounting degree. They argued that the lack of
understandability decreases the usefulness of the disclosure regardless of the disclosure
quantity.
Chandra and Greenball (1977) claimed that if the financial analysts found the
disclosed information to be adequate and fair, then it would mean that the information is
useful and meet the users’ needs. Chandra and Greesball analysed the American literature
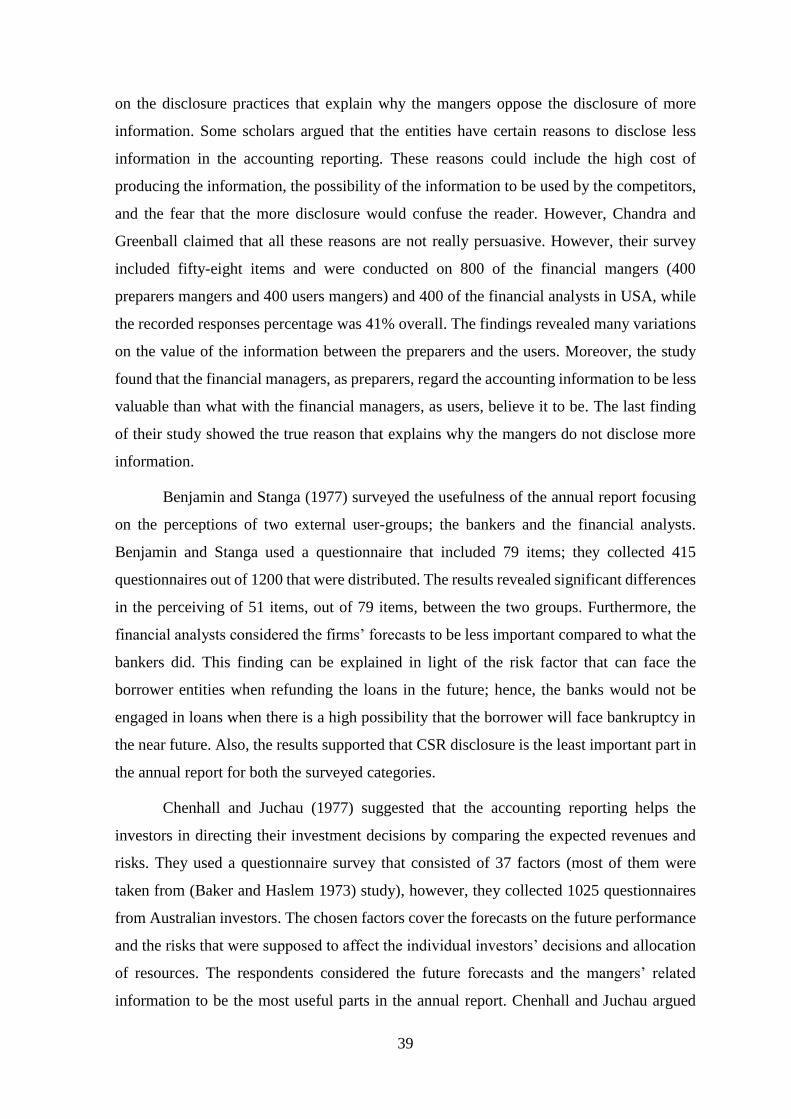
39
on the disclosure practices that explain why the mangers oppose the disclosure of more
information. Some scholars argued that the entities have certain reasons to disclose less
information in the accounting reporting. These reasons could include the high cost of
producing the information, the possibility of the information to be used by the competitors,
and the fear that the more disclosure would confuse the reader. However, Chandra and
Greenball claimed that all these reasons are not really persuasive. However, their survey
included fifty-eight items and were conducted on 800 of the financial mangers (400
preparers mangers and 400 users mangers) and 400 of the financial analysts in USA, while
the recorded responses percentage was 41% overall. The findings revealed many variations
on the value of the information between the preparers and the users. Moreover, the study
found that the financial managers, as preparers, regard the accounting information to be less
valuable than what with the financial managers, as users, believe it to be. The last finding
of their study showed the true reason that explains why the mangers do not disclose more
information.
Benjamin and Stanga (1977) surveyed the usefulness of the annual report focusing
on the perceptions of two external user-groups; the bankers and the financial analysts.
Benjamin and Stanga used a questionnaire that included 79 items; they collected 415
questionnaires out of 1200 that were distributed. The results revealed significant differences
in the perceiving of 51 items, out of 79 items, between the two groups. Furthermore, the
financial analysts considered the firms’ forecasts to be less important compared to what the
bankers did. This finding can be explained in light of the risk factor that can face the
borrower entities when refunding the loans in the future; hence, the banks would not be
engaged in loans when there is a high possibility that the borrower will face bankruptcy in
the near future. Also, the results supported that CSR disclosure is the least important part in
the annual report for both the surveyed categories.
Chenhall and Juchau (1977) suggested that the accounting reporting helps the
investors in directing their investment decisions by comparing the expected revenues and
risks. They used a questionnaire survey that consisted of 37 factors (most of them were
taken from (Baker and Haslem 1973) study), however, they collected 1025 questionnaires
from Australian investors. The chosen factors cover the forecasts on the future performance
and the risks that were supposed to affect the individual investors’ decisions and allocation
of resources. The respondents considered the future forecasts and the mangers’ related
information to be the most useful parts in the annual report. Chenhall and Juchau argued

40
that the high rankings given to the management’s quality items by the investors reflect the
direct influence of the managers’ decisions on the firm performance and share prices in the
future, which emphasizes the importance of the human resources’ disclosure in the annual
report.
Measuring the symmetry of information between the information’s producers and
users was the aim of Firth (1978) study in the UK (as cited in Alrazeen, 1999 and Kribat
2009). He aimed to investigate whether the two parties have similar understanding of the
usefulness of seventy-five pieces of information. Using a questionnaire, 302 responses were
collected from four users-groups; the financial managers and the auditors as information
preparers, and the financial analysts and the loan officers as information users. The results
illustrated that the producers and the users perceive the items in different ways. While the
financial analysts and the loan officers consider 61 items to be of a similar importance, the
perceiving of 49 items was significantly different between to the loan officers and the
financial directors. This study represented a further evidence on the distinctive way in which
the usefulness of the accounting disclosure is perceived from both the users’ and the
producers’ viewpoints.
Investigating the institutional investors’ information needs in Australia was also the
main purpose of Anderson (1981) study. He carried out a questionnaire survey to identify
the importance of the information used in investment decision-making; including those of
the selling, buying, and holding the shares. The respondents were asked to indicate the
usefulness of the annual report’s sections and to identify the subjects that they seek more
information on. The survey was distributed on a sample that included three-hundreds
institutional investors; the received questionnaires were 188 (63.08%). The results showed
that the MR is seen as to be of a moderate usefulness; as the respondents required more
information on the firm’s operations, the future forecasts, and the managers’ qualifications.
Courtis (1982) focused on the Australian individual investors’ perceptions on the
usefulness of the annual report. unlike Firth (1978) approach, Courtis focused only on the
annual report’s sections regardless of the type of information in each section. He distributed
4400 questionnaires on a sample of individual investors in 11 public-state listed firms.
Courtis asked the respondents to rank the importance of the annual report’ sections. The
results revealed that the chairman’s review and MR were ranked third and fourth, out of
seven sections, respectively.
In a literature review article, Hines (1982) compared the findings of twelve based-
survey questionnaires’ studies with some based-content- analysis’ studies. Hines found that

41
the vast majority of the scholars admit that the chairman’s report is the most read part by all
the users' groups; however, when it comes to investment decision-making, the users depend
mostly on the income statement information. Furthermore, he addressed a conflict between
both categories of the studies that was due to the timeliness. Hines illustrated that the users
think that the financial reports are indeed very important, yet, the annual report as being
announced, typically, several weeks after the end of the fiscal year, limits the possible
usefulness of the annual reports.
McNally et al. (1982) used a mixed approach in order to make a comprehensive
investigation of usefulness of the accounting reporting. In order to investigate whether the
current disclosure meet the professional users’ needs or not, the authors conducted a survey
with two user-groups; the financial editors and the stockbrokers in Australia. The
questionnaire included forty-one items that cover financial and non-financial information
and mandatory and voluntary items. The received questionnaires were 83 out of 187
distributed. The findings revealed many important points. First, there was a high agreement
between the two surveyed groups on the usefulness of all the items in the survey. Second,
when comparing the users’ needs with the firms’ actual disclosure, it was found that that the
listed companies failed in disclosing the information that was seen as highly usefulness by
the users. McNally et. al. argued that even though the findings of several prior studies in
USA, UK, and New Zealand indicated that the users’ needs are similar within these
countries, the Australian firms still unaware of the benefits of providing information that
matches the users’ needs.
In the UK, Day (1986) focused on the investments analysts’ perceptions regarding
the usage and usefulness of the annual reports, as well as, on determining the analysts’
suggestions on how to increase the annual report’s usefulness to match their needs. Day
utilized both content analysis approach and interviews to obtain the required data. He used
the annual reports of two British companies for the fiscal year ended on 31th of March 1982,
then he held structured interviews with fifteen financial analysts in order to know how they
use the information and evaluate its usefulness, which should be reflected on their
investment decision-making. The results illustrated that although the chairman’s report
included some useful information, it still need some improvement to increase its usefulness.
The respondents confirmed that providing more information on the future performance and
the management’s plans will make the chairman’s report very useful.

42
McCaslin and Stanga (1986) proposed that there is a similarity in the information
needed by the financial analysts and the bankers in making investment decisions. To
examine that notion, the authors formulated a questionnaire that included thirty financial
items and applied it on the USA Content. The returned questionnaires were 113 from the
bankers and 59 from the financial analysts (out of 300 questionnaires that were distributed
on each group). The findings showed high similarity in the needs and in the estimated
information usefulness for both user-groups. However, this study focused only on the
income statement and its financial information.
In the Netherlands, Vergoossen (1993) tried to determine the main purposes of using
the annual reports and the usefulness of its sections. He conducted a questionnaire survey
with the investment analysts in the Netherlands. The returned usable questionnaires were
215 out of 506 that were distributed. At first, the questionnaire included some questions on
the main purposes of using the annual report. The results of this part suggested that 54.9%
of the users use the annual report for investments decision-making, 38.9% use it in general
ordination and in knowing the firms’ performance in general, while 37.1% use it to advise
their clients. Second, the respondents were asked to determine the usefulness of ten sections
of the annual report. The findings revealed that MR was ranked fourth, while the supervisory
board’s report came in as last in the ranking.
The American Institute of Certified Public Accountants (AICPA), a professional
organization, carried out one of the most important studies in exploring the users’ opinions
regarding the financial reporting of the American entities. AICPA recognised the new
changes in the business environment; therefore, a committee of high-qualified professional
members was formed in 1991 to indicate what the users’ need. The investigation focused
mainly on knowing the respondents observations on the weaknesses of the current disclosure
and on what information should be covered in the annual reports to make it more useful
(AICPA 1994). However, the committee held many meetings before issuing the final
recommendations on improving the efficiency of the accounting reporting. To reach
valuable recommendations, a telephone survey was carried out with 1200 participant (60%
of them were involved in investment decision-making, while 40% were creditors). The final
findings highlighted many interesting tips. First, the users seek more nonfinancial
information to explain the firm operations and the relations between different activities.
Second, the users need information that covers forward-looking performance and includes
the investments opportunities and the risks and their effect on the near-term at least. Finally,

43
the respondents showed some doubts regarding the management disclosure’s policy, since
the managers tend to avoid the disclosure on information that might reflect poor
performance, which would likely make many information to incredible.
Anderson and Epstein (1995) used a questionnaire survey to investigate the
individual investors’ preferences regarding the annual report (as cited in Alrazeen, 1999).
They sought to arrange the annual report’s sections according to their effect on the
investment decision-making and, consequently, their usefulness. The results indicated that
MR is the most read part in the annual report; however, when it comes to investment
decision-making, the income statement was considered to be the most useful section.
The changes in the business environment, the regulations, and the accounting
standards can probably affect the users’ points of view on the usefulness of the disclosure.
Bartlett and Chandler (1997) investigated the effect of these changes on the usefulness of
the listed entities’ disclosure in the UK and compared their study’s findings with those of
Lee and Tweedie’s in the 1970s. Bartlett and Chandler used a questionnaire survey that
included the same items that were used in the study of (Lee and Tweedie 1975a) with some
improvements due to the recent changes in the annual report’s content. The questionnaire
was sent to 300 of the individual investors in a specific British listed firm, while only 76
questionnaires were returned. The findings proved that the narrative disclosure sections
have attracted more attention by the investors. Furthermore, the results supported an
increase in the usefulness of the chairman’s report, the financial summary, the chief
executive’s report, and MR, while the importance of the financial statements was seen to be
decreased. Interestingly, corporate governance disclosure and the auditor’s report were of
the least read parts. Bartlett and Chandler argued that despite that many changes had
happened in the accounting and auditing standards and disclosure regulations, the lack of
communications between the mangers and the users still exist, which limits the usefulness
of the business reporting.
In one of the most interesting studies, Beattie and Pratt (2002) investigated the users
views on the importance of specific items; relying on the views of both the professional and
nonprofessional users in the UK. They adopted a questionnaire survey that included 130
items and were divided into eleven sections. The survey was sent to four user-groups;
namely, the expert users, private shareholders, finance directors, and audit partners. While
the distributed questionnaires were 1645, the returned questionnaires were 538 only, in
addition to 22 follow up interviews done by the telephone. The findings of this study show

44
similarity in the users’ perceptions across the four categories. The highest useful items were
related to the information that covers the financial performance, the firm strategy, the
management discussion, and analysis and risks. On the other hand, the information on the
environmental and corporate social responsibility was considered the lowest useful items.
Graham et al. (2002) focused on investigating the financial analysts’ needs, how they
perceive the information, and how they use it in estimating the entity’s future profits. Their
sample included 200 financial analysts in New York; the returned usable questionnaires
were 34 only. The respondents were asked to indicate the usefulness of certain sources of
information. The results revealed that MR was a very important source of information with
a mean score of 4.53, out of 5-points scale, with 62% of the respondents always use it in
their investments decision-making. In addition, the respondents were asked to evaluate the
importance of specific types of information that affect their expectations for the entity’s
earnings in the future. The respondents indicated that the information related to the earnings
growth, future plans, financial risk, operating risk, recurring and non-recurring profits, and
the quality of the firm’s mangers, respectively, are very useful and affect their estimates
significantly. This study provided very interesting insights for deeper understanding of the
financial analysts’ way of thinking and how they read and use the annual report in a critical
way, with focusing on specific items that can help in anticipating the entity’s performance
in the next year.
Hooks et al. (2002) aimed to explore the compatibility between the users’ needs and
the actual disclosure in the annual reports. They prepared a disclosure index that included
67 pieces of information, then, debated it in-depth with a panel consisted of fifteen high-
qualified experts. The panel’s members were asked to weight the index’s items in light of
their viewpoints on the usefulness of each item. Hooks et al. applied the weighted disclosure
index on a sample of the listed companies in New Zealand. The sample included the annual
reports that were issued between the fiscal years of 1998-1999 by thirty-three electricity-
firm. The results showed that the information related to the management and the ownership
structure was disclosed adequately. In contrast, the disclosure on many other items were
limited within some reports, while they were never disclosed in others, such as the items
related to the forward-looking performance, profit, and performance ratios. Hooks et. al.
indicated that what was common between these items, the less disclosed items, is that most
of them were voluntary items, which highlights the gap between what the regulators enforce

45
the entities to disclose, what the firms disclose voluntarily in its annual report, and what the
information that the users truly seek .
In Belgium, Orens and Lybaert (2007) followed a similar approach to that of Hook’s
et al., but followed reversed steps. Orens and Lybaert attempted to assess the usefulness of
the nonfinancial information from the viewpoints of sell-side financial analysts’. At first,
they prepared a disclosure index which included 71 nonfinancial information, based on the
annual reports content. These items were divided into five categories; namely,
management's analysis of financial and non-financial data, information about management
and shareholders, forward-looking information, background information about the company
items, and intellectual capital information. The authors found that the nonfinancial
disclosure was increased over the time in the annual reports. They linked this finding with
the continuous changes in the disclosure requirements and the voluntary disclosure. At a
second stage, the same index was formatted as a survey questionnaire and was sent to the
financial analysts in Belgium. The aim of this step was to explore the views of the financial
analysts on the usefulness of the disclosure index’s items. The findings documented that the
increasing in nonfinancial disclosure reduces the gap between the financial analysts needs
on the one hand, and what the entities’ managers tend to disclose on the other.
Cohen et al. (2011) focused on the perceptions of non-sophisticated investors’
regarding the usefulness of nonfinancial disclosure. They used a questionnaire survey that
included twenty-two items and cover three main categories of the nonfinancial information;
the economic performance’s indicators, corporate governance, and corporate social
responsibility. The survey was carried online whereas the authors received 750 responses.
The results suggested that the economic performance indicators are the most usefulness
information, followed by the corporate governance, while CSR information came as least.
Cohen et. al. explained that the respondents feel more confidence in corporate governance’
information provided it was audited or organised by the regulation. Moreover, the users can
be more confident in the CSR information if it was disclosed by an independent third-party
(i.e., showing certificates from institutions that had received donations from the reporting
entity or certificates from competent authorities regarding the reporting entity’s efforts in
protecting the environment).
Johansen and Plenborg (2013) as well attempted to evaluate the usefulness of the
mandatory nonfinancial disclosure within two sections of the annual report; the management
commentary and the financial statements’ notes, in Denmark. Using a questionnaire that

46
included 24 items, they surveyed explored the perceptions of four user-groups and one
preparer group. The user-groups included financial analysts, professional investors
(contained four categories: asset managers, pension funds, private equity and institutional
investors), private investors, and banks officers (both credit analysts and client advisers),
while the targeted preparers were the financial managers in the nonfinancial Danish
companies. The returned questionnaires were 288 from the users and 89 from the preparers.
The results showed that the current disclosure was not enough, and that the actual disclosure
level was moderate across all types of information. Moreover, the respondents still seek
more information on the forward-looking information, the past year activities and results,
key performance indicators, and the risks. On other hand, the respondents were still not very
much interested about corporate governance and corporate social responsibility information.
These findings confirm the gap between the users’ needs and the firms’ actual disclosure
and that the preparers still unaware or neglect the users’ needs.
1.5.3 The Lack of Usefulness in the Financial Report: Overview
The above two sections illustrated considerable amount of prior studies on the
usefulness of the accounting report. The research in the emerging countries has begun in the
eighties of the last century, after roughly two decades of it being first begun in the developed
economies. By that time, the studies in the developed markets have been decrease, while
more attention has been paid to the emerging markets (Table1.1). The majority of studies in
the emerging markets focused on the Asian economies, while less attention was paid to other
markets in the other regions. Although several studies were carried out in the Arab Gulf
countries, the results of these studies may not be applicable on the Egyptian context; since
these countries’ economies is based mainly on the petroleum sector, while the Egyptian
economy is more open and does not depend mainly on a single economic sector.
Table 1. 1 Summary of the Prior Studies through the Last Five Decades
Years/Markets Studies on the usefulness of annual report
Total Developed Markets Emerging Markets
1971-1980 7 - 7
1981-1990 6 1 7
1991-2000 7 5 12
2001-2010 6 14 20
2011- 2018 3 4 7
Total 29 24 53

47
However, the subject of these different investigations/studies was not always the
same. While, some studies sought to arrange the usefulness of the annual report’s sections
(e.g., Abu-Nassar and Rutherford, 1996; Alattar and Al-Khater 2008; Almahmoud 2000;
Al-Maliki et al. 2015; Al-Mubarak 1997; Anderson 1981; Biswas and Bala 2016; Courtis
1982; Kitindi et al. 2007; Lee and Tweedie 1975b; Mirshekary and Saudagaran 2005; Naser
et al. 2003; Rahman 2001; Stainbank and Peebles 2006, other studies tended to divide the
annual report into several sections, however, the number of these sections was different
from one study to another. For example, the annual report was divided into four sections
(Naser et al. 2003), seven sections (e.g., Almahmoud 2000; Al-Mubarak 1997; Al-Razeen
and Karbhari 2004; Alzarouni et al. 2011; Courtis 1982; Kitindi et al. 2007; Lee and
Tweedie 1975a, 1975b), eight sections (e.g., Alattar and Al-Khater 2008; Abu-Nassar and
Rutherford 1996; Samaha & Dahawy, 2010; Dawd et al. 2018; Kribat 2009; Mirshekary and
Saudagaran 2005), nine sections (Al-Ajmi 2009), ten sections (Al-Maliki et al. 2015; De-
Zoysa and Rudkin 2010; Vergoossen 1993), fifteen sections in (Bartlett and Chandler 1997),
eighteen sections in (Biswas and Bala 2016), and twenty sections in (Stainbank and Peebles
2006).
Unlike of this approach, other studies focused on investigating the usefulness of
specific types of disclosure or specific items (e.g., Baker and Haslem 1973; Benjamin and
Stanga 1977; Chandra 1974; Chandra and Greenball 1977; Cohen et al. 2011; De Zoysa and
Rudkin 2010 Firth 1978; Hassan and Power 2009; Ho and Wong, 2001; Hooks et al. 2002;
Ibrahim and Kim 1994; Johansen and Plenborg 2013; McNally et al., 1982; Orens and
Lybaert 2007; Solas and Ibrahim, 1992), while, finally, very few studies followed both of
these approach altogether (e.g., Al-Ajmi 2009; Alzarouni et al. 2011; Backer 1970; Bartlett
and Chandler 1997; Beattie and Pratt 2002; Graham et al. 2002; Lee and Tweedie 1975a).
The author believe that investigating the usefulness of the annual reports’ sections as
competitors to one another is not sufficient with the existence of accounting standards in
every country around the world, while, it is more important to focus more on the usefulness
of the information types in every section.
Another noticeable phenomenon in some of the prior studies in general is that the
users-groups who were subject to the investigations were inhomogeneous, which may lead
to inaccurate findings. The researcher argues that the usefulness of accounting information
depends mainly on the purpose that the targeted-user needs it for, which means that it is not
accurate to survey the tax officers or the governmental officers if a study tries to investigate

48
the influence of information on investment or lending decision-making. For instance,
Mirshekary and Saudagaran (2005), Kribat (2009), and De Zoysa and Rudkin (2010)
surveyed the tax officers as one group in their surveys, while Naser et al. (2003) surveyed
the governmental officers as one group in their study. In such cases, some doubts can be
raised regarding the relation between these users-groups and the evaluation of the usefulness
of information that covers the firm strategy, the mangers skills, the financial performance
indicators, and the expected revenues in the next year. It was presumed that some of these
users-groups, as a result of the nature of their work, focus only on the quantitative
information included in the main financial statements, and the importance of narrative
sections would be lower for them.
Nevertheless, many prior studies assumed that the sections on the main financial
statements to be of the highest usefulness in the annual report; therefore, the surveys they
used were designed to investigate the usefulness of information disclosed in these
statements, while other sections in the annual reports were seen as secondary-useful sources
of information. The following arguments will highlight the increased criticisms that were
directed to the financial report, and the necessary reform by which the usefulness of its
content can be maximized.
Thus, from the methodological perspective, there are three main methods that are
popular in the literature of the usefulness of annual report. First, the questionnaire surveys
are the dominant methodology in investigating the usefulness from the users’ viewpoint.
Second, the content analysis approach was also followed in several studies, sometimes on
its own while other times, more often, with another method, such as questionnaire survey
or interviews. Some scholars tended to analyze the financial analysts’ reports in order to
determine which information is useful and reliable and has impact on the financial analysts’
advices and decisions. On the other hand, some scholars analyzed the annual report itself in
order to compare the disclosure practices with the findings of their questionnaire survey or
the undertaken interviews. The aim of that analysis was to provide a comparison between
the users’ perceptions regarding the usefulness of accounting information, and the content
of the annual report. Third, there was only a few scholars who adopted the interview method;
probably because this method has some limitations and does not present accurate results,
especially if it was based on only few users (due to the limitations of the time and the cost)
to determine the usefulness of the annual report. Therefore, in many cases, the interviews

49
were adopted side by side with another method, such as questionnaire survey or content
analysis.
It is also noted that the accounting disclosure might be considered as a product (Dye
2001). In the cases of intense competition, the successful enterprises represent its products
and services in a way that matches the clients’ needs. The entities’ management should
follow the same strategy in preparing the business report, as the users of the information
expect to receive some useful information that is presumed to reflect the current situation of
an entity and whether its investors should sell, buy, or hold their shares (AICPA 1994).
However, the financial report on its own does not provide enough information for the users
to have a complete view of the entity. A first limitation of the financial report is the
standardization process that controls how to prepare it and how to explain the numbers
through the notes. The financial report includes a specific information, as required by the
accounting standards, which is reflected on the information that appear in the financial
statements and their notes (Schroeder and Gibson 1990). Another limitation of the financial
report is the lack of forward-looking performance disclosure. The financial statements
include, by its nature, historical information that reflects the past and the current
performance, while the users seek more information on the planned expansions and the
future performance ( FASB (1978): paragraph 21).
This weakness in the financial report highlights the important role of the
management report(2) in improving the usefulness of the accounting reports (Clarkson et al.
1999). MR provides explanations of the surrounded conditions that influence the financial
statements’ items. The explanations should highlight more details on the events that were
not disclosed in the financial report (IASB 2010b). This disclosure is supposed to support
the financial report and to increase the usefulness of the business report in general. On the
other hand, many of the accounting numbers were measured based on estimates, therefore,
the business report should include information to explain the assumptions and surrounding
conditions that led to these numbers (FASB (2006), Parapraphs: OB15, OB19 & OB26).
This kind of information helps the users in better understanding the factors that impact the
(2) The management report (MR) has several names that differ from one country to another. For example, IASB
called it Management Commentary (MC), in the US and Canada is called “Management Discussion and
Analysis” (MD&A), while in the UK the entity’s management have to prepare several reports, the
important reports include the Strategic Report, Board of Directors’ Report, and Corporate Governance
Report. However, in Egypt, the entity’s management have to prepare one report called “The Management
Report”. In the current study, the names of MR, MC, and MD&A are used as synonyms.

50
preparing of these numbers. However, many of this information does not appear in the
financial statements and their notes; thus, they be shown in the management commentary.
In addition, regulators of the different markets have realised that the financial report is no
longer considered as informative as it was before and that substantial reform is strongly
needed to improve the quality of accounting report in serving the users’ needs (Girdharry et
al. 2011).
Following this argument, AICPA’s report in 1994 presented a model that focused
on the useful information for the investment and lending decisions. The model included five
main parts with a major concern on non-financial information. The first part covers financial
and non-financial information related to the firm’s activities and performance measurements
that were used by the management in the internal decision-making. The second part included
information on the management’s analysis of changes in the financial and operating results.
The third section focused on the risks and opportunities that were related to the forward-
looking information and how the mangers set plans to overcome these risks or seize the
opportunities. The fourth section mentioned the information related to management board’s
compositions and ownership structure. Finally, the fifth section focused on the entity’s
objectives and strategies, along with a brief description of the business sector.
After more than two decades since the issuing of the AICPA’s report in 1994, little
is known regarding the role of MR in enhancing the transparency in the capital markets and
in supporting the investors’ ability to make relevant investments decisions. Moreover, the
domestic regulation is the principle guide to identify what volume and quality of information
have to be disseminated in MR; it suggests that every capital market has its own rules in
determining such a disclosure. The next chapter will attempt to closely view the usefulness
of MR in the accounting literature and illustrate what types of information should be
presented in MR in order to maximize its usefulness in investments decision-making.
SUMMARY
The research on usefulness of accounting reports has gained huge attention by
scholars and professional bodies. The increased role of stock markets in the economic
growth has shown that the accounting system should produce and present enough and useful
information in order to enlighten the users regarding investments decision-making and also
to enhance the accountability of the managers to the owners. Notwithstanding the many
studies that have been done on the usefulness of accounting reports, the majority of these

51
studies focused on evaluating what parts of the annual report were the most useful depending
on the current disclosure within them. Many of these studies did not present empirical
evidence regarding how to increase the usefulness of different parts in the annual report, as
the research on that point, particularly in North Africa region, still very limited.
Furthermore, it was shown that the financial statements and their notes are not enough to
explain the surrounded conditions of an entity, which emphasizes the role of MR in
complementing the usefulness of the accounting system’s outcomes.

52
CHAPTER TWO: The Usefulness of Management Report and the
Development of Research Questions
2.1 Introduction
The regulatory bodies have set specific rules that control the content of management
report. However, there are some differences in the requirements of disclosure in MR from
one country to another. This chapter seeks to define MR and to highlight its importance as
a complement to the financial report. Then, the chapter discusses the main elements of MR
in the light of the rules set by some regulatory bodies. Also, a full description to the effective
and useful preparing MR of will be illustrated. At last, the chapter will discuss the relevant
theoretical framework for the current study and the developing the research questions. The
chapter concludes with identifying the Egyptian context.
2.2 Definition and Importance of the Management Report in the International
Accounting Standards Boards
The management report concept refers to a report that includes an extra information
which differs from the financial statements content, whereas the main objective of this
information is to capture a wide view on the past, current, and expected performance of an
entity, and to highlight the cases that are expected to have impact on the entity either in
direct or indirect ways. The International Accounting Standards Board (IASB) represents a
comprehensive definition on the management commentary: (IASB (2010b); IN3)
“Management commentary is a narrative report that provides a context
within which to interpret the financial position, financial performance and
cash flows of an entity. It also provides management with an opportunity to
explain its objectives and its strategies for achieving those objectives”.
This definition debates several components that should be disclosed in the
management commentary. While management commentary is a narrative report by its
nature, this does not mean that its content is limited on qualitative information only. The
narrative information in management report covers the objectives of the enterprise and the
strategies that were stated by the managers to achieve these objectives. In addition, MR
provides more details on the firm performance and the surrounded conditions that led to that
performance and affected the cash flows. The management report should also include some
quantitative information to highlight some aspects that do not appear in the financial report.

53
IASB highlights the importance of management commentary to the users:
“Users routinely use the type of information provided in management
commentary to help them evaluate an entity’s prospects and its general risks,
as well as the success of management’s strategies for achieving its stated
objectives. For many entities, management commentary is already an
important element of their communication with the capital markets,
supplementing as well as complementing the financial statements”. (IASB
2010b) Paragraph IN3
It was proven that the users use MR to assess the firm performance and the risks.
Information about the risks could be helpful to the users in assessing the going-concern
issue, whether the firm’s activities were in fact shaped by specific risks, and the strategies
that the management follows to overcome these risks. Assessing the firm performance is a
reflection to the management success in administering its plans and strategies. This
evaluation serves the users in two ways; first, in making investment decisions on the
enterprise’s shares, second, in assessing the management stewardship and whether the firm
performance was consistent with the previous forecasts. These two aspects support, in a way
or another, the better resources-allocation for the successful enterprises, which pressures the
firms that have weak performance to improve their strategies and returns.
Hüfner (2007) suggested that MR provides some vital information that aims to help
the users in investments decision-making. He argued that overcoming the weaknesses in the
financial report requires improving the information quality and quantity in MR. Moreover,
some scholars documented empirical evidence that the sell-side analysts in the US depend
heavily on the MD&A information when they prepare the analysts’ reports (Rogers and
Grant 1997). However, there is a notable lack in investigating the users’ perceptions
regarding the usefulness of MR and whether it fills the gap between what the users need and
what the financial report provides (Hüfner 2007). Furthermore, the SEC suggests that
presenting the MD&A aims to explain the financial statements in the eyes of the
management and to increase the quality of financial disclosure through explaining the
conditions that affected the earnings and the cash flows (SEC 2017).
Considering the users’ needs should affect the managers’ view when deciding what
information should be disclosed to the users. The management should consider the needs of
the primary users, current and potential investors, lenders, and other creditors. MR should
include information that complement the financial report, and provide integrated images of

54
the enterprise (IASB 2010b) . In order to achieve this integration, MR should include the
information that cover the past performance, the current progress, and the forward-looking
information.
Being a regulated report, the quality of MR content depends mainly on the
effectiveness of legal requirements regarding the extent of the information to be disclosed
in MR and on the power of enforcing and obligating the companies to disseminate that
disclosure. The main aim of MR is not only to explain narratively the outcomes of an entity
over the fiscal period, but it also extends to highlighting the past and future conditions and
their effect on the current and future performance (Girdharry et al. 2011). Indeed, MR
should enable the reader to know the current trends and whether these trends are expected
to continue in the short-term and long-term and affect the future of the company, either
positively or negatively. Therefore, one can say that the usefulness of MR depends on the
comprehensiveness degree of the content provided within it and whether the regulated
requirements and the preparing process follow the rule of ‘substance over form’.
2.3 Elements of the Management Report
The content of the management report depends primary on two factors; the mandatory
disclosure requirements and the management view regarding the voluntary disclosure.
Generally, the effective MR should cover, at least, the following aspects (IASB 2010b; ASB
2006):
- The nature of the entity activities: information on the industry, the main markets and
the competition statues in this industry, the entity’s main products/services, the main
regulations that control the entity’s activities and the economic environment, and the
entity’s structure
- Objectives and Strategies: every entity has some objectives that it works to achieve.
MR should provide information to highlight these objectives and the management’s
plans in achieving them, which helps the users in understanding the managers’
priorities and the required resources to achieve the results. In addition, the report
should indicate any significant change in the objectives and explain the reasons for
that change and its effects on the entity performance.
- Resources, risks and relationships: the management report should include
information on the available, financial and non-financial resources, and illustrate
how the management employs them in the enterprise operations in order to create

55
value. The disclosure on the resources include, for example, the cash flows and
liquidity, human and intellectual resources, and the capital structure. The report
should disclose information on the primary risks that shape the entity’s activities and
the strategies taken to overcome these risks; this disclosure helps the user in
assessing the impact of these risks on the entity’s results. The significant
relationships between the shareholders and the entity and the effect of those relations
on the entity’s performance should be also disclosed in the report.
- Results and prospects: it is important to provide the report with a description of the
entity’s performance, financial and non-financial results, and whether the future
performance could be estimated based on the current performance or would it be
different. On the one hand, the report explains the performance during the ended
period and the factors that influenced the performance. This explanation enables the
users to understand the general trends behind the performance, which could be useful
in assessing the managers’ performance and whether their strategies are relevant or
not. Moreover, the past performance could be used in estimating the future
performance. In the normal conditions, it is supposed that the future performance is
an extension to the past and the current performance; hence, the report should
illustrate whether this attitude will continue in the future or not and what the factors
that could lead to different trends, if any.
- Key performance’s indicators: the performance indictors highlight the management
performance and compare the actual results with the entity’s objectives. MR should
include some indicators that reflect the relations between the enterprise’s resources
and the performance. Using indicators and measurements helps the users in
understanding the realised performance. To enhance the usefulness of these
indicators, the report should explain why the performance has changed than the
predicted one, in case it was changed. However, the indicators could be combined
of financial and non-financial, while it is preferred to be financial, in some aspects
it is not possible to use quantitative indicators to assess the performance (i.e., the
effect of a new regulation or in increasing the taxes rates).
In addition, FRC has a different classification regarding the issues that should be covered
by MR. As it mentioned previously in this chapter, FRC emphasises duality in the objectives
of the business report. In that regard, the MR should include relevant information to help
the users in making investment decisions and to help also with the management’
56
accountability. Therefore, the following aspects should be covered adequately in MR (FRC
2014):
- The entity’s development, performance, and its position at the year-end;
- Information that clarifies the future prospects;
- The stated strategies for achieving the enterprise’s objectives;
- The business model and how the enterprise generates value in the long-term;
- The governance and its mechanisms; and
- The directors’ remuneration and the factors that were used in determining it.
In the US, the content of the MD&A is subject to the requirements of the S-K 303.
Accordingly, every listed company in SEC has to disseminate information under the
following parts of the MD&A (SEC 2017):
- Liquidity and Capital Resources.
- Results of Operations with distinguishing between irregular components of the
income
- Off-balance Sheet Arrangements.
- Tabular Disclosure of Contractual Arrangements: including long-term Obligations
and Finance Leases.
- Forward-looking performance.
- Research and development activities.
- Related Party Transactions.
- Fair Value Measurements
It could be argued that the differences in elements of the management report are
inconsiderable and that the main objective of the regulatory bodies is to enhance the
usefulness of this report.
2.4 The Usefulness of the Management Report: Some Insights from International
Accounting Bodies
In its book “A Plain English Handbook: How to create clear SEC disclosure
documents”, the U.S. Securities and Exchange Commission (SEC) presents some advices to
improve the understandability and the usefulness of the reports that the listed entities have
to prepare and present to SEC. The book highlights four important tips that the preparers

57
should be concerned with when they prepare any report with the SEC requirements. The
tips are as follow (SEC 1998):
a- Does the report structure is in simple and understandable language to the investors?
b- Does the report include useful information to the investors?
c- Does the report neglect some important information?
d- Does the report include voluntary information, yet it does not affect the investors’
investment decisions?
Furthermore, based on both the literature on MR and the efforts of the professional
bodies; the current study concludes that preparing interesting and useful MR should follows
some characteristics:
Diversity and comprehensive information
The management report provides a view of the firm in eyes of the management,
therefore, the report should present a comprehensive content taken from the information that
the mangers use in managing the entity. As MR is a general-purpose report, the diversity is
a necessity to meet the variety of the users’ needs. At the same time, in order to provide
relevant information to the users, the report should focus more on the most significant
aspects and activities, which is consistent with the materiality principle (ASB 2006).
Tavcar (1998) criticised the content of the management report because it provides an
incomplete information. For example, when an enterprise seeks to explain the increase in
its revenues, it is likely to use some sentences such as “revenues increased largely because
of the high rates of our brands” (Tavcar 1998). While the entity’s management may consider
this sentence to represent an adequate disclosure, this information is in fact ambiguous and
too general; since it does not explain the real reasons behind that increase (i.e., reducing the
production and marketing costs, improving the products’ quality, or the exit of some
competitors in the market…etc.).
MR should cover information on the firm’s operations, forward-looking performance,
risks and opportunities, corporate governance, corporate social responsibility, and related-
information on the managers themselves. This information helps the users in understanding
the past performance and the surrounded conditions that affected it, as well as, it provides
some insights into the future performance and whether the management was qualified
enough and respect the governance rules or not.

58
The Credibility
To be credible, the content of MR should be subjected to an auditing by some external
auditor. In addition, when it is necessary, some information requires to be independently
estimated by an external expert; for example, the expectations regarding the adjudication of
some legal disputes. These actions make the information in MR to be more transparent and
useful.
New information:
When MR present the same information that was already existed in the financial report
then its content will be useless. In order for it to be useful, MR should provide two different
types of information. First, additional explanations for some information that was disclosed
briefly in the financial report due to the accounting standards’ requirements. Second, MR
should not provide repeated information that was already disclosed in the previous year/s.
According to these two aspects, every information in MR should add new insights to the
user’s knowledge of the firm (Tavcar 1998).
Relevant Language
In some cases, however, MR can include some technical and complex
terms/information that may not be easily understandable by all the users. However, this issue
would not mean that the firm have the right to avoid disclosing this information altogether;
alternatively, the firm should explain that information in the most simple and understandable
language to the users (Tavcar 1998). Furthermore, (SEC 1998) points out to several
problems in the language that is used in preparing MR; for example, it:
- Uses long sentences or very abstracted words which makes the content to be boring
or fuzzy;
- Uses very complex words that makes the information to be non-understandable;
- Uses passive voice that confuses the reader; and
- Presents the report in a vapid design.
As the objective is to provide useful information, every firm should consider these
aspects and prepare its report in a way that maximises the decision-usefulness (Fraser et al.
2010).
The Flexibility (Materiality)

59
Despite that preparing the MR is subject to some legal requirements, it is better to give
the entities a level of flexibility when preparing them. Even though there are several sectors
and disciplines in a capital market, the entities within the same sector have similar activities;
these activities, on the other hand, are different from one sector to another. This argument
should be reflected on the process of preparing the MR. In such this case, the flexibility is
an important factor in giving the management the ability to present the information in a
more suitable form rather than only a single fixed one (IASB 2010b; Bryan 1997). However,
the intended flexibility would not imply the absence of the regulation enforcement and
control entirely; rather, it would mean to follow the substance over the form. Firstly, the
regulation should guarantee an adequate level of disclosure, while giving the firms the
ability to choose the best form in which they represent the information; in a narrative way
or by using graphs and tables. For example, the Canadian Securities Administrators (CSA)
have set specific requirements for disclosure in MR, however, the way of representing the
content of this report is completely variable in accordance with the vision of every listed
company and its activities (Girdharry et al. 2011). Secondly, the entities should be
encouraged to provide more voluntary disclosure to meet the users’ needs in assessing both
the decision-usefulness and the management accountability.
Relevant Presentation Tool
MR covers many aspects which include qualitative and quantitative information.
While the qualitative information cannot be disclosed, ordinarily , in a single form, many
quantitative items become easier and more understandable when it they are disclosed in
graphs and tables (Beattie and Jones 2008, 1992). Therefore, the managers should consider
the method that is relevant, clear, and makes the information more useful to the readers.
The cost
As some argue that producing and presenting more useful information requires
additional cost, these costs could in fact be reduced. Every firm produces information to be
used either internally or externally, and the mangers decide the items that will be voluntarily
included in MR. Therefore, externally disclosing and reporting more information by using
some of the useful internal-purpose information can only incur the entity low cost (FRC
2009).

60
2.5 Reviewing the Studies on the Usefulness of the Management Report
The concern regarding the usefulness of MR has started, in a serious way, two decades
ago. One of the earliest efforts on that matter was done by Bryan (1997). Bryan examined
the compatibility between MD&A content and the financial analysts forecasts of the future
performance disclosure, as an empirical evidence on the usefulness of MD&A content in
USA. The sample included 250 MD&A reports for the fiscal year 1990 and it was subjected
to a logistic regression model. The results revealed a positive relationship between the
entity’s future plans disclosure and short-term investments decisions. Despite that this study
did not test the usefulness from the users’ views, it presented an indirect empirical evidence
which suggests that MD&A has the potentiality of guiding the investment decisions.
Nevertheless, the findings illustrated that the forward-looking disclosures is important to
the current and prospective investors and their investment decisions.
Barron et al. (1999) followed a similar approach to Brayan’s. Barron et al. investigated
the usefulness of MD&A by assessing the relationship between MD&A quality and the
accuracy of analysts’ earnings forecasts in USA. The authors used the disclosure’s
requirements by the Securities Exchange Commission (SEC) to evaluate MD&A quality.
They agreed with SEC viewpoint that the financial statements on their own are inadequate
in providing the users with a predictability information. The authors carried out a content
analysis that included the annual MD&A for 284 listed firms, in addition to the analysts’
forecasts reports for the same firms. The results reported that the analysts’ forecasts errors
were associated negatively with historical capital expenditures, forward-looking disclosure
on the operations, and the capital expenditure.
Clarkson et al. (1999) focused on investigating the role of MD&A, as a part of the
firm’s disclosure, and the usefulness of MD&A from the viewpoint of the financial analyst.
They used a mixed approach that were based on interviews and a questionnaire survey. First,
they interviewed fifty-five financial analysts who were working at Toronto Stock Exchange.
The interviewees assessed the usefulness of five categories of information that were
disclosed in MD&A; namely, financial conditions, operations, liquidity ratios, risk
management, and forward-looking performance. Furthermore, the scoring points ranged
between 20 points for the operations category, and 10 points for every other section. Second,
the authors used the interviews’ findings to prepare a questionnaire that assess the usefulness
of MD&A; accordingly, they distributed 416 questionnaires on the sell-side financial
61
analysts, whereas the usable collected questionnaire were thirty-three ones only. The survey
results were consistent with the interviews findings, which confirmed that MD&A provides
many useful and novel information. Finally, in order to measure the actual disclosure by the
listed firms, the authors performed a content analysis on 91 listed companies in the Toronto
Stock Exchange. They reviewed the forward-looking performance disclosures that were
published in MD&A in 1992. They found that 68 out of 91 company provided new
information that was not published at any other source or channel of disclosure. The authors
argued that MD&A is an essential part of the firms reporting and that it plays a major role
in directing the investment decisions.
In a literature review article, Cole and Jones (2005) analyzed the prior studies on
MD&A done on the USA. Their analysis showed that the content of MD&A provides a
value relevant information. MD&A helps the users in understanding the firm operations and
expecting the future performance, as it provides more details that explain the going-concern
issue. Moreover, the authors found that the prior empirical studies focused on the usefulness
of the financial statements and their notes, with less concern on the MD&A content. The
authors added that the existing research on the usefulness of MD&A and its effect on the
investment decision-making is still limited. Finally, they reported that the majority of the
prior studies on MD&A focused on some industrial sectors, which limits the generalization
of their results. They argued that more evidence is still needed especially on the narrative
sections of MD&A.
In a conceptual-evaluation study, Hüfner (2007) also evaluated the SEC disclosure’s
requirements in MD&A and the role of MD&A in providing useful information to the
investors. He pointed out that MD&A should contain predictive information, yet, the
forward-looking mandated disclosure is still insufficient since it has a slight indirect
foretelling ability. As well as, the future trends’ disclosure is unclear. SEC obliges the
entity’s management to disclose on the expected trends only, while neglecting the conditions
that affected these trends. In addition, MD&A reflects the management standpoint, thus,
there is no guarantee that the report will include the items that were demanded by the
investors and the users in general. Hufner argued that MD&A would be more sufficient and
match the investors’ needs if it provided information on the competition and available
opportunities in the market, with highlighting the risks that shape every activity or
production line.

62
Sun (2010) investigated the relationship between the disclosure on the
disproportionate increase of inventory in MD&A report and the users’ predictability of the
future performance. The authors suggested that when a firm provides more information to
explain that increase in the inventory, that type of information would reflect more
transparency and help the users in predicting the future returns. The study used experimental
approach and depended on observations; the sample included 568 industrial entities and the
covered a period of five years. All the chosen firms had reported, in MD&A report, an
increase in their inventories, but not all of them provided more explanations on the reasons
behind that increase. The results revealed that explaining the disproportionate inventory
increases correlate positively with good performance in the future, which includes the
growth and the revenues.
2.6 Discussion on the Prior Studies of the Usefulness of Management Report
This section includes an overview on the studies of the usefulness of the annual report,
that was mentioned in the first chapter, and on the studies that focused on the usefulness of
management report only, as in the previous section.
Overall, the vast majority of the studies on the developed markets found that MR and
chairman’s letter are the most useful sections in the annual report, in contrary with the results
from the emerging markets. However, many of these studies, in both developed and
emerging markets, aimed mainly to` investigate the usefulness of the annual reports sections
with headlines only, which would make the survey results to be dependent on the
respondents’ knowledge on the type of information that was disclosed in each section. In
that case, the responses would be different according to the legal system (i.e., common or
civil) and the user’s awareness of the most efficient way in using the information. On the
other hand, some studies demanded the users to state the most important information that
they desire to find in the annual report. In all these studies in the emerging markets, results
showed that the respondents seek more information on the future performance and risks.
This finding emphasizes the high usefulness that MR might present to its users if it included
these types of information.
In addition, many prior studies ignored the legal environment and did not demonstrate
the mandatory required disclosure in MR; instead, they focused only on evaluating the
current disclosure without asking the respondents about the information they desire. As
result, many prior studies could be described as ‘evaluation studies’ that do not provide any
63
suggestions to increase the usefulness of accounting reports. Nevertheless, (Perera 1989)
signified the effect of the cultural differences between the developed and the developing
countries, which therefore indicates that any empirical evidence from the developed
countries may not applicable on the less developed markets. It is well known that the
domestic culture and socioeconomic factors affect the disclosure practices significantly
(Gray 1988; Dahawy et al. 2002)
In the North Africa region, only two recent studies were undertaken by Hassan and
Power (2009), and Dahawy and Samaha (2010). However, these studies had a major
limitation since the response rate that they received was very low (around 15% and 24.7%
respectively), which limits the credibility of their findings and the possibility of generalizing
their results. The first study focused only on the viewpoint of the financial analysts, which
is never enough in providing comprehensive view on the usefulness of the annual report in
investments decision-making, for example. In additions, the second study included six
users-groups who have different motives in using the accounting information (e.g., the
auditors, academics, loan officers, financial analysts), therefore, the findings do not serve in
understanding the needs of the six users-groups together.
Additionally, some scholars investigated the usefulness of the business report from the
preparers’ view. (Graham et al. 2005) suggested that the directors are aware of the
importance of voluntary disclosure, thus, they endorse the increasing of the voluntary
disclosure to uphold the stocks prices; however, they have certain controls that limit the
disclosure quantity if a specific information would cause any unwanted behaviors by the
shareholders. Nonetheless, the studies that attempted to compare between the perceptions
of the preparers and the users have found significant differences. All the studies that focused
on the preparers’ perceptions (e.g., Chandra, 1974; Chandra and Greenball, 1977; Firth,
1978; Ho and Wong, 2001; Johansen and Plenborg, 2013; Kribat 2009; Stainbank and
Peebles 2006; Wallace 1988) documented that they regard the information to be less
important compared to the users. This common finding indicate an existing gap that shows
how the listed entities do not provide enough disclosure to the users, which plays a
significant effect on the market efficiency.
Moreover, the majority of these studies have similar limitation; their methodology.
Many studies have only employed questionnaire surveys, while not considering analysing
the content of annual reports in order to evaluate to what extent these reports include

64
voluntary information, which would provide stronger evidence on the disclosure practices
and whether the preparers, as the controller of the voluntary disclosure, disclose more
information, rather only than the mandatory items, or not. On the one hand, the financial
and nonfinancial disclosure have increased by the years, but there is still a lack of the
accounting research that distinguishes between the useful and the useless information
(Johansen and Plenborg 2013). On the other hand, Trombetta et al. (2012) referred to the
lack of the academic research that supports the standards setters and highlights the
weaknesses of the disclosure; by investigating the users’ view regard the usefulness of
information. The researcher believe that what Trombetta et al. claimed can be applicable on
the capital market authorities and regulators as well.
The prior studies that focused on the usefulness of MR showed that the financial
analysts’ forecasts accuracy correlates positively with the extent of MR disclosure; yet,
these studies were concerned only with the developed markets, USA and Canada
particularly, which refers to a gap in the research on the usefulness of MR in the emerging
markets. There was only one study in China that focused on the usefulness of the supervisory
board’s report, which did not include MR. The current study will focus only on MR content
with considering the mandatory disclosure requirements in addition to some voluntary
information. To the best of the researcher’s knowledge, this is the first study that focuses on
only MR in the emerging markets. The findings of the study can be applied on the similar
economies in Africa, and especially in North Africa countries.
Based on the previous arguments, the current study aims to investigate the usefulness
of MR in Egypt, as an emerging market, through two phases. First, exploring the perceptions
of the users who were involved in making investment decisions regarding the stocks using
a questionnaire survey. The questionnaire will include mandatory information and some
suggested voluntary items. This step aims to identify the information that they consider to
be useful and affect their investments decision-making. Second, analyzing the content of
the management reports prepared by the nonfinancial listed companies in the Egyptian stock
market.
Therefore, the study seeks to answer the following questions:
1- Do the current regulations provide useful information in MR that meet the users’
needs?

65
2- What are the users’ views regarding the usefulness of MR content? Are some
sections more useful than others?
3- Is there any difference in the usefulness of mandatory disclosure and the
suggested voluntary items in MR?
4- Does the listed companies’ current disclosure in MR provide useful and adequate
information that meets the users’ needs?
5- To what extent the firm-characteristics affect the disclosure level in MRs and its
sections?
2.7 Background of the Egyptian Context
Egypt is one of the oldest world civilizations since over than seven thousand years, as
it plays an effective political and economic role in the Middle-East area. Two uprisings, in
January 2011 and June 2013, added a momentum to the Egyptian context. These actions
have reflected upon an increased desire in the anti-corruption and transparency within all
the fields in the country. In this section, a discussion will be provided that covers four factors
in the Egyptian context; the culture, the accounting standards and practices, the regulation
system, and the capital stock market and the control bodies.
2.7.1 Culture
The disclosure practices vary between countries due to the cultural factors. Gray
(1988) argues that the environmental, societal, and institutional values have significant
influences on the accounting values. This influence includes how the accounting system
works and what the outcomes of this system can be.
Understanding the cultural factors may help understand the domestic context and the
accounting conducts in there. Hofstede (1984) argued that there are four cultural factors that
vary from one country or civilization to another. These factors includes the Individualism
versus Collectivism, Large versus Small Power Distance, Strong versus Weak Uncertainty
Avoidance, and Masculinity versus Femininity. Following Hofstede’s dimensions, Gray and
Vint (1995) sought to provide a simulation model to explain the effects of cultural values
on the accounting disclosure. Their model included four cultural values. The researcher
attempts to explain these values on the Egyptian context as follows:
- Professionalism versus Statutory Control: while the accounting standards are
supposed to be the main guide to the accounting practices, some of the Egyptian

66
laws/practices control the accounting work; even if these practices were in contrast
to the accounting standards (i.e., Lease and Fair Value implications). On the other
hand, the government is the main determiner of updating the accounting standards,
while the professionals’ role is restricted and limited only to help the governmental
authorities in updating the accounting standards.
- Uniformity versus Flexibility: Since it is a civil-law country, uniformity is common
within the Egyptian entities. Every entity has to disclose the required information
using the same form, which mainly applies on MR.
- Conservatism versus Optimism: Ahmed and Hussainey (2017) provided the first
ever evidence on the conservatism practices within the listed entities in EGX. They
measured the conservatism in two different periods; before and after 2011 uprising.
They found that the conservatism practices decreased to the half after 2011 uprising
compared with the previous periods. According to the researcher opinion, this
evidence would suggest that the conservatism or optimism are affected by political
and the economical actions more than the cultural aspects.
- Secrecy versus Transparency: some cultures would prefer to restrict any accounting
information and make it unobtainable for the public. This aspect would indicate less
transparency and lower ability of making management’s accountability. According
to Dahawy et al. (2002), Abd-Elsalam and Weetman (2007), and Dahawy and
Conover (2007), the Egyptian environment is secretive in its nature. They argued
that it is not easy for the Egyptian managers to divert to the full disclosure when they
got used to disclose so little information.
Abdel-Fattah (2008) suggested that the first-two values would be related to the legal
environment and the enforcement authority, while the other two values would be dependent
on the dominant culture in the society and the personal values.
According to the researcher opinion, it could be a challenge if a culture included high
conservatism and secrecy values when, at the same time, the enforcement authorities were
weak. In this case, the accounting disclosure will be less useful and the investors may look
for another market where the cultural values is supported by strong enforcement authorities
and a high useful disclosure as well.
2.7.2 The Accounting Standards and Practices
The current accounting practices in Egypt are backed to two different systems;
Uniform Accounting System and the Egyptian Accounting Standards. However,

67
understanding the current accounting practices requires knowing the developments in the
accounting environment over the last century.
2.7.2.1 The Egyptian Uniform Accounting System
Before the Egyptian revolution in 1952 the Egyptian economy was agricultural-based
mainly, based especially on exporting cotton, while the industrial activities were stationed
around the cotton products (Abd El-Salam 1999). After that revolution, more concern was
directed to increase the industrial investment. However, this change was focused on
managing the economy under the notion of the central planning and nationalization (Abd
El-Salam 1999). These changes were also reflected on the increase of the public-sector
companies (State-owned companies) and on the expanding of their activities, while the
private sector was fiddling. Therefore, there was a necessity in unifying the accounting
practices in order to control the public firms. In 1966, the Egyptian Uniform Accounting
System (UAS) was issued, and all the public firms, except for the banks and insurance
companies, have become obliged to follow its requirements in both bookkeeping and
preparing the financial report.
According to UAS, every public sector company has to present several statements in
its annual report; namely, the balance sheet, the account of profits and losses, the account
of production and trading, the production account, the changes of the financial position
statement, and cash flow statement (CAO 1966). The sole user of these reports were the
central government who own all the public-sector entities. However, as it was discussed
earlier, with the partial privatization of many firms in the public-sector companies in 1990s,
the business report of these companies became usable by other users. While the companies
that were still owned completely by the Egyptian government were called “public sector
companies”, the privatized entities were known as “public business sector”. These concepts
are well known in the business environment in Egypt.
It is noteworthy that the regulation mandates for the records and accounting reports
of both the public-sector firms and public-business firms to be audited by the Accountability
State Authority (ASA)3. However, some firms in the public business sector follow a double-
3 ASA was founded in 1942. The purpose of ASA is to monitor the expenses and the revenues of the
governmental units. ASA is an independent authority and it follows the Egyptian presidency directly (the
Egyptian constitution guarantee this independence).

68
check audit by being subjected to ASA auditing as well as to another external auditor,
especially from a big/known professional offices in Egypt4.
2.7.2.2 The Egyptian Accounting Standards (EAS)
In the early of 1990s, the Egyptian government adopted a reform program that
targeted the economy. According to the government view, the privatization was the primary
tool in undertaking this reform. Therefore, many public entities were subjected to a full
privatization by selling them to one investor or a group of investors, while some firms were
subjected to partial privatization by listing a percentage of their capital in EGX via the initial
public offering. There are three types of the privatization in Egypt; full privatization, partial
privatization, and privatization with holding a minority proportion. Full privatization refers
to the case where the government sell a full state-owned company to one investor or a group
of investors (natural or moral person/s). Partial privatization means that the state holds at
least 51% of the capital of a company and dominates the board of directors, while the
remaining capital gets subjected to listing in EGX. Privatisation with holding a minority
proportion refers to the case when the state lists the majority of a company’s shares in EGX
with holding a proportion less than 49%. The latest case means that the state does not have
the right to dominate the board of directors. Almost one holding company in each business
sector, in the case of privatisation with holding minority proportion, is the authority who
has the right to manage the state-owned companies and take investment decision regarding
the minority shares that are still being owned.
These changes in the ownership type, combined with a governmental common policy,
encourage the growth of the private sector and lead to the economic development.
Therefore, the need of a complete accounting system that can provide information for the
investors was a necessity.
In 1992, the Egyptian Institute of Accountants and Auditors (EIAA) issued twenty
accounting standards (EAS). Even though they would seems like a local-made standards,
these standards were very close to the international accounting standards (IAS) (Abd El-
Salam 1999). In 1997, the economy minister issued a decree (503/1997) to be effective from
January 1998, that substituted the previous standards with twenty-four accounting
standards. However, this version was once again subjected to a small number of
amendments in 2002 (Ebaid 2013). In 2006, a new version of EAS was issued by the
4 The researcher notices this aspect when analysed MR reports that will take part in chapter four.

69
ministry decree of (243/2006), which included thirty-five accounting standards. It was clear,
based on this version, that EAS is nothing but a translation of the IASs with some
modifications that makes it consistent with the Egyptian acts. The current version of EAS
has been issued in 2015 with an enforcement date of January 2016 and included thirty-nine
accounting standards. Although that Egypt has its own accounting standards that is officially
named the “Egyptian Accounting Standards (EAS)”, EAS, in its introduction section,
acknowledges that the standards were prepared in accordance with the International
Accounting Standards (IAS). Moreover, analysing EAS shows clearly that it was a modified
Arabic translation from the IAS English version, with some differences in EAS to be
matched with the local regulation.
The previous evidence clarifies that there are two different accounting systems exist
in Egypt. The first one is UAS, which applies on public business sector entities, and the
second one is EAS, which applies on the private sector entities even if they were not listed.
This means that the annual reports have some differences related to the number of statements
that must be included in them, as well as, the presentation form of these statements and their
notes. Interestingly, once a company becomes listed in EGX, it has to follow the listing rules
and preparation of the MR regardless of its ownership type (i.e., Private, State-owned, or
Partial state-owned). As it was discussed in the Chapter 2, every listed entity has to prepare
its MR following the requirements of both the Companies act and the listing rules. Likewise,
while the companies act originally applies on private joint-stock entities, the listing rules
enforce all the listed entities, regardless the ownership type, to follow the mandatory
disclosure in MR, as it was explained in both the listing rules and the executive regulation
of the CA (159/1981).
2.7.3 The Regulation System
Egypt is known to be one of the civil-law countries. Affected by Belgian and French
regulations, Egypt introduced the commercial and civil laws as the first Arab country to
have them (Abd El-Salam, 1999). Egypt has a traditional leading role in the Middle East
and the Arab region. Considerable number of the Egyptian regulators have worked as
experts in many of the Arab countries, especially in the Arabian Gulf countries, and have
participated in the preparation of many acts, which indicates that many acts in these
countries have been affected by the Egyptian culture and legal system (Abd El-Salam 1999).

70
Despite that the Egyptian regulation is based mainly on the civil law, regulations of
the Egyptian Capital Market (EGX) represent interesting and unique setting. The CA
(159/1981), like the majority of other Egyptian acts, has been prepared with insights from
the civil law. On the one hand, according to this act, the joint stock entities have to disclose
specific information in their MR. On the other hand, the Listing Rules (2002 and 2014) and
the Capital Market Act (95/1992) have been prepared according to the common law and the
listing rules of some Angelo-American countries (Abdel-Fattah, 2008). This made MR to
be subjected to two different legal backgrounds (5). As a result, every listed company has to
prepare its MR while considering both The CA, that is with a civil-law background, and the
Listing Rules, that are with a common-law background.
Moreover, while modifying the listing rules requires only a ratification from
Financial Regulatory Authority (FRA)’s board of directors, any change in the Companies
Act must be approved first by the Parliament and then from the President. This may explain
why the companies’ act is still in its original texts despite the passing of more than thirty-
seven years, while the listing rules were subjected to some major changes within the past
thirteen years.
2.7.4 Capital Stock Market and Control Bodies
The Egyptian Stock Exchange (EGX) was founded officially in 1883, by opening
Alexandria stock exchange and then followed by Cairo Exchange in 1903. EGX was very
active and grows rapidly, it was ranked as the fifth in the world in the 1940s (egx.com.eg).
Dramatically, EGX role was retreated in the 1960s due to the adoption of socialism (Fawzy
2003). In 1992, the Egyptian Government was trended toward a privatization program;
consequently, EGX was revived again and both the Alexandria and the Cairo exchanges
worked together as one market under one management board. It has become common that
a proportion of the capital of public business sector to be listed as a partial privatization.
This means that the listed firms were distinguished from private sector firms and public
business sector firms.
The growth of EGX was rapid in the 1990s. In 1994, EGX was ranked among the
most active markets (Abd El-Salam 1999). By 1997, EGX was classified as one of the
highest emerging markets (Abd El-Salam 1999). The market capitalization enormously
raised from 5 billion L.E in 1990 to 112 billion L.E in 1999 (Ahmed et al. 2015). In 2002,
based on the market capitalizations, EGX was ranked as second in the middle east and north
5 The disclosure requirements in MR is discussed earlier in this chapter.

71
Africa region (Ahmed et al. 2015). Starting from 2009, the names of Cairo and Alexandria
exchanges were changed to be the same; the “Egyptian Exchange”.
Over the first decade of this century, EGX has succeeded in attracting huge amounts
of investments (Table 2.1). In 2007, the market capitalization recorded a total of 768 billion
L.E; which equals 86% of the Gross Domestic Product (GDP). Affected by the financial
crisis in 2008 and the uprising of 2011, the market capitalization in 2015 fell to represent
only 24% of GDP (EGX (2015), 8). In 2016, Morgan Stanly foundation ranked EGX, based
on local currencies to measure the market capitalization, as the highest growing market
compared with other emerging markets (EGX 2016). Moreover, EGX was ranked by the
world bank as the 26th globally according to the disclosure index for 2016 (EGX (2016), 3).
Table 2. 1 Some Statistics Facts about the Listed Companies in EGX
Years
Number of
listed
companies
Number of
traded
companies
Trading
Volumes (In
billion)
Trading
Amounts (L.E.
billion)
Market
capitalization
(in L.E. billion)
Market
capitalization
to GDP
2000 1067 659 1 45.8 121 36%
2001 1110 643 1.18 24.66 112 31%
2002 1151 671 .707 25.8 122 32%
2003 978 540 1.2 23 172 35%
2004 795 503 1.79 36 234 43%
2005 744 441 4.2 151 456 74%
2006 595 407 7.8 271 534 80%
2007 435 337 11.4 321.5 768 86%
2008 373 322 21.9 476 474 46%
2009 306 289 28.6 333.5 500 48%
2010 212 211 28 273 488 40%
2011 213 204 16.9 130.5 294 21%
2012 213 204 33 166.5 376 24%
2013 212 206 27 146 427 21%
2014 214 206 56 265 500 25%
2015 221 217 43 226 425 22%
2016 222 213 66 265 600 25%
2017 222 213 76 296 825 30%
Source: the Annual Reports of EGX (available at: www.egx.com.eg/english/Services_Reports.aspx)
Regarding the control bodies and their role in enhancing the transparency, EGX was
subjected to the control of Capital Market Authority (CMA). In 1999, CMA established a
new sector called “The disclosure Division”. The role of this division was to review the
listed entities’ disclosures and suggest new policies to improve the transparency of the
disclosure6. In 2009, CMA, along with other supervisory authorities in several economic
6 http://www.egx.com.eg/arabic/history.aspx

72
sectors, was replaced by FRA. The role of that new body was to supervise and control all
the non-banking activities in Egypt, which included, for example, the listed entities in EGX,
the insurance companies, mortgage finance companies, lease, and securitization7.
2.8 The Egyptian Regulation Regarding the Disclosure in MR
The previous discussion shows that MR should provide useful information to the
users. As it known, the mandatory disclosure in MR is based mainly on the regulation’s
requirements, which is supposed to be useful to the users. Preparing MR in Egypt is a
mandatory process that is subjected to two regulations; The Companies Act (159/1981) and
its Executive Regulation (Hereafter, CA), and the Listing Rules. Furthermore, the Egyptian
guidelines regarding the corporate governance has emphasized the important role of MR
content in enhancing the transparency of the capital stocks market. This part includes a brief
description of the content of MR according to corporate governance guidelines and the legal
requirements, with distinguishing between the legal requirements under the old listing rules
(for the year of 2002) and the current listing rules (issued in January 2014).
2.8.1 The Content of MR in the Egyptian Market
The Egyptian code on CG was issued for the first time in 2005; it presented
recommendations and guidelines to the listed companies. In 2016, CG code was updated for
the first time since the issuing of the first code in 2005. The 2016 code included a wide
range of aims to enhance the usefulness of the accounting reporting by advising the listed
companies to prepare and disseminate a comprehensive accounting report that includes
several sub-reports. The same issues of the old version of CG code still have existed since
this current code presents some guidelines to increase the usefulness of disclosure but
without emphasize on any benefits or fines in the cases of compliance and noncompliance.
CG code (Section number 3.4) indicated that in order to have a useful MR, the following
information should be fully covered:
- Discussion on the financial results.
- The main achievements over the ended year.
- Analyzing of the competition in the market.
- The company’s strategy.
- The main changes in the administrative structure.
7 http://www.fra.gov.eg/content/efsa_en/efsa_pages_en/main_efsa_page_en.htm

73
- The board’s composition and the number of its meeting (and the same for the board’s
committees).
- Information related to the employees.
- Any fines or lawsuit issued against the company or one or more of its board of
directors.
- CSR and environmental performance over the year.
However, since the Egyptian CG is still merely as guidelines without having any
obligations, the disclosure on many of these sections is still voluntary and depends more on
the view of each company’s managers.
2.8.2 The requirements of the mandatory disclosure under The Egyptian regulation
The management report was prepared under specific articles; the appendix No. 1 of
the executive regulation of the Companies Act (No.159/1981) and the article No. 4 of the
listing rules. Table 2.2 illustrates briefly the mandatory disclosure required by both Acts,
with highlighting the changes made in disclosure in the old and the new listing rules.

74
Table 2. 2 Comparing the Disclosure Requirements before and after 2013
Panel A: The requirements of Companies Act (159/1981) - The entity’s general status, income and future performance.
- The suggested dividends.
- The suggestions related to the company reserves.
- The company’s and its subsidiaries entities’ main Activities, and any change in the
subsidiaries ownership.
- The assets fair value, if there are significant differences compared with the book value.
- The main changes in the fixed assets, in the entity and its subsidiaries entities.
- The segments performance and profits (or losses).
- The exports.
- The number of the entity’s employees and the total of their salaries.
- Any stocks were issued through the year.
- The donates and subsidiaries amounts/ activities through the year.
Any extra information that the board of directors think it is important to be included in BDR,
with comparing it with the last year values.
Panel B: The requirements of The Listing Rules (2002 Versus 2014)
The old listing rules (2002) The new listing rules (January 2014)
- The name of the
responsible person of the
investor relations, and how
to access him/her.
- The board members’
names and their role nature
(Executive- Non-
Executive- Independent).
- The board members’
qualifications and
experiences.
- The board members’
ownership.
- The shareholders who own
5% or more.
- The board’s committees
names, every committee
responsibilities, and the
members’ names
especially the audit
committee.
- The outstanding contracts
that the entity or its
subsidiaries entities.
- The litigations that the
entity takes part in it, and
the situation of every case.
- The same information that
is required by the
executive regulation of the
Companies’ Act.
a) General information:
- The entity name.
- The entity’s objectives.
- The company duration (the period that the entity is supposed
to achieve its objectives and therefore going to voluntary
liquidation)
- The main regulations that control the entity’s activities
- The listing date.
- Par value per share.
- The authorized capital and the paid capital.
b) Investor relations:
- The responsible person
- Head office address.
- Phone number/s, Fax number/s, Website, and E-mail.
c) Information related to the external auditor
- The auditor name.
- The nomination date.
- The auditor Registration Date and number (in the FRA’s
records).
d) The ownership structure and the board of directors’
ownership
- The shareholders who own 5% or more, the shares that are
owned for every owner ( 5% or more), and its percentage to the
stocks capital
- The Board Members Ownership, their shares amounts and the
percentage for every member.
- Treasury Stock – if any- classified according to the purchasing
dates, comparing with the previous year amounts and its
percentage to the whole capital.
e) The board of directors
- The board members’ names and any changes have occurred on
the board composition through the fiscal year.

75
- Every member position and their nature (Executive-Non-
Executive-Independent)
- The board meetings’ number during the year.
f) The audit committee
- The members’ names and their nature (Executive, Non-
Executive or Independent).
- The committee responsibilities.
- The number of the committee meetings during the year and
refer to any Important notes were detected through.
- Whether the audit committee’s reports were discussed by the
board of directors, and any important notes were solved or not.
g) The employees
- The average of the entity’s employees number through the
fiscal year.
- The average of the employees’ income (salaries and other
wages) through the fiscal year.
h) The stock option (if any)
- The available reward and incentive stock option
- Total shares that were given to the board members and
employees through the year
- The number of the recipient persons
- Shares amounts are given since applying the Reward and
incentive stock option system
- Names and Positions of persons who are received 5% or more
from the available shares (or 1% from the shares’ capital )
i) Infractions and actions related to the capital market law
and the Listing Rules
(Explain the actions that were taken against the
company or its board members or directors by stock market or
Egyptian Regulatory Authority (FRA), which relate to
violations of the Capital Market Law and its implementing
regulations and listing rules during the year and its reasons, and
how to address them and avoid their recurrence in the future "if
any").
j) Deals with Related Parties
(Including any contracts have been signed between the company
and one of the blockholders or their relatives through the past
year, with every contract value and its specifications, details)
k) Information related to social responsibility and
environmental activities.
l) The same information that is required by the executive
regulation of the Companies’ Act.
2.8.3 Discussing the Disclosure Requirements in the Egyptian MR
The new listing rules aim to increase the usefulness of information by obligating the
entities to provide more information on corporate governance and the social responsibility.
However, there are several weaknesses in the new requirements compared with IASB
framework on the management commentary. In order to highlight these shortages, the

76
researcher will compare between the Egyptian regulation and IASB’s viewpoint (8) regarding
the information that should be disclosed in MR to increase its usefulness:
- The nature of the entity activities: the Egyptian regulation covers many information
related to this section, yet, there is still no explicit texts that explain what information
should be disclosed to reflect the competition conditions and the entity’s structure.
This issue can provide the entity’s management with the chance to disclose fewer
information regardless of its extent of usefulness.
- Objectives and Strategies: neither the old nor the new requirements include any
information on the management’ strategies.
- Resources, risks and relationships: while the regulation demands providing
information on any transactions or contracts done between the firm and any other
parties, there is a clear lack of disclosure on the risks and risk management. This
lack enables the managers to avoid the disclosure on any threats; which may
accordingly mislead the investors and affect their decisions.
- Results and prospects: although that any entity has to report on the profit/losses of
its main activities, there is no specification on what information can describe or
explain the profits/losses and the reasons behind them. Furthermore, the same
limitation applies on the forward-looking performance disclosure. The regulation
states that every entity has to provide information on the future performance, but it
does not explain the volume and the extent of this information. It is likely that some
firms mention one sentence to cover this requirement; for example, “The future
performance is good”9. However, such expression does not clarify in which context
the future will be good; does it mean the revenues volumes, the profits, the market
share, the dividends, etc. This too wide explanation can be used by managers to
provide a useless level of disclosure without breaking the regulation.
- Key performance’s indicators: there are no requirements that cover the performance
indicators (i.e., the profitability indexes and the liquidity ratios).
These arguments highlight, apparently, some weaknesses in the Egyptian regulation
even after the amendments of 2014. However, this conclusion is still an assumption made
by reviewing the regulation, with no real evidence to confirm it; therefore, investigating the
8 The framework was discussed previously in this chapter in section 2.3. 9 During running the content analysis of the management reports in chapter four, the researcher noticed that
this expression is being used in many management reports.

77
Egyptians users’ views can provide an empirical evidence on the efficiency of this
regulation in meeting the users’ needs.
2.9 Theoretical Framework and developing the research questions
While there is a large agreement that decision-usefulness is the main objective of the
business reporting, the debate related to the management’s stewardship as an objective of
the disclosure still exists. There are two viewpoints about characterising the stewardship.
Some argue that the stewardship should be considered as a separate objective and that the
business reporting should include specific information to enable the users to assess the
stewards’ performance and efficiency. The supporters of this notion argue that there are
some variations in the users’ needs, which rises another challenge in covering the different
and conflicted objectives via a general-purpose business reporting.
Alternatively, others claim that it would not easy to develop an accounting framework
if it was based on multiple objectives for the high cost of preparing a specific report to each
and every user-group (Almahmoud 2000). Therefore, the vast majority of the accounting
bodies and the researchers argue that the main objective of the business reporting is
decision-usefulness, while the stewardship is a lesser objective; thus, the information that
help the users to make investment decisions could be also effectively used in assessing the
managers’ stewardship |(IASB (2008): Paragraphs BC1.24 & BC1.25; Lennard (2007).
Furthermore, the common framework of IASB and FASB on the accounting standards
places the accountability objective as second, while decision-usefulness as the first purpose
of introducing the business report, as it states:
“Both the Board’s and the IASB’s previous frameworks focused on
providing information that is useful in making economic decisions as
the fundamental objective of financial reporting. Those frameworks
also state that financial information that is useful in making economic
decisions would also be helpful in assessing how management has
fulfilled its stewardship responsibility.” BC1.24
Furthermore, as it was previously discussed, each of the approaches can be used in
designing a study that explores the users’ perceptions of the usage of the business report and
provide an explanation of their findings. However, the comparison between the two
approaches highlights some points that help in choosing the most relevant approach to the
current study:

78
- The accountability focuses more on the historical information, while decision-
usefulness requires information on the past, current, and future performance. It can
be argued that decision-usefulness provides much broader framework than that of
the accountability approach.
- The accountability mainly adopts the concept of control. The role of the control can
be played by the current investors, which means that the information will be
designed only for the “principles” role in the accountability of the management. In
contrast, decision-usefulness is concerned more about the current investors as well
as the potential investors. This is reflected on the types of information that are
disclosed in MD&A to motivate the current and potential investors.
- The investors’ ability of disciplining/punishing the management, when the entity’s
management fails to protect the assets and achieve relevant returns, has a different
range of decisions. According to the accountability approach, replacing the
management is the ideal way to punish them. However, this action requires a high
level of agreement between the owners, which means that the mangers can remain
in their positions if the blockholders had some common interests with them. While,
according to the decision-usefulness, the investor can sell the shares/bonds of the
unsuccessful enterprises and buy new shares/bonds of the successful ones.
According to this view, decision-usefulness can provide more protection and options
to the investors.
Based on these arguments, the current study adopts the decision-usefulness approach.
The current study suggests that in order to attain an adequate and reliable disclosure, the
users’ feedback on the usefulness of the accounting information is necessary in helping,
both the regulators and the managers, to provide the content that matches the users’ needs
and, consequently, maximize the MD&A usefulness. Figure (1) illustrates the overlapping
between the accounting standards and the regulation. The accounting standards focus on the
financial statements’ items that seem to be similar within many countries, such IAS (under
the widespread adoption of IAS), while the regulation concentrates mainly on other
disclosures, such as MD&A, CSR and environment statement, and the earning release.
These disclosures are associated with the local conditions, which relatively differ, while the
final product is the annual report that includes both the financial report and MD&A.
Moreover, the annual report includes more information; logically, there are some

79
Investors
Financial Analysts
Other Shareholders
Lenders
differences in the usefulness of this information, and therefore their effect on the investment
decision-making.
Feedback to
The regulators &
Standards setters
Increasing the
Usefulness of
Information
Feedback to the
Firm’s Managers
Figure 1
The disclosure channels and increasing the usefulness of accounting reporting (The source: Self-elaboration by the researcher)
Assessing the usefulness of this information should be done by the users, with taking
into consideration that the financial analysts play an important role in advising both the
sophisticated and the unsophisticated users. The users’ feedback should be considered by
both the regulators and the managers. According to the fact that the firms seek to comply
with the mandatory disclosure, the priority should be to update the disclosure’s regulation,
which would include adding new items to be disclosed and ignore some of the old items in
the future disclosure based on the insights of their benefit to the users. In order to reduce the
information asymmetry, the managers should provide important information even if it was
not mandated. The benefits of the disclosure will be reflected on the successful reputation
of the entities and will make the resources allocation to be more sufficient.
However, the mandatory MR disclosure encompasses two issues that may threaten
its usefulness. The first issue is the power of the enforcement authority and its ability to
obligate the firms to provide information. It is noteworthy that the firms are more likely to
be more concerned with the rigorous regulations; thus, the regulators should consider
+
According to those requirements, the entity is compelled
to prepare and represent the annual report, which covers:
-Historical and forward-looking information.
- Financial and narrative information.
- Information about the entity and its management too.
The regulations (including the
companies act & the listing rules
The accounting
standards
The Managers may decide to disclose additional
information voluntarily

80
issuing stringent mandatory rules to ensure a proper managerial behaviour. When the
authority is powerful, the firms are more likely to adopt transparent disclosure policies since
it may reduce the potentiality of a greater scrutiny by the agencies or any governmental
sanctions (Deegan and Gordon 1996). Some empirical evidence, however, found huge
variations in the disclosure practices across the firms within the same capital market, which
could indicate the weakness of the enforcement authorities (Hjelström et al. 2014).
The second issue relates to the relevance of the disclosure required by the regulators
in the users’ viewpoint. Assuming that the usefulness of the information should be reflected
on the investment decision-making, regulators should force the firms to provide the
information that meet the users’ needs. However, the literature provides evidence that show
the lack of mandatory disclosure requirements. Initially, AICPA (1994) found that the users
were dissatisfied with the mandatory disclosure’s requirements since they do not match their
needs. Similar findings were noted in the studies of Al-Mubarak (1997); Alzarouni et al.
(2011); Chandra (1974); and Mirshekary and Saudagaran (2005). Johansen and Plenborg
(2013) presented recent evidence suggesting that the regulators do not have an adequate
awareness of the information needed by the users. Despite the continuous efforts to improve
the regulation, the empirical evidence confirmed the existing gap between the views of
constructed-world and real-world users (Young 2006).
The above arguments highlight the importance of considering the users’ information
needs by the regulators, especially while changing or updating the disclosure requirements.
The new listing rules for the MR that were provided by the Egyptian regulation in 2014
represent an opportunity for investigation. We investigate whether the new requirements
have improved the usefulness of the MR that was provided by the firms operating in the
code law environment from the users’ viewpoint, based on the following research question:
RQ1: To what extent the users consider that new regulation provide useful disclosures
in MRs?
Several authors argued that the users of the financial reporting have unique attitudes
and needs (e.g., Durocher & Fortin 2011; Durocher et al., 2007; Schalow 1995; Tandy &
Wilburn 1996) . The need of the accounting information depends on the decisions that the
users intend to make. Normally, the investors look for the information that enables them to
make profitable investment decisions (Chenhall and Juchau 1977). Making this decision,
typically, requires information that covers, for example, the company’s performance over

81
past years, the estimated revenues and profits (forward-looking performance), and the risks
and the way the management deals with them (risks disclosure).
Other studies have also confirmed that users of accounting reports have different
priorities regarding the information needed in making the investments-decisions. For
example, Graham et al. (2002) documented that the information related to earnings growth
and risks are vital to the investors. Likewise, other authors included forward-looking
performance information10 as highly useful source of investment decision-making (AICPA,
1994; Al-Ajmi, 2009; Al-Mubarak, 1997; Anderson, 1981; Baker & Haslem, 1973; Beattie
& Pratt, 2002; Benjamin & Stanga, 1977; Chatterjee et al., 2010; Chenhall & Juchau, 1977;
Day, 1986; Graham et al., 2002; Lee & Tweedie, 1975a; Naser et al., 2003; Stainbank &
Peeble, 2006). A recent study by Johansen and Plenborg (2013) confirmed that the users
still seek more information that covers the forward-looking information, key performance
indicators, and risks. Similar findings were highlighted as well by Cohen et al. (2011), while
Biswas and Bala (2016) suggested that the users are not in fact concerned with corporate
governance and CSR.
What should be noted is that the current literature does not provide consistent
evidence on the extent of the effect of the different types of information on investment
decision-making. We seek to fill this gap in order to understand whether users have different
perceptions regarding the usefulness of information of MR provided by the firms, which
can enhance our understanding on the way the sophisticated investors perceive information
and its effect on their investments’ decisions. Therefore, considering the ongoing debate,
we aim to test the usefulness of each section within the MR, especially for firms operating
in the code law environment. Based on these bases we provide the following research
question:
RQ2: To what extent the users consider different kinds of information in the MR useful?
According to the theoretical framework of voluntary disclosure, as suggested in the
literature (Verrecchia 1983), it is argued that disclosure of information should help investors
gain a better understanding of the firms’ performance. Moreover, voluntary disclosure is
expected to provide a positive signal to the market’s participants that the firms are
performing well and are concerned also with their responsibilities (Barnett and Salomon
10 Some studies used the expression of “future forecasts”.

82
2012). Recent evidence showed that the mandatory disclosure is still weak and additional
useful information are needed to increase the market efficiency through the right resources
allocation (Alzarouni et al. 2011; Johansen and Plenborg 2013; Mirshekary and Saudagaran
2005) . We argue in this study that investors in the code law environments are likely to
consider voluntary disclosures to be useful for evaluating the risk in making investment
decisions. This expectation is based on the premise that disclosures would mitigate
information asymmetry between managers and investors (Ronen and Yaari 1993; Healy and
Palepu 2001) and, thus, enable the investors to make proper investment decisions (Kim and
Lyon 2011).
By contrast, it is recognized that the usefulness of voluntary information in
investments decision-making may have some challenges, as pointed out in the literature.
First, it is possible that voluntary disclosure may not truly reflect the firm’s performance,
especially when it involves proprietary costs (Li et al. 1997), and therefore may not be
considered useful for making investment decisions. Second, it is also possible that voluntary
disclosure may result in potential litigation (Matsumura et al. 2014; Jaggi et al. 2018). To the
best of our knowledge, there were only few studies that tested the usefulness of voluntary
disclosure based on the perceptions of the users. Empirically, Hassan and Power (2009) found
that the users perceive mandatory disclosure provided by Egyptian firms to be more useful than
voluntary disclosure. One could expect that if current regulation provides high useful
information to users, thus voluntary disclosure failure in awareness the users’ needs. Given the
inconclusive evidence on the usefulness of voluntary information for investors’ investments
decision-making, especially for the firms operating in the code law environment, we empirically
test users’ perceptions regarding the usefulness of the mandatory and voluntary disclosure
provided in the MR on the basis of the following research question:
RQ3: To what extent mandatory disclosures vs voluntary disclosures in the MR
are considered useful by the users?
A questionnaire survey will be carried out to answer these three questions; as shown
in the next chapter. Then, the results of the survey will be used in formulating a disclosure
index that measure the disclosure level, in Chapter four. Chapter four seeks to answer one
questions and examine one hypothesis. The question relates to the comparison between the
actual disclosure provided in MR by listed companies and the users’ needs, with
distinguishing between the disclosure level under both the old and the new regulation.

83
Therefore, a high level of disclosure would mean that the users’ needs are voluntarily
considered by the managers when a number of the items were not required by the regulation.
By contrast, the low disclosure level would suggest that users do not obtain the information
they desire to make real investment decisions. Therefore, this question is formulated as
follow:
RQ4: Does the current disclosure in MR provide useful information match the users’ needs?
Finally, the prior literature on the disclosure suggests that the firm-characteristics
may affect the disclosure practices among different companies (e.g., Akhtaruddin, 2005;
Alanezi & Albuloushi, 2011; Al-Janadi et al., 2013; Aljifri, 2008; Aljifri et al., 2014;
Boshnak, 2017; Cooke, 1992; Eng & Mak, 2003; Haniffa & Cooke, 2002; Hassan et al.,
2006; Lan et al., 2013; Makhija & Patton, 2004; Ntim et al., 2012; Street & Gray, 2002;
Wallace & Naser, 1995; Wang & Claiborne, 2008). It could be interesting to provide a
complete analysis on the usefulness of MR starting by the views of users, then comparing
between the actual disclosure in MR and the users’ needs, and by finally investigating the
effect of firm-characteristics on MR content. This analysis will depend mainly on the results
of the survey; the index will include the items that the users indicated to be either very useful
or moderate useful, while any useless items will be ignored. Therefore, the following
hypothesis is formulated to examine this notion:
HP1: There are significant impact of firm-characteristics on the disclosure provided in MR
by listed companies in EGX.
SUMMARY
The management report has become an important tool in supplementing the
weaknesses of the financial report. Indeed, many professional bodies and regulators have
tried to increase the extent of disclosure provided in MR and improve the usefulness of its
content to back the investment decisions made by the investors. However, our analysis
shows that the Egyptian regulation is still far from obligating listed companies to provide
high quality information in MR compared with the suggested disclosures of IASB
framework regarding the management commentary. The following two chapters aim to
provide an empirical evidence on the usefulness of the current mandatory disclosure
required in MR, in addition to suggest some voluntary items to be disclosed in MR using a

84
questionnaire survey. Then, a content analysis will be adopted in light of the responses given
by the user-groups on the questionnaire. The disclosure index is a useful tool in measuring
the disclosure level in MR and in assessing whether the current disclosure reflects the users’
needs.

85
CHAPTER THREE: The Users’ Perceptions Regarding the Usefulness of MR
on Investments Decision-Making
3.1 Introduction
As it was discussed in Chapter two, any scientific investigation is based mainly on
the using of some methods to provide evidence regarding a specific phenomenon. The
methods provide the researchers with ability to reach some conclusions on the subject/s
under the investigation. This chapter will include the first utilized method in this study; the
survey questionnaire. The next section of this chapter will discuss the questionnaire’s
design, followed by an identification of the user-groups in section three. Section four will
illustrate the data collection and then it will highlight the relevant statistical tests that was
used in answering the research questions. The remaining part of the chapter will cover the
questionnaire’s reliability and validity, the participants’ profile, and the research questions
of the study.
3.2 The Methodology design
Ewert and Wagenhofer (2012) disapproved the use of questionnaires since they are
not a favourable methodology in the accounting field. However, some scholars claimed that
the survey and the interviews are the main methods that could be used in assessing the
usefulness of the accounting information as seen by the users (Breton and Taffler 2001;
Dhaliwal 1980; Hassan and Power 2009; Johansen and Plenborg 2013). Furthermore,
investigating some phenomena solely using surveys or interviews could be an effective and
relevant method when there is no other method that could be applicable or give accurate
results (Bouwman et al. 1987; Cooper and Schindler 2003; Johansen and Plenborg 2013).
Based on our opinion, studies that seek to measure the usefulness through analysing
only either the analysts’ reports or the market prices have major shortcomings. These
approaches depend on assessing the usefulness through evaluating the current disclosure,
which means they presume that the current disclosure is adequate and provides all the useful
information that the users desire. While, using the survey or the interview methods can
highlight the missing information that the current disclosure does not provide, and probably
the investors decisions could have been different if this information had been disclosed.
Likewise, the survey is the dominant method used in most studies of usefulness of
the accounting information (e.g., AICPA, 1994; Abu-Nassar & Rutherford, 1996; Al-Ajmi,
2009; Al-Maliki et al., 2015; Al-Mubarak, 1997; Al-Razeen & Karbhari, 2004; Alattar &
Al-Khater, 2008; Almahmoud, 2000; Alzarouni et al., 2011; Bartlett & Chandler, 1997;

86
Beattie & Pratt, 2002; Benjamin & Stanga 1977; Chatterjee et al., 2010; Dahya et al., 2003;
Dawd et al., (2018); De-Zoysa & Rudkin, 2010; Hassan & Power, 2009; Kribat, 2009; Lee
& Tweedie 1975b, 1975a; McNally et al., 1982; Naser et al., 2003; Rahman, 2001;
Vergoossen, 1993). We argue that using a questionnaire approach would provide a deeper
understanding of the usefulness of MR content.
Formulating a brief, focused and comprehensive questionnaire is necessary to get
accurate responses. When deciding to use a questionnaire, there are three options to choose
from in designing it (Bourque and Clarck 1992):
- Using a questionnaire that has been already used in a different study and without
making any changes to it.
- Modifying a questionnaire that has been used in a different study.
- Designing a new questionnaire.
The first and the second options are useful if the primary purpose of the intended
study was to compare its findings with the original study(ies). The third option (designing a
new questionnaire) is more relevant to our study objectives. As the current study investigates
the usefulness of MR from the user’ viewpoint, which, in our best knowledge, has not been
investigated before in any previous study. For this reason, it was decided to design a
questionnaire based on the nature of the MR content.
Wallace (1988) claimed that when a researcher decides to formulate his own
questionnaire, he should consider three possible options to choose from when deciding the
items that will appear in the questionnaire, which could be:
- Mandatory disclosure items;
- Another study examined items; or
- Another study suggested items; but never examined.
However, we add a fourth element to Wallace classification that is “mandatory
disclosure item in another country or as was suggested by a professional body or an
international organization”. The developed markets’ context provides two important tools
to the disclosure of MR; higher mandatory requirements disclosure and additional
guidelines to the voluntary disclosure. It could be interesting to investigate the usefulness
of some items that were mandated or suggested as voluntary items in an emerging market.
Following this argument, two phases were followed in order to identify which items
should appear in the questionnaire. Firstly, in order to identify the mandatory disclosure

87
items, the researcher carefully reviewed the disclosure requirements of the Egyptian
regulations, which included The Companies Act and the new listing rules. Secondly, another
review was carried out to cover both literatures on the voluntary disclosure and the
regulations and the guidelines of MR as well, such as SEC in USA, CPA in Canada, FRC
in the UK, and IASB framework on the management commentary. The aim of that review
was to identify whether there was some useful information should be included in MR yet
the current regulation in Egypt does not require it. Including these suggested items in the
questionnaire can highlight the weaknesses, if any, and provide a feedback to both the
managers, that can promote more voluntary disclosure, and the regulators, that can be
considered when updating the listing rules.
Analysing the mandatory disclosure’ requirements in Egypt shows that some
disclosures are incomplete. For example, every listed firm has to provide disclosure on the
manager’s ownership, as individuals, as well as on the shareholders who own 5% or more
of the shares, while the changes that occurred in these ownerships compared with the last
year are not required. The users may, however, find the changes happened in the
blockholders’ and managers’ ownerships as indicators that reflect the firm performance and
the success of its strategy. Another example is that the regulations do not demand any
disclosure on the skills and experiences of the board and its committee’s members. Thus,
every section in the questionnaire included mandatory items and some proposed voluntary
items.
The following phase was to formulate the questions of the questionnaire. There are
two main approaches in formulating the questions; closed-ended questions and open-ended
questions, however, both of them has some limitations.
Open-ended questions mean that the respondent should read every question and think
on how to write an answer to it. This gives the respondent the chance to write down his own
viewpoint freely and without any forced-answers. However, in some cases, the respondent
may misunderstand what the question means and what are the possible answers to it, which
may lead to incomplete or false responses. Furthermore, as these types of questions require
writing the answers, the response rate may not be very high due to the long time that the
respondent should spend on the writing. Moreover, if the respondent was not used to express
his opinion in a written format, his responses may not be clear to the other party. Finally, it
would not be easy to code the answers and to statistically analyse them since there were no
specific possible answers (Saunders et al. 2009).

88
Closed- ended questions is based on providing a number of possible answers for each
and every question while the respondent circles or marks the relevant answer to his view.
This type of questions are much clearer, easier, and quick to answer; since they are easier to
be coded and analysed compared with the open-ended questions (De Vaus 2002). However,
the main problem of this format is related to the question of what would happen if the
respondent did not find the answer that best reflects his opinion amongst the provided
answers? This would mean that this case would likely to get inaccurate responses.
De Vaus (2002) argued that there is no wrong approach and that each approach could
be used depending on the context and the purpose of the study. However, he suggested that
the closed-ended questions can produce high quality answers if the researcher made his
questionnaire as a self-administrated, which would enable the respondents to understand
each question better without needing any further explanations from the interviewer (De
Vaus 2002). Moreover, some researchers found that the closed-ended questions are more
reliable than the open-ended ones (Frazer and Lawley 2001; Gillham 2008; Rowley 2014).
It was decided to design the questionnaire following the closed-ended style. Only one
open-ended optional question was inserted in the second section of the questionnaire. The
aim of that question was to acquire any suggestions from the respondents regarding the
important committee/s that they would have wanted to be disclosed in MR, other than the
audit committee.
The first revised questionnaire included seventy-seven items divided into seven
sections. However, in order to examine the questionnaire’s relevance, short interviews with
five financial analysts and two institutional investors, who were randomly selected, was
held. With an insight from the interviewees’ notes, some changes were made in the
questionnaire; therefore, some items were added or combined together, while some
information was completely ignored. The final questionnaire included forty-seven closed-
ended questions and one open-ended questions, and it was divided into eight sections and
subsections in addition to a separate part includes general questions. Table 3.1 shows the
number of items in every section, classified into mandatory and voluntary items. The table
illustrates that the questionnaire included seventeen mandatory information and twenty-two
voluntary items. While the remaining questions were eight in the first section, and one open-
ended question in the second section.

89
The final design of the questionnaire included a cover page and was followed by two
parts. The cover page is likely to affect the response rate (De Vaus 2002), therefore, this
page has been worded in a careful way to give good impressions to the participants. The
page mentioned the purpose of the survey and clarified that the respondents’ answers and
personal information will be used for scientific purposes only. After the cover page, the first
part of the questionnaire included seven personal questions related to the respondent’s
profile (name, age, qualification, specialization, experience, the company activity, and the
ownership type). The second part included forty-eight questions divided into seven parts, as
follows:
a) Section one aims to answer the first-two questions. The first two-questions in this
section investigate the users’ agreement with the effect of the new listing rules on
increasing the usefulness of MR. The subsequent three-questions highlight the
usefulness of the current disclosure in MR in general, and whether it provides
complementary (to the financial report content), understandable, and useful
information. The last three questions of this section cover three different issues; the
question number six highlights whether the listed entities tend to disclose the
minimum level of information without considering the users’ needs, question
number seven focuses on the role of using graphs and tables as tools in making MR
more readable and understandable, and the final question investigates whether the
respondents think that any entity that does not make its MR available on its website
should be sanctioned by the authorities.
b) Section two focuses on corporate governance disclosure. It includes three subgroups;
the ownership structure, the board composition, and audit committee. This section
includes one open-ended question that discovers if the respondents seek information
on other committees.
c) Section three investigates the importance of risk management and internal control
and how the management strategies control risks.
d) Section four focuses on key performance indicators within the ended year; the
indicators included the profitability and liquidity ratios, in addition, it compares the
actual sales/revenues and profits with the targeted ones.
e) Section five covers the main changes in the fixed assets or their fair value. The
Egyptian Accounting standards (EAS) prevent any re-evaluation to the fixed assets
in the financial statements even if there was certain evidence on a considerable

90
increase or decrease in their values; instead, the companies must admit these
changes, if any, in the BDR.
f) Section six combines between the mandatory and voluntary disclosure on forward-
looking performance. The forward-looking disclosure reflects the expansion plans
and, therefore, the firm situation within the markets.
g) Section seven includes information on the CSR and the environment responsibility,
it mentions some information on the employees and the relations with the
surrounded society.
Table 3.1 summarizes all these parts with distinguishing between mandatory and
voluntary items.
Table 3. 1 The Questionnaire’s Sections and Sub-sections
Number sections/sub-sections Items Count Total
M V
1 General Information on MR -- -- 8
2 Corporate Governance
The ownership structure
Board Structure
Audit Committee
Other Committee
3
2
3
--
2
2
2
--
5
4
5
1
3 Risk Management and Internal Control - 4 4
4 Key Performance Indicators 2 4 6
5 The Main Changes in Fixed Assets 2 1 3
6 Forward-Looking Performance 1 3 4
7 CSR and Environmental Performance 4 4 8
Total 17 22 48
M: Mandatory; V : Voluntary. OQ open-ended question.
As the questionnaire was shaped in closed-ended questions, Likert-scale with five
points was adopted. Since the first section of the questionnaire measures the level of
agreement with its questions, the possible answers and their weighted points for this section
were 1: strongly disagree, 2: disagree, 3: somewhat agree, 4: agree, and 5: strongly agree.
The remaining six sections were aiming to assess the usefulness degree; hence, the possible
answers and their weighted points were 1: not useful at all, 2: not useful, 3: slight useful, 4:
useful, and 5: very useful.

91
3.3 Identifying the User-Groups for the Current Study
The literature on the usefulness of the business report presented several attitudes of
the users-groups that were subjected to the surveys. Some studies focused on one user-
group, other studies included two user-groups, while some studies investigated several user-
groups. De-Zoysa and Rudkin (2010) criticised the studies that focused only on the
investors, the financial analysts, or even just the both . They claimed that, since the business
report is of a general-purpose, the investigation of the usefulness should include all user-
groups who were supposed to use the report. However, in our view, if a study covered
several user-groups, its findings may get significantly weakened. For example, if a study
were to investigate several user-groups including the ‘authorities of environmental
protecting’ as one of these groups, it is highly likely for the respondents within this group
to mark most of the information as not useful, even the information on the risks and the
profits, while they would probably mark the environment-related information as extremely
useful. In this case, the findings cannot be generalized because the users’ decisions were
very different, which make the usefulness to be a proportional concept that depends on the
decisions’ context. Consequently, it was decided to focus on investigating the usefulness of
MR for the investments decision-making.
Following this point, some researchers referred to significant differences in the
awareness of the professionals and the non-professionals regarding the usefulness of the
accounting information. Beattie & Pratt (2002) argued that the professional users are more
sophisticated and use the business report usually in investments’ decision- making. In their
opinion, the term ‘professional users’ includes three user-groups; the institutional investors,
the lenders, and the financial analysts. On the other hand, most of the individual investors
have little knowledge and understanding of the business reports’ content, especially those
who own a small ownerships (Alrazeen 1999; Beattie and Pratt 2002). Beattie and Pratt also
added that conducting an effective survey requires applying it on homogeneous user-groups
who are well qualified to assess the usefulness of business reporting.
Likewise, some previous studies tended to exclude the individual users (Chandra
1974; Firth 1978; Kribat 2009; McNally et al. 1982) . There are two possible reasons for
this exclusion. First, many of the individual investors do not have an accounting background
or an adequate ability to understand and use the business reports’ information, therefor, they
would depend on the financial analysts’ advice in making their investment decisions (Lee
and Tweedie 1977; Day 1986). This notion could be seen in Baker’s and Haslem’s findings;

92
they documented that only 8% of the individual users depend on the business report in
investments decision-making, while 61% depend on the financial analysts’ reports or
advices (Baker and Haslem 1973).
Second, with the several challenges in using the internet facilities (i.e., the online
surveys or emails)11, it is not easy for a researcher in an emerging or developing market to
meet with the individual investors, due to the fact that those users are geographically
dispersed, which would require a long time and a high cost to obtain their responses
(Alrazeen 1999; Kribat 2009). Furthermore, the findings of the studies of Alzarouni et al.
(2011), Alattar and Al-Khater (2008), and Al-Ajmi (2009) documented that the individual
investors in the emerging markets consider the annual report to be less useful source of
information than the other groups do. These reasons confirm that many of the individual
investors depend directly on the advice of the financial analysts’ or their published reports.
Following this argument, the current study focuses only on two user-groups; the
institutional investors and the financial analysts.
3.3.1 The Financial Analysts
The main tasks of the financial analysts are to analyse the accounting information,
issue their reports, and advice their clients. Mautz and Sharaf (1961) argued that the
financial analysts are the ideal qualified users who can understand and analyse the business
report. This user-group was the subject of many prior studies (e.g., Abu-Nassar &
Rutherford, 1996; Almahmoud, 2000; Alzarouni et al., 2011; Baker & Haslem, 1973;
Hassan & Power, 2009; Ho & Wong, 2001; Johansen & Plenborg, 2013; Mirshekary &
Saudagaran, 2005). Therefore, the financial analysts can be helpful in assessing the
usefulness of MR content.
In the Egyptian context, the financial analysts work at stockbrokerage firms,
therefore, the researcher began by determining the number of the stockbrokerages in the
stock market. According to EFSA website, the accredited stockbrokerages in Egypt were
148 companies12. There are some differences between these firms such as the size, age, and
market share. In order to avoid any bias error, it was decided to ignore all these differences
11 As it was discussed earlier in this chapter, the secrecy is a main factor in a country like Egypt, which means
that it is difficult to collect the contact details of the individual investors, such as their phone numbers,
emails, and addresses. 12 Official list by the Egyptian Stock Exchange on January 1, 2016.

93
and distribute only one questionnaire to each stockbrokerage to be filled by the major
financial analyst.
Five of the stockbrokerages ceased their activities completely and were under the
optional clearance as a result of the accumulated losses13 (Table 3.2). Furthermore, twenty-
nine of the stockbrokerages laid off their financial analysts in order to cut their losses or
produce some profit/surplus. However, these stockbrokerages still rely on the big
brokerages' financial analysts’ reports in advising their clients. Moreover, twenty-nine
financial analysts refused to fill-in or even read the questionnaire. Eighty-five
questionnaires were distributed across this user-group, while seventy-eight questionnaires
were collected back (91.76% of the distributed ones, and 52.7% of the total number of the
original user-group).
3.3.2 The Institutional investors
The institutional ownership in the OECD countries has increased significantly from
110% of GDP in 1995 to 163% of GDP in 2005 (Cascino et al. 2014), and it even reached
71$ trillion in 201014. These amounts highlight the huge investments that the institutional
investors can manage in modern economies. In addition, Cole and Jones (2005) emphasized
the positive effect of the intuitional ownership on the disclosure quality. They indicated that
the institutional investors desire more disclosures in order to invest in an entity; therefore,
the managers of that entity attempt to attract more institutional investors by publishing high-
quality MR reports.
In the emerging markets, institutional investors invest huge amounts of money in the
capital markets (Almahmoud 2000). Baker and Haslem (1973) considered the institutional
investors as one of the most qualified user-groups that should participate in investigating
the usefulness of accounting information. They associated this argument to the relevant
qualifications of those users and their accounting background; since they work in big
institutions where there are professional analysis and use of any information. This argument
underlines the increased chance of receiving high-quality responses from the participants of
this group. Likewise, many previous studies included the institutional investors in their
sample to investigate the usefulness of accounting disclosure (e.g.: (Anderson 1981, Chang
13 The researcher met with some of the employees of these firms, and they were working only to finish any
contracts or commitments for their existing clients. They said that the rapid political changes in Egypt had
a negative effect on the trading of securities 14 https://stats.oecd.org/Index.aspx?DataSetCode=7IA_A_Q
94
and Most 1981, Abu-Nassar and Rutherford 1996, Al-Hussaini, 2003; Naser, Nuseibeh et
al. 2003, Mirshekary and Saudagaran 2005, De Zoysa and Rudkin 2010, Alzarouni, Aljifri
et al. 2011).
It was decided to survey the banks and the insurance companies as institutional
investors. According to the data from the Central Bank of Egypt, there were thirty-eight
working banks in Egypt15, while, the list of the accredited insurance companies was
available online on The Financial Regulatory Authority’ website (FRA ).The number of the
insurance companies was twenty-seven; accordingly, the total sample of this user-group was
sixty-five intuitional investors. The person who was intended to fill-in the questionnaire was
the director of securities division (DSD) or his/her vice in each institutional investor.
Forty-four questionnaires were distributed across the participants of this group
(Table 3.2). As the data was collected in-person, the researcher found that eight of the
intuitional investors ended their investments in EGX. They explained the reason behind their
decisions with the instability of the Egyptian capital market due to the increased risks after
the uprising of 25 January 2011. Interestingly, all those investors were originally foreigners,
and the decisions of suspending their investments in the Egyptian securities were taken by
the head offices of their origin country. However, thirteen investors refused allowing us to
meet with the DSD or his/her vice; they related this to the rules of higher managers. Only
forty-four investors agreed to receive the questionnaires, however, the returned
questionnaire were thirty-six (81.8% of the distributed ones and 55.4% of the total
institutional investors in Egypt).
3.4 Distributing and Collecting the Questionnaires
Distributing and collecting the questionnaires in person require a long time and high
costs, thus, it was decided to send the survey by emails, whenever it was possible. The first
problem the researcher faced was that the vast majority of the financial analysts’ emails
were not available to the public. Moreover, considerable number of the stockbrokerages do
not have working websites. For instance, when checking the websites of the first fifty
stockbrokerages in EFSA list in order, only seventeen stockbrokerages were found to have
working websites; however, only three of these websites included contact emails. As result,
at this phase, we focused on the institutional investors because they were bigger institutions
15 The total banks in Egypt were forty banks, but, according to the Central bank of Egypt, there were two banks
under voluntary liquidation, thus, both of them were ignored.

95
and have more integrated websites. Fifty-five, out of sixty-five, institutional investors
provided general email-addresses on their websites; therefore, we sent emails to those users
and requested from whoever receives these emails to forward them to DSD or his/her vice.
After a whole month of sending these emails, the researcher had not receive any
response back from any institutional investor. Therefore, it was decided to distribute and
collect the questionnaires in-person for both users-groups. Data collection took three
months, from July to September 2016. Table 3.2 offers the numbers and percentages of the
distributed and collected questionnaires from both the users-groups.
Table 3. 2 Summary of Data Collecting Process
The respondents
Total
Excluded Firms Valid respondents to run the survey
No
analy
st exists
Sto
pp
ed /u
nder
clearance
Sto
pped
Inv
estmen
ts in
EG
X S
tock
s
Refu
sed to
fill
To
tal exclu
ded
Total
applicable
Distributed
Collected Not
returned
FA Number 148 29 5 -- 29 63 85 78 7
Percentage -- -- -- -- -- -- 100 % 91.77% 8.23%
I Number 65 -- -- 8 13 21 44 36 8
Percentage -- -- -- -- -- -- 100% 81.82% 18.18%
Total Sums 213 92 5 8 42 84 129 114 15
Percentage -- -- -- -- -- -- 100 % 88.37% 11.63%
3.5 Identifying the Used Statistical Tests
In order to answer the research questions of the current study, the SPSS package was
used. Since the study focuses on two user-groups, the statistical test will be used in
examining whether there are significant differences between the financial analysts’ and
institutional investors’ needs of information in MR.
The statistical analysis presents two different classes of tests; Parametric and
Nonparametric, however, each class of these tests is preferred to be used in specific
conditions, which means that determining the type of statistical analysis is very important
to achieve accurate results. The characteristics of the collected data are the key in choosing
the relevant test/s of Parametric or Nonparametric tests. Statistically, using Parametric tests
requires the existence of some assumptions within the data; which are as follow (Field 2009;
Dancey and Reidy 2007):

96
a) The collected data is normally distributed;
b) The variance within the date is homogeneous and changes randomly (not
systematically);
c) The data is based on interval scale; and
d) The data is independent even it was collected from different subjects.
Once it was decided to use a questionnaire survey, these conditions could not be
easily matched. The responses regarding how the users perceive the usefulness of
information would not likely to follow the normal distribution. To make sure, the researcher
checked the normality of the collected data; unfortunately, the results showed that the data
were not normally distributed. Furthermore, since the responses were weighted according
to Likert-five-points-scale, the data was ordinal and not interval. While, in this case, the
parametric tests might gave inaccurate results, alternatively, nonparametric tests could be
used without any limitations or specific conditions. Dancey and Reidy (2007) describe
nonparametric tests as “assumption-free tests”, because they do not require any special
conditions in analysing the data. However, some researchers claimed that using
nonparametric tests can produce less strong findings compared with obtaining them by using
parametric tests; however, this assumption is not always true (Dancey and Reidy 2007).
Even though Norman (2010) provided some evidence regarding the possibility of using
parametric tests without considering the four above-mentioned conditions, Smith (2003)
argued that using parametric tests with ordinal data is incorrect.
Dancey and Reidy (2007) also argued that using Mann-Whitney or Wilcoxon rank-
sum, as nonparametric tests, with unequal-sized groups can produce more accurate results
than the t-test, as parametric test. We argue that using nonparametric tests is more common
and widely used in the business research when using questionnaire survey or content
analysis, therefore, nonparametric tests will be used in analysing the current study data.
The current study uses Mann-Whitney as one of the most common nonparametric
tests in business research. Mann-Whitney test is usually used to show any significant
differences between either two groups or variables, which makes it an equivalent test to the
T-test as a parametric test. Accordingly, this test will be used to analyse the responses of the
survey.
3.6 Reliability and Validity

97
3.6.1 Reliability
One of the major concerns in the scientific research, and especially in the social
sciences, is related to ensuring a confident level of reliability and validity. Reliability is
achieved when the used techniques in collecting and analysing the data are dependable. The
dependability means that if the same measure/method was applied again, or many times, it
will still give consistent results each time (Bhattacherjee 2012; Saunders et al. 2009).
However, this assumption is dependent on that the investigated phenomenon does not
change (Bhattacherjee 2012). Increasing the reliability is correlated positively with the
researcher’s objectivity. This requires formulating the survey in a clear way and asking the
questions that are considered to be clear and known to the respondents (Bhattacherjee 2012).
It could be argued that reliability means formulating the questionnaire’s statements in a clear
language and in an independent way.
According to Easterby-Smith et al. (2008), the reliability can be assessed by
answering three questions:
- Will the used measures produce the same findings on repeated occasions?
- Is it possible to reach similar findings by other researchers?
- What guarantees an adequate level of transparency when using the raw data?
Moreover, Saunders et al. (2009) and Robson and Kieran (2016) referred to four
factors that shape the reliability when carrying out a survey or interviews, as follow:
a) The Participant Error: occurs when the observer sets an inconvenient time to meet
with the interviewees or the respondents. For example, if a study was aiming to
measure the employees’ enthusiasm, it would not be appropriate to meet with the
respondents at Monday’s morning when they have a lot of work, or on Friday’s
afternoon when they are looking forward to their vacation. To avoid this issue, the
researcher should choose a neutral time that can provide more accurate responses.
b) The participant bias: in some cases, the respondents could fill the questionnaire
with responses that they think their bosses would want, which makes such responses
unreflective of the participants’ real viewpoints. This issue is common in the
organizations in which the high management specifies certain individuals to fill the
questionnaires, or when there is a threat of employment insecurity within the
organization. Overcoming this challenge depends on the way that was followed in
designing the questionnaire’s questions or statements. A researcher should formulate

98
the questions or the statements in a way that enables him to get the participants’ real
viewpoints.
c) The observer error: this threat is related to the way the questions were asked,
especially when the survey or interview was conducted by two or more observers. It
is likely that every observer has a different style in asking questions and a different
way that he follows in interacting with the participants.
d) The observer bias: explaining the participants’ responses should be done in an
unbiased way, even if the findings did not match the researcher expectations.
In the current investigation, we sought to achieve the maximum level of reliability.
For the participants’ error, the questionnaires were distributed in-person and every
respondent was asked to choose the most appropriate time for him/her to fill-in the
questionnaire. Some participants asked for the questionnaire to be left at their offices so that
they can fill it later; their request was welcomed. This made the survey to be free of the
participant error. Second, to minimise the participants’ bias, it was not required for the
respondents to write their names on the questionnaire, as we also emphasized that the
responses will be secured and will be used for the research purposes only. Third, the
observer error did not take place in the current study; the distribution and collection of the
questionnaire was done by the researcher only. Finally, as the current investigation was
based on quantitative approach, using a questionnaire that included closed-ended questions,
increased the objectivity of the findings and minimised the observer’s bias.
However, since it was not, logically, possible to repeat the survey and compare the
participants answers in order to examine the reliability, there was another approach that also
examines the consistency of a participant’s response depending on a statistical test. This
approach applies a kind of simulation at the same points of agreement and time whereas the
original responses were obtained (Smith 2003). This approach is called “Alpha Cronbach”,
and it provides an overall score that ranges between zero and 1 to reflect the reliability of a
questionnaire. It is widely agreed that the reliability occurs when Alpha Cronbach Score
records 0.7 or more (De Vaus 2002). When the score raises, it implies a higher level of
consistency and the reliability. The results of Alpha for the collected data recorded a score
of 0.903 and 0.912 for the financial analysts and the institutional investors and respectively,
while the overall score for the whole sample reached 0.907 (Table 3.3). These high scores
ensured a high level of reliability in the collected data.

99
Table 3. 3 Alpha Cronbach’s Scores for users-groups
Users-Groups The respondents Alpha Cronbach’s Score
Financial analysts 78 .903
Institutional investors 36 .912
All responses 114 .907
Finally, Non-Response Bias is another external threat of using questionnaire survey.
This challenge is likely to occur when some of the participants do not fill-in their
questionnaires early. Therefore, in order to increase the response rate, a researcher may
decide to contact the respondents several times to encourage them to fill the questionnaire,
and even resend other copies of the questionnaire. While this action could increase the
responses rate significantly, the non-response bias is likely to affect the credibility of late
responses. Non-response bias means that if some respondents did not fill-in the
questionnaires early or after receiving it by the post/email, there would be some doubts
related to whether the answers provided was given with high focus and care, or the
respondents just randomly chose the answers (Smith 2003). However, in the current study,
the non-response bias does not take place because the questionnaires were distributed and
returned in-person, and the majority of respondents fill the questionnaire within the same
day they received it; no more than 5% of them filled it within two days later.
3.6.2 The validity
The validity refers to the clear identification of the concepts that were used in the
questionnaire. The validity of the questionnaire content is an essential factor that determines
whether the results could be trusted or not (De Vaus 2002). Filling a questionnaire,
generally, is based on the respondents’ personal attitudes, which means that if the same
questionnaire was to be re-filled again, the respondents may choose different answers. To
minimise this issue, the questionnaire should be constructed using clear and easily-
understandable language. At this point, De Vaus (2002) argues that if the questionnaire
included some words that can have more than one meaning, then it would be invalid. In
order to avoid this threat, in our current study, the researcher followed some steps to ensure
the high level of validity.
The questionnaire was debated first with some colleagues and professors in the
department of economics, management, and institutions in the University of Naples
(Federico II). This step aimed to ensure whether the questions were formulated in an
accurate form and cover all sections of MR. In later stage, some interviews were also held

100
with the financial analysts in the Egyptian stockbrokerage companies as a pilot study. We
discussed all the questionnaire’s sections with the interviewees, which enabled them to
check the relevance of each question. After these two steps, some changes in the questions
were considered, such as the deletion of some questions, the merge of some questions, and
the addition of some new questions.
Finally, as the questionnaire was designed originally in English while Arabic is the
spoken language in Egypt, all of the distributed questionnaires were in Arabic. Usunier
(1998) highlights four factors that should be considered when translating the questionnaire
from language to another:
- Lexical meaning- some words in a language could have more than one meaning in
another language, therefore, the translator should be aware of what the exact
equivalent that can gives the same meaning is.
- Idiomatic meaning- an idiom reflects the meaning of a specific expression in a
language. If a questionnaire included some idioms, the translator should extract their
meaning within the targeted language.
- Experiential meaning- some expressions are well-known in the daily life of a society,
for example, “dual career household” as an expression is probably not clear in a
different language; therefore, the translator should explain clearly what this concept
means in the targeted language.
- Grammar and syntax- the order of the words within a sentence differs immensely in
many languages; the way of expressing the past, present, and the future actions are
different between many languages. The translator should not use metaphors and use
the equivalent structure and grammar that gives the same meaning and timeframe.
Furthermore, Usunier (1998) indicated four techniques that could be helpful in
translating the questionnaire to another language. However, every technique has some
advantages and disadvantages, as follow:
- Direct translation: it means to directly translate from the original language to the
targeted language by the researcher. This technique is easy and has a low cost;
however, it is likely for some contradiction and mislead words to exist.
- Back-translation: the translation process here requires two translators from each
language, and each one of them is a native in his language. The process starts with
one translator who have to translate the original text to the targeted language, then,

101
the other translator has to translate-back the new translation to its original language,
and finally a comparison is made in the two translations and checked for any errors.
The main benefit of this strategy is the detection of the majority of errors. However,
it is not always easy to find two native speakers from both languages who can well
understand all the questionnaire’s concepts in its original language.
- Parallel translation: using two translators who every one of them works
individually, then the researcher compares their translations in order to choose the
most accurate one to be the final version. While this technique provides high
accuracy translation, it is likely to have some lexical and idiomatic errors.
- Mixed techniques: it depends on the Back-translation technique and the parallel
translation technique. This method can provide the best translation, but it costs a lot
money and time since it may include finding and changing some words in the
original text to equivalent words that give the same meanings in the targeted
language.
Because every technique has its advantages and disadvantages, the current study
adopts the mixed technique but with a different structure. The researcher translated the
questionnaire himself, then he discussed both the Arabic and English versions with some
other colleagues whom native language was Arabic; this includes some PhD students in the
same department inside the University of Naples Federico II, and some Egyptian PhD
students in the UK’s universities. The aim of this step was to identify whether the Arabic
translation is accurate and reflects the same meaning as that in the original English text.
Minor modifications were received, and after making them, the final translated
questionnaire was ready for the distribution.
3.6.3 Discrimination
Conducting a survey requires distinguishing between the main variables/groups in
the targeted sample, especially when they are expected to receive varied responses (De Vaus
2002). However, as it was discussed earlier, the current investigation concentrates on two
user-groups; the institutional investors and the financial analysts. While the distribution and
collection of the questionnaires were carried out carefully in order to distinguish between
the responses that were received from each group, it enabled us to run some statistical tests
to examine any significant differences between both groups, and then, answer the research
questions using the mean of the whole responses of the two users-groups.

102
3.7 The respondents’ profile
The first section of the questionnaire included some personal information that
covered the respondent’ names, age, gender, specialization, qualification, experience, and
the ownership type of the firm where they work. However, the vast majority of respondents
did not write down their ages, thus, this information was ignored in that section.
Table 3.4 The respondents’ profile
Factors Financial analysts Institutional investors Total
Frequency Percentage Frequency Percentage Frequency Percentage
Gender Males
72
92.3
34
94.5%
106
93.0
Females 6 7.7 2 5.5% 8 7.0
Total 78 100.0 36 100.0 114 100.0
Graduation Accounting
50
64.1
27
75%
77
67.5
Business
Administration
18 23.1 6 16.67% 24 21.1
Other 10 12.8 3 8.33% 13 11.4
Total 78 100.0 36 100.0 114 100.0
Qualifications
Bachelor
52
66.7
20
55.55%
72
63.2
Advanced
Diploma
13 16.7 11 30.56% 24 21.1
Master Degree 11 14.1 4 11.11% 15 13.2
PhD 2 2.6 1 2.77% 3 2.6
Other 0 0% 0 0% 0 0%
Total 78 100.0 36 100.0 114 100.0
Experience
Less Than 10
Years
24
30.8
12
33.33%
36
31.6
More than 10 to
20 Years
44 56.4 17 47.22% 61 53.5
More Than 20
Years
10 12.8 7 19.45% 17 14.9
Total 78 100.0 36 100.0 114 100.0
Ownership Type Governmental
0
0
11
30.56%
11
9.6
Private sector 66 84.6 13 36.11% 79 69.3
Foreign firm 12 15.4 12 33.33% 24 21.1
Total 78 100.0 36 100.0 114 100.0
Table 3.4 shows that one hundred and six respondents were males (93%), while the
females presented only eight (7%), which was not a surprise considering the cultural aspects
in any emerging market in the Middle-East area. Seventy-seven respondents (67.5%)

103
graduated with a major in accounting, twenty-four studied business administration (21.1%),
and only thirteen (11.4%) held other degrees. This finding is very important because it
shows that the vast majority of the respondents had both theoretical and practical
experiences in the disclosure and its usefulness. For the respondents’ qualification, seventy-
two respondents were bachelor holders (63.2%), thirty-nine obtained a higher diploma (after
Bachelor) or master’s degree (34.3%), and only three respondents held a PhD degree (2.6%).
More than half of the sample (sixty-one participants, 53.5%) have had experience between
ten and twenty years, while approximately one-third has had less ten years’ experience, and
15% of them have had more than twenty years of experience.
Considering the ownership structure of the institutional investors, the respondents
were approximately divided into three equal thirds between the government, local private
sector, and foreign firms or branches. Furthermore, as was discussed earlier, the financial
analysts worked in the stockbrokerage companies, where an ownership by the government
was absent (according to the responses in the sample). Seventy-nine financial analysts
(84.6%) also worked at local private ownership firms, while twenty-four (15.4%) worked at
foreign firms or branches. These indicators make the sample richer, as it includes different
types of ownership and organizational culture.
3.8 Results
3.8.1 Users’ perceptions on the usefulness of MR disclosure according to the new
regulation
Overall, the new disclosure requirements in the MR were perceived to be partially
useful by both FA&I, as table 3.5 shows. In particular, in the first question, the respondents
revealed that the mandated rules for the Egyptian listed firms present a moderate level of
usefulness of information provided by the MR. The recorded means were 3.82 and 3.86 for
FA & I respectively, which is located in the range between 3- 3.99 (moderate agreement).
This result reflects the inadequacy of the updated regulation in matching the users’ needs of
providing a high-quality disclosure in MR . The second question showed that the new
regulation increases the readability of the MR, even if with a moderate degree. The recorded
means were 3.77 and 3.86 for FA and I, respectively. This result suggests that the MR
prepared under the new regulation includes some incomprehensible or incomplete
information.

104
Table 3. 5 The impact of new regulation on improving the usefulness level of MR
The results of Mann-Whitney test for the two questions revealed no significant
differences between the FA&I. The recorded means for the two questions, for the whole sample,
were 3.83 and 3.80, while the significance of Z score was .70 and .61 (greater than 0.05)
respectively, therefore, no significant differences in the standpoints on the quality and the
readability of MR between the FA&I existed. Thus, the analysis regarding the first research
question suggested that the two user-groups were partially satisfied with the effect of the new
regulation in increasing the usefulness of MR.
Table 3.6 provides results on the usefulness of MR as a whole. The first question
illustrated that the respondents agreed that MR includes an overall useful information, with
a mean-score of 4.31 and 4.28 for FA&I, respectively. The second question highlighted a
strong evidence on the importance of MR and how the respondents perceived it to be the
main source of a corporate disclosure when making their investment decisions. The recorded
mean-scores were 4.37 and 4.44 for FA&I respectively. This suggests that MR represents
the primary source of information which complement the weakness of the financial report.
The third question also supported the above results. The respondents were also asked
whether there is consistency of information between the financial report and the MR. The
whole sample recorded mean was 4.26, confirming a high level of agreement (4 means
agree, and 5 means completely agree).
The significance of Z-value suggested that there were no differences between the
two user-groups in the three questions. The recorded significances were 0.95, 0.4, and 097
for the three questions respectively, which were all higher than the significance level of the
current study (0.05).
RQ1
FA I Mann-Whitney test
Mean STD Mean STD16 Mean Z Sig.
1- The Management report, which is prepared
under the new regulation, provides more
information comparing with the old regulation
3.82 .68 3.86 .762 3.83 -.389 .70
2- The Management report, which is prepared
under the new regulation, provides information
easy to be understood
3.77 .72 3.86 .723 3.80 -.510 .61

105
Table 3. 6 The users’ perceptions regarding the usefulness of MR
Thus, in Table 3.7, question number six shows that the two user-groups believe that
the current voluntary disclosure in MR is not enough, which probably indicates an existing
gap between what user needs and what managers provide. The agreement level, however,
was moderate with an overall means of 3.75. Question number seven illustrates that FA&I
consider using graphs and tables in MR increases the understandability of its content. The
overall recorded mean was 4.21 out of five points, with no significant difference between
the two user-groups. This finding highlights the importance of using an effective
presentation way in MR. Question number eight focused on the availability of MR on the
firms’ websites. The recorded Means were 4.06 and 4.22 for FA&I respectively. This
finding suggests that the users experience some difficulties in accessing the MR.
Table 3. 7 The users’ perceptions regard the presentation of MR
3.8.2 Users’ perceptions regarding the usefulness of different kinds of information in
MR
Table 3.8 illustrates the descriptive statistics and the results of Mann-Whitney test
regarding the questionnaires’ items. Out of thirty-nine items, the respondents marked
twenty-six items (66.67% of the total items) as either useful or very useful. Nevertheless,
RQ2
FA I Mann-Whitney test
Mean STD Mean STD Mean Z Sig.
3- The management report provides useful
information
4.31 .74 4.28 .82 4.30 -.06 .95
4- You consider the management report a
complementary to the financial report
4.37 .58 4.44 .65 4.40 -.84 .40
5- You usually compare the content of the
management report with the content of the
financial report’s
4.26 .75 4.28 .70 4.26 -.04 .97
The Questions
FA I Mann-Whitney test
Mean STD Mean STD Mean Z Sig.
6- Some companies disclose very limited
information without any attention to the users’
needs.
3.72 1.24 3.83 1.18 3.75 -.41 .68
7- Using the tables and graphs in the management
report make its information more
understandable.
4.26 .67 4.11 .75 4.21 -.91 .37
8- The companies which do not make their
director’s reports available on their websites
should be sanctioned by the Authorities
4.06 .98 4.22 .98 4.11 -1.10 .27
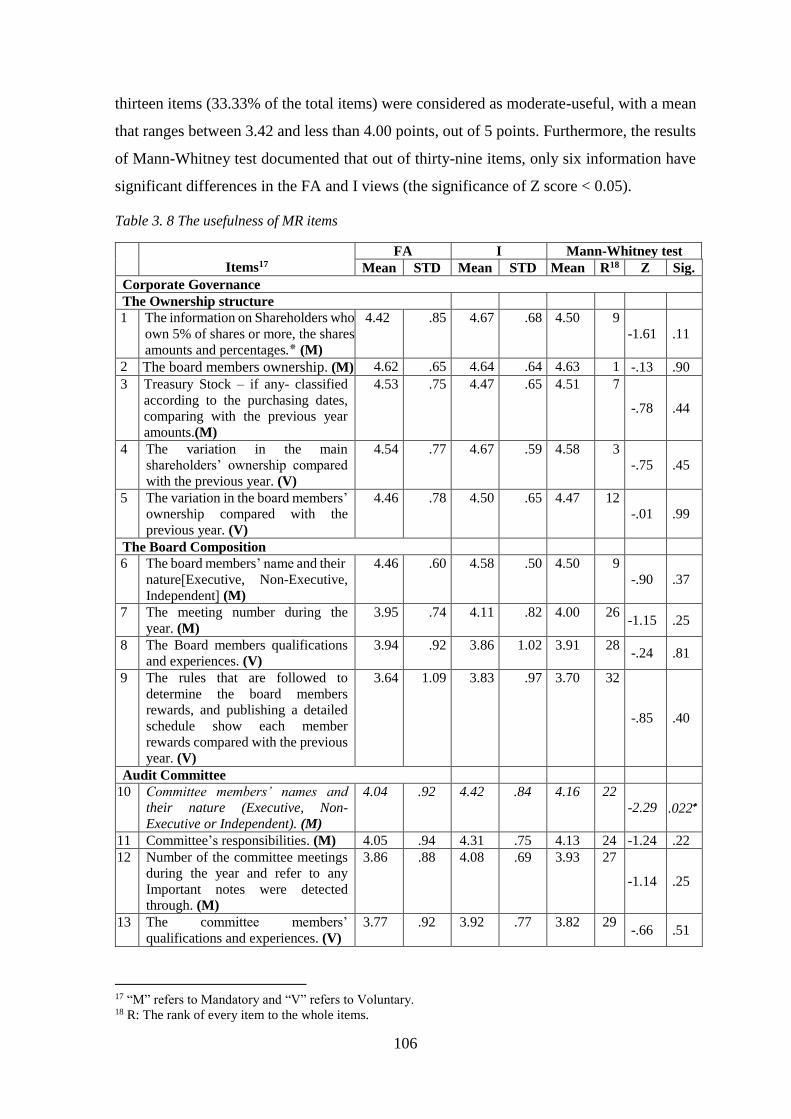
106
thirteen items (33.33% of the total items) were considered as moderate-useful, with a mean
that ranges between 3.42 and less than 4.00 points, out of 5 points. Furthermore, the results
of Mann-Whitney test documented that out of thirty-nine items, only six information have
significant differences in the FA and I views (the significance of Z score < 0.05).
Table 3. 8 The usefulness of MR items
17 “M” refers to Mandatory and “V” refers to Voluntary. 18 R: The rank of every item to the whole items.
Items17
FA I Mann-Whitney test
Mean STD Mean STD Mean R18 Z Sig.
Corporate Governance
The Ownership structure
1 The information on Shareholders who
own 5% of shares or more, the shares
amounts and percentages. (M)
4.42 .85 4.67 .68 4.50 9
-1.61 .11
2 The board members ownership. (M) 4.62 .65 4.64 .64 4.63 1 -.13 .90
3 Treasury Stock – if any- classified
according to the purchasing dates,
comparing with the previous year
amounts.(M)
4.53 .75 4.47 .65 4.51 7
-.78 .44
4 The variation in the main
shareholders’ ownership compared
with the previous year. (V)
4.54 .77 4.67 .59 4.58 3
-.75 .45
5 The variation in the board members’
ownership compared with the
previous year. (V)
4.46 .78 4.50 .65 4.47 12
-.01 .99
The Board Composition
6 The board members’ name and their
nature]Executive, Non-Executive,
Independent[ (M)
4.46 .60 4.58 .50 4.50 9
-.90 .37
7 The meeting number during the
year. (M)
3.95 .74 4.11 .82 4.00 26 -1.15 .25
8 The Board members qualifications
and experiences. (V)
3.94 .92 3.86 1.02 3.91 28 -.24 .81
9 The rules that are followed to
determine the board members
rewards, and publishing a detailed
schedule show each member
rewards compared with the previous
year. (V)
3.64 1.09 3.83 .97 3.70 32
-.85 .40
Audit Committee
10 Committee members’ names and their nature (Executive, Non-
Executive or Independent). (M)
4.04 .92 4.42 .84 4.16 22 -2.29 .022
11 Committee’s responsibilities. (M) 4.05 .94 4.31 .75 4.13 24 -1.24 .22
12 Number of the committee meetings
during the year and refer to any
Important notes were detected
through. (M)
3.86 .88 4.08 .69 3.93 27
-1.14 .25
13 The committee members’
qualifications and experiences. (V)
3.77 .92 3.92 .77 3.82 29 -.66 .51

107
14 The board policy to change the
committee members. (V)
3.73 .99 3.97 .74 3.81 30 -1.02 .31
The Internal control and risk management disclosure
15 The annual review results of the
internal control quality and
effectiveness. (V)
4.38 .69 4.44 .69 4.40 17
-.49 .63
16 The risks that treat every activity or
segment (including any penalties or
lawsuits). (V)
4.44 .77 4.64 .68 4.50 9
-1.60 .11
17 The board strategy to control the
risks. (V)
4.50 .66 4.58 .81 4.53 6 -1.19 .24
18 The expected effect of the risks on
the firm future and its activity
through the next year. (V)
4.46 .70 4.61 .69 4.51 7
-1.25 .21
The Financial Performance Indicators
19 Export activities distributed on
products. (M)
3.97 .90 4.14 .76 4.03 25 -.84 .40
20 Net profit distributed on the
activities or products. (M)
4.46 .77 4.72 .51 4.46 13 -1.69 .091
21 The actual sales compared with the
target sales throughout the year.(V)
4.44 .68 4.53 .56 4.54 5 -.50 .62
22 The actual net profit compared with
the target profit. (V)
4.51 .64 4.69 .52 4.57 4 -1.49 .14
23 Profitability ratios. (V) 4.24 .94 4.64 .54 4.37 18 -2.08 .037
24 Liquidity ratios. (V) 4.35 .83 4.72 .57 4.46 13 -2.48 .013
The Assets Values information
25 Information covers the fair values of fixed assets that are significantly
different compared to the book values, especially lands and real
estate. (M)
4.41 .81 4.00 1.04 4.28 20
-2.04 .042
26 The significant changes in the fixed
assets over the ended year (such as
buying, selling, retirement,
impairment… etc.).(M)
4.24 .84 4.14 .72 4.21 21
-.97 .33
27 Tables and graphs show the main
changes in the fixed assets over the
last three years or more.(V)
3.79 .92 3.81 .98 3.80 31
-.16 .87
Forward–looking performance
28 The management plans to the
additions and betterments. (M)
4.60 .61 4.64 .54 4.61 2 -.13 .90
29 The expected market position (V) 4.29 .77 4.47 .56 4.35 19 -.95 .34
30 The expected profit during the next
year (V)
4.41 .76 4.42 .91 4.41 16 -.38 .71
31 The planned finance sources for
replacing fixed assets, launching new
products, or branches (V)
4.44 .86 4.53 .56 4.46 13
-.14 .89
Corporate social responsibility and Environmental information
32 The employees’ numbers (M) 3.46 .82 3.69 .95 3.54 35 -1.57 .12
33 Total salaries and rewards for the
employees through the year and the
average for the employee income
through the year. (M)
3.60 .94 3.58 .94 3.60 34
-.21 .84
34 The average for the employees’
productivity through the year. (V)
3.62 .87 3.81 1.01 3.68 33 -1.03 .31

108
The results of Mann-Whitney test in table 3.8 showed that out of thirty-nine items,
only six items have significant differences in the FA and I views (the significance of Z score
< 0.05). Interestingly, four out of six items were mandatory information, while two items
were voluntary ones. Nevertheless, these items were as follow:
- Information Number 10- Committee members’ names and their nature (Executive,
Non-Executive or Independent): the significance of Z score value was 0.022.
- Information Number 23 - Profitability ratios: The significance of Z score was 0.037.
- Information Number 24 - Liquidity ratios: The significance of Z score was 0.013.
- Information Number 25 - 25- Information covers the fair values of fixed assets that
are significantly different compared to the book values, especially lands and real
estate: The significance of Z score was 0.042.
- Information Number 36 - The company participation in reducing the pollution and
protecting the environment: The significance of Z score was 0.035.
- Information Number 36 - The amounts paid by the firm to develop the surrounding
community: The significance of Z score was 0.024.
Furthermore, information on the ownership of the board of directors was seen as the
highest useful information, recording a mean of 4.62, while the company participation in
reducing the pollution and protecting the environment was ranked as a less useful item, with
a mean of 3.42.
Table 3.9 presents the descriptive statistics and the results of Mann-Whitney test
regarding the six subsections of information in the MR. To get more accurate results, the
35 The training programs to develop
the employees’ skills,. (V)
3.53 .85 3.53 .91 3.53 37 -.06 .95
36 The company participation in reducing the pollution and
protecting the environment. (M)
3.40 .98 3.83 .97 3.42 39 -2.11 .035
37 The amounts paid by the firm to develop the surrounding
community. (M)
3.31 .90 3.67 .86 3.54 35 -2.26 .024
38 The taken actions to verify the
customers’ satisfaction and attract
new customers. (V)
4.09 .81 4.31 .86 4.16 22
-1.57 .12
39 The company policy to
rationalization the water and saving
the electricity as well as the
unrenewable energy resources used
in its activities. (V)
3.42 .99 3.69 .98 3.51 38 -1.48
.14

109
corporate governance section was divided into three subsections19. The results suggested
that there were significant differences in the FA and I views regarding the usefulness of
financial performance indicators and the CSR sections.
Surprisingly, the ownership structure was ranked first by both user-groups. In table
8, the recorded means were 4.59 and 4.51 by FA and I respectively, with a whole mean of
4.54, suggesting that this sub-section was perceived to be very useful. Z-score indicated no
significant difference between the perceptions of I&FA regarding the usefulness of this
section (Z score was 0.62 which is greater than the significance level at 0.05). However, the
other two sub-sections of corporate governance gained lower concern by the users. Board
composition scored a whole mean of 4.03 to be ranked as sixth compared with the other
sections and subsections, while Z score was not significant with a score of 0.45. As well as,
the audit committee scored a whole mean of 3.97 to be considered as a useful sub-section.
Table 3. 9 The usefulness of MR sections and subsections
Sections and subsections of
MR
FA I Mann-Whitney test Mean STD Mean STD Mean R Z Sig.
Corporate governance:
Ownership structure
Board Composition
Audit Committee
CG in Average20
4.51
3.99
3.89
4.14
.59
.617
.79
.51
4.59
4.10
4.14
4.29
.50
.54
.58
.41
4.54
4.03
3.97
4.19
1
6
7
-
-.49
-.76
-1.33
-
.62
.45
.18
--
Risks & Internal control 4.45 .58 4.57 .63 4.49 2 -1.49 .14
Key Performance Indicators 4.33 .61 4.57 .45 4.41 4 -2.11 .035
Main Changes in Fixed Assets 4.15 .75 3.98 .74 4.10 5 -1.28 .20
Forward –Looking Performance 4.44 .62 4.51 .47 4.46 3 -.34 .73
CSR and Environmental 3.55 .56 3.76 .70 3.62 8 -2.07 .039
R: Rank compared to other sections and subsections of MR
The risk management and internal control was sorted as the second highest useful
section in MR, with a whole mean of 4.48, as the financial analysts gave it a grade of 4.57,
while the institutional investors rated it with a mean of 4.46 points. The significance of Z
score suggests that there was no difference in the perceptions of the two-users groups, since
the value of Z, which was 0.14, was greater than 0.05.
19 It was planned to divide section number six into two subsections, but the descriptive statistics have shown
that CSR and Environmental information were ranked as the less useful section in MR, therefore,
conducting further comparison for that section was seen as useless. 20 If the rank was limited to the main sections, Corporate Governance is ranked fourth out of six sections.

110
Forward-looking performance gained a whole mean of 4.46, positioning it as the third
highest useful type of information in MR. The recorded means of the users-groups were
4.44 and 4.51 by FA&I respectively, with no significant difference between both of them
according to Z score. The Financial Performance Indicators took the fourth highest useful
type of information, as the users considered it to be very useful for their decisions. FA&I
gave this section a score of 4.33 and 4.57 respectively, with a general mean of 4.41.
However, Z score was significant at the level of 0.05 (The significant of Z recorded 0.035),
which refers to a significant difference between the user-groups. Therefore, the institutional
investors find that disclosure on Financial Performance Indicators to be more useful than
the financial analysts’ viewpoint.
The changes in fixed assets section scored an overall mean of 4.10, which makes it
a useful sub-section, but with ranking as the fifth out of eight sections and sub-sections. The
financial analysts found this section to be more useful than the institutional investors did,
since the achieved means were 3.98 and 4.15 respectively. However, the significance of Z
score (0.20) suggests no difference between the viewpoint of FA&I.
CSR and environmental information is classified as the least useful section in MR.
The mean scored 3.55 and 3.76 from FA&I respectively, which gives it a whole score of
3.62. However, Z score refers to significant difference between the two user-groups with a
significance level of 0.039. This difference indicates that the financial analysts regard this
section to be less useful compared with the institutional investors.
As it was mentioned earlier, the questionnaire included one open-ended question in
the corporate governance section. The respondents were asked to name the most important
committee which they value its information in the MR. While only thirty respondent
answered this question, the results showed that the risk committee had the highest score
(suggested by nine respondents), while the purchasing committee had the lowest score
(suggested only by one respondent). Based on the above analysis, the two users-groups have
similar viewpoints regarding the usefulness level of six sections and subsections, that were
seen as either useful or fully useful, while two sections (financial performance indicators
and CSR and Environmental information) were seen as not useful.

111
3.8.3 User’ perceptions on the usefulness of mandatory and proposed voluntary items
in MR
Table 3.10 outlines that the two user-groups considered the mandatory items to be less
useful than the voluntary items. The means of the mandatory were 4.22, by I, and 4.08, by
FA, while the usefulness of voluntary items scored 4.28 by I and 4.14 by FA. The overall
scored means were 4.12, for the mandatory items, and 4.1814 for the voluntary items, with
no significant differences among them (Z scores recorded 0.068 and 0.77 respectively). This
finding suggests that the users find the voluntary items to be as useful as the mandatory
items.
Table 3. 10 The usefulness of mandatory items and voluntary items
Type of disclosure FA I Mann-Whitney test
Mean STD Mean STD Mean Z Score Sig.
Mandatory Items 4.08 .36 4.22 .37 4.12 -1.83 .068
Proposed Voluntary Items 4.14 .43 4.28 .40 4.18 -1.77 .077
In order to get a meaningful analysis regarding the usefulness of mandatory and the
suggested voluntary items, the researcher classified the questionnaire’s items according to
their usefulness level. Since the current study’s survey follows a Likert-scale, the same
classification of the usefulness of mandatory and voluntary items was followed in this step.
Thus, the questionnaire items were classified into two categories. The first category included
items with a score that ranged between ‘more than three’ points to ‘3.99’ points, while the
second category included the items with means more than four points. It is suggested that
the first category could be seen as moderate useful items, while the second category
represents the high useful items.
Table 3.11 shows that the financial analysts perceived ten mandatory disclosure items
as high useful and seven disclosure items as moderate useful, while institutional investors
found thirteen mandatory items as very useful and four as moderate useful.
The overall classification suggested that twelve mandatory items (70.59% of all
mandatory items) were seen as very important, while the remaining five items (29.41%)
were considered as moderate important. Turning to the suggested voluntary items, both user-
groups agreed on the level of its usefulness. They found that fourteen items were high useful
(63.64% of all voluntary items), while eight items were moderate useful (36.36%).
Interestingly, risk management and internal control included four voluntary items all were
classified as high useful information.

112
Table 3. 11 The usefulness of mandatory and voluntary items in section and sub-section in MR
Sections and sub
sections
Financial Analysts Institutional Investors Whole Sample
Mandatory Voluntary Mandatory Voluntary Mandatory Voluntary
MF
(3-3.99)
HF
(4- 5)
MF
(3-3.99)
HF
(4- 5)
MF
(3-3.99)
HF
(4- 5)
MF
(3-3.99)
HF
(4- 5)
MF
(3-3.99)
HF
(4- 5)
MF
(3-3.99)
HF
(4- 5)
Corporate
Governance:
Ownership structure
The Board Composition
The Audit Committee
-
1
1
3
1
2
-
2
2
2
-
-
-
-
-
3
2
3
-
2
2
2
-
-
-
-
1
3
2
2
-
2
2
2
-
-
Risk management
and Internal Control
- - - 4 - - - 4 - - - 4
KPIs 1 1 - 4 - 2 - 4 - 2 - 4
Changes in Fixed
Assets - 2 1 - - 2 1 - - 2 1 -
FLDP - 1 - 3 - 1 - 3 - 1 - 3
CSR&
Environmental
4 - 3 1 4 - 3 1 4 - 3 1
Total Items 7 10 8 14 4 13 8 14 5 12 8 14
MF: Moderate Useful.
HF: High Useful.
3.9 Discussion of Results
3.9.1 The perceived usefulness of MR by the Users
Our analysis highlights that both Egyptian FA&I consider that the MR as mainly a
high useful source in supporting their investments’ decisions, which is consistent with prior
literature on the usefulness of MR (e.g.,(Hüfner 2007; Clarkson et al. 1999, 1994; Cole and
Jones 2005).
Our findings likely suggest that the MR represents an important complementary
report, whereas additional explanations can be added to overcome the weakness of the
disclosure provided in the financial report (Clarkson et al. 1999; FASB 2006; Hüfner 2007;
IASB 2010b). However, the respondents reported that the new Egyptian regulation has
moderately improved the MR disclosure content. Therefore, the report is supposed to be
useful to users when it introduces worthy and high-quality information (Francis and
Schipper 1999). Our findings suggest that there is still shortcomings in the new rules, as
regulators are not fully aware about the information that could effectively meet the users’
information needs to make better investments decisions.

113
3.9.2 The Perceived Usefulness of Different Kinds of Information in MR
Results of the current study revealed that the users distinguish between the different
types of information according to its usefulness for their investments decision-making. In
particular, the FA&I pay higher attention to the information that is especially related to
ownership structure, risk management and internal control, forward-looking performance,
and financial performance indicators. In contrast, the remaining sub-sections of corporate
governance (board composition and audit committee), fixed assets, and CSR and
environmental information gain less attention by the users. This result confirms the notion
that the usefulness extent of the different types of information is supposed not to be equal
for all the users (Dobler et al. 2011; Miihkinen 2013).
The ownership structure was ranked as the highest useful information in MR. This
finding can be explained by that FA&I may rely on the positive association between the
directors’ ownerships and the firm value, which could reduce the agency costs ((Lemmon
and Lins (2003); Morck et al. 1988). Therefore, in consistence with Boubakri et al. (2005),
the ownership concentration should positively affect firm performance especially in the
countries where the regulations provide weak protection to investors. Another possible
explanation is that the overlapping of relations between blockholders and politics may
provide, based on the users’ expectations, a higher level of protection. This explanation is
strongly supported by the study of Maaloul et al. (2018) who found that the politically-
connected firms have better performance and market value in Tunisia, which has similar
settings and political conditions as Egypt.
Forward-looking performance and risk management and internal control
information were seen as very useful sections in the MR. Our result supports the argument
that the decision usefulness approach is mainly concerned with the information that is
helpful in assessing the firm’s future performance. Williams and Ravenscroft (2015)
showed that the greatest contribution of disclosure items, as in estimating the future
performance, is one of the main proxies explaining the level of usefulness. Our results are
consistent with the previous evidence that documented that forward-looking performance
information is vital to the users investments decision-making (e.g., (AICPA 1994; Al-Ajmi
2009; Al-Mubarak 1997; Baker and Haslem 1973; Barron et al. 1999; Bozzolan et al. 2009;
Bryan 1997; Chatterjee 2007; Chenhall and Juchau 1977; Clarkson et al. 1999; Day 1986;
Graham et al. 2002; Johansen and Plenborg 2013; Lee and Tweedie 1975a; Naser et al.
2003), especially for the investors and financial analysts (Aljifri and Hussainey 2007;

114
Athanasakou and Hussainey 2014; Beretta and Bozzolan 2008; Hassanein and Hussainey
2015; Muslu et al. 2014; Hussainey et al. 2003). Forward-looking disclosure provides
explanations to the management’s plans, which enables the users to gain an advanced
understanding on the expected performance (Cole and Jones 2004; Barron et al. 1999; Kieso
and Weygandt 1995).
Also, FA&I believe that their investments’ decisions are significantly affected by
information related to firms’ risk level (AICPA 1994; Beattie and Pratt 2002; Graham et al.
2002; Johansen and Plenborg 2013; Solomon et al. 2000). This result mainly confirms the
argument that greater risk disclosure reduces uncertainty and helps users to adopt better
investments’ decisions (Elshandidy et al. 2015). Recent empirical evidence documented a
positive association between risk disclosure, the shares’ returns, and the trading volumes
(Kravet and Muslu 2013). Consistent with this argument, our descriptive statistics illustrate
that risk management provide very useful content to FA&I.
Disclosure on key performance indicators was also perceived to be very useful in
Egypt. This finding is consistent with that prior studies that documented that the financial
performance indicators are helpful for investments’ decisions (Cohen et al. 2011; Dawd et
al. 2018; Johansen and Plenborg 2013; Watson et al. 2002). This result is likely to suggest
that the financial indicators reflect the firms’ historical information and have potential
usefulness in enhancing the users’ understanding of the firm’s performance and in
estimating future returns (Elzahar et al. 2015; Tomas and Evanson 1987). Furthermore, the
decision maker can use the financial indicators to estimate the probability of expected
failures or bankruptcy in the short-term (Beaver 1966, 1968; Casey 1980; Libby 1975).
Lastly, the financial indicators may serve the users in evaluating the management
performance and the success of its strategy in leading the company (Bin-Abdullah and
Ismail 2008).
The remaining sections and subsections of MR were perceived as moderate useful.
This result is consistent with the previous studies (Cohen et al. 2011; Johansen and Plenborg
2013; Stainbank and Peebles 2006; Bartlett and Chandler 1997). In particular, regarding
corporate governance disclosure, although the Egyptian Code of Corporate Governance
(ECCG) of 2016 represents guidelines for listed companies; its adoption is still voluntary.
This may reflect the low awareness of the managers on the benefits of providing such
information to the users. Therefore, (Ebaid 2013) suggested that the usefulness of corporate
governance information is probably associated with the domestic culture and with the

115
mandatory requirement of adopting the corporate governance rules. The same concern is
applicable to CSR items as well. Consistent with Gray et al. (1995) and Lopatta et al. (2015),
a possible explanation could rely on the fact that the usefulness of CSR disclosure may be
related only to these groups of users who are ethically-oriented.
3.9.3 The Perceived Usefulness of Mandatory and Proposed Voluntary Information in
MR
Our main findings documented a weakness of the current mandatory MR disclosures
since the users consider the voluntary disclosure items to be more useful than the mandatory
ones. The quality of MR content depends on two main aspects; the regulation on mandatory
disclosure and the management decision regarding the voluntary disclosure information.
Our study contradicts the previous empirical evidence in the Egyptian context that revealed
that the users perceive the mandatory disclosure to be slightly more useful than the voluntary
information (Hassan and Power 2009). Apparently, it is more likely for the mandatory
disclosure to be considered more trust-worthy than the voluntary disclosure, however, this
would not mean that the mandatory information is perceived to be more useful than the
voluntary information (Beretta and Bozzolan 2008). Thus, when the mandatory disclosure
is perceived to be not useful in supporting investments decision-making, the users would
demand the managers to provide more extra-voluntarily information. Our results are likely
to suggest the poor awareness of the regulators on meeting the users’ information needs,
and also emphasize the existing continuous gap between the mandatory disclosure and
users’ information needs (e.g., AICPA, 1994; Al-Mubarak, 1997; Alzarouni et al., 2011;
Chandra 1974; Johansen & Plenborg, 2013; Mirshekary & Saudagaran, 2005). The
regulators should be aware of that result in order to increase the efficiency of the Egyptian
stock market.
SUMMARY
The disclosure in MR is a vehicle in enhancing the users’ ability in making
investment decisions. The efficiency of this report depends on its content, and whether the
regulators have a clear knowledge of the users’ needs of information. This chapter showed
that the mandatory disclosure is still inadequate to meet the users’ needs, which suggest that
additional efforts are still needed to be taken by the regulators to respect the user’s voice.
Furthermore, the results revealed that the users see different types of information to have
different levels of usefulness. Information related to ownership structure, forward-looking
performance, and risks seem to have high level of usefulness, while CSR and environmental

116
performance, audit committee, and board composition have less impact on the investment
decisions. Moreover, the findings showed that the total score of the suggested voluntary
items were at the same level as these of the usefulness of mandatory items. The next chapter
seeks to measure the actual disclosure level in MR for the listed companies to find out to
what extent the content of MR reflects the priorities of users.

117
CHAPTER FOUR: Measuring the Disclosure in Management Reports and the
Impact of Firm-Characteristics on Disclosure Level
4.1 Introduction
The current study adopted mixed methods to provide additional evidence regarding
the usefulness of MR on investment decisions. Some scholars suggested that developing a
measurement to assess the quality (usefulness) of the disclosure provides more subjectivity
and reliability of using the content analysis (Hooks and van Staden 2011). Following this
view, the results of the survey, as shown in the previous chapter, revealed that the users
classified the information of MR according to its impact on their investments decision-
making; however, it is still unknown whether the published information in the management
reports of the listed companies in EGX provide useful content that matches the users’ needs.
This chapter utilizes a content analysis approach that aims to provide further
empirical evidence regarding two of our research objectives. The first objective is to
compare between the disclosure level in MR and the users’ needs as concluded from the
previous chapter. This analysis highlights the consistency of both the mandatory and the
voluntary disclosure provided in MR, which would help us in assessing whether the current
disclosure is useful or weak and that more disclosures are still needed.
Then, the chapter represents a multiple linear regression analysis to examine the
impact of the firm-characteristics on the disclosure level of firms in MR. The first step in
achieving these objectives starts by designing a disclosure index, then analyzing and coding
the disclosure in the MR provided by the listed companies in EGX.
4.2 The Disclosure Index
Preparing a disclosure index could be performed following three different ways; first,
is by asking some users-groups to scale the importance of every item in the checklist,
second, is by presenting a disclosure index based on reviewing the prior studies on the same
topic and identifying the relevant items to be included in the index, finally, we can use the
same index of a prior study and apply it on a different sector or context. While the first
method requires long time and cost, the other two methods are more common in the studies
that based on content analysis (Hussainey 2004). However, as the current study has already
asked two users-groups on the usefulness of information disclosed in MR, the same items
that were employed in the questionnaire survey will be used to construct the disclosure

118
index. The researcher believed that it would be more valuable if we measured the disclosure
level of MR to indicate whether the current disclosure matches the users’ needs.
The disclosure index includes thirty-nine items categorized into eight parts. The total
score of the disclosure level is calculated by dividing the total score of all items in the index
on the number of items:
MRDISC = ∑xi
𝑛
Where:
xi = 1 if the item is disclosed in MR, otherwise it scores zero.
n: number of the items in the disclosure index (39 items in this study).
Furthermore, to achieve meaningful results, several disclosure indexes was derived
from the main index to measure the disclosure level. Firstly, from the users’ viewpoint, there
are two different levels of the usefulness of the items included in our survey. Therefore, in
order to provide empirical evidence regarding the existed disclosure of items in both
categories, a distinguish has been made between the useful items and the moderate useful
items. The results of this analysis helped in evaluating whether the current disclosure in MR
reflects the priorities of the users or not. Secondly, consistent with the disclosure literature,
it was presumed that the companies seek to comply with the requirements of the mandatory
disclosure, while the voluntary disclosure is subjected to the management policy and
decisions.
Results of our survey showed that the users consider many voluntary items to be more
useful than some mandatory items; therefore, it was determined to measure the disclosure
level of each type of disclosures separately. This analysis should help in knowing whether
the disclosure in MR is driven mainly by the mandatory requirements or do the listed
companies respect the users’ needs and disclose more information to match these needs. It
should be noted that classifying the items to mandatory and voluntary was done according
to the requirements of the new regulation. As the new regulation has added more mandatory
disclosures than the old one; this means that some items were classified as mandatory items
now, while some of them had not been mandated under the old regulation. Therefore, the
researcher employed this comparison for the period prior to 2013 to illustrate how the
disclosure on the same volume of information has changed (increased/decreased) compared
with the disclosure level under the new regulation.

119
Lastly, we classified the items of the main disclosure index according to its levels of
usefulness and obligation. The analysis distinguished between the disclosure on the very
useful items (26 items) and the moderate useful items (13 items) in order to compare the
user’s preferences with the actual disclosure in MR. Then, it was decided to separate
between the disclosure on mandatory items (17 items) and voluntary items (22 items), which
can help in assessing the listed companies’ adherence to the regulated disclosure and how
they response to the user’s needs even when the regulation does not demand meeting all the
users’ needs. The disclosure value for each index ranges from zero, as the minimum score,
to one, as the maximum score:
𝑍𝑒𝑟𝑜 ≤ DISC≤ 1
4.3 Sample Selection
The sample of the current study included all the nonfinancial listed companies in
EGX on the 31st of December 2016. As it is well known, the banks and the financial-services
firms follow more stringent rules provided by the controlling bodies, which would make
including their MRs in the sample leads to inconsistent results. For this reason, fourteen
banks and thirty financial services firms were excluded from our sample.
Table 4. 1 Companies under the investigation
Number of listed companies on 31st December 2016 222
Excludes: Financial Sector companies:
Banks
Financial services (other than banks)
Total financial sector
14
30
44
The remaining: all Nonfinancial Companies 178
Excludes:
Companies have stopped submitting its annual reports to EGX
Companies have been listed after the year 2011
Total
1
19
20
Valid Companies to the current study 158
As Table 4.1 illustrates, by the end of 2016 one-hundred and seventy-eight
nonfinancial companies were listed in EGX. The selection criteria of the companies to be
considered in the content analysis were based on one condition; that is, all the companies in
the sample must have been listed over the entire period that the sample covers. This
condition was necessary in providing accurate results that enable a comparison to be made

120
between the disclosure levels of the same companies under the old listing rules (hereafter,
before 2013) and between those under the new listing rules (hereafter, After 2013).
Following this rule, it was found that nineteen companies had been listed between the 1st of
January 2012 and 31st of December 2016. Furthermore, one company, the Middle-East
Paper Company, had faced some problems in its activities and, accordingly, had not
introduced its annual reports since 2014. The remaining companies, one-hundred fifty-eight,
in all nonfinancial sectors were completely considered in the analysis.
The researcher utilized two sources for collecting the MRs; First, an open-access
website called “Mubasher”21 was used to collect all available MRs; Second, the missing
MRs were collected from the company of Egypt for Information Dissemination (EGID)22.
It was noticed that many of the MRs for the fiscal years prior to 2011 were missing in both
of the previous sources; therefore, it was decided to only consider the reports of the years
starting from 2011 to 2016. However, since the new listing rules were issued in January
2014, MR content for the fiscal year that ended on 31st of December 2013 was comprised
of two different forms and contents. The listed companies that published their annual report
before that date prepared their MR according to the old listing rules, while the companies
that published their annual report after that date introduced their MR following the new
listing rules. Thus, it was decided to disregard the management reports for the fiscal year
that ended on the 31st of December 2013 for all listed companies.
The MRs of the years of 2011 and 2012 represented the disclosure practices prior to
2013, while the MRs of 2014, 2015, and 2016 covered the disclosure practices under the
new listing rules. The final sample included 158 companies from fifteen economic-sector in
the EGX. As the study aims to compare between the disclosure levels before 2013 and after
2013, the mean of the disclosure level in the years of 2011 and 2012 together represented
the disclosure level prior to 2013. While, the mean of disclosure level in the three years of
2014, 2015, and 2016 represented the disclosure level after 2013. A total of 782 year-
management report was collected; 309 of them were published under the old listing rules,
and 473 of them belonged to the years starting from 2014 to 2016 (Table 4.2).
21 This website is owned by one of the biggest stockbrokerage companies in the Middle-East. 22 This company was established in 1999 by the EGX in order to increase the transparency by making the
published disclosure by the listed companies available and easily accessible to the investors and the public
as paid services.

121
4.4 Analysing and Coding Items of the Disclosure Index
While certain software could be used in analyzing the content of the accounting
reports (Hussainey et al. 2003), so far there is no single software that supports such work
when the text is written in Arabic language. Furthermore, even if there was a software that
supports the Arabic language, the vast majority of the Egyptian companies’ accounting
reports are simply scanned copies, which would make any software to read them as image
files. Therefore, the researcher adopted a manual content analysis for all the collected MRs
by carefully reading, recording, and coding the items in the main disclosure index. Despite
that this method requires a long time in analyzing a big sample of MRs, 782 reports in total,
the outcome will be more accurate than using any other available method.
Table 4. 2 Collected MRs over the years under investigation
MRs published before 2013 MRs published after 2013
Year 2011 2012 Total 2014 2015 2016 Total
Collected MRs 154 155 309 158 158 157 473
Total 782
The researcher used a simple coding style by giving all the items in the disclosure
index the code “I” with the addition of the item’s number, following the same order as it
was in the questionnaire survey. For example, the item number one in the questionnaire that
was encoded, for the statistical purposes, as Q1, was also encoded in analyzing the
disclosure index as I1; and the same was followed in the remaining items.
Two coding methods were common in the content analysis studies; the weighted
index and the unweighted index. Using weighted disclosure index would consider that some
information are more usefulness than others; thus, it should be distinguished between the
less useful information and the important information by giving each of them less or more
points in the disclosure index. However, the majority of studies on the disclosure used
unweighted scales via giving equal coding values for all the items in a disclosure index
(Inchausti 1997; Wallace and Naser 1995). Nonetheless, several other scholars suggested
that using un-weighted scale yields very similar results to the weighted scale ( e.g., Amoako
& Asante, 2013; Prencipe, 2004; Zarzeski (1996). Therefore, it was decided to adopt the
unweighted scoring system.
122
The coding process used two values; One and Zero. Each item disclosed in MR took
a score of one, if otherwise, it took a zero. The researcher believes that this way of coding
to be more understandable to anyone since it guarantees easily transferring the results into
percentages. For example, if the main disclosure index scored 0.45 out of 1, then this would
mean that the companies reported in their MRs, in the period that the study covers, only
45% of the items in the disclosure index. Considering that the item number 19 (Coded as
I19) was related to the exports value which does not apply to services companies, it was
given special coding as “Not Applicable”, for the services companies; the statistical analysis
calculated the main index and sub-indexes after excluding this item for the services
companies’ data only.
4.5 Results and Discussion of Measuring the Disclosure Level in MR
4.5.1 Results of Measuring the Disclosure Level in MR
This section presents a comparison between the disclosure level under the old
regulation and that in the new regulation. The aim of this comparison is to investigate impact
of the new regulation on the disclosure in MRs and how the listed companies in EGX have
responded to the new requirements.
Panel A in table 4.3 provides several interesting results. Firstly, the level of the total
items of the disclosure index increased from 12.6%, before 2013, to 37.41% for every listed
company in average, which is considered to be a significant increase in a level of 0.05.
Furthermore, the analysis demonstrated that the disclosure on the very useful items and the
moderate useful item have increased significantly from 13.66% and 10.58%, before 2013,
to a record 38.86% and 34.56%, respectively, after 2013
In addition, the disclosure on mandatory items and voluntary items has significantly
changed after 2013. The disclosure on mandatory items increased considerably from
16.89%, before 2013, to 76.33% after 2013, which is considered to be a significant increase
in a level of 0.05. Surprisingly, the disclosure on voluntary items significantly decreased
from 0.0934, before 2013, to .0856, after 2013.
Panel B illustrates the disclosure level on the sections and sub-sections of MR. The
table shows that the disclosure on five sections, out of seven sections, in MR was
significantly increased after issuing the new regulation. The ownership structure was the
highest disclosed subsection with an increase that ranged from .0589, before 2013, to .5831,
after 2013, followed by the audit committee information, which increased from 0.0272,

123
before 2013, to 0.5776 after the new rules. Although the board composition scored the
highest points before 2013 with a mean of 0.0769, it is clear that the improvement of
disclosure on this subsection was the least comparing to other Corporate Governance
subsections, as it recorded 0.5095 after 2013. Furthermore, all the disclosures on all CG
subsections exhibited significant differences in them before 2013 compared with after 2013,
since the significance of Z score recorded 0.00 for all the subsections and CG overall as
well.
Table 4. 3 The disclosure level in MRs under both old regulation and new regulation
*, **, *** Significant at 10%, 5%, and 1% respectively.
The disclosure on CSR has been significantly improved to record a mean of 0.4366
after 2013 instead of 0.1634 before 2013.
Interestingly, the disclosure on risk and internal control and forward-looking
performance was decreased from 0.2168 and .1400, before 2013, to 0.1712 and 0.1290,
respectively, after 2013. However, this decrease was significant for risk and internal control
Panel A: The disclosure level in MR: an overview
Subject Under the old listing rules Under the new listing rules Mann-Whitney test
N Mean STD N Mean STD Mean Std. Z P value
Aggregated
Disclosure
309 .1261 .0967 473 .3741 .0812 .2761 .1496
-22.12 .000***
Very Useful 309 .1366 .1061 473 .3886 .0977 .2890 .1594 -21.45 .000***
Moderate Useful 309 .1058 .1205 473 .3456 .0826 .2508 .1537 -20.59 .000***
Mandatory 309 .1689 .1389 473 .7633 .1165 .5284 .3167 -23.48 .000***
Voluntary 309 .0934 .0888 473 .0805 .0926 .0856 .0912 -2.64 .008***
Panel B: The disclosure on MR sections and sub-sections:
Sections and
subsections
Under the old listing rules Under the new listing rules Mann-Whitney test
N Mean Std. R N Mean Std. R Mean Std. Z P value
Ownership Structure 309 .0589 .1106 7 473 .5831 .0951 1 .3760 .2758 -25.92 .000***
Board Composition 309 .0769 .1506 6 473 .5095 .0644 3 .3386 .2372 -25.19 .000***
Audit Committee 309 .0272 .1021 8 473 .5776 .1070 2 .3601 .2890 -25.86 .000***
Risks & Control 309 .2168 .2833 1 473 .1712 .2809 7 .1893 .2826 -2.90 .004***
KPIs 309 .1831 .2158 2 473 .2190 .2200 5 .2048 .2189 -2.60 .009***
Fixed Assets 309 .1154 .1761 5 473 .2142 .2195 6 .1330 .1637 -6.50 .000***
FLPD 309 .1400 .1662 4 473 .1284 .1620 8 .1330 .1637 -1.03 .303
CSR &
Environmental
309 .1634 .1879 3 473 .4366 .1297 4 .3286 .2048
-17.34 .000***

124
since the Z score was significant (P≤ 1%). On the other hand, the change in forward-looking
information was not significant since the significance of Z score reached 0.303.
The mean of the disclosure level on key performance indicators and assets values showed
significant improvement over the period that was after 2013. The assets values disclosure
almost doubled after 2013 comparing with its score before 2013 (increased from 11.5% to
22.4%), as the value of Z revealed high improvement in the disclosure level (P ≤1%). While
the disclosure on the key performance indicators was slightly increased from 0.1831, before
2013, to 0.2190, after 2013; Z score referred to a significant improvement in this disclosure
where the score was .008.
4.5.2 Discussion
The main concern of this study was to investigate the effect of the new listing rules
issued on early of 2014 on increasing the usefulness of MR content for investments decision-
making. Apparently, it was presumed that updating or changing a regulation related to the
disclosure requirements should be reflected directly on increasing the usefulness MR
information. The comparison between the disclosure level before 2013 and after 2013
illustrated that the disclosure level was increased from 12.6% to 37.4%, which reflects the
significant effect of the new rules on increasing the volume of information in MR.
Comparing the changes in mandatory disclosure with voluntary disclosure showed
that the mandatory disclosure has increased by more than five times under the new
regulation compared to its level under the old listing rules. However, the voluntary
disclosure was weak under the old listing rules and has been slightly decreased; however, it
was significantly decreased under the new rules (decreased from 9.3% to 8.05%). This
finding suggests that the listed companies in EGX seek to oblige with the requirements of
mandatory disclosure rather than disseminating additional voluntary information regardless
of the usefulness of this information to the users’ investment decisions. It could be argued
that the listed companies disclosed more voluntary disclosure prior to 2013 when the
mandatory disclosure requirements were limited. Then, when the new listing rules
demanded more mandatory disclosure, the listed companies responded with reducing the
volume of the voluntary disclosure to make a balance with the increase in the mandatory
disclosure.
The disclosure on useful items and moderate useful items has been tripled after
switching to the new listing rules. However, the disclosure level on both of them is still

125
weak and does not exceed 39%, which suggests that the current disclosure is still far from
matching the users’ needs. Overall, the disclosure across all the sections that included
mandatory items has been significantly increased after 2013, regardless of whether these
items are useful or moderate useful.
Table 4.4 compares the results of measuring the actual disclosure level, under both
old and new regulation, with the findings of the survey presented in Chapter three. This
table shows that the disclosure level on all sections and subsections of MR, excluding
ownership structure, is inconsistent with the users’ perceived usefulness on that information.
This inconsistency suggests that the gap between the priorities of users’ needs of
information and what the companies disseminate, mandatorily and voluntarily, is still exist.
While the users consider information on corporate governance’ subsections, excluding the
ownership structure, and CSR and environmental issues as the least useful for their
investments decisions, the disclosure on these types of information has recorded the highest
improvements compared with the other types. On one hand, the users consider information
related to board composition, audit committee, and CSR to be ranked from the sixth to the
eighth. On the other hand, analyzing the disclosure provided in MR revealed that the same
types of information were ranked from the second to the forth. Remarkably , it was shown
that the disclosure level on the ownership structure to be the highest in MR, which is
consistent with the users view on the usefulness of this information.
Table 4. 4 Comparing the usefulness and the disclosure level of MR’s sections and subsections
† The maximum points are 5 based on the likert-scale used in the current study (Chapter three). ‡ The maximum score is 1.
Sections and Sub-sections of
MR
Ranking the usefulness
from the users’ view
The disclosure level
BEFORE 2013
The disclosure
level AFTER 2013
Mean† Rank Mean‡ Rank Mean‡ Rank
Ownership Structure 4.5368 1 .0589 7 .5831 1
Board Composition 4.0285 6 .0769 6 .5095 3
Audit Committee 3.9684 7 .0272 8 .5776 2
Risk & Internal Control 4.4846 2 .2168 1 .1712 7
KPIs 4.4064 4 .1831 2 .2190 5
Changes in Fixed Assets 4.0965 5 .1154 5 .2142 6
FLPD 4.4605 3 .1400 4 .1284 8
CSR & Environmental 3.6195 8 .1634 3 .4366 4

126
In contrast, the disclosure on internal control and risks and forward-looking
performance information were the least disclosed information, with the seventh and the
eighth rankings respectively. Even though that the users think that these types of information
are essential and very useful in helping them make investment decisions. While they were
classified as the second and the third useful section in MR respectively, it could be argued
that the current content of MR doesn’t provide enough information to cover both of these
sections.
The disclosure on KPIs and changes of fixed assets, regardless of its low level, seems
to be close to the users view. Information on KPIs and changes of fixed assets has been
ranked fourth and fifth by the users, while the actual disclosure in MR showed that these
sections scored the fifth and sixth in ranking.
Prior literature presented a limited number of studies that focused on comparing the
actual disclosure by listed companies with the users’ needs. Hooks et al. (2002) found that
the disclosure practices by listed companies in New Zealand to be inconsistent with the
users’ needs. Whilst the users consider many information as very important, the accounting
reports did not reflect the users’ preferences and many important items were no disclosed.
Furthermore, Hooks et. al revealed that the voluntary disclosure culture is uncommon
among the listed companies, which is reflected on the low rate of voluntary disclosure.
Hassan et al. (2012) documented that the level of voluntary disclosure in Egypt is limited
and that the Egyptian companies are not fully obliged with the requirements of the
mandatory disclosure. Furthermore, Dahawy and Conover (2007) argued that the mandatory
disclosure does not provide enough information to the users. With the passing of over a
decade since Dahawy and Conover’s study, regardless of issuing the new listing rules, it is
clear that the users’ needs are still unfulfilled completely and that many essintial information
are still missing from the management report.
4.6 Multiple Linear Regression Model
Results of the previous section reflected high level of variance in the aggregated
disclosure levels across the different types of information included in MR, therefore,
carrying out a multiple linear regression analysis could help in understanding the impact of
firm-characteristics on the disclosure in MR.
The regression model for the current study contained the disclosure level as
dependent variable, in addition to eight other variables divided into five independent and

127
three control variables. The independent variables are of the firm- characteristics; namely,
the ownership structure, cross-listing, age, industry type, and size. The control variables
included the regulation type as external control variable, and the profitability and the
leverage as internal control variables. The chosen firm-characteristics were common in the
studies of the accounting disclosure (Chen et al. 2006; Ettredge et al. 2011; Xin 2015).
4.6.1 Independent Variables
4.6.1.1 The Governmental Ownership (State-Ownership)
Previous studies presented some mixed explanations to the effect of governmental
ownership on the disclosure level. Some argued that the state-ownership would suggest that
the government obtain all information they need from the companies, therefore, the
managers in these companies could think that there will be no need to disclose more
information to the public (Naser and Nuseibeh 2003). However, many scholars criticized
that notion. Eng and Mak (2003) pointed out to the conflict and moral hazard in the state-
owned companies, as they have national objectives from one hand, and represent economic
units that face other competitors and target profits from the other hand. Therefore, they
argued that the managers tend to disseminate more information in order to explain both the
national objective and the profit objective. Furthermore, Li and Harrison (2008) argued that
the significant governmental ownership motivates the managers to disseminate more
information for two reasons; first, the high volume of information enhances the managers’
accountability to the public; second, the bureaucrats consider that disseminating more
information sends implicit messages that imply that there is nothing to hide within our
government properties, which is likely to support their political interests. Moreover, the
expectations that the state-ownership correlates positively with higher disclosure could be
explained by the government desire to be regarded as open to transparency and responses
highly to the users’ needs (Chen et al. 2006).
According to the Accountability State Authority’s Act n. 144 (1988), any firm that
the government owns at least 25% of its capital, either in direct or indirect way, is subjected
to the monitoring of the Accountability State Authority (ASA). This monitoring, of the
ASA, includes checking a firm’s records and the accounting reports. Therefore, the current
study follows the same principle to determine the effect of the volume of the governmental
ownership on the disclosure level (the state ownership must be 25% at least of the capital).
However, the researcher classified the companies of the sample as being ‘owned partially
by the government’, only if the government ownership was direct, while the indirect

128
ownership was ignored regardless of the volume of shares that are owned by one
governmental agency or more.
The majority of the previous studies found a positive relationship between the state
ownership and the disclosure level (e.g., Abd-Elsalam & Weetman, 2007; Boshnak, 2017;
Eng & Mak, 2003; Ghazali & Weetman, 2006; Makhija & Patton, 2004; Ntim et al., 2012;
Wang & Claiborne, 2008). On the other hand, Naser et al. (2002) could not confirm this
relationship, while Hassan et al. (2006) found a negative effect of the state-ownership on
the disclosure level.
Based on this argument, it was expected that state-ownership will correlate positively
with the disclosure level in MR. The sample of our current study could be divided to one-
hundred and eighteen private companies and forty state-owned companies. The researcher
used the dummy variable of ‘one’, if state-ownership exists, and ‘zero’, if otherwise.
4.6.1.2 Cross Listing
Some companies seek to be listed in more than one capital stock market, this action
can be linked with several goals (e.g., (Doidge et al. 2009); Domowitz et al. (1998) King
and Segal (2009). For example, the company could be looking toward being known
internationally, which increases its reputation and its products’ accessibility in the new
foreign markets. Another explanation could be that listing in a foreign market helps the
company in having foreign currency that can be needed to afford the importing of new
equipment that improve the quality of its products or services. The researcher believes that
both these aims/examples are applicable on the Egyptian cross-listed companies, and that
these companies look for the above-mentioned benefits of the cross-listing.
However, it is common that the listing rules differ from one country to another due
to several factors such as the culture, legal system, and the mature degree of a capital market.
Being listed in a stock exchange means that a company has to commit to the disclosure
requirements in that market. It is expected that some stock markets would have more
stringent listing rules that enforce the companies to disseminate extra information in
comparing with other markets. Furthermore, when a company becomes listed in a foreign
stocks market, the international investors impose a higher monitoring on it (Haniffa and
Cooke 2002; Elmagrhi 2016). On the one hand, the company will have to produce higher
volume of information to be complied with the listing rules in the market that requires more
disclosures. On the other hand, once a company presents that information, it is expected that
129
it will also disseminate more information in the other market regardless of what the listing
rules require, which should reduce the cost of capital and the agency costs.
The previous studies have provided evidence that cross-listing associates positively
with the disclosure level in the accounting reports (e.g., Aljifri et al., 2014; Boshnak, 2017;
Collett & Hrasky, 2005; Cooke, 1989a; Cooke, 1989b; Glaum & Street, 2003; Haniffa &
Cooke, 2002; Haniffa & Cooke, 2005; Hodgdon et al., 2009; Inchausti, 1997; Malone et al.,
1993). However, only few studies showed that there is no effect of cross-listing on the
disclosure level (e.g., Abd-Elsalam and Weetman (2003) Popova et al. (2013).
The current study expects that cross-listed companies will disseminate more volume
of information than domestic-listed ones. The sample of current study included nine cross-
listed companies and one-hundred and forty-nine domestic-listed companies. The researcher
used a dummy variable of ‘one’ when a company is cross-listed, and ‘zero’ when otherwise.
The sample of current study included forty-four MRs that belonged to cross-listed
companies, and seven hundred and twenty-one from domestic-listed companies.
4.6.1.3 The Industry Type
The industry sector is likely to effect the level of disclosure in MR. Cooke (1992)
claimed that manufacturing companies should disclose more information compared to the
others. This expectation could be explained with some reasons. For example, manufacturing
companies are supposed to disclose more information to explain the effect of their
operations on polluting the environment and the efforts that the company undertake to avoid
any harm to the surrounded society (sometimes this disclosure is more stringent to the
industrial companies by regulation). Furthermore, due to the continuous improvements in
the industrial technology, industrial companies may face higher risks in comparing with
other companies, which requires a disclosure on the management’s strategy in controlling
these factors. Nevertheless, Naser et al. (2002) argued that the manufacturing companies
have higher turnover in their assets, which requires extra investment to replace them
regularly. This would imply that the manufacturing companies are expected to disclose more
information to attract more investments.
However, the literature presented unclear evidence regarding the effect of the
industry type on the disclosure level. Some scholars documented significant differences in
the disclosure level between the industrial sectors ( e.g., Akhtaruddin, 2005; Alanezi &
Albuloushi; 2011; Aljifri, 2008; Aljifri et al., 2014; Boshnak; 2017; Cooke, 1992; Haniffa

130
& Cooke, 2002; Hassan et al., 2006; Street & Gray 2002; Wallace & Naser, 1995). On the
other hand, some scholars found no significant effect of the industry type on the disclosure
level (e.g., Abd-Elsalam & Weetman, 2003; Malone et al., 1993; Naser et al., 2002; Owusu-
Ansah, 1998; Tsalavoutas, 2011)
The researcher also classified the companies into two categories; manufacturing
companies and non-manufacturing companies. In order to carefully distinguish between
both types of companies, a manual review to the MRs was carried out to check the main
operations of every company. The companies in the sample were classified into eighty-two
manufacturing companies and seventy-six non-manufacturing companies. A dummy
variable was employed with a value of ‘one’ for manufacturing companies, and ‘zero’ for
the otherwise.
4.6.1.4 The Listing-Age
Over the years, the companies became more experienced in disclosing relevant
information to the users (Alsaeed 2006; Akhtaruddin 2005). While a new company faces
serious challenges to gain competitive advantages in the market, an old company depends
on its reputation in the market as a competitive advantage. Therefore, it was expected that
old the companies to have higher motivations in presenting more detailed information within
their accounting reports, which is supposed to enhance the users’ trust (the users of
accounting information)(Owusu-Ansah 1998).
However, it might be significative to take into consideration that that new companies
seek investments to expand their operations and reduce the cost of capital, unlike the old
companies who depend on their internal funds as resources (Haniffa and Cooke 2002).
Moreover, new companies are more aware of the challenges they face, thus, they might
disseminate more information than the old companies for two reasons; first, to enhance the
investors’ confidence in their activities and surrounded risks and how the management
controls them; second, disseminating more information send messages to the capital market
authorities that the new company has high commitment to the mandatory disclosure
requirements and disclose even additional information (Omar 2007).
The previous studies presented mixed results as well. Some studies documented a
positive effect of the firm age on its disclosure level (e.g., Al-Shammari & Al-Sultan, 2010;
Al-Shammari et al., 2008; Boshnak, 2017; Owusu-Ansah, 1998; Popova et al., 2013), while
others found no relationship between the firm age and the disclosure level (e.g.,

131
Akhtaruddin, 2005; Alanezi & Albuloushi, 2011; Alsaeed, 2006; Haniffa & Cooke, 2002;
Hossain & Hammami, 2009; Owusu-Ansah & Yeoh, 2005). Contrary, Mallin and Ow-Yong
(2009) found that the old companies disclose less corporate governance information than
the new companies. This action can be explained with the agency theory; the new companies
attempt to enhance the trust in their management and to decrease the monitoring cost.
The current study distinguished between the listed companies in EGX by dividing
them into two groups; new companies and not-new companies. The first category included
all the companies that have been listed after 2002 and until 2011. In 2002, EGX presented
the listing rules for the first time; therefore, the researcher used that year as a cut-point
between the new companies and not-new companies. The new companies’ group included
thirty new companies, while the other group included one-hundred and twenty-eight of the
non-new companies.
4.6.1.5 The Firm Size
The literature of the accounting disclosure showed that there is a positive association
between the firm size and the disclosure level. Some argued that, due to the signalling
theory, large firms seek to meet the expectations of the users to keep their market leadership
(Iatridis 2008). Boshnak (2017) referred to the complexity of the large companies’
surrounded conditions. While the large company, commonly, produces many
products/services, these activities increase the risks that it faces, which requires disclosing
more information to emphasize the management ability in dealing with these risks.
It is expected that when a company decides to produce more information, for internal
or external usage, it might endure additional cost . Unlike small firms, large firms have the
ability to afford establishing modern information systems that help them in producing high
volume of information for internal use with reasonable cost, thus, any decision by the
management to include some of this information in the accounting report would not cost
extra money (Hassanein and Hussainey 2015; Lang and Lundholm 1993; Xin 2015).
Furthermore, large size companies play an important role in the economy, which highlights
their disclosures in the sight of the governmental bodies (Abd El-Salam 1999). Moreover,
large firms are likely to be pursued by more investors than the small ones, which encourages
the managers to commit to the mandatory disclosure and present more voluntary information
(Boshnak 2017; Healy and Palepu 1995). Nevertheless, large companies have mid-term and
long-term strategies for lunching new products/services and/or new branches, which

132
requires an increase in the capital or lending; accordingly, more disclosure can reduce the
cost of capital/lending for these companies (e.g., Berglof and Pajuste (2005);Botosan (1997)
& (2000); Donnelly and Mulcahy (2008); Hassan et al. (2009)).
The scholars used different measurements as proxies to the company size, such as the
number of employees, total sales, and the market capitalization, however, using the total
assets (the natural logarithm of total assets) is the most common (Alotaibi 2014).
Several studies investigated the effect of firm size on disclosure level, however, their
findings were inconsistent. Many studies illustrated the positive association between the size
and the extent of disclosure (e.g., Akhtaruddin, 2005; Al-Shammari et al., 2008; Aljifri et
al., 2014; Boshnak, 2017; Cooke, 1992; Hassan et al., 2006; Hodgdon et al., 2009; Naser &
Nuseibeh, 2003; Owusu-Ansah & Yeoh, 2005; Wallace & Naser, 1995; Wallace et al.,
1994). On the other hand, several other studies suggested that the firm size does not affect
the disclosure level (e.g., Abd-Elsalam & Weetman, 2003; Alanezi & Albuloushi, 2011;
Aljifri, 2008; Dahawy, 2009; Ettredge et al., 2011; Glaum & Street, 2003; Malone et al.,
1993; Popova et al., 2013; Street & Gray, 2002; Tsalavoutas, 2011)
In the current study, the researcher used the natural logarithm of assets as a proxy to
the firm size. All data has been collected from Thomson Reuters. It was expected that the
large size firms to disseminate more information in MR compared with small companies.
4.6.2 Control Variables
4.6.2.1 The Regulation Type
While the regulation has direct effects on the accounting disclosure in general, the
listing rules are the main reference that include the minimum mandatory disclosure of
information that should be disclosed in MR. As one of the main aims of the current study is
to investigate the effect of new listing rules on the usefulness of MR content, the researcher
used the regulation type as a control variable to explain the differences in the disclosure
level between MRs that were prepared under the new regulation and MRs that were prepared
under the old one. Therefore, this variable would take ‘one’ as a score for the MRs that had
been produced under the new listing rules, and ‘zero’ for the otherwise.
4.6.2.2 The Profitability
Empirical evidence so far suggested that the higher profits have a significant positive
effect on the disclosure level. While the less profitable or unsuccessful companies may tend
to withhold some information from their stakeholders, the companies with higher profits

133
tend to disclose more information for three reasons. First, the management desires to express
its success in achieving profits and to enhance the stakeholders’ confidence in the
company’s performance and the management strategies (Hassan et al. 2006), which would
be reflected on the compensation that the managers receive from the company (Singhvi and
Desa 1971). Second, the managers believe that disseminating more information is a means
to show their success in leading the company, which increases the their reputation as
mangers in the market (Alsaeed 2006). Last and not least, the high profits could increase the
political costs, which urges the management to explain how the company achieved this level
of profits while respecting the regulations and the moral rules (Inchausti 1997). Conversely,
the managers disseminate less information when the company gains low profits or even
losses in an attempt to withhold some details about the poor performance of the company
and the managers (Aljifri et al. 2014).
The prior studies presented mixed results regarding the relationship between the
profitability and disclosure level. Several studies documented a positive effect of
profitability on the disclosure level (e.g., Akhtaruddin, 2005; Al-Shammari et al., 2008;
Hassan et al., 2006; Hodgdon et al., 2009; Naser et al., 2002; Owusu-Ansah, 1998; Owusu-
Ansah & Yeoh, 2005; Tsalavoutas, 2011). On the other hand, many studies found no
significant evidence of the impact of profits on the disclosure level (e.g., Abd-Elsalam &
Weetman, 2003; Aljifri, 2008; Aljifri et al., 2014; Malone et al., 1993; Popova et al., 2013;
Street & Gray, 2002; Wallace et al., 1994). Surprisingly, Boshnak (2017) revealed that the
companies with high profits are less commitment with the mandatory disclosure
requirements, despite that these same companies disseminate more voluntary information.
The current study uses the return on equity (ROE), a proxy of the profitability, as a
control variable. The data has been collected from Thomson Reuters’ database. It was
expected that the companies with higher profits disseminate more information in MR
compared with companies with less profits.
4.6.2.3 The Leverage
It is presumed that when the ratio of debts is high, the company tends to disclose
more information to convince its creditors that their money is safe (Hassan et al. 2006).
Furthermore, the companies that are on the verge of making borrowing-decision may tend
to increase the volume of information in their accounting reports (Haniffa and Cooke 2002;
Malone et al. 1993). This step would aim to persuade the prospective creditors on how their
money will be safe, which will be reflected on the cost of loans (Wallace et al. 1994).

134
Furthermore, a company may disclose more information than usual when its leverage is high
due to the agency costs (Jensen and Meckling 1976; Ahmed and Courtis 1999). Moreover,
disclosing more information can send certain signals to the creditors on the management
awareness of all the surrounded conditions, including the risks (Xin 2015).
The studies that investigated the effect of leverage on disclosure level produced
inconsistent results. Some studies documented a positive association between leverage and
disclosure level (e.g., Al-Shammari et al., 2008; Alanezi & Albuloushi, 2011; Barako et al.,
2006; Boshnak, 2017; Ghazali, 2010; Hassan et al., 2009; Malone et al., 1993; Tsalavoutas,
2011). Another group of studies revealed that there is no significant effect of leverage on
the disclosure level )e.g., Agyei-Mensah, 2013; Ali et al., 2004; Aljifri, 2008; Craig & Diga,
1998; Dahawy, 2009; Wallace & Naser, 1995). However, few other studies found that the
leverage has a negative impact on the disclosure level (e.g., Eng and Mak (2003) Hassan et
al. (2006); Mallin and Ow-Yong (2009)).
Likewise, for the profitability, the current study employees the Leverage as a control
variable. The data has been collected from Thomson Reuters. It was expected that the
companies with higher leverage disclose more information in MR compared with the
companies with less leverage.
Table 4.5 summarizes the above variables and the sources of collecting each of them.
The Model
MRDISC= OWNST+ +CROSL+ INDTY +AGE+SIZE +REG + ROE+ LEV+ ε
Where; MRDISC: Disclosure level in MR ; OWNST State-ownership; CROSL: Cross-listing;
INDTY: Industry Type; AGE: company’s age; SIZE: company’s size; REG: Regulation Type; ROE:
Return on equity; LEV: Leverage; ε: estimation error in the model
4.7 Descriptive Statistics
Table 4.6 presents the descriptive statistics regarding both the independent variables
and the control variables. It shows that 74.3% of the collected reports were issued by private
companies, while one-quarter of the reports belonged to the companies that partially owned
by the government. Furthermore, less than 6% of the companies were cross-listed and 51.6%
of the companies were involved in manufacturing activities. Moreover, less than one-fifth
of the listed companies in EGX were new listed companies (listed after 2002). The
135
companies’ size seemed to be medium since the average of theirs size recorded 13.4, with a
minimum of 10.13 and maximum of 18.04. In relation to the period that the MRs covers,
roughly 60% of the collected reports were produced under the new regulation. The returns
on equity and financial leverage as divided by equity varied between the companies in the
sample from -77.54 and .01 to 80.27 and 228.69 respectively.
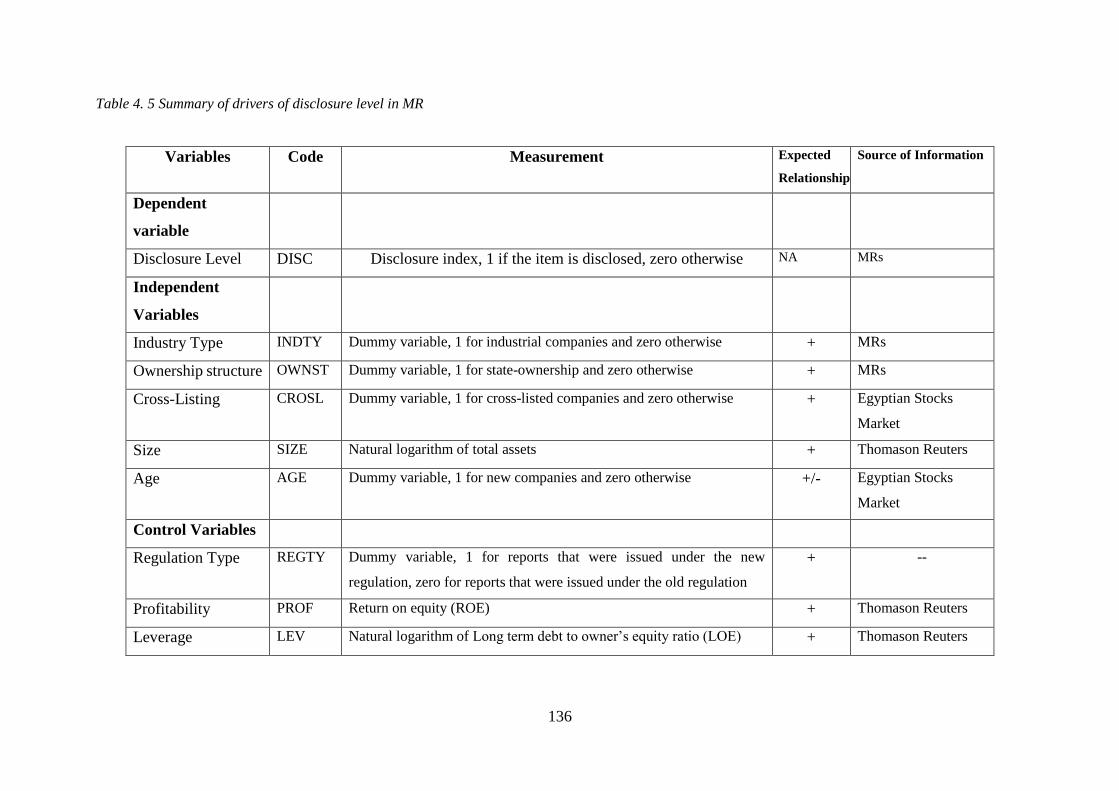
136
Table 4. 5 Summary of drivers of disclosure level in MR
Variables Code Measurement Expected
Relationship
Source of Information
Dependent
variable
Disclosure Level DISC Disclosure index, 1 if the item is disclosed, zero otherwise NA MRs
Independent
Variables
Industry Type INDTY Dummy variable, 1 for industrial companies and zero otherwise + MRs
Ownership structure OWNST Dummy variable, 1 for state-ownership and zero otherwise + MRs
Cross-Listing CROSL Dummy variable, 1 for cross-listed companies and zero otherwise + Egyptian Stocks
Market
Size SIZE Natural logarithm of total assets + Thomason Reuters
Age AGE Dummy variable, 1 for new companies and zero otherwise +/- Egyptian Stocks
Market
Control Variables
Regulation Type REGTY Dummy variable, 1 for reports that were issued under the new
regulation, zero for reports that were issued under the old regulation
+ --
Profitability PROF Return on equity (ROE) + Thomason Reuters
Leverage LEV Natural logarithm of Long term debt to owner’s equity ratio (LOE) + Thomason Reuters

137
Table 4. 6 Descriptive statistics of independent and control variables in the regression model
Variables Number of Observations Mean Std. Deviation Minimum Maximum
OWNST 765 .7425 .43755 -- --
CROSL 765 .0575 .233 -- --
INDTY 765 .5163 .50 -- --
- AGE
- Age in years
765
158 Companies
.194
18.46 years
.395
6.24 years
--
5 years
--
58 years
SIZE_LOG 703 13.42 1.663 10.13 18.04
REGTY 765 .596 .491 -- --
ROE 658 .088 .17 -.78 .81
LEV 639 .437 .597 .01 2.29
Table 4. 7 Pearson correlation
Variables Disc GOVOW CROLT INDTY AGE SIZE_LO REGTY ROE LEV
MRDISC 1.000
OWNST .221
(.000)
1.000
--
CROST .058
(.077)
.015
(.355) 1.000
INDTY .154
(.000)
-.126
(.001)
-.049
(.113) 1.000
AGE -.019
(.317)
.232
(.000)
.073
(.036)
-.006
(.437) 1.000
SIZE_LO .165
(.000)
-.091
(.013)
.383
(.000)
.050
(.111)
.031
(.220) 1.000
REG .810
(.000)
.005
(.454)
.002
(.485)
.022
(.291)
.013
(.375)
.147
(.000) 1.000
ROE .075
(.032)
-.210
(.000)
-.083
(.020)
.000
(.497)
-.093
(.011)
.127
(.001)
.023
(.285) 1.000
LEV .059
(.075)
.177
(.000)
.148
(.000)
.036
(.189)
.049
(.113)
.330
(.129)
.097
(.008)
-.275
(.000) 1.000
OWNST State-ownership; CROSL: Cross-listing; INDTY: Industry Type; AGE: company’s age; SIZE:
company’s size; REG: Regulation Type; ROE: Return on equity; LEV: Leverage
, , the correlation is significant at 10%, 5%, and 1% respectively.
Table 4.7 shows the results of Pearson test of the correlations between the variables
in the regression model. It was revealed that the disclosure level correlates with all the
independent and control variables in the model, except for the Age. The type of correlation

138
referred to a positive association between the disclosure level and state-ownership, cross
listing, the industry type (the industrial firms), the firm size (big firms), profits (high profits),
and leverage (high leverage). Furthermore, the new regulation has a positive correlation
with the increase of the disclosure level in MR.
4.8 Results
Using a linear regression analysis needs four assumptions in the used data to be met.
These assumptions are (all the tests are un-tabled):
The normality of the dependent variable (Shapiro-Wilk test);
Homoskedasticity (Breausch-Pagan test);
Absence of autocorrelation between residuals (Durbin-Watson test);
Absence of multicollinearity (VIF and Tolerance).
While the last three assumptions were met in our collected data, the normality was an
issue in the ROE and Leverage. Using the natural logarithm is not possible in case of the
ROE because the original data could include negative values. In order to minimise the non-
normality issue, some transformations were followed, such as the square root, however, the
transformed data did not produce any different results in the testing of the normality
distribution. Furthermore, the outliners were eliminated from the data to minimise the non-
normality. It has been argued that the non-normality assumption does not treat the validity
of the regression model, but rather it would only imply that the estimators with non-
normality might not be sufficient in explaining the independent variable (Brooks 2008).
Brooks suggested that even if the normality assumption was not met in some variables, OLS
would still be effective in carrying out the analysis because it gives more accurate results
compared with other regression models. He added that the type of finance date rarely passes
the normality assumption. Furthermore, in some cases, non-normality is the result of some
types of heteroskedasticity, especially in financial data, however, its eventual effect on the
results is not intense (Elghuweel 2015). In addition, the current study focuses mainly on the
relationships between independent variables and the dependent variable, while it employees
ROE and Leverage as control variables. Based on this brief discussion, it was decided to
perform an ordinary least Squares (OLS) regression model.

139
4.8.1 Firm-Characteristics and Aggregated Disclosure in MR
Table 4.8 demonstrates that t- value for three of firm-characteristics have significant
effects on the disclosure level, while other firm characteristics seem to have no significant
influence on the disclosure. The governmental-ownership in listed companies has a positive
relationship with the disclosure level ( t-value: - 9.253, P value ≤ 1%). Furthermore,
manufacturing firms have used to disseminate more volume of information than
nonmanufacturing firms (t- value: 5.137, P value ≤ 1%). Lastly, the cross-listed companies
disseminate more information in its MRs in comparing with the local-listed companies (t-
value: 2.926, P value ≤ 1%). The age, size, profitability, and leverages seem to have
insignificant impact on the aggregate disclosure level in MR.
Table 4. 8 OLS regression model on the aggregated disclosure in MR
Variables Coefficients Std. error T Sig. Ranking
Independent Variables
OWNST .075 .008 9.253 .000 9
CROSL .042 .014 2.926 .004 4
INDTY .034 .007 5.137 .000 3
AGE .007 .009 .794 .428
SIZE -.001 .002 -.516 .606
Control Variables
REG .246 .007 36.927 .000 1
ROE .000 .000 1.038 .300
LEV .000 .000 .555 .579
Constant .173 .032 5.479 .000
R2 .723 Adj. R2 .719
Std. Error of the
Estimate .08045
F- value 194.386 Sig. F .000
Number of
observations 605
OWNST State-ownership; CROSL: Cross-listing; INDTY: Industry Type; AGE: company’s age; SIZE:
company’s size; REG: Regulation Type; ROE: Return on equity; LEV: Leverage
, , significant at 10%, 5%, and 1% respectively
Discussion on the impact of firm-characteristics on the aggregated disclosure in MR
Results of OLS regression model suggested that some firm-characteristics have
significant effects on the overall disclosure level. The results revealed that the state-
ownership has a significant impact on the disclosure level of the different types of

140
information. Generally, the private-owned companies disclose lower volume of information
than the state-owned companies. This finding is consistent with many other studies (e.g.,
Abd-Elsalam & Weetman, 2007; Abdel-Fattah, 2008; Boshnak, 2017; Eng & Mak, 2003;
Ghazali & Weetman, 2006; Ntim et al., 2012; Wang & Claiborne, 2008). This finding can
be related to three reasons. First, the government attempts to present the best disclosure
practices to encourage the private companies in following their same disclosure strategy,
which is useful, in the medium and long run, in enhancing the market efficiency and
maturity. Another possible explanation can be the enhancing of the accountability of
government by the public. As the state-ownership means that public amounts of money have
been dedicated by the government for investing in some profitable activities; these
companies increase its disclosure level to explain to the public how their money was
invested.
Cross-listing seems to affect the disclosure in MR positively compared with the
companies listed in only one capital market. This finding is similar to the prior studies (e.g.,
Abdel-Fattah, 2008; Aljifri et al., 2014; Boshnak, 2017; Collett & Hrasky, 2005; Cooke,
1989a; Cooke, 1989b; Glaum & Street, 2003; Haniffa & Cooke, 2002; Haniffa & Cooke,
2005; Hodgdon et al., 2009; Inchausti, 1997; Malone et al., 1993). This result can be
explained with the variety of the users’ needs in the different markets. Cross-listed
companies deal with several users-groups in different markets, which is reflected on the
dissemination of more information in order to gain the trust of the investors in each market.
Furthermore, it is expected for the disclosure culture of any company to be affected by the
higher efficient market, and that the company would adopt a similar culture in the lower
efficient market regardless of the disclosure practices of the other companies listed in the
local-market only (Abdel-Fattah 2008).
The industry type affects the disclosure practices in MR. Results of the regression
analysis showed that MRs of the industrial companies includes more information than these
in non-industrial companies. This result is consistent with several prior studies ( e.g.,
Akhtaruddin, 2005; Alanezi & Albuloushi, 2011; Aljifri, 2008; Aljifri et al., 2014; Boshnak,
2017; Cooke, 1992; Haniffa & Cooke, 2002; Hassan et al., 2006; Street & Gray, 2002;
Wallace & Naser, 1995). However, this finding is in contrast to other studies that found no
significant effect of the type of industry on the disclosure level (e.g., Abd-Elsalam &
Weetman, 2003; Malone et al., 1993; Naser et al., 2002; Owusu-Ansah, 1998; Tsalavoutas,
2011). The positive effect between industrial activities and disclosure level could be

141
accounted to the higher complexities that face the manufacturing companies activities (i.e.,
the technological obsolescence, competition risks, and pollution emissions). These
conditions require more information to reflect whether the management adopted successful
strategy to deal with them. This disclosure is helpful for both the investors and the
governmental authorities who monitor the effects of the industrial companies on the
surrounded environment.
The impact of firm size on the disclosure level showed non-significant. This finding
is similar to many other studies that revealed that the size does not affect the disclosure level
(e.g., Abd-Elsalam & Weetman, 2003; Alanezi & Albuloushi, 2011; Aljifri, 2008; Dahawy
2009; Ettredge et al., 2011; Glaum & Street, 2003; Malone et al., 1993; Popova et al., 2013;
Street & Gray, 2002; Tsalavoutas, 2011). This finding could be attributed to the desire of
the small companies to expand their activities, which requires attracting new investors and
lenders via the adoption of more transparent strategy in disseminating information that
shows the strong position of these companies.
The analysis suggested also that Age, Size, ROE, and leverage have no significant
impact on the disclosure level in MR. Firm’s age has no significant impact on the disclosure
level in MR. This finding is similar to several prior studies ( e.g., Akhtaruddin, 2005; Al-
Shammari et al., 2008; Alanezi & Albuloushi, 2011; Alotaibi, 2014; Alsaeed, 2006; Haniffa
& Cooke, 2002; Hossain & Hammami, 2009; Owusu-Ansah & Yeoh, 2005). This finding
suggests that the new companies attempt to adopt similar disclosure strategies to these of
the old companies, which is reflected on the similar volumes of the disclosure included in
MRs of the new and old companies. ROE has no significant impact on the aggregated
volume of information provided in MR although that many prior studies suggested that the
high profits are associated positively with the disclosure level. Our findings are similar to
the results of several other studies (e.g., Abd-Elsalam & Weetman, 2003; Aljifri, 2008;
Aljifri et al., 2014; Malone et al., 1993; Popova et al., 2013; Street & Gray, 2002; Wallace
et al.,1994). This result suggests that the companies with high profits do not seek to justify
the success of their activities and their strong competitive position that led to the high profits.
Lastly, the current study revealed that the leverage has no significant impact on the overall
discourse level in MRs compared with companies with low leverage ratios. This finding
matches the results of many prior studies (e.g., Aljifri (2008), Dahawy (2009), Wallace and
Naser (1995).

142
4.8.2 Firm-Characteristics and Usefulness level of Disclosure: Usefulness level and
Commitment level
This section examines the effect of firm-characteristics on the disclosure level in MR
based on the type of disclosure. First, we will check the impact of firm-characteristics on
the disclosed volume of high useful items and moderate useful items. Second, we will
examine the relationship between firm-characteristics and the level of commitment in the
disclosure (mandatory disclosure vs. voluntary disclosure).
4.8.2.1 Firm-Characteristics and the Usefulness Level of Disclosure
Chapter three concluded with that the users consider some information to has high
usefulness, while the rest of the items in the questionnaire were chosen as of moderate
usefulness. Table 4.9 represents the regression model for the disclosure on the very useful
items and the moderate useful items. However, it was clear that the effect of the regulation
is the dominant explanation in the improvement of disclosure level.
The table illustrates that three of firm-characteristics have significant influences on
reporting the very useful items in MR. The state-ownership correlates positively and
significantly with disseminating more information in MR (t- value of -7.826 and P value ≤
1%). Moreover, the MRs of the companies that were listed in more than one capital market
provided more useful content than these in the companies listed in one market only (t-
Value: 3.612, P value ≤ 1%). In addition, the nonindustrial companies disclosed less useful
information in comparing with the industrial ones (t- value: 3.404, Sig.: 1%).
The disclosure of moderate useful items in MR was affected by four variables. Table
4.8 indicates that the absent of state ownership has a negative impact on the level of
disclosure on the moderate useful information (t- value: -8.063, P value ≤ 1%). Furthermore,
the industrial companies presented more moderate useful information than the other
companies (t- value: 7.108, P value ≤ 1%). The company’s age has the least significant
effect on disclosure level, since t- value achieved 1.671 which was significant (P value
≤10%). This finding suggests that the new listed companies disclose less moderate useful
information in the MR. Lastly, the companies with higher profits disseminate high number
of moderate useful information compared with the companies with losses or lower profits
(t- value 1.814, P value ≤ 10%).

143
4.8.2.2 Firm-characteristics and the commitment level of disclosure: Mandatory
disclosure and Voluntary disclosure
Table 4.9 indicates that the regression model is efficient in explaining the differences
in disclosure level in MRs (Adj. R squared: 0.861), as the significance of F value supports
the significance of the model in general (F value: 469.915, P value ≤1%).
Three firm-characteristics affected the level of mandatory disclosure in MR. Table
4.8 highlights that the companies with government ownership are more committed to the
mandatory disclosure requirements (t- value: -7.417, P value ≤1%). Furthermore, the
industrial companies showed more obligation to the mandatory disclosure compared with
the nonindustrial companies (t- value: 3.887, P value ≤1%). The profitability seems to have
a trivial significant impact on mandatory disclosure level (P value ≤1%). moreover, the high
profits encourage the companies to commit to the mandatory disclosure requirements (t-
value: 2.798, P value ≤1%)
Regarding the voluntary disclosure, table 4.8 illustrates that the regression model
significance was high (F value: 12.606, Sig.: 0.00). It was proven that the governmental
ownership positively correlates with the extent of the voluntary disclosure (t- value: 7.361,
Sig.: 0.00). Moreover, t- value for the cross-listing variable scored (3.980) which is
considered to be significant at the level of 0.05; this suggests that cross-listed companies
provide more voluntary information in their MR. The industry type was also appeared to be
of the least significant effects on voluntary disclosure, since the value of t- recorded 3.308
at significance level of 1%. This indicates that the industrial companies disclose more
voluntary information compared with the non-industrial companies. On the contrary, the
voluntary disclosure has decreased after switching to the new regulation (t- value -1.742,
Sig: .082). The age, profitability, size, and leverage did not have any significant impact on
the extent of voluntary disclosure in MR.
4.8.2.3 Discussion
The usefulness level of disclosure
Up to best of our knowledge, the previous studies did not examine the impact of firm-
characteristics on the usefulness level of disclosure. The current study showed that the
presence of state-ownership and manufacturing activities significantly increases the
disclosure on the very useful items and the moderate useful items. Moreover, cross-listed
companies disseminate more very-useful items than the other companies. Both the age and
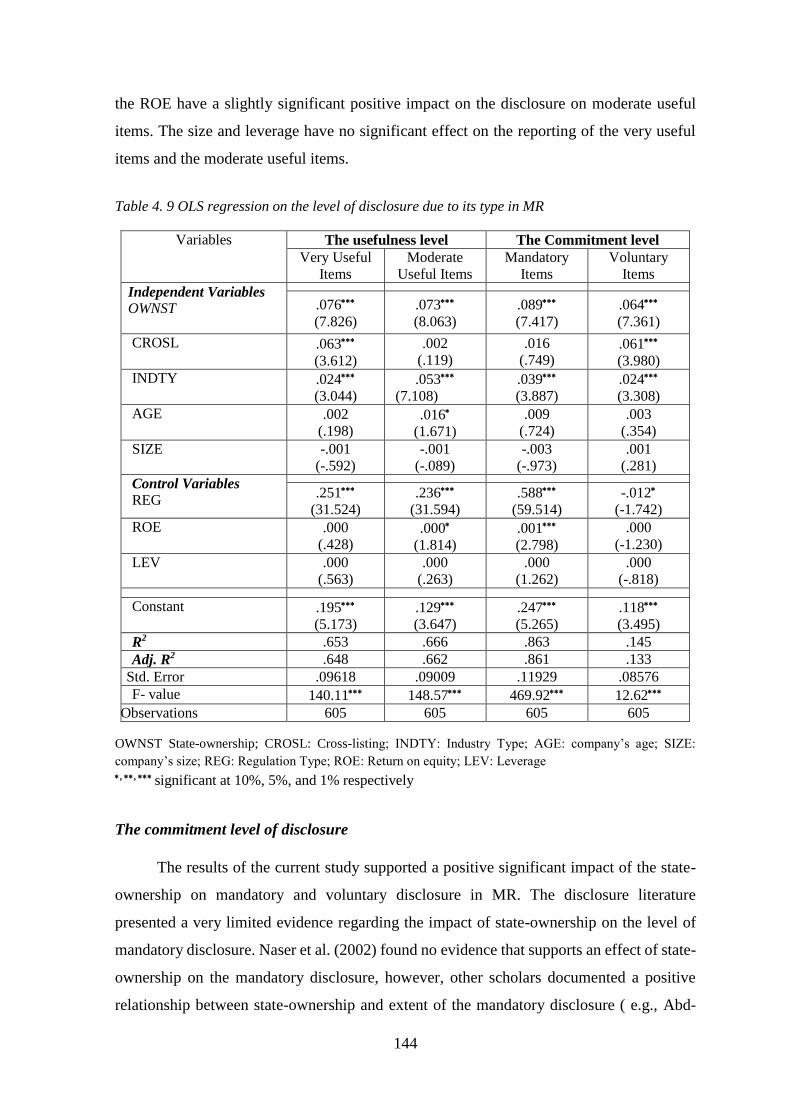
144
the ROE have a slightly significant positive impact on the disclosure on moderate useful
items. The size and leverage have no significant effect on the reporting of the very useful
items and the moderate useful items.
Table 4. 9 OLS regression on the level of disclosure due to its type in MR
Variables The usefulness level The Commitment level
Very Useful
Items
Moderate
Useful Items
Mandatory
Items
Voluntary
Items
Independent Variables
OWNST
.076
(7.826)
.073
(8.063)
.089
(7.417)
.064
(7.361)
CROSL .063
(3.612)
.002
(.119)
.016
(.749) .061
(3.980)
INDTY .024
(3.044)
.053
(7.108)
.039
(3.887)
.024
(3.308)
AGE .002
(.198) .016
(1.671)
.009
(.724)
.003
(.354)
SIZE -.001
(-.592)
-.001
(-.089)
-.003
(-.973)
.001
(.281)
Control Variables
REG
.251
(31.524)
.236
(31.594)
.588
(59.514)
-.012
(-1.742)
ROE .000
(.428) .000
(1.814)
.001
(2.798)
.000
(-1.230)
LEV .000
(.563)
.000
(.263)
.000
(1.262)
.000
(-.818)
Constant .195
(5.173)
.129
(3.647)
.247
(5.265)
.118
(3.495)
R2 .653 .666 .863 .145
Adj. R2 .648 .662 .861 .133
Std. Error .09618 .09009 .11929 .08576
F- value 140.11 148.57 469.92 12.62
Observations 605 605 605 605
OWNST State-ownership; CROSL: Cross-listing; INDTY: Industry Type; AGE: company’s age; SIZE:
company’s size; REG: Regulation Type; ROE: Return on equity; LEV: Leverage
, , significant at 10%, 5%, and 1% respectively
The commitment level of disclosure
The results of the current study supported a positive significant impact of the state-
ownership on mandatory and voluntary disclosure in MR. The disclosure literature
presented a very limited evidence regarding the impact of state-ownership on the level of
mandatory disclosure. Naser et al. (2002) found no evidence that supports an effect of state-
ownership on the mandatory disclosure, however, other scholars documented a positive
relationship between state-ownership and extent of the mandatory disclosure ( e.g., Abd-

145
Elsalam and Weetman (2007) Boshnak (2017)). Regarding the voluntary disclosure, our
findings are in line with several prior studies (e.g., Al-Janadi et al. (2013); Eng and Mak
(2003); Lan et al. (2013); Makhija and Patton (2004); Ntim et al. (2012); Wang and
Claiborne (2008))
Cross-listing was found to have a strong positive impact on increasing the extent of
voluntary disclosure; however, no significant effect of it was noticed on the mandatory
disclosure. The findings related to the mandatory disclosure is consistent with the studies of
Abd-Elsalam and Weetman (2003), Dahawy (2009), and Popova et al. (2013). On the other
hand, cross-listed companies presented a greater content of information in their MRs
compared with the companies listed in only one-market, which is consistent with the main
stream of the previous studies (e.g., Boshnak, 2017; Cooke, 1989b; Cooke, 1992; Inchausti,
1997; Malone et al., 1993; Ntim et al., 2012; Wallace et al., 1994). These results could be
explained in light of the power of enforcement imposed on them; where both cross-listed
and one-market-listed companies are committed to the requirements of the mandatory
disclosure. The increase in the voluntary disclosure in cross-listed companies stems from
the differences in mandatory disclosure requirements in the higher market and the maturity
of users in that market, which can be reflected on the volume of the produced information
that is available to the external users in the lower market.
The analysis that was done on the industry type suggested that the manufacturing
companies presented more mandatory and voluntary information than the non-
manufacturing companies. Prior studies have failed in classifying listed companies into
specific agreed-upon economic sectors; however, several of these studies found a significant
impact of the economic sectors on mandatory disclosure (e.g., Akhtaruddin, 2005; Al-
Shammari et al., 2008; Alanezi & Albuloushi, 2011; Aljifri, 2008; Aljifri et al., 2014;
Cooke, 1992; Craig & Diga, 1998; Hassan et al., 2006; Street & Gray, 2002; Wallace &
Naser, 1995), and on voluntary disclosure (e.g., Al‐Akra et al. (2010); Barako et al., 2006;
Boshnak, 2017; Camfferman & Cooke, 2002; Cooke, 1989b; Cooke, 1992; Haniffa &
Cooke, 2002; Ho & Wong, 2001; Raffournier, 1995; Samaha and Dahawy (2010). It could
argued that some firms’ activities emphasize the need for more disclosure in respect of both
the legally-requested disclosure (Accounting standards and listing regulations) and thee
voluntarily information needed to highlight the going concerns for current and potential
investors. As the current study shows, manufacturing companies are more obliged to
mandatory disclosure’s requirements and present more voluntary information in their MRs.

146
The profitability (ROE) has a slightly significant positive impact on voluntary
disclosure, yet no significant impact was noticed regarding the mandatory disclosure. These
results are consistent with many prior studies on the voluntary disclosure (e.g., Akhtaruddin
et al. (2009); Boshnak, 2017; Ghazali & Weetman, 2006; Haniffa & Cooke, 2002; Hassan
et al., 2006; Hussainey & Al-Najjar, 2012; Jaggi & Low, 2000; Kamel And Awadallah,
2017; Lan et al., 2013; Raffournier, 1995; Wang & Claiborne, 2008), and on mandatory
disclosure (e.g., Abd-Elsalam & Weetman, 2003; Agyei-Mensah, 2013; Aljifri, 2008;
Malone et al., 1993; Street & Gray, 2002; Wallace et al., 1994). While all companies
considered the mandatory disclosure to be the minimal level of information they have to
present, companies with high profits sought to show their strong performance to the
investors, which enhances their shares’ prices and their mangers’ reputation in the market.
The Age, Size, and Leverage had no significant impact on both types of disclosure;
the mandatory and the voluntary. This finding is in consistence with the prior studies on the
age (e.g., Akhtaruddin, 2005; Al-Shammari et al., 2008; Alanezi & Albuloushi, 2011;
Alotaibi, 2014; Owusu-Ansah, 1998), Size (e.g., Abd-Elsalam & Weetman, 2003; Alanezi
& Albuloushi, 2011; Aljifri, 2008; Makhija & Patton, 2004; Malone et al., 1993), and
Leverage (e.g., Agyei-Mensah, 2013; Ali et al., 2004; Craig & Diga, 1998; Dahawy, 2009;
Haniffa & Cooke, 2002; Ho & Wong, 2001; Hussainey & Al-Najjar, 2012; Kamel And
Awadallah, 2017; Raffournier, 1995; Scaltrito (2016); Wallace & Naser, 1995; Wallace et
al., 1994).
4.8.3 Discussion on the Impact of Firm-Characteristics on Disclosure Level in MR
Sections and Subsections
This section includes additional analysis to examine the impact of firm-characteristics
on disclosure level of the different types of information provided in MRs. Results of the
analysis are reflected in table 4.10.
The analysis demonstrated that the firm-characteristics have an unequaled effect on
disseminating the information on CG’s subsections. The disclosure on ownership structure
was affected by the state-ownership, which implies a significant positive relationship
between the state-ownership and the disclosure on ownership structure (P value > 1%).
Other variables were found not to have a significant impact on ownership structure
disclosure. A prior study by Samaha et al. (2012) in Egypt showed that industry type, size,

147
ROE, and Leverage do not affect the disclosure on ownership structure, which is consistent
with our current study.
The disclosure on board composition was affected by two variables; state-ownership
(P value > 10%) and cross listing (P value > 1%). Furthermore, there were no significant
impact of other firm-characteristics on board composition disclosure, which is in line with
the findings of Samaha et al. (2012) study, except for the size which was positively
associated with this type of disclosure.
Three firm-determinates had a significant impact on the disclosure on the audit
committee. The results suggested that manufacturing companies disclose less information
on the audit committee compared with the non-manufacturing companies (P value> 1%). In
addition, both old companies and large size companies disseminate more volume of
information in their MRs that covers audit committee (P value > 10% and > 5%
respectively). The remaining variables in the model appeared not to have any significant
influence on corporate governance’s subsections.
The regression model on the internal control and risks illustrated that there were four
variables that had significant effects on the disclosure on this section. Table 4.11 shows that
cross-listed companies disclose more information than the companies listed in one-market
(P value > 1%), and that new listed companies disseminate less information compared to
the old listed companies (P value > 5%). Rationally, cross-listed companies face more
complex challenges in their activities, which requires more disclosures to justify the risks to
the users. Furthermore, as it was discussed earlier, the new firms are in a severe competition
with the old companies, which puts them in the face of risks. As it was expected, the high
profits had a negative effect on the disclosure level (P value ≤ 1%). This result was expected
since the companies with low profits or with losses encounter serious threats and need to
present more justifications in their MRs to explain the impact of these threats on the current
and the expected performance (Elshandidy et al. 2015). Furthermore, the current study
revealed that the high Leverage associates positively with the higher volume of disclosure
on the risks management (P value > 1%), which is consistent with Hassan (2009) but in
opposite of Amran et al. (2008).
Firm size was found to have an insignificant influence on risks disclosure, which is
consistent with findings of Elzahar and Hussainey (2012), but on contrast to the studies of (

148
Amran et al. (2008); Elshandidy et al. (2015); and Linsley and Shrives (2006) who found
that the large companies disclose more information that covers the risks.
The effect of firm-characteristics on KPIs and on the changes of fixed assets
disclosure was similar. Both types of disclosure were affected positively by state-ownership,
industry type (manufacturing companies disseminate higher volume of information), size
(small companies disclose more information than the large ones), and profitability. Leverage
appeared to have a significant effect on the changes in fixed assets information, however,
no such impact was found in KPIs disclosure. Moreover, multiple-listed firms disclose more
information on KPIs; surprisingly, these firms do not provide high disclosure on the changes
of fixed assets. The last finding was unlike the expected, since the Egyptian cross-listed
companies follow IAS/IFRS (including the Fair Value standard IFRS 16), it was expected
that these companies would transfer their disclosures within the developed capital market
on the changes of fixed assets to their MRs when submitting to the EGX.
Five firm-characteristics affected the disclosure on FLP. Cross-listed companies
disseminate more FLP information; this is consistent with the studies of Clarkson et al.
(1999) and Al-Najjar and Abed (2014). Likewise, the industrial firms provide more
information in their MRs to cover FLP disclosure (t- value 2.751, P value > 1%), which is
consistent with Beretta and Bozzolan (2008) and Wang and Hussainey (2013), yet
contradicts the study of Aljifri and Hussainey (2007) who found an insignificant association
between the type of economic sector and FLP disclosure. Finally, the regression analysis
indicated that sate-ownership has a positive impact on FLP disclosure (P value > 10%).
Furthermore, the profitability was positively associated with FLP disclosure, however, this
finding is inconsistent with the studies of Aljifri and Hussainey (2007), Wang and Hussainey
(2013), and Al-Najjar and Abed (2014). The researcher believes that the companies with
high profits employ FLP disclosure to highlight the improvement of their performance in
the future, which can support the share prices in the market. The findings also showed that
the leverage was positively and significantly associated with FLP disclosure, which is
consistent with the studies of Aljifri and Hussainey (2007) and Wang and Hussainey (2013)
but contradicts the study of Al-Najjar and Abed (2014) who found no significant effect of
leverage on FLP. This finding could be attributed to the motivations presented to managers
in the companies with higher leverage in order to enhance the users’ trust in their ability of
investing all financial resources, which could reduce the cost of capital.
149
Three firm-characteristics affected the disclosure on CSR and environmental
information. Table 4.10 demonstrates that the industrial companies, as it was expected, tend
to disseminate more information on this section (t- value 8.107, P value ≤ 1%), which is
consistent with several prior studies (e.g., Chan et al. (2014); Cormier and Magnan (1999);
Hackston and Milne (1996); Patten (1991); Roberts (1992)). The same was also applicable
with the presence of state ownership (t- value -8.31, P value ≤1%), however, this finding is
inconsistent with Alotaibi and Hussainey (2016) who found a negatively association
between the governmental ownership and CSR disclosure. Furthermore, the results showed
that higher profitability associates with a greater CSR disclosure (t- value 2.122, P value ≤
5%), which is in line with the studies of Cormier and Magnan (1999); Gamerschlag et al.
(2011); Haniffa and Cooke (2005); Khan et al. (2013); and Roberts (1992) but is inconsistent
with the study Chan et al. (2014) who suggested that profitability does not affect CSR
disclosure.

150
Table 4. 10 OLS regression on the disclosure on different sections and subsections of the MR
OWNST State-ownership; CROSL: Cross-listing; INDTY: Industry Type; AGE: company’s age; SIZE: company’s size; REG: Regulation Type; ROE: Return on equity;
LEV: Leverage.
, , significant at 10%, 5%, and 1% respectively.
Variables Ownership
Structure
Board
Composition
Audit
Committee Risks
KPIs Fixed
Assets
FLP CSR & Environ-
menatal
Independent Variables:
OWNST
.029
(2.767)
.022
(1.909)
.010
(1.003)
-.022
(-.807) .228
(11.989)
.085
(4.493)
.056
(3.485)
.117
(8.311)
CROSL -.013
(-.691) .056
(2.798)
-.012
(-.651) .198
(4.093)
.108
(3.195)
-.070
(-2.094)
.053
(1.851)
.017
(.673)
INDTY -.012
(-1.336)
-.010
(-1.047) -.017
(-1.961)
-.005
(-.232) .101
(6.452)
.040
(2.571)
.036
(2.751)
.094
(8.107)
AGE .003
(.287)
.000
(-.003) .019
(1.726)
-.058
(-2.034)
.028
(1.371)
.012
(.590)
.024
(1.448)
.014
(.966)
SIZE .000
(.089)
.001
(.236)
.008
(2.797)
.011
(1.393) -.011
(-1.978)
-.014
(-2.661)
-.003
(-.551)
-.003
(-.762)
Control Variables:
REG
.524
(60.888)
.434
(46.708)
.549
(63.943)
-.034
(-1.513) .036
(2.291)
.101
(6.532)
-.023
(-1.728)
.266
(23.018)
ROE .000
(1.331)
.000
(.184)
.000
(-.416) -.004
(-5.148)
.001
(2.860)
.001
(2.122)
.001
(2.457)
.001
(2.122)
LEV .000
(1.480)
.000
(1.440)
.000
(-1.435) .000
(-3.080)
.000
(1.570) .000
(1.815)
.000
(2.280)
.000
(.258)
Constant .074
(1.811)
.081
(1.838)
-.066
(-1.618)
.089
(.847) .422
(5.706)
.335
(4.573)
.173
(2.789)
.233
(4.262)
R2 .866 .793 .877 .093 .291 .136 .061 .548
Adj. R2 .864 .790 .876 .080 .282 .124 .049 .542
Std. Error .10382 .11208 .10353 .26852 .18837 .18620 .15782 .13928
F- value 481.406 285.147 532.988 7.598 30.630 11.721 4.854 90.336
Number of Observations 605 605 605 605 605 605 605 605
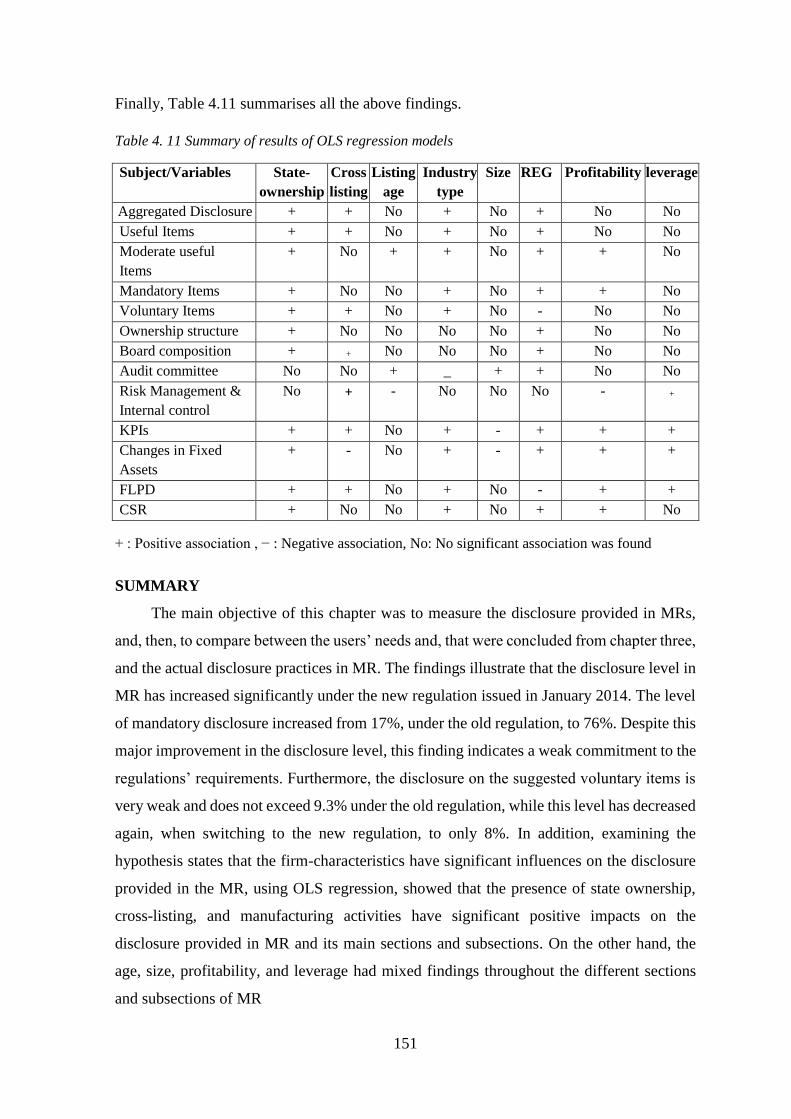
151
Finally, Table 4.11 summarises all the above findings.
Table 4. 11 Summary of results of OLS regression models
Subject/Variables State-
ownership
Cross
listing
Listing
age
Industry
type
Size REG Profitability leverage
Aggregated Disclosure + + No + No + No No
Useful Items + + No + No + No No
Moderate useful
Items
+ No + + No + + No
Mandatory Items + No No + No + + No
Voluntary Items + + No + No - No No
Ownership structure + No No No No + No No
Board composition + + No No No + No No
Audit committee No No + _ + + No No
Risk Management &
Internal control
No + - No No No - +
KPIs + + No + - + + +
Changes in Fixed
Assets
+ - No + - + + +
FLPD + + No + No - + +
CSR + No No + No + + No
+ : Positive association , − : Negative association, No: No significant association was found
SUMMARY
The main objective of this chapter was to measure the disclosure provided in MRs,
and, then, to compare between the users’ needs and, that were concluded from chapter three,
and the actual disclosure practices in MR. The findings illustrate that the disclosure level in
MR has increased significantly under the new regulation issued in January 2014. The level
of mandatory disclosure increased from 17%, under the old regulation, to 76%. Despite this
major improvement in the disclosure level, this finding indicates a weak commitment to the
regulations’ requirements. Furthermore, the disclosure on the suggested voluntary items is
very weak and does not exceed 9.3% under the old regulation, while this level has decreased
again, when switching to the new regulation, to only 8%. In addition, examining the
hypothesis states that the firm-characteristics have significant influences on the disclosure
provided in the MR, using OLS regression, showed that the presence of state ownership,
cross-listing, and manufacturing activities have significant positive impacts on the
disclosure provided in MR and its main sections and subsections. On the other hand, the
age, size, profitability, and leverage had mixed findings throughout the different sections
and subsections of MR
152
CONCLUSION
(Concluding Remarks, Contributions, Limitations, and Future Research)
The aim of this study was to investigate the users’ perceptions regarding the usefulness
of the management report in light of the requirements of the new listing rules that were
issued in January 2014 in Egypt.
The financial crisis in 2008 has shown the inadequacy of the accounting disclosure
within the financial reports in providing useful transparent information that reflects the
actual performance of companies. The management report is considered an essential vehicle
that complements the weakness of financial reports. While the management report aims
mainly to illustrate the company’s current performance and future forecasts, this study
focused on assessing the usefulness of management report in the eyes of the users. Unlike
the developed markets, emerging markets have different characteristics that are related to
the market efficiency and maturity. The authorities in the emerging markets seek to enhance
the level of efficiency by improving the disclosure usefulness to match the users’ needs.
One of these efforts took place in Egypt where the Financial Regulatory Authority (FRA)
issued new regulation that obligates the listed companies to increase the volume of
disclosure in their MRs.
Using a survey questionnaire, one-hundred and fourteen questionnaires were collected
from the financial analysts and the institutional investors as sophisticated users of the
accounting information. Results of the survey revealed that the new regulation has slightly
improved the requirements of the mandatory disclosure included in the MR, however, the
new requirements are still far from meeting the users’ needs and more additional
information are still needed to be disclosed in MRs. Furthermore, the results showed that
the users regard different information to be unequal in their usefulness. While some items
were seen as very useful in investments decision-making, other information was considered
to be moderate useful and have lower impact on the users’ decisions. Therefore, it could be
argued that the FRA did not interview the users to explore their needs in the disclosure of
MR. The usefulness of accounting disclosure would be difficult to achieve when the
regulation requires only the disclosure on many moderate or slightly useful information,
while most of the very useful information are not mandated. In fact, this conduct can
critically shape the market efficiency.

153
After that, the study analysed 782 MRs that cover five years; two years under the old
regulation and three years under the new regulation. This analysis sought to compare the
users’ needs with the disclosure level provided in MRs, and to examine the effect of firm-
characteristics on the extent of information disclosed in MR. The findings showed that the
general level of disclosure in MR has increased significantly after switching to the new
regulation. However, the results indicated that the companies do not fully commit to the
requirements of the mandatory disclosure, as listed companies do not disseminate much on
the very useful information in their MR, even if voluntarily. While the results clearly showed
that the level of mandatory disclosure has increased after applying the new regulation, the
counteractive effect appeared in the voluntary disclosure. These contrasted findings indicate
the initial role of regulatory bodies in matching the users’ needs by increasing the extent of
mandatory disclosure to include more items that are seen to be very useful to the users.
Some prior studies on Egypt pointed out that the incomplete commitment to the
mandatory disclosure requirements and the low levels of the voluntary can reflect the
cultural environment. The values of secrecy and conservatism are heavily rooted in Egypt,
which challenges the desire of the users in more transparency (Dahawy and Conover 2007;
Dahawy et al. 2002; Hassan et al. 2012). Furthermore, the insufficient enforcement power
and the feeble penalties on the non-compliance with the mandatory requirements are a
problematic issue (Abd-Elsalam and Weetman 2007; Hassan et al. 2009; Hassan et al. 2012).
FRA should have clear strategies for both enhancing the value of transparency and
respecting the voices of the users and it should also set strict penalties for the non-compliant
companies.
Finally, in an additional test, the results showed that some of firm-characteristics have
significant effects on the disclosure level in MR. Mainly, the presence of state ownership,
cross listing, and manufacturing activities have significant positive impacts on the
disclosure provided in MR. On the other hand, the other firm-characteristics showed uneven
findings.
This study provided two main contributions to the body of knowledge. First, prior
studies focused on the usefulness of the MR in the developed markets (especially in US),
while our study represented the first investigation on the perceived usefulness of the MR
disclosure in an emerging market. Second, prior studies focused on the usefulness of the
annual report’s section while this study provided greater understanding of the usefulness of
the different types of information included in the MR. This could add to the knowledge of

154
the voluntary disclosure theory from the users’ points of view. In particular, this study
addressed a gap in the literature related to exploring what the financial statement’s users
think of the content of the MR.
Furthermore, the current study provided two practical contributions. First, the findings
should be considered by the regulators to overcome the current weaknesses in the disclosure
in order to meet users’ information needs. As the results showed, the regulators efforts
improved the usefulness of MR, however, more work is still needed as the users desire more
strict regulation that guarantees a useful and a comprehensive disclosure in the MR. It took
almost eleven years between the first issuing of the Egyptian listing rules in 2002 and the
issue of a new regulation in the early of 2014 as a reform that enhances the transparency in
the capital market. However, the results of our study evaluated this reform as they
highlighted that the new regulation, after five years of applying it, is still lacking several
disclosures .
Second, our results can also be useful for the managers and the accountants and
encourage them to increase the degree of the voluntary disseminated information that are
perceived as useful by investors. The study documented that, out of twenty-two suggested
voluntary items, the users considered fourteen items as very useful and eight items as of
moderate usefulness. For the companies who are concerned with what their current and
prospective investors could desire, our findings can help their managers to report more
useful information as needed by the users.
This study has two main limitations. The study focusses on the usefulness of the MR
in one emerging country, thus, a cross-jurisdictional approach is advocated. For the
difficulties related to conducting a survey in-person, it was not possible to undertake the
study in more than one emerging market. Also, as it was above-mentioned, emerging
markets have special characteristics that make the findings of the studies took within their
context difficult to be generalised on the developed markets. What should be considered is
that this study can also be of benefit to other emerging markets that have similar cultural,
social, and economical features (i.e., other North African countries)
Secondly, the study investigated the usefulness of the MR disclosure for investments
decision-making. Other users-groups, such as lenders and governmental authorities (Taxes
authorities and the ministry of investment, for example), might have the power to acquire

155
the information they need, which is not obtainable to the investors who hold small number
of shares or bonds.
The current study has highlighted some gaps for the future research. First, it could be
interesting to investigate the usefulness of the MR in the lending decision-making, in order
to find out if there was any different perceptions amongst other types of users. Second, based
on the results of the regression analysis, future studies can investigate the relationships
between state ownership, cross listing, and the industry type on one hand, and the market
value of the companies on the other hand.
156
REFERENCES
Abdel-Fattah, T. M. H. 2008. Voluntary Disclosure Practices in Emerging Capital Markets:
The Case of Egypt, Unpublished PhD Thesis, Durham.
Abd-ElSalam, O. H. 1999. The Introduction and Application of International Accounting
Standards to Accounting Disclosure Regulations of a Capital Market in Developing
Country: The Case of Egypt, Unpublished PhD Thesis, Heriot-Watt University.
Abd-Elsalam, O. H., and P. Weetman. 2003. Introducing International Accounting
Standards to an emerging capital market: relative familiarity and language effect in
Egypt. Journal of International Accounting, Auditing & Taxation 12:63-84.
Abd-Elsalam, O. H., and P. Weetman. 2007. Measuring Accounting Disclosure in a period
of Complex Changes: the Case of Egypt. Advances in International Accounting 20:75-
104.
Abu-Nassar, M., and B. A. Rutherford. 1996. External users of financial reports in less
developed countries: The case of Jordan. The British Accounting Review 28 (1):73-87.
Acedo-Ramírez, M. A., and F. J. Ruiz-Cabestre. 2014. Determinants of Capital Structure:
United Kingdom Versus Continental European Countries. Journal of International
Financial Management & Accounting 25 (3): 237-270.
Agyei-Mensah, B. K. 2013. Adoption of International Financial Reporting Standards
(IFRS) in Ghana and the quality of financial statement disclosures. International
Journal of Accounting and Financial Reporting 3 (2):269-286.
Ahmed, A. H., and K. Hussainey. 2017. Is Egyptian Corporate Financial Reporting
Becoming More Conservative? Journal of Financial Reporting and Accounting 15(3),
333-346.
Ahmed, H. A., Y. A. Tahat, B. M. Burton, and T. M. Dunne. 2015. The value relevance of
corporate internet reporting: The case of Egypt. Advances in Accounting, incorporating
Advances in International Accounting 31(2), 188-196.
Ahmed, K., and J. K. Courtis. 1999. Associations between corporate Characteristics and
disclosure Levels in annual reports: A meta-analysis. The British Accounting Review
31(1) :35-61.
AICPA. 1973. Financial Statement Report of the Study Group on Objectives of Financial
Statements. New York: American Institute of Certified Public Accountant.

157
———. 1994. "Improving business reporting – a customer focus: meeting the information
needs of investors and creditors", Comprehensive report of the special committee on
financial reporting (the Jenkins report). American Institute of Certified Public
Accountants New York, NY.
Akhtaruddin, M. 2005. Corporate mandatory disclosure practices in Bangladesh. The
International Journal of Accounting 40 (4):399-422.
Akhtaruddin, M., M. A. Hossain, M. Hossain, and L. Yao. 2009. Corporate governance
and voluntary disclosure in corporate annual reports of Malaysian listed firms. Journal
of Applied Management Accounting Research 7 (1):1-20.
Al-Ajmi, J. 2009. Investors' use of corporate reports in Bahrain. Managerial Auditing
Journal 24 (3):266-289.
Al‐Akra, M., I. A. Eddie, and M. J. Ali. 2010. The association between privatisation and
voluntary disclosure: evidence from Jordan. Accounting and Business Research 40
(1):55-74.
Alanezi, F. S., and S. S. Albuloushi. 2011. Does the existence of voluntary audit
committees really affect IFRS-required disclosure? The Kuwaiti evidence.
International Journal of Disclosure and Governance 8 (2):148-173.
Alattar, J. M., and K. Al-Khater. 2008. An empirical investigation of users' views on
corporate annual reports in Qatar. International Journal of Commerce and
Management 17 (4):312-325.
Ali, M. J., K. Ahmed, and D. Henry. 2004. Disclosure compliance with national accounting
standards by listed companies in South Asia. Accounting and Business Research 34
(3):183-199.
Al-Janadi, Y., R. A. Rahman, and N. H. Omar. 2013. Corporate Governance Mechanisms
and Voluntary Disclosure in Saudi Arabia. Research Journal of Finance and
Accounting 4 (4):25-35.
Aljifri, K. 2008. Annual report disclosure in a developing country: The case of the UAE.
Advances in Accounting, incorporating Advances in International Accounting 24
(1):93-100.
Aljifri, K., A. Alzarouni, C. Ng, and M. I. Tahir. 2014. The Association Between Firm
Characteristics And Corporate Financial Disclosures: Evidence From UAE Companies.
The International Journal of Business and Finance Research 8 (2):101-123.

158
Aljifri, K., and K. Hussainey. 2007. The determinants of forward-looking information in
annual reports of UAE companies. Managerial Auditing Journal 22 (9):881-894.
Allini, A., S. Rakha, D. G. McMillan, and A. Caldarelli. 2017. Pecking order and market
timing theory in emerging markets: The case of Egyptian firms. Research in
International Business and Finance 44: 297-308.
Almahmoud, S. A. 2000. The usefulness of annual report information to participants in the
Saudi Stock Market, University of Cardiff, Unpublished PhD Thesis.
Al-Maliki, I., H. Hammami, and G. H. Mardini. 2015. Corporate financial reporting in
Qatar: a study of individual investors' assessment of annual reports. Middle East
Journal of Management 2 (1):79-96.
Al-Mubarak, F. 1997. The usefulness of corporate annual reports to investment analysts in
Saudi Arabia, PhD Thesis, University of Newcastle Upon Tyne.
Al-Najjar, B., and S. Abed. 2014. The association between disclosure of forward-looking
information and corporate governance mechanisms. Managerial Auditing Journal 29
(7):578-595.
Alotaibi, B. M. 2014. Corporate Governance and Voluntary Disclosure in Kuwait, PhD
Thesis, University of Bedfordshire.
Alotaibi, K. O., and K. Hussainey. 2016. Determinants of CSR disclosure quantity and
quality: Evidence from non-financial listed firms in Saudi Arabia. International
Journal of Disclosure and Governance 13 (4):364-393.
Alrazeen, A. M. 1999. The quality of annual financial reports of Saudi corporations: users
perceptions and companies practices, PhD Thesis, University of Cardiff.
Al-Razeen, A., and Y. Karbhari. 2004. Annual corporate information: importance and use
in Saudi Arabia. Managerial Auditing Journal 19 (1):117-133.
Alsaeed, K. 2006. The association between firm-specific characteristics and disclosure: the
case of Saudi Arabia. Managerial Auditing Journal 21 (5):476-496.
Al-Shammari, B., and W. Al-Sultan. 2010. Corporate governance and voluntary disclosure
in Kuwait. International Journal of Disclosure and Governance 7 (3):262-280.
Alzarouni, A., K. Aljifri, C. Ng, and M. I. Tahir. 2011. The Usefulness of Corporate
Financial Reports: Evidence from the United Arab Emirates. Accounting & Taxation 3
(1):17-37.

159
Amoako, G. K., and S. Asante. 2013. Compliance with international financial reporting
standard 7 (IFRS 7): a study of listed banks in Ghana. Research Journal of Finance
and Accounting 3 (4):66-73.
Amran, A., A. Manaf Rosli Bin, and B. Che Haat Mohd Hassan. 2008. Risk reporting: An
exploratory study on risk management disclosure in Malaysian annual reports.
Managerial Auditing Journal 24 (1):39-57.
Anderson, R. 1981. The usefulness of accounting and other information disclosed in
corporate annual reports to institutional investors in Australia. Accounting and Business
Research 11 (44):259-265.
Anderson, R., and M. Epstein. 1995. The Usefulness of Annual Reports: Australian
shareholders want more information in annual reports and clearer explanations of what
the numbers mean. Australian Accountant 65:25-25.
Antonczyk, R. C., and A. J. Salzmann. 2014. Overconfidence and optimism: The effect of
national culture on capital structure. Research in International Business and Finance
31:132–151.
ASB. 2006. Reporting Statement: Operating and Financial review (OFR). London: The
Accounting Standards Board.
Athanasakou, V., and K. Hussainey. 2014. The perceived credibility of forward-looking
performance disclosures. Accounting and Business Research 44 (3):227-259.
Backer, M. 1970. Financial reporting for security investment and credit decisions. New
York Certified Public Accountant (pre-1986) :885-892.
Baker, H. K., and J. A. Haslem. 1973. Information Needs of Individual Investors'. The
Journal of Accountancy (November):64-69.
Ballwieser, W. 2004. The Limitations of Financial Reporting. Edited by P. D. Leuz C.,
Hopwood A. Oxford: Oxford University Press.
Barako, D. G., P. Hancock, and H. Y. Izan. 2006. Factors Influencing Voluntary Corporate
Disclosure by Kenyan Companies. Corporate Governance: An International Review
14 (2):107-125.
Barnett, M. L., and R. M. Salomon. 2012. Does it pay to be Really Good? Addressing the
Shape of the Relationship between Social and Financial Performance. Strategic
Management Journal 33(11), 1304-1320.

160
Barron, O. E., C. O. Kile, and T. B. O'Keefe. 1999. MD&A quality as measured by the
SEC and analysts' earning forecasts. Contemporary Accounting Research 16 (1):75-
109.
Bartlett, S. A., and R. A. Chandler. 1997. The corporate report and the private shareholder:
Lee and Tweedie twenty years on. The British Accounting Review 29 (3):245-261.
Beattie, V., and M. J. Jones. 1992. The use and abuse of graphs in annual reports:
theoretical framework and empirical study. Accounting and Business Research 22
(88):291-303.
———. 2008. Corporate reporting using graphs: A review and synthesis. Journal of
Accounting Literature 27:71-110
Beattie, V., and K. Pratt. 2002. Voluntary annual report disclosures: what users want:
Institute of Chartered Accountants of Scotland, Edinburgh.
Beaver, W. H. 1966. Financial ratios as predictors of failure. Journal of Accounting
Research: 71-111.
———. 1968. Alternative accounting measures as predictors of failure. The Accounting
Review 43 (1):113-122.
Belkhir, M., A. Maghyereh, and B. Awartani. 2016. Institutions and Corporate Capital
Structure in the MENA Region. Emerging Markets Review. 26: 99-129.
Benjamin, J. J., and K. G. Stanga. 1977. Differences in disclosure needs of major users of
financial statements. Accounting and Business Research 7 (27):187-192.
Beretta, S., and S. Bozzolan. 2004. A framework for the analysis of firm risk
communication. The International Journal of Accounting 39 (3):265-288.
———. 2008. Quality versus quantity: the case of forward-looking disclosure. Journal of
Accounting, Auditing & Finance 23 (3):333-376.
Berglof, E., and A. Pajuste. 2005. what do Firms Disclose and why? Enforcing Corporate
Governance and Transparency in Central and Eastern Europe. Oxford Review of
Economic Policy 21 (2):178-197.
Bhattacherjee, A. 2012. Social Science Research: Principles, Methods, and Practices: The
Global Text Project. Textbooks Collection. 3

161
Bin-Abdullah, A., and K. N. I. K. Ismail. 2008. Disclosure of Voluntary Accounting Ratios
by Malaysian Listed Companies. Journal of Financial Reporting and Accounting 6
(1):1-20.
Biswas, P. K., and S. K. Bala. 2016. Usefulness of corporate annual reports to individual
investors in Bangladesh. International Journal of Disclosure and Governance 13
(2):97-116.
Boshnak, H. 2017. Mandatory and voluntary disclosures in GCC listed firms, PhD Thesis,
University of the West of England. Available from: http://eprints.uwe.ac.uk/30789.
Botosan, C. A. 1997. Disclosure level and the cost of equity capital. The Accounting Review
72 (3):323-349.
———. 2000. Evidence that greater disclosure lowers the cost of equity capital. Journal
of applied corporate finance 12 (4):60-69.
Boubakri, N., J.-C. Cosset, and O. Guedhami. 2005. Postprivatization corporate
governance: The role of ownership structure and investor protection. Journal of
Financial Economics 76 (2):369-399.
Bourque, L. B., and V. A. Clarck. 1992. Processing Data: The Survey Example. (No. 85),
Sage, London.
Bouwman, M. J., P. A. Frishkoff, and P. Frishkoff. 1987. How do financial analysts make
decisions? A process model of the investment screening decision. Accounting,
Organizations and Society 12 (1):1-29.
Bozzolan, S., M. Trombetta, and S. Beretta. 2009. Forward-looking disclosures, financial
verifiability and analysts' forecasts: A study of cross-listed European firms. European
Accounting Review 18 (3):435-473.
Breton, G., and R. J. Taffler. 2001. Accounting information and analyst stock
recommendation decisions: a content analysis approach. Accounting and Business
Research 31 (2):91-101.
Brooks, C. 2008. Introductory Econometrics for Finance: Second Edition. Cambridge
University Press, New York.
Bryan, S. H. 1997. Incremental information content of required disclosures contained in
management discussion and analysis. The Accounting Review 77 (2):285-301.

162
Camfferman, K., and T. E. Cooke. 2002. An analysis of disclosure in the annual reports of
UK and Dutch companies. Journal of International Accounting Research 1 (1):3-30.
CAO. 1966. Uniform Accounting System. Central Auditing Organisation, Cairo, Egypt.
Caplan, D., and S. K. Dutta. 2016. Managing the risk of misleading financial metrics in
annual reports: A first step towards providing assurance over management's discussion.
Journal of Accounting Literature 36:1-27.
Cascino, S., M. Clatworthy, B. G. Osma, J. Gassen, S. Imam, and T. Jeanjean. 2013. "The
use of information by capital providers: Academic literature review": The Research
Committee of The Institute of Chartered Accountants of Scotland (ICAS) and the
European Financial Reporting Advisory Group (EFRAG).
Cascino, S., M. Clatworthy, B. García Osma, J. Gassen, S. Imam, and T. Jeanjean. 2014.
Who uses financial reports and for what purpose? Evidence from capital providers.
Accounting in Europe 11 (2):185-209.
Casey, C. J. 1980. The usefulness of accounting ratios for subjects' predictions of corporate
failure: Replication and extensions. Journal of Accounting Research 18 (2): 603-613.
CFA. 2013. Financial Reporting Disclosures: Investor Perspectives on Transparency,
Trust, and Volume. Virginia: Chartered Financial Analysts Institute.
Chan, M. C., J. Watson, and D. Woodliff. 2014. Corporate Governance Quality and CSR
Disclosures. Journal of Business Ethics 125 (1):59-73.
Chandra, G. 1974. A study of the consensus on disclosure among public accountants and
security analysts. The Accounting Review 49 (4):733-742.
Chandra, G., and M. N. Greenball. 1977. Management reluctance to disclose: An empirical
study. Abacus 13 (2):141-154.
Chatterjee, B. 2007. Highlights in annual reports: its perceived usefulness. International
Journal of Commerce and Management 17 (1/2):166-177.
Chatterjee, B., S. Mirshekary, O. A. Farooque, and M. Safari. 2010. Users’ Information
Requirements and Narrative Reporting: The Case of Iranian Companies. Australasian
Accounting Business and Finance Journal 4 (2):79-96.
Chen, G., M. Firth, D. N. Gao, and O. M. Rui. 2006. Ownership structure, corporate
governance, and fraud: Evidence from China. Journal of Corporate Finance 12
(3):424-448.

163
Chenhall, R., and R. Juchau. 1977. Investor information needs—an Australian study.
Accounting and Business Research 7 (26):111-119.
Clarkson, P. M., J. L. Kao, and G. D. Richardson. 1994. The voluntary inclusion of
forecasts in the MD&A section of annual reports. Contemporary Accounting Research
11 (1):423-450.
———. 1999. Evidence that management discussion and analysis (MD&A) is a part of a
firm's overall disclosure package. Contemporary Accounting Research 16 (1):111-134.
Cohen, J., L. Holder-Webb, L. Nath, and D. Wood. 2011. Retail investors’ perceptions of
the decision-usefulness of economic performance, governance, and corporate social
responsibility disclosures. Behavioral Research in Accounting 23 (1):109-129.
Cole, C. J., and C. L. Jones. 2004. The usefulness of MD&A disclosures in the retail
industry. Journal of Accounting, Auditing & Finance 19 (4):361-388.
———. 2005. Management discussion and analysis: A review and implications for future
research. Journal of Accounting Literature 24:135-174
Collett, P., and S. Hrasky. 2005. Voluntary disclosure of corporate governance practices
by listed Australian companies. Corporate Governance: An International Review 13
(2):188-196.
Collison, D., J. Grinyer, and A. Russell. 1993. Management's Economic Decisions and
Financial Rgporting: The Research Board, Institute of Chartered Accountants in
England and Wales (ICAEW).
Companies Act N.159. 1981. The Ministry of Economy, Cairo, Egypt.
Cooke, T. E. 1989a. Disclosure in the Corporate Annual Reports of Swedish Companies.
Accounting and Business Research 19:113-124.
———. 1989b. Voluntary corporate disclosure by Swedish companies. Journal of
International Financial Management and Accounting 1 (2):171-195.
Cooke, T. E. 1992. The impact of size, stock market listing and industry type on disclosure
in the annual reports of Japanese listed corporations. Accounting and Business
Research 22 (87):229-237.
Cooper, D., and P. Schindler. 2003. Business Research Methods. USA: McGraw-
Hill/Irwin.

164
Cormier, D., and M. Magnan. 1999. Corporate environmental disclosure strategies:
determinants, costs and benefits. Journal of Accounting, Auditing & Finance 14
(4):429-451.
Courtis, J. K. 1982. Private shareholder response to corporate annual reports. Accounting
& Finance 22 (2):53-72.
Craig, R., and J. Diga. 1998. Corporate accounting disclosure in ASEAN. Journal of
International Financial Management and Accounting 9 (3):246-274.
Dahawy, K. 2009. Company characteristics and disclosure level: The case of Egypt.
International Research Journal of Finance and Economics 34:194-208.
Dahawy, K., and K. Samaha. 2010. An investigation of the views and perceptions of
external users of corporate annual reports in emerging economies: the case of Egypt.
International Journal of Accounting and Finance 2 (3/4):333-367.
Dahawy, K., and T. Conover. 2007. Accounting Disclosure in Companies Listed on the
Egyptian Stock Exchange. Middle Eastern Finance and Economics 1 (1):5-20.
Dahawy, K., B. D. Merino, and T. L. Conover. 2002. The conflict between IAS disclosure
requirements and the secretive culture in Egypt. Advances in International Accounting
15 (48):203-228.
Dahya, J., Y. Karbhari, J. Z. Xiao, and M. Yang. 2003. The usefulness of the supervisory
board report in China. Corporate Governance: An International Review 11 (4):308-
321.
Dancey, C. P., and J. Reidy. 2007. Statistics without Maths for Psychology: Fourth edition.
Davis, J. H., F. D. Schoorman, and L. Donaldson. 1997. Toward a Stewardship Theory of
Management. The Academy of Management Review 22 (1):20-47.
Dawd, I., B. Burton, T. Dunne, and H. Almujamed. 2018. Corporate reporting and
disclosures in the emerging capital market of Kuwait: the perceptions of users and
preparers. International Journal of Disclosure and Governance 15:61-72.
Day, J. F. 1986. The use of annual reports by UK investment analysts. Accounting and
Business Research 16 (64):295-307.
De Vaus, D. A. 2002. Surveys in Social Research: Fifth Edition. University College
London, London.

165
De Zoysa, A., and K. Rudkin. 2010. An investigation of perceptions of company annual
report users in Sri Lanka. International Journal of Emerging Markets 5 (2):183-202.
Deegan, C., and B. Gordon. 1996. A Study of the Environmental Disclosure Practices of
Australian Corporations. Accounting and Business Research 26 (3):187-199.
Dhaliwal, D. S. 1980. Improving the quality of corporate financial disclosure. Accounting
and Business Research 10 (40):385-391.
Dobler, M., K. Lajili, and D. Zéghal. 2011. Attributes of corporate risk disclosure: An
international investigation in the manufacturing sector. Journal of International
Accounting Research 10 (2):1-21.
Doidge, C., G. A. Karolyi, and M. R. Stulz. 2009. Has New York become less competitive
than London in global markets? Evaluating foreign listing choices over time. Journal
of Financial Economics 91:253-277.
Domowitz, I., J. Glen, and A. Madhavan. 1998. International Cross-Listing and Order Flow
Migration: Evidence from an Emerging Market. The Journal of Finance 53 (6):2001-
2027.
Donnelly, R., and M. Mulcahy. 2008. Board structure, ownership, and voluntary disclosure
in Ireland. Corporate Governance: An International Review 16 (5):416-429.
Durocher, S., and A. Fortin. 2011. Practitioners' participation in the accounting standard-
setting process. Accounting and Business Research 41 (1):29-50.
Durocher, S., A. Fortin, and L. Côté. 2007. Users’ participation in the accounting standard-
setting process: A theory-building study. Accounting, Organizations and Society 32
(1):29-59.
Dye, R. A. 2001. An evaluation of ‘‘essays on disclosure’’ and the disclosure literature in
accounting. Journal of Accounting and Economics 32:181-235.
Easterby-Smith, M., R. Thorpe, P. Jackson, and A. Lowe. 2008. Management Research:
Third Edition. Sage, London.
Ebaid, I. E. 2009. The impact of capital‐structure choice on firm performance: empirical
evidence from Egypt. The Journal of Risk Finance 10 (5):477-487.
Ebaid, I. E. 2013. Corporate governance and investors’ perceptions of earnings quality:
Egyptian perspective. Corporate Governance: The International Journal of Business
in Society 13 (3):261-273.

166
Edwards, J. 1989. A History of Financial Accounting (RLE Accounting): Routledge.
EGX. 2015. The Annual Report. The Egyptian Capital Exchange.
———. 2016. The Annual Report. The Egyptian Capital Exchange.
Eldomiaty, T. I., and M. A. Ismail. 2009. Modeling capital structure decisions in a
transition market: empirical analysis of firms in Egypt. Review of Quantitative Finance
and Accounting 32 (3):211-233.
Elghuweel, M. I. 2015. Empirical essays on corporate governance and corporate decisions
in emerging economies: the case of Oman, PhD thesis, University of Glasgow.
Elliott, B., and J. Elliott. 2011. Financial Accounting and Reporting: Fourteenth Edition.
Pearson Education Limited.
Elmagrhi, M. H. A. 2016. Corporate Governance, Voluntary Compliance, Corporate
Performance and Executive Pay: Evidence from the UK, PhD Thesis, University of
Huddersfield Repository. Available at http://eprints.hud.ac.uk/30301/.
Elshandidy, T., I. Fraser, and K. Hussainey. 2015. What drives mandatory and voluntary
risk reporting variations across Germany, UK and US? The British Accounting Review
47 (4):376-394.
Elzahar, H., and K. Hussainey. 2012. Determinants of narrative risk disclosures in UK
interim reports. The Journal of Risk Finance 13 (2):133-147.
Elzahar, H., K. Hussainey, F. Mazzi, and I. Tsalavoutas. 2015. Economic consequences of
key performance indicators' disclosure quality. International Review of Financial
Analysis 39:96-112.
Eng, L. L., and Y. T. Mak. 2003. Corporate governance and voluntary disclosure. Journal
of Accounting and Public Policy 23:325–345.
Ettredge, M., K. Johnstone, M. Stone, and Q. Wang. 2011. The effects of firm size,
corporate governance quality, and bad news on disclosure compliance. Review of
Accounting Studies 16 (4):866–889.
Ewert, R., and A. Wagenhofer. 2012. Using Academic Research for the Post‐
Implementation Review of Accounting Standards: A Note. Abacus 48 (2):278-291.
FASB. 1978. Statement of Financial Accounting Concepts No. 1: Objectives of Financial
Reporting by Business Enterprises: Financial Accounting Standards Board.

167
———. 2006. Objective of Financial Reporting and Qualitative Characteristics of
Decision-Useful Financial Reporting Information. In Financial Accounting Series.
———. 2010. Statement of Financial Accounting Concepts No. 8: Conceptual Framework
for Financial Reporting: Financial Accounting Standards Board.
Fawzy, S. 2003. Assessment of corporate governance in Egypt: The Egyptian Centre for
Economic Studies, Working Paper.
FEE. 2015. The Future of Corporate Reporting: Creating the Dynamics for Change. In
Cogito Series. Brussels: Federation of European Accountants.
Field, A. 2009. Discovering Statistics Using SPSS: Fourth Edition. SAGE Publications
Ltd.
Firth, M. 1978. A study of the consensus of the perceived importance of disclosure of
individual items in corporate annual reports. The International Journal of Accounting
Education and Research 14 (1):57-70.
Francis, J., and K. Schipper. 1999. Have Financial Statements Lost Their Relevance?
Journal of Accounting Research 37 (2):319-352.
Fraser, I., J. Pierpoint, B. Collins, and W. Henry. 2010. Meeting the Needs? User Views
on External Assurance and Management Commentary: The Institute of Chartered
Accountants of Scotland.
Frazer, L., and M. Lawley. 2001. Questionnaire design and administration: Wiley.
FRC. 2009. Louder than words: Principles and actions for making corporate reports less
complex and more relevant: Financial Reporting Council, London.
———. 2011. Cutting Clutter. Combating clutter in annual reports: Financial Reporting
Council, London.
———. 2012. The UK Stewardship Code: Financial Reporting Council, London.
———. 2014. Guidance on the Strategic Report. London: Financial Reporting Council,
London.
Gamerschlag, R., K. Möller, and F. Verbeeten. 2011. Determinants of voluntary CSR
disclosure: empirical evidence from Germany. Review of Managerial Science 5 (2-
3):233-262.

168
Ghazali, N. A. 2010. Ownership structure, corporate governance and corporate
performance in Malaysia. International Journal of Commerce and Management 20
(2):109-119.
Ghazali, N. A. M., and P. Weetman. 2006. Perpetuating traditional influences: voluntary
disclosure in Malaysia following the economic crisis. Journal of International
Accounting, Auditing and Taxation 15:226-248.
Gillham, B. 2008. Developing a questionnaire: A&C Black.
Girdharry, K., E. Simonova, and R. Lefebvre. 2011. MD&A – Counterpart to or distraction
from financial reporting: Certified General Accountants Association of Canada.
Glaum, M., and D. L. Street. 2003. Compliance with the Disclosure Requirements of
Germany’s New Market: IAS Versus US GAAP. Journal of International Financial
Management and Accounting 14 (1):64-100.
Graham, C. M., N. V. Cannice, and T. L. Sayre. 2002. Analyzing Financial Analysts: What
they look for in financial reports and how they determine earnings quality. Journal of
Management Research 2 (2):63-72.
Graham, J., C. Harvey, and S. Rajgopal. 2005. The economic implications of corporate
financial reporting. Journal of Accounting and Economics 40 (1):3-73.
Gray, R., D. Owen, and K. Maunders. 1991. Accountability, Corporate Social Reporting
and External Social Audits. Advances in Public Interest Accounting 4:1-21.
Gray, R., R. Kouhy, and S. Lavers. 1995. Corporate social and environmental reporting: a
review of the literature and a longitudinal study of UK disclosure. Accounting, Auditing
& Accountability Journal 8 (2):47-77.
Gray, S. J. 1988. Towards a Theory of Cultural Influence on the Development of
Accounting Systems Internationally. Abacus 24 (1):1-15.
Gray, S. J., and H. M. Vint. 1995. The Impact of Culture on Accounting Disclosures: Some
International Evidence. Asia-Pacific Journal of Accounting 2 (1):33-43.
Hackston, D., and M. J. Milne. 1996. Some determinants of social and environmental
disclosures in New Zealand companies. Accounting, Auditing & Accountability Journal
9 (1):77-108.
Haniffa, R. M., and T. E. Cooke. 2002. Culture, Corporate Governance and Disclosure in
Malaysian Corporations. Abacus 38 (3):317-349.
169
Haniffa, R. M., and T. E. Cooke. 2005. The impact of culture and governance on corporate
social reporting. Journal of Accounting and Public Policy 24 (5):391-430.
Harding, N., and J. McKinnon. 1997. User Involvement In The Standard-Setting Process:
A Research Note On The Congruence Of Accountant And User Perceptions Of
Decision Usefulness. Accounting, Organizations and Society 22 (1):55-67.
Hassan, M. K. 2009. UAE corporations-specific characteristics and level of risk disclosure.
Managerial Auditing Journal 24 (7):668-687.
Hassan, O. A. G., G. Giorgioni, and P. Romilly. 2006. The extent of financial disclosure
and its determinants in an emerging capital market: the case of Egypt. International
Journal of Accounting, Auditing and Performance Evaluation 3 (1):41-67.
Hassan, O. A., G. Giorgioni, P. Romilly, and D. M. Power. 2012. The information gap in
corporate annual reports: evidence from Egypt. African Journal of Accounting,
Auditing and Finance 1 (4):338-358.
Hassan, O. A., P. Romilly, G. Giorgioni, and D. Power. 2009. The value relevance of
disclosure: Evidence from the emerging capital market of Egypt. The International
Journal of Accounting 44 (1):79-102.
Hassan, O., and D. Power. 2009. The usefulness of accounting information; evidence from
the Egyptian market. Qualitative Research in Financial Markets 1 (3):125-141.
Hassanein, A., and K. Hussainey. 2015. Is forward-looking financial disclosure really
informative? Evidence from UK narrative statements. International Review of
Financial Analysis 41:52-61.
Healy, P. M., and K. G. Palepu. 2001. Information asymmetry, corporate disclosure, and
the capital markets: A review of the empirical disclosure literature. Journal of
Accounting and Economics 31 (1):405-440.
Healy, P., and K. Palepu. 1995. The challenges of investor communications: the case of
CUC International, Inc. Journal of financial economics 38 (2): 111– 140.
Hines, R. D. 1982. The usefulness of annual reports: the anomaly between the efficient
markets hypothesis and shareholder surveys. Accounting and Business Research 12
(48):296-309.
Hjelström, A., T. Hjelström, and E. Sjögren. 2014. Decision usefulness explored : An
investigation of capital market actors’ use of financial reports: Swedish Enterprise.

170
Ho, S. S., and K. S. Wong. 2001. A study of corporate disclosure practice and effectiveness
in Hong Kong. Journal of International Financial Management & Accounting 12
(1):75-102.
Hodgdon, C., R. H. Tondkar, A. Adhikari, and D. W. Harless. 2009. Compliance with
International Financial Reporting Standards and auditor choice: New evidence on the
importance of the statutory audit. The International Journal of Accounting 44 (1):33-
55.
Hofstede, G. 1984. Cultural Dimensions in Management and Planning. Asia Pacific
Journal of Management 1 (2):81-99.
Hooks, J., and C. J. van Staden. 2011. Evaluating environmental disclosures: The
relationship between quality and extent measures. The British Accounting Review 43
(3):200-213.
Hooks, J., D. Coy, and H. Davey. 2002. The information gap in annual reports. Accounting,
Auditing & Accountability Journal 15 (4):501-522.
Hossain, M., and H. Hammami. 2009. Voluntary disclosure in the annual reports of an
emerging country: the case of Qatar. Advances in Accounting incorporating Advances
in International Accounting, 25 (2):255-265.
Hüfner, B. 2007. The SEC's MD&A: Does it Meet the Informational Demands of
Investors? Schmalenbach Business Review (SBR) 59 (1): 58-84.
Hussainey, K. 2004. A Study Of The Ability Of (Partially) Automated Disclosure Scores
To Explain The Information Content Of Annual Report Narratives For Future Earnings,
PhD Thesis, University of Manchester.
Hussainey, K., and B. Al-Najjar. 2012. Understanding the determinants of RiskMetrics/ISS
ratings of the quality of UK companies' corporate governance practice. Canadian
Journal of Administrative Sciences/Revue Canadienne des Sciences de l'Administration
29 (4):366-377.
Hussainey, K., T. Schleicher, and M. Walker. 2003. Undertaking large-scale disclosure
studies when AIMR-FAF ratings are not available: the case of prices leading earnings.
Accounting and Business Research 33 (4):275-294.
IASB. 2008. An improved Conceptual Framework for Financial Reporting: The
International Accounting Standards Board.

171
———. 2010a. The Conceptual Framework for Financial Reporting: The International
Accounting Standards Board
Iatridis, G. 2008. Accounting disclosure and firms' financial attributes: Evidence from the
UK stock market. International Review of Financial Analysis 17 (2):219-241.
Ibrahim, M. E., and J. B. Kim. 1994. User-groups consensus on financial disclosure
preferences: the case of Egypt. Advances in International Accounting 7:61-71.
IFRS. 2010. IFRS Practice Statement: Management Commentary: A framework for
presentation: IFRS Foundation.
———. 2018. Conceptual Framework for Financial Reporting. In IFRS Conceptual
Framework.
Ijiri, Y. 1983. On the accountability-based conceptual framework of Accounting. Journal
of Accounting and Public Policy, 2(2), 75-81.
Inchausti, B. G. 1997. The influence of company characteristics and accounting regulation
on information disclosed by Spanish firms. European Accounting Review 6 (1):45-68.
Jaggi, B., A. Allini, R. Macchioni, and A. Zampella. 2018. Do Investors find carbon
information useful? Evidence from Italian Firms. Review of Quantitative Finance and
Accounting 50 (4):1031-1056.
Jaggi, B., and P. Y. Low. 2000. Impact of culture, market forces, and legal system on
financial disclosures. The International Journal of Accounting 35 (4):495-519.
Jensen, M. C., and W. H. Meckling. 1976. Theory of the Firm: Managerial Behavior,
Agency Costs and Ownership Structure. Journal of Financial Economics 3 (4):305-
360.
Johansen, T. R., and T. Plenborg. 2013. Prioritising disclosures in the annual report.
Accounting and Business Research 43 (6):605-635.
Kamel, H., and E. Awadallah. 2017. The extent of voluntary corporate disclosure in the
Egyptian Stock Exchange: Its determinants and consequences. Journal of Accounting
in Emerging Economies 7 (2):266-291.
Khan, A., M. B. Muttakin, and J. Siddiqui. 2013. Corporate Governance and Corporate
Social Responsibility Disclosures: Evidence from an Emerging Economy. Journal of
Business Ethics 114 (2):207-223.

172
Kieso, D. E., and J. J. Weygandt. 1995. Intermediate Accounting. Vol. 8. New York, NY.:
Wiley.
Kim, E. H., and T. P. Lyon. 2011. Strategic environmental disclosure: Evidence from the
DOE’s voluntary greenhouse gas registry. Journal of Environmental Economics and
Management 61:311-326.
King, R. M., and D. Segal. 2009. The Long-Term Effects of Cross-Listing, Investor
Recognition, and Ownership Structure on Valuation. The Review of Financial Studies
22 (6):2393-2421.
Kitindi, E. G., B. S. Magembe, and A. Sethibe. 2007. Lending decision making and
financial information: The usefulness of corporate annual reports to lenders in
Botswana. The International Journal of Applied Economics and Finance 1 (2):55-66.
Kravet, T., and V. Muslu. 2013. Textual risk disclosures and investors’ risk perceptions.
Review of Accounting Studies 18 (4):1088-1122.
Kribat, M. M. J. 2009. Financial disclosure practices in developing countries: evidence
from the Libyan banking sector, PhD Thesis, University of Dundee.
La Porta, R., F. Lopez-De-Silanes, and A. Shleifer. 2006. What Works in Securities Laws?
The Journal of Finance 61 (1): 1-32.
Lan, Y., L. Wang, and X. Zhang. 2013. Determinants and features of voluntary disclosure
in the Chinese stock market. China Journal of Accounting Research 6 (4):265-285.
Lang, M., and R. Lundholm. 1993. Cross-sectional determinants of analyst ratings of
corporate disclosures. Journal of Accounting Research 31(2): 246-271.
Lee, T. A., and D. P. Tweedie. 1975a. Accounting Information: An Investigation of Private
Shareholder Usage. Accounting and Business Research 5 (20):280-291.
———. 1975b. Accounting information: an investigation of private shareholder
understanding. Accounting and Business Research 6 (21):3-17.
Lee, T. A., and D. P. Tweedie. 1977. The Private Shareholder and the Corporate Report.
London: ICAEW.
Lemmon, M. L., and K. V. Lins. 2003. Ownership structure, corporate governance, and
firm value: Evidence from the East Asian financial crisis. The Journal of Finance 58
(4):1445-1468.

173
Lennard, A. 2007. Stewardship and the Objectives of Financial Statements: A Comment
on IASB's Preliminary Views on an Improved Conceptual Framework for Financial
Reporting: The Objective of Financial Reporting and Qualitative Characteristics of
Decision-Useful Financial Reporting Information. Accounting in Europe 4 (1):51-66.
Lerner, J. S., and P. E. Tetlock. 1999. Accounting for the Effects of Accountability.
Psychological Bulletin 125 (2):225-275.
Li, J., and J. R. Harrison. 2008. Corporate Governance and National Culture: a Multi-
Country Study. Corporate Governance: The international journal of business in society
8 (5):607-621.
Li, Y., G. D. Richardson, and D. B. Thornton. 1997. Corporate Disclosure of
Environmental Liability Information: Theory and Evidence. Contemporary Accounting
Research 14 (3):435-474.
Libby, R. 1975. Accounting ratios and the prediction of failure: Some behavioral evidence.
Journal of Accounting Research 13 (1):150-161.
Linsley, F. M., and P. J. Shrives. 2006. Risk reporting: A study of risk disclosures in the
annual reports of UK companies. The British Accounting Review 38 (4):387-404.
Lopatta, K., F. Buchholz, and T. Kaspereit. 2015. Asymmetric Information and Corporate
Social Responsibility. Business & Society 55(3): 458-488.
Maaloul, A., R. Chakroun, and S. Yahyaoui. 2018. The effect of political connections on
companies’ performance and value: Evidence from Tunisian companies after the
revolution. Journal of Accounting in Emerging Economies 8 (2):185-204.
Makhija, A. K., and J. M. Patton. 2004. The impact of firm ownership structure on
voluntary disclosure: Empirical evidence from Czech annual reports. The Journal of
Business 77 (3):457-491.
Mallin, C., and K. Ow-Yong. 2009. Corporate Governance in Alternative Investment
Market (AIM) Companies: Determinants of Corporate Governance Disclosure. In the
Third Singapore International Conference on Finance: Available at:
http://ssrn.com/abstract=1326627.
Malone, D., C. Fries, and T. Jone. 1993. An Empirical Investigation of the Extent of
Corporate Financial Disclosure in the Oil and Gas Industry. Journal of Accounting,
Auditing & Finance 8 (3):249-273.
174
Matsumura, E. M., R. Prakash, and S. C. Vera-Munoz. 2014. Firm-Value Effects of Carbon
Emissions and Carbon Disclosures. The Accounting Review 89 (2):695-724.
Mautz, R. K., and H. A. Sharaf. 1961. The Philosophy of Auditing: American Accounting
Association.
McCaslin, T. E., and K. G. Stanga. 1986. Similarities in measurement needs of equity
investors and creditors. Accounting and Business Research 16 (62):151-156.
McNally, G. M., L. H. Eng, and C. R. Hasseldine. 1982. Corporate financial reporting in
New Zealand: An analysis of user preferences, corporate characteristics and disclosure
practices for discretionary information. Accounting and Business Research 13 (49):11-
20.
Messner, M. 2009. The limits of accountability. Accounting, Organizations and Society 34
(8):918-938.
Miihkinen, A. 2013. The usefulness of firm risk disclosures under different firm riskiness,
investor-interest, and market conditions: New evidence from Finland. Advances in
Accounting 29 (2):312-331.
Mirshekary, S., and S. M. Saudagaran. 2005. Perceptions and characteristics of financial
statement users in developing countries: Evidence from Iran. Journal of International
Accounting, Auditing and Taxation 14 (1):33-54.
Morck, R., A. Shleifer, and R. Vishny. 1988. Management ownership and market
valuation. Journal of Financial Economics 20:293-315.
Muslu, V., S. Radhakrishnan, K. Subramanyam, and D. Lim. 2014. Forward-looking
MD&A disclosures and the information environment. Management Science 61 (5):931-
948.
Naser, K., and R. Nuseibeh. 2003. Quality of financial reporting: evidence from the listed
Saudi nonfinancial companies. The International Journal of Accounting 38 (1):41-69.
Naser, K., K. Al-Katib, and Y. Karbhari. 2002. Empirical evidence on the depth of
corporate information disclosure in developing countries: The case of Jordan.
International Journal of Commerce and Management 12 (3/4):122-155.
Naser, K., R. Nuseibeh, and A. Al-Hussaini. 2003. Users’ perceptions of various aspects
of Kuwaiti corporate reporting. Managerial Auditing Journal 18 (6/7):599-617.

175
Norman, G. 2010. Likert scales, levels of measurement and the ‘‘laws’’ of statistics.
Advanced in Health Science Education 15 (5):625-632.
Ntim, C. G., K. K. Opong, J. Danbolt, and D. A. Thomas. 2012. Voluntary corporate
governance disclosures by post-Apartheid South African corporations. Journal of
Applied Accounting Research 13 (2):122-144.
Omar, B. F. A. 2007. Exploring The Aggregate, Mandatory And Voluntary Financial
Disclosure Behaviour Under A New Regulatory Environment: The Case Of Jordan,
PhD Thesis, University of Hull.
Orens, R., and N. Lybaert. 2007. Does the financial analysts' usage of non-financial
information influence the analysts' forecast accuracy? Some evidence from the Belgian
sell-side financial analyst. The International Journal of Accounting 42 (3):237-271.
Owusu-Ansah, S. 1998. The Impact of Corporate Attributes on the Extent of Mandatory
Disclosure and Reporting by Listed Companies in Zimbabwe. The International
Journal of Accounting 33 (5):605-631.
Owusu-Ansah, S., and J. Yeoh. 2005. The effect of legislation on corporate disclosure
practices. Abacus 41 (1):92-109.
Patel, S. A., and G. Dallas. 2002. Transparency and disclosure: overview of methodology
and study results-United States. Standard and Poor’s.
Patten, D. M. 1991. Exposure, legitimacy, and social disclosure. Journal of Accounting and
Public Policy 10 (4):297-308.
Perera, M. 1989. Accounting in developing countries: A case for localised uniformity. The
British Accounting Review 21 (2):141-157.
Popova, T., G. Georgakopoulos, I. Sotiropoulos, and K. Z. Vasileiou. 2013. Mandatory
disclosure and its impact on the company value. International Business Research 6
(5):1-16.
Prencipe, A. 2004. Proprietary costs and determinants of voluntary segment disclosure:
evidence from Italian listed companies. European Accounting Review 13 (2):319-340.
Raffournier, B. 1995. The determinants of voluntary financial disclosure by Swiss listed
companies. European Accounting Review 4 (2):261-280.
Rahman, A. A. 2001. The use and perceived importance of annual reports by accountants
in the service industry in Malaysia. Asian Review of Accounting 9 (2):117-128.

176
Robb, S. W. G., L. E. Single, and L. T. Zarzeski. 2001. Nonfinancial disclosures across
Anglo-American countries. Journal of International Accounting, Auditing and
Taxation 10 (1):71-83.
Roberts, J. 2009. No one is perfect: The limits of transparency and an ethic for ‘intelligent’
accountability. Accounting, Organizations and Society 34 (8):957–970.
Roberts, R. W. 1992. Determinants of corporate social responsibility disclosure: An
application of stakeholder theory. Accounting, Organizations and Society 17 (6):595-
612.
Robson, C., and M. Kieran. 2016. Real World Research: Fourth Edition. John Wiley &
Sons.
Rogers, R. K., and J. Grant. 1997. Content Analysis of Information Cited in Reports of
Sell-Side Financial Analysts. Journal of Financial Statement Analysis (3):17-31.
Ronen, J., and V. Yaari. 1993. The Disclosure Policy of the Firm in an Efficient Market.
Review of Quantitative Finance and Accounting 3:311-324.
Rowley, J. 2014. Designing and using research questionnaires. Management Research
Review 37 (3):308-330.
Samaha, K., and K. Dahawy. 2010. Factors influencing corporate disclosure transparency
in the active share trading firms: An explanatory study. Research in Accounting in
Emerging Economies 10:87-118.
Samaha, K., K. Dahawy, K. Hussainey, and P. Stapleton. 2012. The extent of corporate
governance disclosure and its determinants in a developing market: The case of Egypt.
Advances in Accounting 28 (1):168-178.
Saunders, M., P. Lewis, and A. Thornhill. 2009. Research Methods for Business Students:
Fifth Edition. Prentice Hall.
Scaltrito, D. 2016. Voluntary disclosure in Italy: Firm-specific determinants an empirical
analysis of Italian listed companies. EuroMed Journal of Business 11 (2):272-303.
Schalow, C. M. 1995. Participation Choice: The exposure draft for postretirement.
Accounting Horizons 9 (1):27-41.
Schroeder, N., and C. Gibson. 1990. Readability of management's discussion and analysis.
Accounting Horizons 4 (4):78-87.
Scott, W. R. 1997. Financial Accounting Theory: Prentice hall Upper Saddle River, NJ.

177
SEC. 1998. A Plain English Handbook: How to create clear SEC disclosure documents.
Washington DC: U.S. Securities and Exchange Commission.
———. 2003. Commission Guidance Regarding Management's Discussion and Analysis
of Financial Condition and Results of Operations, Securities and Exchange
Commission.
———. 2017. Financial Reporting Manual. Securities and Exchange Commission.
Singhvi, S. S., and H. B. Desa. 1971. An Empirical Analysis of the Quality of Corporate
Financial Disclosure The Accounting Review 46 (1):129-138.
Smith, M. 2003. Research Methods in Accounting. London: Sage.
Solas, C., and M. E. Ibrahim. 1992. Usefulness of disclosure items in financial reports: a
comparison between Jordan and Kuwait. The Asian Review of Accounting 1 (1):1-11.
Solomon, J. F., A. Solomon, S. D. Norton, and N. L. Joseph. 2000. A conceptual framework
for corporate risk disclosure emerging from the agenda for corporate governance
reform. The British Accounting Review 32 (4):447-478.
Son, D. D., N. Marriott, and P. Marriott. 2006. Users' perceptions and uses of financial
reports of small and medium companies (SMCs) in transitional economies: Qualitative
evidence from Vietnam. Qualitative Research in Accounting & Management 3 (3):218-
235.
SOX. 2002. Sarbanes-Oxley act of 2002 In The Public Company Accounting Reform and
Investor Protection Act. Washington DC: US Congress
Stainbank, L., and C. Peebles. 2006. The usefulness of corporate annual reports in South
Africa: perceptions of preparers and users. Meditari Accountancy Research 14 (1):69-
80.
Street, D. L., and S. J. Gray. 2002. Factors influencing the extent of corporate compliance
with International Accounting Standards: summary of a research monograph. Journal
of International Accounting, Auditing and Taxation 11 (1):51-76.
Sun, Y. 2010. Do MD&A Disclosures Help Users Interpret Disproportionate Inventory
Increases? The Accounting Review 85 (4):1411-1440.
Tandy, P. R., and N. L. Wilburn. 1996. The academic community's participation in standard
setting: Submission of comment letter on SFAS nos. 1-117. Accounting Horizons 10
(3):92-111.

178
Tavcar, L. R. 1998. Make the MD&A more readable. The CPA Journal 68 (1):10.
Tomas, I. J., and R. V. Evanson. 1987. An empirical investigation of association between
financial ratio use and small business success. Journal of Business, Finance, and
Accounting 14 (4):555-571.
Trombetta, M., A. Wagenhofer, and P. Wysocki. 2012. The usefulness of academic
research in understanding the effects of accounting standards. Accounting in Europe 9
(2):127-146.
Tsalavoutas, I. 2011. Transition to IFRS and compliance with mandatory disclosure
requirements: What is the signal? Advances in Accounting 27 (2):390-405.
Usunier, J. C. 1998. International and Cross-Cultural Management Research: Sage.
Vance, A., P. B. Lowry, and D. Eggett. 2015. Increasing accountability through user-
interface design artifacts: A new approach to addressing the problem of access-policy
violations. MIS Quarterly: Management Information Systems 39 (2):345-366.
Vergoossen, R. G. 1993. The use and perceived importance of annual reports by investment
analysts in the Netherlands. European Accounting Review 2 (2):219-244.
Verrecchia, R. E. 1983. Discretionary Disclosure. Journal of Accounting and Economics 5
(1):179-194.
Wagenhofer, A. 2004. Accounting and Economics: What We Learn from Analytical
Models in Financial Accounting and Reporting. In The Economics and Politics of
Accounting: International Perspectives on Research Trends, Policy, and Practice,
edited by C. Leuz, D. Pfaff and A. Hopwood: New York: Oxford University Press.
Wallace, R. 1988. Intranational and international consensus on the importance of disclosure
items in financial reports: a Nigerian case study. The British Accounting Review 20
(3):223-265.
Wallace, R. O., and K. Naser. 1995. Firm-Specific Determinants of the Comprehensiveness
of Mandatory Disclosure in the Corporate Annual Reports of Firms Listed on the Stock
Exchange of Hong Kong. Journal of Accounting and Public Policy 14 (4):311-368.
Wallace, R. S., K. Naser, and A. Mora. 1994. The Relationship Between the
Comprehensiveness of Corporate Annual Reports and Firm Characteristics in Spain.
Accounting and Business Research 25 (97):41-53.

179
Wang, K., O, S., and M. C. Claiborne. 2008. Determinants and consequences of voluntary
disclosure in an emerging market: evidence from China. Journal of International
Accounting, Auditing and Taxation 17 (1):14-30.
Wang, M., and K. Hussainey. 2013. Voluntary forward-looking statements driven by
corporate governance and their value relevance. Journal of Accounting and Public
Policy 32 (3):26-49.
Watson, A., P. Shrives, and C. Marston. 2002. Voluntary disclosure of accounting ratios in
the UK. The British Accounting Review 34 (4):289-313.
Williams, P. F., and S. P. Ravenscroft. 2015. Rethinking decision usefulness.
Contemporary Accounting Research 32 (2):763-788.
Wilton, L. R., and J. B. Tabb. 1978. An Investigation into Private Shareholder Usage of
Financial Statements in New Zealand. Accounting Education 18 (1) :93-101.
Xin, J. 2015. The determinants of forward-looking risk disclosure and its impacts on firms'
risk and analyst forecast accuracy: Evidence from the UK, PhD Thesis, Durham theses,
Durham University: http://etheses.dur.ac.uk/11070/.
Young, J. J. 2006. Making up users. Accounting, Organizations and Society 31 (6):579-
600.
Zarzeski, M. T. 1996. Spontaneous harmonization effects of culture and market forces on
accounting disclosure practices. Accounting Horizons 10 (1):18-37.
180
APPENDICES
Appendix One: The Questionnaire
---------------------------------------------------------------------------------------------
Dear Participant,
The researcher is carrying out a survey analysis in order to investigate the usefulness
of information required in the Management Report by the 2014 Listing Rules and the
Companies Act 159/1981. To this end, we greatly appreciate your valuable time and effort
that you will spend in filling out this questionnaire. It will require no more than 10 minutes.
This survey includes a set of questions mainly investigate whether the current content of the
management report is sufficient for investments decision-making. Please note that there are
no right or wrong answers for any of these questions as we are expecting different people
provide different answers. This research is purely for academic purposes only and the
information you provide will be kept confidential at all times. Please answer and rate the
items as accurately and honestly as possible in order to enable the researcher to reach
accurate results.
Thank you very much for your cooperation and valuable time,
The Researcher The supervisor
Mostafa K.A. Mohamed Prof. Alessandra Allini

181
General Information:
1- Name: …………………………………………………(Optional)
2- Year of Born: ……………………………..
3- Gender: Male Female
4- The latest Certificate:
Bachelor Advanced Diploma Master Degree PhD
5- Graduate Field:
Accounting Business Administration Other
6- Your Experience in Securities:
10 Years or less Between 10-20 Years More than 20 years
7- Please select your firm type:
Bank Insurance Company Mediators Company
8- Please select the firm ownership:
Governmental Private sector Foreign firm
Section One: General Information about The Management Report Please indicate the degree of your agreement with the following statements
Statements Str
on
gly
Ag
ree
Ag
ree
No
t sure
Disa
gre
e
Str
on
gly
disa
gre
e
1-g) The Management report, which is prepared under the new
regulation, provides more information comparing with the old
regulation.
2.g) The Management report, which is prepared under the new
regulation, provides information easy to be understood.
3.g) The management report provides useful information.
4.g) You consider the management report a complementary to the
financial report.
5.g) You usually compare the content of the management report with
the content of the financial report’s.
6.g) Some companies disclose very limited information without any
attention to the users’ needs.
7.g) Using the tables and graphs in the management report make its
information more understandable.
8.g) The companies which do not make their director’s reports
available on their websites should be sanctioned by the Authorities
Section two: Corporate Governance disclosure
2.1 Ownership structure: Please indicate the degree of usefulness of the following information related to ownership structure
Items Very
Usefu
l
Usefu
l
Mo
dera
te
usefu
l
Slig
ht
Usefu
l
No
t
Usefu
l

182
1- Information on Shareholders who own 5% of shares or more, the
shares amounts and percentages.
2- The board members ownership
3- Treasury Stock – if any- classified according to the purchasing
dates comparing with the previous year amounts.
4- The variation in the main shareholders’ ownership compared
with the previous year.
5- The variation in the board members’ ownership compared with
the previous year.
2.2 Board Composition: Please indicate the degree of usefulness of the following information related to board composition
Items Very
Usefu
l
Usefu
l
Mo
dera
te
usefu
l
Slig
ht
Usefu
l
No
t
Usefu
l
6- The board members’ names and their nature]Executive, Non-
Executive, Independent[
7- The meeting number during the year. 8- The board members qualifications and experiences. 9- The rules that are followed to determine the rewards of board
members, and publishing a detailed schedule show each
member's rewards compared with the previous year.
2.3 Audit Committees: Please indicate the degree of usefulness of the following information related to Audit Committee
Items Very
Usefu
l
Usefu
l
Mo
dera
te
usefu
l
Slig
ht
Usefu
l
No
t
Usefu
l
10- Committee members’ names and their nature (Executive, Non-
Executive or Independent).
11- The Committee’s responsibilities. 12- Number of the committee meetings during the year and refer to
any Important notes were detected through.
13- The Committee members’ qualifications and experiences. 14- The board policy to change the committee members.
Please indicate the most 1 or 2 important committee/committees whose information is important for
you …………………………………………………………………………………
Section Three: internal control and risk management disclosure Please indicate the degree of usefulness of the following information related to risks and internal
control Items V
ery
Usefu
l
Usefu
l
Mo
dera
te
usefu
l
Slig
ht
Usefu
l
No
t
Usefu
l
15- The annual review results of the internal control quality and
effectiveness.
16- The risks that treat every activity or segment (including any
penalties or lawsuits).
17- The Board strategy to control the risks.

183
18- The expected effect of the risks on the firm future and its activity
through the next year.
Section Four: Key performance indicators: Please indicate the degree of usefulness of the following information related to key performance
indicators
Items Very
Usefu
l
Usefu
l
Mo
dera
te
usefu
l
Slig
ht
Usefu
l
No
t
Usefu
l
19- Export activities distributed on products. 20- Net profit distributed on the activities or products. 21- The actual sales compared with the target sales throughout the
year.
22- The actual net profits/losses compared with the target profits. 23- Profitability ratios. 24- Liquidity ratios.
Section Five: Changes in Fixed Assets Please indicate the degree of usefulness of the following information related to changes in the fixed
assets
Items Very
Usefu
l
Usefu
l
Mo
dera
te
usefu
l
Slig
ht
Usefu
l
No
t
Usefu
l
25- Information covers the fair values of fixed assets that are
significantly different compared to the book values, especially
lands and real estate.
26- The significant changes in the fixed assets over the ended year
(such as buying, selling, retirement, impairment… etc.).
27- Tables and graphs show the main changes in the fixed assets over
the last three years or more.
Section Six: : Disclosure about Forward-Looking performance Please indicate the degree of usefulness of the following information related to forward-looking
performance
Items Very
Usefu
l
Usefu
l
Mo
dera
te
usefu
l
Slig
ht
Usefu
l
No
t
Usefu
l
28- The management plans for the additions and betterments. 29- The expected market position. 30- The expected profit during the next year. 31- The planned finance sources for replacing fixed assets, launching
new products, or branches.
Section Seven: The social responsibility and environmental performance Please indicate the degree of usefulness of the following information related to corporate social and
environmental responsibility Items V
ery
Usefu
l
Usefu
l
Mo
dera
te
usefu
l
Slig
ht
Usefu
l
No
t Usefu
l

184
32- The employees’ numbers. 33- Total salaries and rewards for the employees through the year
and the average for the employee income through the year.
34- The average for the employees’ productivity throughout the year. 35- The Training programs to develop the employees’ skills. 36- The company participation in reducing the pollution and
protecting the environment.
37- The amounts paid by the firm to develop the surrounding
community.
38- The taken actions to verify the customers’ satisfaction and attract
new customers.
39- The company policy to rationalization the water and saving the
electricity as well as the unrenewable energy resources used in
its activities.

185
Appendix Two: The Disclosure Index
Section One: Corporate Governance disclosure Mandatory
(M)/voluntary
(V) First: Ownership structure disclosure
Items Yes No Before
2013
After
2013
1 The shareholders who own 5% of shares or more M
2 The board members’ ownership M
3 Treasury Stock – if any- classified according to the purchasing
dates, comparing with the previous year amounts and its
percentage to the whole capital.
M
4 The variation in the main shareholders’ ownership compared
with the previous year V
5 The variation in the board members’ ownership compared with
the previous year V
6
Second: Board Composition
6 The Board Members names, and their nature (Executive-Non-
Executive-Independent) M
7 The meeting number during the year M
8 The Board members qualifications and experiences V
9 Publishing a detailed schedule show each member rewards
compared with the previous year V
Third: Audit Committee
10 The committee members names and their nature (Executive,
Non-Executive or Independent) M
11 The committee responsibilities M
12 The number of the committee meetings during the year M
13 The committee members’ qualifications and experiences V
14 The board policy to change the committee members. V
Section Two: Internal Control and Risks
15 The annual review results of the internal control quality and
effectiveness V
16 The risks which treat every activity or segment V
17 The Board strategy to control the risks V
18 The risks effect on the firm future and its activity through the
next year. V
Section Three: Key Performance Indicators
19 The Exports distributed by products M
90 Net profit distributed by the activities or products M
91 Comparing the actual sales to the target sales through the year V
92 The % of the actual net profit to the target profit V

186
23 The Profitability ratios (at least one of Net Operational
Profit/Sales, Net Operational Profit/ownership equity or capital,
Net Operational Profit/Total Assets)
V
24 Liquidity Ratio (one of Cash Ratio or Acid test ratio V
Section Four: Changes in fixed Assets
25 Information related to the fixed assets have fair values
significantly differ from the Book Value, especially lands and
real estate.
M
26 The Important changes in the fixed assets through the year
(such as buying, selling, retirement, Impairment… etc.) M
27 Tables and graphs to show the main changes in the firm assets
and liabilities through the three years or more V
Section Five: Forward-Looking performance disclosure
28 The management plans to the additions and betterments M
29 The expected sales/revenues in the next year V
30 The expected profits in the next year V
31 The planned finance sources for replacing assets, launching new
products, or branches V
Section Six: Corporate Social and Environmental Responsibility
32 The employees’ numbers M
33 The average for the employee income through the year M
34 The average for the employees’ productivity through the year V
35 The training programs to develop the employees’ skills through
the ended-year V
36 The company participation in reducing the pollution or
protecting the environment M
37 The amounts paid by the firm to develop the surrounding
community M
38 The taken actions to verify the customers’ satisfaction and
attract new customers V
39 The company policy to rationalization the water and saving the
electricity as well as the unrenewable energy Resources which
used in the firm activities
V
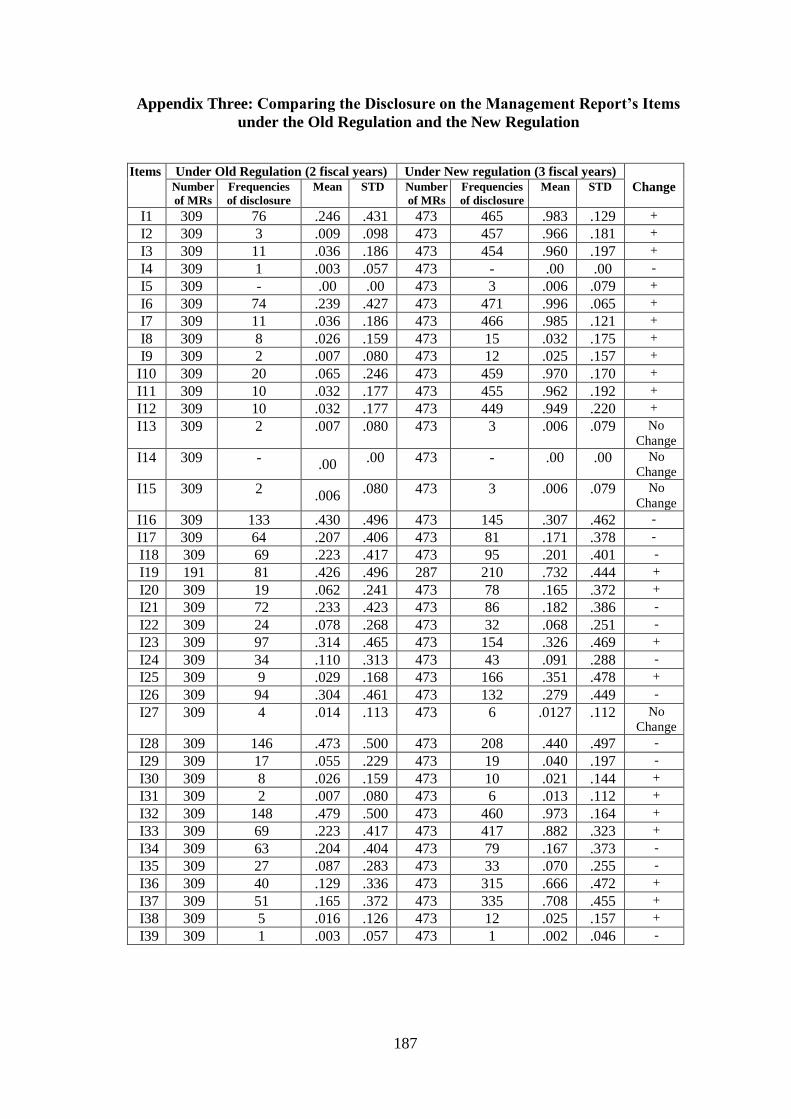
187
Appendix Three: Comparing the Disclosure on the Management Report’s Items
under the Old Regulation and the New Regulation
Items Under Old Regulation (2 fiscal years) Under New regulation (3 fiscal years)
Change Number
of MRs
Frequencies
of disclosure
Mean STD Number
of MRs
Frequencies
of disclosure
Mean STD
I1 309 76 .246 .431 473 465 .983 .129 +
I2 309 3 .009 .098 473 457 .966 .181 +
I3 309 11 .036 .186 473 454 .960 .197 +
I4 309 1 .003 .057 473 - .00 .00 -
I5 309 - .00 .00 473 3 .006 .079 +
I6 309 74 .239 .427 473 471 .996 .065 +
I7 309 11 .036 .186 473 466 .985 .121 +
I8 309 8 .026 .159 473 15 .032 .175 +
I9 309 2 .007 .080 473 12 .025 .157 +
I10 309 20 .065 .246 473 459 .970 .170 +
I11 309 10 .032 .177 473 455 .962 .192 +
I12 309 10 .032 .177 473 449 .949 .220 +
I13 309 2 .007 .080 473 3 .006 .079 No
Change
I14 309 - .00
.00 473 - .00 .00 No
Change
I15 309 2 .006
.080 473 3 .006 .079 No
Change
I16 309 133 .430 .496 473 145 .307 .462 -
I17 309 64 .207 .406 473 81 .171 .378 -
I18 309 69 .223 .417 473 95 .201 .401 -
I19 191 81 .426 .496 287 210 .732 .444 +
I20 309 19 .062 .241 473 78 .165 .372 +
I21 309 72 .233 .423 473 86 .182 .386 -
I22 309 24 .078 .268 473 32 .068 .251 -
I23 309 97 .314 .465 473 154 .326 .469 +
I24 309 34 .110 .313 473 43 .091 .288 -
I25 309 9 .029 .168 473 166 .351 .478 +
I26 309 94 .304 .461 473 132 .279 .449 -
I27 309 4 .014 .113 473 6 .0127 .112 No
Change
I28 309 146 .473 .500 473 208 .440 .497 -
I29 309 17 .055 .229 473 19 .040 .197 -
I30 309 8 .026 .159 473 10 .021 .144 +
I31 309 2 .007 .080 473 6 .013 .112 +
I32 309 148 .479 .500 473 460 .973 .164 +
I33 309 69 .223 .417 473 417 .882 .323 +
I34 309 63 .204 .404 473 79 .167 .373 -
I35 309 27 .087 .283 473 33 .070 .255 -
I36 309 40 .129 .336 473 315 .666 .472 +
I37 309 51 .165 .372 473 335 .708 .455 +
I38 309 5 .016 .126 473 12 .025 .157 +
I39 309 1 .003 .057 473 1 .002 .046 -