Embed Size (px)
Citation preview
�
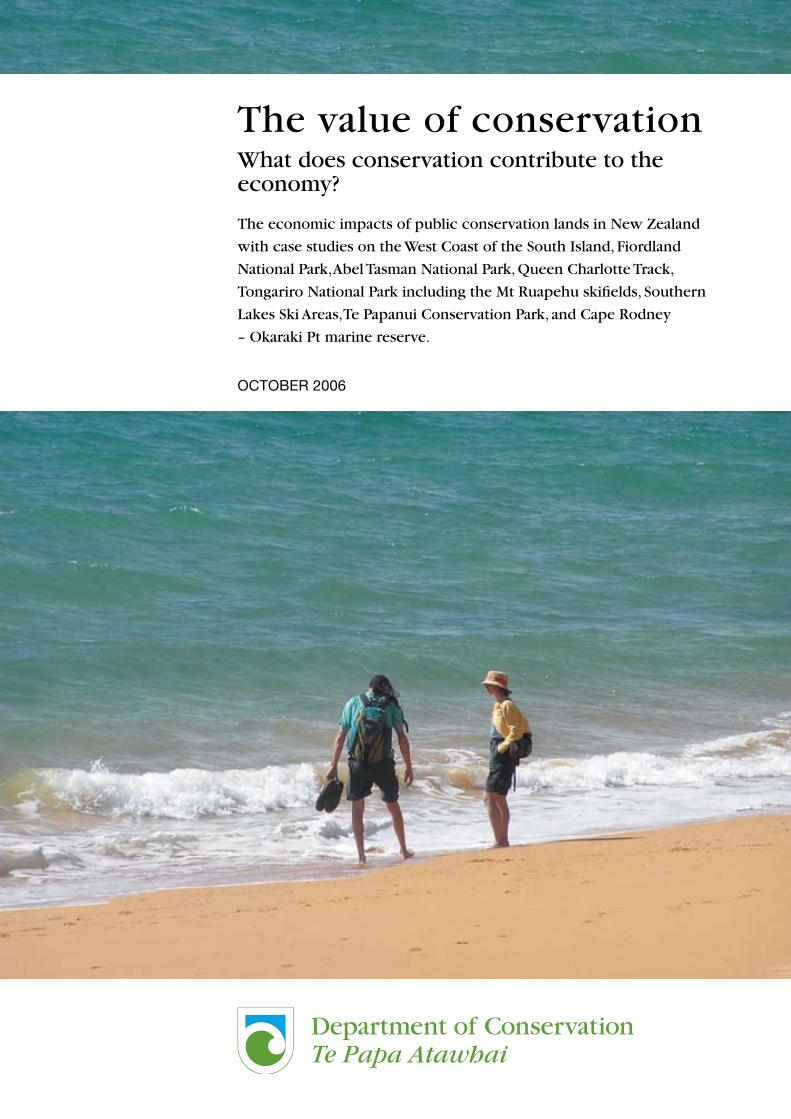
The value of conservationWhat does conservation contribute to the economy?
The economic impacts of public conservation lands in New Zealand
with case studies on the West Coast of the South Island, Fiordland
National Park, Abel Tasman National Park, Queen Charlotte Track,
Tongariro National Park including the Mt Ruapehu skifields, Southern
Lakes Ski Areas, Te Papanui Conservation Park, and Cape Rodney
– Okaraki Pt marine reserve.
OCTOBER 2006

�
Front cover
Photo: DOC
Clematis/puawananga Clematis
paniculata
Photo: DOC
�
FOREWORD FROM THE MINISTER OF CONSERVATION
For many New Zealanders our national parks and public conservation lands are part
of our Kiwi identity. Up until now, we’ve reserved and protected unique landscapes,
special places and habitats for native species because we’ve recognised we have a
responsibility to future generations to ensure the experience of New Zealand’s natural
environment remains a part of the Kiwi way of life.
But this is now changing. Increasingly, people are becoming aware that in addition
to the social and environmental reasons for conservation, there is a hitherto under-
recognised economic rationale.
This publication explores that economic rationale more fully, and seeks to answer
some of the questions the public have been asking. It draws on the findings of
studies commissioned by the Department of Conservation to assess the economic
impact of Fiordland National Park, conservation lands on the West Coast, Te Papanui
Conservation Park in Otago, Abel Tasman National Park, the Queen Charlotte Track in
Marlborough and Tongariro National Park. Independent economic impact reports on
the Mt Ruapehu skifields (in Tongariro National Park), and on the five Southern Lakes
ski areas (three of which are on public conservation land) and the Cape Rodney
– Okaraki Pt marine reserve are also included.
The most obvious and immediate economic impact readers will discover is the
enormous contribution conservation makes to regional wealth and employment, largely
through tourism. International tourism is now our single largest foreign exchange
earner. Tourism, generally, is a key driver of many regional economies, and the appeal
of natural attractions in New Zealand is a key driver of the industry, particularly in
areas like the West Coast, Nelson-Tasman/Marlborough, and in Queenstown and Te
Anau.
But this publication also outlines many of the subtler and more complex economic
contributions natural environments supply, such as “ecosystem services”.
Ecosystem services are the natural processes nature provides for free, and from
which we benefit. They include services like fresh water filtration and allocation, soil
maintenance, erosion and flood control, and the role the environment has to play in
the maintenance of food stocks, such as whitebait.
Around the world there is a growing realisation that these kinds of services actually
underpin sustainable development and economic growth, and thus have a significant
economic value, even though technically we don’t have to pay for them.
Many of these services are extraordinarily difficult to provide artificially, if not impossible.
If we destroy the ability of natural areas to provide them, we face considerable costs
and consequences in trying to replace them. For this reason, it is crucial economic
markets, government policies and legislation recognise ecosystem services and their
importance. To achieve that recognition, they need to be understood by the public.
One of the best ways to preserve ecosystem services is to protect important landscapes
and environments that provide those services. As this publication demonstrates, public
conservation lands, which span some 8 million ha, do just that. They safeguard the
“natural capital” of New Zealand.
Chris CarterMINISTER OF CONSERVATION
Chris Carter
Minister of Conservation
�
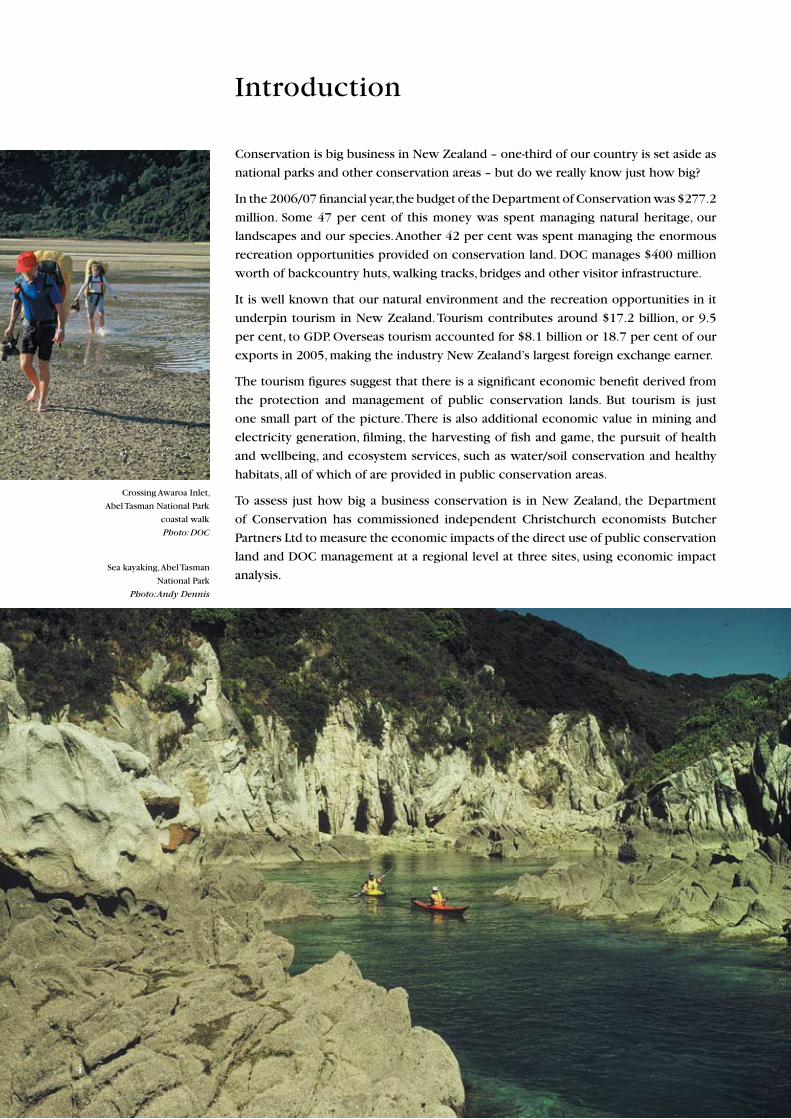
Introduction
Conservation is big business in New Zealand – one-third of our country is set aside as
national parks and other conservation areas – but do we really know just how big?
In the �006/07 financial year, the budget of the Department of Conservation was $�77.�
million. Some �7 per cent of this money was spent managing natural heritage, our
landscapes and our species. Another �� per cent was spent managing the enormous
recreation opportunities provided on conservation land. DOC manages $�00 million
worth of backcountry huts, walking tracks, bridges and other visitor infrastructure.
It is well known that our natural environment and the recreation opportunities in it
underpin tourism in New Zealand. Tourism contributes around $�7.� billion, or 9.5
per cent, to GDP. Overseas tourism accounted for $8.� billion or �8.7 per cent of our
exports in �005, making the industry New Zealand’s largest foreign exchange earner.
The tourism figures suggest that there is a significant economic benefit derived from
the protection and management of public conservation lands. But tourism is just
one small part of the picture. There is also additional economic value in mining and
electricity generation, filming, the harvesting of fish and game, the pursuit of health
and wellbeing, and ecosystem services, such as water/soil conservation and healthy
habitats, all of which of are provided in public conservation areas.
To assess just how big a business conservation is in New Zealand, the Department
of Conservation has commissioned independent Christchurch economists Butcher
Partners Ltd to measure the economic impacts of the direct use of public conservation
land and DOC management at a regional level at three sites, using economic impact
analysis.
�
Sea kayaking, Abel Tasman
National Park
Photo: Andy Dennis
Crossing Awaroa Inlet,
Abel Tasman National Park
coastal walk
Photo: DOC
5
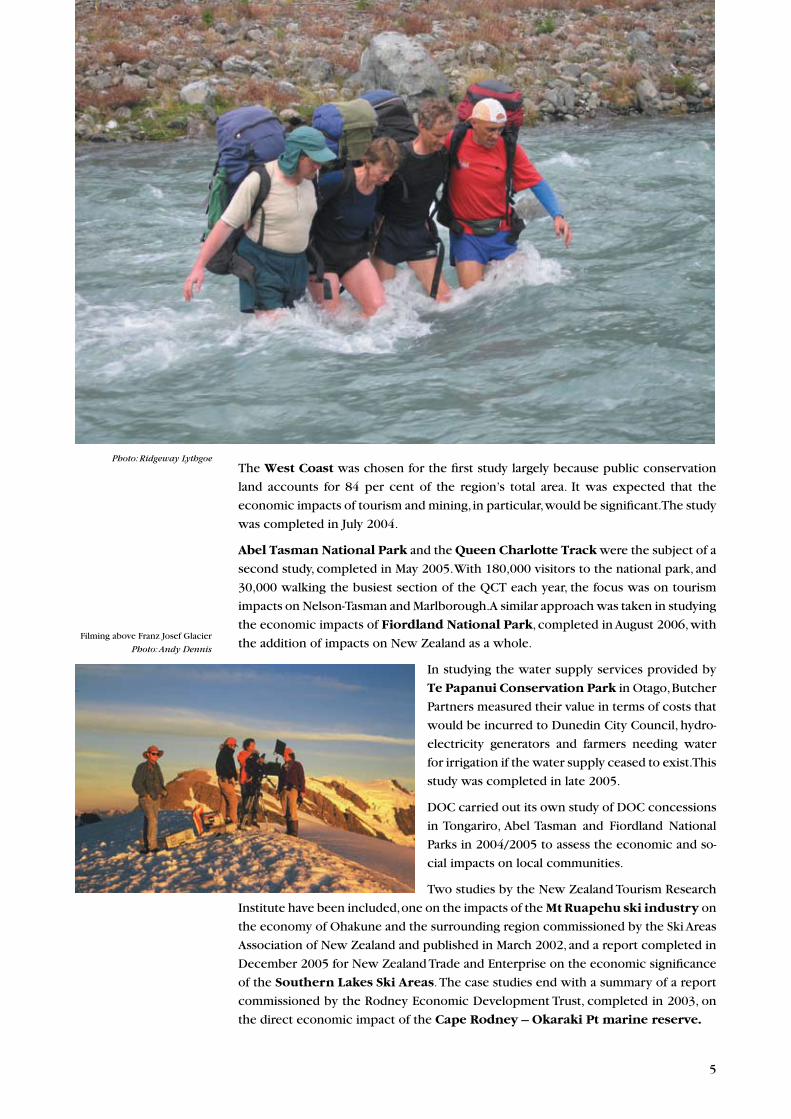
The West Coast was chosen for the first study largely because public conservation
land accounts for 8� per cent of the region’s total area. It was expected that the
economic impacts of tourism and mining, in particular, would be significant. The study
was completed in July �00�.
Abel Tasman National Park and the Queen Charlotte Track were the subject of a
second study, completed in May �005. With �80,000 visitors to the national park, and
�0,000 walking the busiest section of the QCT each year, the focus was on tourism
impacts on Nelson-Tasman and Marlborough. A similar approach was taken in studying
the economic impacts of Fiordland National Park, completed in August �006, with
the addition of impacts on New Zealand as a whole.
In studying the water supply services provided by
Te Papanui Conservation Park in Otago, Butcher
Partners measured their value in terms of costs that
would be incurred to Dunedin City Council, hydro-
electricity generators and farmers needing water
for irrigation if the water supply ceased to exist. This
study was completed in late �005.
DOC carried out its own study of DOC concessions
in Tongariro, Abel Tasman and Fiordland National
Parks in �00�/�005 to assess the economic and so-
cial impacts on local communities.
Two studies by the New Zealand Tourism Research
Institute have been included, one on the impacts of the Mt Ruapehu ski industry on
the economy of Ohakune and the surrounding region commissioned by the Ski Areas
Association of New Zealand and published in March �00�, and a report completed in
December �005 for New Zealand Trade and Enterprise on the economic significance
of the Southern Lakes Ski Areas. The case studies end with a summary of a report
commissioned by the Rodney Economic Development Trust, completed in �00�, on
the direct economic impact of the Cape Rodney – Okaraki Pt marine reserve.
Filming above Franz Josef Glacier
Photo: Andy Dennis
Photo: Ridgeway Lythgoe
6
ECONOMIC IMPACT ANALYSIS
The case studies for Fiordland National Park, the West Coast, Abel Tasman National
Park, Queen Charlotte Track, DOC-concessioned activities in three national parks,
the Mt Ruapehu skifields and the Southern Lakes Ski Areas were carried out using
economic impact analysis, a standard tool that economists use. This method measures
the total dollars spent in a region that would not have been spent if the national park/
conservation area did not exist.
One advantage of measuring economic impacts is that the results can be expressed in
ways that are familiar to non-economists:
• Jobs: number of employees and self-employed persons expressed as full-time
equivalents (FTEs).
• Household income: what households earn before tax.
• Value added: household income plus returns to business capital, i.e. wages, taxes,
interest, depreciation, self-employed income and profits.
• Output: total turnover, that is, the sum of value added, and purchases from
suppliers.
Calculating economic impacts entails chasing the money-go-round in a regional
economy, that is, counting what tourists spend on tourism businesses, and what they
buy from their suppliers, and so on. The flow-on effects are derived from the direct
spending using formulas known as multipliers.
Multipliers are based on economic models of regional economies. For instance, on the
West Coast, the average multiplier for all types of employment in respect of public
conservation land is �.�6. That means that if there are ���� jobs directly related to
conservation, the total number of jobs generated in the region is �8��. The additional
�7� jobs include the extra retail staff, hairdressers, bankers, builders, petrol station
workers and so forth needed to service the ���� workers.
Using economic impact analysis, it is possible to estimate how much extra money is
pumped into a local economy, the number of new jobs created, and the contribution
to a region’s household income and to business profits as a result of a national park or
conservation area.
The studies on following pages prove that public land is not a “lock up” of resources,
rather, it provides a platform for businesses to operate sustainably.
6
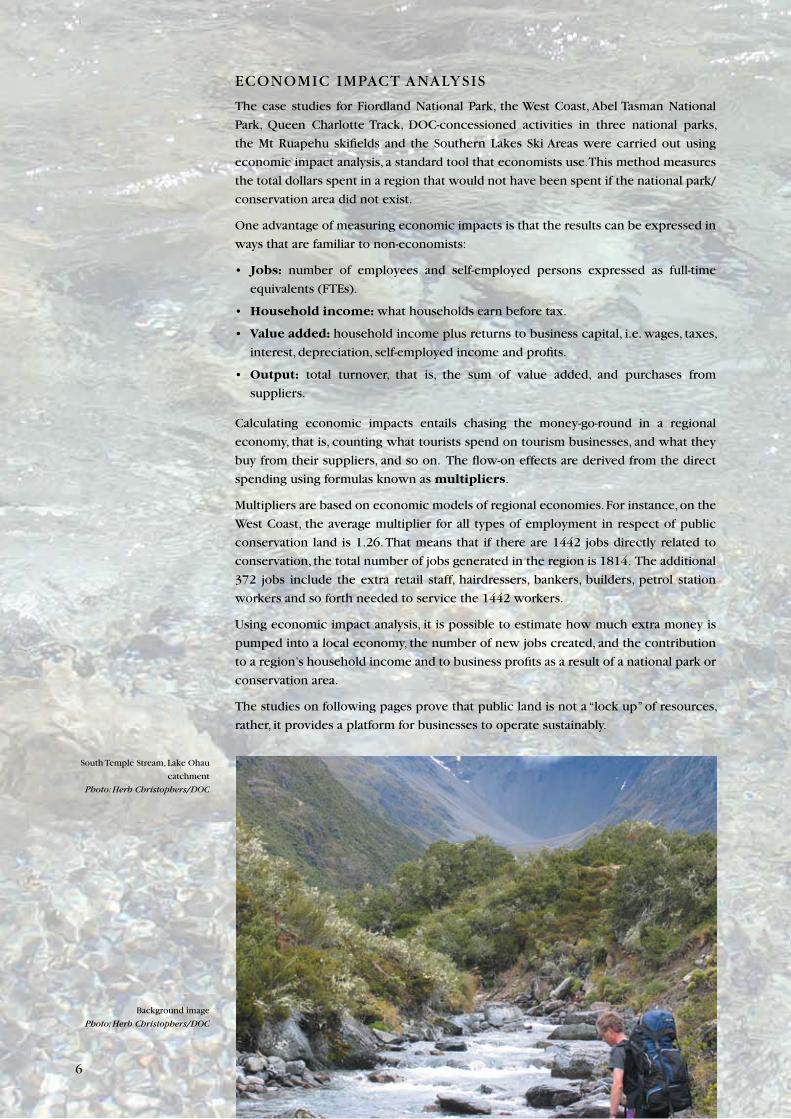
South Temple Stream, Lake Ohau
catchment
Photo: Herb Christophers/DOC
Background image
Photo: Herb Christophers/DOC
7
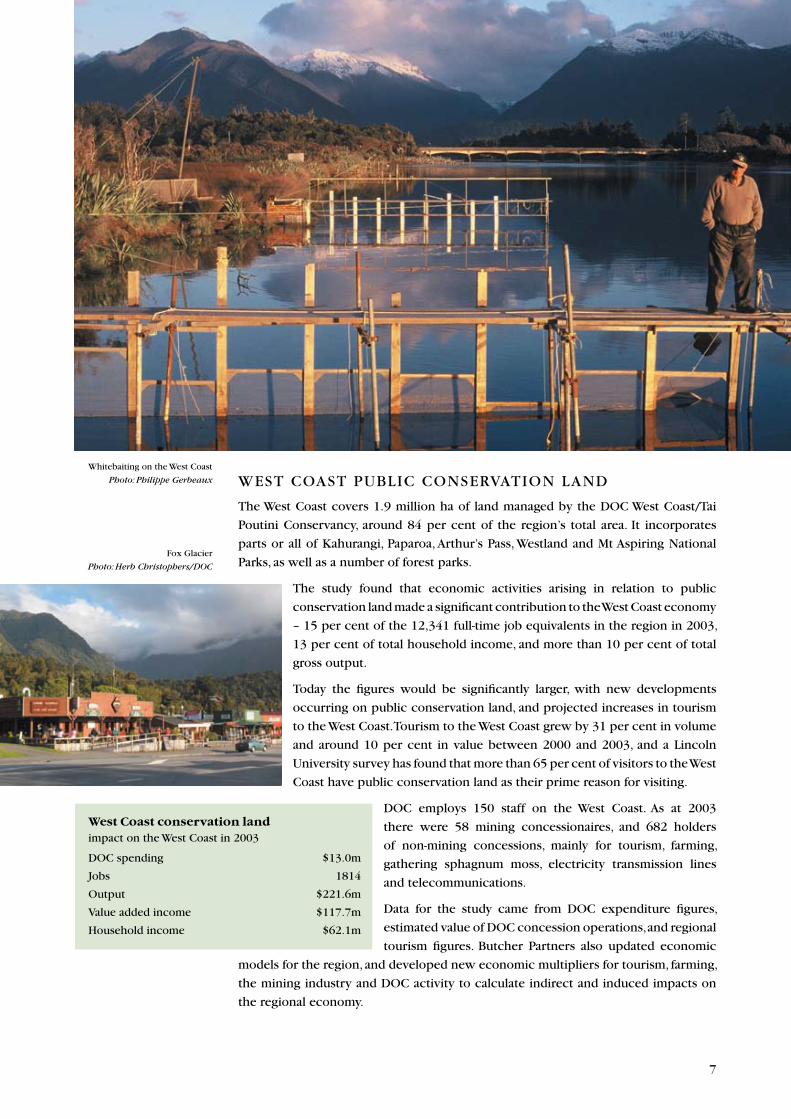
WEST COAST PUBLIC CONSERVATION LAND
The West Coast covers �.9 million ha of land managed by the DOC West Coast/Tai
Poutini Conservancy, around 8� per cent of the region’s total area. It incorporates
parts or all of Kahurangi, Paparoa, Arthur’s Pass, Westland and Mt Aspiring National
Parks, as well as a number of forest parks.
The study found that economic activities arising in relation to public
conservation land made a significant contribution to the West Coast economy
– �5 per cent of the ��,��� full-time job equivalents in the region in �00�,
�� per cent of total household income, and more than �0 per cent of total
gross output.
Today the figures would be significantly larger, with new developments
occurring on public conservation land, and projected increases in tourism
to the West Coast. Tourism to the West Coast grew by �� per cent in volume
and around �0 per cent in value between �000 and �00�, and a Lincoln
University survey has found that more than 65 per cent of visitors to the West
Coast have public conservation land as their prime reason for visiting.
DOC employs �50 staff on the West Coast. As at �00�
there were 58 mining concessionaires, and 68� holders
of non-mining concessions, mainly for tourism, farming,
gathering sphagnum moss, electricity transmission lines
and telecommunications.
Data for the study came from DOC expenditure figures,
estimated value of DOC concession operations, and regional
tourism figures. Butcher Partners also updated economic
models for the region, and developed new economic multipliers for tourism, farming,
the mining industry and DOC activity to calculate indirect and induced impacts on
the regional economy.
West Coast conservation land impact on the West Coast in �00�
DOC spending $��.0m
Jobs �8��
Output $���.6m
Value added income $��7.7m
Household income $6�.�m
Whitebaiting on the West Coast
Photo: Philippe Gerbeaux
Fox Glacier
Photo: Herb Christophers/DOC
8
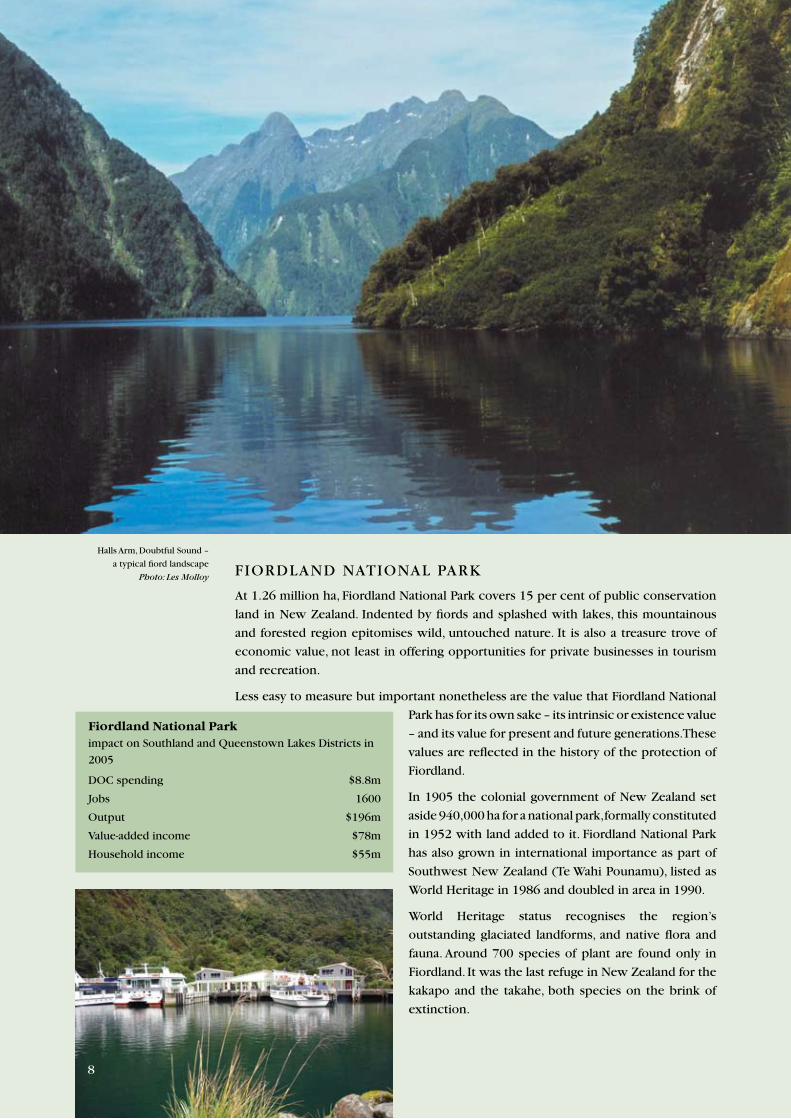
FIORDLAND NATIONAL PARK
At �.�6 million ha, Fiordland National Park covers �5 per cent of public conservation
land in New Zealand. Indented by fiords and splashed with lakes, this mountainous
and forested region epitomises wild, untouched nature. It is also a treasure trove of
economic value, not least in offering opportunities for private businesses in tourism
and recreation.
Less easy to measure but important nonetheless are the value that Fiordland National
Park has for its own sake – its intrinsic or existence value
– and its value for present and future generations. These
values are reflected in the history of the protection of
Fiordland.
In �905 the colonial government of New Zealand set
aside 9�0,000 ha for a national park, formally constituted
in �95� with land added to it. Fiordland National Park
has also grown in international importance as part of
Southwest New Zealand (Te Wahi Pounamu), listed as
World Heritage in �986 and doubled in area in �990.
World Heritage status recognises the region’s
outstanding glaciated landforms, and native flora and
fauna. Around 700 species of plant are found only in
Fiordland. It was the last refuge in New Zealand for the
kakapo and the takahe, both species on the brink of
extinction.
Fiordland National Park impact on Southland and Queenstown Lakes Districts in
�005
DOC spending $8.8m
Jobs �600
Output $�96m
Value-added income $78m
Household income $55m
Halls Arm, Doubtful Sound –
a typical fiord landscape
Photo: Les Molloy
8
9
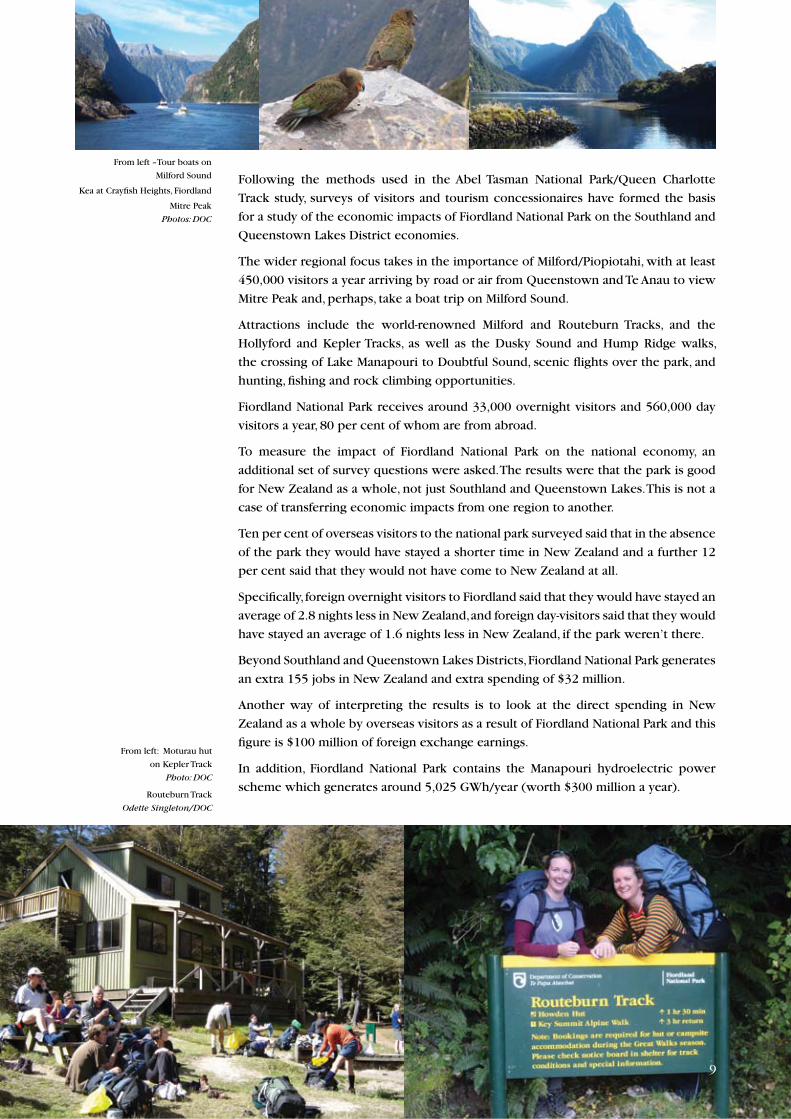
Following the methods used in the Abel Tasman National Park/Queen Charlotte
Track study, surveys of visitors and tourism concessionaires have formed the basis
for a study of the economic impacts of Fiordland National Park on the Southland and
Queenstown Lakes District economies.
The wider regional focus takes in the importance of Milford/Piopiotahi, with at least
�50,000 visitors a year arriving by road or air from Queenstown and Te Anau to view
Mitre Peak and, perhaps, take a boat trip on Milford Sound.
Attractions include the world-renowned Milford and Routeburn Tracks, and the
Hollyford and Kepler Tracks, as well as the Dusky Sound and Hump Ridge walks,
the crossing of Lake Manapouri to Doubtful Sound, scenic flights over the park, and
hunting, fishing and rock climbing opportunities.
Fiordland National Park receives around ��,000 overnight visitors and 560,000 day
visitors a year, 80 per cent of whom are from abroad.
To measure the impact of Fiordland National Park on the national economy, an
additional set of survey questions were asked. The results were that the park is good
for New Zealand as a whole, not just Southland and Queenstown Lakes. This is not a
case of transferring economic impacts from one region to another.
Ten per cent of overseas visitors to the national park surveyed said that in the absence
of the park they would have stayed a shorter time in New Zealand and a further ��
per cent said that they would not have come to New Zealand at all.
Specifically, foreign overnight visitors to Fiordland said that they would have stayed an
average of �.8 nights less in New Zealand, and foreign day-visitors said that they would
have stayed an average of �.6 nights less in New Zealand, if the park weren’t there.
Beyond Southland and Queenstown Lakes Districts, Fiordland National Park generates
an extra �55 jobs in New Zealand and extra spending of $�� million.
Another way of interpreting the results is to look at the direct spending in New
Zealand as a whole by overseas visitors as a result of Fiordland National Park and this
figure is $�00 million of foreign exchange earnings.
In addition, Fiordland National Park contains the Manapouri hydroelectric power
scheme which generates around 5,0�5 GWh/year (worth $�00 million a year).
9
From left: Moturau hut
on Kepler Track
Photo: DOC
Routeburn Track
Odette Singleton/DOC
From left –Tour boats on
Milford Sound
Kea at Crayfish Heights, Fiordland
Mitre Peak
Photos: DOC
�0
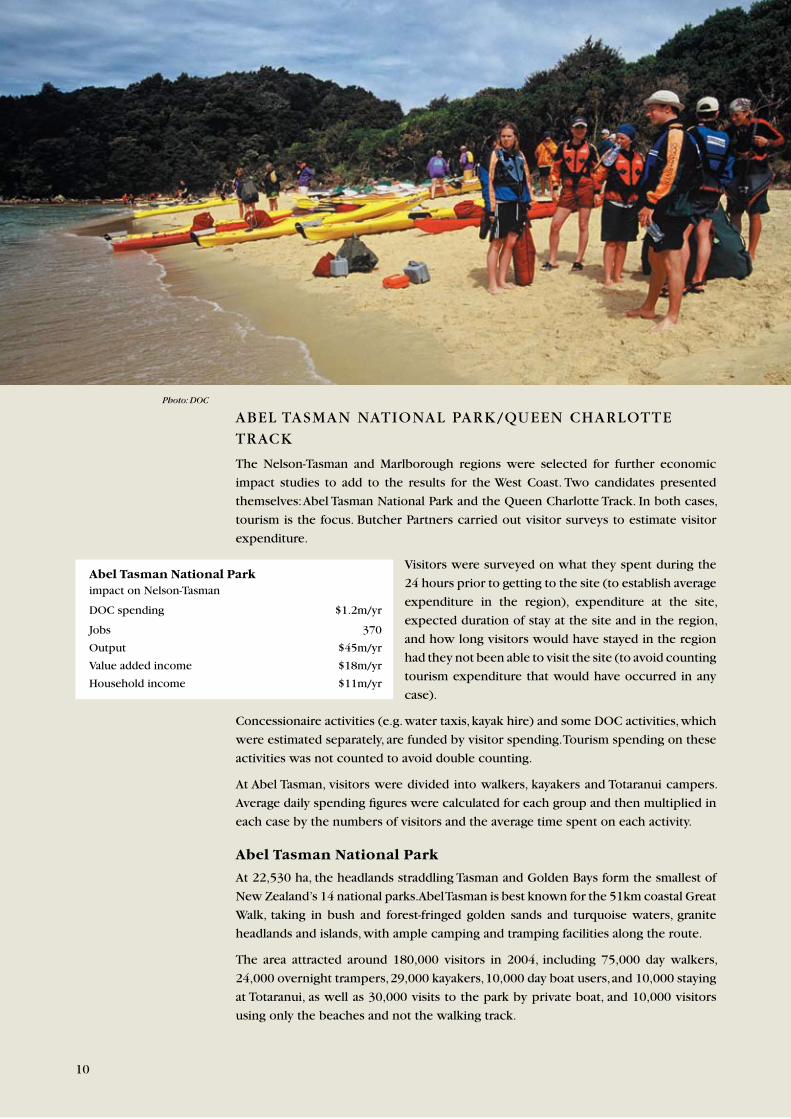
ABEL TASMAN NATIONAL PARK/QUEEN CHARLOTTE TRACK
The Nelson-Tasman and Marlborough regions were selected for further economic
impact studies to add to the results for the West Coast. Two candidates presented
themselves: Abel Tasman National Park and the Queen Charlotte Track. In both cases,
tourism is the focus. Butcher Partners carried out visitor surveys to estimate visitor
expenditure.
Visitors were surveyed on what they spent during the
�� hours prior to getting to the site (to establish average
expenditure in the region), expenditure at the site,
expected duration of stay at the site and in the region,
and how long visitors would have stayed in the region
had they not been able to visit the site (to avoid counting
tourism expenditure that would have occurred in any
case).
Concessionaire activities (e.g. water taxis, kayak hire) and some DOC activities, which
were estimated separately, are funded by visitor spending. Tourism spending on these
activities was not counted to avoid double counting.
At Abel Tasman, visitors were divided into walkers, kayakers and Totaranui campers.
Average daily spending figures were calculated for each group and then multiplied in
each case by the numbers of visitors and the average time spent on each activity.
Abel Tasman National Park
At ��,5�0 ha, the headlands straddling Tasman and Golden Bays form the smallest of
New Zealand’s �� national parks. Abel Tasman is best known for the 5�km coastal Great
Walk, taking in bush and forest-fringed golden sands and turquoise waters, granite
headlands and islands, with ample camping and tramping facilities along the route.
The area attracted around �80,000 visitors in �00�, including 75,000 day walkers,
��,000 overnight trampers, �9,000 kayakers, �0,000 day boat users, and �0,000 staying
at Totaranui, as well as �0,000 visits to the park by private boat, and �0,000 visitors
using only the beaches and not the walking track.
Abel Tasman National Park impact on Nelson-Tasman
DOC spending $�.�m/yr
Jobs �70
Output $�5m/yr
Value added income $�8m/yr
Household income $��m/yr
�0
Photo: DOC
��
Queen Charlotte Track
A water taxi ride away from Picton, the 7�km track spans forested and farmed public
conservation land and private land between Ship Cove and Anakiwa. Part of the
attraction is the water taxi service, offering access to several landing points and a
backpack-carrying service, allowing visitors to choose the number of days they wish
to spend on the track. The private huts and lodges en route offer a wide range of
accommodation standards.
The track is open to mountain-bikers, except along the busy Ship Cove-Punga Cove
leg between � December and �8 February, making the
Queen Charlotte one of the few dual-use tracks in the
public conservation estate. It is also one of the few tracks
where people can walk comfortably side by side.
Around �0,000 people walked or mountain-biked
the busiest section in �00�–�00�. There were 5�,000
visitor-nights spent on the track in a year, and ��,000
visitor-days for people not staying overnight. The track
directly supports more than �0 private accommodation businesses and three water
taxi companies.
Queen Charlotte Track impact on Marlborough
DOC spending $0.�m/yr
Jobs 98
Output $9.� m/yr
Value added income $�.�m/yr
Household income $�.5 m/yr
��
Photos: DOC
Queen Charlotte Track
Photo: DOC
��
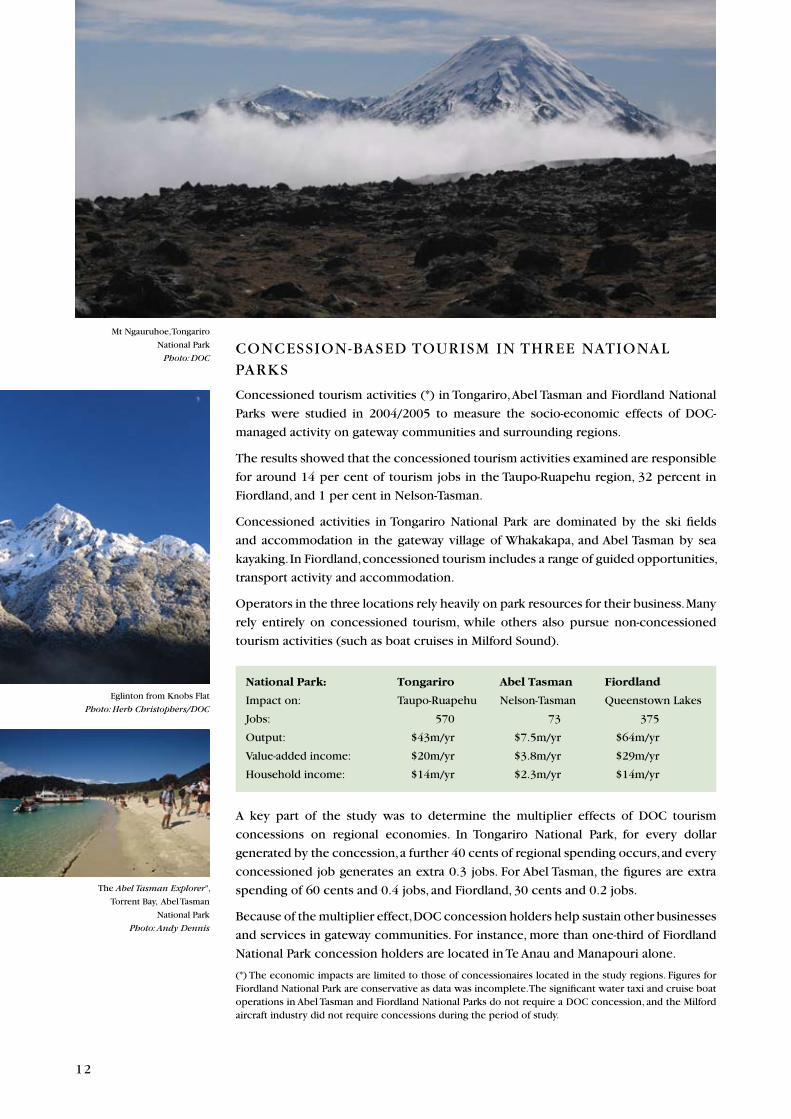
CONCESSION-BASED TOURISM IN THREE NATIONAL PARKS
Concessioned tourism activities (*) in Tongariro, Abel Tasman and Fiordland National
Parks were studied in �00�/�005 to measure the socio-economic effects of DOC-
managed activity on gateway communities and surrounding regions.
The results showed that the concessioned tourism activities examined are responsible
for around �� per cent of tourism jobs in the Taupo-Ruapehu region, �� percent in
Fiordland, and � per cent in Nelson-Tasman.
Concessioned activities in Tongariro National Park are dominated by the ski fields
and accommodation in the gateway village of Whakakapa, and Abel Tasman by sea
kayaking. In Fiordland, concessioned tourism includes a range of guided opportunities,
transport activity and accommodation.
Operators in the three locations rely heavily on park resources for their business. Many
rely entirely on concessioned tourism, while others also pursue non-concessioned
tourism activities (such as boat cruises in Milford Sound).
National Park: Tongariro Abel Tasman Fiordland
Impact on: Taupo-Ruapehu Nelson-Tasman Queenstown Lakes
Jobs: 570 7� �75
Output: $��m/yr $7.5m/yr $6�m/yr
Value-added income: $�0m/yr $�.8m/yr $�9m/yr
Household income: $��m/yr $�.�m/yr $��m/yr
A key part of the study was to determine the multiplier effects of DOC tourism
concessions on regional economies. In Tongariro National Park, for every dollar
generated by the concession, a further �0 cents of regional spending occurs, and every
concessioned job generates an extra 0.� jobs. For Abel Tasman, the figures are extra
spending of 60 cents and 0.� jobs, and Fiordland, �0 cents and 0.� jobs.
Because of the multiplier effect, DOC concession holders help sustain other businesses
and services in gateway communities. For instance, more than one-third of Fiordland
National Park concession holders are located in Te Anau and Manapouri alone.
(*) The economic impacts are limited to those of concessionaires located in the study regions. Figures for Fiordland National Park are conservative as data was incomplete. The significant water taxi and cruise boat operations in Abel Tasman and Fiordland National Parks do not require a DOC concession, and the Milford aircraft industry did not require concessions during the period of study.
The Abel Tasman Explorer",
Torrent Bay, Abel Tasman
National Park
Photo: Andy Dennis
Eglinton from Knobs Flat
Photo: Herb Christophers/DOC
Mt Ngauruhoe, Tongariro
National Park
Photo: DOC
��
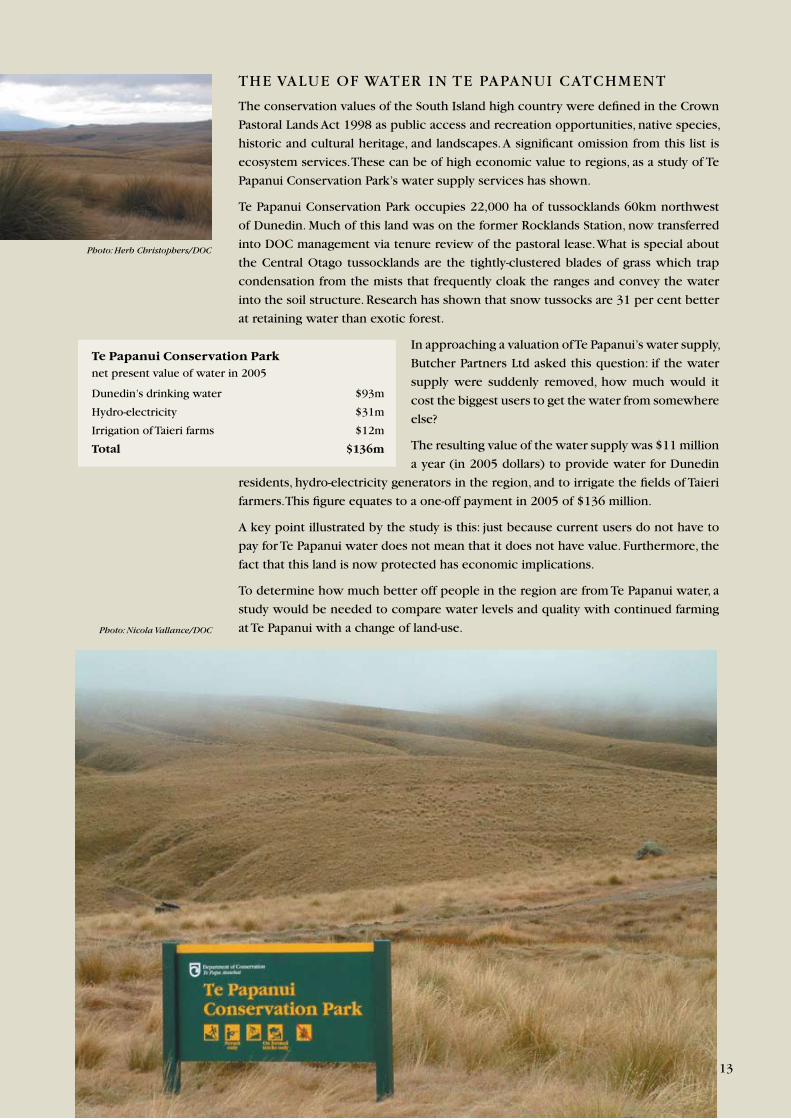
Te Papanui Conservation Parknet present value of water in �005
Dunedin’s drinking water $9�m
Hydro-electricity $��m
Irrigation of Taieri farms $��m
Total $136m
��
Photo: Nicola Vallance/DOC
Photo: Herb Christophers/DOC
THE VALUE OF WATER IN TE PAPANUI CATCHMENT
The conservation values of the South Island high country were defined in the Crown
Pastoral Lands Act �998 as public access and recreation opportunities, native species,
historic and cultural heritage, and landscapes. A significant omission from this list is
ecosystem services. These can be of high economic value to regions, as a study of Te
Papanui Conservation Park’s water supply services has shown.
Te Papanui Conservation Park occupies ��,000 ha of tussocklands 60km northwest
of Dunedin. Much of this land was on the former Rocklands Station, now transferred
into DOC management via tenure review of the pastoral lease. What is special about
the Central Otago tussocklands are the tightly-clustered blades of grass which trap
condensation from the mists that frequently cloak the ranges and convey the water
into the soil structure. Research has shown that snow tussocks are �� per cent better
at retaining water than exotic forest.
In approaching a valuation of Te Papanui’s water supply,
Butcher Partners Ltd asked this question: if the water
supply were suddenly removed, how much would it
cost the biggest users to get the water from somewhere
else?
The resulting value of the water supply was $�� million
a year (in �005 dollars) to provide water for Dunedin
residents, hydro-electricity generators in the region, and to irrigate the fields of Taieri
farmers. This figure equates to a one-off payment in �005 of $��6 million.
A key point illustrated by the study is this: just because current users do not have to
pay for Te Papanui water does not mean that it does not have value. Furthermore, the
fact that this land is now protected has economic implications.
To determine how much better off people in the region are from Te Papanui water, a
study would be needed to compare water levels and quality with continued farming
at Te Papanui with a change of land-use.
��
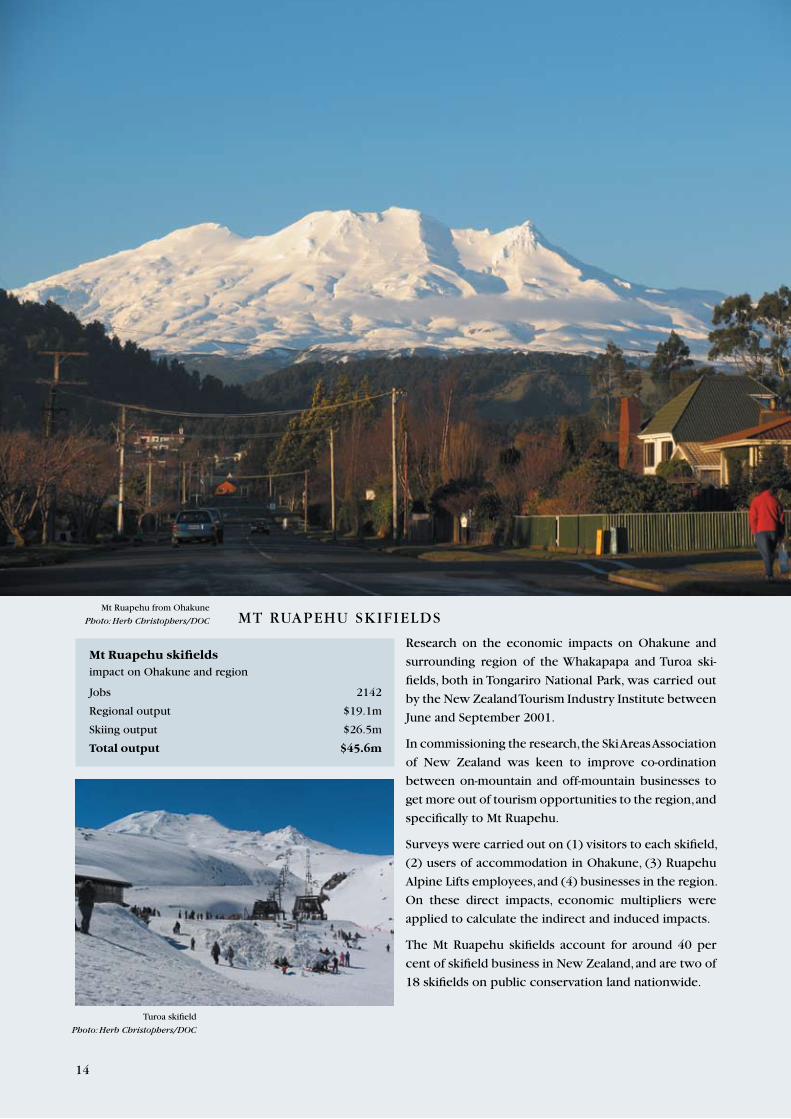
MT RUAPEHU SKIFIELDS
Research on the economic impacts on Ohakune and
surrounding region of the Whakapapa and Turoa ski-
fields, both in Tongariro National Park, was carried out
by the New Zealand Tourism Industry Institute between
June and September �00�.
In commissioning the research, the Ski Areas Association
of New Zealand was keen to improve co-ordination
between on-mountain and off-mountain businesses to
get more out of tourism opportunities to the region, and
specifically to Mt Ruapehu.
Surveys were carried out on (�) visitors to each skifield,
(�) users of accommodation in Ohakune, (�) Ruapehu
Alpine Lifts employees, and (�) businesses in the region.
On these direct impacts, economic multipliers were
applied to calculate the indirect and induced impacts.
The Mt Ruapehu skifields account for around �0 per
cent of skifield business in New Zealand, and are two of
�8 skifields on public conservation land nationwide.
Mt Ruapehu skifieldsimpact on Ohakune and region
Jobs ����
Regional output $�9.�m
Skiing output $�6.5m
Total output $45.6m
��
Turoa skifield
Photo: Herb Christophers/DOC
Mt Ruapehu from Ohakune
Photo: Herb Christophers/DOC
�5
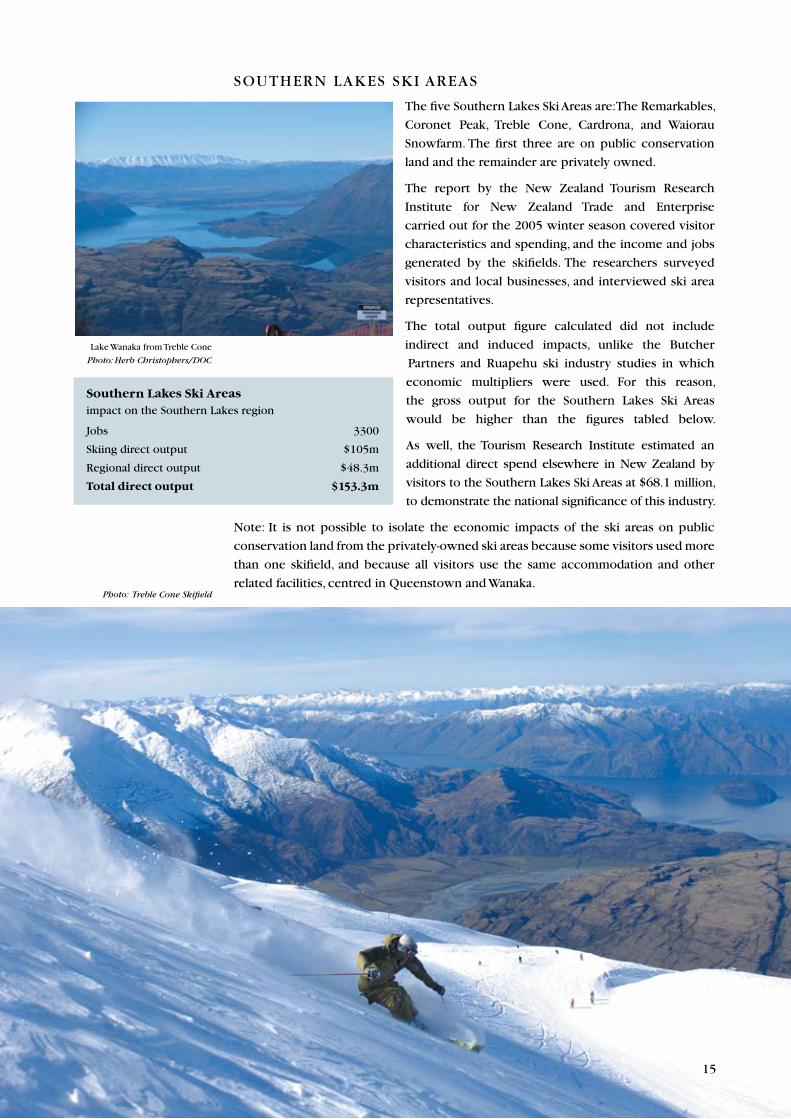
SOUTHERN LAKES SKI AREAS
The five Southern Lakes Ski Areas are: The Remarkables,
Coronet Peak, Treble Cone, Cardrona, and Waiorau
Snowfarm. The first three are on public conservation
land and the remainder are privately owned.
The report by the New Zealand Tourism Research
Institute for New Zealand Trade and Enterprise
carried out for the �005 winter season covered visitor
characteristics and spending, and the income and jobs
generated by the skifields. The researchers surveyed
visitors and local businesses, and interviewed ski area
representatives.
The total output figure calculated did not include
indirect and induced impacts, unlike the Butcher
Partners and Ruapehu ski industry studies in which
economic multipliers were used. For this reason,
the gross output for the Southern Lakes Ski Areas
would be higher than the figures tabled below.
As well, the Tourism Research Institute estimated an
additional direct spend elsewhere in New Zealand by
visitors to the Southern Lakes Ski Areas at $68.� million,
to demonstrate the national significance of this industry.
Note: It is not possible to isolate the economic impacts of the ski areas on public
conservation land from the privately-owned ski areas because some visitors used more
than one skifield, and because all visitors use the same accommodation and other
related facilities, centred in Queenstown and Wanaka.
Southern Lakes Ski Areasimpact on the Southern Lakes region
Jobs ��00
Skiing direct output $�05m
Regional direct output $�8.�m
Total direct output $153.3m
Photo: Treble Cone Skifield
Lake Wanaka from Treble Cone
Photo: Herb Christophers/DOC
�5
�6
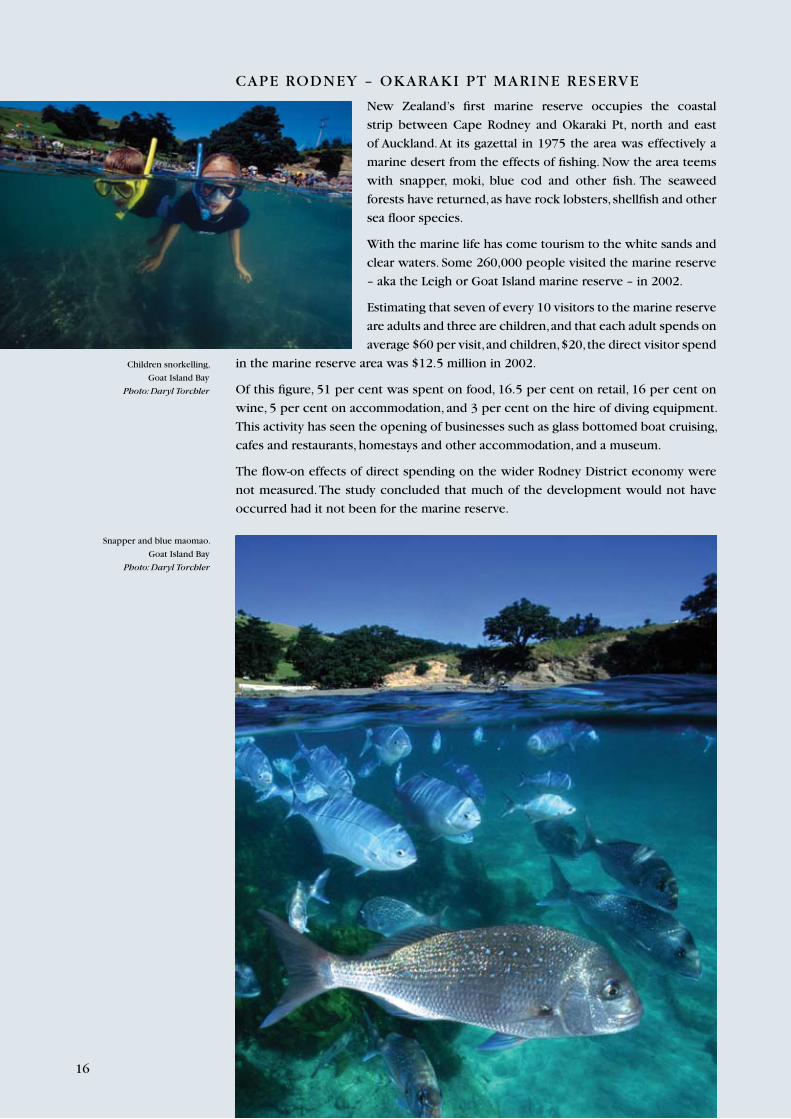
CAPE RODNEY – OKARAKI PT MARINE RESERVE
New Zealand’s first marine reserve occupies the coastal
strip between Cape Rodney and Okaraki Pt, north and east
of Auckland. At its gazettal in �975 the area was effectively a
marine desert from the effects of fishing. Now the area teems
with snapper, moki, blue cod and other fish. The seaweed
forests have returned, as have rock lobsters, shellfish and other
sea floor species.
With the marine life has come tourism to the white sands and
clear waters. Some �60,000 people visited the marine reserve
– aka the Leigh or Goat Island marine reserve – in �00�.
Estimating that seven of every �0 visitors to the marine reserve
are adults and three are children, and that each adult spends on
average $60 per visit, and children, $�0, the direct visitor spend
in the marine reserve area was $��.5 million in �00�.
Of this figure, 5� per cent was spent on food, �6.5 per cent on retail, �6 per cent on
wine, 5 per cent on accommodation, and � per cent on the hire of diving equipment.
This activity has seen the opening of businesses such as glass bottomed boat cruising,
cafes and restaurants, homestays and other accommodation, and a museum.
The flow-on effects of direct spending on the wider Rodney District economy were
not measured. The study concluded that much of the development would not have
occurred had it not been for the marine reserve.
�6
Children snorkelling,
Goat Island Bay
Photo: Daryl Torchler
Snapper and blue maomao.
Goat Island Bay
Photo: Daryl Torchler
�7�7
BACKGROUND ON “ECOSYSTEM SERVICES”
The air we breathe, the water we drink, the soils that sustain our
pastures, forestry, orchards and crops are examples of environmental
goods that benefit humans. Without them, life on Earth would be
impossible.
These goods – air, water and soil – arise from interactions between
living things, such as chemical reactions and mechanical processes.
Ecosystem processes that benefit humans are called “ecosystem
services”.
When fungi, worms and bacteria convert sunlight, carbon and nitrogen,
they provide an ecosystem service resulting in soil that farmers and
gardeners use. When the marine environment allows tuna, snapper,
hoki, squid and other commercial species to thrive, it is providing an
ecosystem service to the fishing industry.
Ecosystem services deriving from public conservation lands appear
in many forms:
Provisioning services
• Ecosystems and habitats that nurture fish and game, and other
species that are harvested, either commercially, for customary or
subsistence use, and/or for recreation.
• Ecosystems and habitats that provide opportunities for
bioprospecting.
• Ecosystems and habitats that provide resources for scientific
research.
• Ecosystems that provide fresh water for drinking, hydro and
irrigation.
Regulating services
• Ecosystems and habitats that may capture carbon and regulate the
effects of human-caused climate change.
• Vegetated catchments that regulate supply of water, mitigate
flooding, reduce erosion, and reduce the rates of silting up of
harbours and estuaries.
Supporting services
• Native bees, which are varroa bee-mite resistant, may provide
important pollination services for horticulture and pastoral
farming.
• High-biodiversity ecosystems and habitats, such as wetlands, that
provide nutrient recycling and environmental detoxification
services to improve aspects of the environment such as water
quality.
• Ecosystems – e.g. bacteria, flies, worms, fungi – that decompose
decaying organic matter into essential minerals and other resources
such as soil and purified water.
Cultural services
• Ecosystems and habitats that provide attractive places to visit for
recreation (e.g. tramping, mountain-biking, camping, sightseeing,
photography, snorkelling and diving), and for conservationists.
Tongariro River
Photo: Herb Christophers
Moke Lake, Central Otago
Photo: Dave Mitchell
�8
• Ecosystems and habitats in which people may pursue improved health and wellbeing,
and/or for spiritual and/or cultural purposes.
• Ecosystems, habitats and scenery that provide the backdrop to New Zealand’s clean,
green image, and draw overseas tourists and film-makers to New Zealand.
Ecosystem services are often taken for granted, because they are “free”, that is, not
traded directly in markets – unlike fish, vegetables and timber. The value to society of
ecosystem services becomes more apparent when:
• They are in decline – when air and water is polluted, when erosion and overgrazing
degrades soils, when deforested catchments lead to flooding in heavy rain, when
whitebait catches fall on the removal of wetlands and streams for farming.
• There are conflicting demands on use – between hydro companies, irrigators,
kayakers, anglers and rafting companies for river flows; between diving tourism
companies, recreational snorkelers and fishers for healthy marine environments.
In these situations, the ecosystem services are no longer free, but, in the absence of
markets and well-defined property rights it is unclear how they should best be man-
aged. Also, ecosystems are so complicated that it is impossible to reproduce them
artificially. Rather, humans impact on ecosystems, and in some cases the impacts are
irreversible. The more the ecosystems are modified, the simpler they are likely to be-
come and provide fewer services.
�8
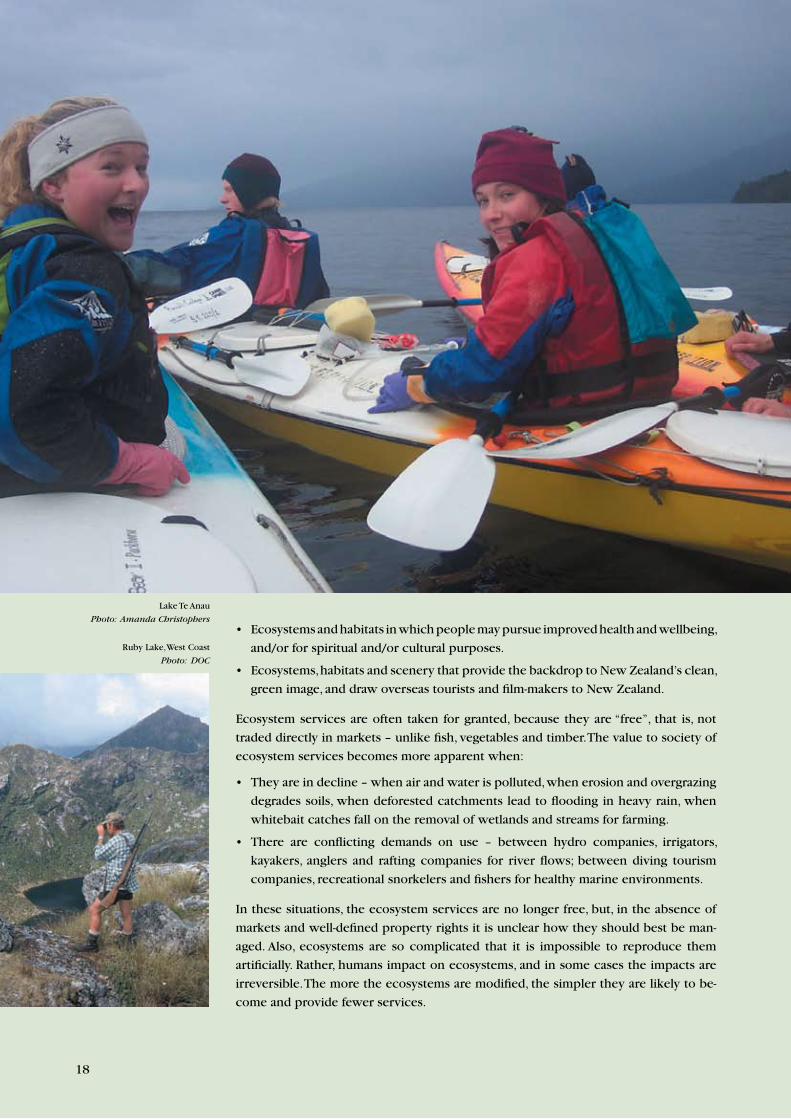
Lake Te Anau
Photo: Amanda Christophers
Ruby Lake, West Coast
Photo: DOC
�9
Conclusion
While the intrinsic values and recreation benefits of public conservation land are well
known, the economic and health benefits are assuming increasing significance.
Failure to appreciate non-market values such as ecosystem services carries a risk of
deterioration of natural capital in New Zealand, with consequences including increased
flood risk, reduced whitebait catches, impoverished tourism experience, and damage
to our clean, green image.
The first steps in preventing further decline in ecosystems (and the services they
provide) are to recognise that they have economic values, and to attempt to measure
at least some of them. Armed with this information, the Department hopes to make
better-informed conservation decisions, and increase public awareness of what is at
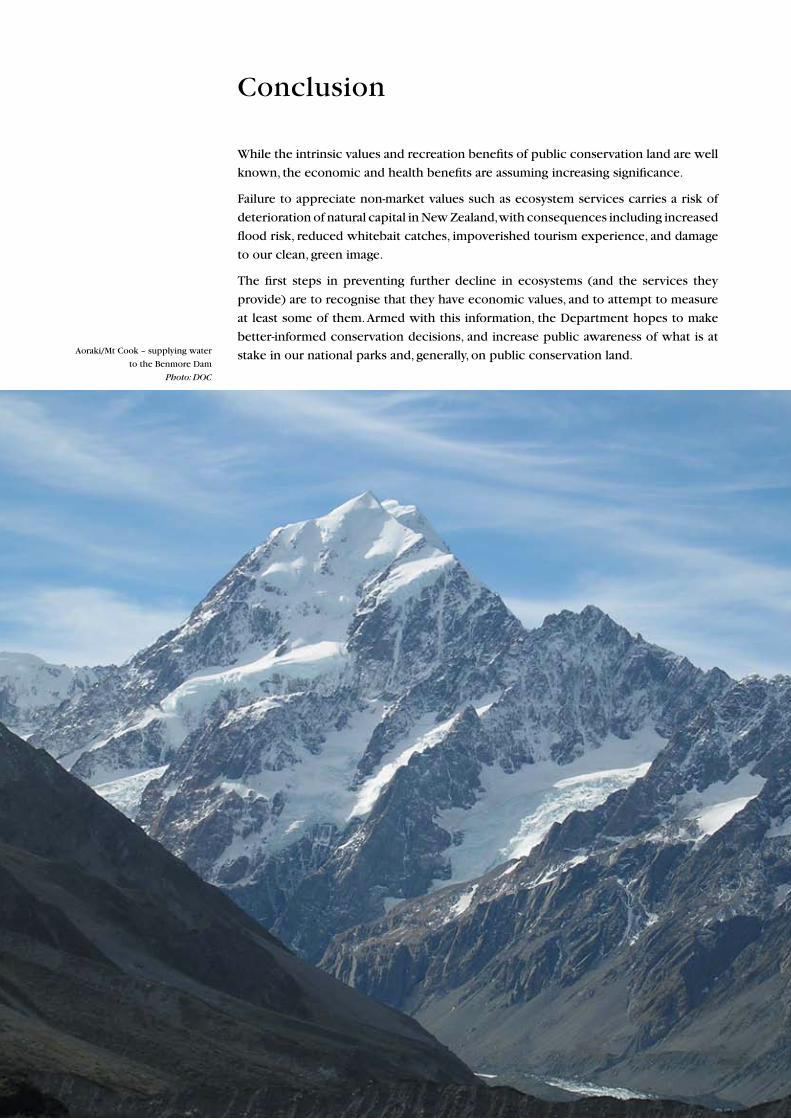
stake in our national parks and, generally, on public conservation land.Aoraki/Mt Cook – supplying water
to the Benmore Dam
Photo: DOC
�0Photo: Herb Christophers/DOC