Embed Size (px)
Citation preview
The value of e-assessment in interprofessional education and large student numbers
Melissa Owens*John Dermo*
Fiona MacVane Phipps
*Presenters
The Challenge
• Large cohort of approximately 350 students– Recognition of value of student-centred assessment– Linking the process of interprofessional learning to the
outcome through assessment (WHO 2009)• Desire to test student engagement as well as
knowledge
The Module
• 10 credit year one, level one module• One week of face2face contact involving lectures, small
group work and on-line activities using problem based learning (PBL) and problem based e-learning (PBeL)
• 8 weeks of on-line activities in small discussion groups using PBeL
• Final assessment by MCQ and Peer Assessment, both delivered electronically

Attributes of Electronic Multiple Choice Questionnaire (eMCQ)
• It is objective, rather than subjective• Can be used to test analytical skills• It is an efficient and valid method of assessing
large numbers of students in a short space of time
• Machine-graded, thus expedite results
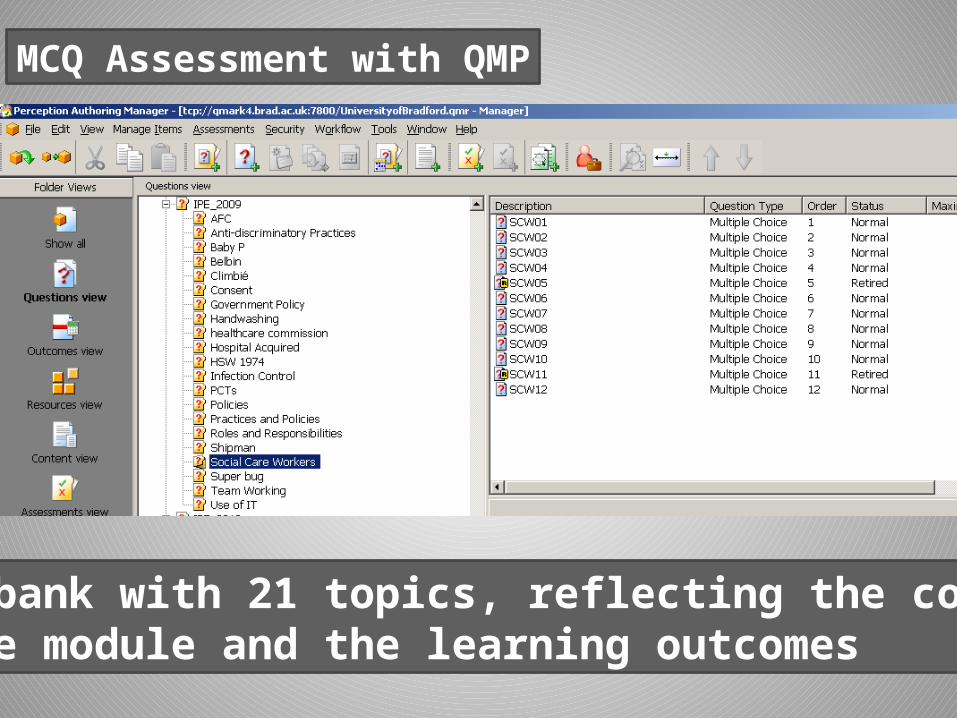
Item bank with 21 topics, reflecting the content of the module and the learning outcomes
MCQ Assessment with QMP
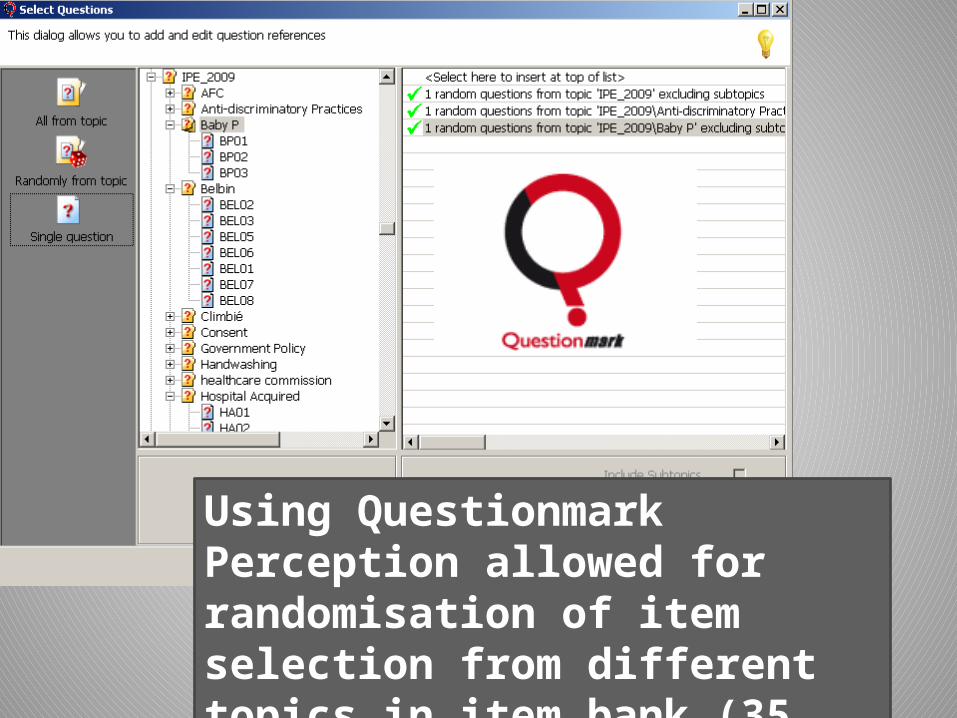
Using Questionmark Perception allowed for randomisation of item selection from different topics in item bank (35 questions from 21 topics)

In accordance with university regulations for e-assessment, students receive a mock practice test via the VLE before the real test:same format and layout, just shorter
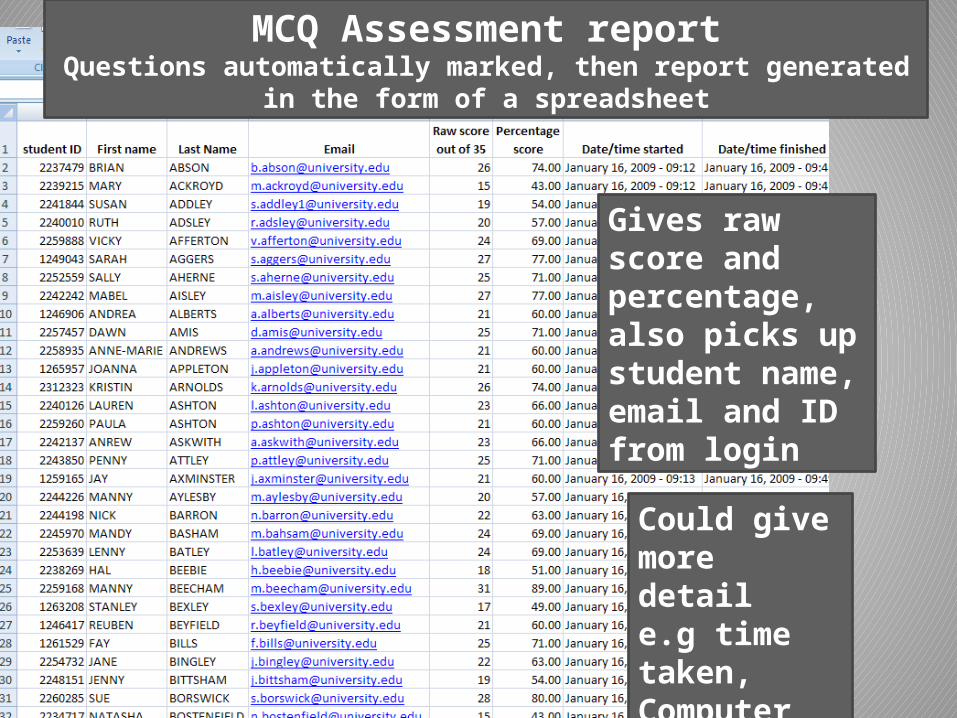
MCQ Assessment reportQuestions automatically marked, then report generated in the form of a
spreadsheet
Gives raw score and percentage, also picks up student name, email and ID from login
Could give more detail e.g time taken, Computer ID
Delivery of Exam
•3 sittings of one hour each for both components •Computer suites used•Allow for 10% computer failure
Attributes of Electronic Peer Assessment
• It is readily deliverable and the results can be speedily collated
• Enables students to better judge the quality of their work and that of others
• A skill that students develop over time• What is being valued?
– Tutor or student perceptions?
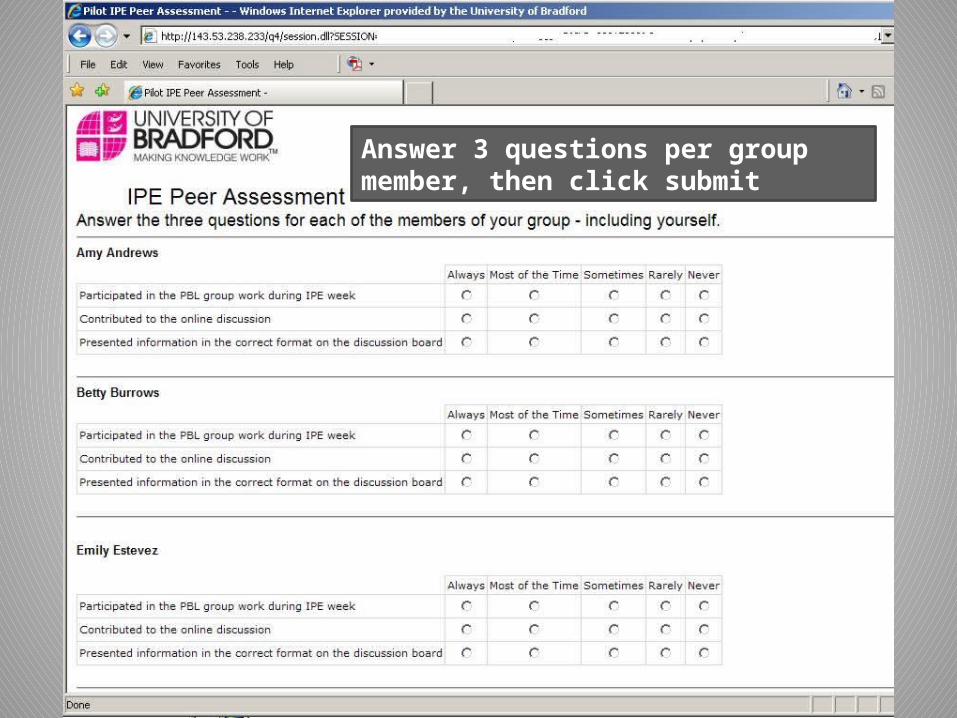
Answer 3 questions per group member, then click submit

Links from the webpage where the online exam had been delivered
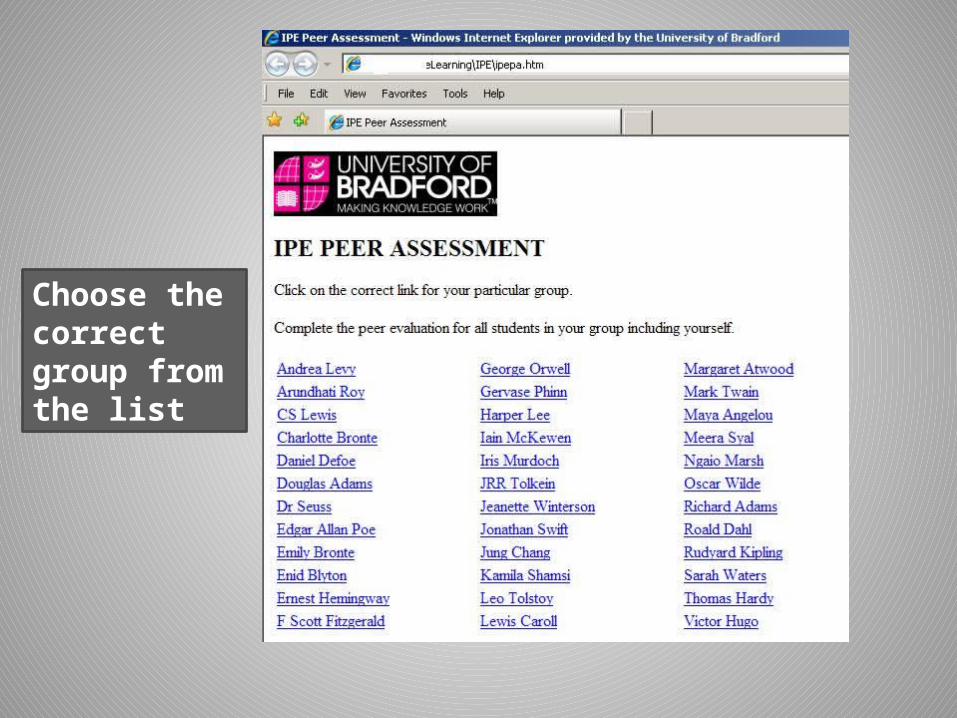
Choose the correct group from the list
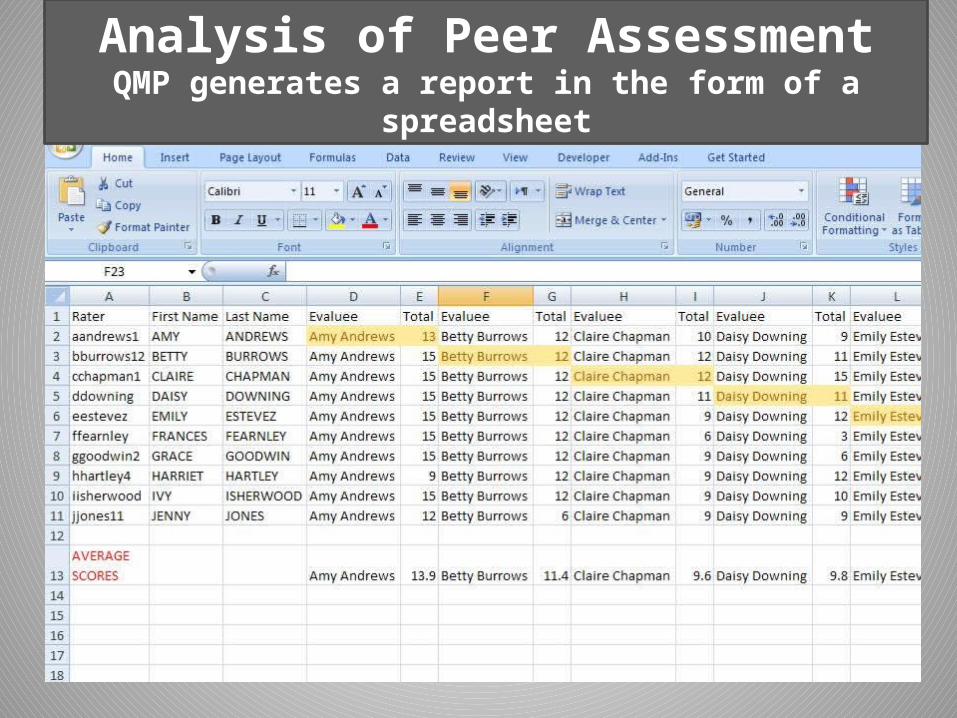
Analysis of Peer AssessmentQMP generates a report in the form of a spreadsheet
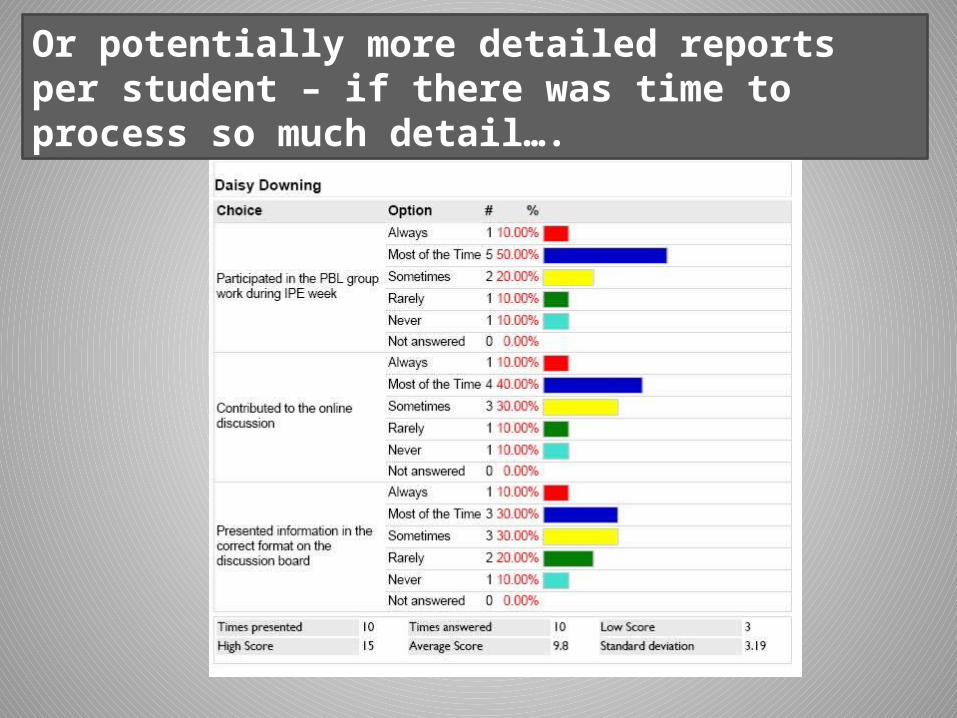
Or potentially more detailed reports per student – if there was time to process so much detail….
Score (out of 35)35302520151050
Nu
mb
er o
f st
ud
ents
50
40
30
20
10
0
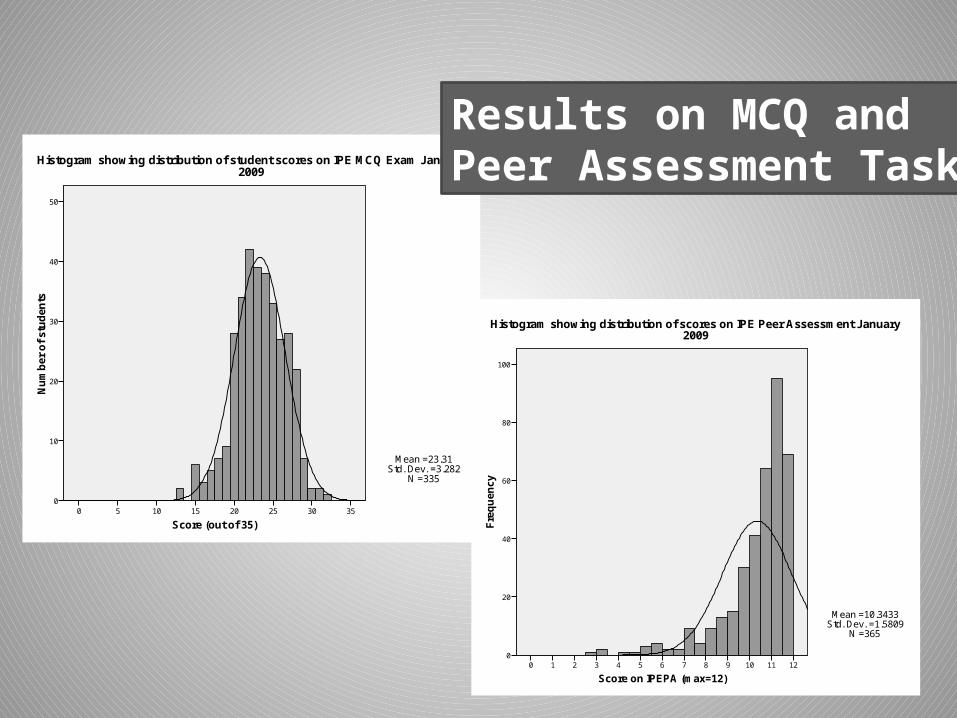
Mean =23.31Std. Dev. =3.282
N =335
Histogram showing distribution of student scores on IPE MCQ Exam January 2009
Score on IPEPA (max=12)1211109876543210
Fre
qu
ency
100
80
60
40
20
0
Mean =10.3433Std. Dev. =1.5809
N =365
Histogram showing distribution of scores on IPE Peer Assessment January 2009
Results on MCQ and Peer Assessment Tasks
4 5 6 7 8 9 10 11 120
5
10
15
20
25
30
35
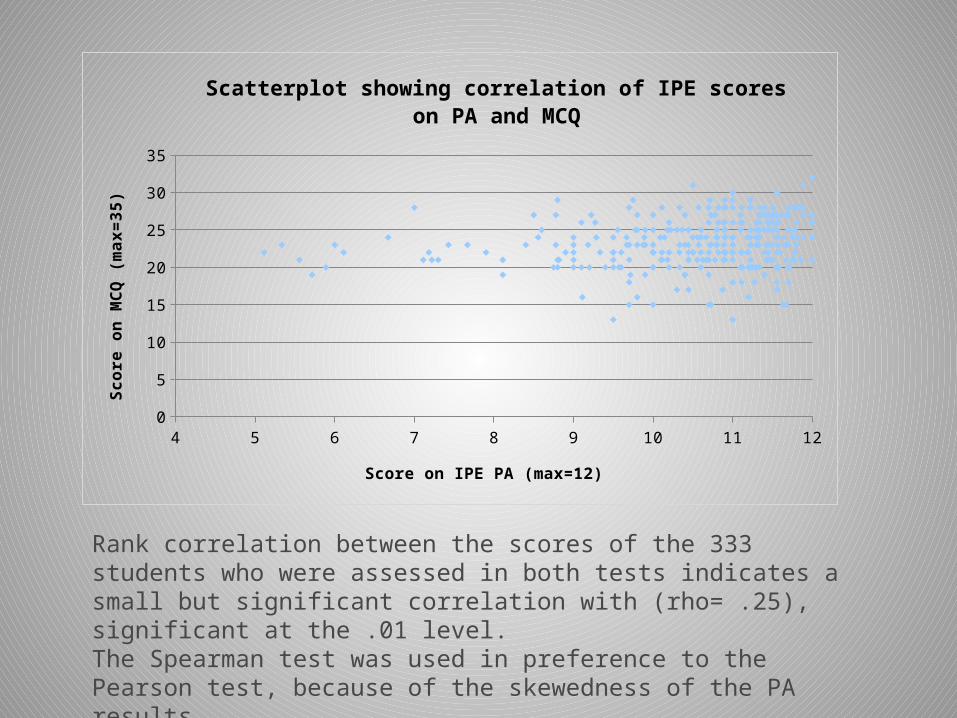
Scatterplot showing correlation of IPE scores on PA and MCQ
Score on IPE PA (max=12)
Scor
e on
MCQ
(max
=35)
Rank correlation between the scores of the 333 students who were assessed in both tests indicates a small but significant correlation with (rho= .25), significant at the .01 level. The Spearman test was used in preference to the Pearson test, because of the skewedness of the PA results

• Ensure the tests are as reliable and fair as possible• QMP reporting tools provide a wealth of data which enables instructors to analyse the performance of each item, including how each distracter performs• This enables improvements to the bank to be made from one assessment period to the next
Item Analysis
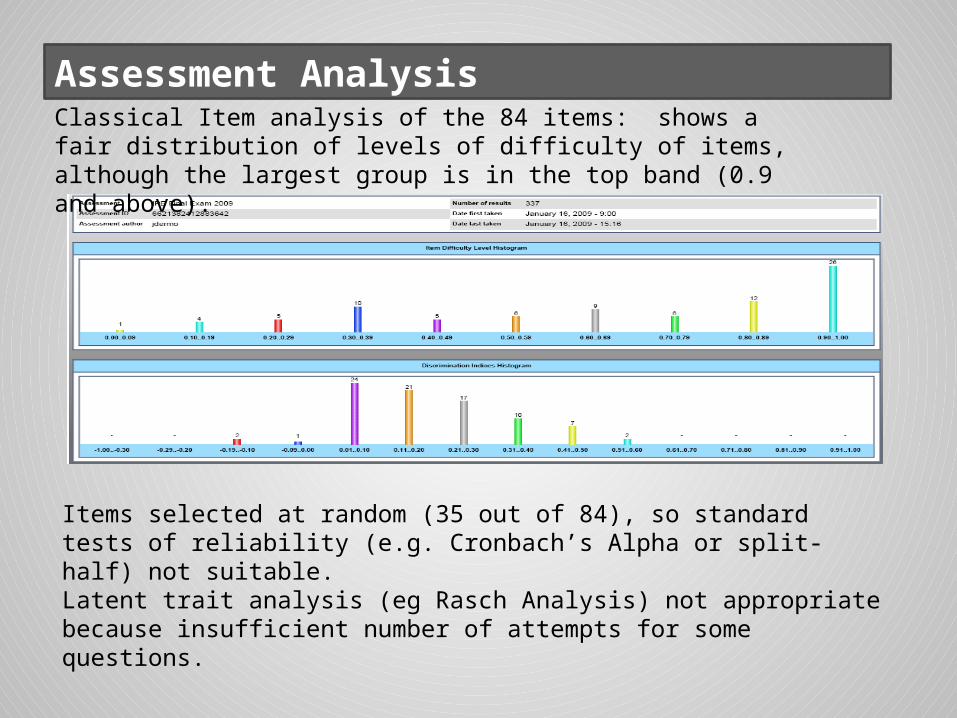
Classical Item analysis of the 84 items: shows a fair distribution of levels of difficulty of items, although the largest group is in the top band (0.9 and above).
Items selected at random (35 out of 84), so standard tests of reliability (e.g. Cronbach’s Alpha or split-half) not suitable. Latent trait analysis (eg Rasch Analysis) not appropriate because insufficient number of attempts for some questions.
Assessment Analysis
Conclusions
• Combining methods of assessment advantages a greater number of students
• Combining methods of assessment enables multidimensional testing to occur
• Preparation is time consuming. Results can be expedited speedily
• Use of QMP enables statistical analysis of MCQs to occur and enhance validity over time
• Use of QMP enabled large numbers of students to peer assess
• There was a small but significant correlation between level of achievement in MCQ and in Peer Assessment