Embed Size (px)
Citation preview
The Value of International Patent Rights
Jonathan Putnam'
February 3, 1997
'Charles River Associates. This paper benefitted from comments by Ashish Arora, Robert Evenmn,
Brian Fikkert. Sam Kortum, Jenny Lanjouw, Josh Lerner, and Ariel Pakes. I am grateful to Derwent Ltd.
fur graciously providing the data used in this study. I received critical support from the National Science
Foundation, the hlellon Foundation, the Yale Center for International and Area Studies, and the Julius Silver
Program in Law, Science and Technology at Columbia University. Errors are mine.
Abstract
I study an inventor's decision to file for patent protection in each of an arbitrary set of countries, as a means of
estimating the global value of patent rights, and the distribution from which patented inventions are drawn.
Using oversampled, invention-level data from the 1974 international patent cohort, I estimate a random-
coefficient, multinomial probit model for the 18 leading patenting countries. The Monte Carlo simulation
results are consistent with those of patent renewal models, except in the right tail of the distribution, where
the international model imputes significantly more value (up to $50 million worldwide) to the most valuable
iuventions. The international component of annual capitalized patent returns alone represents over $14
hillion in 1974 dollars, or about 21% of annual private business R&D in the countries under investigation.
The average internationally protected patented invention generates about $245,000 in patent rights, with
over half the total value captured by the top 5% of inventions. With the exception of Japan, the largest
developed countries appear to grant more value in patent rights at home than they hold abroad.
Keywords: patent, technology, trade, valuation, renewal, multinomial probit, discrete choice, sam-
ple selection
1 Introduction
When an inventor makes an invention, we commonly refer to it independently of its economic and
institutional circumstances: Edison invented "the" light bulb; Salk discovered "the" polio vaccine.
In formal economics, it is standard practice to note that additional investments may be required to
adapt or improve an invention to suit local biological conditions or factor prices,1 as in the case of
hvbrid plant varieties or this winter's flu shot. In the absence of such investments, however, formal
economics also treats an invention (though of course not its value) without reference to its location
or the state of nature.
The same cannot be said, however, of the property right that is most commonly used as an
invention indicator, i.e., a patent. A patent grants the right to exclude others within the granting
,jurisdiction from making, using or selling an invention. Typically, however, the scope of this right
varies, both systematically and stochastically, between countries. Some countries, for example,
forbid patent protection for medical products. More generally, the definition of an "equivalent"
invention, and therefore the boundaries of permissible imitation, has evolved through the quasi-
independent legislative, judicial, and technological histories of each countv. Thus, holding an
invention's technological definition constant, its legal definition-its claims and their interpretation,
its sphere of exclusion, the efficacy of its disclosure, even its probability of issueshifts with a
change in jurisdiction. For this reason, and apart from dserences in market size and competitive
conditions, the value of holding a patent right on the "same" invention varies from country to
country.
While counting patents as indicators of technological change has a long, if somewhat unsatis-
fying,' history, efforts to value them remain novel and relatively uncommon. Pakes and Schanker-
man (1984) made the key observation that, like R&D itself, patenting is an optimizing process,
'The classic exposition of this point is Fei and Raois (1964). ' ~ f . Griliches's review (1990) and his epigraphic conversation "overheard in a Catsldlls resort: 'The food here is
terrible.' 'Yes, and the portions are so small.' "
rather than simply an unobserved "propensity" (Scherer 1983). Pakes and Schankerman estimated
a model of the decision to renew patent protection in a country that requires the patentee to pay
an increasing annual fee to keep his rights in force. Subsequent work by Schankerman and Pakes
(1986), Pakes (1986), Pakes and Simpson (1989), Schankerman (1991) and Lanjouw (1993) has re-
fined and generalized the original optimizing model, to allow for more general returns distributions
and to compare the behavior of patentees across countries and technolow groups.3
Though differing in their approach to an inventor's learning during an invention's early years and
in the data employed, these studies share two important features. First, they implicitly condition
on the filing of an application. That is, the filing cost-typically the first and most expensive
part of obtaining patent protection-is assumed sunk in these models, and therefore does not
influence the value distribution. This assumption generates an inconsistency, in that the capitalized
value of simulated patent returns may fdl short of the cost of 6ling; depending on the model and
dataset employed, this inconsistency can d i c t up to 20% of the patents in the left tail of the value
di~tribution.~ Second, each study models the value of patent rights in asingle country. In comparing
the value of patent rights across countries, these studies implicitly treat the value distributions as
independent, and abstract from differences in market size, patent system "strength," or other
economic and institutional factor^.^ 3See Lanjouw, Pakes and Putnam (1996) for a review of these models and an evaluation of their utility in policy
and other applied settings. ' ~ o d e l s that permit re turn to evolve stochesticdy sometimes avoid this inconsistency, in the sense that the
expected value of f i g is greater than the cost, conditional on information available at the t i e the cost is incurred.
For example, in Lanjouw (1993), the applicant is assumed to know nothing about the value of his particular invention
a t the time of filing, and therefore Ida expected value of filing is the unconditional mean of the distribution. On the
other hand, in P& (1986), the applicant receives an initial draw that determines the conditional evolution of returns
and therefore the conditional expected value of Wug, which need not be greater than the Wng cost. The imposition
of a filing fee in his model would have increased the hazard of obsolescence: the large number of early dropouts would
have to have been explained by an i n c r e d likelihood that a patent drawing an initial return su5cient to cover the
filing cost would ultimately prove worthless. 'Schankerman and Pakes (1986) compare trends in national GDP over time with change4 in the value distribution
for the U.K., France and Germany. Schankerman (1991) takes into account the cross-cohort effect of the 1970s oil
These features have some limitations. Conditioning inference on the observation of a patent
has been a main objection to the use of patent statistics for decades (Griliches 1990). This form of
sample selection is actually only one of a number of selection mechanisms that skew the conclusions
drawn from patent counts, particularly when international comparisons are made. Most inventions
are not patented in every country, so the use of patent counts from anv one country is misleading.
A related point is that foreign filing choices are not made from the same information set as domestic
filings, so comparisons even within a single country are biased. The United States keeps rejected
applications secret, so U.S.-oriented researchen observe only that fraction of filings that the patent
office deems to be worthy of grant, which is a subset of all those that had private value ex ante. On
the other hand, many other countries allow the inventor to delay the patent office's grant decision
for several years after filing, with the result that a much larger fraction of applications-all of which
are observed-fail to mature into patents than in the U.S. Thus, the various selection mechanisms
afflict not only optimizing models, but even simple patent counts.
The demand for an international dimension to economic patent analysis has been articulated
bv economists and policymakers for over 40 years. Penrose (1951) was perhaps the first to point
out systematically the possibility that the international patent system operated to the detriment
of countries with large markets but poor prospects for inventing. With the creation by the U.S.
of a "watch list" of countries that may be threatened with sanctions for inadequate protection of
intellectual property rights (e.g., USITC 1988), and the incorporation intellectual property rights
into the most recent GATT round, the North-South patent debate has intensified recently, at least
in the theoretical and policy l i te ra t~res .~ On the empirical side, however, Raymond Vernon's study
for the U.S. government prior to an earlier attempt at international consensus remains apt today:
shocks on patent values in France. Lanjouw (1993) simulates the effects of various policy changes on the patent value
distribution for several German technology sectors. 'See e.g. Chin and Grossman (1990), Diwan and Rodrik (1991). Deardorff (1992), and Helpman (1993). Benko
(1987) and Gadbaw and Richards (1988) are North-oriented reviews of the debate; Lesser et al. (1989), Primo Braga
(1989) and Siebeck et al. (1990) include the South's perspective in their reviews.
But the resolution of issues does not always wait on data. The 1957 Lisbon meeting will
reach its decisions to modify the international patent system, with or without facts.7
As an initial effort to provide basic data on international patenting patterns, the World Intel-
lectual Property Organization has published data on patent counts by source and granting country,
in total and for some technology subaggregates, since the 1970s. Evenson (1984) analyzes these
data and finds the source of inventions concentrated in the top five countries; except for the U.S.,
almost all countries grant more patents to foreigners than to their own citizens. An early effort
to explain the pairwise flow of patents, in a manner analogous to explaining export patterns, is
found in the gravity-equation model of Slarna (1981). Slama concluded that both market size and
distance were significant determinants of patent activity, as they are for exports. Recently, Eaton
et al. (1996) consider technology-specific explanations for variation in the flows of patents b e e n
countries, finding systematic differences in the mobility of technologies between countries. Eaton
and Kortum (1996a, 1996b) also employ patent flows.in a structural model of the effects of R&D,
patenting and imitation on the growth of.productivity among OECD countries. They find that the
inflow of inventions from abroad explains a significant fraction of observed productivity growth in
almost all countries. Each of these studies, however, employs the pairwise flow of patent rights as
the unit of observation, analogous to trade in physical goods. In addition to ignoring the statistical
and economic dependence of these flows, which is rooted in a common set of originating inventions,
this specification does not make use of information embodied in the highly heterogeneous patterns
of protection sought by different inventors. Not surprisingly, pairwise studies are also open to the
criticism that they fail to count patents properly, because a patent document means different things
in different countries.
It is this heterogeneity-both in national patent systems and in international filing choices-
that I exploit in the present paper. The most important feature distinguishing this paper from
earlier efforts is the explicit decomposition of the inventor's returns into components that remain
'The International Patent System and Foreign Policy, United State4 Senate Subcommittee on Patents and Trade-
marks (1957)
constant across national boundaries, reflecting the intrinsic economic quality of the invention, and
components that var,v both systematically and stochastically bv country This decomposition c a p
tures the decision process of an inventor who, having invested in R&D and made an invention in
a particular country, must recoup his investment from the opportunities afforded by the world's
various intellectual property regimes and market circumstances. By conditioning on market size,
and allowing for country-specific opportunities that are observed by the inventor but not the econo-
metrician, we can identify not only the expected contribution of each country's institutional regime,
but also the parameters of the world's underlying invention quality distribution. This identification
is achieved using only the inventor's binary choice to file for patent protection.
Taking an international, cross-sectional approach to patent valuation yields several other im-
mediate benefits:
1. It enables comparison of the level of national R&D expenditures with each nation's worldwide
returns to patent protection, shedding light on the patent system's contribution to appropri-
ating returns to R&D.
2. It provides a quantitative answer to the question, Which countries benefit most from the
international patent system?
3. It offers more precise information about the right tail of the quality distribution, where most
of the value is concentrated, because only a tiny fraction of all inventions are patented in all
countries.
4. Because i t treats an observed application as coming from a truncated distribution, it also
sheds light on the left tail of the distribution, i.e., on those inventions that are not patented
due to the cost of patenting.
5. It facilitates the construqtion of firm-level time series, because each invention contributes
an observation for each possible country in which it could be patented, greatly increasing
efficiency.
The present study makes use of a dataset that, while not previously employed in econometric
work, is widely available and extends back in some fields as far as 1963. It is, however, relatively
costlv to access for samples of the size that applied researchers typically require. For this among
other reasons, I also implement an oversampling strategy that increases the information obtainable
from a given number of inventions.
There are two principal tradeoffs involved in taking an international approach, apart from the
cost of the data.8 The first is the absenceat least in the present model-of renewal, or any other
time-varying, data on the patents, with which to bound the implied returns sequences. Second,
the institutional differences in national patent systems substantially increase the complexity of
both the applicant's decision problem and the data generating process, which in turn increase the
complexity of the model, relative to single-country models. While I attempt to justify the particular
modeling decisions made based on the data and computational considerations, these are open to
further refinement and generalization.
Before laying out the model itself, I describe the institutional and legal regimes that generate
the data, in Section 2. Section 3 introduces the data themselves: the 1974 invention cohort.
These sections provide the reader with important background for the modeling choices presented
in Section 4. Sections on estimation results and their robustness ( 5 ) , and a comparison of Monte
Carlo simulations with the data and with earlier work (6) follow. In the final section I offer a
critical evaluation of the model's performance and outline a program of further research.
'To be fair, patent renewal data are typically wen more costly to gather, on an inventio~by-invention basis. The
data employed in Pakes and Schankerman (1984), Schankerman and Pakes (1986) and Pakes (1986) were aggregated
over all inventions and by the national patent offices in the countries they studied. The data used in Pakes
and Simpson (1989), Lanjouw (1993) and Putnam (19'91) were collected manually; the patent office4 waived the usual
per-patent fees.
2 The Patent System as a Data Generating Process
At its most intuitive level, the patent system functions as a screening device: only new, non-trivial
inventions are patentable. We might hope, therefore, that by counting patents we could obtain
at least rough indices of technological change, without constructing R&D "stocks" or otherwise
confronting the problems posed by total factor productivity estimation. Unfortunately, the resulting
indices turn out to be so rough that they may fail to convey any new information, and in fact
may badly mislead. Both temporal and cross-sectional problems arise in constructing these indices.
Because both patent renewal models and the model presented in Section 4 try to extract information
from the byproducts of the screening process, it helps to understand the basics of that process in
order to evaluate each model's strengths and weaknesses.
2.1 National and International Rules
Temporally, the filtering process operates through a dynamic, non-market feedback loop among
the patent office, the inventor, and rival inventors. The date that defines the information set
against which an application will be judged is the date of filing the application. Following this
date, the applicant may accumulate significant additional information, from his own labs, from
the marketplace, and from the patent office. One frequent consequence of his learning is that he
abandons his application rather than continue to incur legal and administrative fees. The patented
inventions that survive examination constitute a highly selected, highly heterogeneous set.
Cross-sectionally, the patent screening process differs markedly across countries. In the U.S.
and Canada, a patent application is published only if it is granted; otherwise its contents and
existence are kept secret. Once the patent is granted, the inventor begins a 17-year period during
which he may exclude others from "making, using or selling" the invention. No further fees are
required; naturally, this precludes the use of renewal models in these co~nt r ies .~ Although the
'Both the U.S. and Canada began to require renewal fees in the mid-1980s; the model developed below employs
observed inventions are quite heterogeneous in quality, there is nothing, economically speaking, to
distinguish one granted patent from another.1°
The patent screening process affords different windows in other countries. In most countries,
all patent applications are published, 18 months after filing, independent of the patent office's
decision to accept or reject them. In many countries, the applications are published again if and
when they are granted, to reflect any changes, such as withdrawing some claims or augmenting
the disclosure, that may have been required by the patent office. This process implies that both
"failures" and "successes" are observed--events that might, in principle, be explained. In some
countries, notably Germany and Japan, a separate, optional fee is required in order to initiate
formal examination proceedings, with the inventor having up to seven years to decide whether to
request examination. After allowance by the patent office, some countries permit formal opposition
lo the allowed application by any interested party, before the patent is actually granted. Following
the grant, most countries require that the patentee continue to pay increasing annual renewal fees
in order to keep the patent alive. All of these events are observable, all require the payment of a
known fee in order to proceed to the next stage, and all provide discrete occasions for the applicant
to abandon his rights. Thus, the "screening" that occurs also reflects endogenous choices by the
applicant, which are more readily observed in other countries than in the U.S. The diversity of
practice around the world implies a corresponding diversity in optimal responses during the patent
prosecution period, which has further stymied efforts to draw meaningful inferences directly from
international comparisons of observed "patent" counts.
The "international patent system," which essentially consists of the provisions of the Paris
data from 1974, however, which were grandfathered into the pre-renewal-fee regime. At this writing, the U.S. is in
the process of changing its patent term from 17 years after grant to 20 years after application, which is the standard
in most of Europe and Japan. "For these reasons, U.3.-oriented researchers have been Limited to the inference that all the economic information
contained in a patent exists in the fact of its having been granted: because only granted patents are observed, this
fact cannot be econometrically "explained." Instead, empirical researchers have counted patents, treating counts
endogenously or exogenously depending on the focus of their study.
Convention. imposes a bit of further structure in both the temporal and cross-sectional dimensions.
Temporally, the Paris Convention imposes a one-year limit for filing foreign applications after the
initial filing date, if they are to retain that date as the reference point against which their invention
will be ,judged. The initial filing becomes the "priority filing," and the date it was filed the "priority
date." Applications filed in another signatory country of the Paris Convention before the one-
year deadline retain the "priority" of the initial application, i.e., they are judged in the queue of
applications against the state of the art prevailing on the priority date rather than their actual
filing date in the signatory country. This latitude allowed under the Paris Convention removes the
major cost of delay in filing (foreign) patent applications: the risk of losing the race to the patent
office.
Cross-sectionally, Convention rules require a policy of non-discrimination: whatever the coun-
try's patent rules (about which the Convention makes minimal stipulations), they must
apply equally to domestic and foreign inventors." The level procedural field, coupled with the
transactions costs of foreign filing (e.g., mandatory translation of the application) generally imply
that domestic filing is cheaper.''
Costless delay for foreign applications, the policy of non-discrimination as between 'foreign and
domestic inventors, and the high cost of filing abroad, help to explain two empirical regularities:
(1) most priority patent applications are filed in the inventor's home country;13 (2) among the
he European Patent OEce, which began issuing patents in 1978, administers a single examination procedure
valid in all designated countries, but leaves enforcement of the resulting patent rights to member countries. (In
addition to application and examination fees, the applicant pays a fee according to the number of European countries
in which he seeh protection; the additional complexity implied by the EPO's application fee schedule is another
reason to restrict the model initially t o the pre-1978 regime.) " ~ u t n a m (1996) develops a model that explains the choice of priority country by the dynamics introduced under
the one-year Paris Convention rule. Because delay is costles.1, the applicant's initial filing may show negative returns,
net of the cost of fling, with probability 1. ''while these statements are generally true, there are exceptions. Data from the U.S., 197595, show that about
98% of all inventions whose 6mt inventor resides in the U.S. are a h fled first in the U.S. In this dataset, the
percentage of inventors 6ling first in their home country ranges downward to just under 90% for the major European
inventions for which foreign applications are also filed, the vast majority of foreign applications are
not filed until the one-,year anniversary of the home countv (prioritv) filing. Together, these two
regularities foreshadow another important feature of the data: (3) the large majority of inventions
are protected only in their home country.
Patent offices do not grant patents based on their economic value, but on their technical merit.'*
Overall, this distinction is useful, because it keeps subjective claims of private value from contarni-
nating the objective determination of non-trivially new technology. Unfortunately, it is the lack of
correlation between technical merit and private value that complicates the formulation of patent
policv, as well a s the valuation of patent rights.15,16 Because the patent office rewards technical
countries, 70-80% in the minor European countries, and about 25% in Belgium and Canada. Unfortunately, in the
data to be analyzed below the inventor's country of residence is not identified. "Over time, U.S. courts have come to accept certain Ysecandary factors" ar indirect evidence of the technical
merit of an invention (beginning with Gmhom v. John D e m , 383 U.S. 1 (1966)). Some of these, such as 'long-felt
need" and "commercial success," are explicitly demand-related; others, such as "evidence of the failure of others" and
'.acquiescence" [by rivala to the patent right] depend on supply choices. Explicit market considerations are generally
introduced only in subsequent litigation, in defenie of a patent's validity, rather than during the application process. "There are varied reasons for the imperfect correlation between private value and technical merit. (1) Patent
rights are specific assets, for which markets are thin and transactions cads are high, and so have value that depends
in general on their owner (Teece 1986). (2) Successhl inventions are often complementary; a technically superior
product, isolated from a feasible manufacturing process, has Little private value. (3) Perhaps mwt importantly, the
value of a patent right depends, not only on the market conditions that determine the profitability of the invention,
but on the ability of the patentee to claim exclusive use of the information he has discovered and must disclose. This
ability depends on both the state of related arts and on the inventor's awareness of his invention's permutations.
Particularly with breakthrough inventions, an inventor has imperfect information at the time of filing about how
best to claim uses of his new dkmeq' . As a result, inventions with great technical merit may yield relatively low
economic value, as the new information disseminates and opportunistic imitators (who may have complementary
private information) exploit interstices in the claims. ''At one extreme, a putative "patent right" would be very d u a b l e even if it diaclased no new information (e.g..
it simply claimed the same device claimed by another patent, creating a "duopoly"); at the other, an application
that disclosed important technical information, but that failed to claim any patentable device, would fail to provide
any pounds for market exclusion (e.g., it simply diclosed the results of a scientific experiment). Between these
extremes, neither of which would issue as a panted patent, lies a vast territory where the economic value and the
merit rather than private value, it may reject applications that have positive private value. In most
cases, the g~ounds for rejection are "insufficient merit" (in legal terms, both novel and non-obvious).
Applications may also fail to mature into patents for many other reasons, such as better infor-
mation about their true private value. Because we will eventually wish to compare the capitalized
value of expected patent returns with the cost of filing, and because we have no information on the
applicant's valuation of returns subsequent to his filing decision, we may ask the basic question,
Do patent returns start on the filing date, or the grant date? Perhaps even more than most capital
goods, intangible property generates rents that are difficult to identify with any particular flow
of cash.17 There is little evidence, or even conceptual agreement, on what constitutes a "current
return" to patent protection, so the Bellrnan-type separability of the value function into current r e
turns and an option on future returns rests almost entirely on the specification and assumptions of
the model, rather than on data. Putnam (1996) investigates the issue in more depth; his principal
conclusions are that patent returns actually comprise several distinct components, whose onsets
cannot be observed:
1 . Returns to search. The applicant need not be fully informed about the state of the art,
nor about his invention's relative novelty. Filing an application is one (depending on the
fee, government-subsidized) way of becoming fully informed, but this investment may never
generate returns to patent protection per se. In fact, a fully informed applicant might never
have filed the application.
2 . Returns to signalling. In some countries (the U.S.), a patent application has no legal effect. In
particular, the patentee cannot recover damages for infringement during pendency; in other
countries (e.g., Germany), some recovery is possible. A pending application has at least one
real effect, however, that may generate current returns: it is a credible signal of research
technical merit of a grantable application may vary almost independently, and occasionally (because of the "creative
destruction'' (Schumpeter 194'7; Caballero and J d e 1993) c a d by the disclcaure) inversely. "For example, most firm do not report the capitalized value of their patent returns as an asset on their balance
sheets (although income from licensing is reported on their income statements).
success. This mav affect the firm's abilitv to raise capital, for example, or induce additional
spending by rivals, thereby raising their costs.
3. Returns t o delay. In the U.S., examination is automatic; its cost is included in the application
fee, and a final decision is typically rendered within three years. In Japan and Germany, the
applicant may delay requesting examination up to seven years while he accumulates additional
information; as previously noted, he may be eligible for patent damages during the pendency
interval. In general, we would be mistaken to conclude that a patent granted in the U.S.
(sav) must generate current returns, particularly if we were to observe that it was eventually
abandoned without examination in other markets where the applicant had filed.18
Thus, the receipt of a granted patent is neither necessary nor sufficient for realizing returns. A
model that ignores renewal data in computing capitalized ez ante asset values has the advantage
of abstracting from most of these temporal issues in comparing the present value of the optzon on
future returns-all unrealized on the filing date--with the cost of filing. Even though we observe
the date of grant in the dataset, we cannot identify the commencement of returns with this date, or
with any other observable date. Inevitably, a degree of arbitrariness must accompany any blanket
assumption. I illustrate the effects of changing assumptions about when returns start for a given
renewal fee schedule and depreciation rate in the next section.
"For similar re&so1m, one cannot rely on the ratio of grants to applications as an index of the stringency of
examination. from which one might infer the quality of information possessed by each patent office.
3 The 1974 International Patent Application Cohort
The data discussed in this section were selected &om Denvent Ltd.'s World Patent I n f o m a t i o n
online database. The data were chosen so that their priority application was filed in 197.1; this was
the first year that Derwent covered all t e c h n ~ l o ~ i e s . ' ~ ~ In 1974, Derwent effectively monitored 24
national patent offices. Among these, the relevant application, renewal, translation and legal fees
could be obtained for 18."
A tvpical database entry records the patentee, various technological classifications (both the
standard International Patent Classification codeszZ and proprietary Derwent codes), and various
document numbers corresponding to applications and publications (which comprise both unexarn-
ined applications and granted patents, depending on the country). There is thus some temporal
information implicitly available, in the sense that the final status of some applications can be
tracked. In order to simplify the analysis, I only recorded the publication of a document as an
"~erwent's data collection began in 1963, coyering agricultural chemicals in 11 countries, expanding in 1965 to
pharmaceuticals and in 1970 to all chemical inventions. The only omission from the expansion to all technologies in
1974 is Japanese electronic inventions, which were not included apparently due to their sheer volume. ''The year 1974 is a h the latest cohort (as of 1995) for which complete renewal data might be observed, given
the 2C-yeerr+from-filing patent lifetime available in mast countries, plus the oneyear delay permitted under the Paris
Convention. Unfortunately, renewal data are not available from Dement. Their eventual collection and incorporation
into the model remains the subject of future research. "Countries covered by Derwent hut omitted h m this study include the former Soviet Union (which published
about 35.000 applications in 1974), the former East Germany (7,000). Brazil (6,700) the former Czechoslovakia
(6,0001, Romania (1,600) and Israel (1,400). With the exception of East Germany, the former Soviet bloc countries
were not significant sources or targets of patenting activity for the West. Intrbbloc patenting among these countries
was fairly common, however. "1t is both helpful and interesting to reclsssify patents by their industrial, as opposed to technological, .classification.
Doing so, however, raises a whole hoat of issues that must remain beyond the =ope of the present paper, such as
whether one wishes to classify the industry of origin of the invention (say, to compare the value of patented output
with R&D inputs), or the industry of use (in order to explain interindustry di5erences in productivity growth, for
example). For a discussion of these issues and a concordance between the IPC and SIC classification systems, See
Kortum and Putnam (1992) and Evenscn and Putnam (1993).
indicator of an application's having been
The sample selected for analysis consists of approximately 28,400 patent families, of which
about 20.700 are international patent families. "Large" international families were o ~ e r s a r n ~ l e d . ~ ~
Using the sampling weights, we can estimate the total number of inventions for which protection
was sought in the 18 countries under study a s approximately 168,000, generating a total of about
377,000 patent applications, or an average filing rate of just over two countries per invention. An
est,imated 58,100 of the 168,000, or about 35%, were international families, averaging about 4.6
countries per family.
Tables 1, 2 and 3 presents summary information on the 1974 cohort for the 18 countries that
constitute the sample. 25 Table 1 views each country as a grantor of patent rights, i.e., in an
'=The Dement database contains fields for both applications and publications. The application field gives the
country of origin of the first (priority) application, as well as evidence of amended applications in other countries.
The availability of this additional data means that, for example, if a U.S. applicant lilm in the United States, where
ungranted applications are not published, and then.6les in Germany, which automatically publishes applications, the
record will note the presence of the U.S. application and give the application number, even if no U.S. patent ever
issues. In the summary tabulations below, I exploit this additional source of information on the inventor's sing
patterns. In the econometric model, however, I omit the information available from the application field because the
question of whether one observes an application, and the appropriate correction for sample selection, then becomes a
function of the source-destination country pair (in this case, U.S;Germany), rather than of the destination country
alone. '"lore pmisely, the organization of the Dement database permitted stratiEcation on the number of documenh
in the family, rather than on the nnniber of countries (a constraint that no longer appears in current versions of the
database). This results in oversampling countries that publish the patent document more than once, such as Japan.
Germany and the Netherlands, but does not bias the inferences. The sampling rule was to choose 26 of every 500
families having one document, 51 of every 500 families having two documents, and 501 of every 1000 families having
three or more documents. he data were drawn horn two sources: the Dement sample, and annual publications of the World Intellectual
Property Organization (WIPO). WIPO reports aggregate statistics collected from the national offices, such as the
total number of applications in countries that do not publish individual applications, and subtotals by resident/non-
resident inventors, that are not available from the Dement sample. The WIPO data are averaged over the period
1973-76; for various reasons, mostly related to diierences in the definition of an annual cohort, direct year-t*year
international context, as a potential "target" for patent protection. Countries in the table are
ranked by their average number of patents granted, according to the WIPO definition, during
1973-76. Column 1 presents each country's share of the world total (where the "world" comprises
the 18 countries under investigation). The "Big Fiven-the U.S., Japan, (West) Germany, France
and the U.K.-account for nearly 70% of applications filed in the sample. The endogenous sample
attrition due to delayed examination by the patent office is particularly noticeable in Germany and
Japan: Column 2 shows that each has a much larger share of world applications than world patent
grants.
Columns 3 and 4 give the percentage of world patent families (Column 3) and world international
patent families (Column 4) that show a filing in the indicated country. It is readily apparent that
no country is an automatic target for patent protection. Even the U.S., with a GDP about three
times that of Germany's or Japan's during this period, appears to have generated positive ex ante
net returns for only about 64% of all families filed internationally; for over half the countries, the
figure is less than 20%.'~
Column 5 shows the fraction of each country's applications that originate from domestic in-
ventors. Most countries grant significantly more numbers of patents to foreigners, particularly
to inventors from the Big Five, than they do to their own citizens. This observation has led to
t,he claim that significant trade imbalances exist between some country pairs, particularly between
North and South, in the value of patent rights.
Columns 6 and 7 present each country's patent granting rate for all inventions and for that
subset filed by foreigners, taken as the ratio of patents granted to patents filed during the interval
1973-76. The success rates of foreign patents are generally higher than those for patents as a whole.
This might be expected, given the one-year delay permitted to foreigners, and their higher cost
comparisons between the WIPO and Dement data are not posrible. 261n the case of the U.S., this figure is biased downward considerably, because the U.S. does not publish applicatiom
unless they are granted.
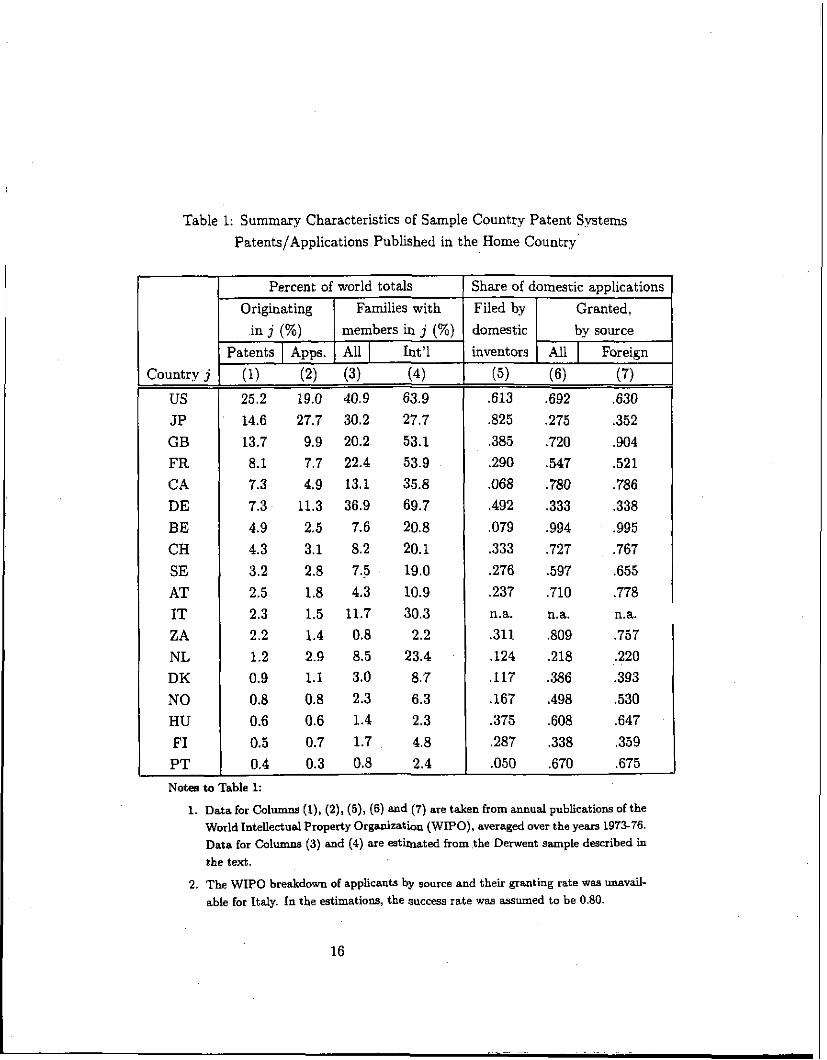
Table 1: Summary Characteristics of Sample Country Patent Svstems
Patents/Applications Published in the Home Country'
Percent of world totals Share of domestic applications
Originating Families with Filed by Granted,
in j (%) members in j (%) domestic by source
Patents I Apps. All 1 Int'l inventors All I Foreign
Country j (I) (2) (3) (4) (5) (6) (7)
US 25.2 19.0 40.9 63.9 ,613 ,692 ,630 JP 14.6 27.7 30.2 27.7 ,825 ,275 ,352 GB 13.7 9.9 20.2 53.1 ,385 ,720 ,904 FR 8.1 7.7 22.4 53.9 ,290 ,547 ,521 C A 7.3 4.9 13.1 35.8 ,068 ,780 ,786 DE 7.3 11.3 36.9 69.7 ,492 ,333 ,338
BE 4.9 2.5 7.6 20.8 ,079 ,994 ,995 CH 4.3 3.1 8.2 20.1 ,333 ,727 ,767
SE 3.2 2.8 7.5 19.0 ,276 ,597 ,655
AT 2.5 1.8 4.3 10.9 ,237 ,710 ,778 IT 2.3 1.5 11.7 30.3 n.a. n.a. n.a.
Z A 2.2 1.4 0.8 2.2 ,311 ,809 ,757 NL 1.2 2.9 8.5 23.4 ,124 .218 ,220
DK 0.9 1.1 3.0 8.7 ,117 .386 ,393
NO 0.8 0.8 2.3 6.3 .I67 .498 ,530
HU 0.6 0.6 1.4 2.3 ,375 ,608 ,647
FI 0.5 0.7 1.7 4.8 ,287 ,338 ,359
PT 0.4 0.3 0.8 2.4 ,050 ,670 ,675
N o h to Table 1:
1. Data lor Columns (I), (Z), (5), (6) and (7) are taken from annual publications of the World Intellectual Property Organization (WIPO), averaged over the years 1972-76. Data for Columns (3) and (4) are estimated from the Dement sample described in the text.
2. The WIPO breakdown of applicants by source and their granting rate was unavail- able for Italy. In the estimations, the success rate was assumed to be 0.80.
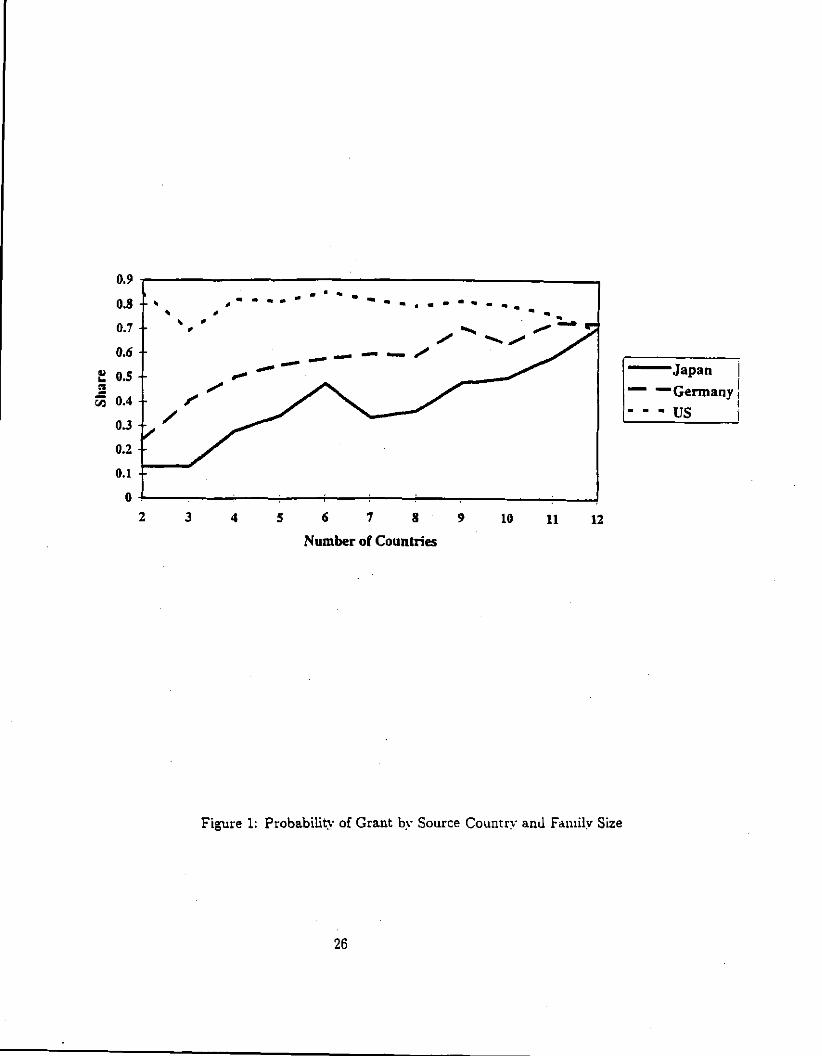
of filing. Note, for example, the large discrepancies between countries that automaticallv examine
patent applications (the US. , U.K.) and countries that permit the applicant to delay examination
(Japan, Germany). While one might expect that, within a country, the probability of acceptance
by the patent office would be a positive function of the patent's technical quality, which should in
turn be positively correlated with the patent's economic value, Figure 1 shows that even this simple
inference is complicated by each office's rules. In the US. , the probability of grant is uncorrelated
with patent family size,27 while in Germany and Japan the probability of grant increases with
familv size. On the other hand, Putnam (1996) shows that the average pendency of German and
Japanese patents also increases with family size; discretionary delay and information acquisition
t,hus appear to influence the success probabilities.
Table 2 inverts the perspective and views each country as a source of patentable technology.
Columns 1 and 2 give the share of inventions in the Derwent sample originating in each country: h s t
the share of all patent families (Column I), then the share of international families only (Column 2).
Considered from their source, the concentration of inventions into the Big Five countries is even
more pronounced: together these countries account for more the 75% of the inventions in the
sample, with the U.S. and Japan responsible for more than half.
Column 3 shows the percentage of inventions originating in each country that are subsequently
filed abroad. Again, fairly wide dserences emerge. At least three factors may explain why the
relative frequency of foreign filing is higher for some countries: (1) sample selection-inventors only
file domestically if they are likely also to file abroad, since domestic returns alone will not cover
the cost of the domestic (priority) filing; (2) differing distributions-inventors from some countries
systematically draw higher quality inventions; (3) differing export opportunities-inventors having
in place more distribution networks and other infrastructure abroad are more highly integrated
into world markets, which increases the returns to foreign patent protection. Some support for the
"These estimates are computed by observing the fraction of internationally Ued families originating in the re-
spective countries that do not show a granted patent from that country. Thus, we can construct a success rate for
(internationally filed) US.-origin applications even though the U.S. keeps its applications secret.
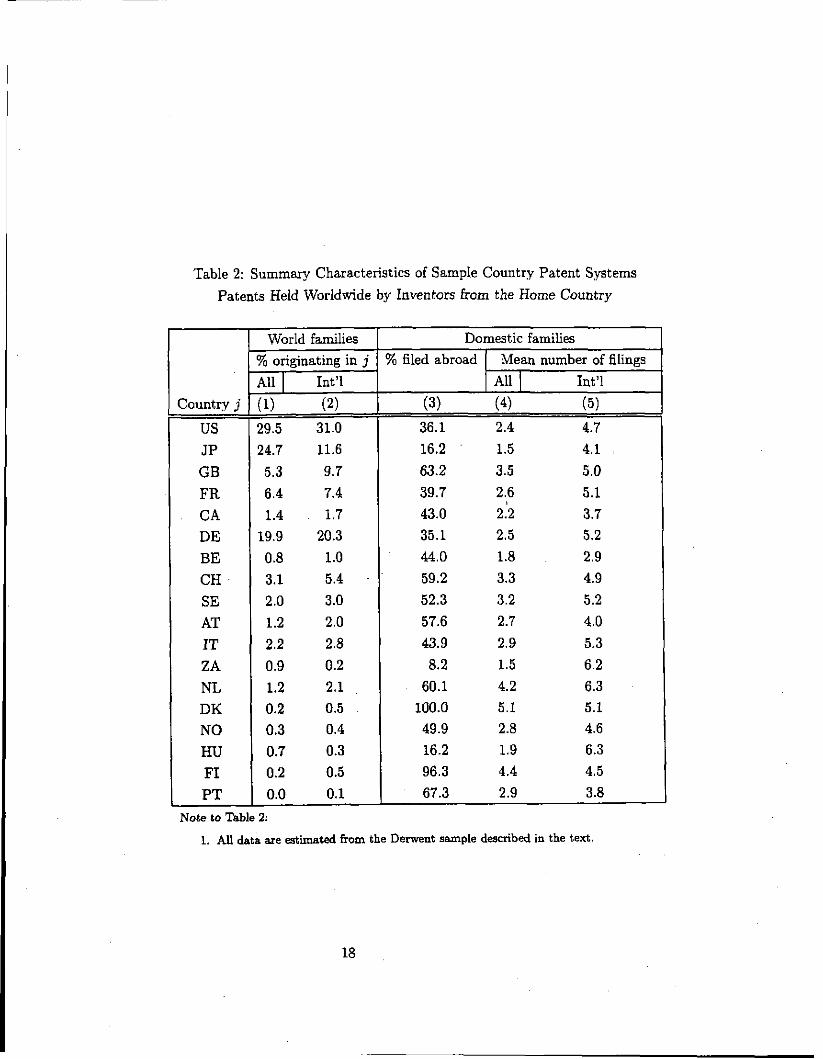
Table 2: Summary Characteristics of Sample Country Patent Systems
Patents Held Worldwide by Inventors from the Home Country
Note to Table 2:
1. AU data are estimated from the Denvent sample described in the tea .
Country j
US J P
GB FR C A DE BE CH SE
AT IT Z A NL DK NO HU FI PT
World families
% originating in j
All I Int'l
(1) (2)
29.5 31.0 24.7 11.6
5.3 9.7 6.4 7.4 1.4 1.7
19.9 20.3
0.8 1.0 3.1 5.4 2.0 3.0 1.2 2.0
2.2 2.8 0.9 0.2 1.2 2.1 0.2 0.5 0.3 0.4 0.7 0.3 0.2 0.5 0.0 0.1
Domestic families % filed abroad Mean number of filings
All I Int'l
(3) (4) (5) 36.1 2.4 4.7 16.2 1.5 4.1
63.2 3.5 5.0 39.7 2.6 5.1 43.0 2.2 3.7 35.1 2.5 5.2 44.0 1.8 2.9 59.2 3.3 4.9 52.3 3.2 5.2
57.6 2.7 4.0 43.9 2.9 5.3 8.2 1.5 6.2
60.1 4.2 6.3 100.0 5.1 5.1 49.9 2.8 4.6 16.2 1.9 6.3 96.3 4.4 4.5 67.3 2.9 3.8
first hypothesis can be found in the generally inverse relationship observed in Column 3 between
foreign filing frequency and the size of the domestic economy. Support for the second and third
hypotheses might be found, for example, in a relationship between the level and mix of research
projects in a country and its returns to patent protection, or a relationship between the level of
exports and patent protection.
Finally, Columns 4 and 5 provide the mean "family size," as indicated by the number of country
filings per invention, for all patent families (Column 4) and for international families only (Col-
umn 5). These figures are obviously influenced by the same factors that underlie Column 3, the
share of inventions on which foreign applications are filed. For the same reasons, one cannot tell
whether countries having higher mean filings are populated by better, luckier or more globally in-
tegrated inventors, or whether regional agglomeration and lower transactions costs between patent
offices account for the difference. Although the mean family size has been proposed as an indicator
of the value of a patent family (e.g., Mogee et al. 1993), simple inter-country and inter-firm com-
parisons are kaught with sample selection and multiple causality problems that make inferences
from this statistic misleading.
Columns 1 through 4 present several items that characterize the patent system of each country
in the sample. The h s t column indicates whether the Derwent sample contains published applica-
tions (A) or granted patents (P). Note that our observing only granted patents in some countries
constitutes a source of measurement error in the dependent variable. Column 2 shows the maxi-
mum patent lifetime available in each country. In Canada and the U.S., patent lifetimes are defined
with respect to the date of grant; elsewhere they are defined with respect to the date of application.
Columns 3 and 4 of Table 3 provide two indications of the cost of filing in each country. Column 3
shows the maximum renewal fee in each country, which is invariably assessed in the last permissible
year of patent life.
To illustrate the effects of the renewal fee schedule on the fixed cost of filing, I present in Figure 2
the minimum level of initial returns, EL, required by an applicant in Germany in order to cover the
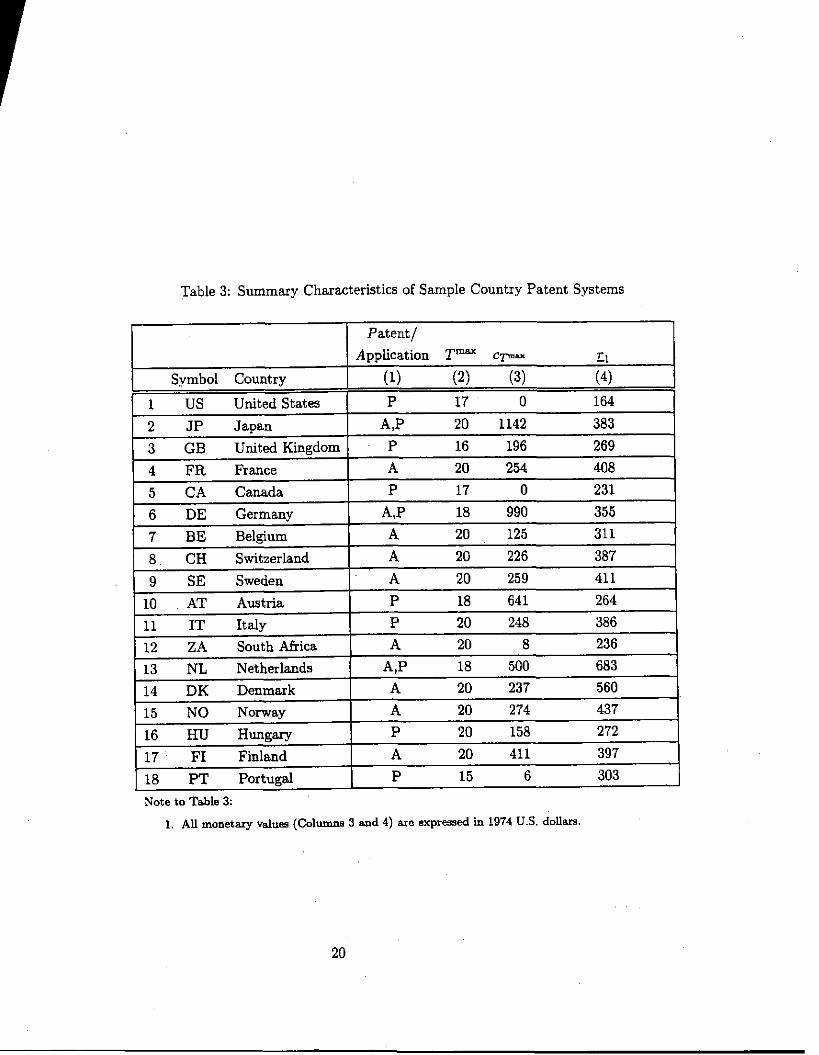
Table 3: Summary Characteristics of Sample Country Patent Systems
Note to Table 3:
1. AN monetary values (Columns 3 and 4) are expressed in 1974 U.S. dollars.
fixed cost of filing, and the renewal fees that he must pay along the way. In this figure, based on
the German application and renewal fee schedules, the solid lines show the breakeven combinations
of Lxed costs Ca and initial returns r, given an assumed annual depreciation in returns of 15%. For
~xample, if Co = $2000 and we assume that returns begin in year 1, then rl = $600. Alternatively,
if we assume that the applicant's returns do not begin until age 7, the figure shows that he must
forecast an initial return z, of at least $1625 in order to justify an application.
Column 4 of Table 3 lists for each country j , based on the estimated out-of-pocket costs
of filing an application, again assuming an annual depreciation rate of 15% and optimal patentee
renewal behavior given the country's renewal fee s c h e d ~ l e . ~ ~ ~ ~ ~ The governmental costs of filing
are taken from publications of the national patent offices; estimates of legal and translation fees
associated with filing are taken from Helfgott (1993) and deflated using each country's implicit
price deflator. The relatively low d u e s for the U.S. and Canada reflect, in part, the absence of
renewal fees in both countries; for each of these countries, under the assumption that patent returns
depreciate at a constant rate, all patents are 'tenewed" out to their statutory maximum and earn
returns over the entire interval.
Figure 2 also plots the year 1 that a patent earning the breakeven return is allowed to lapse as
a function of its fixed costs and minimum initial return. Lapse occurs when current returns have
depreciated to a level lower than the cost of renewal. If lapse occurs in year n then the region is
delimited by dotted lines and denoted by I = n. To return to our examples, a patent that cost
$2000 and earned the breakeven return of $600 beginning in year 1 would be renewed through year
8, then allowed to lapse in year I = 9; if returns did not begin until year 7, the patent would lapse
in year 1 = 14.
'"I aasume that the inventor expects this schedule to remain constant, in real term, throughout the life of his patent. he reported figure for each country is an average of the minimum returns required by inventors from each af
the countries in the sample, weighted by the frequency of applications observed in 1974 from each country. In this case, the only source of variation acrosl origin countries is the cost of translating the application if the languages of the source and destination countries are merent.
An important empirical irregularity in international patent application data can be found in
the pattern of protection sought, which cannot be explained by differences in filing costs, or simple
filing rules. Note that for J countries, there are 2J - (J + 1) possible observable combinations of
international patent protection. For J = 18 countries, this number is about 2.6 x lo5 . While only a
small subset of these combinations is actually observed, it is nevertheless a large number in absolute
terms, when compared to the number of choices that must be modelled in a single-country renewal
model. Among the sample of 20,700 international families, 5810 unique combinations of application
countries can be observed. The top 50 of these accounted for about 50% of the estimated weighted
t,otal of 58,100, with the US.-Canada pair accounting for 9% alone.
Table 4 illustrates this source of variation among the top five patenting countries, by ranking
the 32 possible combinations of these countries according to their estimated frequencies in the p o p
ulation of international families. Each combination is indicated by a string of letters corresponding
to the first letter of each country's international symbol (so Germany is denoted by "D" and the
U.K. by "G"). Countries outside the top five are disregarded, except that an international family
having no members among the top five is denoted by the word -none-. (Using this notation, each
country can appear singly, which implies that it has been paired with at least one other country
outside the top five.)
The most likely combinations are those covering all of the top five countries (having probability
.12) and the top five sans Japan ( .15) (Column 1 ) . Twenty-three of the 32 combinations occur
at the rate of at least .O1 in the population. About 3% of all international families are filed in
none of the top five countries. Column 2 of Table 4 shows the corresponding probabilities for the
entire (domestic-only as well as international) population. Because of their large percentage of
domestic-only families, the U.S., Japan and Germany dominate this column.
Columns 4, 5 and 6 of Table 4 indicate the relationship between the truncated combination
shown and the actual number of filings observed in the 18 countries. Column 4 shows the average
number of filings for each combination; an invention filed in each of the top five is filed on average
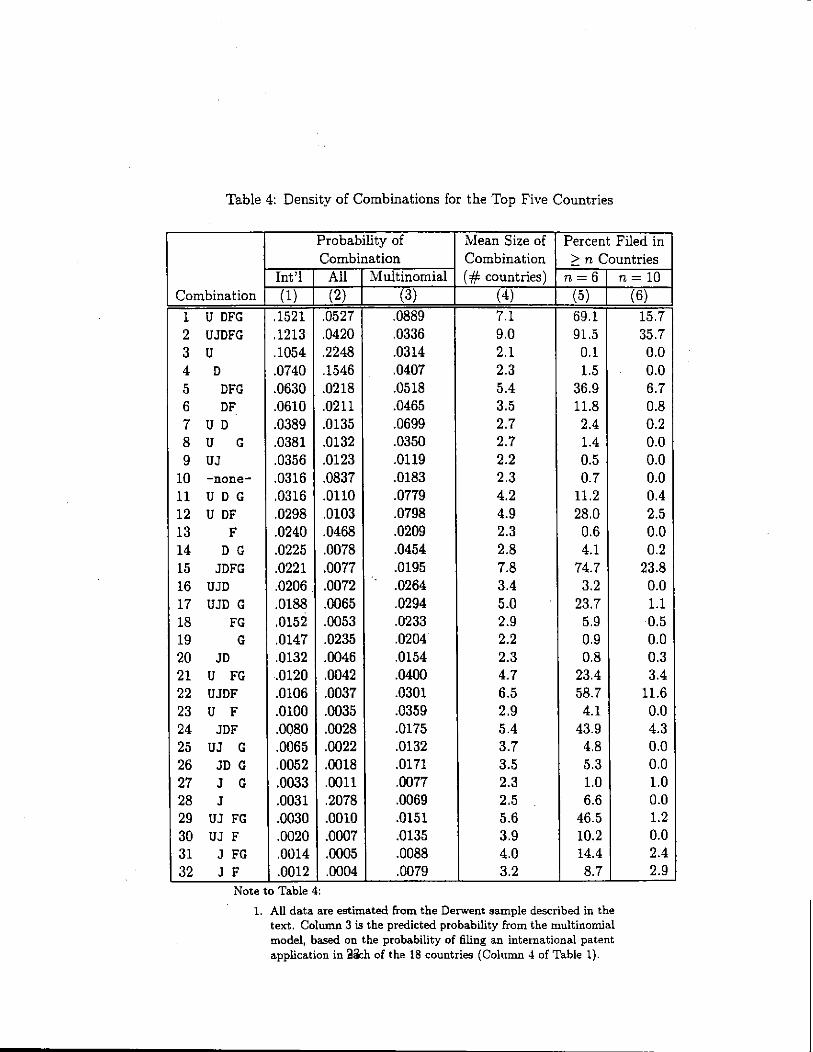
Table 4: Density of Combinations for the Top Five Countries
Probability of Combination
Combination 1 U DFG 2 UJDFG 3 U 4 D 5 DFG 6 DF 7 U D 8 U G 9 UJ
10 -none- 11 U D G 12 U DF 13 F 14 D G 15 JDFG 16 UJD 17 UJD G 18 FG 19 G 20 JD 21 U FG 22 UJDF 23 U F 24 JDF 25 UJ G 26 JD G 27 J G 28 J 29 UJ FG 30 UJ F 31 J FG 32 J F
Note
Mean Size of Combination
Percent Filed in > n Countries
1. AU data are estimated horn the Dement sample described in the text. Column 3 is the predicted probability From the multinomial model, based on the probability of filing an international patent application in a&h of the 18 countries (Column 4 of Table 1).
(# countries) (4) 7.1 9.0 2.1 2.3 5.4 3.5 2.7 2.7 2.2 2.3 4.2 4.9 2.3 2.8 7.8 3.4 5.0 2.9 2.2 2.3 4.7 6.5 2.9 5.4 3.7 3.5 2.3 2.5 5.6 3.9 4.0 3.2
Multinomial (3)
,0889 ,0336 ,0314 ,0407 ,0518 ,0465 ,0699 .0350 ,0119 ,0183 ,0779 .0798 ,0209 ,0454 ,0195 ,0264 ,0294 ,0233 ,0204 ,0154 .0400 ,0301 ,0359 ,0175 ,0132 ,0171 .0077 ,0069 ,0151 ,0135 .0088 ,0079
Int'l (1)
,1521 ,1213 ,1054 ,0740 ,0630 .0610 ,0389 ,0381 ,0356 ,0316 ,0316 ,0298 ,0240 .0225 ,0221 ,0206 ,0188 ,0152 ,0147 ,0132 ,0120 ,0106 .0100 ,0080 ,0065 ,0052 .0033 ,0031 ,0030 ,0020 ,0014 ,0012
to Table
All (2)
,0527 ,0420 ,2248 .I546 ,0218 ,0211 ,0135 ,0132 ,0123 ,0837 .0110 ,0103 ,0468 ,0078 .oon ,0072 ,0065 ,0053 ,0235 ,0046 ,0042 ,0037 ,0035 .0028 .0022 ,0018 ,0011 ,2078 .0010 ,0007 .0005 ,0004
4:
- n = 6
(5) 69.1 91.5 0.1 1.5
36.9 11.8 2.4 1.4 0.5 0.7
11.2 28.0 0.6 4.1
74.7 3.2
23.7 5.9 0.9 0.8
23.4 58.7 4.1
43.9 4.8 5.3 1.0 6.6
46.5 10.2 14.4 8.7
n = 10 (6)
15.7 35.7 0.0 0.0 6.7 0.8 0.2 0.0 0.0 0.0 0.4 2.5 0.0 0.2
23.8 0.0 1.1 0.5 0.0 0.3 3.4
11.6 0.0 4.3 0.0 0.0 1.0 0.0 1.2 0.0 2.4 2.9
in nine of the 18 countries. Column 5 shows that patenting in only the top five countries is also
quite rare: over 91% of all families having the UJDFC combination are also patented in at least one
other country. Given that these countries account for such a large fraction of the world total, it
seems rather surprising that so few inventors choose to patent only in them.
We formalize this query as the null hypothesis of complete independence across countries in
a multinomial model of international patent filing, tested against the alternative of dependence,
which we will attribute in the next section to the common economic quality of patents in different
institutional settings. If we use the notation y j = I to indicate that an applicant files in country j,
y j = 0 otherwise, then the probability of observing any particular vector of patent filings g is given
b,v: J
Prob[g] = n (q)sj x (1 - ,)l-*j j=1
Employing as estimates of i ~ j the percentages given in Column 4 of Table 1 (which gives the
unconditional probability that an international patent family has a member in each of the 18
countries), we can compute these probabilities straightforwardly. Column 3 of Table 4 shows the
sum of these probabilities for all families having the truncated five-country combination shown, as
predicted by a multinomial model. While the results show some similarity, indicating that there is
a significant independent component to returns across countries, X Z tests reject the equivalence of
the distributions even for very small samples. Consistent with our suppositions, the multinomial
model predicts a 50% larger share of all families filed in each of the Big Five are filed only there
(14%, as against 8.5% in the data).
The economic significance of rejecting a multinomial model can be made somewhat more em-
phatically by comparing the actual and estimated densities of patent families distributed by the
number of countries in which filings are observed. The multinomial model predicts that we should
observe essentially zero families with filings in 10 or more countries. The data, on the other hand,
show approximately 8% of all patent families having at least 10 filings. Column 6 of Table 4 shows
the large variability in this likelihood across different patterns of protection in the Big Five coun-
tries. If we equate these large families with the upper tail of the value distribution, and accept
rhe Lorenz curve estimates, we can infer from Pakes's (1986) Monte Carlo simulations that the top
8% of all patents account for about 40% of the total value of the population. Thus, an error in
this part of the distribution has much greater significance in value terms than its simple frequency
suggests.
If we accept the alternative hypothesis that patents have a common quality across countries,
we come to the problem of defining what we mean by "quality" and its relationship to economic
value. In the case of single-country models, quality is indistinguishable from the value of the patent
right. On the other hand, in an international context we must confront the fact that patents on
the same invention, having therefore the same technical merit, will have different values in different
countries, depending not only on the market size but on such institutional factors as the average
scope of patent protection, the maximum permitted lifetime, and the rigor of enforcement, as well
as any unobserved stochastic component.
1- Japan I
J 2 3 4 5 6 7 8 9 10 11 12
Number of Countries
Figure 1: Probability of Grant by Source Country and Fanlilv Size
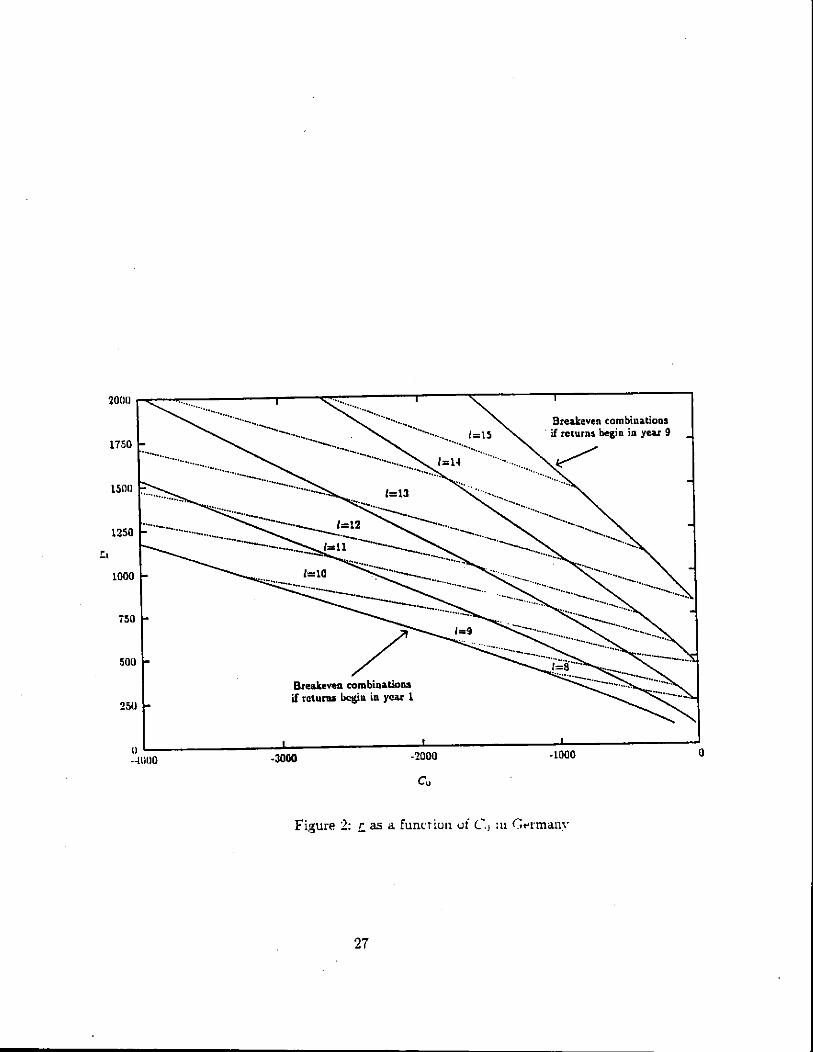
Figure 2: L as a funcriun u i C'., :ii Grrmany
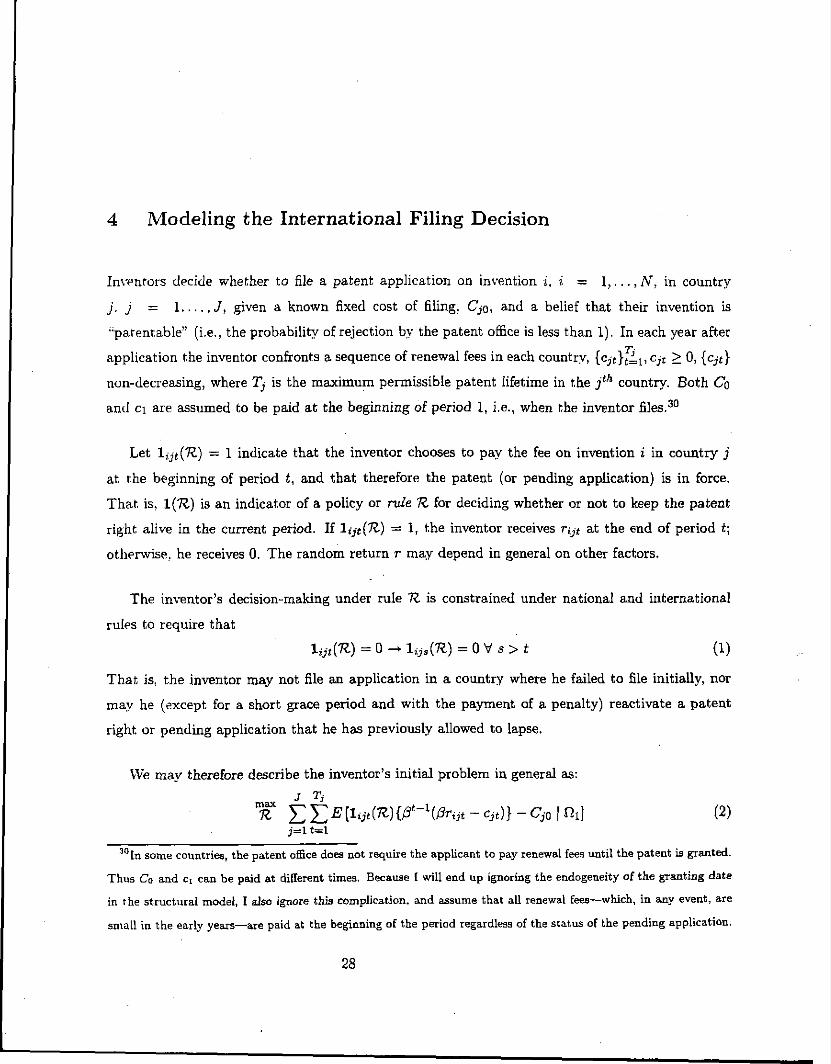
4 Modeling the International Filing Decision
In\-rnrors decide whether to file a patent application on invention i. I: = 1,. . . , N, in country
j . j = 1.. . . , J , given a known fixed cost of filing: Cia, and a belief that their invention is
.'patentablen (i.e., the probability of rejection by the patent office is less than 1). In each year after
application the inventor confronts a sequence of renewal fees in each countrv, {cjt}Fil, cjt 2 0, {cjt}
non-decreasing, where Tj is the maximum permissible patent lifetime in the jth country. Both Co
and cl are assumed to be paid a t the beginning of period 1, i.e., when the inventor files.30
Let lijt(R) = 1 indicate that the inventor chooses to pav the fee on invention i in country j
at the beginning of period t , and that therefore the patent (or pending application) is in force.
That is, 1(R) is an indicator of a policy or rule R for deciding whether or not to keep the patent
right alive in the current period. If lijt(R) = 1, the inventor receives r,jt at the end of period t ;
otherwise, he receives 0. The random return r may depend in general on other factors.
The in\-entor's decision-making under rule R is constrained under national and international
rules to require that
l i j t(R) = 0 - l " , , ( ~ ) = o v > t (1)
That is, the inventor may not file an application in a country where he failed to file initially, nor
ma.v he (except for a short grace period and with the payment of a penalty) reactivate a patent
right or pending application that he has previously allowed to lapse.
We ma.v therefore describe the inventor's initial problem in general as:
max J T,
R C C E [1.jt(R){Pt-'(~r,jt - tit)} - C;.O I RI] j=l t-1
some countries, the patent office does not require the applicant to pay renewal fees until the patent is granted.
Thus Co and c, can he paid at different times. Because I will end up ignoring the endogeneity of the granting date
in the structural model, I also ignore this complication. and assume that all renewal fees-which, in any event, are
small in the early years-are paid at the beginning of the period regardless of the status of the pending application.
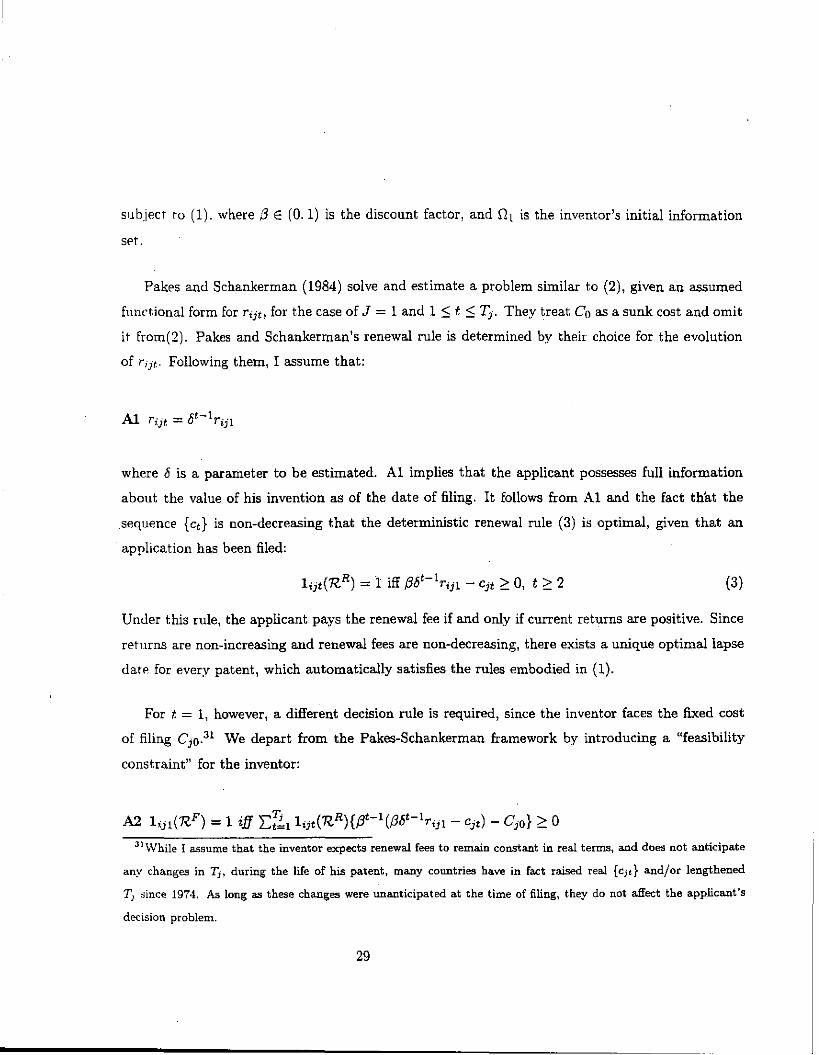
subject to ( 1 ) . where 3 E ( 0 . 1 ) is the discount factor, and ill is the inventor's initial information
set.
Pakes and Schankerman (1984) solve and estimate a problem similar to (2), given an assumed
functional form for r,jt, for the case of J = 1 and 1 5 t 5 T,. They treat Co as a sunk cost and omit
it from(2). Pakes and Schankerman's renewal rule is determined by their choice for the evolution
of r , j t . Following them, I assume that:
where 6 is a parameter to be estimated. A1 implies that the applicant possesses full information
about the value of his invention as of the date of filing. It follows from A1 and the fact th'at the
sequence { c t ) is non-decreasing that the deterministic renewal rule (3) is optimal, given that an
application has been filed:
l i j t ( 'RR) = 1 iff P ~ ~ - ~ T ~ ~ ~ - cjt >_ 0 , t 2 2 (3)
Under this rule, the applicant pays the renewal fee if and only if current returns are positive. Since
retiirns are non-increasing and renewal fees are non-decreasing, there exists a unique optimal lapse
date for every patent, which automatically satisfies the rules embodied in (1).
For t = 1, however, a different decision rule is required, since the inventor faces the futed cost
of filing c , ~ . ~ ~ We depart from the Pakes-Schankerman framework by introducing a "feasibility
constraint" for the inventor:
A2 l i j l ( ' R F ) = 1 i f f C T L ~ l i j t (~R){~ t -1 ( f16 t - '~ i j l - cj t ) - Cj0} >_ 0
3 1 ~ h i l e I assume that the inventor expects renewal fees to remain c o d a n t in real terms, and does not anticipate
an?. changes in T,, during the life of his patent, many countries have in fact raised real [cjt) and/or lengthened
T, since 1974. As long as these changes were unanticipated at the time of filing, they do not aE%t the applicant's
decision problem.
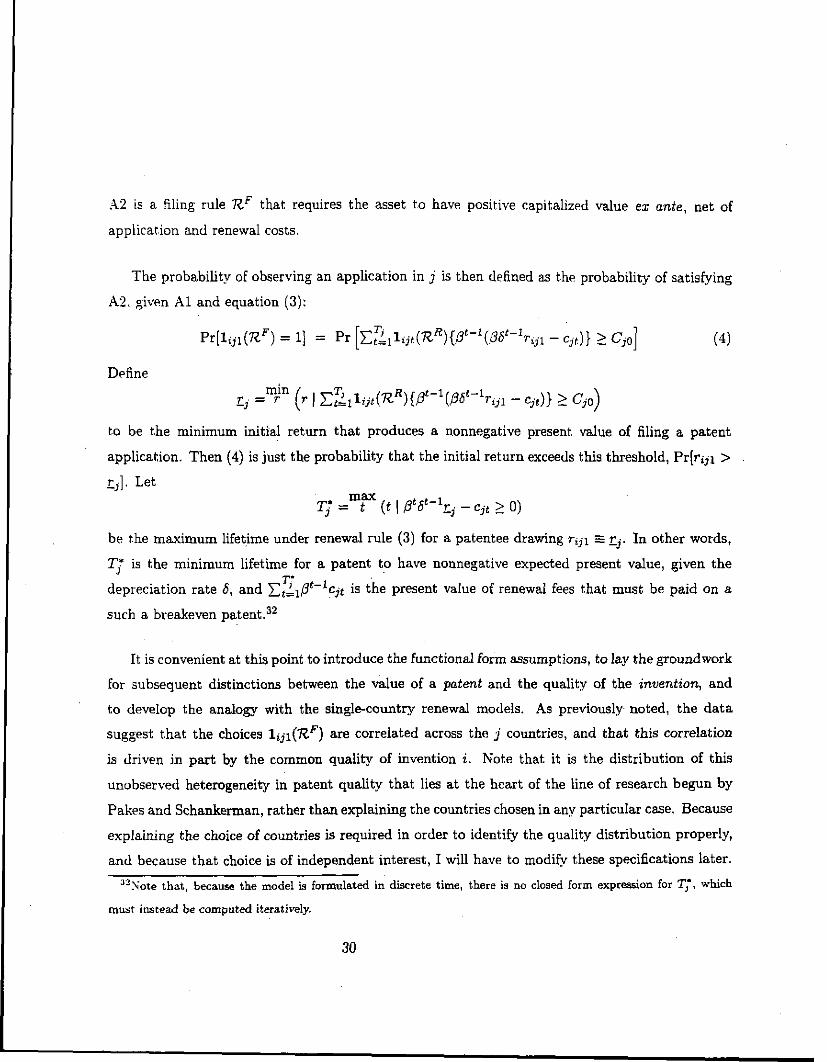
A2 is a filing rule 7ZF that requires the asset to have positive capitalized value es ante, net of
application and renewal costs.
The probabilitv of observing an application in j is then defined as the probability of satisfying
A2. given A1 and equation (3):
Define min TI 1..
T . = T (T I Ekl - cjt)) 2 ~ ~ 0 ) -3
to be the minimum initial return that produces a nonnegative present value of filing a patent
application. Then (4) is just the probability that the initial return exceeds this threshold, Pr[rijl > r ] Let -1 '
max T; = t ( t ( fltbt-lE, - cjt 2 0)
be the maximum lifetime under renewal rule (3) for a patentee drawing rijl cj. In other words,
T; is the minimum lifetime for a patent to have nonnegative expected present value, given the T'
depreciation rate 6, and Ctilflt-'cjt is the present value of renewal fees that must be paid on a
such a breakeven patent.32
It is convenient at this point to introduce the functional form assumptions, to lay the groundwork
for subsequent distinctions between the value of a patent and the quality of the invention, and
to develop the analogy with the single-country renewal models. As previously noted, the data
suggest that the choices lijl(7ZF) are correlated across the j countries, and that this correlation
is driven in part by the common quality of invention i. Note that it is the distribution of this
unobserved heterogeneity in patent quality that lies at the heart of the line of research begun by
Pakes and Schankerman, rather than explaining the countries chosen in anv particular case. Because
explaining the choice of countries is required in order to identify the quality distribution properly,
and because that choice is of independent interest, I will have to modify t.hese specifications later.
-'?Note that, because the model is formulated in discrete time, there is no closed form expression for T;, which
must instead be computed iteratively
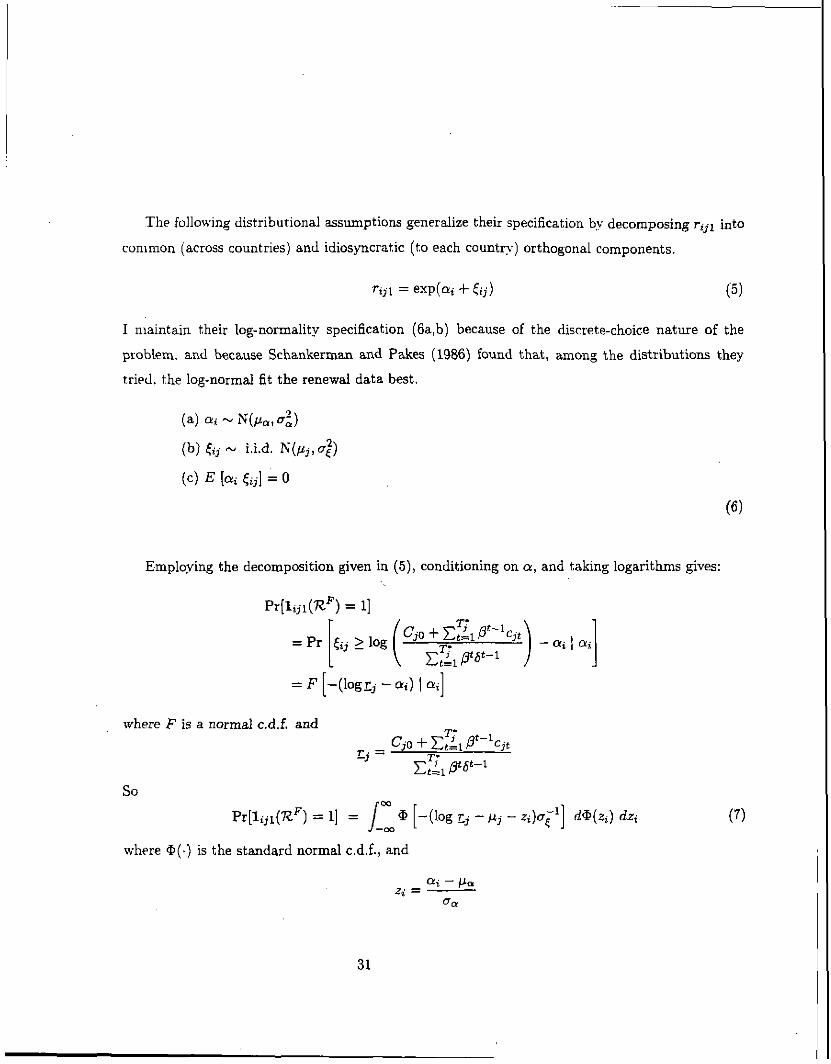
The following distributional assumptions generalize their specification by decomposing rijl into
conlmon (across countries) and idiosyncratic (to each country) orthogonal components.
I maintain t,heir log-normality specification (6a,b) because of the discrete-choice nature of the
problem, and because Schankerman and Pakes (1986) found that, among the distributions they
tried, the log-normal fit the renewal data best.
(8) ai - N(P~, a:)
(b) (ij - i.i.d. a:)
(c) E [ai f i j ] = 0
Employing the decomposition given in (5), conditioning on a, and taking logarithms gives:
where F is a normal c.d.f. and
z, = cjo + x:-, ot-'cjt Tt
Ctll $at-1 So
m = 11 = / a [-(log c, - p i - z i )a j l ] n q i I hi
-m (7)
where a(.) is the standard normal c.d.f., and
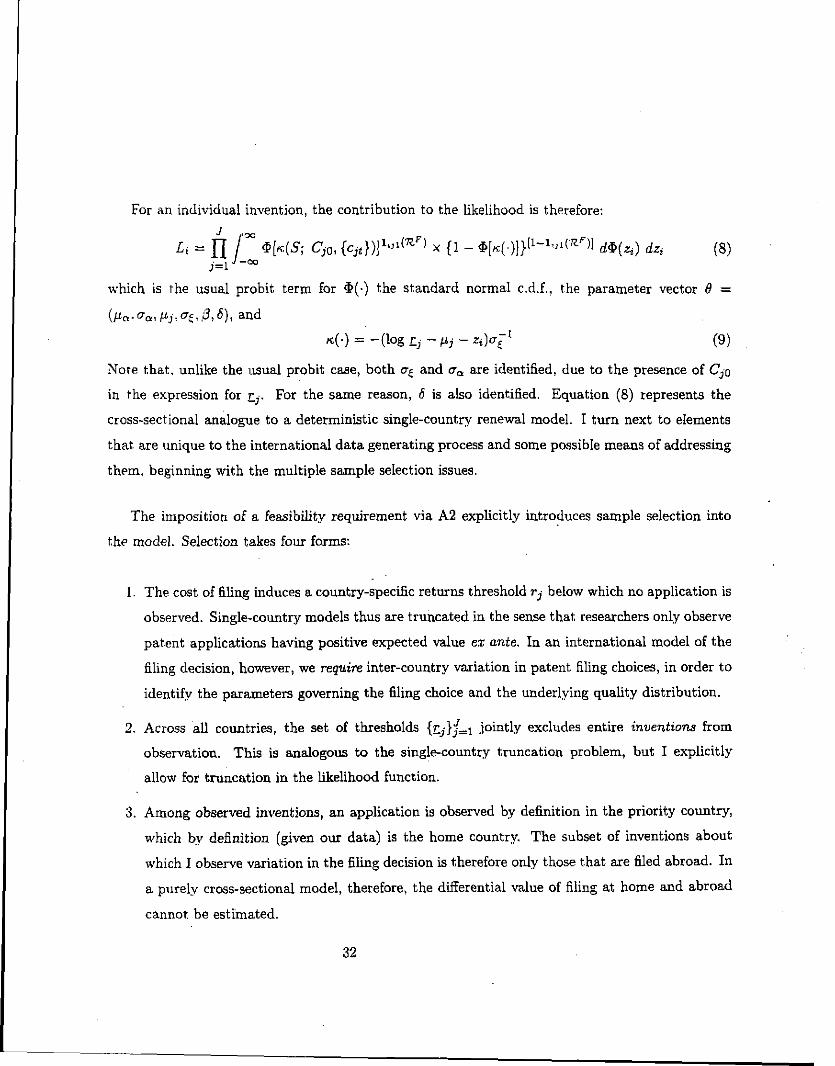
For an individual invention, the contribution to the likelihood is therefore:
J m
Li = n 1 @[K(s; cjo, {cjt})I l b ~ l ( R F ) x (1 - (p[,+)~}[l-~,,l('~F)I d ( p ( ~ * ) dzd jE1. -m
(8)
shich is the usual probit term for a(.) the standard normal c.d.f., the parameter vector 0 =
(p.*. mu, pjLj: 0:. ,3,6), and
x(.) = -(log Lj - pj - 2 , ) ~ - I E (9
Note that. unlike the usual probit case, both 0: and u, are identified, due to the presence of CjO
in the expression for cj. For the same reason, 6 is also identified. Equation (8) represents the
cross-sectional analogue to a deterministic single-country renewal model. I turn next to elements
that are unique to the international data generating process and some possible means of addressing
them, beginning with the multiple sample selection issues.
The imposition of a feasibility requirement via A2 explicitly introduces sample selection into
the model. Selection takes four forms:
1. The cost of filing induces a country-specific returns threshold rj below which no application is
observed. Single-country models thus are truncated in the sense that researchers only observe
pat,ent applications having positive expected value ex ante. In an international model of the
filing decision, however, we repire inter-country variation in patent filing choices, in order to
identifv the parameters governing the filing choice and the underlying quality distribution.
2. Across all countries, the set of thresholds {21j}&1 jointly excludes entire inventions from
observation. This is analogous to the single-country truncation ~roblem, but I explicitly
allow for truncation in the likelihood function.
3. Among observed inventions, an application is observed by definition in the priority country,
which b.v definition (given our data) is the home country. The subset of inventions about
which I observe variation in the filing decision is therefore only those that are filed abroad. In
a purely cross-sectional model, therefore, the differential value of filing at home and abroad
cannot be estimated.
4. In some countries, only granted patents are observed, which means that I have mismeasured
the dependent variable.
I correct for these potential sources of error as follows. Invention i only enters the sample if a
p~.iority application is filed. Therefore, I treat the probability of observing a patent application as
conditional, not only on a,, but on the presence of a home application, i.e., l iHl(aF) s 1. That
is. F - ~ r [ l i , l ( ~ ~ ) = 11 = Pr [fi, 2 -(log c, - pj - zz,)o;l ( ni, {li.y~(R ) = I)] (10)
where H is the home country. Of course, for j = H, this probability is 1. For the ith invention, the
term corresponding to j = H cancels out of (8) when I condition on the presence of a home coun-
try application. Therefore, this modification effectively eliminates the home country application
decision from the model.
A purely cross-sectional model cannot distinguish inventions that exhibit zero foreign filings
because their idiosyncratic value is high only at home (i.e., CiH is large) from inventions that
have experienced a sharply downward revision in ai in the interval between the domestic and
foreign application d e c i ~ i o n s . ~ ~ While it is attractive to introduce dynamic optimization in order to
dist,inguish these effects, it also complicates the model, and I wish to focus on what can be learned
from the cross-section. Therefore, I restrict the sample still further, by requiring the presence of at
least one foreign application, and assuming that the inventor is fully informed as of the one-year
priority anniversary.
Conditioning on the value of ai as of the Paris Convention filing deadline, the probability of at
""A substantial fraction of patents may be abandoned during this interval. On the other hand, particularly in the
larger economies, the incidence of inventors who can generate positive net ret- by filing only in their home country
(and whose inexperience with foreign filing may increase the implicit costs doing so), may also lie significant. I report
3lonte Carlo simulations of the value of patents filed only in Germany in Section 6.
least one foreign filing is 1 minus the probability of no foreign filings:
The probability of observing an application in any given foreign count,ry is therefore conditioned
on (1) the common quality of the invention, a,; (2) the presence of a home country application; (3)
at least one foreign application:
~ r [ l i ~ l ( X ~ ) = 11
In those countries K, k E K, that only publish granted patents, those events that lead to aban-
donment or rejection of the application cause us to mismeasure the indicator function, lakl(RF).
Because we might expect that higher quality inventions are more likely to be granted, and therefore
observed, we potentially face the problem that mismeasurement of the application decision is cor-
related with a, the quality of the patent. As Figure 1 showed, howver, the evidence on this point
is mixed. In the U.S., the probability of grant appears to be unrelated to patent family size, while
in Japan and Germany, where the applicant has more control over the timing of the examination,
there is a strong positive relationship between family size and grant. Given that the mismeasure-
ment ~roblem occurs most frequently in the U.S., I adopt the simplest solution: in countries that
~ub l i sh granted patents only, the failure to observe an application, given that one has been filed,
is an independent (of ui and across j ) event.
I introduce the following assumption to govern the relationship between observed and actual
applications:
A3 In those countries K , k E K , which do not publish rejected patent appiications, the observation
of an application is governed b y realizations of a Bernoulli random variable x k having success
pamm.eter ( 1 - p k ) , which is t a k e n from C o l u m n 7 of Table 1. T h e probability of observing a n
appl icat ion o n inven t ion i , i i k l ( ' R F ) , is
wh,ile th.e probability of failing t o observe a n appl icat ion is
As Section 2 pointed out, the observed distinction between abandonment and rejection of an
application has a great deal to do with the applicant's discretion over the timing of his examination.
As a result, the observation of a granted patent is neither a necessary nor a sufficient indicator for
positive current returns to a patent application. At the same time, we cannot impute the same
ignorance to the applicant, who must instead be presumed to hold expectations regarding whether
and when his application will be granted, as well as the time path of returns. Lacking guidance
from the data as to when returns actually begin, we are therefore forced to make some simplifying
assumptions about the onset of returns and that subset of applications that actually generates
returns.
In all countries, I therefore assume that one of two outcomes occurs: either the patent fails to
generate anv returns at all, or it generates them beginning in year 1. For countries where we observe
only successful applications, I assume that the applicant's expectations of failure are the same as
those implied by the measurement error correction. For those countries where all applications are
observed, i.e., where no correction for measurement error is necessary, I compute the probability of
failure in the same way as in the measurement error case, using data on the failure rate for foreign
applications.
If we assume, as in A3, that xj is independent of r,,1, then the expected value of the patent,
conditional on filing, is:
The foregoing discussion has concentrated on addressing the problems peculiar to the interna-
t,ional data generating process. Given the invest,ment in disentangling those issues, it is compara-
tiv~I?- easv to introduce cost and demand parameters.
The cost of filing the application, Cjo, includes the application fee and an estimate of average
legal fees required to file an application in country j.34 In reality, these fees vary substantially
across i , and do so in ways that may be correlated with r,j1.35 Despite the provisions of the Paris
Convention, the cost of filing abroad, particularly in 1974 (when international communications were
relativelv cost,ly), may vary depending on the country pair. Both physical distance and differences
34The data on the fees charged by the governments were obtained directly. Estimats of attorney fees are taken
from Helfgott (1993). This survey asked only for the cmt of 6ling the application, rather than of prosecuting it until
grant, with the result that costs are underestimated in countries for which only granted patents are observed. I return
to this problem below. "Legal fees vary for mahy reasons: the transactions costs of filing in foreign languages and under unfamiliar rules;
difference. in the competence and experience of legal counsel (and also, perhaps, of the examiner); differences in the
difficulty of ascertaining the prior art against which the invention will be judged; differences of opinion between the
inventor and the patent examiner as to the patentability of certain claims, which lengthen the bargaining proem;
different marginal costs of using in-house rather than outside counsel; and so on.
Perhaps the most troubling source of variation is the possible complementarity between the unobservable technical
quality of the invention and the level of legal effort employed to create value in the patent right (i.e., increased
effort increases ai, in which case the coat is endogenous). If the invention-specific ccost of fling, G j o , were treated
endogenously, however, then the minimum returns threshold rij would become a function of the initial draw, rui =
Its identification could only be accomplished by introducing a second equation that explained sj as
a function of oi and/or Fij, in addition to at least one other exogenous factor. This possibility complicates the
estimation considerably. It also requires invention-specific application cast data that are not easily observable. For
both these reasons, I ignore the possibility of a relationship between C,,o and ?, ,I .
in language are imperfect proxies for the variation in transactions costs between countries, but they
are readily o b s e r ~ a b l e . ~ ~ I therefore permit C,o to vary with invention i :
where ZD is the distance in kilometers between t,he patent offices of each country, and ZT = 1 if
the documents must be translated.
Two costs are incurred by the decision to allow Cia to vary: (1) TG, the minimum feasible
lifet,ime satisking A2, varies with ~ i , q , and so must be computed iteratively for each observation;
(2) in the expression for 6, the depreciation rate, is no longer identified separately, but only
the ratio $16. For this reason, I choose to fix the depreciation rate at 6 = 6 based on previous
estimates, rather than to estimate it.
A realization of the random variable.,&, reflects the particular opportunities available for ex-
ploiting invention i in country j. As mentioned above, it is not difficult to imagine that the value
of these opportunities varies systematically depending on the size of and trade with the target
market.37 While some of these factors may be observed by the econometrician, others are not.
To account for these sources of variation, I assume, first, that the value of patent protection can
be expressed as a fraction of the size of the domestic market, and second, that this fraction de-
pends on institutional and market factors exogenous to the inventor, on the invention's quality,
and on country-specific investment opportunities. These assumptions are formalized by modifying
eqilations (5) and (6):
36?;ote that Cjo already incorporates an estimate of the cost of translating the application, which is required by
law. taken from Helfgott (1993). 3'\laskus and Penubarti (1995) make the slightly different point that, acmas a broad range of countries and
industrial sectors, the level of imports varies positively with their measure of patent strength, an instrumented
version of the subjective scale given in Rapp and Rozek (1990)
A5 Let p, = v . .\Ii be the expected "mark:et sh,are3 in of a patent i n coun ty j , where Mi iS the
GDP of coun.ty j , and u is a parameter to be estimated. Let Xij be a vector of ezogenous linear
sh,iffers of the returns distribution, having param.eter vector :i. Then
I choose current exports from H to j , E H ~ , as an appropriate shifting variable x?%aving parameter
A5 transforms this formulation into a random-coefficient model. In contrast to Mj (a share
of which is directly drawn by the patentee), however, the role of exports is to proxy for the plethora
of bilateral institutions and investments that determine both trade in goods and the value of patent
prot,ection.
There are many possible sources of invention-level returns heteroskedasticity, for both a, and
. One frequently discussed source is differences in the share of GDP devoted to R&D: higher
R&D intensities might reflect a greater likelihood of success at research; on the other hand, they
might also reflect the positive payoffi to marginal research projects when spread over a larger
(domestic) economy. A structural model of the returns to research would identify the specific form
of the heteroskedasticity; since such a model is not our primary concern, I treat R&D intensity as
another element of X, the vector of returns shifters, having parameter yRD.40
381n principle, elements of Z may appear in X also (entering non-linearly through the amortization of the iixed
cost). as they may affect returns directly, in addition to their indirect effect on costs. Far example, we could identify
separate effects both for the higher filing costs of small inventors, and for lower expected foreign returns. I ignore
this possibility. "While current exports are likely to be correlated with past R&D and patenting success, they should not be
corl-elated with realizations of the current patent cohort except ~ e r h a p s indirectly, through the choice of the R&D
projects that gave rise to them.
' '~his specification introduces L'heteroakedasticity" into the model because the variance of a lognormal random
variable depends on p, and p now depends on R&D intensity. Similar efforts to induce the dependence of o, on R&D
resulted in convergence to lower likelihood values.
Finally. I assume that there exist country-specific fixed effects, most notably the strength and
cost of enforcing patent protection, that are independent of market size." These are captured by
country-specific indicators Dl. Thus, the maintained distributional assumptions are gathered in
Assumption A6:
I compare the estimated fixed effects with the Maskus and Penubarti estimates in section 5.
Incorporating these modifications to (a), I obtain the following contribution by invention i to
the likelihood function:
where K(.) is
"Obviously, legal institutions constitute only part of the fixed effect attributable to each country. Economists have
made some attempts to distinguish more horn less valuable patent regimes (e.g., Rapp and Rozek (1990), Maskus
and Penubarti (1995). and Ginarte and Park (1996)).
RD. . an<[ 1s 'he research intensity of the country in which the ith invention originated. The invention- . , specific returns threshold &j is
Ki th these modifications, and the assumption that f = .85 (taken from the midrange reported by
Pakes (1986) and Schankerman and Pakes (1986)), the vector 0 then becomes
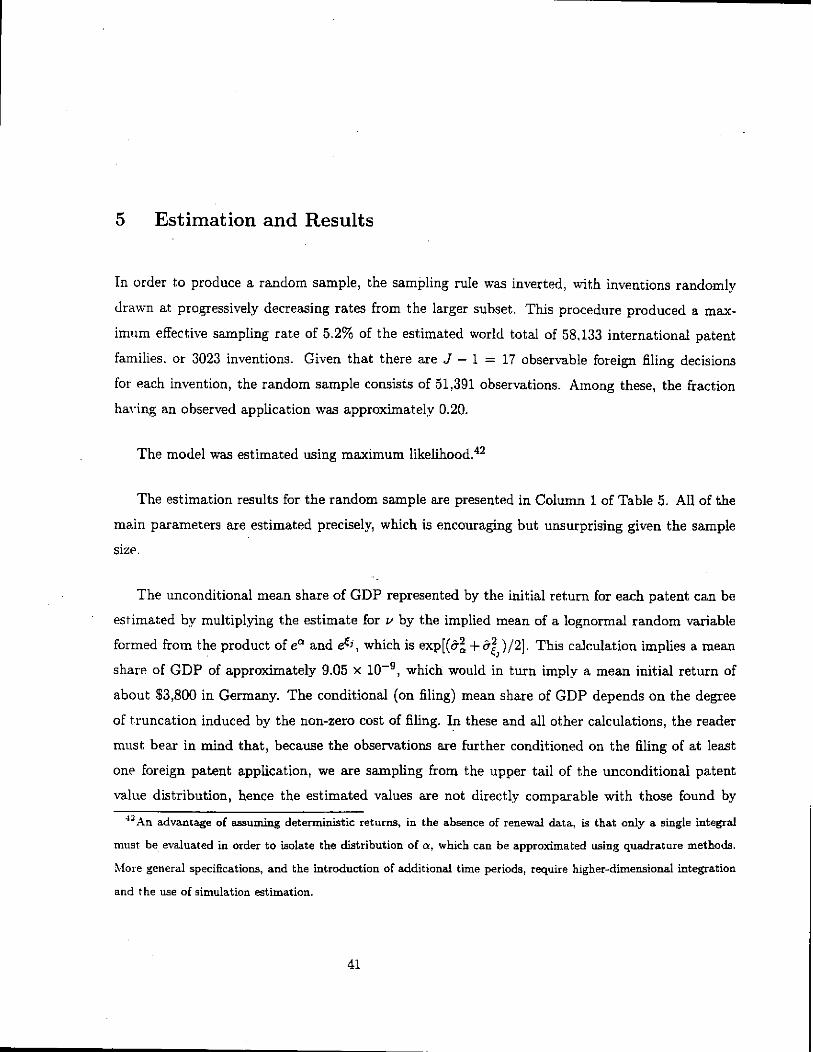
5 Estimation and Results
In order to produce a random sample, the sampling rule was inverted, with inventions randomly
drawn at progressively decreasing rates from the larger subset. This procedure produced a max-
imum effective sampling rate of 5.2% of the estimated world total of 58.133 international patent
families. or 3023 inventions. Given that there are J - 1 = 17 observable foreign filing decisions
for ~ a c h invention, the random sample consists of 51,391 observations. Among these, the fraction
having an observed application was approximately 0.20.
The model was estimated using maximum likelihood.42
The estimation results for the random sample are presented in Column 1 of Table 5. All of the
main parameters are estimated precisely, which is encouraging but unsurprising given the sample
size.
The unconditional mean share of GDP represented by the initial return for each patent can be
estimated bv multiplying the estimate for v by the implied mean of a lognormal random variable
formed from the ~ roduc t of em and e t j , which is exp[(+: + 5;; )/2]. This calculation implies a mean
share of GDP of approximately 9.05 x lo-', which would in turn imply a mean initial return of
about $3,800 in Germany. The conditional (on filing) mean share of GDP depends on the degree
of t,runcation induced by the non-zero cost of filing. In these and all other calculations, the reader
must bear in mind that, because the observations are further conditioned on the filing of at least
one Foreign patent application, we are sampling from the upper tail of t,he unconditional patent
value distribution, hence the estimated values are not directly comparable with those found by 4 2 An advantage of assuming deterministic returns, in the absence of renewal data, is that only a single integral
must be evaluated in order to isolate the distribution of a, which can be approximated using quadrature methods.
More general specifications, and the introduction of additional time periods, require higher-dimensional integration
and the use of simulation estimation.
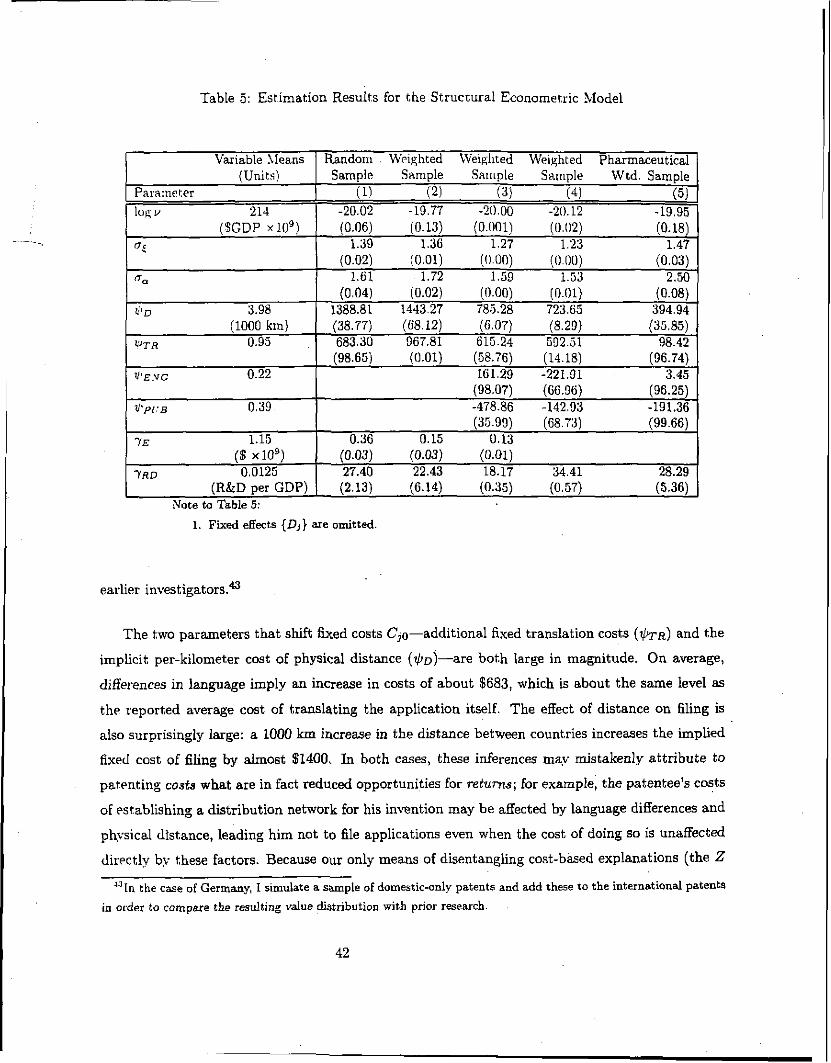
Table 5 : Estimation Results for t,he Structural Econometric Model
Variable \leans Randonl Wrighted LVeigllted Weighted Pharmaceutical (Units) Samplr Sample Saltlple Sar~lple Wtd.Sample
Parameter (1) (2) (3) (4 ) (5) 1011 L/ 214 -20.02 -19.77 -20.00 -20.12 -19.95
('SGDP x lo9) (0.06) (0.13) (0.1101) (0.02) (0.18)
"< 1.39 1.36 1.27 1.23 1.47 (0.02) (0.01) (0.00) (0.00) (0.03)
f lm 1.61 1.72 1.59 1.53 2.50 (0.04) (0.02) (0.00) (0.01) (0.08)
$10 3.98 1388.81 1443.27 785.28 723.65 394.94 (1000 km) (38.77) (68.12) (6.07) (8.29) (35.85)
WTR 0.95 683.30 967.81 615.24 502.51 98.42 (98.65) (0.01) (58.76) (14.18) (96.74)
V'EZIG 0.22 161.29 -221.91 3.45 (98.07) (66.96) (96.25)
VPL:B 0.39 -478.86 -142.93 -191.36 (35.89) (68.73) (99.66)
YE 1.15 0.36 0.15 0.13 ($ ~ 1 0 ~ ) (0.03) (0.03) (0.01)
Tan 0.0125 27.40 22.43 18.17 34.41 28.29 (R&D per GDP) ( (2.13) (6.14) (0.35) (0.57) (5.36) 1
Note to Table 5:
1. Fixed effects {D,} are omitted,
earlier investigators.43
The two parameters that shift fixed costs Cia-additional fixed translation costs (hR) and the
implicit per-kilometer cost of physical distance ($D)-are both large in magnitude. On average,
differences in language imply an increase in costs of about $683, which is about the same level as
the reported average cost of translating the application itself. The effect of distance on filing is
also surprisingly large: a 1000 km increase in the distance between countries increases the implied
fixed cost of filing by almost $1400, In both cases, these inferences may mistakenly attribute to
patenting costs what are in fact reduced opportunities for returns; For example, the patentee's costs
of establishing a distribution network for his invention may be affected by language differences and
physical distance, leading him not to file applications even when the cost of doing so is unaffected
directlv by these factors. Because our only means of disentangling cost-based explanations (the Z
"In the case of Germany, I simulate a sample of domestic-only patents and add these to the international patents in order to compare the resulting value djstributioo with prior research.
verror) from returns-based explanations (the X vector) comes from the identification achieved by
the non-linear entry of Z into the likelihood, rather than from any independent information, and
because the level of exports from one country to another reflects at least indirectly the costs of
distance and language barriers between the countries, I have chosen the parsimonious representation
that imputes all costs to the patent filing decision.
The parameters that are assumed to shift the returns distribution, the R&D intensity of the
home country ( y R D ) and the exports from the home to the foreign country ( y E ) , are also econom-
ically as well as statistically significant. The estimates imply that a patent originating in the U.S.
is on average worth about 47% more in world markets than one originating in Italy, given that the
U.S.'s R&D intensity is about three times Italy's. This inference is especially noteworthy given
that it excludes from the calculation the domestic value of patent rights; adding domestic values to
the U.S. and Italy, given the size of their respective economies, would increase this disparity. One
interpretation of this result is that U.S. inventors choose higher risk projects with higher expected
returns? and can, in effect, insure themselves by conducting more projects t,hat earn positive returns
ewn on some marginal research outcomes due to the larger scale of the economy. On the other
hand, because R&D intensity is employed in a reduced-form fashion as a returns shifter, rather
t,han structurally, this interpretation should not be overstressed: R&D intensity proxies well for
the general level of development in the source economy, and is highly correlated with education,
capital and infrastructure investment (and, of course, with both R&D levels and the R&D s tock) ,
all of which might similarly explain systematic differences in the qualitv of inventions produced.
The finding that even similarly developed countries apparently do not draw from the same value
distribution is suggestive, however, and deserves further investigation.
The impact of exports on the returns distribution is both large, and complicated by an artifact
of the data. The US.-Canada bilateral trading relationship is far and away the largest in the world
(in 1974, U.S. exports to Canada exceeded $21 billion; the next largest pairwise trade was Japan's
exports to the U.S., which amounted to about half that). U.S.-Canada patents are also the most
conlmon patent combination (as noted previouslv, about 9% of all international families). Because
US.-Canada t,rade explains U.S.-Canada patenting much better than the countries's gross domestic
products, and because US.-Canada patent families constitute a large fraction of the sample, trade
may assume an undeservedly prominent role in shifting the returns distribution. This role can
be seen in the magnitude of the implied impact on the value of US.-Canada patenting: exports
increase the mean value of patents by about 1000 times over that implied by the the unconditional
mean level of trade between all sample country pairs. Since t,he volume of U.S.-Canada exports is
only about 19 times the sample mean, this estimate seems impIausiblv high. I use this puzzle to
int,roduce a more general discussion of robustness issues and alternative specifications.
Two-country families are quite frequent: over the entire sample, they constitute more than
one-third of the observed international families. Given the size of the U.S. market, the proximity of
Canada to the U.S., their common language, and the fact that most Canadian applications are filed
first in the US. , it is not surprising that we observe such a kequent pairing. The broader question
t,hese figures raise is whether or not the estimates of the a distribution are unduly influenced by
relatively low-value patentfamilies, when, a s an economic matter, the upper-tail mass is the most
critical to estimate precisely.
An obvious approach to mitigating the US.-Canada problem, and to improving estimation effi-
ciency generally, is to oversample larger patent families. This implies, of course, that the sampling
rule is choice-based, which in turn implies in general that parameter estimates are inconsistent.
Coslett (1981b) discusses this problem and proposes a minimax pseudo-likelihood estimator that
incorporates sample information into the estimation of Lagrangian multipliers A, to assign to ob-
servations in each choice class, s = 1,. . . , S, where S is the total number of choices. In effect,
t,hese multipliers optimally reweight the observation by compensating for its endogenous selection
into the sample. As a estimate, Coslett suggests a consistent but inefficient weight
that is derived from the expected and observed frequencies of each choice in the sample, given the
endogenous sampling rule.
In rhe present case, we are confronted with a large number of observations, avery large number of
possible choices, and a full information estimation algorithm that requires minimizing with respect
to A. then maximizing with respect to 0, at each iteration (which is computationally costly).
Illoreover. in this problem the choices (to file or not in each country, and therefore the choice
of the patent family combination) are independent, conditional on a. By oversampling on large
families (i.e., those with stochastically larger a draws), we preserve this most of this independence,
and therefore do not introduce the same potential for bias that would be present if we were to
oversample on patent families that did not originate in the U.S. or Canada. Therefore, I construct
a second sample of patent families using the following rule, which generates what Coslett terms an
"augmented" sample: a random sample one-third the size of the original was drawn; in addition, a
sample two-thirds the size of the original was drawn randomly from patent families with Wigs in 10
or more countries." In other words, for sampling purposes I assume that the endogenous "choice"
made by inventors is binary: to file in 10 or more, or 9 or fewer, countries. The weights assigned
to each are determined by the expected frequency of each choice in the combined sample, which
is assumed to be known with ~ertainty.~' The result is a dataset of the same size as the random
sample, but the fraction of observations in which a filing is observed more than doubles, from 0.20
to about 0.50. Coslett (1981a) shows that estimates of 0 derived from this procedure are consistent
but inefficient. Given the large sample, the further gains from efficient estimation would seem to
be outweighed by the additional computational burden of the full-information method; moreover,
t,he limited-information method is still significantly more efficient in its use of filing information,
for a given sample size, than is maximum likelihood on the random sample.
The results of estimating the model on the choice-based sample are shown in Column 2 of
Tathe 5. The most significant change is that the coefficient on exports falls by nearly tmth i rds .
As applied to US.-Canadian trade, the implication is that the increase in t,he value of patent rights
"[t must be noted that we may not eliminate bias completely: this sampling rule slightly favors inventions origi-
nating in Europe, where the shorter distances between countries increase the expected family size, conditional on or.
Over the entire sample, about 8% of all families are filed in 10 or more countries; among European-origin families,
the share is 9.7%. 45 Since the original dataset sampled 50.1% of all families having 10 or more filings, this assumption appears to be
reasonable.
exchanged between the two countries is about 15 times the value implied b,v trade between the
mPan country pair, an estimate that is in line with the ratio of US-Canadian to mean pairwise
trade.
Column 3 of Table 5 explores two changes to the method of estimating the cost of filing a
patent application. The first tests for any evidence that there is an implicit benefit to filing in
English-language countries; both the U.S. and the U.K. receive a large number of priority applica-
tions from non-English-speaking countries, and English is in some ways the modern lingua francs of international commerce. The second change tests indirectly for a problem introduced by mea-
surement error and sample selection: in countries where onlv granted patents are published, the
applicant had to expend additional resources in order to reach the granting stage. The observation
of a granted application should imply unmeasured costs that were incurred in the course of its
prosecution.
The English-language fixed affect does not have the expected sign and is statistically insignifi-
cant. Somewhat surprisingly, the correction for the effects of sample selection on the cost of filing
shows significantly lower costs for filing in countries that onlv publish granted patents. There are
two possible explanations for this estimate: (1) the naive measurement error correction (A3) now
overstates the likelihood of filing low-value patents, since the probability that an application is filed
bur not observed is assumed to be independent of a; (2) applicants derive an unobserved benefit,
in the form of early information about the true value of their patents, from filing in countries (like
the US.) that automatically examine the patent as part of the application process.46
There are several sources of measurement error that could lead to incorrect inferences. Probably
t,he weakest source of data appears also to be the most crucial: estimates of the legal and translation
fees, which are based on a small sample and which, in any event, vary from patent to patent. AS a
'"n Putnam (1996) I Bnd that, in a dynamic model of learning during the Paris Convention intend, the "better
informed" the patent office, as measured by the number of patents it issues, the more attractive it is aa a choice of
priority country. Typically, the .'first action on the merits" in the V.S. occurs before the one-year Paris Convention
filing deadline.
gross check on this potential problem, I also estimated the model using 2Cijjo and Cijo + $2000 as
alternative estimates of the fixed cost. In both cases, the parameter estimates were similar to those
reported in Column 1, except for a slight increase in u, but the value of the likelihood function
was Because the expected value of the lognormal distribution varies linearly with v , but
quadratically with u,, the effects of this small change in v are minor compared with, for example,
sampling variation in Monte Carlo simulations. Accordingly, I ignore this possible source of error
in the following discussion, while continuing to search for better data sources and better methods
of incorporating endogenous sources of cost variation into the model.
Although a detailed investigation of sectoral differences in the value of patent protection lies
beyond our present concerns, we can compare the results for the entire sample with those for the
sector that traditionally places the greatest importance on patent protection, namely pharmaceuti-
cals. The 1974 cohort contained 1119 international pharmaceutical families,48 averaging about 7.0
filings each, or about 2.4 more filings than the unconditional sample average.
The model was estimated after eliminating exports as a returns shifter; preliminary estimates
suggested the export coefficient was insignificant or negative, and pharmaceutical trade data could
not be observed for all country pairs. The results are shown in Column 5 of Table 5. In conformity
with both small- and large-sample results obtained by others, the most critical change is the sharp
increase in u, from about 1.5 to about 2.5, which implies a sharply increased mean and variance
in the value distribution. The change in u,, coupled with the increase in u, imply that the uncon-
ditional share of GDP obtained by an initial pharmaceutical draw was about 1.58 x lo-', or about
$6626 in Germany. It is noteworthy that in this sample both the implicit cost of translation and
4 7 ~ , ote that a doubling of C;,o does not imply a doubling of theminimum required return s j , nor does it greatly
affect the critical parameters of the returns distribution, o. and uc. First, it is the present value of the minimum
initial return 2, that must double. Because patents with higher returns are also renewed longer, they have additional
years with which to recoup the additional 6 x 4 cost. Second, and more importantly, only marginal patents are
affected by the perturbation in costs; the model compensates for the increase in costs via a slight increase in W , which
increases the expected share of GDP received by a patent. in order to restore the probability of filing to the level it
had been prior to the increase in C,,o. '"hese were defined as all families classified with a Derwent "8" ("Farmdoc", or pharmaceutical document) code.
the ilnplicit cost, of distance are about half their level in the overall sample. Since the vast ma,jority
of these patents are filed bv large pharmaceutical companies. it mav be the case that such firms
have found that their large volumes of inventions and large number of filings per invention justify
investments in cost-reducing infrastructure, like translators, telexes and retainer relationships with
foreign patent agents.
6 Monte Carlo Simulation
The Monte Carlo simulations reported in this section consist of draws that attempt to duplicate
the sample of patents observed for the 1974 patent cohort. In order to duplicate the entire cohort
of intrrnat,ional patent families, I need to generate 58,133 inventions having positive net value in
at least one countrv. I draw separately for each country according to the number of inventions
it g~nerated in the cohort, in order to reflect the different costs and opporturlities available to
inventors from different countries.
For each invention i, then, I draw an cri and a set {{ij}, and determine whether an invention
having t,hese attributes would have been filed anywhere, given its country of origin. On average,
this requires about 25% more draws than there are inventions, because of the truncation induced by
the cost of filing. In these simulations, I assumed that, in each country, applications independently
matured into patents at the same rate did foreign applications in the US.. which was about 0.63.~'
Onlv "granted" patents, thus defined, enter into the following value calculations.
Despite the apparently favorable reduction in the export coefficient that results from oversam-
pling and thereby de-emphasizing US.-Canadian trade, Monte Carlo simulations using estimates
from Column 3 of Table 5 produce questionable results.50
In order to generate more plausible estimates, I re-estimate the model, omitting exports. The
'".4hhough this method neglects the information on patent granting rates that is available for the individual
countries, the countries are not comparable because of the endogenous attrition that results hom the option of
delaying examination. Because the U.S. examines a high percentage of all international families, and because it does
so automatically rather than at the discretion of the applicant, its rate of foreign granting seems to be the clonest
estimate we have to a common granting standard across countries. Therefore, in eafh country, I drew an independent
random variable that determined whether the application was "granted". 3 a ~ h e most suspect of these is the value of patent rights held in Canada. which, in unreported simulations, averages
about 20% of the total world value of patent rights. This value is almnst entirely attributable to U.S. patenting and
the protection of U.S. exports. The value of U.S. patent rights held in Canada is estimated to exceed 25% of its total
value of exports to Canada.
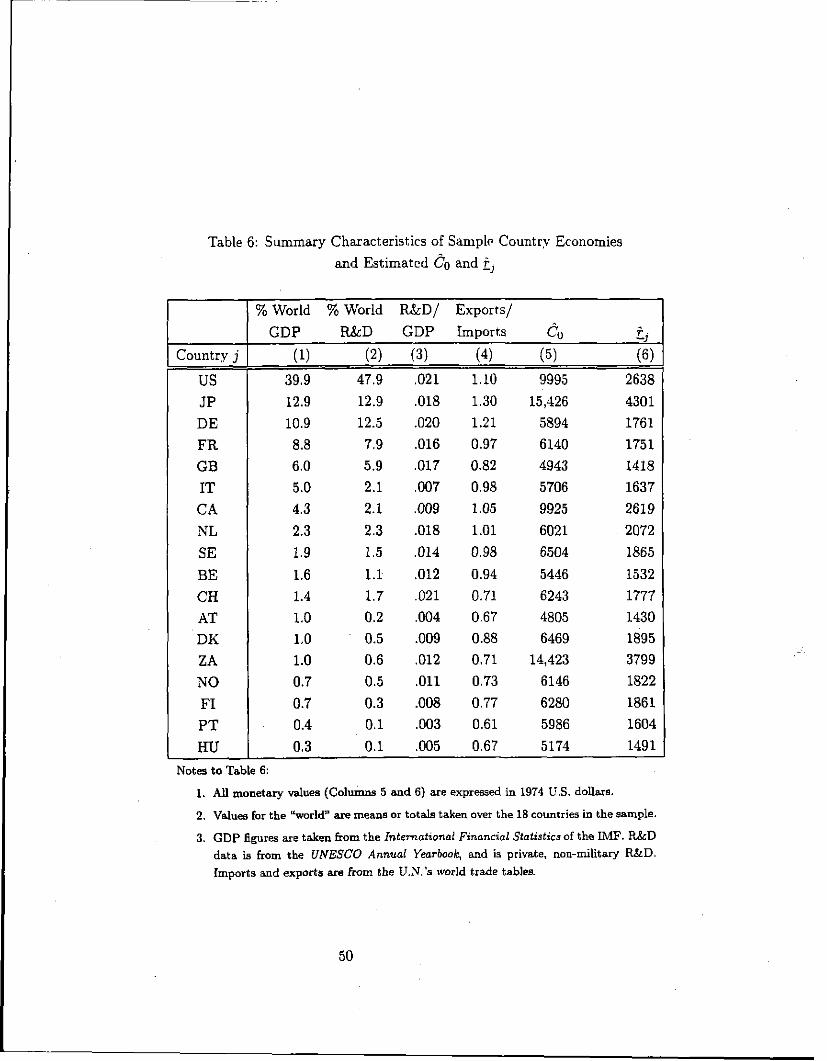
Table 6: Summary Characteristics of Sample Country Economies
and Estimated & and f,
% World % World R&D/ Exports/
GDP R&D GDP Imports ~o -I i..
Country j (1) (2) (3) (4) (5) (6)
US 39.9 47.9 ,021 1.10 9995 2638
J P 12.9 12.9 ,018 1.30 15,426 4301 DE 10.9 12.5 ,020 1.21 5894 1761
FR 8.8 7.9 ,016 0.97 6140 1751
GB 6.0 5.9 ,017 0.82 4943 1418
IT 5.0 2.1 ,007 0.98 5706 1637
C A 4.3 2.1 ,009 1.05 9925 2619
NL 2.3 2.3 ,018 1.01 6021 2072
SE 1.9 1.5 ,014 0.98 6504 1865
BE 1.6 1.1 ,012 0.94 5446 1532
CH 1.4 1.7 ,021 0.71 6243 1777 AT 1.0 0.2 ,004 0.67 4805 1430 DK 1.0 0.5 ,009 0.88 6469 1895
Z A 1.0 0.6 ,012 0.71 14,423 3799
NO 0.7 0.5 ,011 0.73 6146 1822
FI 0.7 0.3 ,008 0.77 6280 1861
P T 0.4 0.1 ,003 0.61 5986 1604
HU 0.3 0.1 ,005 0.67 5174 1491
Note4 to Table 6:
1. All monetary values (Columns 5 and 6) are expressed in 1974 U.S. dollars.
2. Value8 for the 'brarld" are means or totals taken over the 18 countries in the sample.
3. GDP figures are taken from the International Financial Statisticsof the IMF. R&D data is from the UNESCO Annual Yearbook, and is private, non-military RkD. Imports and exports are from the U.N.'s world trade tables.
results are shown in Column 4 of Table 5. The principal change from t,he previous model is the
near-doubling of the effect of U D intensit,?-which is correlated with the level of exports.
Data ?.hat assist in interpreting the Monte Carlo results are found in Columns 1-6 of Table 6.
Countries are ranked by Column 1, which gives each country's share of total GDP among the 18
countries in the sample; Column 2 gives t,he corresponding share of R&D. Note that in 1974 the
U.S. was responsible for almost half of all R&D undertaken b,v these countries. Column 3 shows
the RSiD intensity-the ratio of F&D to GDP-in each country. Although exports do not enter
t,he estimates in the model selected for simulation, for comparison purposes I present the ratio of
total exports to total imports within the l&count,ry sample in Column 4.
Columns 5 and 6 present two indicators of the cost of filing in each country. Column 5 shows
t,he unweighted mean cost of filing for inventors seeking to file in each country, averaged across
inventors from each of the countries in the sample, using the estimates from Column 4 of Table 5.
The average implicit cost of filing ranges from $4,800 in Austria to $15,400 in Japan. Relative
to recent estimates of filing costs, (such a s those found in Helfgott (1993) expressed in 1974 U.S.
dollars), t,hese estimates appear somewhat high. On the other hand, they take into account shadow
costs, such as distance and language differences, that are not normally represented in out-of-pocket
cost estimates. Distance is the largest component of costs (although in the model used for Monte
Carlo simulation the shadow cost of a 1000 km increase in distance is actually about half the
estimate from the random sample). Column 6 gives the estimated zj for each country, again
averaged over all i, which ranges from $1418 in the U.K. to $4301 in Japan.
In general, the simulated counts of patent applications conform to the actual totals reasonably
closely. Columns 1 and 2 of Table 7 present t,he actual and estimated number of applications,
as percentages of the world total, filed in each country; Columns 1 and 2 of Table 8 present
the corresponding percentages of total applications filed by inventors from each country. The
model tends to overestimate the share of applications filed in the United States by about one
percentage point, and overpredicts the number of filings made by some European countries, while
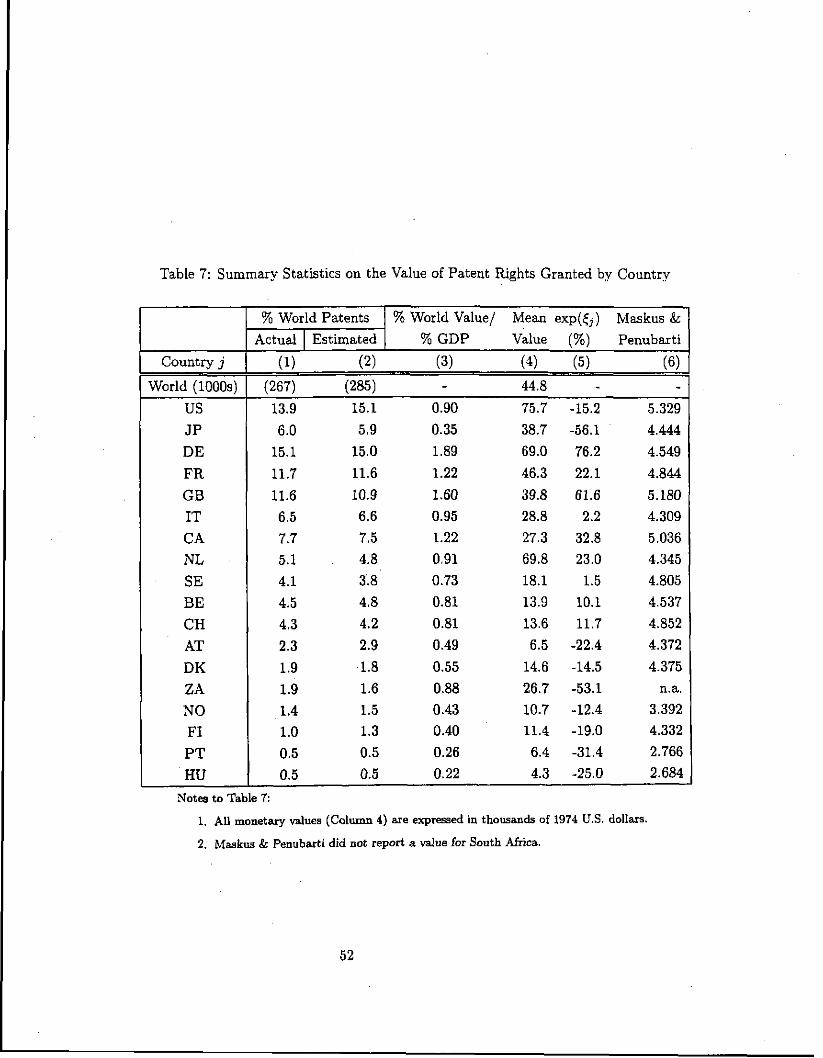
Table 7: Summary Statistics on the Value of Patent Rights Granted by Countrv
- % World Patents % World Value/ Mean exp(G) Evfaskus &
Actual 1 Estimated % GDP Value (%) Penubarti
Country j (1) (2) (3) (4) (5) (6) World (1000s) (267) (285) - 44.8 -
US 13.9 15.1 0.90 75.7 -15.2 5.329 J P 6.0 5.9 0.35 38.7 -56.1 4.444 DE 15.1 15.0 1.89 69.0 76.2 4.549
FR 11.7 11.6 1.22 46.3 22.1 4.844
GB 11.6 10.9 1.60 39.8 61.6 5.180 IT 6.5 6.6 0.95 28.8 2.2 4.309 CA 7.7 7.5 1.22 27.3 32.8 5.036 NL 5.1 4.8 0.91 69.8 23.0 4.345
SE 4.1 3.8 0.73 18.1 1.5 4.805
BE 4.5 4.8 0.81 13.9 10.1 4.537
CH 4.3 4.2 0.81 13.6 11.7 4.852
AT 2.3 2.9 0.49 6.5 -22.4 4.372
DK 1.9 1 . 8 0.55 14.6 -14.5 4.375
Z A 1.9 1.6 0.88 26.7 -53.1 n.a.
NO 1.4 1.5 0.43 10.7 -12.4 3.392 FI 1.0 1.3 0.40 11.4 -19.0 4.332 PT 0.5 0.5 0.26 6.4 -31.4 2.766 HU 0.5 0.5 0.22 4.3 -25.0 2.684
Notea to Table 7:
1. All monetary values (Column 4) are expressed in thousands of 1974 U.S. dollars.
2. Maskus & Penubarti did not report a d u e for South Africa.
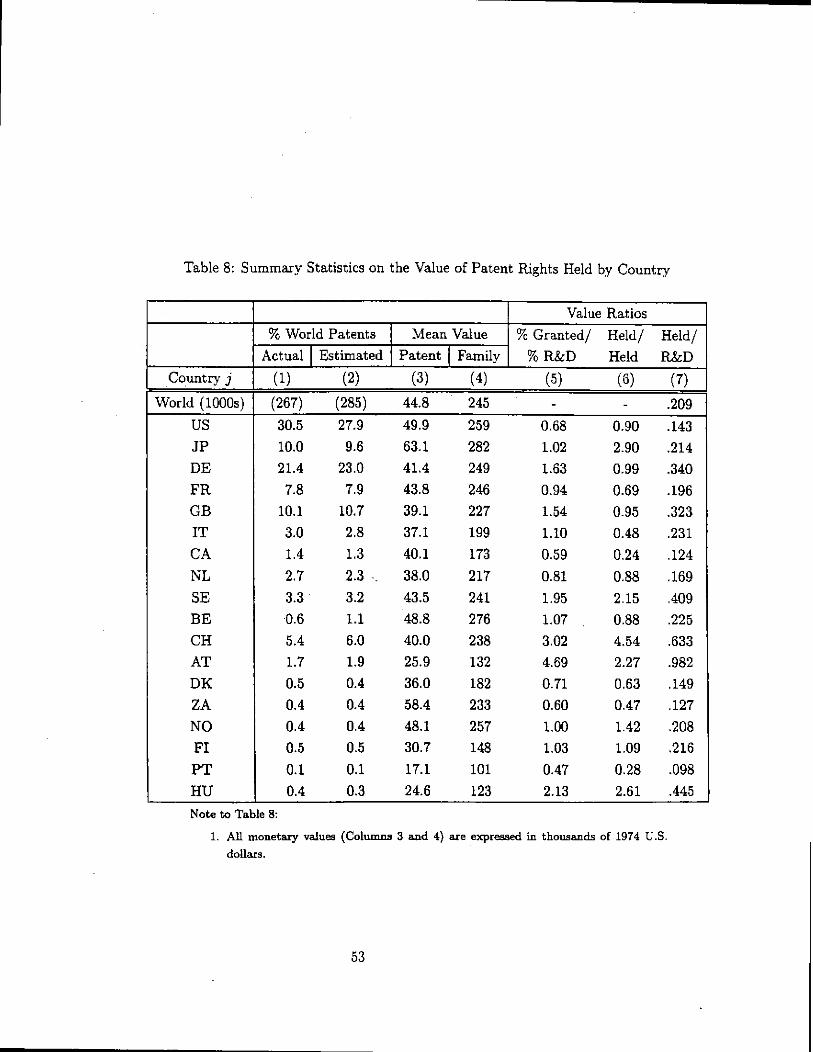
Table 8: Summary Statistics on the Value of Patent Rights Held by Country
Note to Table 8:
1. All monetary values (Columns 3 and 4) are expressed in thousands of 1974 U.S dollars.
Country j
World (1000s)
US J P
DE
FR
GB IT
C A NL SE BE CH
AT DK
Z A NO FI PT HU
% World Patents I Mean Value Actual I Estimated I Patent I Family
Value Ratios
% Granted/ Held/ Held/ % R&D Held R&D
(1) (2) (3) (4) (5) i (7)
(267) (285) 44.8 245 ,209
30.5 27.9 49.9 259 0.68 0.90 ,143 10.0 9.6 63.1 282 1.02 2.90 ,214 21.4 23.0 41.4 249 1.63 0.99 ,340
7.8 7.9 43.8 246 0.94 0.69 ,196 10.1 10.7 39.1 227 1.54 0.95 ,323 3.0 2.8 37.1 199 1.10 0.48 .231 1.4 1.3 40.1 173 0.59 0.24 ,124
2.7 2.3 -. 38.0 217 0.81 0.88 ,169 3.3 3.2 43.5 241 1.95 2.15 ,409 0.6 1.1 48.8 2 76 1.07 0.88 ,225 5.4 6.0 40.0 238 3.02 4.54 ,633 1.7 1.9 25.9 132 4.69 2.27 ,982 0.5 0.4 36.0 182 0.71 0.63 ,149 0.4 0.4 58.4 233 0.60 0.47 ,127 0.4 0.4 48.1 257 1.00 1.42 ,208 0.5 0.5 30.7 148 1.03 1.09 ,216
0.1 0.1 17.1 101 0.47 0.28 ,098 0.4 0.3 24.6 123 2.13 2.61 ,445
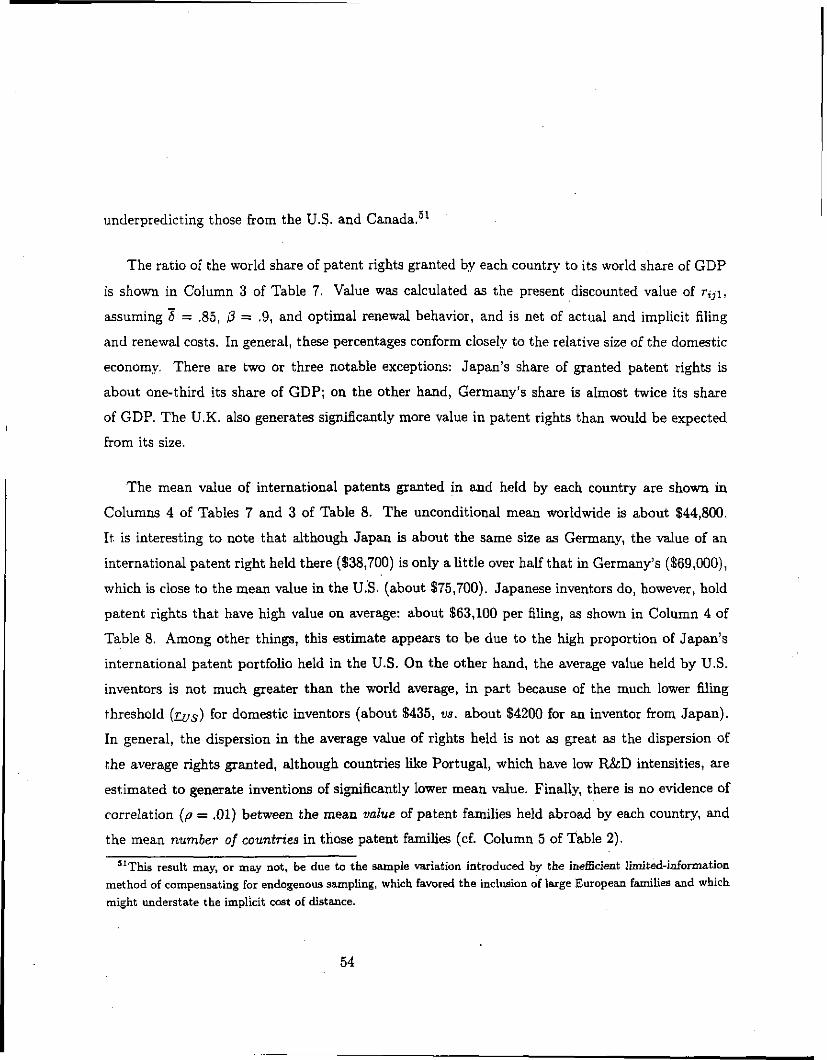
underpredicting those from the U.S. and Canada.jl
The ratio of the world share of patent rights granted by each country to its world share of GDP
is shown in Column 3 of Table 7. Value was calculated as the present discounted value of ri31,
assuming 8 = 25, a = .9, and optimal renewal behavior, and is net of actual and implicit filing
and renewal costs. In general, these percentages conform closely to the relative size of the domestic
economy. There are two or three notable exceptions: Japan's share of granted patent rights is
about one-third its share of GDP; on the other hand, Germany's share is almost twice its share
of GDP. The U.K. also generates significantly more value in patent rights than would be expected
from its size.
The mean value of international patents granted in and held by each country are shown in
Columns 4 of Tables 7 and 3 of Table 8. The unconditional mean worldwide is about $44,800.
It is interesting to note that although Japan is about the same size as Germany, the value of an
international patent right held there ($38,700) is only a little over half that in Germany's ($69,000),
which is close to the mean value in the U.'S. (about $75,700). Japanese inventors do, however, hold
patent rights that have high value on average: about $63,100 per filing, as shown in Column 4 of
Table 8. Among other things, this estimate appears to be due to the high proportion of Japan's
international patent portfolio held in the U.S. On the other hand, the average value held by U.S.
inventors is not much greater than the world average, in part because of the much lower filing
threshold (ms) for domestic inventors (about $435, va. about $4200 for an inventor from Japan).
In general, the dispersion in the average value of rights held is not as great as the dispersion of
the average rights granted, although countries like Portugal, which have low R&D intensities, are
estimated to generate inventions of significantly lower mean value. Finally, there is no evidence of
correlation ( p = .01) between the mean value of patent families held abroad by each country, and
the mean number of countries in those patent families (cf. Column 5 of Table 2).
"This result may, or may not, be due to the sample variation introduced by the ine5cient limited-information method of compensating for endogenous sampling, which favored the inclusion of large European families and which might understate the implicit cost of distance
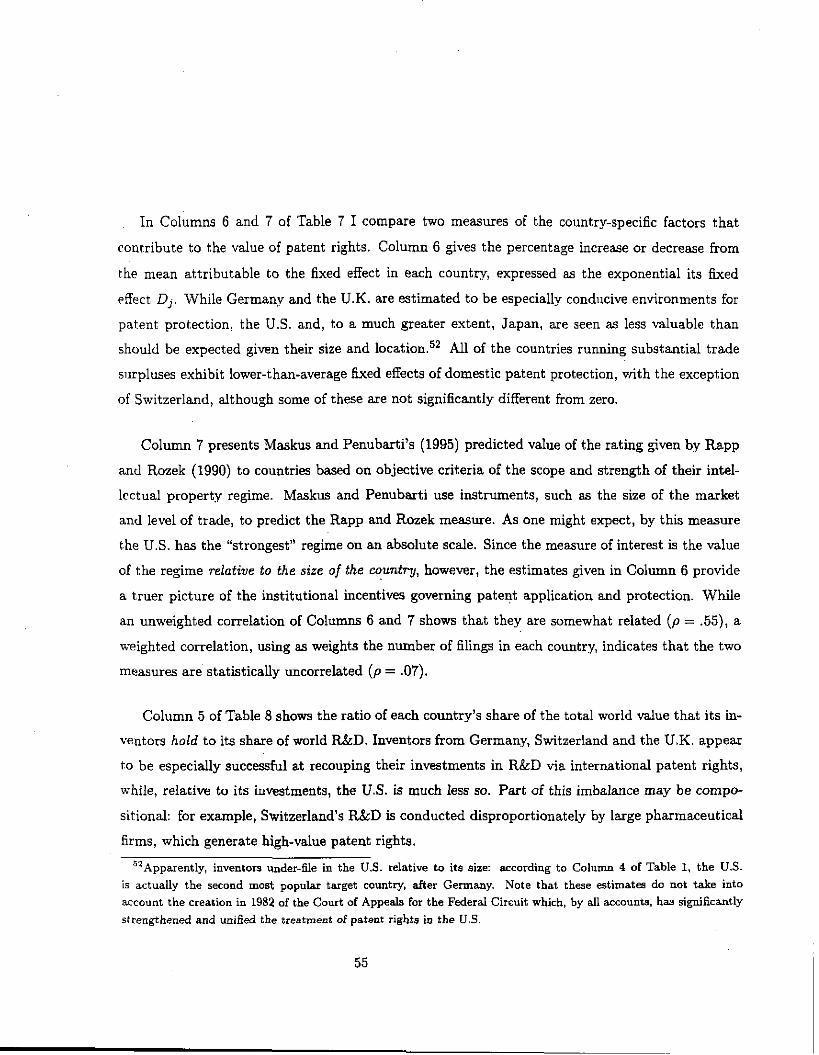
In ~ o l i m n s 6 and 7 of Table 7 I compare two measures of the country-specific factors that
contribute to the value of patent rights. Column 6 gives the percentage increase or decrease from
the mean attributable to the fixed effect in each country, expressed as the exponential its fixed
~ffect Dj. While Germanv and the U.K. are estimated to be especially conducive environments for
patent protection, the U.S. and, to a much greater extent, Japan, are seen as less valuable than
should be expected given their size and 10cation.~' All of the countries running substantial trade
silrpluses exhibit lower-than-average fixed effects of domestic patent protection, vrith the exception
of Switzerland, although some of these are not significantly different from zero.
Column 7 presents Maskus and Penubarti's (1995) predicted value of the rating given by Rapp
and Rozek (1990) to countries based on objective criteria of the scope and strength of their intel-
lectual property regime. Maskus and Penubarti use instruments, such as the size of the market
and level of trade, to predict the Rapp and Rozek measure. As one might expect, by this measure
t,he U.S. has the "strongest" regime on an absolute scale. Since the measure of interest is the value
of the regime relative to the size of the country, however, the estimates given in Column 6 provide
a truer picture of the institutional incentives governing patent application and protection. While
an unweighted correlation of Columns 6 and 7 shows that they are somewhat related ( p = .55), a
weighted correlation, using as weights the number of filings in each country, indicates that the two
measures are statistically uncorrelated ( p = .07).
Column 5 of Table 8 shows the ratio of each country's share of the total world value that its in-
ventors hold to its share of world R&D. Inventors from Germany, Switzerland and the U.K. appear
to be especially successful at recouping their investments in R&D via international patent rights,
while, relative to its investments, the U.S. is much less so. Part of this imbalance may be compo-
sitional: for example, Switzerland's R&D is conducted disproportionately by large pharmaceutical
firms, which generate high-value patent rights.
"2hpparently, inventors under-file in the U.S. relative to its size: according to Column 4 of Table 1, the U.S. is actually the second most popular target country, after Germany. Note that these estimates do not take into account the creation in 1982 of the Court of Appeals for the Federal Circuit which, by all accounts, has significantly strengthened and unified the treatment of patent rights in the U.S
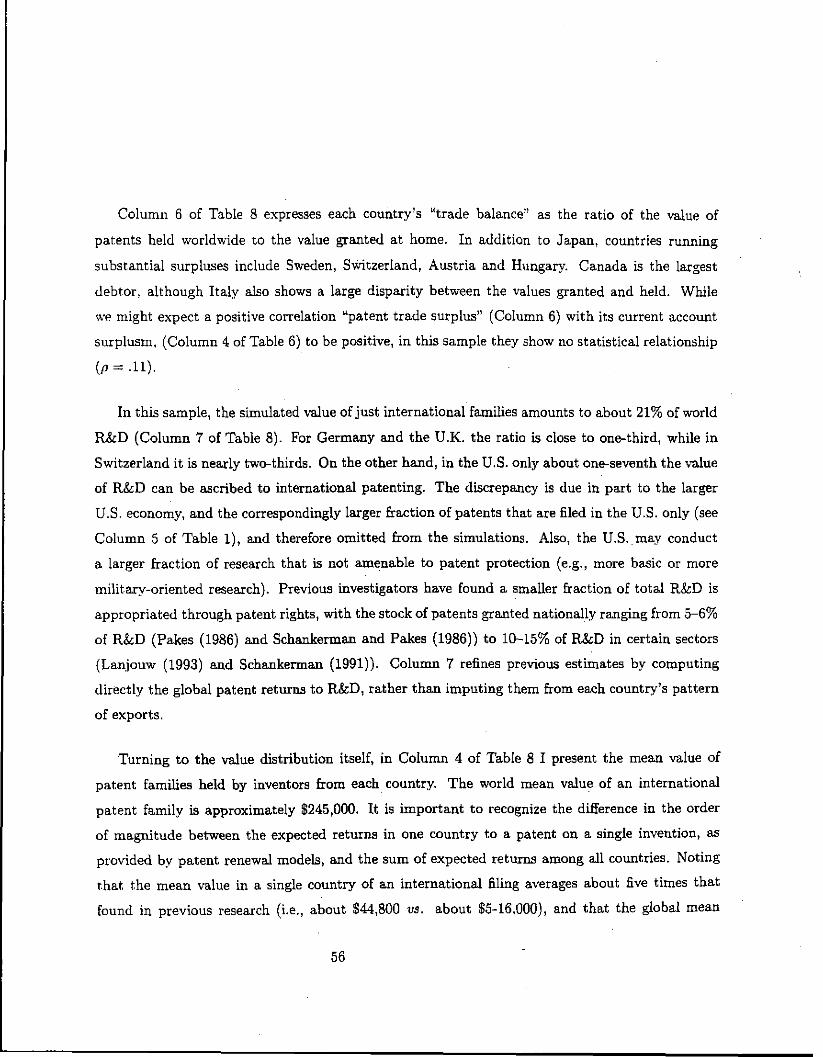
Column 6 of Table 8 expresses each country's "trade balance" as the ratio of the value of
patents held worldwide to the value granted at home. In addition to Japan, countries running
substantial surpluses include Sweden, Switzerland, Austria and Hungary. Canada is the largest
debtor, although Italy also shows a large disparity between the values granted and held. While
we might expect a positive correlation "patent trade surplus" (Column 6) with its current account
surplusm. (Column 4 of Table 6) to be positive, in this sample they show no statistical relationship
( p = .11).
In this sample, the simulated value of just international families amounts to about 21% of world
R&D (Column 7 of Table 8). For Germany and the U.K. the ratio is close to onethird, while in
Switzerland it is nearly twc-thirds. On the other hand, in the U.S. only about one-seventh the value
of R&D can be ascribed to international patenting. The discrepancy is due in part to the larger
U.S. economy, and the correspondingly larger fraction of patents that are filed in the U.S. only (see
Column 5 of Table I ) , and therefore omitted from the simulations. Also, the U.S.may conduct
a larger fraction of research that is not amenable to patent protection (e.g., more basic or more
military-oriented research). Previous investigators have found a smaller fraction of total R&D is
appropriated through patent rights, with the stock of patents granted nationally ranging from 5-6%
of R&D (Pakes (1986) and Schankerman and Pakes (1986)) to 10-15% of R&D in certain sectors
(Lanjouw (1993) and Schankerman (1991)). Column 7 refines previous estimates by computing
directly the global patent returns to R&D, rather than imputing them from each country's pattern
of exports.
Turning to the value distribution itself, in Column 4 of Table 8 I present the mean value of
patent families held by inventors from each country. The world mean value of an international
patent family is approximately $245,000. It is important to recognize the difference in the order
of magnitude between the expected returns in one country to a patent on a single invention, a s
provided by patent renewal models, and the sum of expected returns among all countries. Noting
that the mean value in a single country of an international filing averages about five times that
found in previous research (i.e., about $44,800 us. about $5-16,000), and that the global mean
value of patent rights on a single international family is another five times the single-country value
($245.000 us. $44.800). we can reasonably infer that the returns to patent protection provided by
the international patent system cover a much larger scale of research project than might have been
inferred from single-country estimates.
In Table 9 I provide the simulated pairwise trade balances for each of the countries in the sample,
along with each country's total surplus (deficit) as a percentage of the value of patent rights it holds
in international patents. Here we can easily contrast the dominance of the Big Five countries in
t,he number of patents they obtain worldwide with the value these patents create in each market.
Among the.Big Five countries, only Japan is estimated to run a surplus, but this surplus is quite
large, amounting to 65% of its total stock of international patent rights. The U.S., Germany and
the U.K. operate deficits ranging from 1 to 11% of their total stock; France's percentage deficit is
substantially greater. The U.S.'s deficit with Japan accounts for about 90% of its total deficit. If
we were to include more countries in the sample, the U.S. might show a surplus in non-Japanese
patent trade, although even relatively small countries like Sweden generate substantially greater
benefits from their patenting in the U.S. than vice versa.
6.1 The Distribution of Patent Values and its Fit to the Data
An ongoing theme of research on R&D returns and the private value of patent rights is the extreme
variance and skew of the value distribution. One of the limitations of patent renewal models in this
regard has been that a large share of the total value distribution is contained in its tail, which is
unobserved due to the statutory maximum lifetime imposed on patents.53 The unobserved tail of
she distribution must be inferred from the observable dropout rates. By adding a cross-sectional
dimension to the data, we obtain an additional 6x on the tail of the distribution through our
pstimate of a.
j3pakes and Sirnpsan (1989) present nonparametric evidence on the unobserved portion of the value distribution.
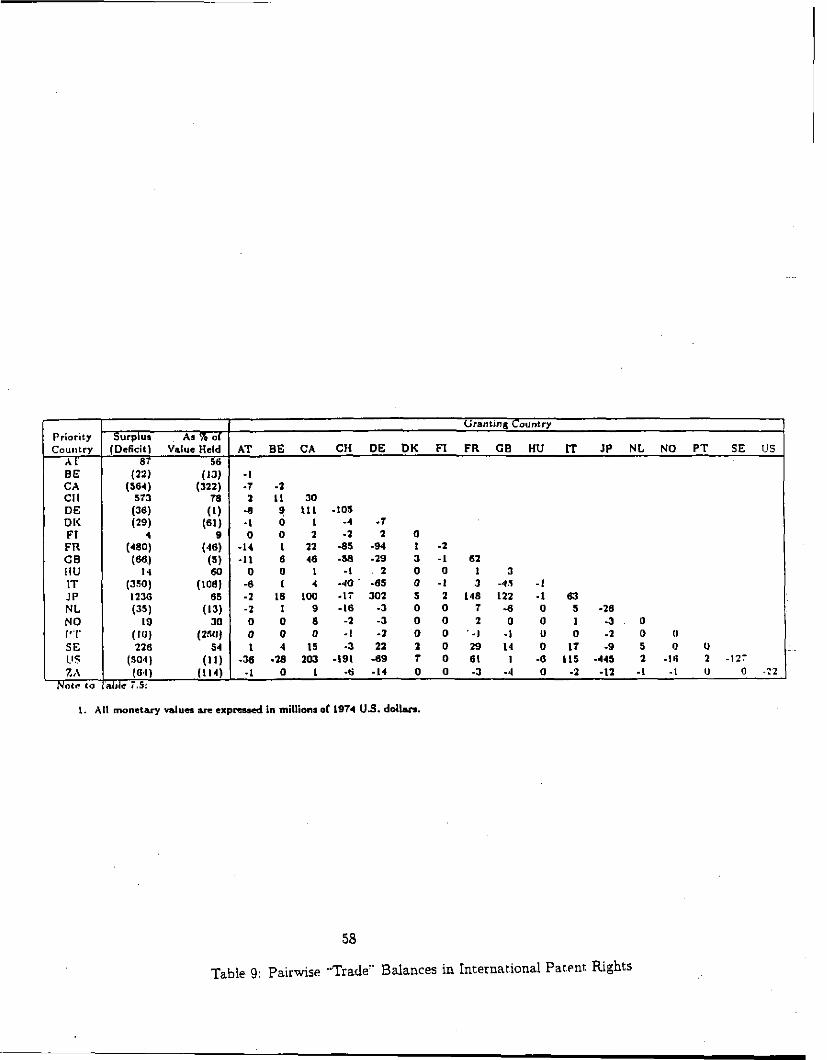
Notr to lulrle i .5:
I. All monetary d u e s are c x p d in millions or1974 U.S. dol1.n.
58
Table 9: Palrwise ,'Trade" Balances in Internar~onal Patent Rights
Grantins Country
AT B E CA C H DE DK P I F R C B H U JP NL NO PT SE IJS 8156
-I -7 -2 2 I 1 JO
-8 9 Ill -105 -I 0 I -4 -1
9 0 0 2 - 2 2 0 -14 I 12 -85 -94 1 -2 -11 6 46 -58 -19 3 -1 62
0 0 I - 1 . 2 0 0 1 3 -6 I 4 -40 - -6s o -1 3 -4.5 -1 -2 18 IW - 1 i 302 S 2 148 122 - 1 63 -2 1 9 - I 6 -3 0 0 7 -6 o 5 -28
3 0 0 0 8 - 2 - 3 0 0 2 0 0 ~ . ~ 0 0 0 0 - I -2 0 0 ' - 1 -1 u 0 -2 0 I , 1 4 15 -3 22 2 0 29 14 0 11 -9 5 0 #J
-36 -29 205 -191 -89 7 0 81 I -0 115 4 4 2 - I 6 2 -127 -1 0 1 -6 -14 0 0 -3 -4 o -2 -12 -1 .I u o .:z
Priority Country
A I BE C A C I I D E D I< F I FR C B I I U IT J P NL NO 1"r SE 113 z,\
Surplus As R or (Deficit) ValueHcld
(22) (13) (564) (322)
573 78 (36) (1) (29) (61)
4 (480) (48) ($6) (5)
I 4 a (350) ( laal 1236 65 (35) (13)
19 (10) (150) 226 54
( ~ 0 4 ) (11) (6.1) - - (! Id)
An efficient means of summarizing the distribution of the value of patent families is to compare
the sizes of families generated by the Monte Carlo simulations with those actually found in the
data. Figure 3 compares the actual density with that generated by the simulations and with
that implied by the multinomial (complete independence) model. In general, the simulated fit is
close: the model underpredicts twc-country families, slightly overpredicts medium-sized families,
and again slightly underpredicts the very largest families. The underprediction of two-country
families probably occurs because of the omission of exports a s a returns shifter; simulations made
using Column 3 rather than Column 4 of Table 5, which include exports and which, in particular,
account for the exceptionally large number of US.-Canadian patent families, do not exhibit this
discrepancy. Of course, the significance of this error in value terms depends on the proportion of
total value assigned to small families.
Table 10 augments the actual and estimated densities distributed by the size of the patent
family with the value density, and provides the corresponding the Lorenz coefficient. The error
in two-country families does not appear to affect significantly the value distribution,. since the
estimates imply that only 2.5% of the value distribution is contained in families of this size. The
value density is actually quite flat across family sizes, with families of between 7 and 16 countries
each accounting for between 6.8 and 8.2% of the distribution. In other words, over this range the
implied increment to value from adding a country is approximately offset, in the aggregate, by the
decreased frequency of observing families with the additional country.
As previously noted, researchers sometimes suggest that the number of countries in a patent
family be used as an indicator of its value. They do not, however, indicate how larger families
should be weighted relative to smaller families. In Column 7 of Table 10 I present the simulated
mean value for each patent family size, which ranges from about $20,000 for inventions filed in two
countries to about $11.2 million for inventions filed in all 18 countries. The means increase a t a
regular rate as countries are added to the family. A regression, weighted by the percent of the value
distribution (Column 5) , of the log of the mean value for a family of size n on the log mean of size
11, - 1 fits well:
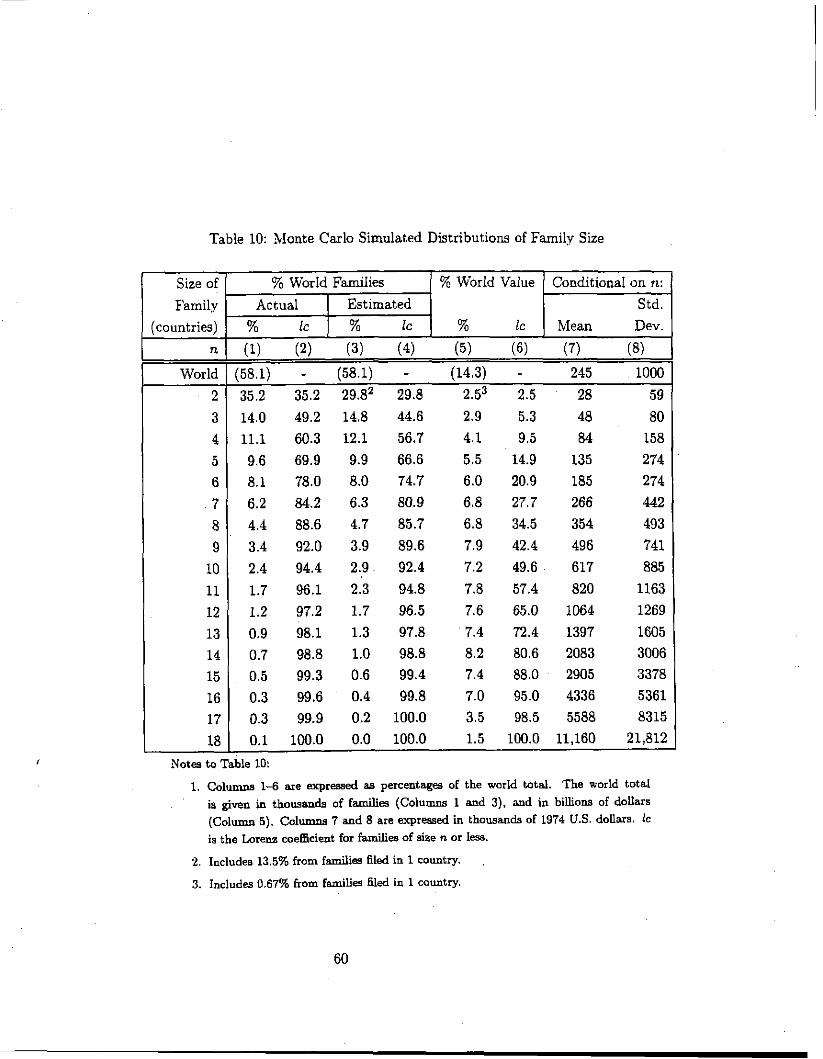
Table 10: Monte Carlo Simulated Distributions of Family Size
Notes to Table 10:
1. Columna 1-6 are expressed as percentages of the world total. The world total
is given in thousands of families (Columns 1 and 3), and in billions of dollars (Column 5). Columns 7 and 8 are expressed in thousands of 1974 U.S. dollars. lc is the Lorenz coefficient for families of size n or less.
Size of
Family
(countries)
2. Includes 13.5% from f d e s Bled in 1 country.
% World Value
% lc
% World Families
Actual I Estimated
% lc 1 % Ic
3. Includes 0.6% from families Ued in 1 country.
Conditional on n:
Std.
Mean Dev.
n
World
2
3
4
5
6
7
8 9
10
11
12
13
14
15
16
17
18
(1) (2) (3) (4) (5) (6) (7) (8)
(58.1) - (58.1) - (14.3) - 245 1000
35.2 35.2 29.82 29.8 2.53 2.5 28 59
14.0 49.2 14.8 44.6 2.9 5.3 48 80
11.1 60.3 12.1 56.7 4.1 9.5 84 158
9.6 69.9 9.9 66.6 5.5 14.9 135 274
8.1 78.0 8.0 74.7 6.0 20.9 185 274
6.2 84.2 6.3 80.9 6.8 27.7 266 442
4.4 88.6 4.7 85.7 6.8 34.5 354 493
3.4 92.0 3.9 89.6 7.9 42.4 496 741
2.4 94.4 2.9 92.4 7.2 49.6 617 885
1.7 96.1 2.3 94.8 7.8 57.4 820 1163
1.2 97.2 1.7 96.5 7.6 65.0 1064 1269
0.9 98.1 1.3 97.8 7.4 72.4 1397 1605
0.7 98.8 1.0 98.8 8.2 80.6 2083 3006
0.5 99.3 0.6 99.4 7.4 88.0 2905 3378
0.3 99.6 0.4 99.8 7.0 95.0 4336 5361
0.3 99.9 0.2 100.0 3.5 98.5 5588 8315
0.1 100.0 0.0 100.0 1.5 100.0 11,160 21,812
logm, = 0.774 + 0.967 l o g + 0.432 D l 8
(0.222) (0.017) (0.176) -2 R = ,9958
The close fit should be expected, given the "trend" in the data. The parameter estimates implv
that each additional country increases the expected value of the patent family by about 44%,
evaluated at the mean.54 Of course, there is still extreme variation within families of a given
"size"; Column 8 of Table 10 presents the standard deviations. For example, patent families having
12 countries have an expected value of about $1.06 million, with a standard deviation of about
$1.27 million; within the simulated sample, 12-country families ranged in value from about $29,000
to about 513.5 million. Analysis of variance shows that the size of the patent family, as indicated
by the number of countries, accounts for about 55% of the variance in the log of patent family
values.
6.2 Comparisons with Patent Renewal Models
In order to construct a sample that is comparable to those reported in earlier studies, I generate
a set of domestic-only patents by separately drawing a simulated sample of patents for Germany,
'"The regression includes a dummy variable for families patented in 18 countries. The coeficient on the 18-country dummy is large (about half the size of the slope coefficient), and statistically significant. This dummy reflects (crudely) the truncation problem implied by observing only a subset of the pmihle countries in which inventors might seek protection. The role of this dummy &able is analogous to similar regressions in the patent renewal literature designed to determine the rate at which patent values rise as a function of the date of lapse; some of those lapsing in the lid year are 'Yruncated" obsenrations in the sense that they would have been renewed longer but for
the statutory maximum. Typically, the coefficient on a dummy variable for the value in the final year of lapse is large and positive, reflecting the concentration of all tail values in the final year. In a patent application model, where there is both a common and an idiosyncratic component to patent value, it is not the case that only families with
applications in all 18 observed countries are subject to this type of truncation: low country-specific opportunities
open the possibility that families with very high a values might not have been filed in some of the countries in the sample, even though they were also filed in many countries outside the sample (and in that sense are subject to truncation). In this simulated sample, for example, the most valuable invention was filed in 13 countries.
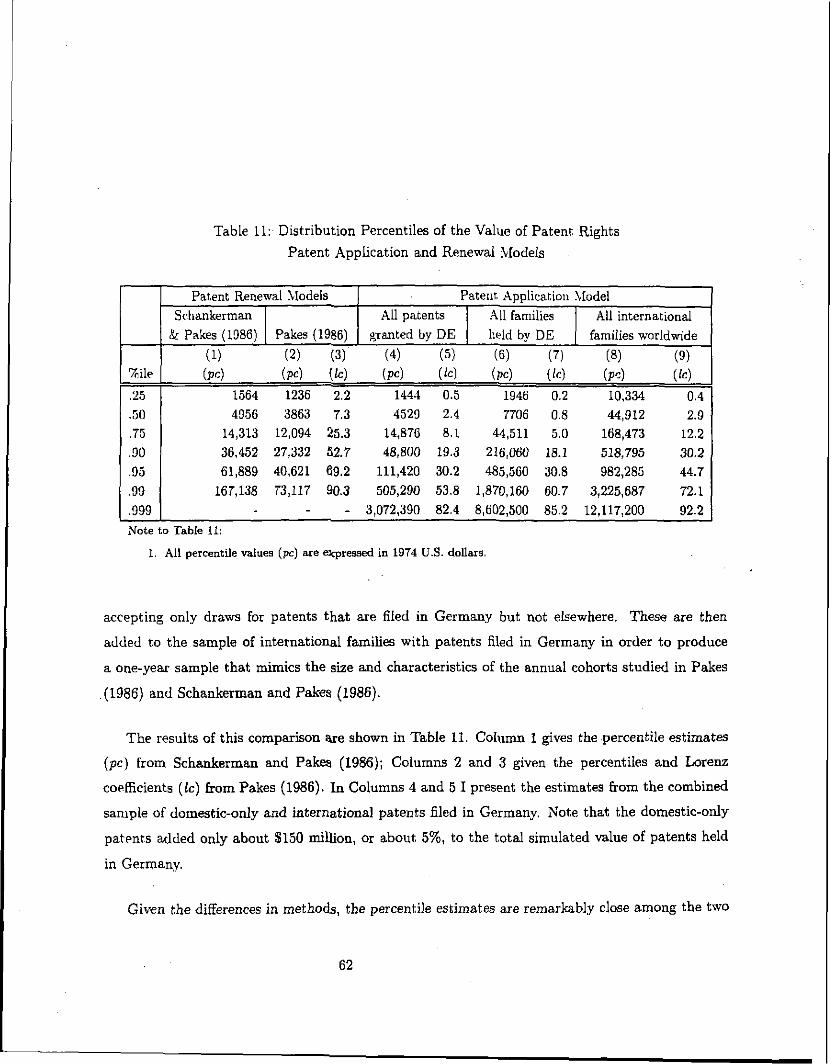
Table 11: Distribution Percentiles of the Value of Patent Rights
Patent Application and Renewal hlodels
I I %ik (PC) (14 (PC) ( 1 ~ ) (PC) (14 (P-1 (14
1444 0.5 1946 0.2 10,334 0.4 4956 386'3 7.3 4529 2.4 7706 0.8 44,912 2.9
14,313 12,094 25.3 14,876 8.1 44,511 5.0 168,473 12.2 36,452 27,332 32,7 48,800 19.3 216,060 18.1 518,795 30.2 61,889 40,621 69.2 111,420 30.2 485,560 30.8 982,285 44.7
167,138 73,117 90.3 505,290 53.8 1,870,160 60.7 3,225,687 72.1 - 3,072,390 82.4 8,602,500 85.2 12,117,200 92.2
Note to Table 11:
Patent Renewal Models
& Pakes (1986)
1. All percentile values (PC) are expressed in 1974 U.S. dollars.
Patent, Applicatioli &lode1
accepting only draws for patents that are filed in Germany but not elsewhere. These are then
added to the sample of international families with patents filed in Germany in order to produce
a one-year sample that mimics the size and characteristics of the annual cohorts studied in Pakes
(1986) and Schankerman and Pakes (1986).
Srtiankerman I 1 All patents I All families 1 All international
(1) (2) (3) (4) (5) (6) (7) (8) (9)
Pakes (1986) granted by DE
The results of this comparison are shown in Table 11. Column 1 gives the percentile estimates
(pc) from Schankerman and Pakes (1986); Columns 2 and 3 given the percentiles and Lorenz
coefficients (lc) from Pakes (1986). In Columns 4 and 5 I present the estimates from the combined
saniple of domestic-only and international patents filed in Germany. Note that the domestic-only
patpnts added only about $150 million, or about 5%, to the total simulated value of patents held
in Germany.
Given the differences in methods, the percentile estimates are remarkably close among the two
lirld by DE families worldwide
classes of models. The estimated distribution for the international model actually lies between that
found for the two renewal models through about the 75th percentile. .4t that point, however, the
int~rnational model's estimates become even more skewed than the renewal models's; the estimate
for the 99th percentile is about three times that of Schankerman and Pakes (1986) and about seven
times t,hat of Pakes (1986). While Pakes reported a maximum draw of less than $400,000, the
maximum occuring in the simulated dataset used here was about $40 million, or over 100 times
as great. Xeedless to sav, this sharp divergence in the extreme tail values implies increasingly . divergent Lorenz coefficients: while Pakes found that about 10% of the value of the distribution
was concenbrated in the top 1% of all patents, these estimates attribute nearly half the total value
to the top 1%. In fact, the top one-tenth of one percent-about 21 patents-are estimated to
account for about 17.6% of the entire value of the distribution.
By way of comparison, I also present the simulated distribution of all patent families held by
Germans worldwide, including those filed only at home. Columns 6 and 7 give the percentiles and
Lor~nz coefficients. While the median patent family generates only $7,706 worldwide, the top 2%
. (about 700 families) are each worth more than $1 million, and the top one-tenth of one percent are
worth more than $8.6 million.
fin all.^, Columns 8 and 9 present the percentiles and Lorenz coefficients for the international
sample. Because this sample does not include domestic-only patents, it is not comparable to the
others. The median international patent familv is estimated to be worth about $45,000, or just
over one-sixth the mean. About 5% of all international patent families, or about 3000 inventions,
are worth more than $1 million. The top 1% of all international families-fewer than 600-are
estimated to account for more than a fourth of the entire value of the distribution.
I began this investigation by noting the importance both of sample selection in the international
patent data generating process, and of the distinction between an invention's common quality and
its idiosyncratic legal boundaries. I close this section with two calculations derived from the reported
simulations. Inventions that do not justify patent protection in any single country are omitted from
both t.he simulations and t,he model. The mean value these inventions would have generated if the
cost of filing and renewal had been free is about $7900 worldwide; the maximum is about $70,000.
\Vhih the mean is only about 3% of the mean of filed inventions, it is about the same as the mean
es~imated by Schankerman and Pakes for patent,s filed in France.
I also argued that the patterns of international patenting that are observed could not be ex-
plained by a purely independent model of the international filing decision. and instead formulated
a illode1 that estimated the distribution of the common quality of the invention across countries.
\Ve may now ask what fraction of the variance in patent values is attributable to this common
quality, and what fraction is idiosyncratic. A regression of the log of the patent family value on
a shows that a explains about 61% of the variation in the value of patent families. The elasticity
of \ d u e with respect to a: is approximately 1.24; higher quality inventions are patented in more
co1.1ntries and are renewed longer, each of which implies a greater than proportionate increase in
global returns to patent protection.
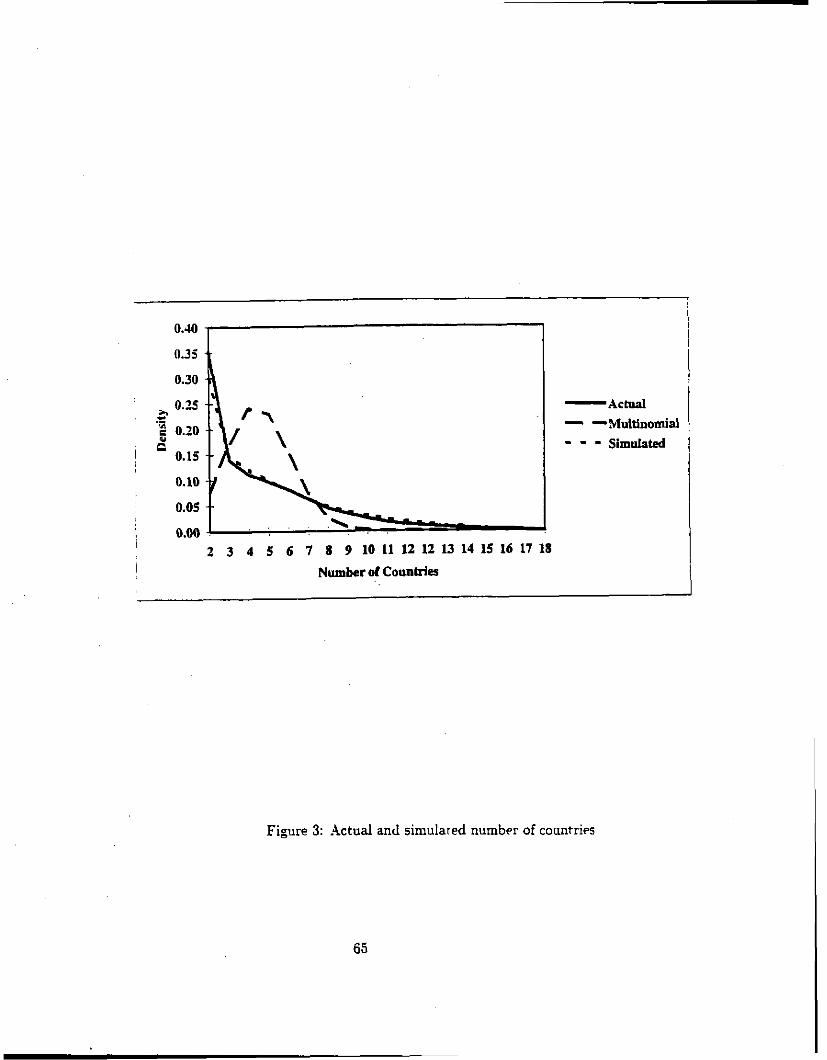
0.00 I
2 3 4 5 6 7 8 9 10 11 12 12 13 14 15 16 17 18 I Number of CouaMcs
- Actual - -Multlnomial - - - Simulated
Figure 3: ..\ctual and sirnulared number of countries
7 Conclusion
The model presented here addresses most of the concerns raised in the review of the current Iit-
erature. although it does not put them to rest. Rather than being invalidated by international
differences in patent systems, it exploits these differences in order to recover the common distribu-
tion of patent quality across countries. I t is relatively efficient, and its efficiency can be increased
by adding observations from additional countries. The model's greater efficiency permits the use of
inyention- and even patent-level explanatory variables, in addition to firm and industry variables.
It treats the application decision endogenously rather than exogenously, which corrects a misspec-
ificabion in some earlier models and extends the scope of an inventor's behavior that is assumed
t,o be economically rational. It produces estimates for the U.S., for which significant, accessible
firm-level datasets already exist. Because the model is estimated on a single cross-section, however,
its ~erformance in explaining time series variation in variables of interest is not yet known.
Perhaps the greatest shortcoming of the' present approach to modelling patent protection de-
cisions is that it strips the time dimension from a decision process in which the resolution of
uncertainty is arguably the most interesting economic phenomenon at work. The particulars of
the learning process-as manifested in the optimal mix, level and abandonment of a portfolio of
uncertain R&D projects-are still quite poorly understood. They is also hard to study: because
project-level R&D expenditure and return data are not only very sensitive but are also difficult to
st,andardize and measure properly, the possibility that individual patent decisions might provide
significant insights into otherwise unobservable decisian-making is quite attractive. While patent
data may one day provide an important and tightly-focused view into a firm's allocative decision-
making under uncertainty, they will ultimately require the inclusion of an intertemporal dimension
to the model and data in order to understand more completely how the firm transforms research
invest,ments into profitable products and processes.
.4 second area of fundamental economic and policy interest is the definition, measurement and
control of the rate of technical advance. In this paper I have used the world "quality" to signify the
common value of a patent across different economic and institutional regimes, but this value may
still be only poorly correlated with the degree of technical advance made by any particular invention,
ancl with the value of the information it discloses. For the purpose of understanding the degree to
which the patent system accomplishes its stated mission of promoting .'the progress of the useful
arts." it is necessary to observe the correspondence between the social contribution of the invention
and the private reward received by the inventor. In this regard, the work of Trajtenberg (1990a,
b) and colleagues on patent citations holds out the hope that invention-level patent citation data
can be deployed in future versions of the model in the effort to distinguish economic from purely
technical progress, and to disentangle the social and private returns to invention.
Therefore, this study represents only an intermediate step in the comprehensive modeling of
patent applicant behavior. It is obvious, for example, to imagine combining the renewal decision
wit,h the international filing decision in one large general model. Such a marriage, however, expands
the number of ex ante choices from T, in a single-country renewal model, and 2J - (J + 1) in the
international model, to a truly huge combinatoric function of Tj and J.~'
Even without patent renewal data, the cross-sectional patent data used in the present study
have not been fully exploited. We have expressly neglected the majority of the world's inventions,
namely those filed in only their home country, in formulating the international model. The evidence
presented here indicates that the excluded inventions do not account for much of the total value
of the world's patent rights, but the results cannot be considered conclusive. Beyond that, we
have collapsed all application and grant data into a single indicator of filing; the raw data contain,
however. the results of the applicant's subsequent decisions, including the division of the application
' ( : ) . 2' - ( J + I) &&rent obervable international ""Given J p&hle application countries, there are x,=2 combinations. If we sirnplii the calculation by assuming that every country permits T, T , V j different lapse dates,
then for each combination of size j , there are T J different pmihle lapse outcomes (where the superscript j me-,
"to the j" power"). The total number of possible outcomes for a single invention is therefore
for .I = 18 and T = 15, this number is of the order 10''.
into parts and, ultimately. whether or not a pat,ent issued on the application.
At the international level, the results presented here should stimulate additional theoretical
and empirical i n q u i ~ into the flows of information and technology among countries. While it is
often asserted that the international patent system works to the detriment of developing countries,
the evidence presented here shows that the largest developed countries do not necessarily generate
surpluses in "trade" with smaller developed countries, leading one to question whether the benefits
of exclusive rights granted in the developing world are really so much greater than the reciprocal
value created in the large developed economies.
An obvious avenue of exploration, which has been completely suppressed in this study, is the role
of competition among firms, both in research and in product markets. Like all earlier studies, we
have treat,ed each patent application as an independent draw from a common distribution, when we
know from theoretical, empirical and anecdotal literature that inventions are not independent and
that the identity of its owner matters to its prospects for commercial success.56 In an international
context, we might begin to apply the methods developed here by observing that firms may not
patent in certain markets because they do not expect to face competition in those markets over the
lifp of the patent. More generally, a model developed by Lanjouw (1992), which expresses the value
of patent protection as a function of the equilibrium number of imitators expected in the market,
could be employed to refine the estimates of returns to patent protection, and to disentangle the
value conferred by each country's institutional regime from the quality of the competition offered
by it,s firms.
4 perhaps more fundamental question is the extent to which inventors are able to appropriate
the full value of their inventions through international patent protection. While the simulations
here indicate that a substantially higher fraction of each country's R&D expenditures may be
appropriated through patent protection than has been estimated previously, on the whole this
''A promising start in the direction of using patent data to infer 6rm-level research strategies has been made by Lerner (1995).
value still appears small. ~~lacroeconomic evidence (e.g., Eaton and Kortum (1996a)) suggests
t,hat international Rows of technology, as proxied by patent counts, contribute greatly to domestic
productivity g~owth in OECD economies; thus, an important macroeconomic question is the degree
to xhich the benefits of this growth are captured by the technology's inventors, and an important
mic.roeconomic question is the fraction of benefits that are captured t,hrough patents compared
with other appropriation mechanisms.
Finally, it should be observed that although there appear to be substantial levels of international
puz.chases of property rights, these purchases cannot be termed "trade." in the usual sense of
exchange. Moreover, there are no countervailing factors, such as depreciation of the exchange
rate, that impinge on a chronic "deficit" in patent rights, except insofar a s these rights influence
trade in real goods and services. Even at the relatively simple level of the regressions reported by
COP and Helpman (1993), we face complex problems in the timing and realization of returns to
patent protection if these are ever to account empirically for observed patterns of trade and growth.
Expanding the number of cohorts and countries, in order to generate complementary panels to be
used in such macroeconomic investigations, becomes a priority for the fut,ure.
References
Benko. R. P. 1987. Protecting Intellectual Property Rights. Washington, DC: American Enterprise
Institute.
Caballero, R. and A. Jaffe. 1993. "How High Are the Giant's Shoulders? An Empirical Assessment
of Knowledge Spillovers and Creative Dest,ruction in a Model of Economic Growth." In 0.
Blanchard and S. Fischer, eds., NBER Macroeconomics Annual 8.
Chin, J. C. and G. M. Grossman. 1990. "Intellectual Property Rights and North-South Trade," in
R. W. Jones and A. 0. Krueger (eds.) The Political Economy of International Tmde: Essays
in Honor of Robert E. Baldwin. Cambridge: Basil Blackwell.
Coe, D. and E. Helpman. 1993. "International R&D Spillovers." NBER Working Paper No.
Coslett, S. R. 1981a. "Maximum ~ikelihood Estimator for Choice-Based Samples!' Econornetrica
9: 1289-1316.
Coslett, S. R. 1981b. "E5cient Estimation of Discrete-Choice Models." In C. F. Manski and
D. McFadden (eds.), Struchml Analysis of Discrete Data with Econometric Applications.
Cambridge: MIT Press.
Deardorff, A. V. 1992. "Welfare Effects of Global Patent Protection," Economico 59: 35-51.
Diwan, I. and D. Rodrik. 1991. "Patents, Appropriate Technology, and North-South Trade,"
Journal of International Economics 30: 27-47.
Eaton, Jonathan and Samuel Kortum 1996a. "Trade in Ideas: Productivity and Patenting in the
OECD," Journal of International Economics, 40: 251-278.
Eaton. Jonathan and Samuel Kortum 1996b. "International Technology D i h i o n : Theory and
hIeasurement," mimeo, Boston University.
Evenson. R. 1984. "International Invention: Implications for Technology Market Analysis." In Z.
Griliches (ed.), R&D, Patents and Productivity. Chicago: University of Chicago Press.
Fpi. John C.H. and Gustav Ranis. 1964. Development of the Surplus Labor Economy. Homewood,
Illinois: Richard D. Irwin.
Gadbaw, R. M. and T. J. Richards. 1988. Intellectual Property Rights: Global Consensus, Global
Conflict? Boulder: Westview Press.
Ginart,e, J. C. and W. G. Park. 1995. "Determinants of Intellectual Property Rights: A Cross-
National Study." Unpublished manuscript, American University Department of Economics.
Griliches, Z. 1990. "Patent Statistics as Economic Indicators: A Survey," Journal of Economic
Literature 28: 1661-1707.
Grossman, G. M. and E. Helpmann. 1991. Innovation and Growth in the Global Economy.
Cambridge: MIT Press.
Helfgott, S. 1993. "Patent Filing Costs Around the World." Journal of th,e Patent and Tkademark
Ofice Society: 567-580.
Hdpman, E. 1993. "Innovation, Imitation, and Intellectual Property Rights," Econometrics 61(6):
1247-1280.
Kortum, S. and J. Putnam. 1997. "Assigning Patents to Industries: Tests of the Yale Technology
Concordance," forthcoming, Economic Systemics Research.
Lanjouw, J. 0. 1992. The Private Value of Patent Rights: A Dynamic Pmgmmming and Game
Theoretic Analysis of West German Patent Renewal Data, 1953-1988. Unpublished Ph.D.
dissertation, London School of Economics.
Lanjouw, J. 0. 1993. "Patent Protection: Of What Value and for How Long?" NBER Working
Paper No. 4475.
\Iaskus. K. E. and hI. Penubarti. 1995. "How TradeRelated are Intell~ctual Property Rights?"
Forthcoming, Journal of International Econom.ics.
\logee, &I. E., R. Kolar and J. Putnam. 1992. "Extracting Useful Information for Technology
Llanagement from International Patent Records." SBIR Phase I final report, National Science
Foundation.
Pakes, A. 1986. "Patents as Options: Some Estimates of the Value of Holding European Patent
Stocks," Econometrics 54: 755-84.
Pakes, A. and M. Schankerman. 1984. "The Rate of Obsolescence of Knowledge, Research
Gestation Lags, and the Private Rate of Return to Research Resources." In 2. Griliches
(ed.), R&D, Patents and Productivity. Chicago: The University of Chicago Press.
Pakes, A. and M. Simpson. 1989. "Patent Renewal Data." Br0okin.g~ Papers on Economic
Activity 3: 331-410.
Pnnrose, E. 1951. The Economics of the ~nternational Paten,? System. Baltimore: Johns Hopkins
University Press.
Primo Braga, C. A. 1989. "Intellectual Property Rights and the GATT: A View from the South."
Vanderbilt Journal of Transnational Law 22 (2) .
Putnam, J. 1991. "What Can We Really Learn Etom the (International) Patent System?" Un-
published manuscript, Yale University Department of Economics.
Putnam, J. 1996. The Value of International Patent Rights. Unpublished Ph.D. dissertation, Yale
University.
Rapp, R. and R. Rozek. 1990. "Benefits and Costs of Intellectual Property Protection in Devel-
oping Countries." Working Paper No. 3, National Economic Research Associates.
Romer, P. 1990. "Endogenous Technical Change," Journal of Political Economy 98(5): 71-102.
Scl~ankerman. LI. 1991. ,.How Valuable is Patent Protection? Estimate bv Technology Field Using
Patent Renewal Data." NBER Working Paper No. 3780.
Schank~rman, M. and A. Pakes. 1986. "Estimates of the Value of Patent Rights in European
Countries During the Post-1950 Period." Econom.ic Journal: 1-25.
Srherer. F. h1. 1983. "The Propensity to Patent," Internation.al Journal of Industrial Organization
1: 107-128.
Sherwood, R. M. 1990. Intellectual Property and Economic Deuelopm.ent. Boulder: Westview
Press.
Siebeck. W. (ed.), with R. Evenson, W. Lesser, and C. A. Primo Braga. 1990. Strengthening Pm-
tection of Intellectual Property in Deve1opin.g Countries: A Survey of the Literature. World
Bank Discussion Paper #112.
Slarna. J. 1981. "Analysis by Means of a Gravitational Model of International Flows of Patent
Applications in the Period 1967-78." World Patent Information 3: 1-8.
Trajtenberg, M. 1990a. Economic Analysis of Product Innovation: The Case of CT Scanners.
Cambridge: Harvard University Press. ,
Tra,jtenberg, M. 1990b. "A Penny for Your Quotes: Patent Citations and the Value of Innova-
tions." Rand Journal of Economics 21 (1): 172-187.
United States International 'Itade Commission. 1988. Foreign Protection of Intellectual Property
Rights and the Eflect on U.S. Indwtry and Trade. Washington, DC: Government Printing
Office.
Vernon, R. 1957. The International Patent System and Foreign Policy. United States Senate
Subcommittee on Patents and Trademarks.
World Intellectual Property Organization. Various years. In,dustria Propelty Statistics. Geneva:
World Intellectual Property Organization.