Embed Size (px)
Citation preview
The Virtual Estuary: Simulation meets Visualization
Yvette Spitz Scott Durski
Erik Anderson Joel Daniels
Juliana Freire Claudio Silva
Antonio Baptista Joseph Zhang

2
km
Nitrate
Phytoplankton
Zooplankton Detritus
Ammonium
• Five-component ecosystem model
Spitz et al. (2005)
km
50 km
SELFE – Unstructured grid
Nodes: 27624, Elements: 53369 Vertical levels: 54 • Model of Myrionecta Rubra: 7 components
• Other possible model: 12 components ROMS – Structured grid
Grid pts: 384x128 Vert. levels: 44
CMOP: Making Sense of Data
3 CMOP: Making Sense of Data
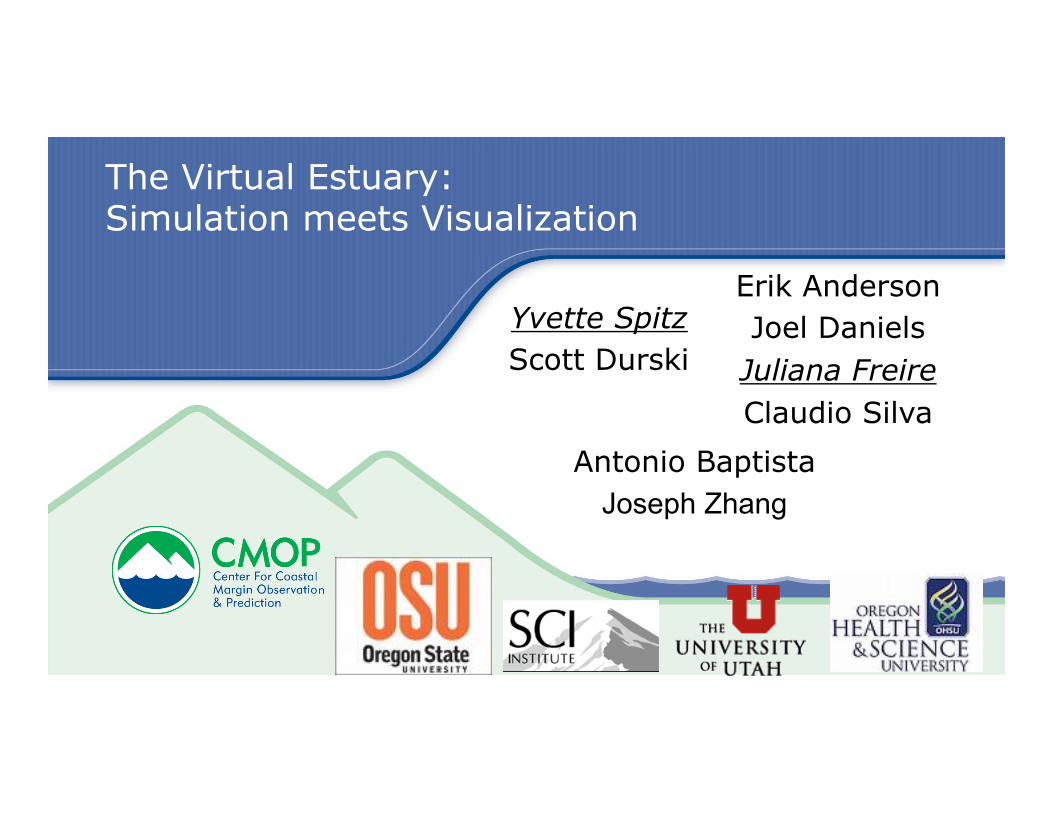
• Observation and modeling of multiple systems at multiple scales – Scientists need to collaborate: biologists, chemists,
oceanographers, computer scientists • Very large number of data products, sensor
measurements, and results from numerical models • Cover more than 10 years of experiments: occupy over
30 TB of storage

4 CMOP Cyberinfrastructure
• Support key activities in the CMOP collaboratory: from data acquisition and analysis to result dissemination
• VisTrails is a scientific workflow system – Integrate simulations, data pre-processing, and analysis – Focus on exploratory tasks such as visualization and data
mining – Transparently tracks provenance of the discovery process---
the trail followed as users generate and test hypotheses
Open-source: http://www.vistrails.org

5 VisTrails: Provenance of Exploration
Reproducibility and
Validation
Collaboration
Knowledge sharing: data +
processes

6 Benefits of Provenance
• Compare data products – Assess data quality, understand process
• Support for reflective reasoning • Improve training and
teaching
[Freire et al., IPAW 2006]
“Reflective reasoning requires the ability to store temporary results, to make inferences from stored knowledge, and to follow chains of
reasoning backward and forward, sometimes backtracking when a promising line of thought
proves to be unfruitful. …the process is slow and laborious”
Donald A. Norman

7 Benefits of Provenance
• Compare data products • Support for reflective reasoning • Improve training and teaching • Knowledge re-use
– Provide suggestions to users as they construct visualizations
[Koop et al., IEEE Vis 2008]

8 Visualization at large and on the go
High- resolution rendering of the Columbia River virtual estuary at a display wall
Rendering of the Columbia River on an IPOD Touch

9 VisTrails: Science Dissemination
• Science mashups: simplify data exploration through visualization
[Santos et al., IEEE Vis 2009]

10
• Teaching and training – Lecture provenance: student can reproduce results – Homework provenance: provides insights regarding ask
complexity and nature, student confusion – VisTrails has been adopted as a teaching tool at Utah, UNC,
UTEP, Linkoping (Sweden)
VisTrails: Science Dissemination
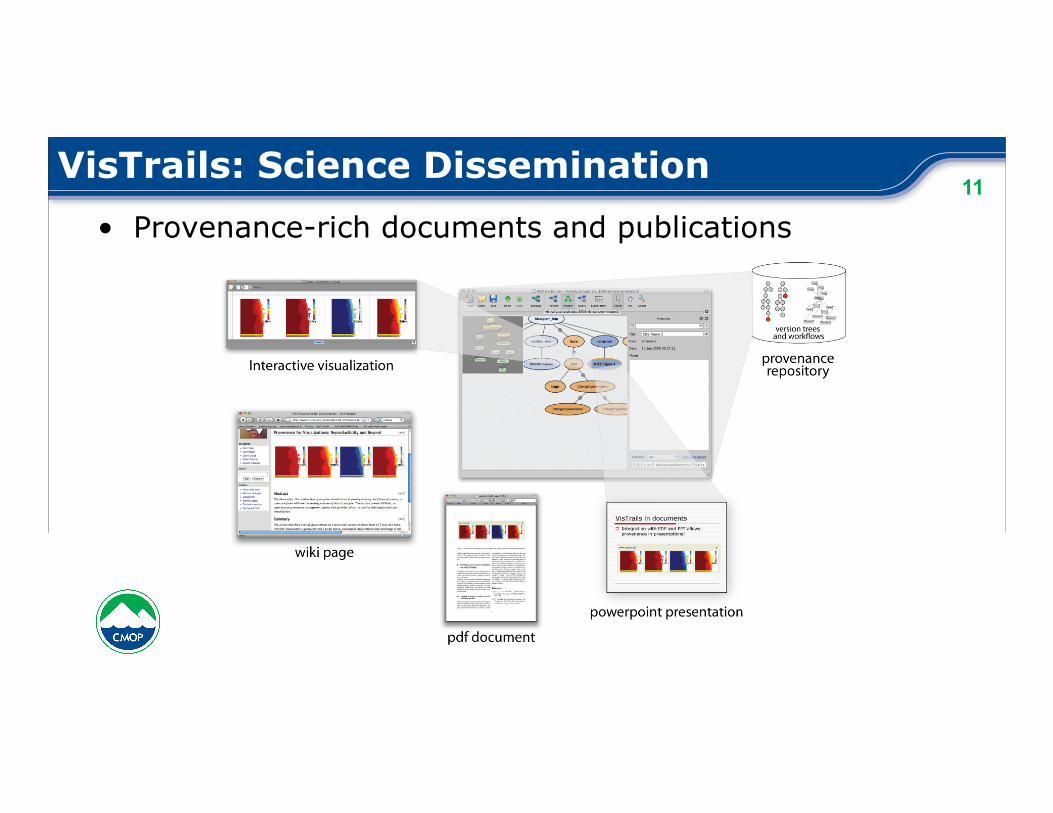
11 VisTrails: Science Dissemination
• Provenance-rich documents and publications

12 The Importance of Visualization: Research
• A picture is worth a thousand words!
• Understand large volumes of simulation results---obtain insights – Identify interesting features – Correlate information from
multiple models – Interactively explore data Flow visualization
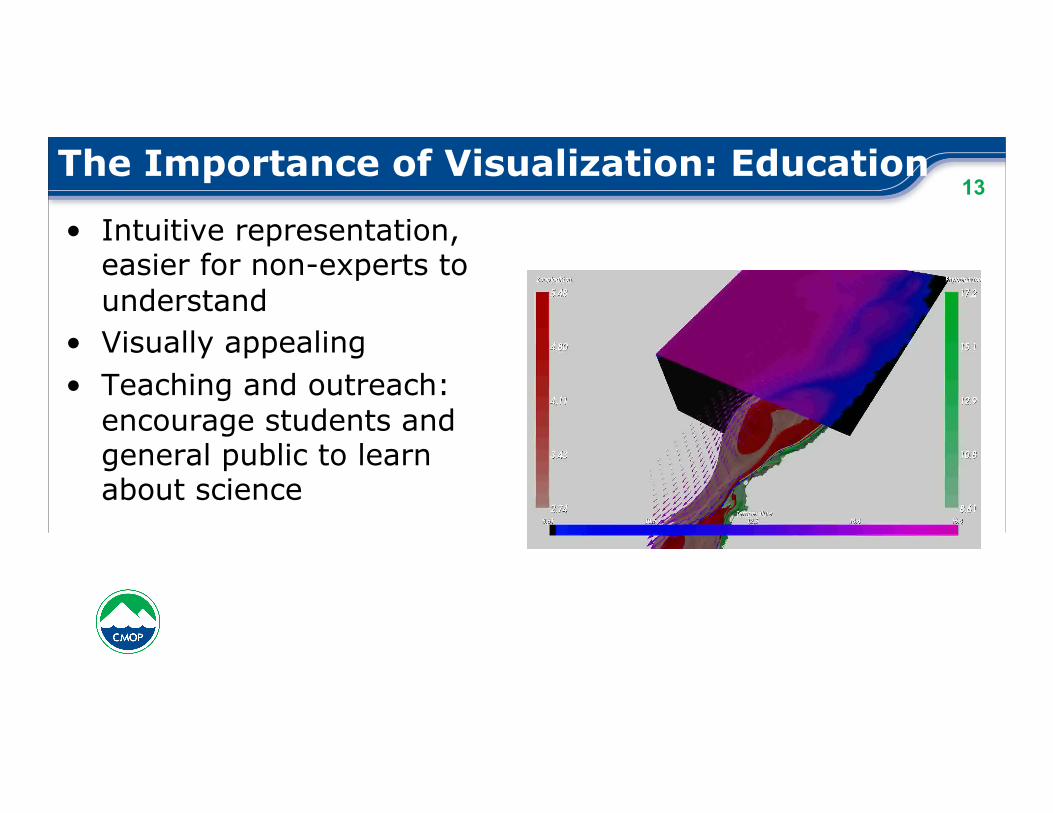
13 The Importance of Visualization: Education
• Intuitive representation, easier for non-experts to understand
• Visually appealing • Teaching and outreach:
encourage students and general public to learn about science

14 Conclusions and Future Work
• Visualization is essential for ocean observatories • VisTrails and Provenance
– Support reflective reasoning – Intuitive interfaces for simplifying the construction and
refinement of visualizations
• Sharing provenance creates new opportunities
– Workflow/provenance repositories; provenance-enabled publications
– Expose scientists to different techniques and tools – Scientists can learn by example; expedite their scientific
training; and potentially reduce their time to insight
Provenance + Workflows + Sharing have the potential to revolutionize
science!

15 Acknowledgments
• Thanks to: – VisTrails group – CMOP cyber and modeling teams

Backup

17 VisTrails: Parameter Exploration
• Conveniently explore parameter spaces and compare results
[Freire et al., IPAW 2006]

18 Provenance Enabling Tools
[Callahan et al., IPAW 2008]

19 VisComplete
[Koop et al., IEEE Vis 2008]