Embed Size (px)
Citation preview

The Visual Analog Mood Scales – a review and evaluationJames A Athanasou

Mood, as a quality of feeling at a particular time or even a persistent emotion influencing our thoughts and actions

Case study
Male 40 yrsProfessionalMotor vehicle accident two years ago
Whiplash injury
Not admitted to hospital
Whole person impairment 0-11%Chronic adjustment disorder preceding the accident
Now unemployed
Difficulty in working – “my ability to focus, memory and ability to interact with other people...”
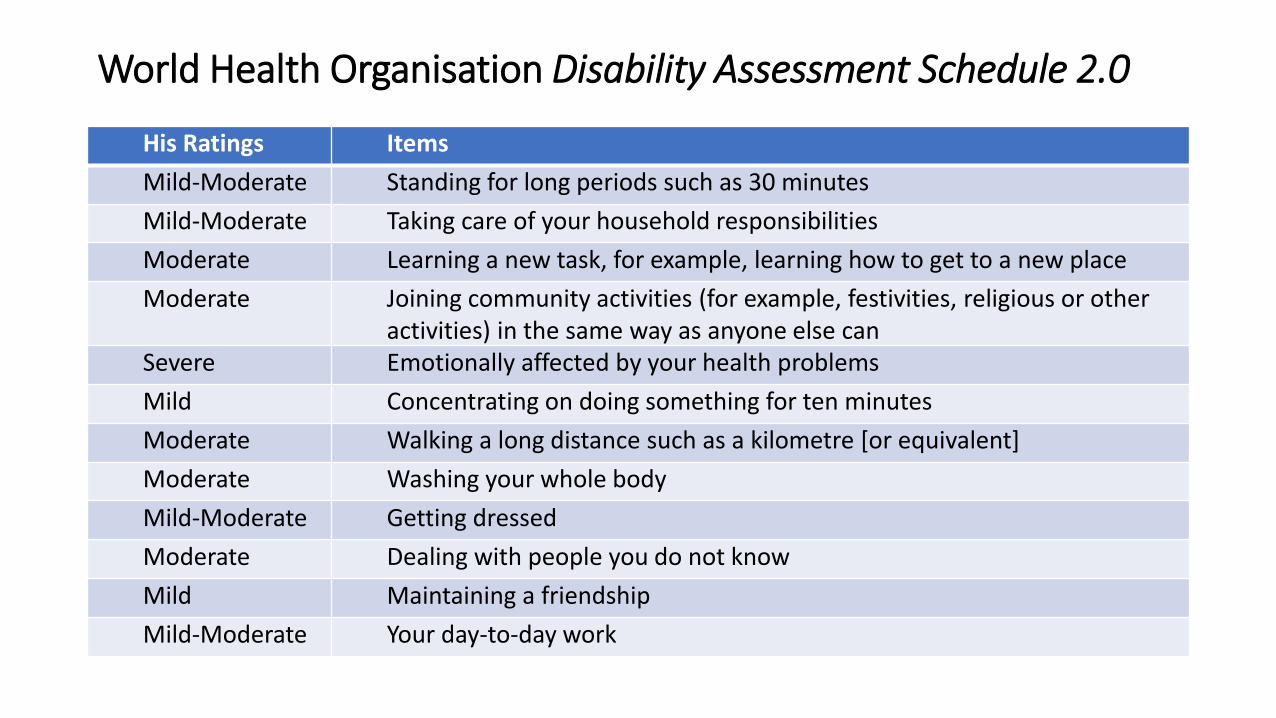
World Health Organisation Disability Assessment Schedule 2.0
His Ratings Items
Mild-Moderate Standing for long periods such as 30 minutes
Mild-Moderate Taking care of your household responsibilities
Moderate Learning a new task, for example, learning how to get to a new place
Moderate Joining community activities (for example, festivities, religious or other activities) in the same way as anyone else can
Severe Emotionally affected by your health problems
Mild Concentrating on doing something for ten minutes
Moderate Walking a long distance such as a kilometre [or equivalent]
Moderate Washing your whole body
Mild-Moderate Getting dressed
Moderate Dealing with people you do not know
Mild Maintaining a friendship
Mild-Moderate Your day-to-day work

Some assessment resultsTEST RESULT
Chair fitness test 21.5 seconds Below average (13 seconds)
Dynamometer 27kg Below average
Back-leg pull strength 25kg Well below average
Shoulder strength dynamometer 14kg push/11kg pull Below average
Lezak 15-item test Recalled 15 out of 15 Not malingering
Information processing speed 14-17 bits of information per second
40-75th percentile
Academic Achievement Battery Reading Grade 13.2 Well above average
Mental status assessment - On brief office testing of mental status, he was oriented in place, date, day, time and season. He showed limited awareness of politics and events. Mental control and mental arithmetic computation were poor. Reasoning with similarities or analogies was adequate. His practical judgment was adequate but not perfect.
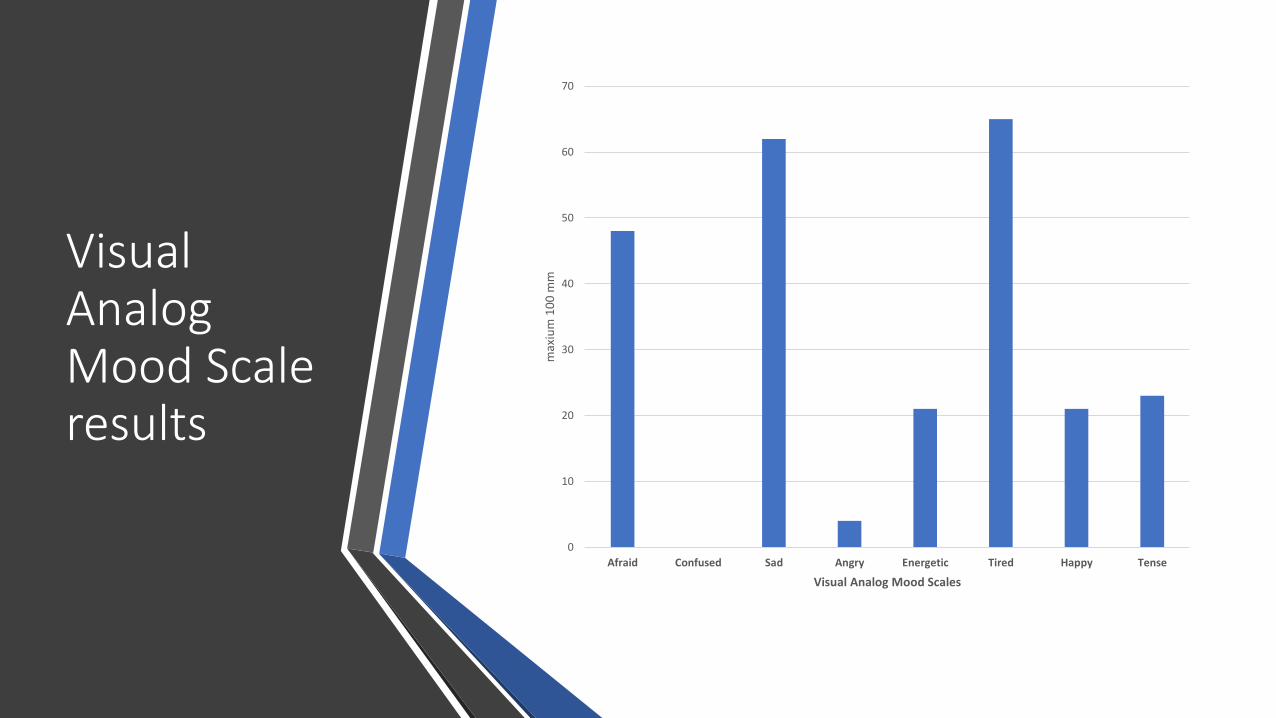
Visual Analog Mood Scale results
0
10
20
30
40
50
60
70
Afraid Confused Sad Angry Energetic Tired Happy Tensem
axiu
m 1
00
mm
Visual Analog Mood Scales

Difficulties in answering questionnaires
• Literacy problems
• Aphasia
• Brief assessment
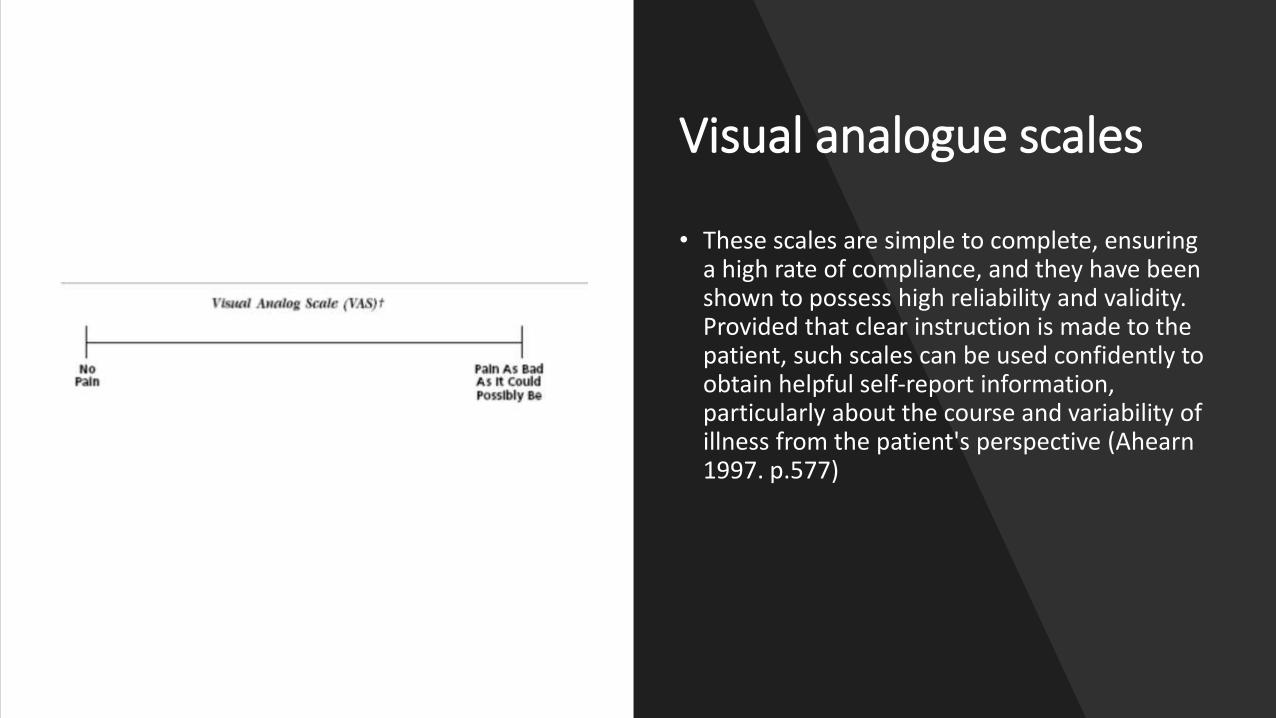
Visual analogue scales
• These scales are simple to complete, ensuring a high rate of compliance, and they have been shown to possess high reliability and validity. Provided that clear instruction is made to the patient, such scales can be used confidently to obtain helpful self-report information, particularly about the course and variability of illness from the patient's perspective (Ahearn 1997. p.577)

Format and nature of the Visual Analog Mood Scales

VAMS
• Unipolar dimensions
• Ideogram
• Unbroken 100mm vertical line

Standardisation
• Non-representative sample
• 579 adults 18-94 years
• Non-representative
• 21% undergraduate; remainder church, community groups
• Scores transformed to T-scores
• Norms for younger (N=250) and older (N=175
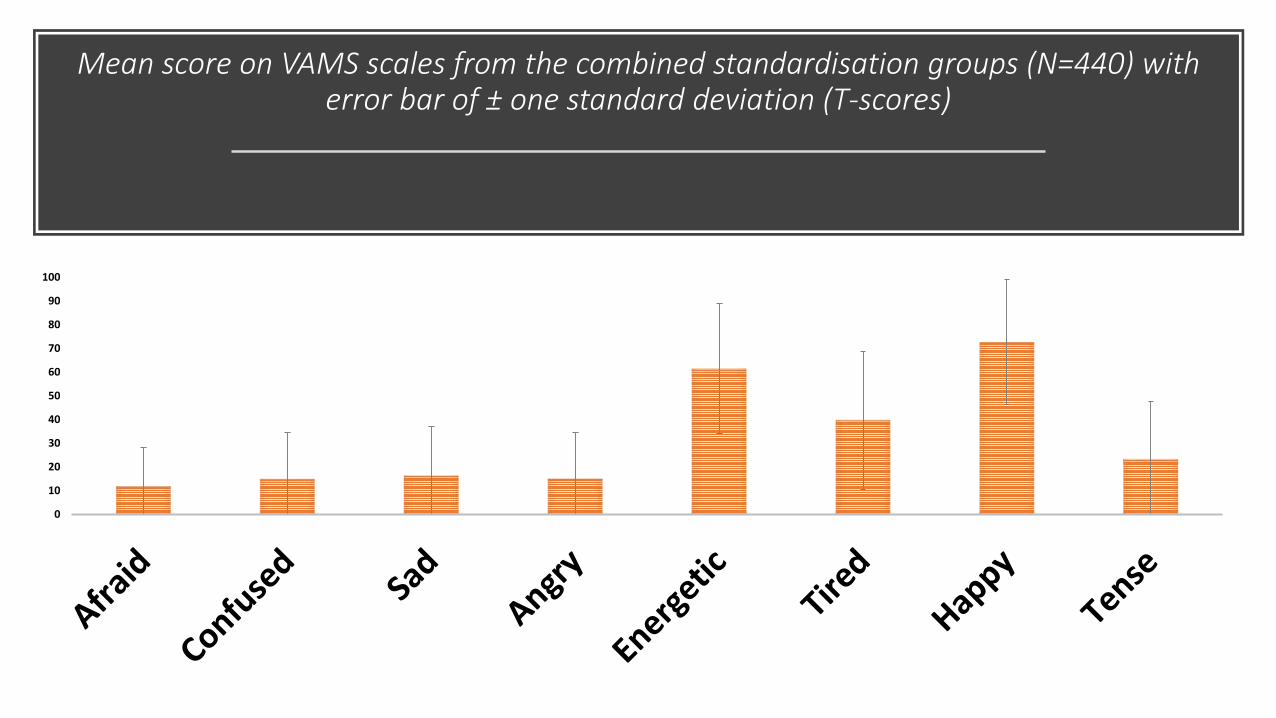
Mean score on VAMS scales from the combined standardisation groups (N=440) with error bar of ± one standard deviation (T-scores)
0
10
20
30
40
50
60
70
80
90
100

In four studies a total score
across all eight scales has been used
• no a priori justification for combining the results to produce an overall “mood” score
• conceptual nature of this overall mood is questionable
• may be reasonable, however, to discern an elevated mood level across the eight scales (with scoring reversed for the positive moods)
• doubts about the value of the norms from the standardisation group based on the comments of the review in the Mental Measurement Yearbook
• clinicians might be better advised to use the ordering of the raw scores (Cliff & Keats, 2003)
• possibly 50 as an initial screening point for further clinical investigation of the negative moods

Reliability coefficients are considered low for any high-stakes decisions
Range of the test-retest correlations for seven of the eight scales across three studies
• Afraid .69 to .84
• Confused .43 to .87
• Sad .45 to .83
• Angry .71 to .75
• Energetic .44 to .81
• Tired .60 to .63 or
• Happy .67 to .73
• (Tense - insufficient data)

Nine studies of the concurrent validity – the range of validity coefficient is wide
Correlations Afraid Confused Sad Angry Energetic Tired Happy TenseMinimum
Maximum
.12
.78
.43
.64
.49
.72
.28
.80
.33
.71
.33
.74
.50
.82
.52
.62
CES-D Modified Center for Epidemiological Studies – Depression Scale; HDRS Hamilton Depression Rating Scale; LIV Life Interests and Values Cards; POMS Profile of Mood States

Interventions and the Visual Analog Mood Scales
First author Year Country N Condition Intervention and findings
Arruda 1997 USA 25 Depressiv
e disorder
1.VAMS (sad, happy, tired, energetic) most sensitive to therapeutic effects
of ECT
2.VAMS correlated with psychiatrist’s Clinical Global Improvement(sad,
happy, tired, energetic) Barton 1993 USA 29 Normal
volunteers
No effect of lithium on mean VAMS scores for “normal” subject in week 5
of double blind placebo controlled crossover studyCorsten 2015 German
y
27 Aphasia Used a biographic-narrative intervention over 10 weeks; T-scores for
Confused and Tense scales decreased significantly from baseline for
narrative interviewsPorcherot 2015 France 277 Restauran
t clients
Investigated effect of aperitif consumption on mood; raspberry Kir
reduced significantly tense and anxious moodsThomas 2012 UK 105 Stroke VAMS sad scale reflected allocation to usual care versus behavioural
therapy for strokeVickery 2009 USA 120 Stroke Mean VAMS composite score based on six negative moods was 346.8
(SD=83,5) on admission and 312.9 (SD+76.9) on discharge

Conclusions
Visual Analog Moods Scales enable
(a) a description of a person’s functioning;
(b) the diagnosis of problem areas;
(c) to ascertain the need for therapy; and
(d)even monitor the progress of an intervention on positive or negative moods

Conclusions
• found limited application in psychological or health settings despite their potential
• reports are limited mainly to small sample sizes with clinical groups such as Parkinsons, Alzheimers, stroke, aphasia or dementia

Nine studies of the concurrent validity – the range of validity coefficient is wide
Correlations Afraid Confused Sad Angry Energetic Tired Happy TenseMinimum
Maximum
.12
.78
.43
.64
.49
.72
.28
.80
.33
.71
.33
.74
.50
.82
.52
.62
CES-D Modified Center for Epidemiological Studies – Depression Scale; HDRS Hamilton Depression Rating Scale; LIV Life Interests and Values Cards; POMS Profile of Mood States

Comparison of the lowest concurrent validity coefficients for each Visual Analog Mood Scale with real world validities
Minimum
concurrent validity
VAMS scale Equivalent real-world validities
.12 Afraid Family social support and lower blood pressure (Myer et al., p. 130)
.28 Anger Effect of psychological therapy under clinically relevant conditions
(Myer et al., p. 131).36 Energetic
Tired
Gender and self-reported assertiveness (Myer et al., p. 131)
.43 Confused Loss in habitat size and population decline (r=.40) (Myer et al., p. 131)
.49 Sad Weight and height for US adults (r=.44) (Myer et al., p. 132)
.50 Happy Parental report of attachment to their parents and the quality of their
child’s attachment (r=.47) (Myer et al., p. 132).52 Tense Increasing age and declining speed of information processing (Myer
et al., p. 132)

N=50 Information processing speed
Afraid 0.35
confused 0.21
Sad 0.21
Angry 0.31
Energetic -0.08
Tired 0.31
Happy -0.22
Tense 0.31
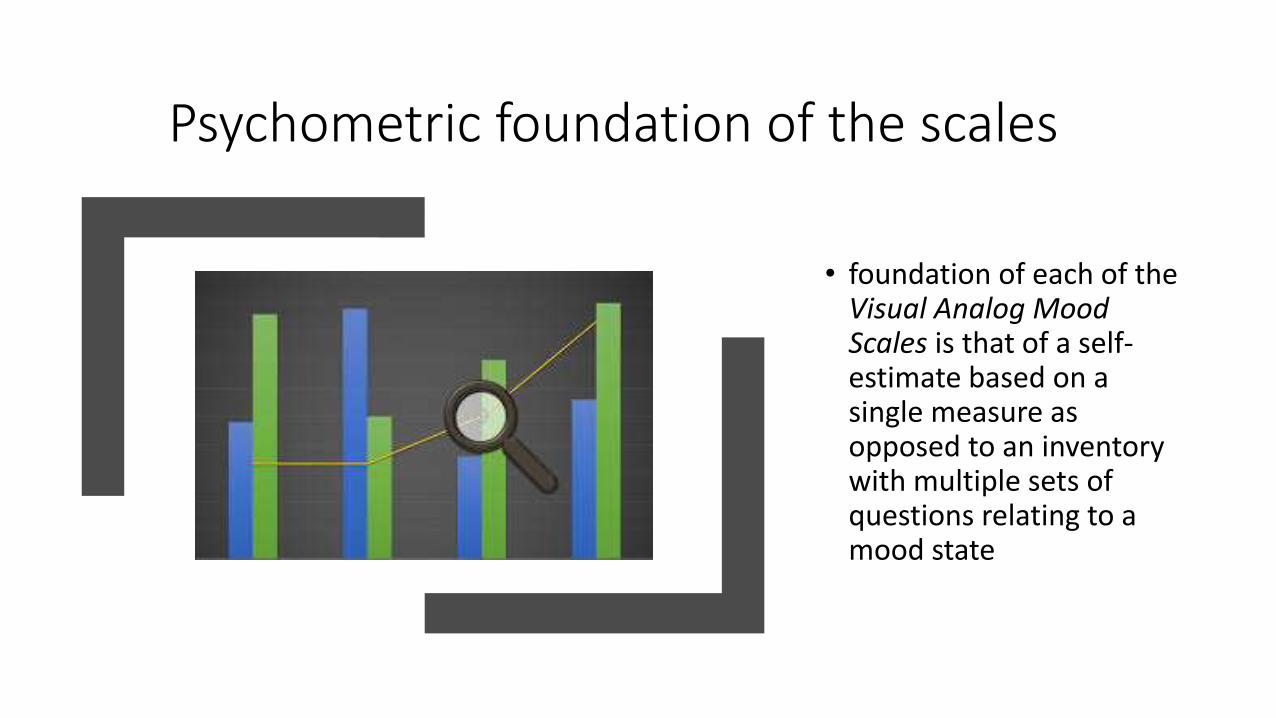
Psychometric foundation of the scales
• foundation of each of the Visual Analog Mood Scales is that of a self-estimate based on a single measure as opposed to an inventory with multiple sets of questions relating to a mood state
Self-estimates
• individuals can be valid observers of themselves
• “what the person tells us directly turns out to be as valuable an index as any other more direct sign” Mischel (1977, p. 248)
• “if self-ratings are (a) directly communicable, (b) the ultimate in economy, and (c) also more valid than their questionnaire counterparts, then we will have to face the embarrassing question of just why we continue to construct personality inventories at all” (Burisch, 1984, p. 225).


![Artificial Intelligence In Medicineaiolos.um.savba.sk/~roman/Papers/aiim19.pdf · complaints). Four 100 mm visual analogue scales [25] for drive, mood, affectivityand drowsiness were](https://img.pdfslide.net/doc/110x75/5fabdb10501bb974893e6d92/artificial-intelligence-in-romanpapersaiim19pdf-complaints-four-100-mm-visual.jpg)