Embed Size (px)
Citation preview
our progress
on the way ahead 2016 results

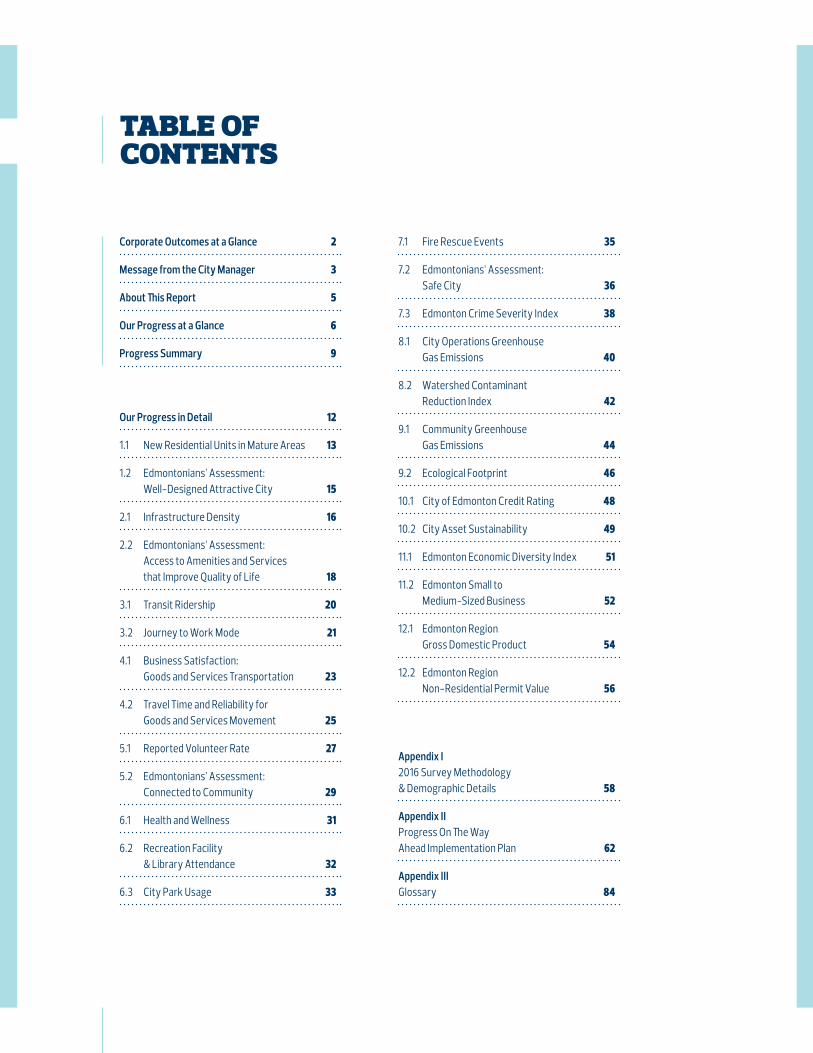
table of contents
Corporate Outcomes at a Glance 2
Message from the City Manager 3
About This Report 5
Our Progress at a Glance 6
Progress Summary 9
Our Progress in Detail 12
1.1 New Residential Units in Mature Areas 13
1.2 Edmontonians’ Assessment: Well-Designed Attractive City 15
2.1 Infrastructure Density 16
2.2 Edmontonians’ Assessment: Access to Amenities and Services that Improve Quality of Life 18
3.1 Transit Ridership 20
3.2 Journey to Work Mode 21
4.1 Business Satisfaction: Goods and Services Transportation 23
4.2 Travel Time and Reliability for Goods and Services Movement 25
5.1 Reported Volunteer Rate 27
5.2 Edmontonians’ Assessment: Connected to Community 29
6.1 Health and Wellness 31
6.2 Recreation Facility & Library Attendance 32
6.3 City Park Usage 33
7.1 Fire Rescue Events 35
7.2 Edmontonians’ Assessment: Safe City 36
7.3 Edmonton Crime Severity Index 38
8.1 City Operations Greenhouse Gas Emissions 40
8.2 Watershed Contaminant Reduction Index 42
9.1 Community Greenhouse Gas Emissions 44
9.2 Ecological Footprint 46
10.1 City of Edmonton Credit Rating 48
10.2 City Asset Sustainability 49
11.1 Edmonton Economic Diversity Index 51
11.2 Edmonton Small to Medium-Sized Business 52
12.1 Edmonton Region Gross Domestic Product 54
12.2 Edmonton Region Non-Residential Permit Value 56
Appendix I 2016 Survey Methodology & Demographic Details 58
Appendix II Progress On The Way Ahead Implementation Plan 62
Appendix III Glossary 84
2
corporate outcomes at a glance
ten-year strategic goals
Transform Edmonton’s Urban Form
Enhance Use Of Public Transit & Active Modes Of Transportation
Improve Edmonton’s Livability
Preserve & Sustain Edmonton’s Environment
Ensure Edmonton’s Financial Sustainability
Diversify Edmonton’s Economy
corporate outcomes
Edmonton is Attractive & Compact.
The City of Edmonton Has Sustainable & Accessible Infrastructure.
Edmontonians Use Public Transit & Active Modes of Transportation.
Goods & Services Move Efficiently.
Edmontonians are Connected to the City in Which They Live, Work & Play.
Edmontonians Use Facilities & Services T hat Promote Healthy Living.
Edmonton is a Safe City.
The City of Edmonton’s Operations are Environmentally Sustainable.
Edmonton is an Environmentally Sustainable & Resilient City.
The City of Edmonton has a Resilient Financial Position.
Edmonton has a Globally Competitive & Entrepreneurial Business Climate.
Edmonton Region is a Catalyst for Industry & Business Growth.

3
Our Progress on The Way Ahead | 2016 Results city of edmonton
on the way ahead
message from the city manager
Every day, City of Edmonton employees serve Edmontonians in countless ways through innovation, creativity, dedication and hard work.
Over the last ten years - the first ten of The Way Ahead - foundational and exceptional work has been done around public transit modes, urban form, economic resilience and regional development and even environment.
I am pleased to present that work The Way Ahead Progress Report 2016, which documents our performance as an organization and a piece that holds us accountable to always working towards advancing that performance and improving our results around those measures.
A high performance organization requires a culture of performance excellence. The approach our employees have taken to report and evaluate performance will be critical to build the culture and therefore, achieve City Council vision and outcomes. This approach also provides the foundation for the City to ensure that systems are in place to ensure the organization is able to make strategic decisions focused on improving the City’s effectiveness and efficiency in demonstrating value to citizens.
linda d.m. cochranecity manager

5
Our Progress on The Way Ahead | 2016 Results city of edmonton
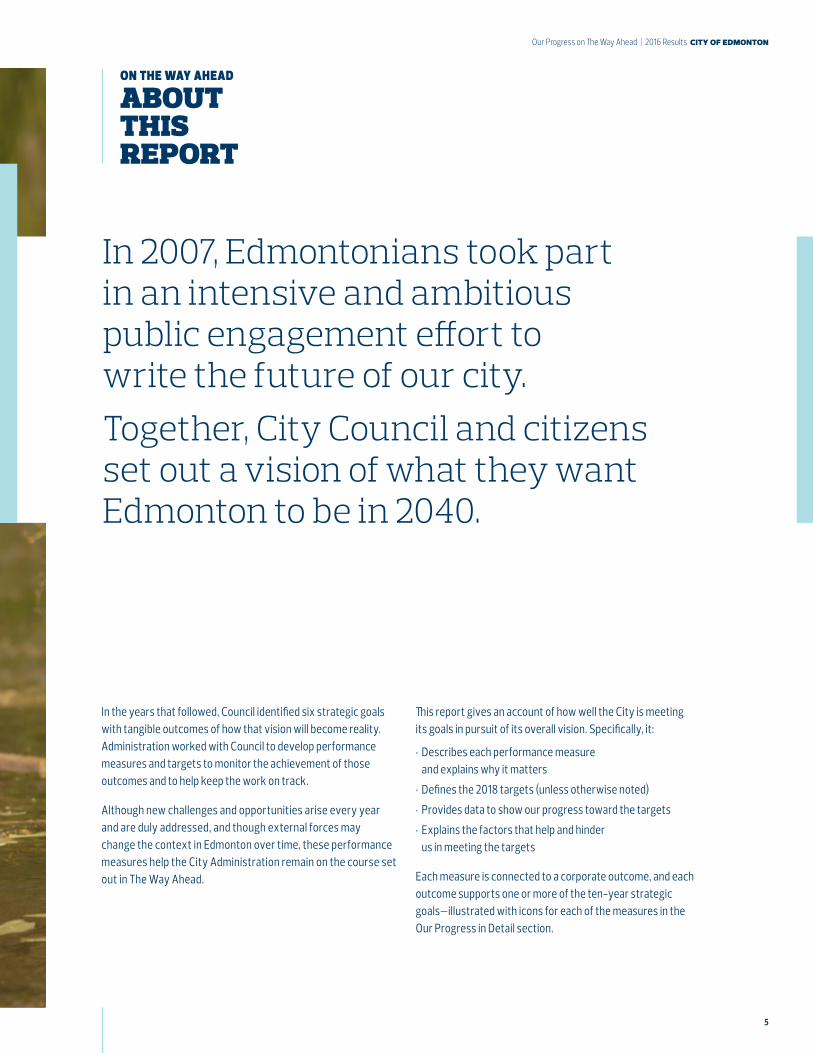
In the years that followed, Council identified six strategic goals with tangible outcomes of how that vision will become reality. Administration worked with Council to develop performance measures and targets to monitor the achievement of those outcomes and to help keep the work on track.
Although new challenges and opportunities arise every year and are duly addressed, and though external forces may change the context in Edmonton over time, these performance measures help the City Administration remain on the course set out in The Way Ahead.
on the way ahead
about this report
This report gives an account of how well the City is meeting its goals in pursuit of its overall vision. Specifically, it:
• Describes each performance measure and explains why it matters
• Defines the 2018 targets (unless otherwise noted)
• Provides data to show our progress toward the targets
• Explains the factors that help and hinder us in meeting the targets
Each measure is connected to a corporate outcome, and each outcome supports one or more of the ten-year strategic goals—illustrated with icons for each of the measures in the Our Progress in Detail section.
In 2007, Edmontonians took part in an intensive and ambitious public engagement effort to write the future of our city.Together, City Council and citizens set out a vision of what they want Edmonton to be in 2040.
6
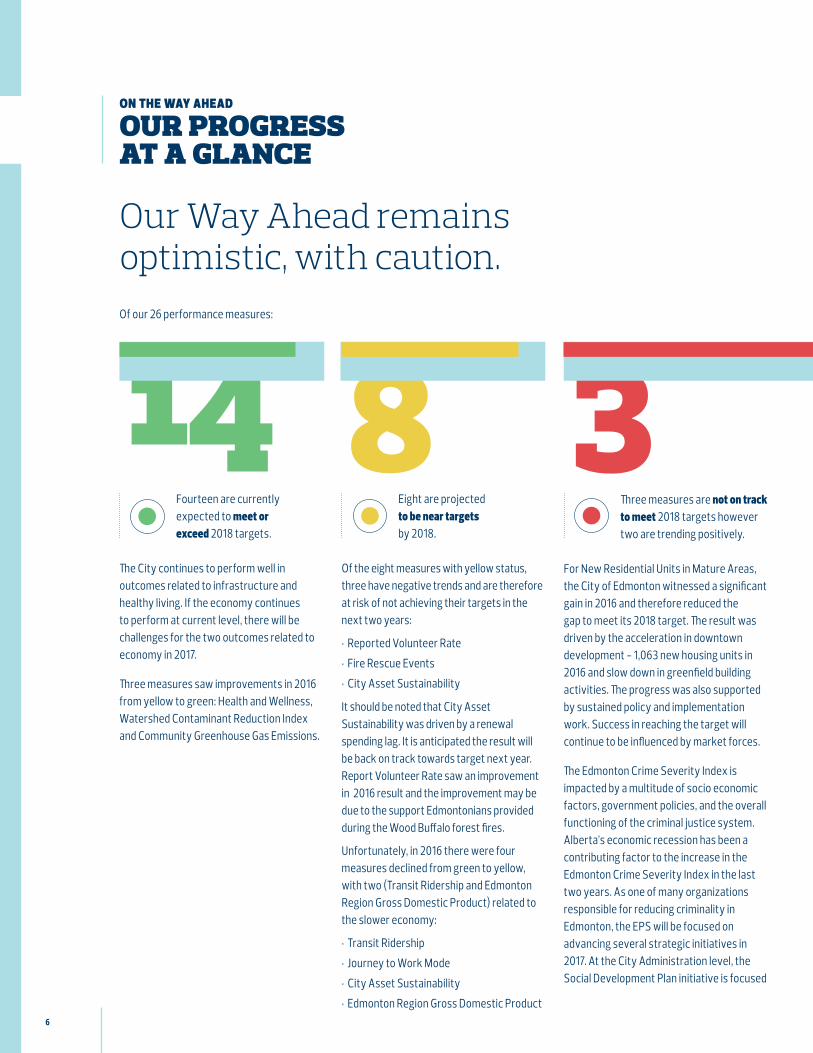
Our Way Ahead remains optimistic, with caution.
The City continues to perform well in outcomes related to infrastructure and healthy living. If the economy continues to perform at current level, there will be challenges for the two outcomes related to economy in 2017.
Three measures saw improvements in 2016 from yellow to green: Health and Wellness, Watershed Contaminant Reduction Index and Community Greenhouse Gas Emissions.
Of the eight measures with yellow status, three have negative trends and are therefore at risk of not achieving their targets in the next two years:
• Reported Volunteer Rate
• Fire Rescue Events
• City Asset Sustainability
It should be noted that City Asset Sustainability was driven by a renewal spending lag. It is anticipated the result will be back on track towards target next year. Report Volunteer Rate saw an improvement in 2016 result and the improvement may be due to the support Edmontonians provided during the Wood Buffalo forest fires.
Unfortunately, in 2016 there were four measures declined from green to yellow, with two (Transit Ridership and Edmonton Region Gross Domestic Product) related to the slower economy:
• Transit Ridership
• Journey to Work Mode
• City Asset Sustainability
• Edmonton Region Gross Domestic Product
For New Residential Units in Mature Areas, the City of Edmonton witnessed a significant gain in 2016 and therefore reduced the gap to meet its 2018 target. The result was driven by the acceleration in downtown development - 1,063 new housing units in 2016 and slow down in greenfield building activities. The progress was also supported by sustained policy and implementation work. Success in reaching the target will continue to be influenced by market forces.
The Edmonton Crime Severity Index is impacted by a multitude of socio economic factors, government policies, and the overall functioning of the criminal justice system. Alberta’s economic recession has been a contributing factor to the increase in the Edmonton Crime Severity Index in the last two years. As one of many organizations responsible for reducing criminality in Edmonton, the EPS will be focused on advancing several strategic initiatives in 2017. At the City Administration level, the Social Development Plan initiative is focused
on the way ahead
our progress at a glance
Fourteen are currently expected to meet or exceed 2018 targets.
Eight are projected to be near targets by 2018.
Three measures are not on track to meet 2018 targets however two are trending positively.
14 8 3Of our 26 performance measures:
7
Our Progress on The Way Ahead | 2016 Results city of edmonton
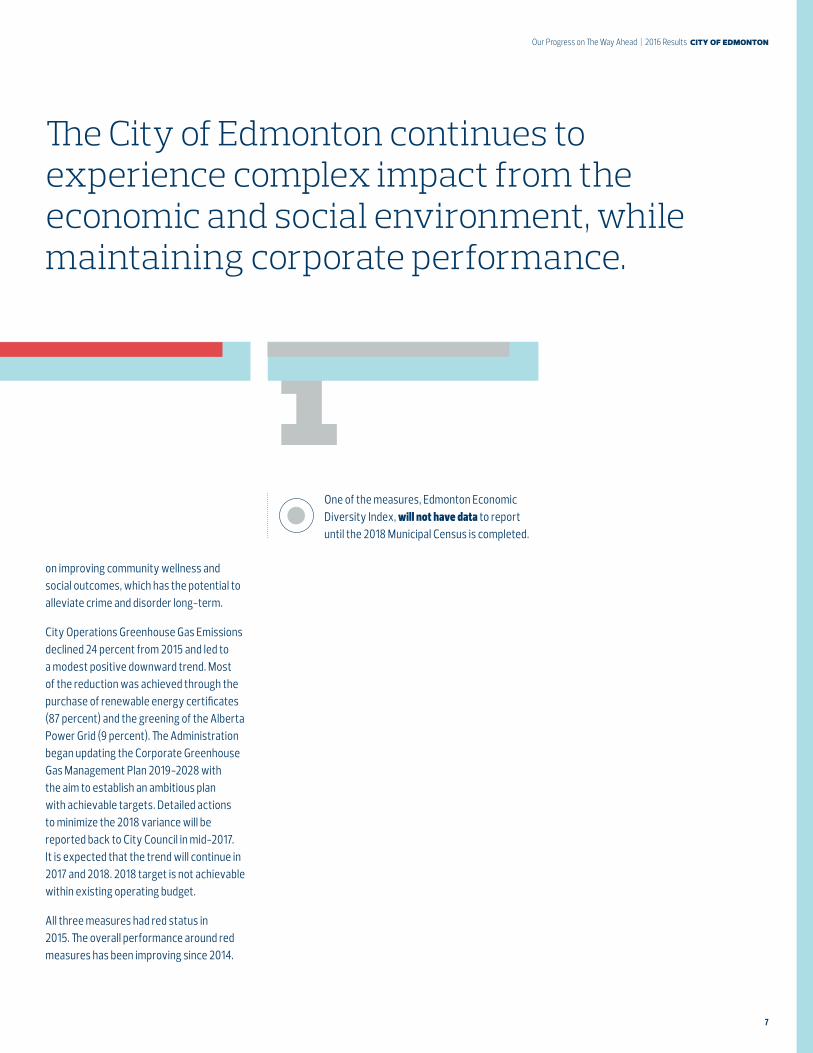
One of the measures, Edmonton Economic Diversity Index, will not have data to report until the 2018 Municipal Census is completed.
1on improving community wellness and social outcomes, which has the potential to alleviate crime and disorder long-term.
City Operations Greenhouse Gas Emissions declined 24 percent from 2015 and led to a modest positive downward trend. Most of the reduction was achieved through the purchase of renewable energy certificates (87 percent) and the greening of the Alberta Power Grid (9 percent). The Administration began updating the Corporate Greenhouse Gas Management Plan 2019-2028 with the aim to establish an ambitious plan with achievable targets. Detailed actions to minimize the 2018 variance will be reported back to City Council in mid-2017. It is expected that the trend will continue in 2017 and 2018. 2018 target is not achievable within existing operating budget.
All three measures had red status in 2015. The overall performance around red measures has been improving since 2014.
The City of Edmonton continues to experience complex impact from the economic and social environment, while maintaining corporate performance.

9
Our Progress on The Way Ahead | 2016 Results city of edmonton
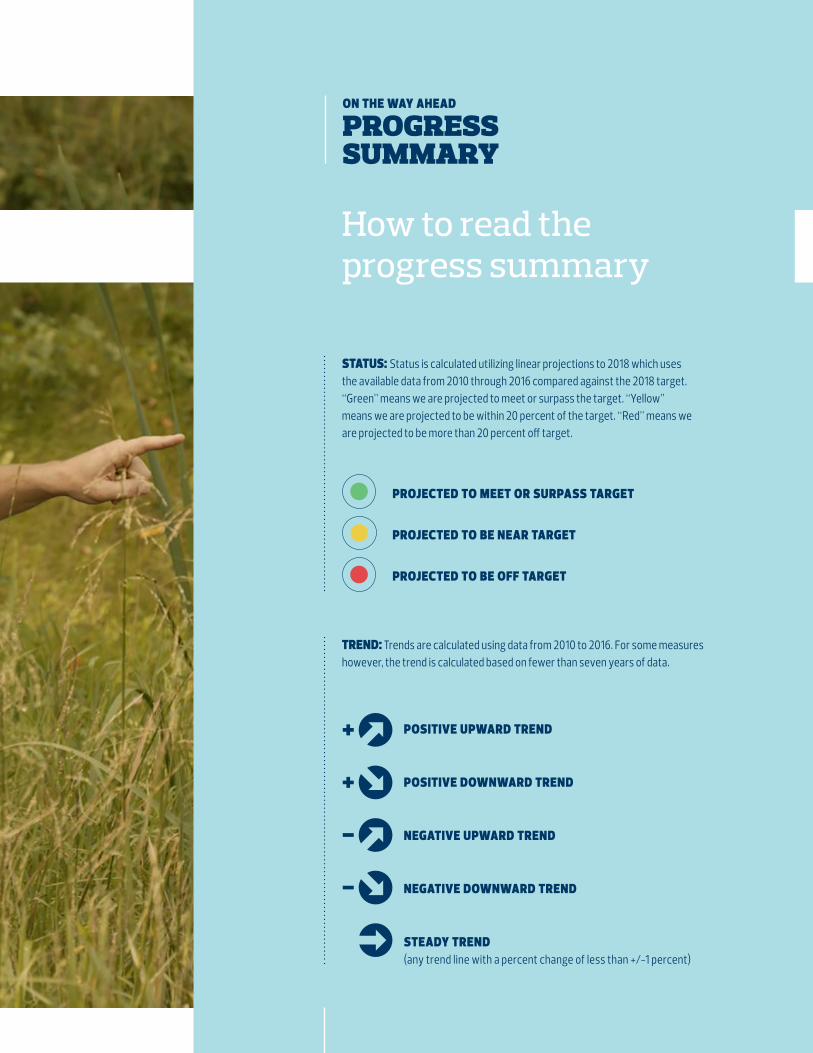
status: Status is calculated utilizing linear projections to 2018 which uses the available data from 2010 through 2016 compared against the 2018 target. “Green” means we are projected to meet or surpass the target. “Yellow” means we are projected to be within 20 percent of the target. “Red” means we are projected to be more than 20 percent off target.
projected to meet or surpass target
projected to be near target
projected to be off target
on the way ahead
progress summary
trend: Trends are calculated using data from 2010 to 2016. For some measures however, the trend is calculated based on fewer than seven years of data.
positive upward trend
positive downward trend
negative upward trend
negative downward trend
steady trend (any trend line with a percent change of less than +/-1 percent)
How to read the progress summary
10
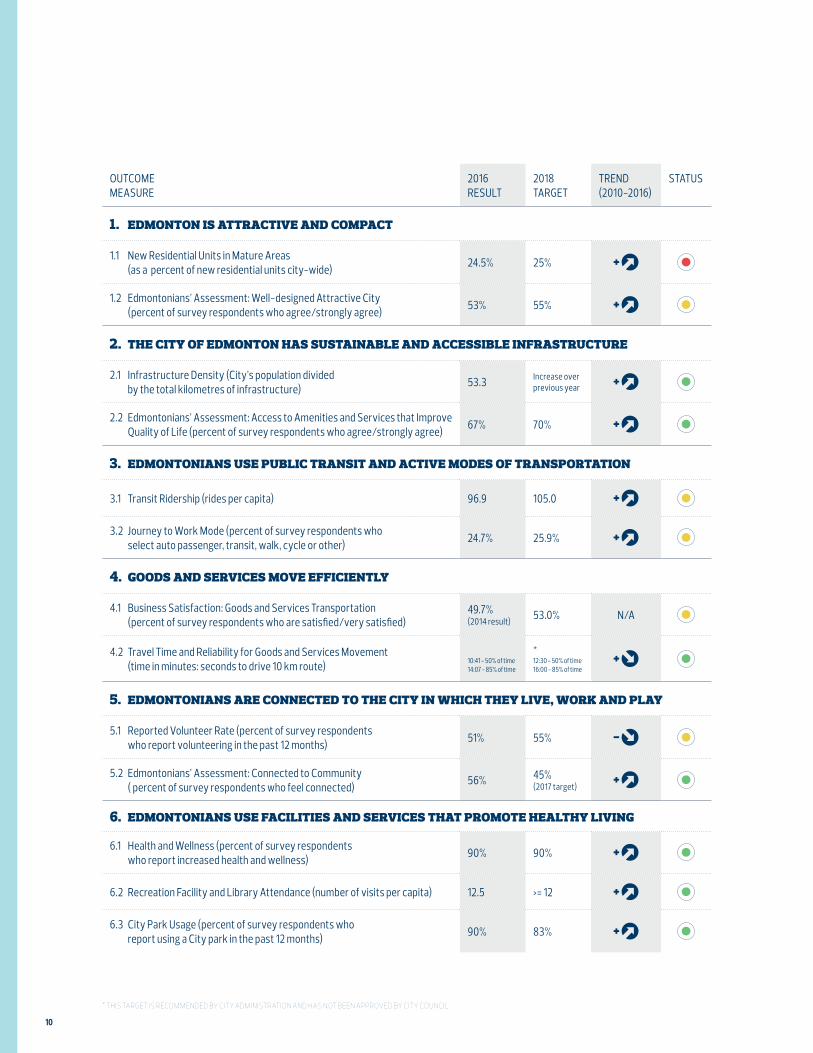
OUTCOME MEASURE
2016 RESULT
2018TARGET
TREND (2010-2016)
STATUS
1. edmonton is attractive and compact
1.1 New Residential Units in Mature Areas (as a percent of new residential units city-wide) 24.5% 25%
1.2 Edmontonians’ Assessment: Well-designed Attractive City (percent of survey respondents who agree/strongly agree) 53% 55%
2. the city of edmonton has sustainable and accessible infrastructure
2.1 Infrastructure Density (City’s population divided by the total kilometres of infrastructure) 53.3 Increase over
previous year
2.2 Edmontonians’ Assessment: Access to Amenities and Services that Improve Quality of Life (percent of survey respondents who agree/strongly agree) 67% 70%
3. edmontonians use public transit and active modes of transportation
3.1 Transit Ridership (rides per capita) 96.9 105.0
3.2 Journey to Work Mode (percent of survey respondents who select auto passenger, transit, walk, cycle or other) 24.7% 25.9%
4. goods and services move efficiently
4.1 Business Satisfaction: Goods and Services Transportation (percent of survey respondents who are satisfied/very satisfied)
49.7% (2014 result) 53.0% N/A
4.2 Travel Time and Reliability for Goods and Services Movement (time in minutes: seconds to drive 10 km route)
10:41 - 50% of time14:07 - 85% of time
* 12:30 - 50% of time16:00 - 85% of time
5. edmontonians are connected to the city in which they live, work and play
5.1 Reported Volunteer Rate (percent of survey respondents who report volunteering in the past 12 months) 51% 55%
5.2 Edmontonians’ Assessment: Connected to Community ( percent of survey respondents who feel connected) 56% 45%
(2017 target)
6. edmontonians use facilities and services that promote healthy living
6.1 Health and Wellness (percent of survey respondents who report increased health and wellness) 90% 90%
6.2 Recreation Facility and Library Attendance (number of visits per capita) 12.5 >= 12
6.3 City Park Usage (percent of survey respondents who report using a City park in the past 12 months) 90% 83%
* this target is recommended by city administration and has not been approved by city council.
11
Our Progress on The Way Ahead | 2016 Results city of edmonton
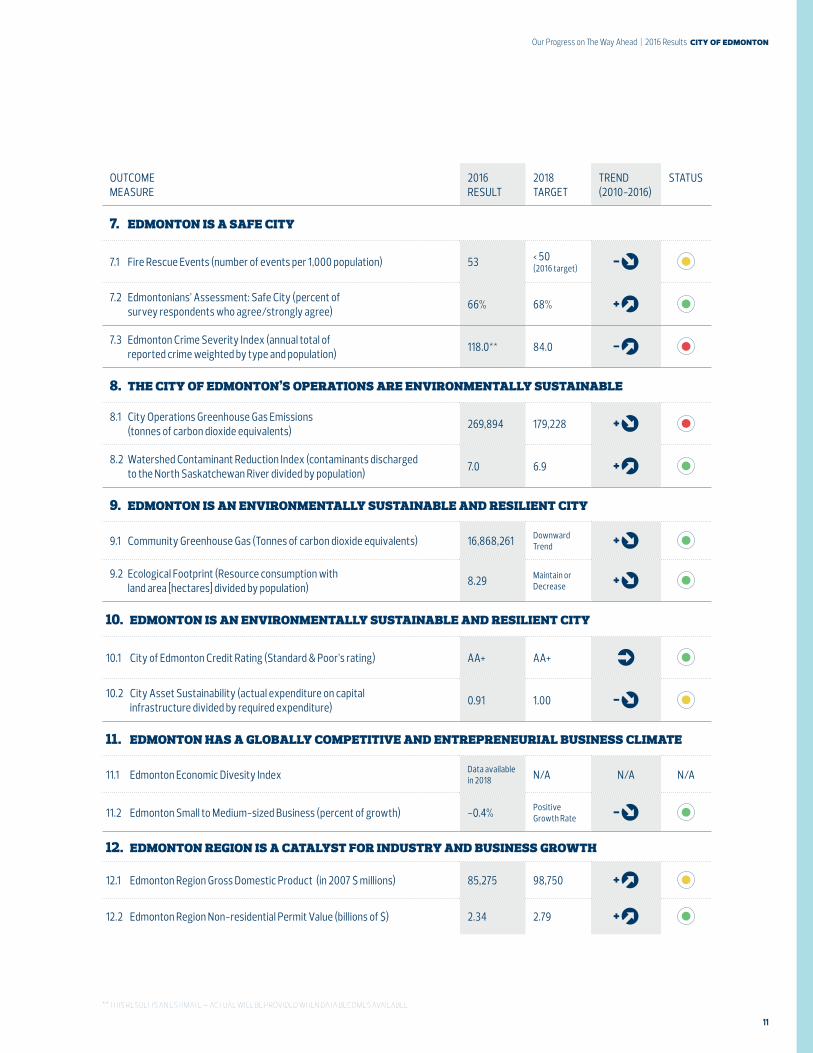
OUTCOME MEASURE
2016 RESULT
2018TARGET
TREND (2010-2016)
STATUS
7. edmonton is a safe city
7.1 Fire Rescue Events (number of events per 1,000 population) 53 < 50(2016 target)
7.2 Edmontonians’ Assessment: Safe City (percent of survey respondents who agree/strongly agree) 66% 68%
7.3 Edmonton Crime Severity Index (annual total of reported crime weighted by type and population) 118.0** 84.0
8. the city of edmonton’s operations are environmentally sustainable
8.1 City Operations Greenhouse Gas Emissions (tonnes of carbon dioxide equivalents) 269,894 179,228
8.2 Watershed Contaminant Reduction Index (contaminants discharged to the North Saskatchewan River divided by population) 7.0 6.9
9. edmonton is an environmentally sustainable and resilient city
9.1 Community Greenhouse Gas (Tonnes of carbon dioxide equivalents) 16,868,261 Downward Trend
9.2 Ecological Footprint (Resource consumption with land area [hectares] divided by population) 8.29 Maintain or
Decrease
10. edmonton is an environmentally sustainable and resilient city
10.1 City of Edmonton Credit Rating (Standard & Poor’s rating) AA+ AA+
10.2 City Asset Sustainability (actual expenditure on capital infrastructure divided by required expenditure) 0.91 1.00
11. edmonton has a globally competitive and entrepreneurial business climate
11.1 Edmonton Economic Divesity Index Data available in 2018 N/A N/A N/A
11.2 Edmonton Small to Medium-sized Business (percent of growth) -0.4% Positive Growth Rate
12. edmonton region is a catalyst for industry and business growth
12.1 Edmonton Region Gross Domestic Product (in 2007 $ millions) 85,275 98,750
12.2 Edmonton Region Non-residential Permit Value (billions of $) 2.34 2.79
** this result is an estimate – actual will be provided when data becomes available
Our Progress In Detail
13
Our Progress on The Way Ahead | 2016 Results city of edmonton
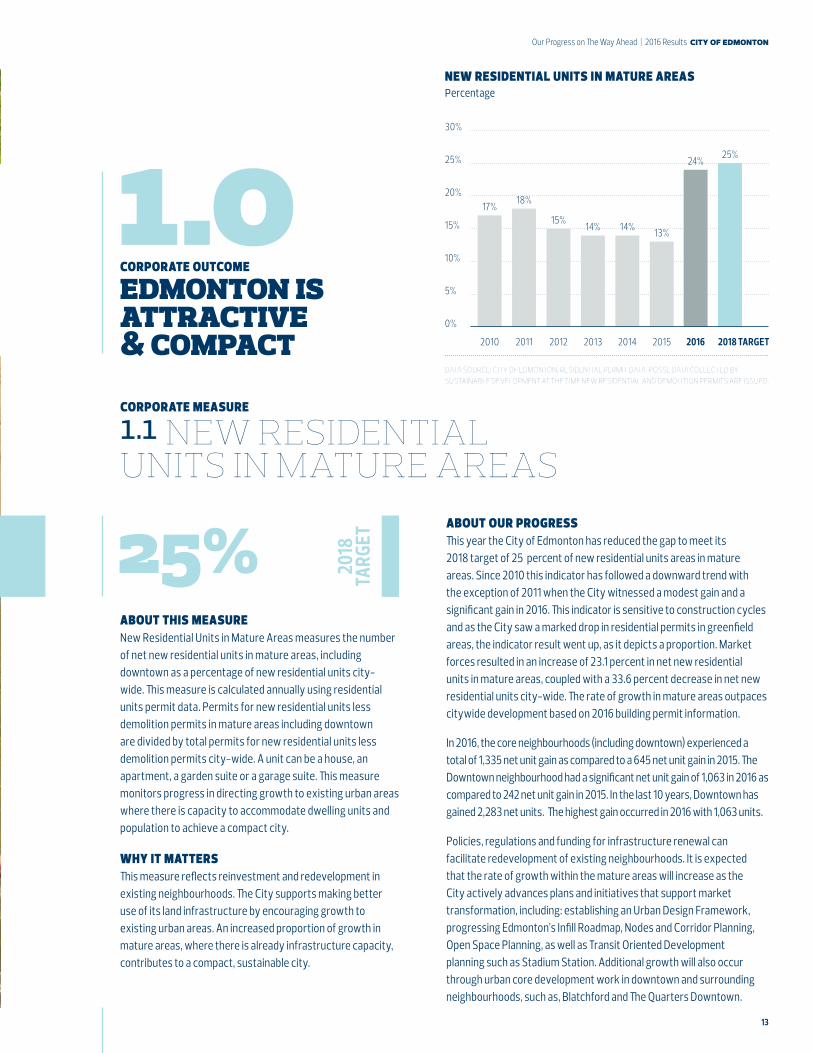
25%
1.0
about this measure New Residential Units in Mature Areas measures the number of net new residential units in mature areas, including downtown as a percentage of new residential units city-wide. This measure is calculated annually using residential units permit data. Permits for new residential units less demolition permits in mature areas including downtown are divided by total permits for new residential units less demolition permits city-wide. A unit can be a house, an apartment, a garden suite or a garage suite. This measure monitors progress in directing growth to existing urban areas where there is capacity to accommodate dwelling units and population to achieve a compact city.
why it matters This measure reflects reinvestment and redevelopment in existing neighbourhoods. The City supports making better use of its land infrastructure by encouraging growth to existing urban areas. An increased proportion of growth in mature areas, where there is already infrastructure capacity, contributes to a compact, sustainable city.
about our progress This year the City of Edmonton has reduced the gap to meet its 2018 target of 25 percent of new residential units areas in mature areas. Since 2010 this indicator has followed a downward trend with the exception of 2011 when the City witnessed a modest gain and a significant gain in 2016. This indicator is sensitive to construction cycles and as the City saw a marked drop in residential permits in greenfield areas, the indicator result went up, as it depicts a proportion. Market forces resulted in an increase of 23.1 percent in net new residential units in mature areas, coupled with a 33.6 percent decrease in net new residential units city-wide. The rate of growth in mature areas outpaces citywide development based on 2016 building permit information.
In 2016, the core neighbourhoods (including downtown) experienced a total of 1,335 net unit gain as compared to a 645 net unit gain in 2015. The Downtown neighbourhood had a significant net unit gain of 1,063 in 2016 as compared to 242 net unit gain in 2015. In the last 10 years, Downtown has gained 2,283 net units. The highest gain occurred in 2016 with 1,063 units.
Policies, regulations and funding for infrastructure renewal can facilitate redevelopment of existing neighbourhoods. It is expected that the rate of growth within the mature areas will increase as the City actively advances plans and initiatives that support market transformation, including: establishing an Urban Design Framework, progressing Edmonton’s Infill Roadmap, Nodes and Corridor Planning, Open Space Planning, as well as Transit Oriented Development planning such as Stadium Station. Additional growth will also occur through urban core development work in downtown and surrounding neighbourhoods, such as, Blatchford and The Quarters Downtown.
corporate measure
1.1 new residential units in mature areas
corporate outcome
edmonton is attractive & compact
30%
25%
20%
15%
10%
5%
0%
17%
2010 2011 2012 2013 2014 2015 2016 2018 TARGET
18%
15%14% 14% 13%
24% 25%
new residential units in mature areas percentage
data source: city of edmonton, residential permit data. posse data collected by sustainable development at the time new residential and demolition permits are issued.
2018
TA
RGET
14
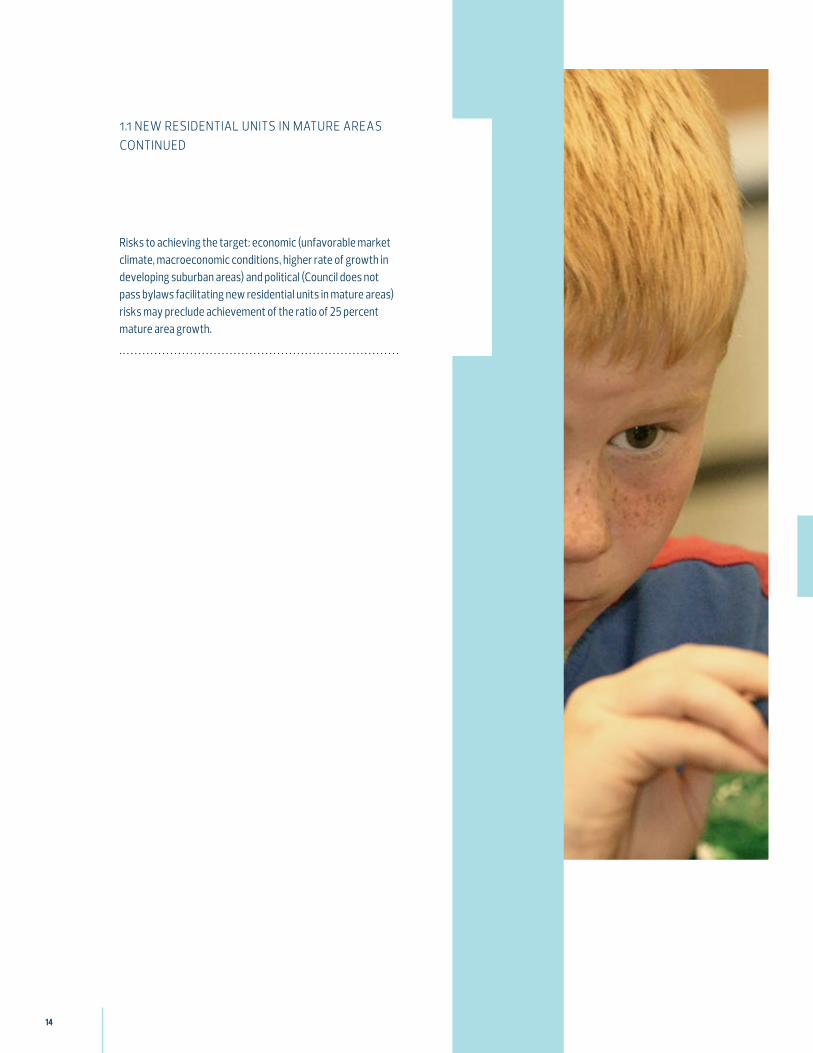
Risks to achieving the target: economic (unfavorable market climate, macroeconomic conditions, higher rate of growth in developing suburban areas) and political (Council does not pass bylaws facilitating new residential units in mature areas) risks may preclude achievement of the ratio of 25 percent mature area growth.
1.1 new residential units in mature areas continued
15
Our Progress on The Way Ahead | 2016 Results city of edmonton
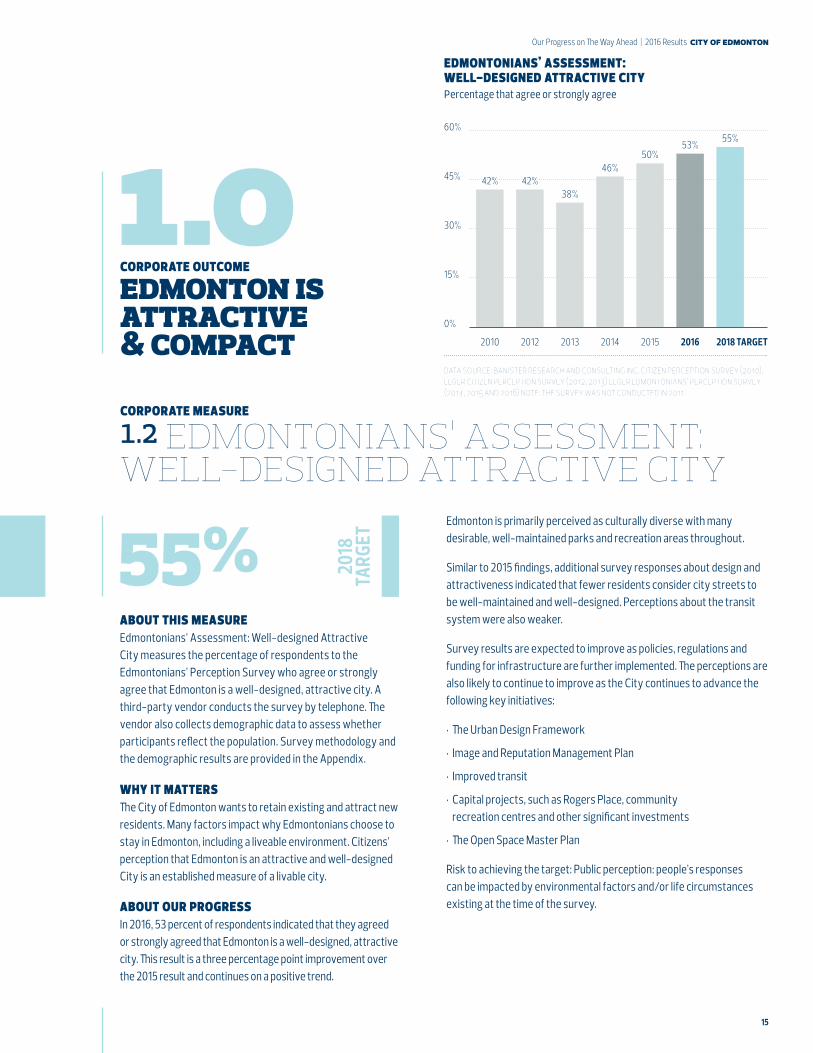
55%about this measure Edmontonians’ Assessment: Well-designed Attractive City measures the percentage of respondents to the Edmontonians’ Perception Survey who agree or strongly agree that Edmonton is a well-designed, attractive city. A third-party vendor conducts the survey by telephone. The vendor also collects demographic data to assess whether participants reflect the population. Survey methodology and the demographic results are provided in the Appendix.
why it matters The City of Edmonton wants to retain existing and attract new residents. Many factors impact why Edmontonians choose to stay in Edmonton, including a liveable environment. Citizens’ perception that Edmonton is an attractive and well-designed City is an established measure of a livable city.
Edmonton is primarily perceived as culturally diverse with many desirable, well-maintained parks and recreation areas throughout.
Similar to 2015 findings, additional survey responses about design and attractiveness indicated that fewer residents consider city streets to be well-maintained and well-designed. Perceptions about the transit system were also weaker.
Survey results are expected to improve as policies, regulations and funding for infrastructure are further implemented. The perceptions are also likely to continue to improve as the City continues to advance the following key initiatives:
• The Urban Design Framework
• Image and Reputation Management Plan
• Improved transit
• Capital projects, such as Rogers Place, community recreation centres and other significant investments
• The Open Space Master Plan
Risk to achieving the target: Public perception: people’s responses can be impacted by environmental factors and/or life circumstances existing at the time of the survey.
corporate measure
1.2 edmontonians’ assessment: well-designed attractive city
1.0corporate outcome
edmonton is attractive & compact
about our progress In 2016, 53 percent of respondents indicated that they agreed or strongly agreed that Edmonton is a well-designed, attractive city. This result is a three percentage point improvement over the 2015 result and continues on a positive trend.
data source: banister research and consulting inc. citizen perception survey (2010), leger citizen perception survey (2012, 2013) leger edmontonians’ perception survey (2014, 2015 and 2016) note: the survey was not conducted in 2011.
60%
45%
30%
15%
0%
42% 42%
2010 2012 2013 2014 2015 2016 2018 TARGET
38%
46%50%
53% 55%
edmontonians’ assessment: well-designed attractive city percentage that agree or strongly agree
2018
TA
RGET
16
2.0corporate outcome
the city has sustainable & accessible infrastructure
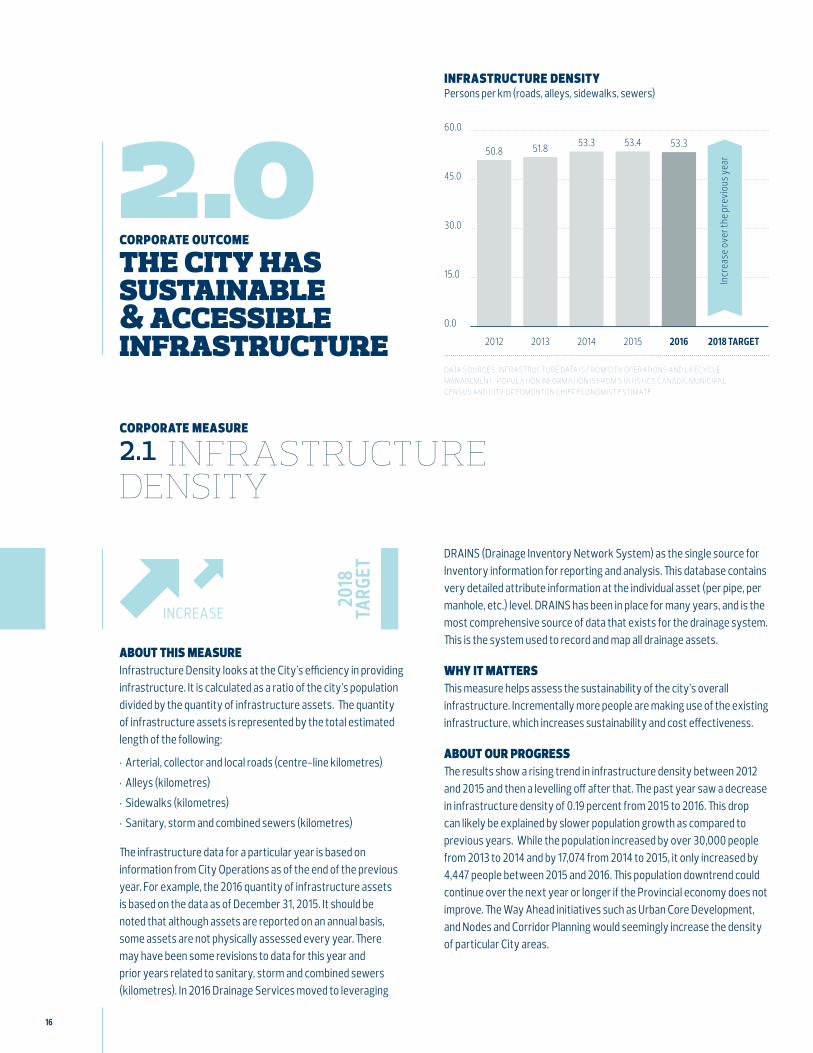
about this measure Infrastructure Density looks at the City’s efficiency in providing infrastructure. It is calculated as a ratio of the city’s population divided by the quantity of infrastructure assets. The quantity of infrastructure assets is represented by the total estimated length of the following:
• Arterial, collector and local roads (centre-line kilometres)
• Alleys (kilometres)
• Sidewalks (kilometres)
• Sanitary, storm and combined sewers (kilometres)
The infrastructure data for a particular year is based on information from City Operations as of the end of the previous year. For example, the 2016 quantity of infrastructure assets is based on the data as of December 31, 2015. It should be noted that although assets are reported on an annual basis, some assets are not physically assessed every year. There may have been some revisions to data for this year and prior years related to sanitary, storm and combined sewers (kilometres). In 2016 Drainage Services moved to leveraging
corporate measure
2.1 infrastructure density
DRAINS (Drainage Inventory Network System) as the single source for Inventory information for reporting and analysis. This database contains very detailed attribute information at the individual asset (per pipe, per manhole, etc.) level. DRAINS has been in place for many years, and is the most comprehensive source of data that exists for the drainage system. This is the system used to record and map all drainage assets.
why it matters This measure helps assess the sustainability of the city’s overall infrastructure. Incrementally more people are making use of the existing infrastructure, which increases sustainability and cost effectiveness.
about our progress The results show a rising trend in infrastructure density between 2012 and 2015 and then a levelling off after that. The past year saw a decrease in infrastructure density of 0.19 percent from 2015 to 2016. This drop can likely be explained by slower population growth as compared to previous years. While the population increased by over 30,000 people from 2013 to 2014 and by 17,074 from 2014 to 2015, it only increased by 4,447 people between 2015 and 2016. This population downtrend could continue over the next year or longer if the Provincial economy does not improve. The Way Ahead initiatives such as Urban Core Development, and Nodes and Corridor Planning would seemingly increase the density of particular City areas.
INCREASE
2018
TA
RGET
data sources: infrastructure data is from city operations and lifecycle management. population information is from statistics canada, municipal census and city of edmonton chief economist estimate
60.0
0.0
15.0
30.0
45.0
50.8 51.8 53.3 53.4 53.3
2012 201520142013 2016 2018 TARGET
infrastructure density Persons per km (roads, alleys, sidewalks, sewers)
Incr
ease
ove
r the
pre
viou
s yea
r
17
Our Progress on The Way Ahead | 2016 Results city of edmonton
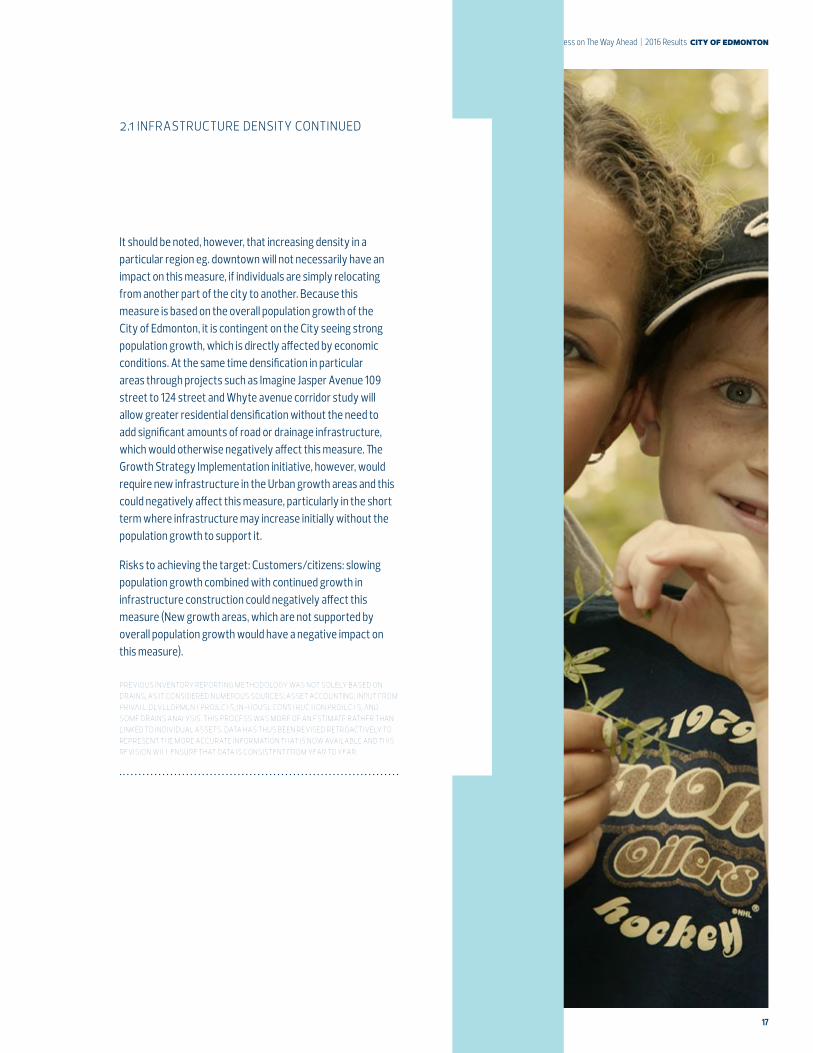
previous inventory reporting methodology was not solely based on drains, as it considered numerous sources; asset accounting, input from private development projects, in-house construction projects, and some drains analysis. this process was more of an estimate rather than linked to individual assets. data has thus been revised retroactively to represent the more accurate information that is now available and this revision will ensure that data is consistent from year to year.
It should be noted, however, that increasing density in a particular region eg. downtown will not necessarily have an impact on this measure, if individuals are simply relocating from another part of the city to another. Because this measure is based on the overall population growth of the City of Edmonton, it is contingent on the City seeing strong population growth, which is directly affected by economic conditions. At the same time densification in particular areas through projects such as Imagine Jasper Avenue 109 street to 124 street and Whyte avenue corridor study will allow greater residential densification without the need to add significant amounts of road or drainage infrastructure, which would otherwise negatively affect this measure. The Growth Strategy Implementation initiative, however, would require new infrastructure in the Urban growth areas and this could negatively affect this measure, particularly in the short term where infrastructure may increase initially without the population growth to support it.
Risks to achieving the target: Customers/citizens: slowing population growth combined with continued growth in infrastructure construction could negatively affect this measure (New growth areas, which are not supported by overall population growth would have a negative impact on this measure).
2.1 infrastructure density continued
18
2.0corporate outcome
the city has sustainable & accessible infrastructure
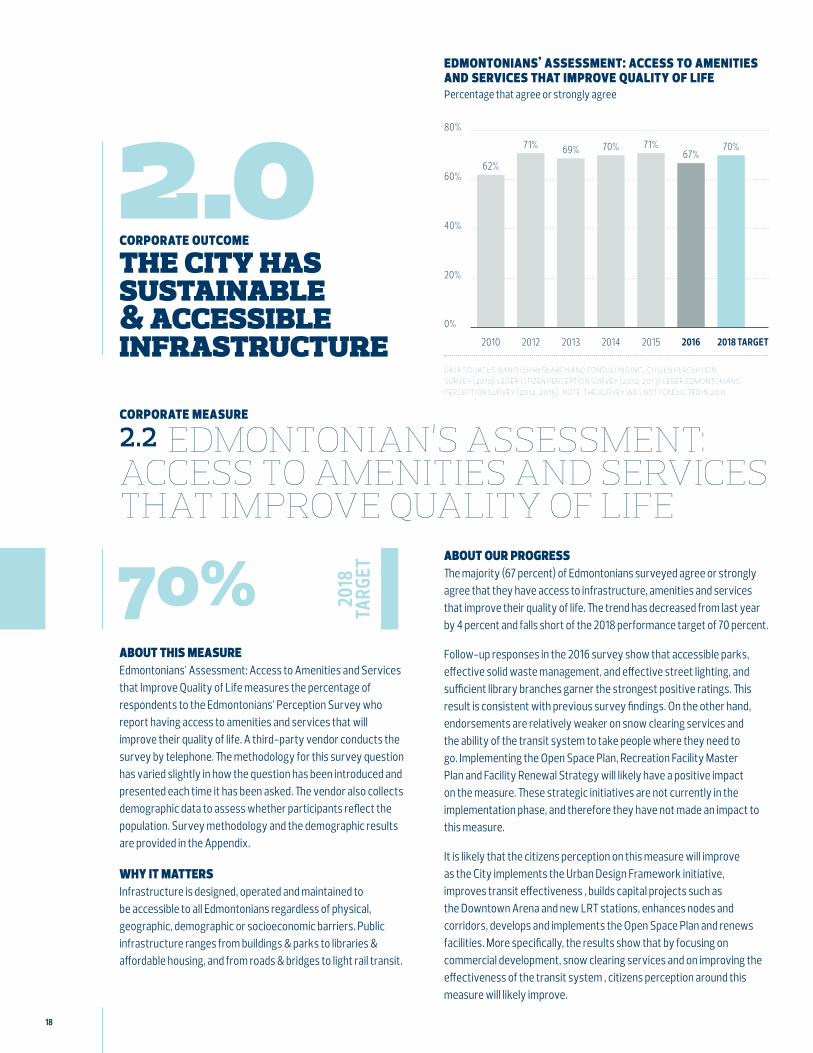
70%about this measure Edmontonians’ Assessment: Access to Amenities and Services that Improve Quality of Life measures the percentage of respondents to the Edmontonians’ Perception Survey who report having access to amenities and services that will improve their quality of life. A third-party vendor conducts the survey by telephone. The methodology for this survey question has varied slightly in how the question has been introduced and presented each time it has been asked. The vendor also collects demographic data to assess whether participants reflect the population. Survey methodology and the demographic results are provided in the Appendix.
why it matters Infrastructure is designed, operated and maintained to be accessible to all Edmontonians regardless of physical, geographic, demographic or socioeconomic barriers. Public infrastructure ranges from buildings & parks to libraries & affordable housing, and from roads & bridges to light rail transit.
corporate measure
2.2 edmontonian’s assessment: access to amenities and services that improve quality of life
about our progress The majority (67 percent) of Edmontonians surveyed agree or strongly agree that they have access to infrastructure, amenities and services that improve their quality of life. The trend has decreased from last year by 4 percent and falls short of the 2018 performance target of 70 percent.
Follow-up responses in the 2016 survey show that accessible parks, effective solid waste management, and effective street lighting, and sufficient library branches garner the strongest positive ratings. This result is consistent with previous survey findings. On the other hand, endorsements are relatively weaker on snow clearing services and the ability of the transit system to take people where they need to go. Implementing the Open Space Plan, Recreation Facility Master Plan and Facility Renewal Strategy will likely have a positive impact on the measure. These strategic initiatives are not currently in the implementation phase, and therefore they have not made an impact to this measure.
It is likely that the citizens perception on this measure will improve as the City implements the Urban Design Framework initiative, improves transit effectiveness , builds capital projects such as the Downtown Arena and new LRT stations, enhances nodes and corridors, develops and implements the Open Space Plan and renews facilities. More specifically, the results show that by focusing on commercial development, snow clearing services and on improving the effectiveness of the transit system , citizens perception around this measure will likely improve.
2018
TA
RGET
data sources: banister research and consulting inc., citizen perception survey (2010), leger citizen perception survey (2012, 2013) leger edmontonians’ perception survey (2014, 2015). note: the survey was not conducted in 2011.
80%
60%
40%
20%
0%
62%
2010 2012 2013 2014 2015 2016 2018 TARGET
71% 69% 70% 71%67%
70%
edmontonians’ assessment: access to amenities and services that improve quality of life percentage that agree or strongly agree
19
Our Progress on The Way Ahead | 2016 Results city of edmonton
Risk to achieving the target: Public perception - perception-based questions are influenced by recent events, expectations and life circumstances. Improving the areas where Edmontonians have low satisfaction levels are likely to result in increased satisfaction.
2.2 edmontonian’s assessment: access to amenities and services that improve quality of life continued
20
3.0corporate outcome
edmontonians use public transit and active modes of transportation
105 2018
TA
RGET
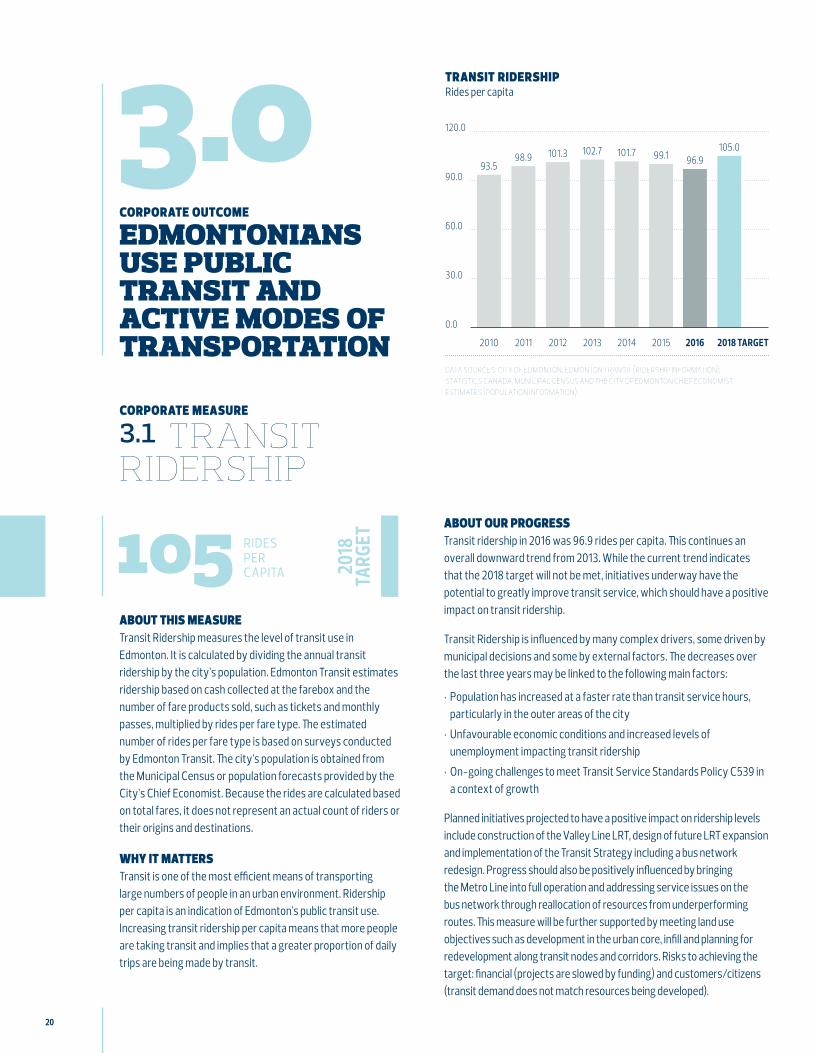
about this measure Transit Ridership measures the level of transit use in Edmonton. It is calculated by dividing the annual transit ridership by the city’s population. Edmonton Transit estimates ridership based on cash collected at the farebox and the number of fare products sold, such as tickets and monthly passes, multiplied by rides per fare type. The estimated number of rides per fare type is based on surveys conducted by Edmonton Transit. The city’s population is obtained from the Municipal Census or population forecasts provided by the City’s Chief Economist. Because the rides are calculated based on total fares, it does not represent an actual count of riders or their origins and destinations.
why it matters Transit is one of the most efficient means of transporting large numbers of people in an urban environment. Ridership per capita is an indication of Edmonton’s public transit use. Increasing transit ridership per capita means that more people are taking transit and implies that a greater proportion of daily trips are being made by transit.
corporate measure
3.1 transit ridership
about our progress Transit ridership in 2016 was 96.9 rides per capita. This continues an overall downward trend from 2013. While the current trend indicates that the 2018 target will not be met, initiatives underway have the potential to greatly improve transit service, which should have a positive impact on transit ridership.
Transit Ridership is influenced by many complex drivers, some driven by municipal decisions and some by external factors. The decreases over the last three years may be linked to the following main factors:
• Population has increased at a faster rate than transit service hours, particularly in the outer areas of the city
• Unfavourable economic conditions and increased levels of unemployment impacting transit ridership
• On-going challenges to meet Transit Service Standards Policy C539 in a context of growth
Planned initiatives projected to have a positive impact on ridership levels include construction of the Valley Line LRT, design of future LRT expansion and implementation of the Transit Strategy including a bus network redesign. Progress should also be positively influenced by bringing the Metro Line into full operation and addressing service issues on the bus network through reallocation of resources from underperforming routes. This measure will be further supported by meeting land use objectives such as development in the urban core, infill and planning for redevelopment along transit nodes and corridors. Risks to achieving the target: financial (projects are slowed by funding) and customers/citizens (transit demand does not match resources being developed).
rides per capita
120.0
90.0
60.0
30.0
0.0
93.5
2010 2011 2012 2013 2014 2015 2016 2018 TARGET
98.9 101.3 102.7 101.7 99.1 96.9105.0
transit ridership Rides per capita
data sources: city of edmonton, edmonton transit (ridership information); statistics canada, municipal census and the city of edmonton chief economist estimates (population information)
21
Our Progress on The Way Ahead | 2016 Results city of edmonton
3.0corporate outcome
edmontonians use public transit and active modes of transportation
25.9% 2018
TA
RGET
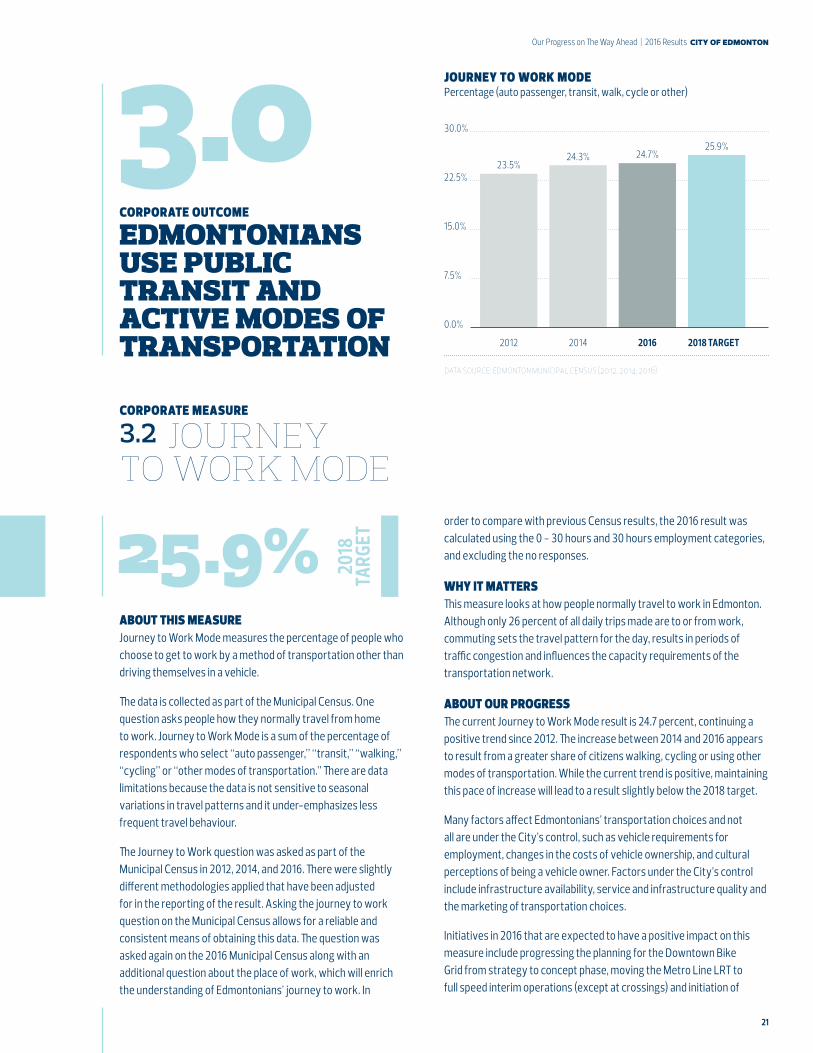
about this measure Journey to Work Mode measures the percentage of people who choose to get to work by a method of transportation other than driving themselves in a vehicle.
The data is collected as part of the Municipal Census. One question asks people how they normally travel from home to work. Journey to Work Mode is a sum of the percentage of respondents who select “auto passenger,” “transit,” “walking,” “cycling” or “other modes of transportation.” There are data limitations because the data is not sensitive to seasonal variations in travel patterns and it under-emphasizes less frequent travel behaviour.
The Journey to Work question was asked as part of the Municipal Census in 2012, 2014, and 2016. There were slightly different methodologies applied that have been adjusted for in the reporting of the result. Asking the journey to work question on the Municipal Census allows for a reliable and consistent means of obtaining this data. The question was asked again on the 2016 Municipal Census along with an additional question about the place of work, which will enrich the understanding of Edmontonians’ journey to work. In
corporate measure
3.2 journey to work mode
order to compare with previous Census results, the 2016 result was calculated using the 0 - 30 hours and 30 hours employment categories, and excluding the no responses.
why it matters This measure looks at how people normally travel to work in Edmonton. Although only 26 percent of all daily trips made are to or from work, commuting sets the travel pattern for the day, results in periods of traffic congestion and influences the capacity requirements of the transportation network.
about our progress The current Journey to Work Mode result is 24.7 percent, continuing a positive trend since 2012. The increase between 2014 and 2016 appears to result from a greater share of citizens walking, cycling or using other modes of transportation. While the current trend is positive, maintaining this pace of increase will lead to a result slightly below the 2018 target.
Many factors affect Edmontonians’ transportation choices and not all are under the City’s control, such as vehicle requirements for employment, changes in the costs of vehicle ownership, and cultural perceptions of being a vehicle owner. Factors under the City’s control include infrastructure availability, service and infrastructure quality and the marketing of transportation choices.
Initiatives in 2016 that are expected to have a positive impact on this measure include progressing the planning for the Downtown Bike Grid from strategy to concept phase, moving the Metro Line LRT to full speed interim operations (except at crossings) and initiation of
data source: edmonton municipal census (2012, 2014, 2016)
30.0%
0.0%
7.5%
15.0%
22.5%23.5%
2012 2014 2016 2018 TARGET
24.3% 24.7%25.9%
journey to work mode Percentage (auto passenger, transit, walk, cycle or other)
22
Valley Line LRT construction. Planning and design for future LRT expansion and implementation of the Transit Strategy including a bus network redesign will support mode shift to transit. Likewise, active modes will be supported through the planning and construction of cycling infrastructure and integration of the Complete Streets Guidelines in the Roads Design Standards. Developments in the urban core and planning for redevelopment along transit nodes and corridors will further support this measure by improving alignment of transportation infrastructure and service with land use.
Risks to achieving the target: financial (projects are slowed by funding) and customers/citizens (transit demand does not match resources being developed).
3.2 journey to work mode continued
23
Our Progress on The Way Ahead | 2016 Results city of edmonton
4.0corporate outcome
goods and services move efficiently
53%
corporate measure
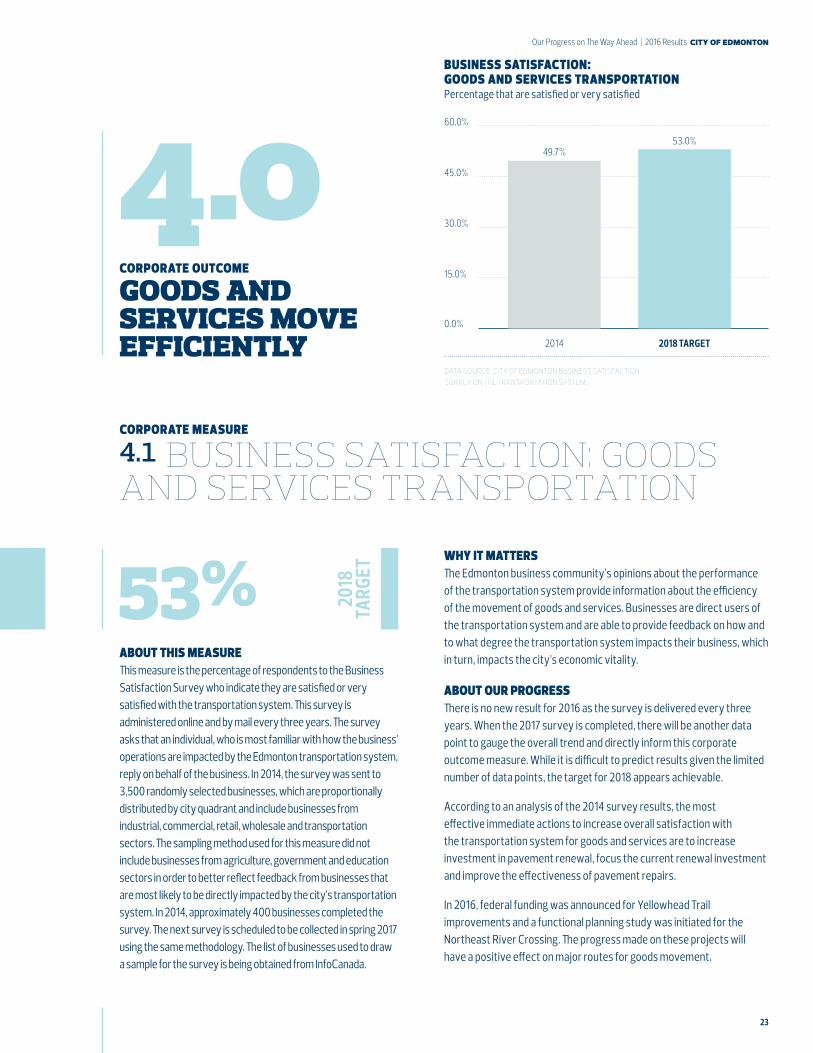
4.1 business satisfaction: goods and services transportation
about this measure This measure is the percentage of respondents to the Business Satisfaction Survey who indicate they are satisfied or very satisfied with the transportation system. This survey is administered online and by mail every three years. The survey asks that an individual, who is most familiar with how the business’ operations are impacted by the Edmonton transportation system, reply on behalf of the business. In 2014, the survey was sent to 3,500 randomly selected businesses, which are proportionally distributed by city quadrant and include businesses from industrial, commercial, retail, wholesale and transportation sectors. The sampling method used for this measure did not include businesses from agriculture, government and education sectors in order to better reflect feedback from businesses that are most likely to be directly impacted by the city’s transportation system. In 2014, approximately 400 businesses completed the survey. The next survey is scheduled to be collected in spring 2017 using the same methodology. The list of businesses used to draw a sample for the survey is being obtained from InfoCanada.
why it matters The Edmonton business community’s opinions about the performance of the transportation system provide information about the efficiency of the movement of goods and services. Businesses are direct users of the transportation system and are able to provide feedback on how and to what degree the transportation system impacts their business, which in turn, impacts the city’s economic vitality.
about our progress There is no new result for 2016 as the survey is delivered every three years. When the 2017 survey is completed, there will be another data point to gauge the overall trend and directly inform this corporate outcome measure. While it is difficult to predict results given the limited number of data points, the target for 2018 appears achievable.
According to an analysis of the 2014 survey results, the most effective immediate actions to increase overall satisfaction with the transportation system for goods and services are to increase investment in pavement renewal, focus the current renewal investment and improve the effectiveness of pavement repairs.
In 2016, federal funding was announced for Yellowhead Trail improvements and a functional planning study was initiated for the Northeast River Crossing. The progress made on these projects will have a positive effect on major routes for goods movement.
2018
TA
RGET
data source: city of edmonton business satisfaction survey on the transportation system.
business satisfaction: goods and services transportation Percentage that are satisfied or very satisfied
0.0%
15.0%
45.0%
60.0%
30.0%
2014
49.7%
2018 TARGET
53.0%
24
Planned initiatives which contribute to the current results are developing the Smart Roads Strategy, and further implementation of the Goods Movement Strategy including:
• Establishing a Goods Movement Task Force
• Implementing prioritized actions from the Goods Movement Strategy
• Design and construction of Yellowhead Trail improvements
Risks to achieving the target: financial (projects are slowed by funding) and project management (construction projects are not delivered on time, on budget, on quality, or within scope).
4.1 business satisfaction: goods and services transportation continued
25
Our Progress on The Way Ahead | 2016 Results city of edmonton
4.0corporate outcome
goods and services move efficiently
12.516.0
corporate measure
4.2 travel time & reliability for goods and services Movement
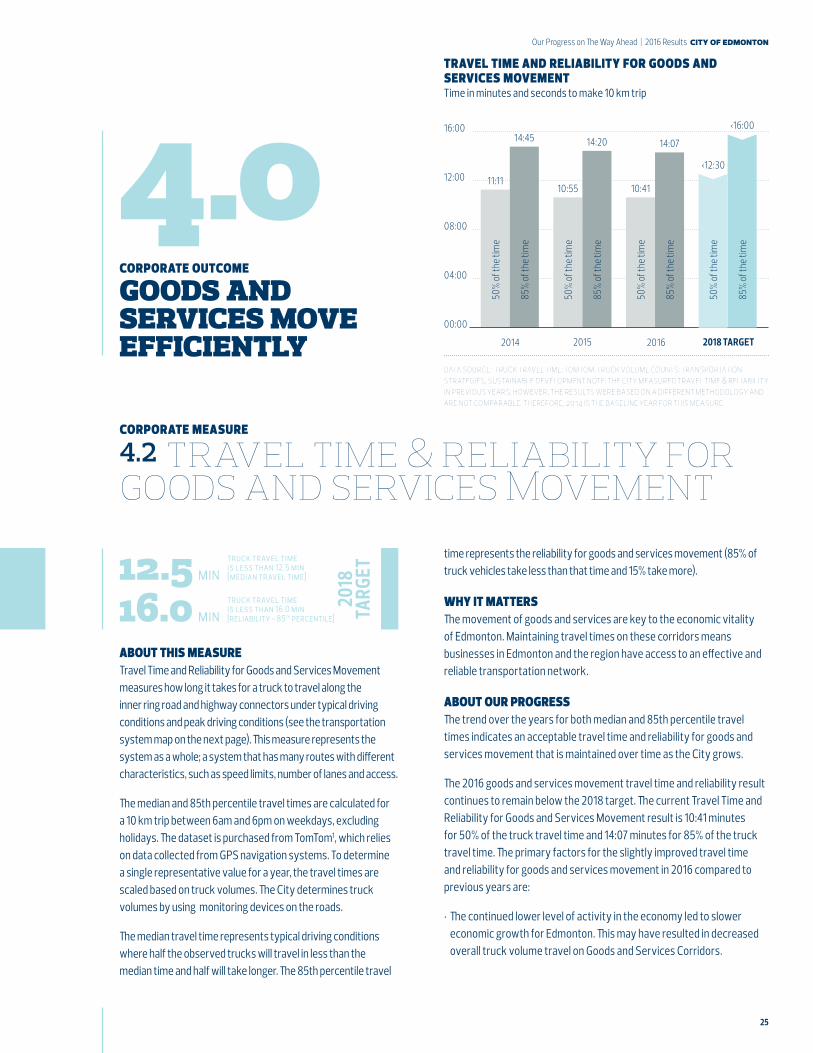
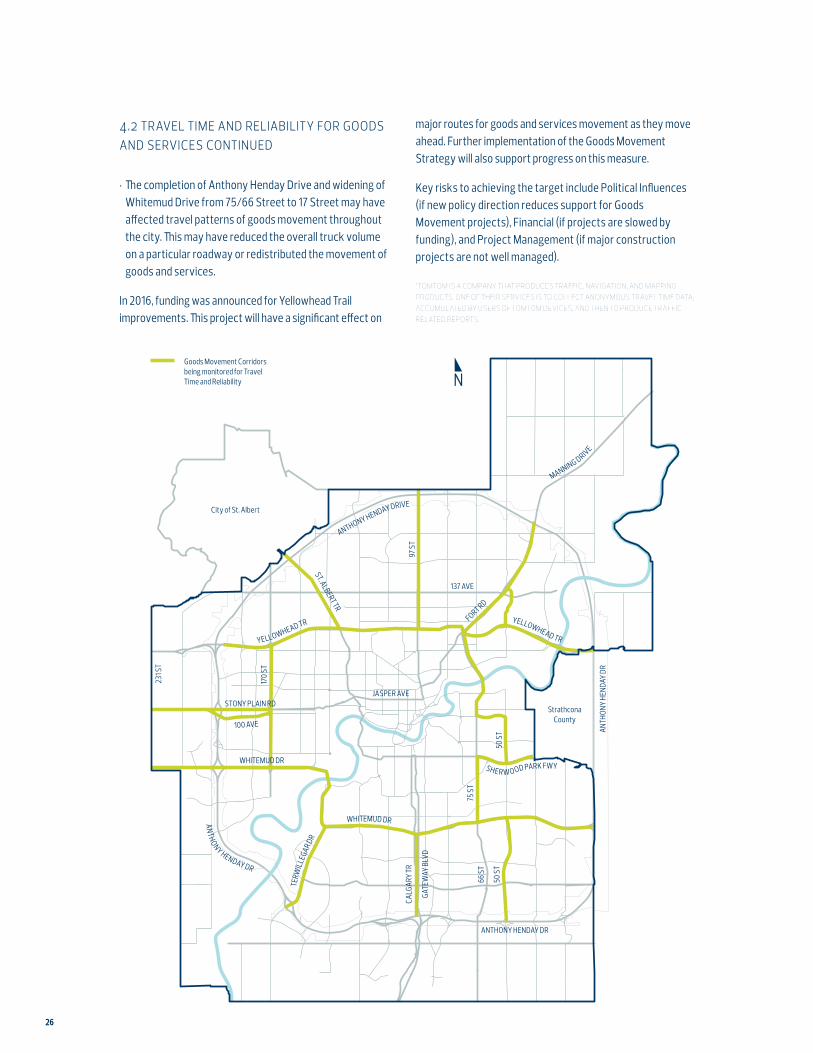
about this measure Travel Time and Reliability for Goods and Services Movement measures how long it takes for a truck to travel along the inner ring road and highway connectors under typical driving conditions and peak driving conditions (see the transportation system map on the next page). This measure represents the system as a whole; a system that has many routes with different characteristics, such as speed limits, number of lanes and access.
The median and 85th percentile travel times are calculated for a 10 km trip between 6am and 6pm on weekdays, excluding holidays. The dataset is purchased from TomTom1, which relies on data collected from GPS navigation systems. To determine a single representative value for a year, the travel times are scaled based on truck volumes. The City determines truck volumes by using monitoring devices on the roads.
The median travel time represents typical driving conditions where half the observed trucks will travel in less than the median time and half will take longer. The 85th percentile travel
time represents the reliability for goods and services movement (85% of truck vehicles take less than that time and 15% take more).
why it matters The movement of goods and services are key to the economic vitality of Edmonton. Maintaining travel times on these corridors means businesses in Edmonton and the region have access to an effective and reliable transportation network.
about our progress The trend over the years for both median and 85th percentile travel times indicates an acceptable travel time and reliability for goods and services movement that is maintained over time as the City grows.
The 2016 goods and services movement travel time and reliability result continues to remain below the 2018 target. The current Travel Time and Reliability for Goods and Services Movement result is 10:41 minutes for 50% of the truck travel time and 14:07 minutes for 85% of the truck travel time. The primary factors for the slightly improved travel time and reliability for goods and services movement in 2016 compared to previous years are:
• The continued lower level of activity in the economy led to slower economic growth for Edmonton. This may have resulted in decreased overall truck volume travel on Goods and Services Corridors.
2018
TA
RGET
truck travel time is less than 12.5 min [median travel time]
truck travel time is less than 16.0 min [reliability - 85th percentile]
2018 TARGET
travel time and reliability for goods and services movement Time in minutes and seconds to make 10 km trip
data source: truck travel time: tomtom. truck volume counts: transportation strategies, sustainable development note: the city measured travel time & reliability in previous years; however, the results were based on a different methodology and are not comparable. therefore, 2014 is the baseline year for this measure.
16:00
00:00
04:00
08:00
12:00 11:1110:55 10:41
<12:30
14:45 14:20 14:07
<16:00
2014 20162015
50%
of th
e tim
e
50%
of th
e tim
e
50%
of th
e tim
e
50%
of th
e tim
e
85%
of th
e tim
e
85%
of th
e tim
e
85%
of th
e tim
e
85%
of th
e tim
e
min
min
26
4.2 travel time and reliability for goods and services continued
• The completion of Anthony Henday Drive and widening of Whitemud Drive from 75/66 Street to 17 Street may have affected travel patterns of goods movement throughout the city. This may have reduced the overall truck volume on a particular roadway or redistributed the movement of goods and services.
In 2016, funding was announced for Yellowhead Trail improvements. This project will have a significant effect on
1 tomtom is a company that produces traffic, navigation, and mapping products. one of their services is to collect anonymous travel time data, accumulated by users of tomtom devices, and then to produce traffic related reports.
major routes for goods and services movement as they move ahead. Further implementation of the Goods Movement Strategy will also support progress on this measure.
Key risks to achieving the target include Political Influences (if new policy direction reduces support for Goods Movement projects), Financial (if projects are slowed by funding), and Project Management (if major construction projects are not well managed).
YELLOWHEAD TR
97 S
T
231 S
T
170 S
T
50 S
T
137 AVE
FORT RD
JASPER AVESTONY PLAIN RD
100 AVE
WHITEMUD DR
GATE
WAY
BLV
D
50 S
T
66 S
T75
ST
CALG
ARY
TR
ANTH
ONY
HEND
AY D
R
ANTHONY HENDAY DR
ST. ALBERT TR
City of St. Albert
StrathconaCounty
Goods Movement Corridorsbeing monitored for TravelTime and Reliability
ANTHONY HENDAY DRIVE
MANNING DRIVE
YELLOWHEAD TR
ANTHONY HENDAY DR
WHITEMUD DR
SHER W OOD PARK FWY
TERW
ILLEG
AR DR
27
Our Progress on The Way Ahead | 2016 Results city of edmonton
5.0corporate outcome
edmontonians are connected to the city in which they live, work and play
55%
corporate measure
5.1 reported volunteer rate
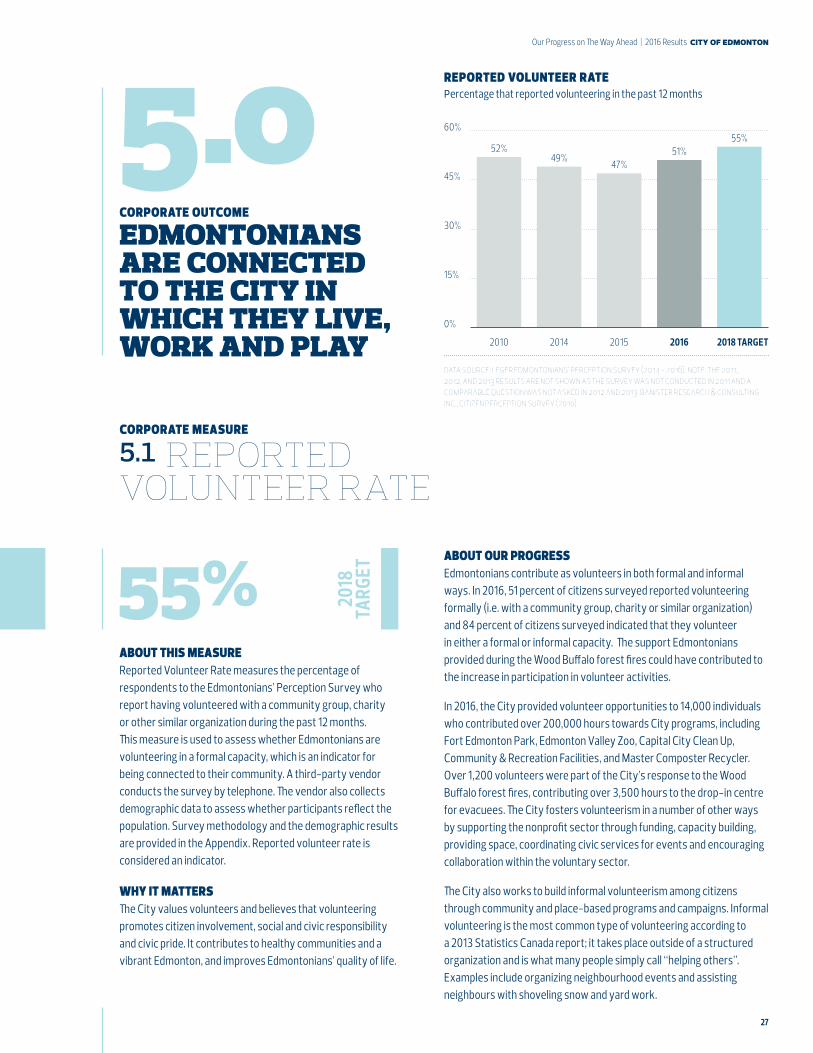
about this measure Reported Volunteer Rate measures the percentage of respondents to the Edmontonians’ Perception Survey who report having volunteered with a community group, charity or other similar organization during the past 12 months. This measure is used to assess whether Edmontonians are volunteering in a formal capacity, which is an indicator for being connected to their community. A third-party vendor conducts the survey by telephone. The vendor also collects demographic data to assess whether participants reflect the population. Survey methodology and the demographic results are provided in the Appendix. Reported volunteer rate is considered an indicator.
why it matters The City values volunteers and believes that volunteering promotes citizen involvement, social and civic responsibility and civic pride. It contributes to healthy communities and a vibrant Edmonton, and improves Edmontonians’ quality of life.
about our progress Edmontonians contribute as volunteers in both formal and informal ways. In 2016, 51 percent of citizens surveyed reported volunteering formally (i.e. with a community group, charity or similar organization) and 84 percent of citizens surveyed indicated that they volunteer in either a formal or informal capacity. The support Edmontonians provided during the Wood Buffalo forest fires could have contributed to the increase in participation in volunteer activities.
In 2016, the City provided volunteer opportunities to 14,000 individuals who contributed over 200,000 hours towards City programs, including Fort Edmonton Park, Edmonton Valley Zoo, Capital City Clean Up, Community & Recreation Facilities, and Master Composter Recycler. Over 1,200 volunteers were part of the City’s response to the Wood Buffalo forest fires, contributing over 3,500 hours to the drop-in centre for evacuees. The City fosters volunteerism in a number of other ways by supporting the nonprofit sector through funding, capacity building, providing space, coordinating civic services for events and encouraging collaboration within the voluntary sector.
The City also works to build informal volunteerism among citizens through community and place-based programs and campaigns. Informal volunteering is the most common type of volunteering according to a 2013 Statistics Canada report; it takes place outside of a structured organization and is what many people simply call “helping others”. Examples include organizing neighbourhood events and assisting neighbours with shoveling snow and yard work.
2018
TA
RGET
60%
45%
30%
15%
0%
52%
2010 2014 2015 2016 2018 TARGET
49%47%
51%55%
reported volunteer rate percentage that reported volunteering in the past 12 months
data source: leger edmontonians’ perception survey (2014 - 2016). note: the 2011, 2012, and 2013 results are not shown as the survey was not conducted in 2011 and a comparable question was not asked in 2012 and 2013. banister research & consulting inc., citizen perception survey (2010)
28
Risk to achieving the target: Public perception: Perception-based questions are influenced by recent events, expectations and life circumstances which could impact results.
5.1 reported volunteer rate continued
29
Our Progress on The Way Ahead | 2016 Results city of edmonton
5.0corporate outcome
edmontonians are connected to the city in which they live, work and play
45%
corporate measure
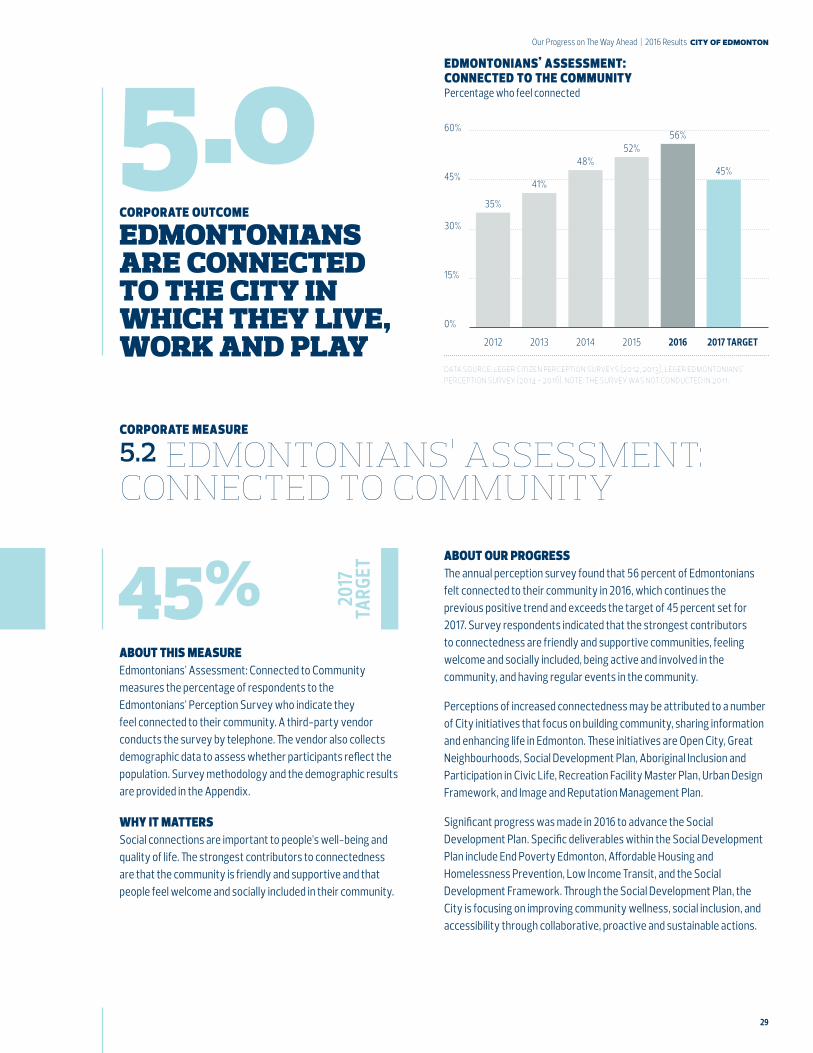
5.2 edmontonians’ assessment: connected to community
about this measure Edmontonians’ Assessment: Connected to Community measures the percentage of respondents to the Edmontonians’ Perception Survey who indicate they feel connected to their community. A third-party vendor conducts the survey by telephone. The vendor also collects demographic data to assess whether participants reflect the population. Survey methodology and the demographic results are provided in the Appendix.
why it matters Social connections are important to people’s well-being and quality of life. The strongest contributors to connectedness are that the community is friendly and supportive and that people feel welcome and socially included in their community.
about our progress The annual perception survey found that 56 percent of Edmontonians felt connected to their community in 2016, which continues the previous positive trend and exceeds the target of 45 percent set for 2017. Survey respondents indicated that the strongest contributors to connectedness are friendly and supportive communities, feeling welcome and socially included, being active and involved in the community, and having regular events in the community.
Perceptions of increased connectedness may be attributed to a number of City initiatives that focus on building community, sharing information and enhancing life in Edmonton. These initiatives are Open City, Great Neighbourhoods, Social Development Plan, Aboriginal Inclusion and Participation in Civic Life, Recreation Facility Master Plan, Urban Design Framework, and Image and Reputation Management Plan.
Significant progress was made in 2016 to advance the Social Development Plan. Specific deliverables within the Social Development Plan include End Poverty Edmonton, Affordable Housing and Homelessness Prevention, Low Income Transit, and the Social Development Framework. Through the Social Development Plan, the City is focusing on improving community wellness, social inclusion, and accessibility through collaborative, proactive and sustainable actions.
2017
TA
RGET
data source: leger citizen perception surveys (2012, 2013), leger edmontonians’ perception survey (2014 - 2016). note: the survey was not conducted in 2011.
60%
0%
15%
30%
45%
35%
41%
48%52%
56%
45%
2012 201520142013 2016 2017 TARGET
edmontonians’ assessment: connected to the community Percentage who feel connected
30
Risks to achieving the target:
• Customers / Citizens: higher demands are placed on existing programs and demands for new programs intensify, resulting in reduced overall service levels
• Public perception: perception-based questions are influenced by recent events, expectations and life circumstances which could impact results
• Financial: current funding streams are unpredictable and availability of future resources that are determined by other orders of government is uncertain
5.2 edmontonians’ assessment: connected to community continued
31
Our Progress on The Way Ahead | 2016 Results city of edmonton
6.0corporate outcome
edmontonians use facilities and services that promote healthy living
90%
corporate measure
6.1 health and wellness
about this measure Health and Wellness measures the percentage of survey respondents who report that their participation in services and programs offered by the City of Edmonton have contributed to their health and wellness.
Survey results were collected from registered users of the facilities, programs and services offered by Edmonton’s Citizen Services as well as a random telephone survey.
why it matters City of Edmonton programs and services are intended to increase Edmontonians’ health and wellness. A healthy city is an active one, and the City’s programs and facilities contribute to the well-being of individuals and communities.
Recreation is important because:
• It has the potential to reduce costs related to challenges such as obesity and sedentary living
• It contributes to good physical and mental health
• It is a fundamental need in all ages and stages in life
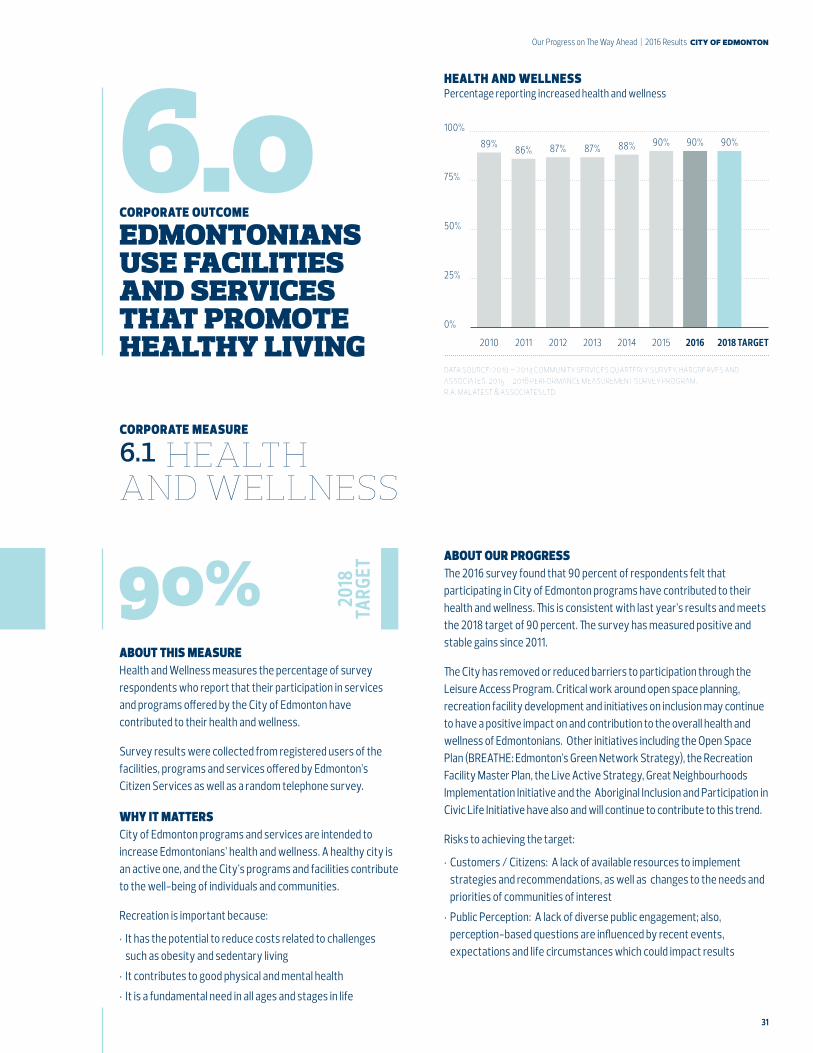
about our progress The 2016 survey found that 90 percent of respondents felt that participating in City of Edmonton programs have contributed to their health and wellness. This is consistent with last year’s results and meets the 2018 target of 90 percent. The survey has measured positive and stable gains since 2011.
The City has removed or reduced barriers to participation through the Leisure Access Program. Critical work around open space planning, recreation facility development and initiatives on inclusion may continue to have a positive impact on and contribution to the overall health and wellness of Edmontonians. Other initiatives including the Open Space Plan (BREATHE: Edmonton’s Green Network Strategy), the Recreation Facility Master Plan, the Live Active Strategy, Great Neighbourhoods Implementation Initiative and the Aboriginal Inclusion and Participation in Civic Life Initiative have also and will continue to contribute to this trend.
Risks to achieving the target:
• Customers / Citizens: A lack of available resources to implement strategies and recommendations, as well as changes to the needs and priorities of communities of interest
• Public Perception: A lack of diverse public engagement; also, perception-based questions are influenced by recent events, expectations and life circumstances which could impact results
2018
TA
RGET
100%
75%
50%
25%
0%
89%
2010 2011 2012 2013 2014 2015 2016 2018 TARGET
86% 87% 87% 88% 90% 90% 90%
health and wellness Percentage reporting increased health and wellness
data source: 2010 – 2014 community services quarterly survey, hargreaves and associates. 2015 – 2016 performance measurement survey program, r.a. malatest & associates ltd.
32
6.0corporate outcome
edmontonians use facilities and services that promote healthy living
12
corporate measure
6.2 recreation facility and library attendance
about this measure Recreation Facility and Library Attendance measures visits per capita at City of Edmonton recreation facilities and libraries. Attendance numbers are collected on a daily basis by each individual recreation facility and library. The results are then combined to produce one annual total. Non-paying visitors who use these facilities as community hubs (e.g., to have coffee or socialize during a sports match) are not included in the attendance count. Survey methodology and the demographic results are provided in the Appendix.
why it matters This measure is important because it shows that people are utilizing facilities for a myriad of purposes. Either through active recreation, like fitness or sports activities, or through passive recreation, like reading and knowledge expansion, citizens are increasing their health and wellness when they participate in the City’s facilities, services and programs. Attendance should increase as a result of programming needs being met.
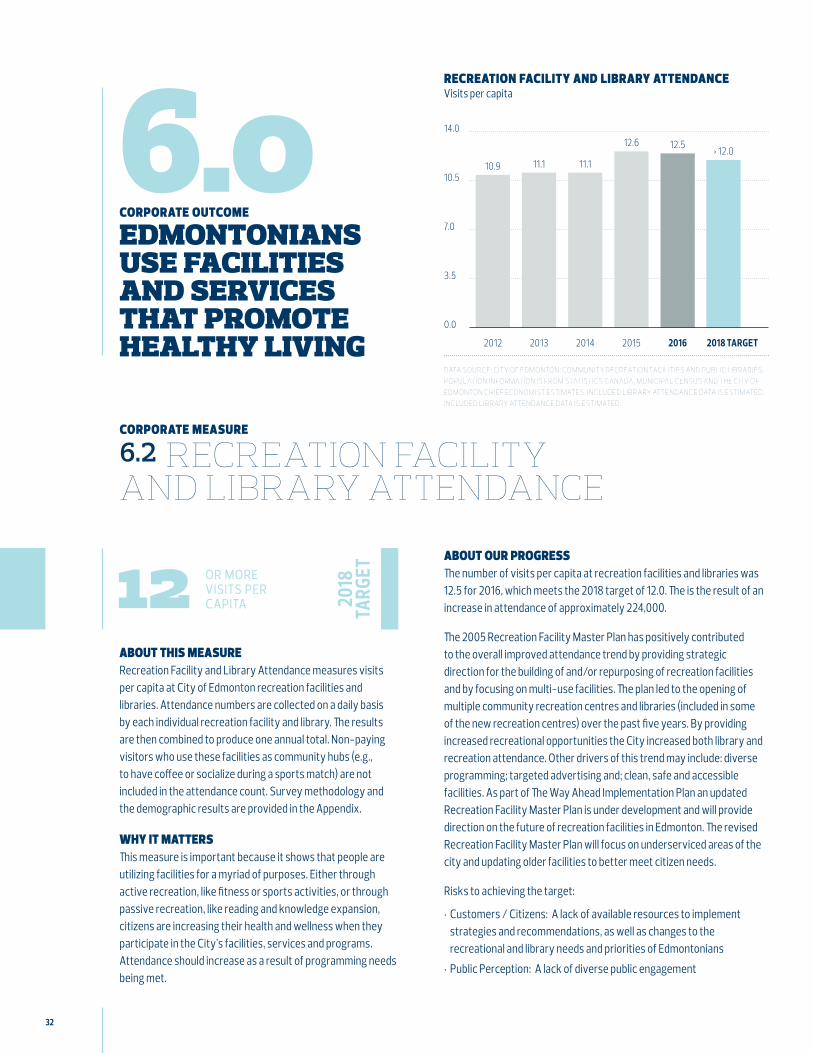
about our progress The number of visits per capita at recreation facilities and libraries was 12.5 for 2016, which meets the 2018 target of 12.0. The is the result of an increase in attendance of approximately 224,000.
The 2005 Recreation Facility Master Plan has positively contributed to the overall improved attendance trend by providing strategic direction for the building of and/or repurposing of recreation facilities and by focusing on multi-use facilities. The plan led to the opening of multiple community recreation centres and libraries (included in some of the new recreation centres) over the past five years. By providing increased recreational opportunities the City increased both library and recreation attendance. Other drivers of this trend may include: diverse programming; targeted advertising and; clean, safe and accessible facilities. As part of The Way Ahead Implementation Plan an updated Recreation Facility Master Plan is under development and will provide direction on the future of recreation facilities in Edmonton. The revised Recreation Facility Master Plan will focus on underserviced areas of the city and updating older facilities to better meet citizen needs.
Risks to achieving the target:
• Customers / Citizens: A lack of available resources to implement strategies and recommendations, as well as changes to the recreational and library needs and priorities of Edmontonians
• Public Perception: A lack of diverse public engagement
2018
TA
RGETor more
visits per capita
data source: city of edmonton: community recreation facilities and public libraries. population information is from statistics canada, municipal census and the city of edmonton chief economist estimates. included library attendance data is estimated. included library attendance data is estimated.
14.0
0.0
3.5
7.0
10.510.9 11.1 11.1
12.6 12.5> 12.0
2012 201520142013 2016 2018 TARGET
recreation facility and library attendance Visits per capita
33
Our Progress on The Way Ahead | 2016 Results city of edmonton
6.0corporate outcome
edmontonians use facilities and services that promote healthy living
83%
corporate measure
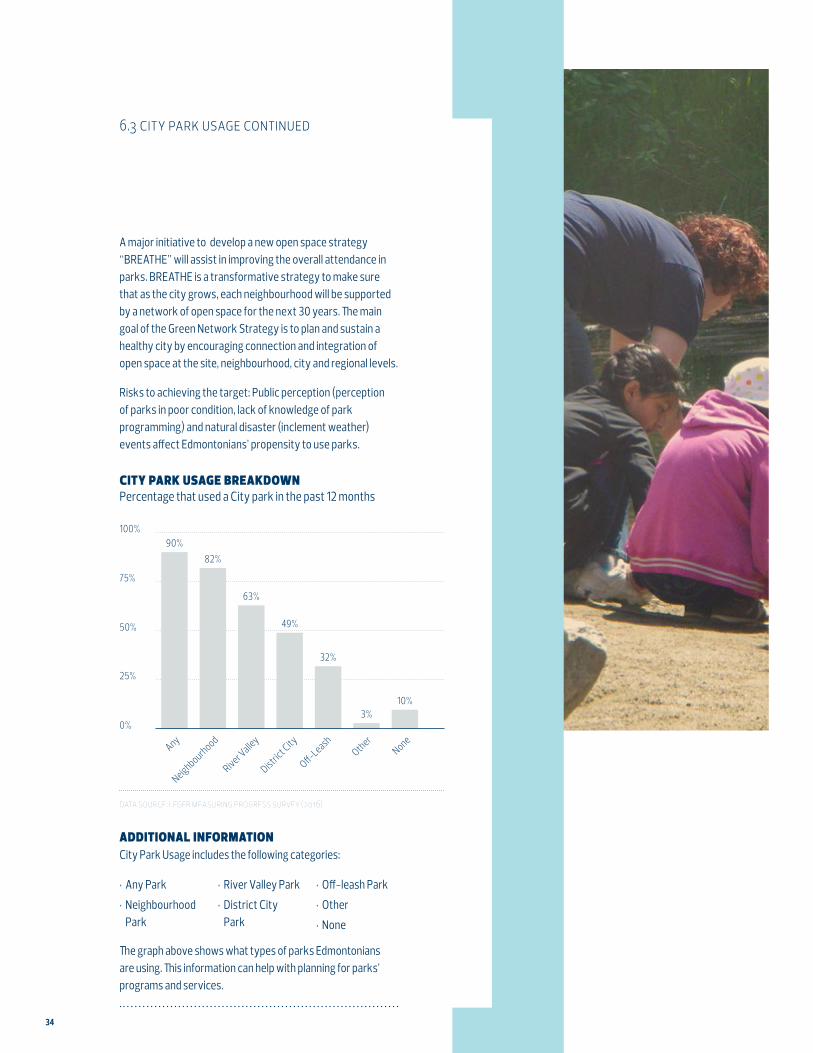
6.3 city park usage
about this measure City Park Usage measures the percentage of respondents to the Edmontonians’ Perception Survey who report they have used a City park in the past 12 months. This measure looks at whether Edmontonians are using facilities, programs and spaces the City of Edmonton has to offer that provide physical, social and mental health benefits. A third-party vendor conducts the survey by telephone. The vendor also collects demographic data to assess whether participants reflect the population. Survey methodology and the demographic results are provided in the Appendix.
why it matters Parks and green spaces are key to improving the overall livability and wellness of communities. They also help address some of the most complicated and expensive physical and mental health challenges arising from poor nutrition and obesity. They can contribute to social sustainability, pedestrian movement, gathering, socializing
and quality of life. In the national framework for recreation (Pathways to Wellbeing, 2015):
• 98 percent of Canadians reported that parks and recreation benefit the community and are an essential service
• 75 percent indicated parks and recreation help children and youth lead a healthy lifestyle
• 93 percent indicated parks and recreation improve health
• 89 percent indicated parks and recreation boost social cohesion
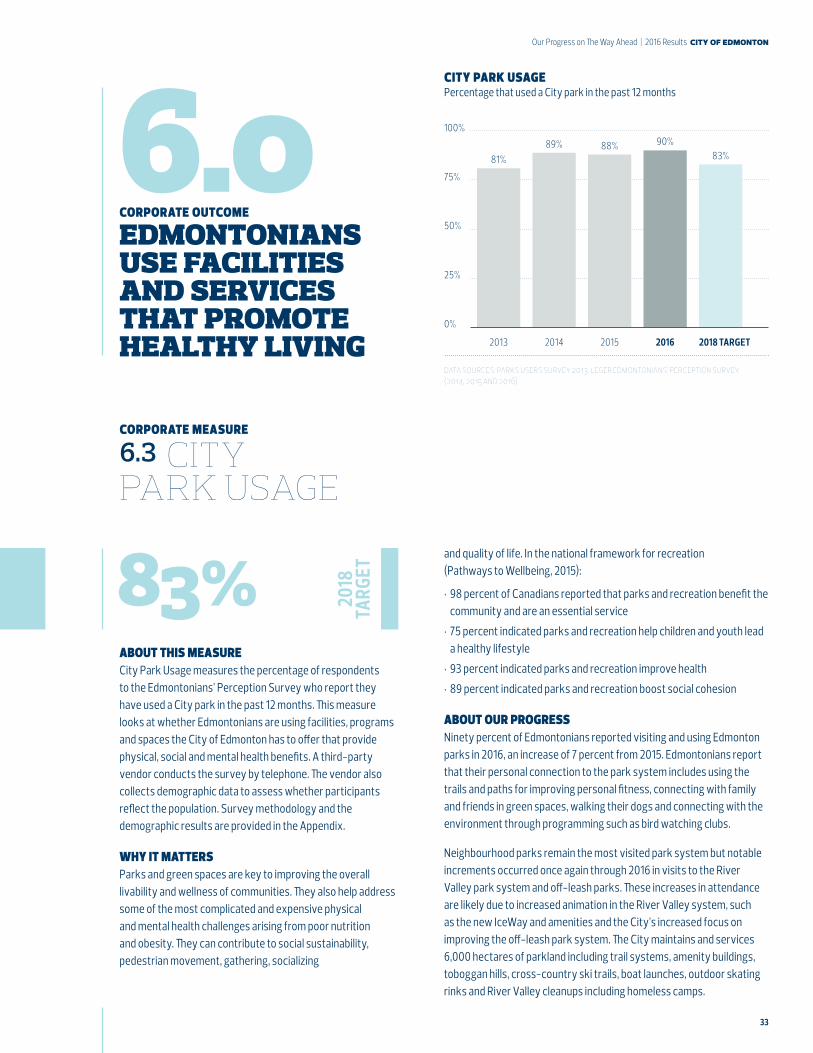
about our progress Ninety percent of Edmontonians reported visiting and using Edmonton parks in 2016, an increase of 7 percent from 2015. Edmontonians report that their personal connection to the park system includes using the trails and paths for improving personal fitness, connecting with family and friends in green spaces, walking their dogs and connecting with the environment through programming such as bird watching clubs.
Neighbourhood parks remain the most visited park system but notable increments occurred once again through 2016 in visits to the River Valley park system and off-leash parks. These increases in attendance are likely due to increased animation in the River Valley system, such as the new IceWay and amenities and the City’s increased focus on improving the off-leash park system. The City maintains and services 6,000 hectares of parkland including trail systems, amenity buildings, toboggan hills, cross-country ski trails, boat launches, outdoor skating rinks and River Valley cleanups including homeless camps.
2018
TA
RGET
data sources: parks users survey 2013. leger edmontonians’ perception survey (2014, 2015 and 2016)
100%
75%
50%
25%
0%
81%
2013 2014 2015 2016 2018 TARGET
89% 88% 90%83%
city park usage Percentage that used a City park in the past 12 months
34
A major initiative to develop a new open space strategy “BREATHE” will assist in improving the overall attendance in parks. BREATHE is a transformative strategy to make sure that as the city grows, each neighbourhood will be supported by a network of open space for the next 30 years. The main goal of the Green Network Strategy is to plan and sustain a healthy city by encouraging connection and integration of open space at the site, neighbourhood, city and regional levels.
Risks to achieving the target: Public perception (perception of parks in poor condition, lack of knowledge of park programming) and natural disaster (inclement weather) events affect Edmontonians’ propensity to use parks.
6.3 city park usage continued
data source: leger measuring progress survey (2016)
100%
75%
50%
25%
0%
Any
Neighbourhood
River Valley
District City
Off-LeashOther
None
city park usage breakdown Percentage that used a City park in the past 12 months
90%82%
63%
49%
32%
3%10%
additional information City Park Usage includes the following categories:
The graph above shows what types of parks Edmontonians are using. This information can help with planning for parks’ programs and services.
• Any Park
• Neighbourhood Park
• River Valley Park
• District City Park
• Off-leash Park
• Other
• None
35
Our Progress on The Way Ahead | 2016 Results city of edmonton
7.0corporate outcome
edmonton is a safe city
the 2018 target is therefore to be less than the average of actual results for 2015, 2016, and 2017.
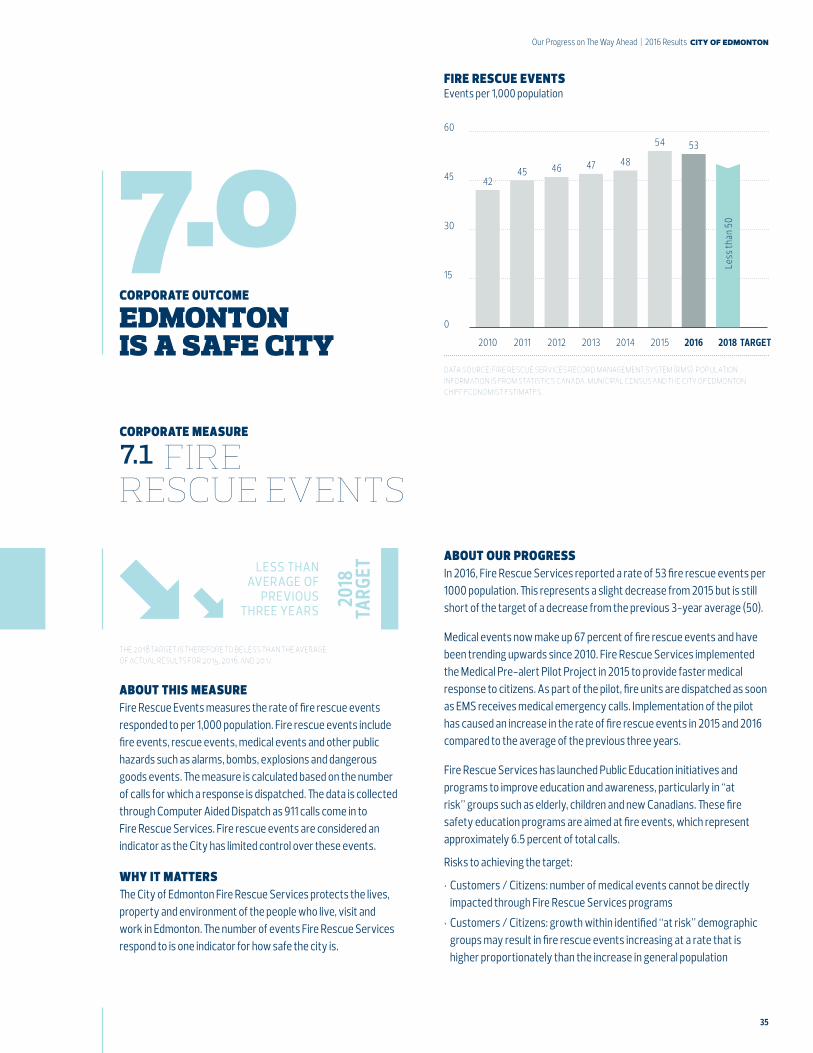
about this measure Fire Rescue Events measures the rate of fire rescue events responded to per 1,000 population. Fire rescue events include fire events, rescue events, medical events and other public hazards such as alarms, bombs, explosions and dangerous goods events. The measure is calculated based on the number of calls for which a response is dispatched. The data is collected through Computer Aided Dispatch as 911 calls come in to Fire Rescue Services. Fire rescue events are considered an indicator as the City has limited control over these events.
why it matters The City of Edmonton Fire Rescue Services protects the lives, property and environment of the people who live, visit and work in Edmonton. The number of events Fire Rescue Services respond to is one indicator for how safe the city is.
corporate measure
7.1 fire rescue events
about our progress In 2016, Fire Rescue Services reported a rate of 53 fire rescue events per 1000 population. This represents a slight decrease from 2015 but is still short of the target of a decrease from the previous 3-year average (50).
Medical events now make up 67 percent of fire rescue events and have been trending upwards since 2010. Fire Rescue Services implemented the Medical Pre-alert Pilot Project in 2015 to provide faster medical response to citizens. As part of the pilot, fire units are dispatched as soon as EMS receives medical emergency calls. Implementation of the pilot has caused an increase in the rate of fire rescue events in 2015 and 2016 compared to the average of the previous three years.
Fire Rescue Services has launched Public Education initiatives and programs to improve education and awareness, particularly in “at risk” groups such as elderly, children and new Canadians. These fire safety education programs are aimed at fire events, which represent approximately 6.5 percent of total calls.
Risks to achieving the target:
• Customers / Citizens: number of medical events cannot be directly impacted through Fire Rescue Services programs
• Customers / Citizens: growth within identified “at risk” demographic groups may result in fire rescue events increasing at a rate that is higher proportionately than the increase in general population
2018
TA
RGETless than
average of previous
three years
60
45
30
15
0
42
2010 2011 2012 2013 2014 2015 2016 2018 TARGET
45 46 47 48
54 53
fire rescue events Events per 1,000 population
data source: fire rescue services record management system (rms). population information is from statistics canada, municipal census and the city of edmonton chief economist estimates.
Less
than
50
36
7.0corporate outcome
edmonton is a safe city
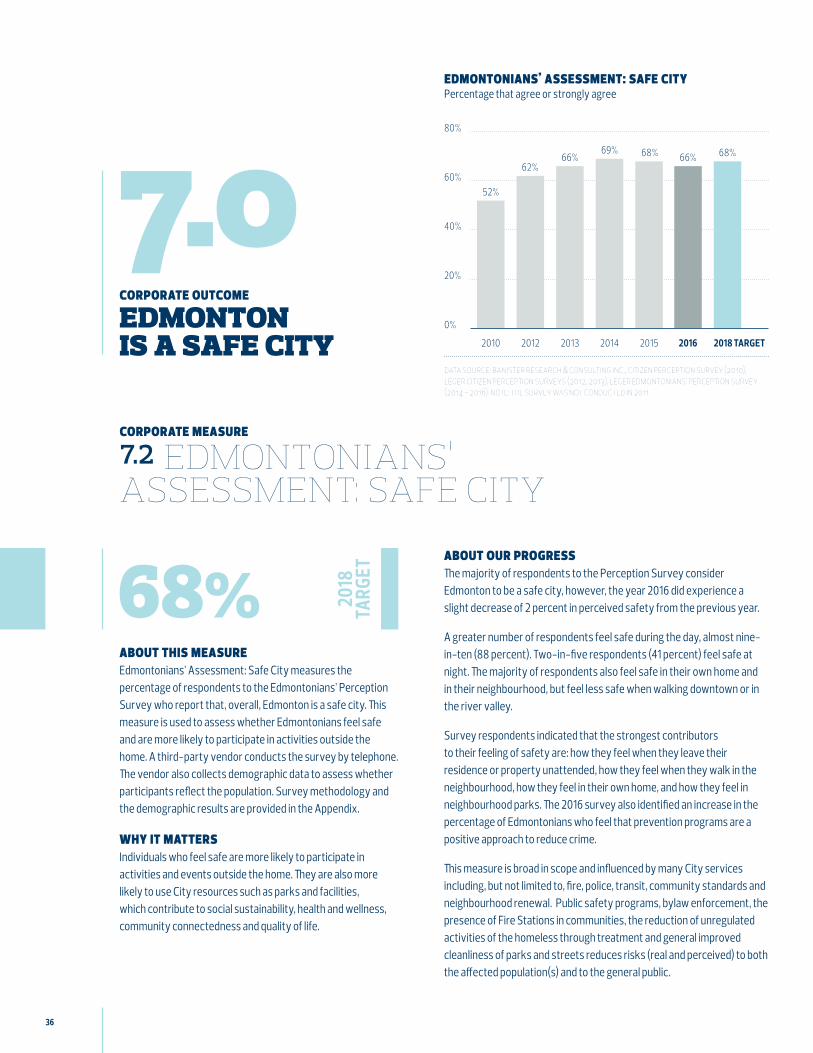
68%about this measure Edmontonians’ Assessment: Safe City measures the percentage of respondents to the Edmontonians’ Perception Survey who report that, overall, Edmonton is a safe city. This measure is used to assess whether Edmontonians feel safe and are more likely to participate in activities outside the home. A third-party vendor conducts the survey by telephone. The vendor also collects demographic data to assess whether participants reflect the population. Survey methodology and the demographic results are provided in the Appendix.
why it matters Individuals who feel safe are more likely to participate in activities and events outside the home. They are also more likely to use City resources such as parks and facilities, which contribute to social sustainability, health and wellness, community connectedness and quality of life.
corporate measure
7.2 edmontonians’ assessment: safe city
about our progress The majority of respondents to the Perception Survey consider Edmonton to be a safe city, however, the year 2016 did experience a slight decrease of 2 percent in perceived safety from the previous year.
A greater number of respondents feel safe during the day, almost nine-in-ten (88 percent). Two-in-five respondents (41 percent) feel safe at night. The majority of respondents also feel safe in their own home and in their neighbourhood, but feel less safe when walking downtown or in the river valley.
Survey respondents indicated that the strongest contributors to their feeling of safety are: how they feel when they leave their residence or property unattended, how they feel when they walk in the neighbourhood, how they feel in their own home, and how they feel in neighbourhood parks. The 2016 survey also identified an increase in the percentage of Edmontonians who feel that prevention programs are a positive approach to reduce crime.
This measure is broad in scope and influenced by many City services including, but not limited to, fire, police, transit, community standards and neighbourhood renewal. Public safety programs, bylaw enforcement, the presence of Fire Stations in communities, the reduction of unregulated activities of the homeless through treatment and general improved cleanliness of parks and streets reduces risks (real and perceived) to both the affected population(s) and to the general public.
2018
TA
RGET
80%
60%
40%
20%
0%
52%
2010 2012 2013 2014 2015 2016 2018 TARGET
62%66%
69% 68% 66% 68%
edmontonians’ assessment: safe city Percentage that agree or strongly agree
data source: banister research & consulting inc., citizen perception survey (2010), leger citizen perception surveys (2012, 2013), leger edmontonians’ perception survey (2014 - 2016) note: the survey was not conducted in 2011.
37
Our Progress on The Way Ahead | 2016 Results city of edmonton
Risks to achieving the target:
• Customers / Citizens: population increases put increased demand on services
• Economic: recession and other economic trends (e.g. poverty) increase the need for social supports
• Public perception: perception-based questions are influenced by recent events, expectations and life circumstances which could impact results
7.2 edmontonian’s assessment: safe city continued
38
7.0corporate outcome
edmonton is a safe city
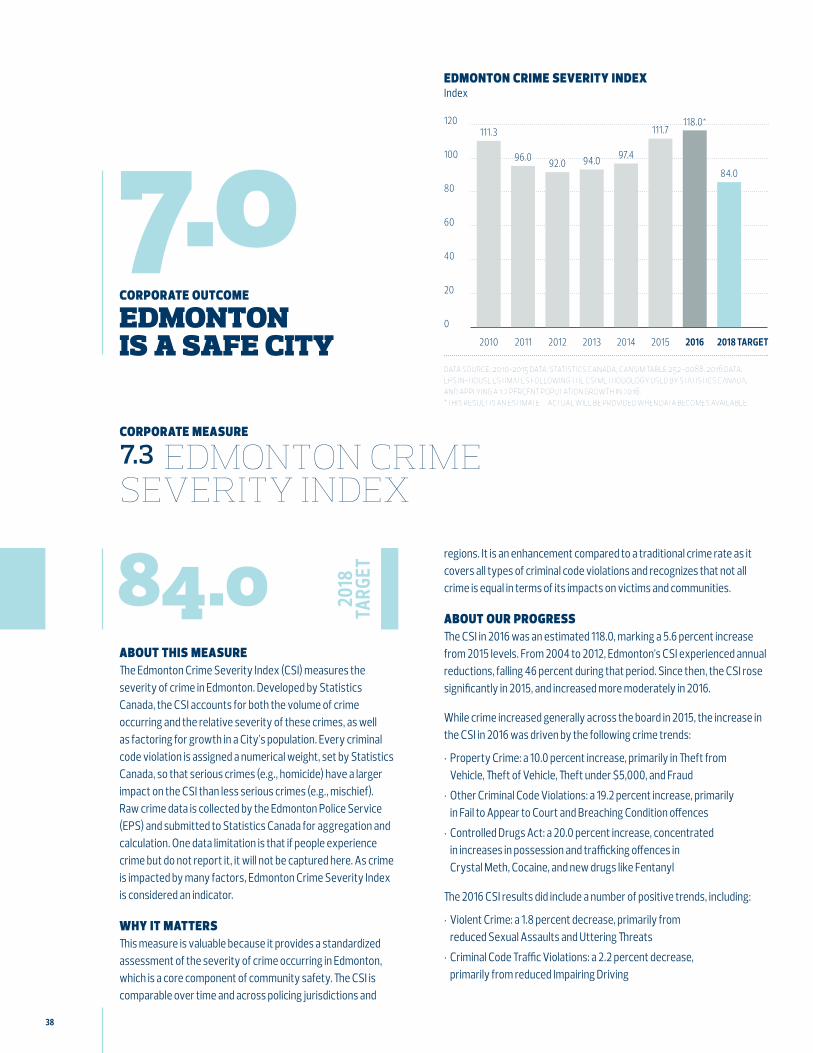
84.0about this measure The Edmonton Crime Severity Index (CSI) measures the severity of crime in Edmonton. Developed by Statistics Canada, the CSI accounts for both the volume of crime occurring and the relative severity of these crimes, as well as factoring for growth in a City’s population. Every criminal code violation is assigned a numerical weight, set by Statistics Canada, so that serious crimes (e.g., homicide) have a larger impact on the CSI than less serious crimes (e.g., mischief). Raw crime data is collected by the Edmonton Police Service (EPS) and submitted to Statistics Canada for aggregation and calculation. One data limitation is that if people experience crime but do not report it, it will not be captured here. As crime is impacted by many factors, Edmonton Crime Severity Index is considered an indicator.
why it matters This measure is valuable because it provides a standardized assessment of the severity of crime occurring in Edmonton, which is a core component of community safety. The CSI is comparable over time and across policing jurisdictions and
corporate measure
7.3 edmonton crime severity index
regions. It is an enhancement compared to a traditional crime rate as it covers all types of criminal code violations and recognizes that not all crime is equal in terms of its impacts on victims and communities.
about our progress The CSI in 2016 was an estimated 118.0, marking a 5.6 percent increase from 2015 levels. From 2004 to 2012, Edmonton’s CSI experienced annual reductions, falling 46 percent during that period. Since then, the CSI rose significantly in 2015, and increased more moderately in 2016.
While crime increased generally across the board in 2015, the increase in the CSI in 2016 was driven by the following crime trends:
• Property Crime: a 10.0 percent increase, primarily in Theft from Vehicle, Theft of Vehicle, Theft under $5,000, and Fraud
• Other Criminal Code Violations: a 19.2 percent increase, primarily in Fail to Appear to Court and Breaching Condition offences
• Controlled Drugs Act: a 20.0 percent increase, concentrated in increases in possession and trafficking offences in Crystal Meth, Cocaine, and new drugs like Fentanyl
The 2016 CSI results did include a number of positive trends, including:
• Violent Crime: a 1.8 percent decrease, primarily from reduced Sexual Assaults and Uttering Threats
• Criminal Code Traffic Violations: a 2.2 percent decrease, primarily from reduced Impairing Driving
2018
TA
RGET
data source: 2010-2015 data: statistics canada, cansim table 252-0088. 2016 data: eps in-house estimates following the csi methodology used by statistics canada, and applying a 1.2 percent population growth in 2016. *this result is an estimate – actual will be provided when data becomes available.
edmonton crime severity index Index
120
100
80
60
40
20
0
111.3
2010 2011 2012 2013 2014 2015 2016 2018 TARGET
96.0 92.0 94.0 97.4
111.7118.0*
84.0
39
Our Progress on The Way Ahead | 2016 Results city of edmonton
The CSI is impacted by a multitude of socio economic factors, government policies, and the overall functioning of the criminal justice system. However, it is the position of the Edmonton Police Service (EPS) that the increase in the CSI in the last two years has been driven by Alberta’s economic recession. This is supported by several observations. First, crime levels in Edmonton began their rise in early 2015, coinciding with the collapse of oil prices and the start of Alberta’s economic recession. Second, rising crime has primarily been property-based, which increased 28.3 percent since 2014, compared to only 7.4 percent in violent crime. Third, rising crime has occurred across Alberta. From 2014-2015, property crime increased 37.2 percent in Calgary, and 17.1 percent for the rest of Alberta (less Calgary and Edmonton).
As one of many organizations responsible for reducing criminality in Edmonton, the EPS will be focused on advancing several strategic initiatives in 2017:
• Advocating for the creation of a Community Wellness Centre, so that vulnerable persons can access social programs efficiently and effectively
• Implementation of a new Warrant Management System, to improve apprehension outcomes for the thousands of individuals with outstanding EPS-issued criminal warrants
• Implementation of an Intelligence-based policing bureau, to better align and synergize the intelligence function
• Reducing gun violence through improved techniques in intelligence-led policing
• Pursuing the creation of a Collision Reporting Centre, in order to redeploy existing policing resources to higher priorities
At the City Administration level, the Social Development Plan initiative is focused on improving community wellness and social outcomes, which has the potential to alleviate crime and disorder long-term. Several of these components include:
• End Poverty Strategy
• Affordable Housing Strategy
• Homelessness Strategy
• Low Income Transit
Despite continuous improvement by EPS and City Administration, as the CSI is currently 34 percent off-target, it should not be expected that the target will be achieved by 2018.
7.3 edmonton crime severity index continued
40
8.0corporate outcome
the city’s operations are environmentally sustainable
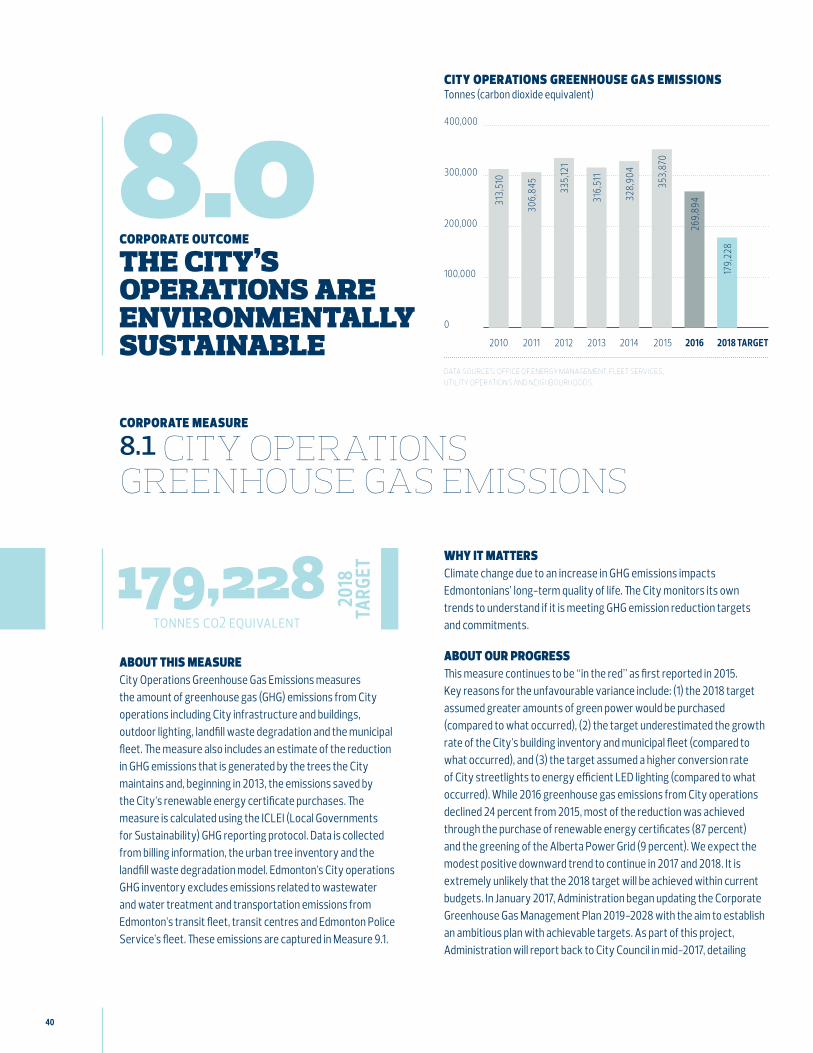
about this measure City Operations Greenhouse Gas Emissions measures the amount of greenhouse gas (GHG) emissions from City operations including City infrastructure and buildings, outdoor lighting, landfill waste degradation and the municipal fleet. The measure also includes an estimate of the reduction in GHG emissions that is generated by the trees the City maintains and, beginning in 2013, the emissions saved by the City’s renewable energy certificate purchases. The measure is calculated using the ICLEI (Local Governments for Sustainability) GHG reporting protocol. Data is collected from billing information, the urban tree inventory and the landfill waste degradation model. Edmonton’s City operations GHG inventory excludes emissions related to wastewater and water treatment and transportation emissions from Edmonton’s transit fleet, transit centres and Edmonton Police Service’s fleet. These emissions are captured in Measure 9.1.
corporate measure
8.1 city operations greenhouse gas emissions
why it matters Climate change due to an increase in GHG emissions impacts Edmontonians’ long-term quality of life. The City monitors its own trends to understand if it is meeting GHG emission reduction targets and commitments.
about our progress This measure continues to be “in the red” as first reported in 2015. Key reasons for the unfavourable variance include: (1) the 2018 target assumed greater amounts of green power would be purchased (compared to what occurred), (2) the target underestimated the growth rate of the City’s building inventory and municipal fleet (compared to what occurred), and (3) the target assumed a higher conversion rate of City streetlights to energy efficient LED lighting (compared to what occurred). While 2016 greenhouse gas emissions from City operations declined 24 percent from 2015, most of the reduction was achieved through the purchase of renewable energy certificates (87 percent) and the greening of the Alberta Power Grid (9 percent). We expect the modest positive downward trend to continue in 2017 and 2018. It is extremely unlikely that the 2018 target will be achieved within current budgets. In January 2017, Administration began updating the Corporate Greenhouse Gas Management Plan 2019-2028 with the aim to establish an ambitious plan with achievable targets. As part of this project, Administration will report back to City Council in mid-2017, detailing
data sources: office of energy management, fleet services, utility operations and neighbourhoods.
city operations greenhouse gas emissions Tonnes (carbon dioxide equivalent)
100,000
200,000
300,000
400,000
0
2010 2011 2012 2013 2014 2015 2016 2018 TARGET
313,
510
306,
845
335,
121
316,
511
328,
904
353,
870
269,
894
179,
228
2018
TA
RGET179,228
tonnes co2 equivalent
41
Our Progress on The Way Ahead | 2016 Results city of edmonton
actions to minimize the 2018 variance, including strategies for both encouraging a local renewable energy certificates market and purchasing green power through the City’s electricity service agreement. The updated 10-year plan, with new targets, will be presented to Council in January 2018.
8.1 city operations greenhouse gas emissions continued
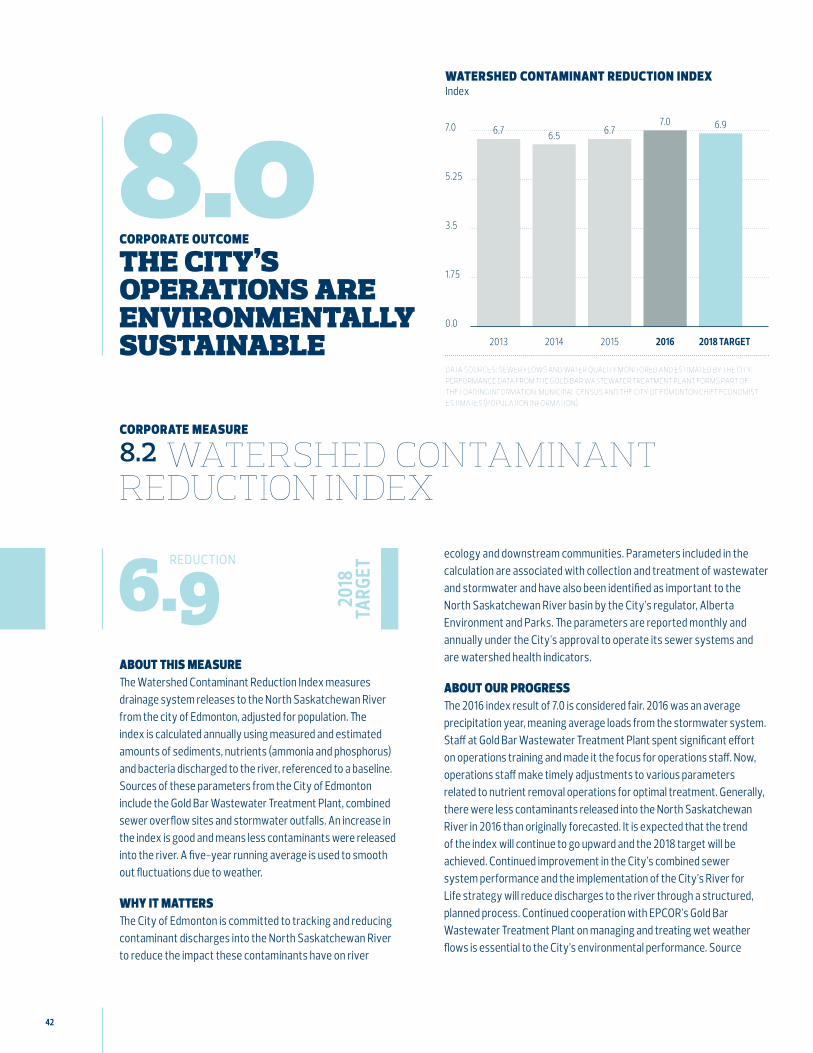
42
8.0corporate outcome
the city’s operations are environmentally sustainable
6.9about this measure The Watershed Contaminant Reduction Index measures drainage system releases to the North Saskatchewan River from the city of Edmonton, adjusted for population. The index is calculated annually using measured and estimated amounts of sediments, nutrients (ammonia and phosphorus) and bacteria discharged to the river, referenced to a baseline. Sources of these parameters from the City of Edmonton include the Gold Bar Wastewater Treatment Plant, combined sewer overflow sites and stormwater outfalls. An increase in the index is good and means less contaminants were released into the river. A five-year running average is used to smooth out fluctuations due to weather.
why it matters The City of Edmonton is committed to tracking and reducing contaminant discharges into the North Saskatchewan River to reduce the impact these contaminants have on river
corporate measure
8.2 watershed contaminant reduction index
ecology and downstream communities. Parameters included in the calculation are associated with collection and treatment of wastewater and stormwater and have also been identified as important to the North Saskatchewan River basin by the City’s regulator, Alberta Environment and Parks. The parameters are reported monthly and annually under the City’s approval to operate its sewer systems and are watershed health indicators.
about our progress The 2016 index result of 7.0 is considered fair. 2016 was an average precipitation year, meaning average loads from the stormwater system. Staff at Gold Bar Wastewater Treatment Plant spent significant effort on operations training and made it the focus for operations staff. Now, operations staff make timely adjustments to various parameters related to nutrient removal operations for optimal treatment. Generally, there were less contaminants released into the North Saskatchewan River in 2016 than originally forecasted. It is expected that the trend of the index will continue to go upward and the 2018 target will be achieved. Continued improvement in the City’s combined sewer system performance and the implementation of the City’s River for Life strategy will reduce discharges to the river through a structured, planned process. Continued cooperation with EPCOR’s Gold Bar Wastewater Treatment Plant on managing and treating wet weather flows is essential to the City’s environmental performance. Source
reduction
data sources: sewer flows and water quality monitored and estimated by the city. performance data from the gold bar wastewater treatment plant forms part of the loading information. municipal census and the city of edmonton chief economist estimates (population information).
7.0
5.25
3.5
1.75
0.0
6.7
2013 2014 2015 2016 2018 TARGET
6.5 6.77.0 6.9
watershed contaminant reduction index Index
2018
TA
RGET
43
Our Progress on The Way Ahead | 2016 Results city of edmonton
control, enforcement of the Drainage Bylaw, development of the Low Impact Development Design Guide, continued updating of the City’s design and construction standards and citizen education play a role in improving the index score. Overall citizen education about the impact that people have on the North Saskatchewan River will also help reduce the City’s impact.
Risks to achieving the target: Natural disasters (Extreme weather producing above average rainfall and correspondingly above average loads discharged to the river).
8.2 watershed contaminant reduction index continued
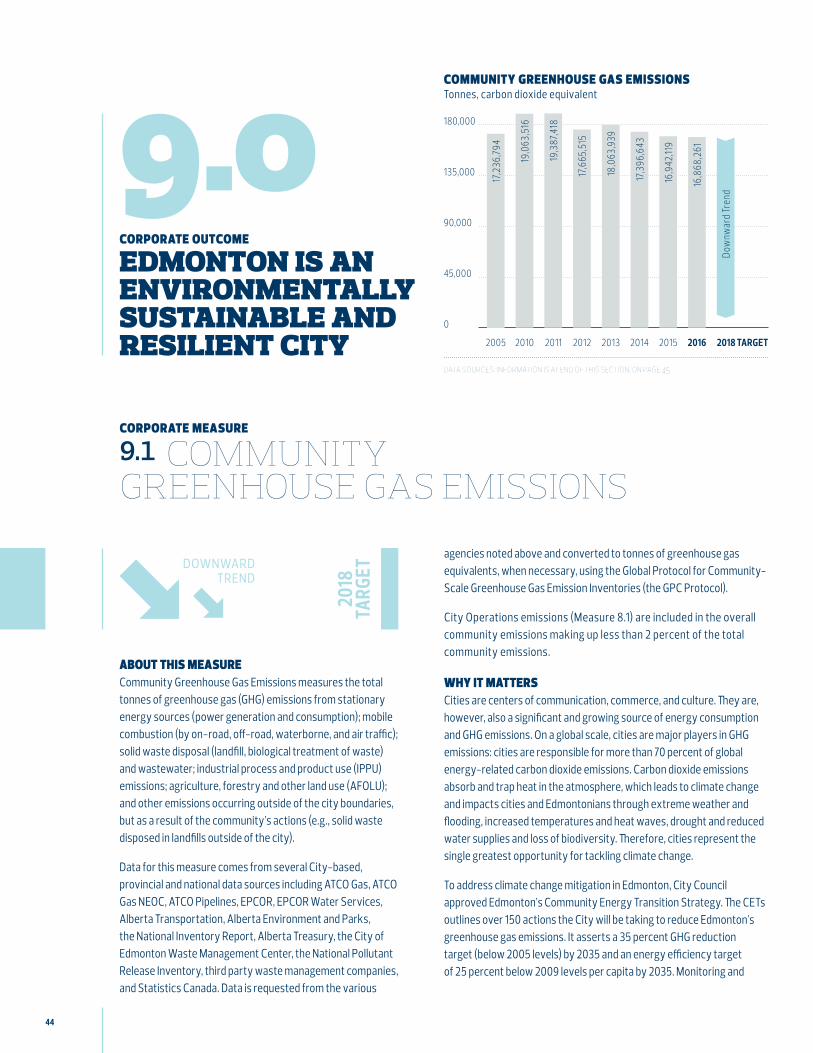
44
9.0corporate outcome
edmonton is an environmentally sustainable and resilient city
downward trend
about this measure Community Greenhouse Gas Emissions measures the total tonnes of greenhouse gas (GHG) emissions from stationary energy sources (power generation and consumption); mobile combustion (by on-road, off-road, waterborne, and air traffic); solid waste disposal (landfill, biological treatment of waste) and wastewater; industrial process and product use (IPPU) emissions; agriculture, forestry and other land use (AFOLU); and other emissions occurring outside of the city boundaries, but as a result of the community’s actions (e.g., solid waste disposed in landfills outside of the city).
Data for this measure comes from several City-based, provincial and national data sources including ATCO Gas, ATCO Gas NEOC, ATCO Pipelines, EPCOR, EPCOR Water Services, Alberta Transportation, Alberta Environment and Parks, the National Inventory Report, Alberta Treasury, the City of Edmonton Waste Management Center, the National Pollutant Release Inventory, third party waste management companies, and Statistics Canada. Data is requested from the various
corporate measure
9.1 community greenhouse gas emissions
agencies noted above and converted to tonnes of greenhouse gas equivalents, when necessary, using the Global Protocol for Community-Scale Greenhouse Gas Emission Inventories (the GPC Protocol).
City Operations emissions (Measure 8.1) are included in the overall community emissions making up less than 2 percent of the total community emissions.
why it matters Cities are centers of communication, commerce, and culture. They are, however, also a significant and growing source of energy consumption and GHG emissions. On a global scale, cities are major players in GHG emissions: cities are responsible for more than 70 percent of global energy-related carbon dioxide emissions. Carbon dioxide emissions absorb and trap heat in the atmosphere, which leads to climate change and impacts cities and Edmontonians through extreme weather and flooding, increased temperatures and heat waves, drought and reduced water supplies and loss of biodiversity. Therefore, cities represent the single greatest opportunity for tackling climate change.
To address climate change mitigation in Edmonton, City Council approved Edmonton’s Community Energy Transition Strategy. The CETs outlines over 150 actions the City will be taking to reduce Edmonton’s greenhouse gas emissions. It asserts a 35 percent GHG reduction target (below 2005 levels) by 2035 and an energy efficiency target of 25 percent below 2009 levels per capita by 2035. Monitoring and
community greenhouse gas emissions Tonnes, carbon dioxide equivalent
180,000
135,000
45,000
90,000
0
2018 TARGET2005
17,2
36,7
94
2010
19,0
63,5
16
2011
19,3
87,4
18
2012
17,6
65,5
15
2013
18,0
63,9
39
2014
17,3
96,6
43
2015
16,9
42,11
9
2016
16,8
68,2
61
Dow
nwar
d Tr
end
2018
TA
RGET
data sources: information is at end of this section, on page 45
45
Our Progress on The Way Ahead | 2016 Results city of edmonton
9.1 community greenhouse gas emissions continued
measuring energy usage and greenhouse gases in the community is required to track progress towards these goals.
Edmonton is participating in various international and national climate change and protection declarations and programs. Specifically, the City of Edmonton has joined the Global Covenant of Mayors, which was launched at the 2014 United Nations Climate Summit. The Global Covenant of Mayors is a global coalition of mayors and city officials committing to reducing local GHG emissions, enhance resilience to climate change, and track their progress publicly. The Global Covenant of Mayors requires greenhouse gas reporting in conformance with the Global Protocol for Community-Scale Greenhouse Gas Emission Inventories.
about our progress GHG emissions in recent years are showing a downward trend and, as such, consistent with meeting the 2018 The Way Ahead target. Total emissions for 2016 have been estimated to be 16,868,261 tCO2e and have decreased 73,859 tCO2e or 0.4 percent from the 2015 reporting year.
Between 2015 and 2016 there was a decline in total GHG emissions which is most likely related to the continued greening of the Alberta electrical grid combined with an unseasonably warm winter. There is a slight increase in GHG emissions from the transportation and waste sectors which is expected as the City’s population increased between reporting years. Fugitive GHG emissions increased slightly as a result of a reported pipeline hit in 2016. Compared to the 2005 baseline reporting year, the community GHG emissions have decreased 368,533 tCO2e or 2.1 percent.
The decline in GHG emissions from the baseline is mostly attributable to the greening (introduction of lower carbon energy sources) of the electrical grid, and increased building and vehicle efficiencies. The carbon intensity of the grid has decreased approximately 30 percent between 2005 to 2016. This has resulted in less CO2 emissions being produced per kilowatt hour of electricity used in Edmonton.
Declines seen in the last few years (2014, 2015, 2016) are also most likely attributable to warmer than average winters which have decreased the space heating requirements of Edmonton buildings.
data sources including atco gas, atco gas neoc, atco pipelines, epcor, epcor water services, alberta transportation, alberta environment and parks, the national inventory report, alberta treasury, the city of edmonton waste management center, the national pollutant release inventory, third party waste management companies, and statistics canada. the use of the gpc protocol marks a departure from past methodologies employed to report on this measure (i.e. the federation of canadian municipalities’ iclei based partners for climate protection protocol). as such the values noted in this reporting year are not comparable to previously reported values. to ensure comparability between years and accurate trending going forward, prior period adjustments have been made back to the 2005 baseline year and reported below. the reason for the positive discrepancies is largely related to additional sources that are accounted for under the gpc protocol (e.g. edmonton’s contribution to airline passenger travel, rail emissions, and better accounting for emissions transboundary to edmonton). also, the 2016 year represents an estimate only as some data was extrapolated from historical trends. this was necessary because not all data sources are available in q1. a revised figure will be published in the fall of 2017.
The City of Edmonton developed a robust policy framework over the last half dozen years to accelerate carbon reductions in the community. In 2015, Edmonton City Council approved Edmonton’s Community Energy Transition Strategy (CETs). The CETs outlines over 150 actions the City will be taking to reduce Edmonton’s greenhouse gas emissions.
Several programs outlined in the CETs are anticipated to launch in 2017 including the Residential Energy Labeling Program, the Large Building Energy Reporting and Disclosure program, and the development of a comprehensive electric vehicle strategy. These new programs combined with a renewed effort to promote and expand existing programs such as the Green Home/Sustainable Living outreach program are expected to assist in reducing emissions in the community over time. Major projects such as Blatchford and the expansion of the LRT system are also a means to assist in mitigating further increases in community GHG emissions. Other projects and programs that will be initiated later in 2017 including a large scale marketing campaign focused on energy efficiency and renewable energy which will further advance Edmonton on the low carbon path.
Risks to achieving the target: political (e.g. the Governments of Alberta or Canada do not implement energy and GHG reduction legislation), economic (e.g. downtrends in the economy can positively or negatively impact GHG reduction measures and activities), customers/citizens (e.g. population increase leads to more development, energy use and GHG emissions), and natural disasters (e.g. climate change causes increased heating and cooling days, increased energy use and GHG emissions).
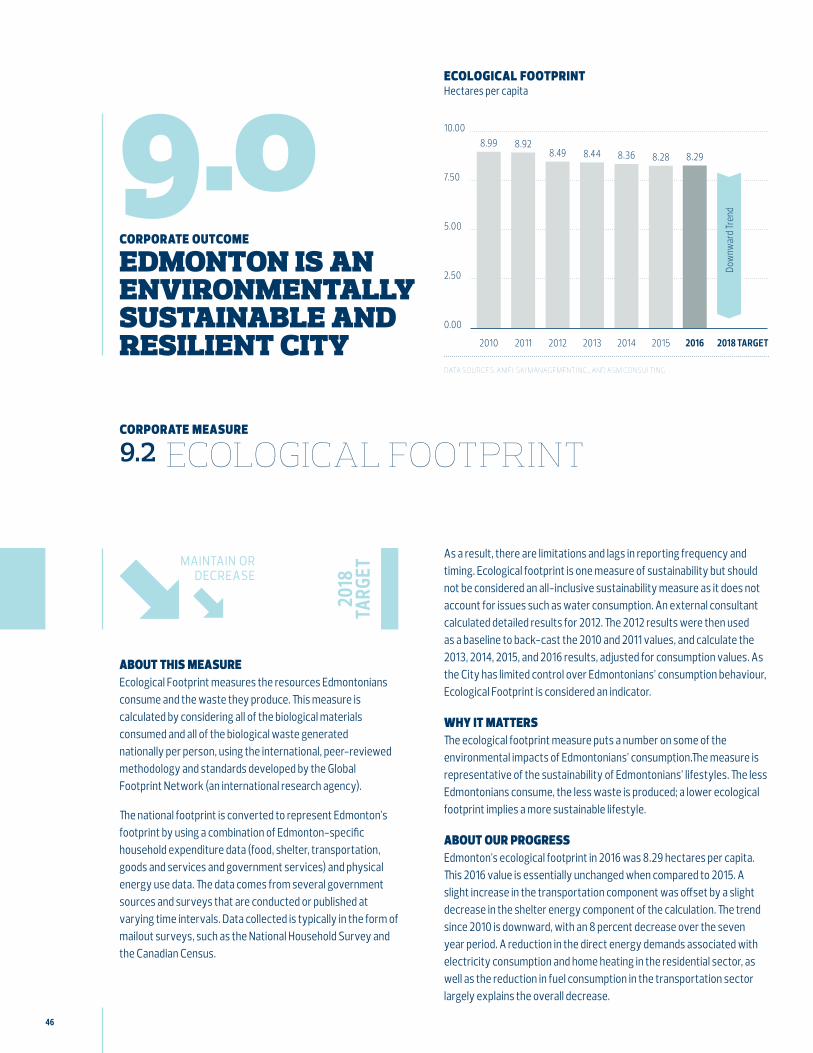
46
9.0corporate outcome
edmonton is an environmentally sustainable and resilient city
maintain or decrease
about this measure Ecological Footprint measures the resources Edmontonians consume and the waste they produce. This measure is calculated by considering all of the biological materials consumed and all of the biological waste generated nationally per person, using the international, peer-reviewed methodology and standards developed by the Global Footprint Network (an international research agency).
The national footprint is converted to represent Edmonton’s footprint by using a combination of Edmonton-specific household expenditure data (food, shelter, transportation, goods and services and government services) and physical energy use data. The data comes from several government sources and surveys that are conducted or published at varying time intervals. Data collected is typically in the form of mailout surveys, such as the National Household Survey and the Canadian Census.
corporate measure
9.2 ecological footprint
As a result, there are limitations and lags in reporting frequency and timing. Ecological footprint is one measure of sustainability but should not be considered an all-inclusive sustainability measure as it does not account for issues such as water consumption. An external consultant calculated detailed results for 2012. The 2012 results were then used as a baseline to back-cast the 2010 and 2011 values, and calculate the 2013, 2014, 2015, and 2016 results, adjusted for consumption values. As the City has limited control over Edmontonians’ consumption behaviour, Ecological Footprint is considered an indicator.
why it matters The ecological footprint measure puts a number on some of the environmental impacts of Edmontonians’ consumption.The measure is representative of the sustainability of Edmontonians’ lifestyles. The less Edmontonians consume, the less waste is produced; a lower ecological footprint implies a more sustainable lifestyle.
about our progress Edmonton’s ecological footprint in 2016 was 8.29 hectares per capita. This 2016 value is essentially unchanged when compared to 2015. A slight increase in the transportation component was offset by a slight decrease in the shelter energy component of the calculation. The trend since 2010 is downward, with an 8 percent decrease over the seven year period. A reduction in the direct energy demands associated with electricity consumption and home heating in the residential sector, as well as the reduction in fuel consumption in the transportation sector largely explains the overall decrease.
2018
TA
RGET
10.00
7.50
5.00
2.50
0.00
8.99 8.92
2010 2011 2012 2013 2014 2015 2016 2018 TARGET
8.49 8.44 8.36 8.28 8.29
ecological footprint Hectares per capita
data sources: anielski management inc., and asm consulting
Dow
nwar
d Tre
nd
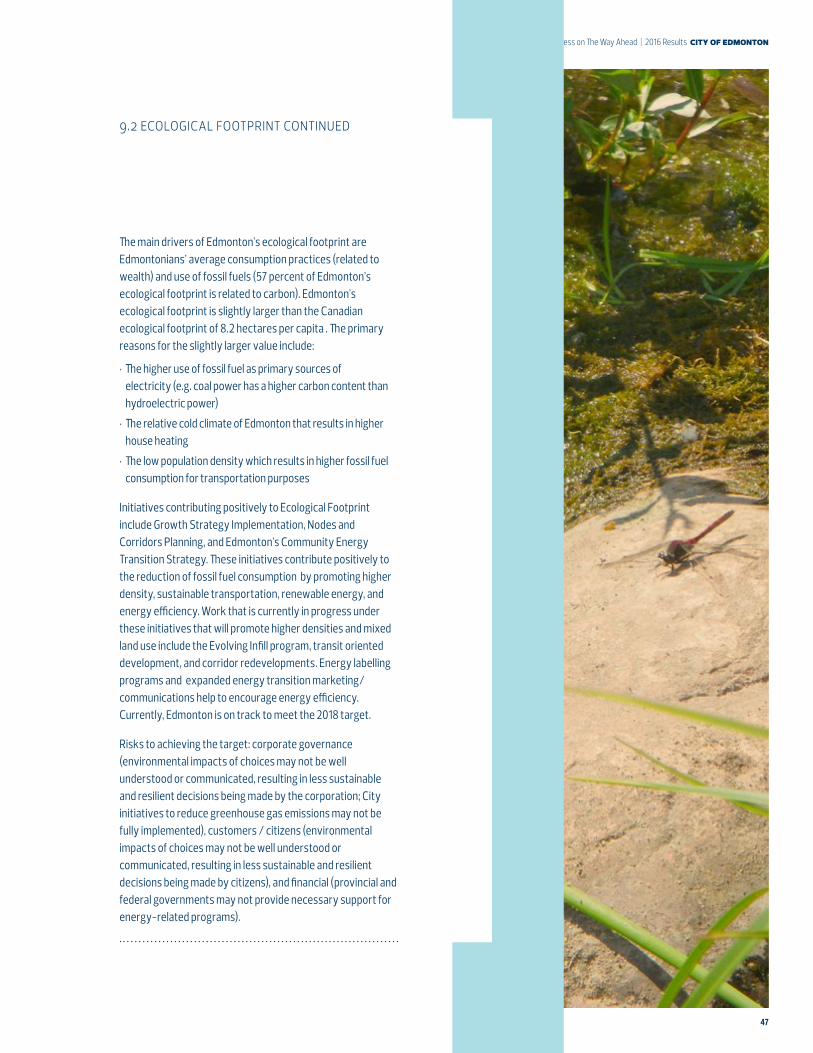
47
Our Progress on The Way Ahead | 2016 Results city of edmonton
The main drivers of Edmonton’s ecological footprint are Edmontonians’ average consumption practices (related to wealth) and use of fossil fuels (57 percent of Edmonton’s ecological footprint is related to carbon). Edmonton’s ecological footprint is slightly larger than the Canadian ecological footprint of 8.2 hectares per capita . The primary reasons for the slightly larger value include:
• The higher use of fossil fuel as primary sources of electricity (e.g. coal power has a higher carbon content than hydroelectric power)
• The relative cold climate of Edmonton that results in higher house heating
• The low population density which results in higher fossil fuel consumption for transportation purposes
Initiatives contributing positively to Ecological Footprint include Growth Strategy Implementation, Nodes and Corridors Planning, and Edmonton’s Community Energy Transition Strategy. These initiatives contribute positively to the reduction of fossil fuel consumption by promoting higher density, sustainable transportation, renewable energy, and energy efficiency. Work that is currently in progress under these initiatives that will promote higher densities and mixed land use include the Evolving Infill program, transit oriented development, and corridor redevelopments. Energy labelling programs and expanded energy transition marketing/communications help to encourage energy efficiency. Currently, Edmonton is on track to meet the 2018 target.
Risks to achieving the target: corporate governance (environmental impacts of choices may not be well understood or communicated, resulting in less sustainable and resilient decisions being made by the corporation; City initiatives to reduce greenhouse gas emissions may not be fully implemented), customers / citizens (environmental impacts of choices may not be well understood or communicated, resulting in less sustainable and resilient decisions being made by citizens), and financial (provincial and federal governments may not provide necessary support for energy-related programs).
9.2 ecological footprint continued
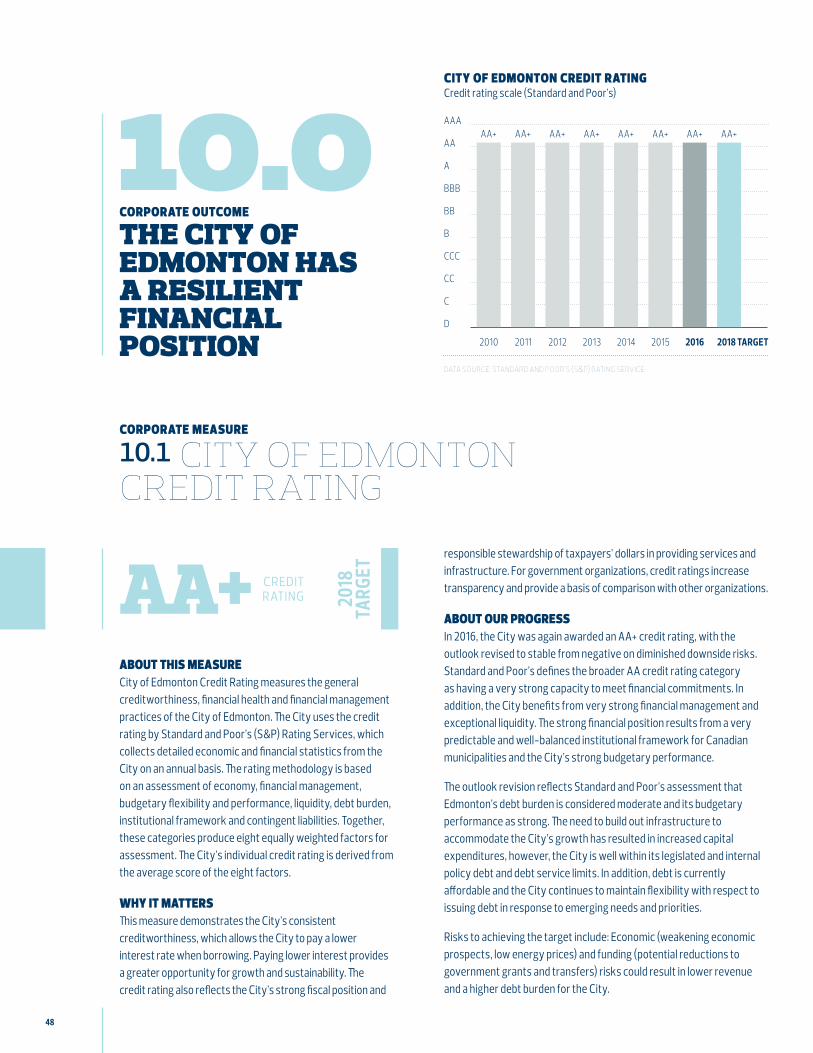
48
10.0
AA+
corporate outcome
the city of edmonton has a resilient financial position
about this measure City of Edmonton Credit Rating measures the general creditworthiness, financial health and financial management practices of the City of Edmonton. The City uses the credit rating by Standard and Poor’s (S&P) Rating Services, which collects detailed economic and financial statistics from the City on an annual basis. The rating methodology is based on an assessment of economy, financial management, budgetary flexibility and performance, liquidity, debt burden, institutional framework and contingent liabilities. Together, these categories produce eight equally weighted factors for assessment. The City’s individual credit rating is derived from the average score of the eight factors.
why it matters This measure demonstrates the City’s consistent creditworthiness, which allows the City to pay a lower interest rate when borrowing. Paying lower interest provides a greater opportunity for growth and sustainability. The credit rating also reflects the City’s strong fiscal position and
corporate measure
10.1 city of edmonton credit rating
responsible stewardship of taxpayers’ dollars in providing services and infrastructure. For government organizations, credit ratings increase transparency and provide a basis of comparison with other organizations.
about our progress In 2016, the City was again awarded an AA+ credit rating, with the outlook revised to stable from negative on diminished downside risks. Standard and Poor’s defines the broader AA credit rating category as having a very strong capacity to meet financial commitments. In addition, the City benefits from very strong financial management and exceptional liquidity. The strong financial position results from a very predictable and well-balanced institutional framework for Canadian municipalities and the City’s strong budgetary performance.
The outlook revision reflects Standard and Poor’s assessment that Edmonton’s debt burden is considered moderate and its budgetary performance as strong. The need to build out infrastructure to accommodate the City’s growth has resulted in increased capital expenditures, however, the City is well within its legislated and internal policy debt and debt service limits. In addition, debt is currently affordable and the City continues to maintain flexibility with respect to issuing debt in response to emerging needs and priorities.
Risks to achieving the target include: Economic (weakening economic prospects, low energy prices) and funding (potential reductions to government grants and transfers) risks could result in lower revenue and a higher debt burden for the City.
2018
TA
RGET
data source: standard and poor’s (s&p) rating service
city of edmonton credit rating Credit rating scale (Standard and Poor’s)
AAA
AA
BBB
A
BB
B
CCC
CC
C
D
AA+ AA+ AA+ AA+ AA+ AA+ AA+ AA+
2010 2011 2012 2013 2014 2015 2016 2018 TARGET
credit rating
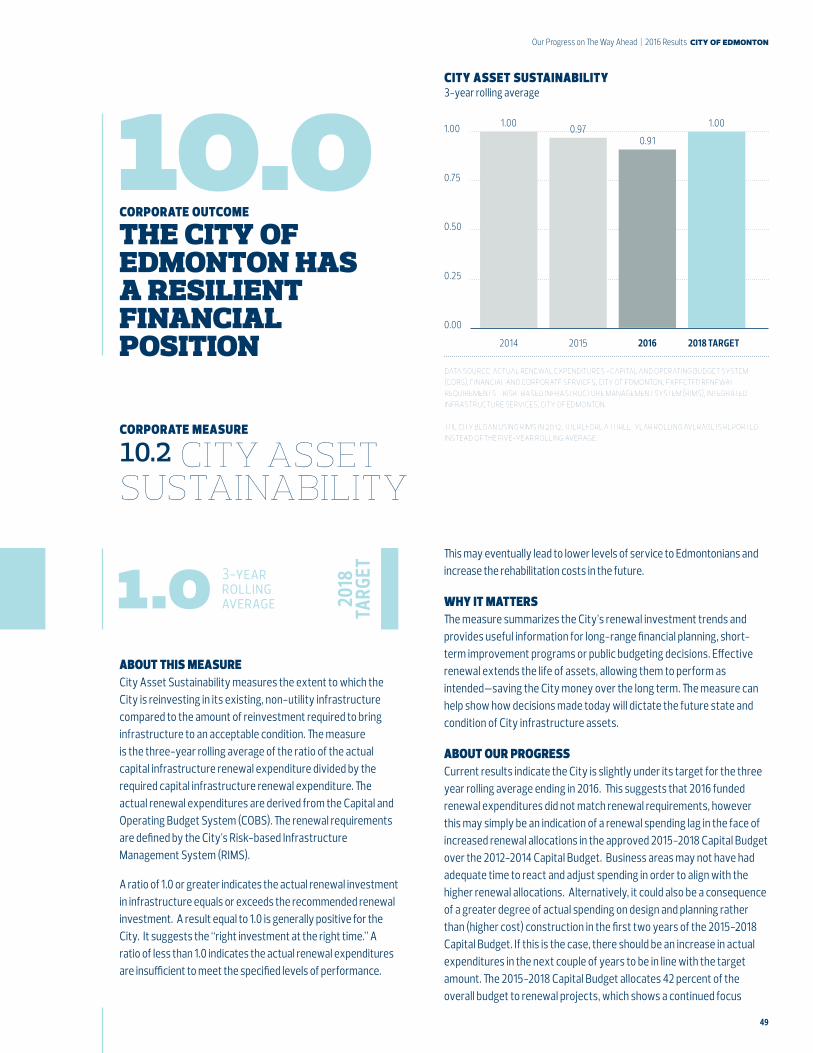
49
Our Progress on The Way Ahead | 2016 Results city of edmonton
10.0corporate outcome
the city of edmonton has a resilient financial position
about this measure City Asset Sustainability measures the extent to which the City is reinvesting in its existing, non-utility infrastructure compared to the amount of reinvestment required to bring infrastructure to an acceptable condition. The measure is the three-year rolling average of the ratio of the actual capital infrastructure renewal expenditure divided by the required capital infrastructure renewal expenditure. The actual renewal expenditures are derived from the Capital and Operating Budget System (COBS). The renewal requirements are defined by the City’s Risk-based Infrastructure Management System (RIMS).
A ratio of 1.0 or greater indicates the actual renewal investment in infrastructure equals or exceeds the recommended renewal investment. A result equal to 1.0 is generally positive for the City. It suggests the “right investment at the right time.” A ratio of less than 1.0 indicates the actual renewal expenditures are insufficient to meet the specified levels of performance.
corporate measure
10.2 city asset sustainability
This may eventually lead to lower levels of service to Edmontonians and increase the rehabilitation costs in the future.
why it matters The measure summarizes the City’s renewal investment trends and provides useful information for long-range financial planning, short-term improvement programs or public budgeting decisions. Effective renewal extends the life of assets, allowing them to perform as intended—saving the City money over the long term. The measure can help show how decisions made today will dictate the future state and condition of City infrastructure assets.
about our progress Current results indicate the City is slightly under its target for the three year rolling average ending in 2016. This suggests that 2016 funded renewal expenditures did not match renewal requirements, however this may simply be an indication of a renewal spending lag in the face of increased renewal allocations in the approved 2015-2018 Capital Budget over the 2012-2014 Capital Budget. Business areas may not have had adequate time to react and adjust spending in order to align with the higher renewal allocations. Alternatively, it could also be a consequence of a greater degree of actual spending on design and planning rather than (higher cost) construction in the first two years of the 2015-2018 Capital Budget. If this is the case, there should be an increase in actual expenditures in the next couple of years to be in line with the target amount. The 2015-2018 Capital Budget allocates 42 percent of the overall budget to renewal projects, which shows a continued focus
2018
TA
RGET3-year
rolling average1.0
data source: actual renewal expenditures -capital and operating budget system (cobs), financial and corporate services, city of edmonton, expected renewal requirements - risk-based infrastructure management system (rims), integrated infrastructure services, city of edmonton.
the city began using rims in 2012, therefore a three-year rolling average is reported instead of the five-year rolling average.
1.00
0.00
0.25
0.50
0.75
1.00
2014 2015 2016 2018 TARGET
0.970.91
1.00
city asset sustainability 3-year rolling average
50
on renewal reinvestment. Levels of funding are expected to continue to meet or exceed the renewal requirements in future years. Initiatives such as the Facility Renewal Strategy could have a positive impact on this measure over time, since this measure is focused on renewal expenditures and aims to rehabilitate/renew existing City buildings.
Risk to achieving the target: corporate governance (City Council decides the level of spending on infrastructure renewal projects, which could impact an ability to meet a target); economic (because of the current economic downturn there is potential for spending to be adjusted in certain areas). Delays to the initiatives mentioned above could also impact this measure.
10.2 city asset sustainability continued
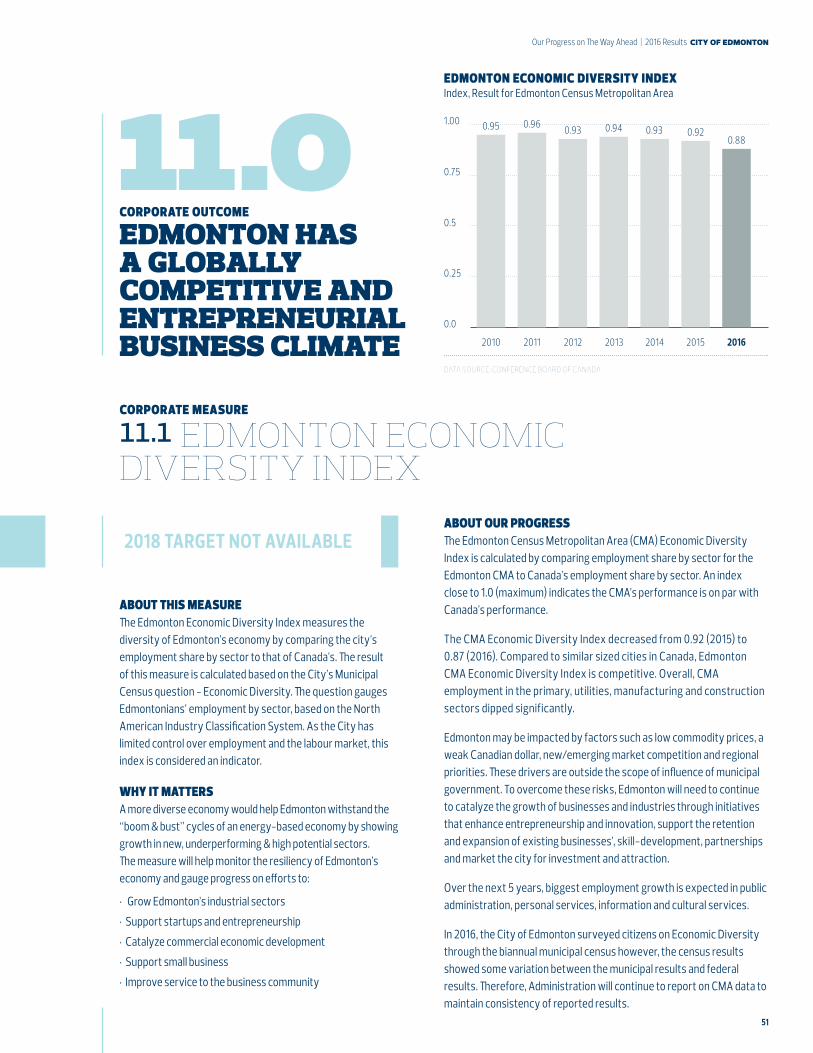
51
Our Progress on The Way Ahead | 2016 Results city of edmonton
11.0corporate outcome
edmonton has a globally competitive and entrepreneurial business climate
about this measure The Edmonton Economic Diversity Index measures the diversity of Edmonton’s economy by comparing the city’s employment share by sector to that of Canada’s. The result of this measure is calculated based on the City’s Municipal Census question - Economic Diversity. The question gauges Edmontonians’ employment by sector, based on the North American Industry Classification System. As the City has limited control over employment and the labour market, this index is considered an indicator.
why it matters A more diverse economy would help Edmonton withstand the “boom & bust” cycles of an energy-based economy by showing growth in new, underperforming & high potential sectors. The measure will help monitor the resiliency of Edmonton’s economy and gauge progress on efforts to:
• Grow Edmonton’s industrial sectors
• Support startups and entrepreneurship
• Catalyze commercial economic development
• Support small business
• Improve service to the business community
corporate measure
11.1 edmonton economic diversity index
about our progress The Edmonton Census Metropolitan Area (CMA) Economic Diversity Index is calculated by comparing employment share by sector for the Edmonton CMA to Canada’s employment share by sector. An index close to 1.0 (maximum) indicates the CMA’s performance is on par with Canada’s performance.
The CMA Economic Diversity Index decreased from 0.92 (2015) to 0.87 (2016). Compared to similar sized cities in Canada, Edmonton CMA Economic Diversity Index is competitive. Overall, CMA employment in the primary, utilities, manufacturing and construction sectors dipped significantly.
Edmonton may be impacted by factors such as low commodity prices, a weak Canadian dollar, new/emerging market competition and regional priorities. These drivers are outside the scope of influence of municipal government. To overcome these risks, Edmonton will need to continue to catalyze the growth of businesses and industries through initiatives that enhance entrepreneurship and innovation, support the retention and expansion of existing businesses’, skill-development, partnerships and market the city for investment and attraction.
Over the next 5 years, biggest employment growth is expected in public administration, personal services, information and cultural services.
In 2016, the City of Edmonton surveyed citizens on Economic Diversity through the biannual municipal census however, the census results showed some variation between the municipal results and federal results. Therefore, Administration will continue to report on CMA data to maintain consistency of reported results.
2018 TARGET NOT AVAILABLE
data source: conference board of canada
edmonton economic diversity index Index, Result for Edmonton Census Metropolitan Area
1.00
0.75
0.5
0.25
0.0
0.95 0.96 0.93 0.94 0.93 0.920.88
2010 2011 2012 2013 2014 2015 2016
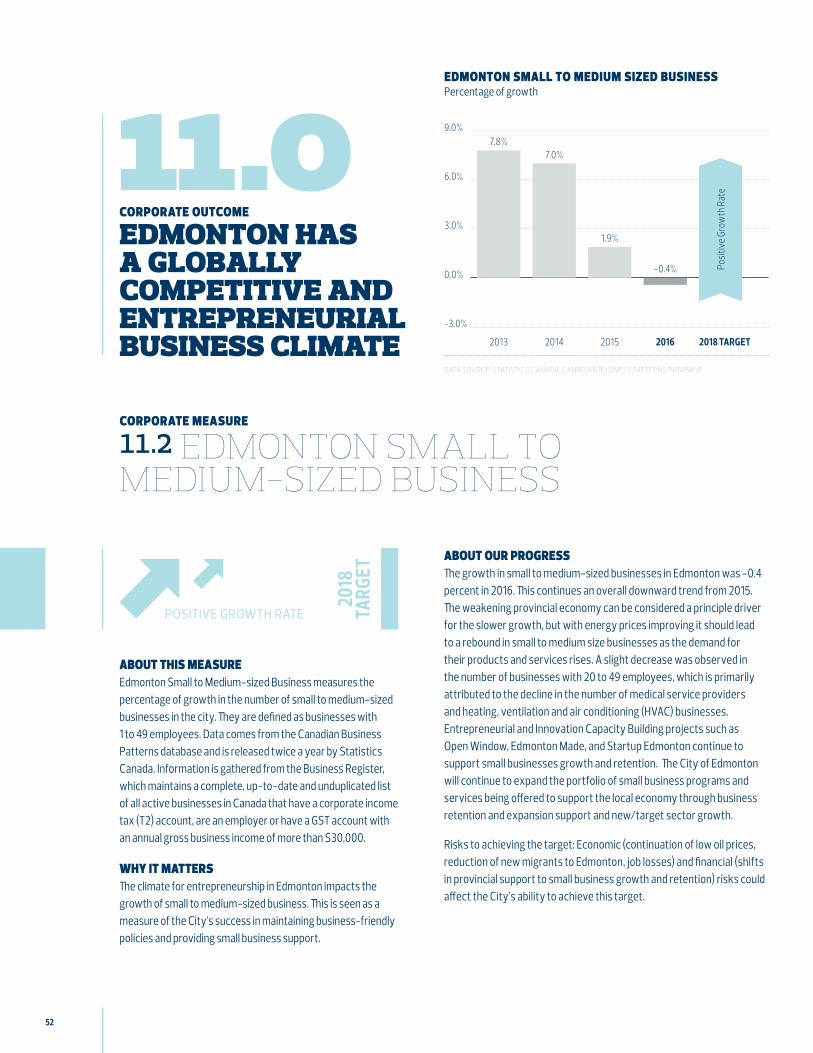
52
11.0corporate outcome
edmonton has a globally competitive and entrepreneurial business climate
about this measure Edmonton Small to Medium-sized Business measures the percentage of growth in the number of small to medium-sized businesses in the city. They are defined as businesses with 1 to 49 employees. Data comes from the Canadian Business Patterns database and is released twice a year by Statistics Canada. Information is gathered from the Business Register, which maintains a complete, up-to-date and unduplicated list of all active businesses in Canada that have a corporate income tax (T2) account, are an employer or have a GST account with an annual gross business income of more than $30,000.
why it matters The climate for entrepreneurship in Edmonton impacts the growth of small to medium-sized business. This is seen as a measure of the City’s success in maintaining business-friendly policies and providing small business support.
corporate measure
11.2 edmonton small to medium-sized business
about our progress The growth in small to medium-sized businesses in Edmonton was -0.4 percent in 2016. This continues an overall downward trend from 2015. The weakening provincial economy can be considered a principle driver for the slower growth, but with energy prices improving it should lead to a rebound in small to medium size businesses as the demand for their products and services rises. A slight decrease was observed in the number of businesses with 20 to 49 employees, which is primarily attributed to the decline in the number of medical service providers and heating, ventilation and air conditioning (HVAC) businesses. Entrepreneurial and Innovation Capacity Building projects such as Open Window, Edmonton Made, and Startup Edmonton continue to support small businesses growth and retention. The City of Edmonton will continue to expand the portfolio of small business programs and services being offered to support the local economy through business retention and expansion support and new/target sector growth.
Risks to achieving the target: Economic (continuation of low oil prices, reduction of new migrants to Edmonton, job losses) and financial (shifts in provincial support to small business growth and retention) risks could affect the City’s ability to achieve this target.
positive growth rate
2018
TA
RGET
data source: statistics canada, canadian business patterns database
9.0%
6.0%
3.0%
0.0%
-3.0%
7.8%
2013 2014 2015 2016 2018 TARGET
7.0%
1.9%
-0.4%
edmonton small to medium sized business Percentage of growth
Posit
ive G
row
th R
ate
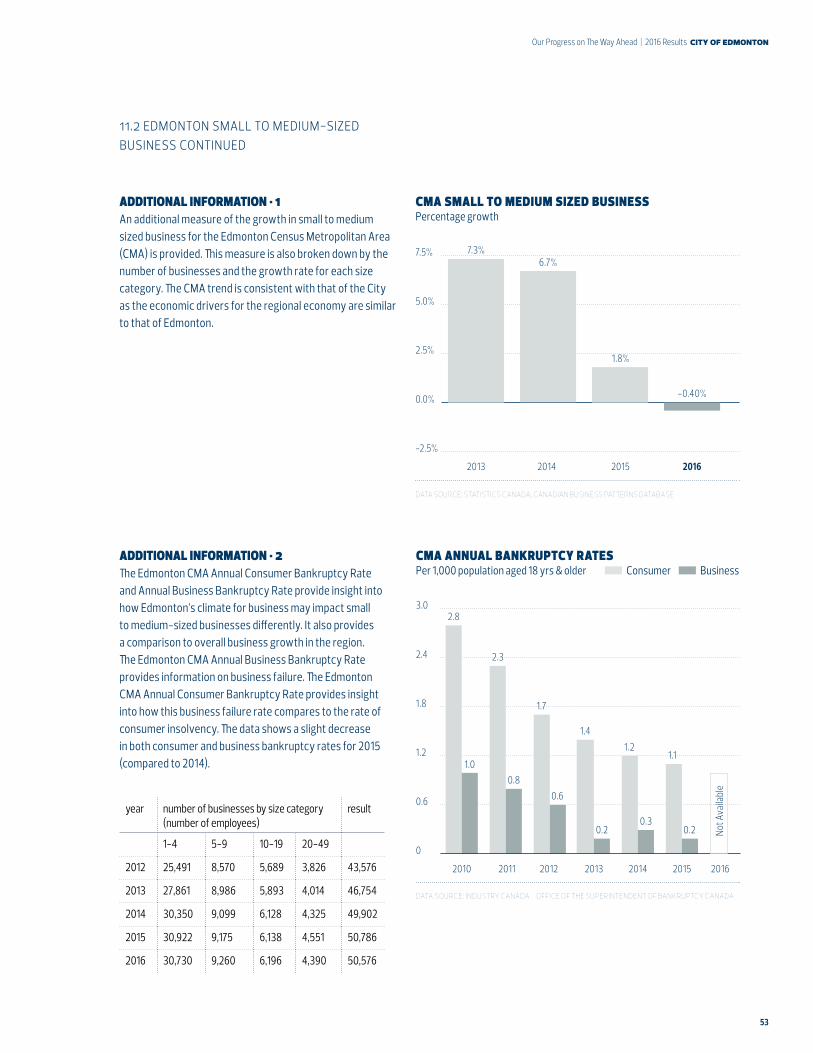
53
Our Progress on The Way Ahead | 2016 Results city of edmonton
data source: statistics canada, canadian business patterns database
7.5%
5.0%
2.5%
0.0%
-2.5%
7.3%
2013 2014 2015 2016
6.7%
1.8%
-0.40%
cma small to medium sized business Percentage growth
year number of businesses by size category (number of employees)
result
1-4 5-9 10-19 20-49
2012 25,491 8,570 5,689 3,826 43,576
2013 27,861 8,986 5,893 4,014 46,754
2014 30,350 9,099 6,128 4,325 49,902
2015 30,922 9,175 6,138 4,551 50,786
2016 30,730 9,260 6,196 4,390 50,576
additional information • 2 The Edmonton CMA Annual Consumer Bankruptcy Rate and Annual Business Bankruptcy Rate provide insight into how Edmonton’s climate for business may impact small to medium-sized businesses differently. It also provides a comparison to overall business growth in the region. The Edmonton CMA Annual Business Bankruptcy Rate provides information on business failure. The Edmonton CMA Annual Consumer Bankruptcy Rate provides insight into how this business failure rate compares to the rate of consumer insolvency. The data shows a slight decrease in both consumer and business bankruptcy rates for 2015 (compared to 2014).
additional information • 1 An additional measure of the growth in small to medium sized business for the Edmonton Census Metropolitan Area (CMA) is provided. This measure is also broken down by the number of businesses and the growth rate for each size category. The CMA trend is consistent with that of the City as the economic drivers for the regional economy are similar to that of Edmonton.
11.2 edmonton small to medium-sized business continued
cma annual bankruptcy rates Per 1,000 population aged 18 yrs & older
data source: industry canada - office of the superintendent of bankruptcy canada
2.4
3.0
0
0.6
1.2
1.8
2.3
2.8
0.81.0
1.7
0.6
1.4
0.2
1.2
0.3
1.1
0.2
20112010 201420132012 2015 2016
Consumer Business
Not A
vaila
ble
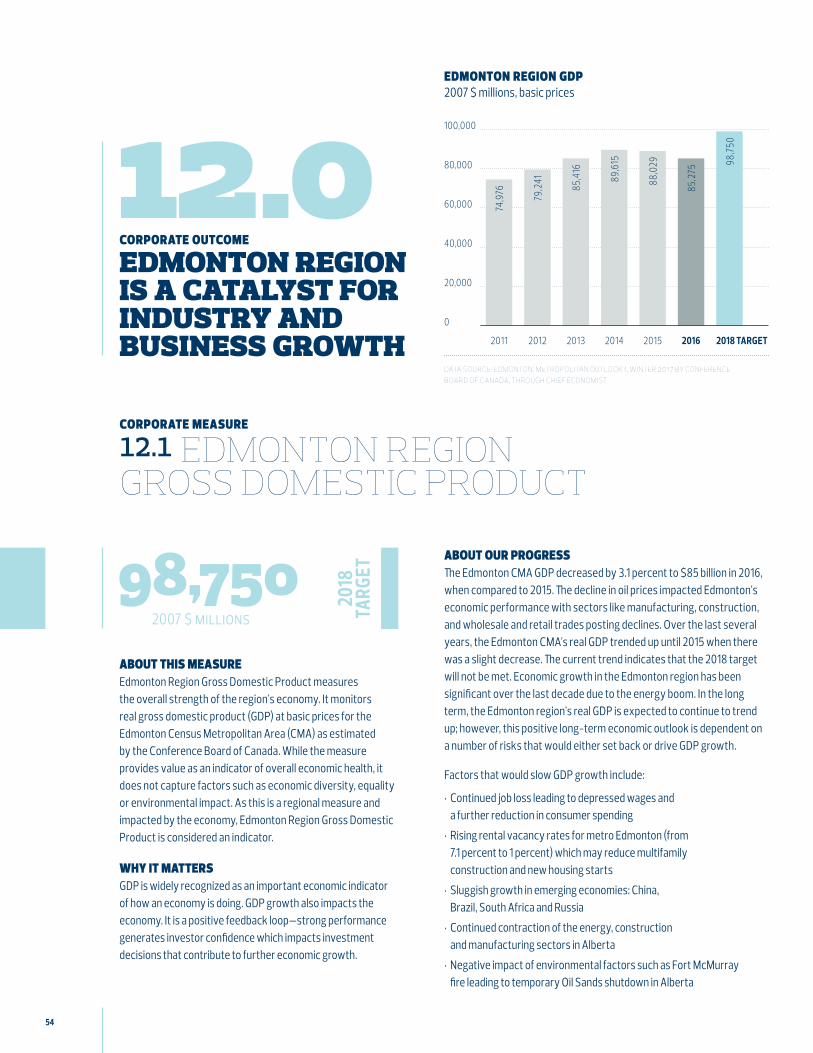
54
12.0corporate outcome
edmonton region is a catalyst for industry and business growth
about this measure Edmonton Region Gross Domestic Product measures the overall strength of the region’s economy. It monitors real gross domestic product (GDP) at basic prices for the Edmonton Census Metropolitan Area (CMA) as estimated by the Conference Board of Canada. While the measure provides value as an indicator of overall economic health, it does not capture factors such as economic diversity, equality or environmental impact. As this is a regional measure and impacted by the economy, Edmonton Region Gross Domestic Product is considered an indicator.
why it matters GDP is widely recognized as an important economic indicator of how an economy is doing. GDP growth also impacts the economy. It is a positive feedback loop—strong performance generates investor confidence which impacts investment decisions that contribute to further economic growth.
corporate measure
12.1 edmonton region gross domestic product
about our progress The Edmonton CMA GDP decreased by 3.1 percent to $85 billion in 2016, when compared to 2015. The decline in oil prices impacted Edmonton’s economic performance with sectors like manufacturing, construction, and wholesale and retail trades posting declines. Over the last several years, the Edmonton CMA’s real GDP trended up until 2015 when there was a slight decrease. The current trend indicates that the 2018 target will not be met. Economic growth in the Edmonton region has been significant over the last decade due to the energy boom. In the long term, the Edmonton region’s real GDP is expected to continue to trend up; however, this positive long-term economic outlook is dependent on a number of risks that would either set back or drive GDP growth.
Factors that would slow GDP growth include:
• Continued job loss leading to depressed wages and a further reduction in consumer spending
• Rising rental vacancy rates for metro Edmonton (from 7.1 percent to 1 percent) which may reduce multifamily construction and new housing starts
• Sluggish growth in emerging economies: China, Brazil, South Africa and Russia
• Continued contraction of the energy, construction and manufacturing sectors in Alberta
• Negative impact of environmental factors such as Fort McMurray fire leading to temporary Oil Sands shutdown in Alberta
98,7502007 $ millions
2018
TA
RGET
data source: edmonton: metropolitan outlook 1, winter 2017 by conference board of canada, through chief economist
100,000
60,000
80,000
40,000
20,000
0
2011 2012 2013 2014 2015 2016 2018 TARGET
edmonton region gdp 2007 $ millions, basic prices
74,9
76 79,2
41
85,4
16
89,6
15
88,0
29
85,2
75
98,7
50
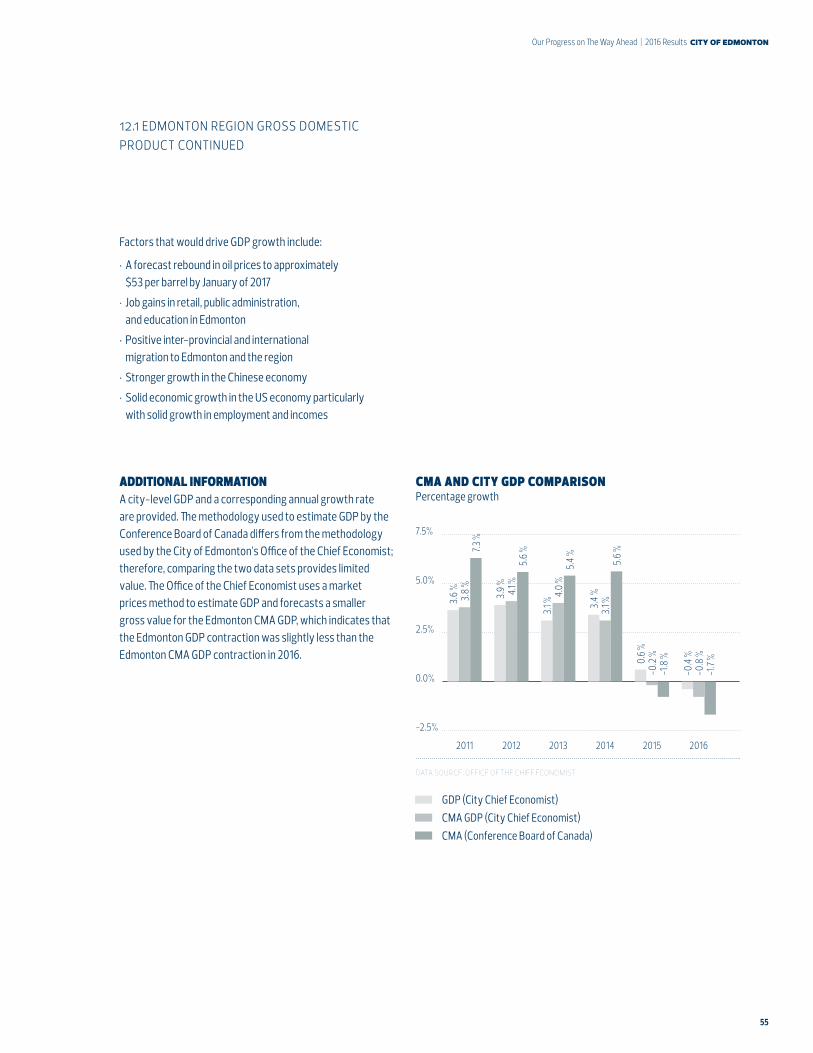
55
Our Progress on The Way Ahead | 2016 Results city of edmonton
additional information A city-level GDP and a corresponding annual growth rate are provided. The methodology used to estimate GDP by the Conference Board of Canada differs from the methodology used by the City of Edmonton’s Office of the Chief Economist; therefore, comparing the two data sets provides limited value. The Office of the Chief Economist uses a market prices method to estimate GDP and forecasts a smaller gross value for the Edmonton CMA GDP, which indicates that the Edmonton GDP contraction was slightly less than the Edmonton CMA GDP contraction in 2016.
Factors that would drive GDP growth include:
• A forecast rebound in oil prices to approximately $53 per barrel by January of 2017
• Job gains in retail, public administration, and education in Edmonton
• Positive inter-provincial and international migration to Edmonton and the region
• Stronger growth in the Chinese economy
• Solid economic growth in the US economy particularly with solid growth in employment and incomes
cma and city gdp comparison Percentage growth
data source: office of the chief economist
7.5%
-2.5%
0.0%
2.5%
5.0%
3.6 % 3.
9 %
3.1 % 3.
4 %
0.6 %
-0.4
%
-0.2
%
-0.8
%
-1.8
%
-1.7
%
3.8
%
4.1 %
4.0
%
3.1 %
7.3 %
5.6 %
5.4
%
5.6 %
2011 201420132012 2015 2016
GDP (City Chief Economist)CMA GDP (City Chief Economist)CMA (Conference Board of Canada)
12.1 edmonton region gross domestic product continued
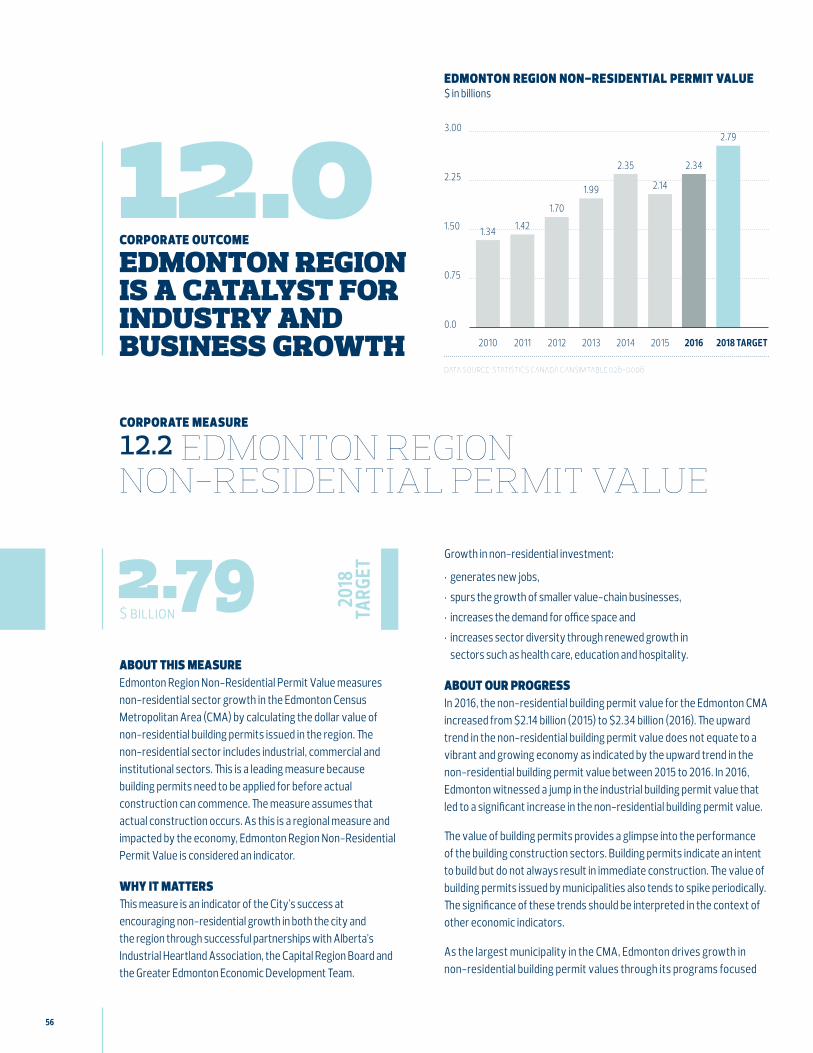
56
12.0corporate outcome
edmonton region is a catalyst for industry and business growth
about this measure Edmonton Region Non-Residential Permit Value measures non-residential sector growth in the Edmonton Census Metropolitan Area (CMA) by calculating the dollar value of non-residential building permits issued in the region. The non-residential sector includes industrial, commercial and institutional sectors. This is a leading measure because building permits need to be applied for before actual construction can commence. The measure assumes that actual construction occurs. As this is a regional measure and impacted by the economy, Edmonton Region Non-Residential Permit Value is considered an indicator.
why it matters This measure is an indicator of the City’s success at encouraging non-residential growth in both the city and the region through successful partnerships with Alberta’s Industrial Heartland Association, the Capital Region Board and the Greater Edmonton Economic Development Team.
corporate measure
12.2 edmonton region non-residential permit value
Growth in non-residential investment:
• generates new jobs,
• spurs the growth of smaller value-chain businesses,
• increases the demand for office space and
• increases sector diversity through renewed growth in sectors such as health care, education and hospitality.
about our progress In 2016, the non-residential building permit value for the Edmonton CMA increased from $2.14 billion (2015) to $2.34 billion (2016). The upward trend in the non-residential building permit value does not equate to a vibrant and growing economy as indicated by the upward trend in the non-residential building permit value between 2015 to 2016. In 2016, Edmonton witnessed a jump in the industrial building permit value that led to a significant increase in the non-residential building permit value.
The value of building permits provides a glimpse into the performance of the building construction sectors. Building permits indicate an intent to build but do not always result in immediate construction. The value of building permits issued by municipalities also tends to spike periodically. The significance of these trends should be interpreted in the context of other economic indicators.
As the largest municipality in the CMA, Edmonton drives growth in non-residential building permit values through its programs focused
$ billion
2018
TA
RGET2.79
3.00
2.25
1.50
0.75
0.0
1.34
2010 2011 2012 2013 2014 2015 2016 2018 TARGET
1.42
1.70
1.99
2.35
2.14
2.34
2.79
edmonton region non-residential permit value $ in billions
data source: statistics canada cansim table 026-0006
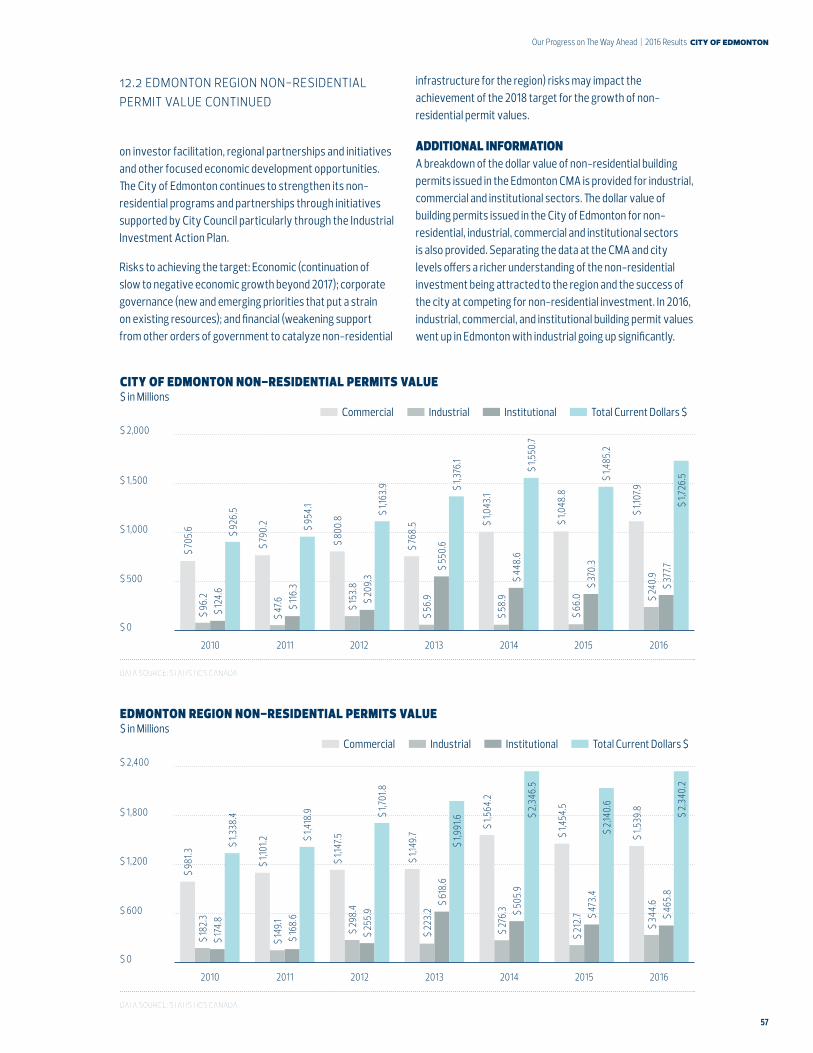
57
Our Progress on The Way Ahead | 2016 Results city of edmonton
on investor facilitation, regional partnerships and initiatives and other focused economic development opportunities. The City of Edmonton continues to strengthen its non-residential programs and partnerships through initiatives supported by City Council particularly through the Industrial Investment Action Plan.
Risks to achieving the target: Economic (continuation of slow to negative economic growth beyond 2017); corporate governance (new and emerging priorities that put a strain on existing resources); and financial (weakening support from other orders of government to catalyze non-residential
city of edmonton non-residential permits value $ in Millions
data source: statistics canada
$ 2,000
$ 1,500
$ 1,000
$ 500
$ 0
$ 79
0.2
$ 70
5.6
$ 80
0.8
$ 76
8.5 $
1,043
.1
$ 1,0
48.8
$ 1,1
07.9
$ 47
.6
$ 96
.2
$ 15
3.8
$ 56
.9
$ 58
.9
$ 66
.0 $ 24
0.9
$ 11
6.3
$ 12
4.6
$ 20
9.3
$ 55
0.6
$ 44
8.6
$ 37
0.3
$ 37
7.7
$ 95
4.1
$ 92
6.5 $
1,163
.9 $ 1,3
76.1
$ 1,5
50.7
$ 1,4
85.2
$ 1,7
26.5
20112010 201420132012 2015 2016
Commercial Industrial Institutional Total Current Dollars $
edmonton region non-residential permits value $ in Millions
data source: statistics canada
$ 2,400
$ 1,800
$ 1,200
$ 600
$ 0
$ 1,1
01.2
$ 14
9.1$
168.
6$
1,418
.9
$ 98
1.3$
182.
3$
174.
8$
1,338
.4
$ 1,1
47.5
$ 29
8.4
$ 25
5.9
$ 1,7
01.8
$ 1,1
49.7
$ 22
3.2
$ 61
8.6
$ 1,9
91.6
$ 1,5
64.2
$
276.
3 $ 50
5.9
$ 2,
346.
5
$ 1,4
54.5
$ 21
2.7 $
473.
4$
2,140
.6
$ 1,5
39.8
$ 34
4.6
$ 46
5.8
$ 2,
340.
2
20112010 201420132012 2015 2016
Commercial Industrial Institutional Total Current Dollars $
infrastructure for the region) risks may impact the achievement of the 2018 target for the growth of non-residential permit values.
additional information A breakdown of the dollar value of non-residential building permits issued in the Edmonton CMA is provided for industrial, commercial and institutional sectors. The dollar value of building permits issued in the City of Edmonton for non-residential, industrial, commercial and institutional sectors is also provided. Separating the data at the CMA and city levels offers a richer understanding of the non-residential investment being attracted to the region and the success of the city at competing for non-residential investment. In 2016, industrial, commercial, and institutional building permit values went up in Edmonton with industrial going up significantly.
12.2 edmonton region non-residential permit value continued
58
appendix i
2016 survey methodology & demographic details
RESPONDENTS PROFILE
CATEGORY TOTAL (400)
GENDERMale 50%Female 50%
AGE18-24 11%25-34 21%35-44 22%45-54 13%55-64 17% 65 years and over 17%
DURATION OF STAY IN EDMONTON6 months – less than 1 year –1 year – less than 3 years 6%3 years – less than 5 years 6%5 years or more 87%
CITY QUADRANT Northwest 28%Northeast 20%Southeast 26%Southwest 26%
PEOPLE IN HOUSEHOLD1 12%2 34%3 20%4+ 34%Prefer not to answer –
AGE OF PEOPLE IN HOUSEHOLDUnder 10 years of age 22%Between 10 and 17 years of age 17%Between 18 and 65 years of age 79%Older than 65 16%
EDUCATIONLess than high school 3%Graduated high school 20%Graduated college, technical or vocational school 25%Graduated university 51%Prefer not to answer 1%
MARITAL STATUSSingle, never married 28%Married or common law 61%Separated, divorced, widowed 10%Don’t know/Prefer not to answer 1%
EMPLOYMENTWorking full time 55%Working part time 12%A student 5%Not working outside the home 8%Retired 17%Prefer not to answer 3%
ANNUAL HOUSEHOLD INCOMELess than $20,000 3%Between $20,000 and $29,999 6%Between $30,000 and $49,999 11%Between $50,000 and $79,999 15%Between $80,000 and $119,999 18%$120,000 or more 28%Prefer not to answer 18% ANNUAL PERSONAL INCOMELess than $20,000 15%Between $20,000 and $29,999 9%Between $30,000 and $49,999 13%Between $50,000 and $79,999 21%Between $80,000 and $119,999 14%$120,000 or more 10%Prefer not to answer 18%
PRIMARY LANGUAGEEnglish 84%French –Others 16%
WORK FOR THE CITY OF EDMONTONYes 4%No 96%
VOTED IN MOST RECENT MUNICIPAL ELECTIONYes 72%No 26%I was not eligible 2%
OWN OR RENTOwn 75%Rent 25%
TYPE OF RESIDENCEHouse 63%Duplex 6%Four-plex –Apartment 9%Condo 9%Townhouse 7%Other 4%
BORNCanada 75%Moved to Canada from elsewhere 25%
YEAR MOVED TO CANADA*1951-1980 21%1981-2000 27%2001-2005 16%2006-2010 16%2011-2016 19%data source: leger edmontonians’ perception survey
(2016) * n=100 (100 of 400 respondents indicated they moved to canada)
59
Our Progress on The Way Ahead | 2016 Results city of edmonton
SURVEY METHODOLOGY AND DEMOGRAPHIC DETAILS The Edmontonians’ Perception Survey was conducted at random by telephone between November 14 and December 5, 2016. Four hundred (400) interviews took place with Edmonton residents 18 years of age and older, who have lived
MEASURE 1.2 The 2016 positive responses (agree/strongly agree) are provided by demographic breakdown.
MEASURE 2.2 The 2016 positive responses (agree/strongly agree) are provided by demographic breakdown.
in Edmonton for six months or longer. Quotas by age, gender and city quadrant were maintained during data collection to minimize the need for data weighing. The margin of error is ±4.9 percentage points, 19 times out of 20.
city design & attractivenessTARGET PERFORMANCE • 55%
access to infrastructure, amenities & servicesTARGET PERFORMANCE • 70%
Yes YesNo No
english as first language
english as first language
51%66%59%
73%
18-34 18-3435-54 35-5455+ 55+
age age
52%60%
Male Female
gender gender
65%57%
69%
Born in Canada
Born in Canada
Moved 10+ Years
Ago
Moved 10+ Years
Ago
Moved <10 Years
Ago
Moved <10 Years
Ago
born in / moved to cananda
born in / moved to cananda
51%67%
54%
Yes YesNo No
children in household children in household
51%
72%54%
education education
65%73%
54% 73%
High School or Less
High School or Less
College / Vocational
College / Vocational
University University
57%70%
59% 65%51%
65%
<$30K <$30K$30K - $50K
$30K - $50K
$50K - $80K
$50K - $80K
> $80K > $80K
personal income personal income
69% 74%
43%
68%
70% 66% 65%
Male Female
48%46%
47%63% 57%
62% 64%
60
Yes YesNo No
english as first language
english as first language
51% 54%
18-34 18-3435-54 35-5455+ 55+
age agegender gender
49% 52%52%60%
Born in Canada
Born in Canada
Moved 10+ Years
Ago
Moved 10+ Years
Ago
Moved <10 Years
Ago
Moved <10 Years
Ago
born in / moved to cananda
born in / moved to cananda
49% 54%63% 57%
Yes YesNo No
children in household children in household
MEASURE 5.1 The 2016 positive responses (yes) are provided by demographic breakdown.
MEASURE 5.2 The 2016 positive responses (agree/strongly agree) are provided by demographic breakdown.
volunteerismTARGET PERFORMANCE • 55%
connectedness to communityTARGET PERFORMANCE • 45%
education education
33%
63%73%
High School or Less
High School or Less
College / Vocational
College / Vocational
University University
56% 57% 57%
<$30K <$30K$30K - $50K
$30K - $50K
$50K - $80K
$50K - $80K
> $80K > $80K
personal income personal income
37%
71%
64% 60%
43% 47%56% 61%
53% 60%
58% 66%47% 51%
50%67%
Male Female Male Female
43%
65%48%42% 47% 45% 48%
61
Our Progress on The Way Ahead | 2016 Results city of edmonton
MEASURE 6.3 The 2016 positive responses (used in past 12 months) are provided by demographic breakdown
MEASURE 7.2 The 2016 positive responses (agree/strongly agree) are provided by demographic breakdown.
Yes No
english as first language
66%
18-34 35-54 55+
age
Male Female
gender
67% 65%
Born in Canada
Moved 10+ Years
Ago
Moved <10 Years
Ago
born in / moved to cananda
66% 66%
Yes No
children in household
safety in the cityTARGET PERFORMANCE • 68%
park visitationsTARGET PERFORMANCE • 83%
education
63%71%
73%
High School or Less
College / Vocational
University
66% 63% 63%
<$30K $30K - $50K
$50K - $80K
> $80K
personal income
66%
68%
64% 67% 67%
66% 66%
66%
Yes No
english as first language
89%
18-34 35-54 55+
age
Male Female
gender
90% 90%
Born in Canada
Moved 10+ Years
Ago
Moved <10 Years
Ago
born in / moved to cananda
90% 85%
Yes No
children in household
education
84%93%
High School or Less
College / Vocational
University
88% 82%95%
<$30K $30K - $50K
$50K - $80K
> $80K
personal income
97%
95%
93% 93%82%
95% 87%
94%
88%
60%
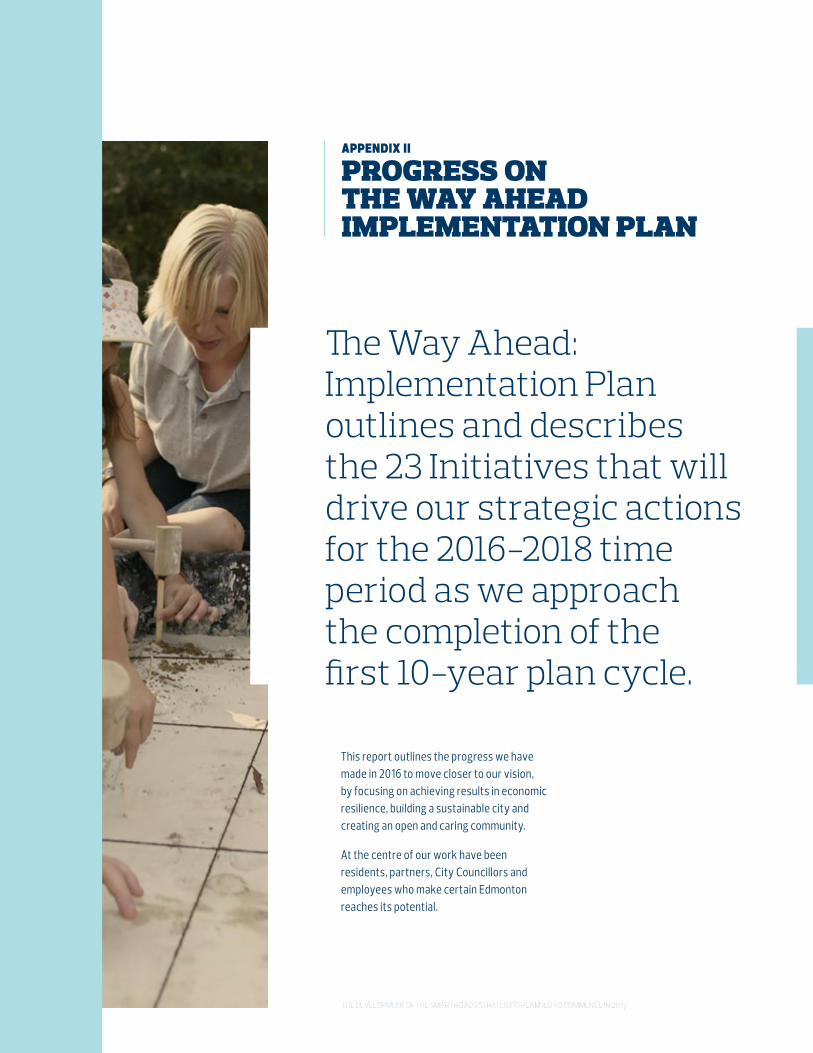
62
appendix ii
progress on the way ahead implementation plan
This report outlines the progress we have made in 2016 to move closer to our vision, by focusing on achieving results in economic resilience, building a sustainable city and creating an open and caring community.
At the centre of our work have been residents, partners, City Councillors and employees who make certain Edmonton reaches its potential.
The Way Ahead: Implementation Plan outlines and describes the 23 Initiatives that will drive our strategic actions for the 2016-2018 time period as we approach the completion of the first 10-year plan cycle.
the development of the smart roads strategy is planned to commence in 2017.
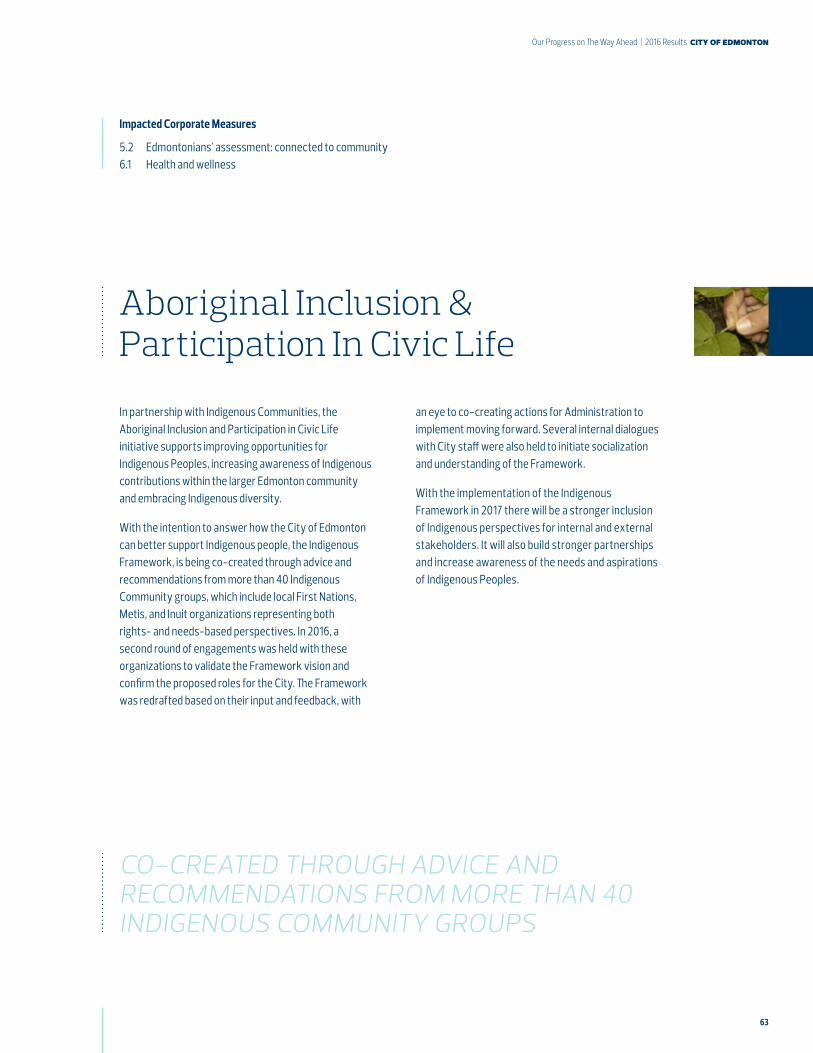
63
Our Progress on The Way Ahead | 2016 Results city of edmonton
In partnership with Indigenous Communities, the Aboriginal Inclusion and Participation in Civic Life initiative supports improving opportunities for Indigenous Peoples, increasing awareness of Indigenous contributions within the larger Edmonton community and embracing Indigenous diversity.
With the intention to answer how the City of Edmonton can better support Indigenous people, the Indigenous Framework, is being co-created through advice and recommendations from more than 40 Indigenous Community groups, which include local First Nations, Metis, and Inuit organizations representing both rights- and needs-based perspectives. In 2016, a second round of engagements was held with these organizations to validate the Framework vision and confirm the proposed roles for the City. The Framework was redrafted based on their input and feedback, with
Aboriginal Inclusion & Participation In Civic Life
an eye to co-creating actions for Administration to implement moving forward. Several internal dialogues with City staff were also held to initiate socialization and understanding of the Framework.
With the implementation of the Indigenous Framework in 2017 there will be a stronger inclusion of Indigenous perspectives for internal and external stakeholders. It will also build stronger partnerships and increase awareness of the needs and aspirations of Indigenous Peoples.
CO-CREATED THROUGH ADVICE AND RECOMMENDATIONS FROM MORE THAN 40 INDIGENOUS COMMUNITY GROUPS
Impacted Corporate Measures
5.2 Edmontonians’ assessment: connected to community 6.1 Health and wellness
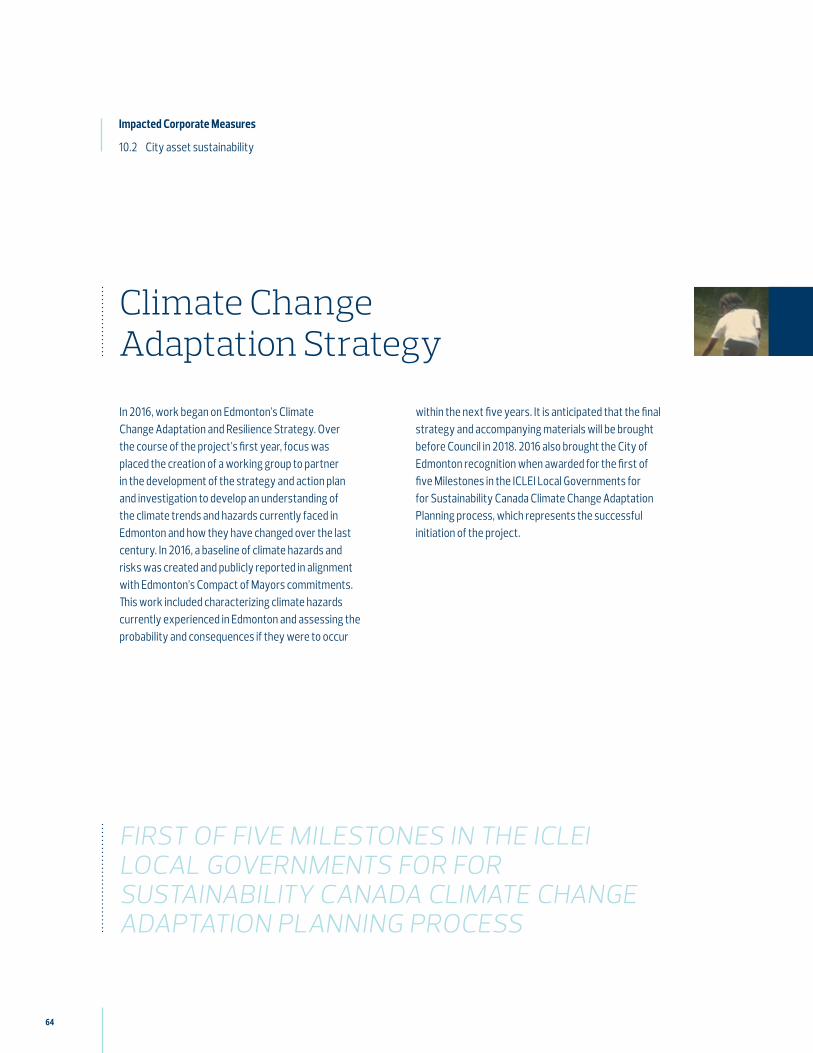
64
In 2016, work began on Edmonton’s Climate Change Adaptation and Resilience Strategy. Over the course of the project’s first year, focus was placed the creation of a working group to partner in the development of the strategy and action plan and investigation to develop an understanding of the climate trends and hazards currently faced in Edmonton and how they have changed over the last century. In 2016, a baseline of climate hazards and risks was created and publicly reported in alignment with Edmonton’s Compact of Mayors commitments. This work included characterizing climate hazards currently experienced in Edmonton and assessing the probability and consequences if they were to occur
Climate Change Adaptation Strategy
within the next five years. It is anticipated that the final strategy and accompanying materials will be brought before Council in 2018. 2016 also brought the City of Edmonton recognition when awarded for the first of five Milestones in the ICLEI Local Governments for for Sustainability Canada Climate Change Adaptation Planning process, which represents the successful initiation of the project.
FIRST OF FIVE MILESTONES IN THE ICLEI LOCAL GOVERNMENTS FOR FOR SUSTAINABILITY CANADA CLIMATE CHANGE ADAPTATION PLANNING PROCESS
Impacted Corporate Measures
10.2 City asset sustainability
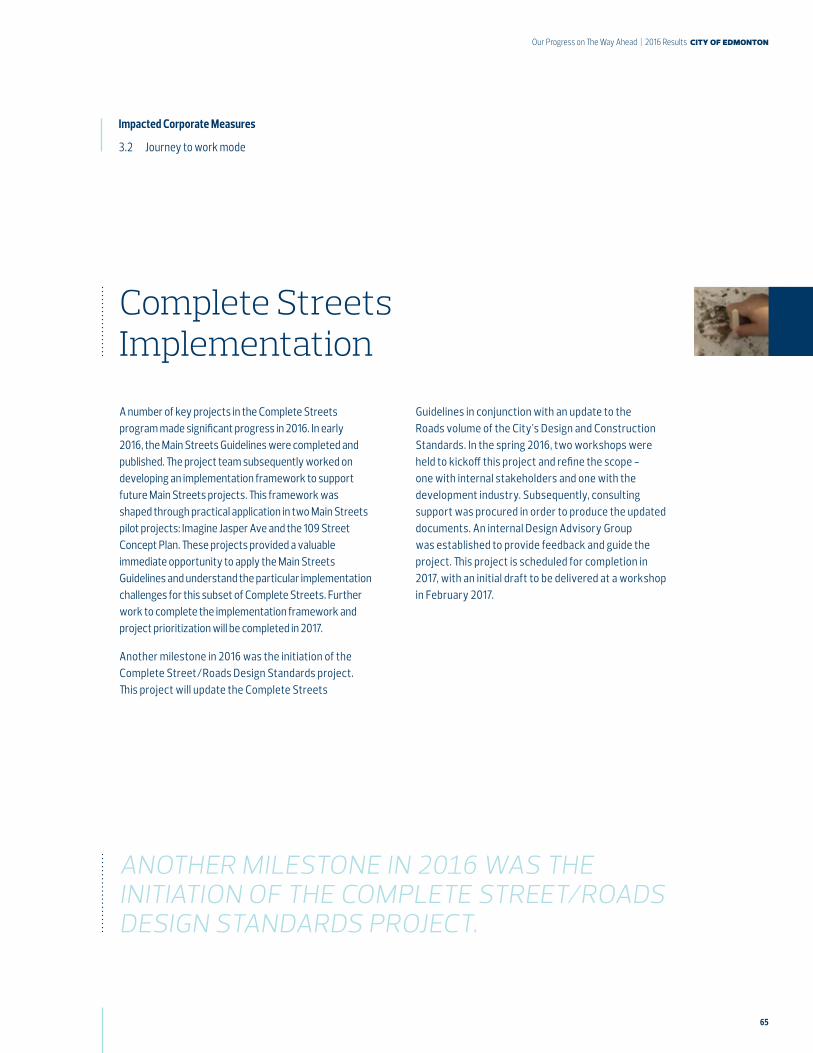
65
Our Progress on The Way Ahead | 2016 Results city of edmonton
A number of key projects in the Complete Streets program made significant progress in 2016. In early 2016, the Main Streets Guidelines were completed and published. The project team subsequently worked on developing an implementation framework to support future Main Streets projects. This framework was shaped through practical application in two Main Streets pilot projects: Imagine Jasper Ave and the 109 Street Concept Plan. These projects provided a valuable immediate opportunity to apply the Main Streets Guidelines and understand the particular implementation challenges for this subset of Complete Streets. Further work to complete the implementation framework and project prioritization will be completed in 2017.
Another milestone in 2016 was the initiation of the Complete Street/Roads Design Standards project. This project will update the Complete Streets
Complete Streets Implementation
Guidelines in conjunction with an update to the Roads volume of the City’s Design and Construction Standards. In the spring 2016, two workshops were held to kickoff this project and refine the scope - one with internal stakeholders and one with the development industry. Subsequently, consulting support was procured in order to produce the updated documents. An internal Design Advisory Group was established to provide feedback and guide the project. This project is scheduled for completion in 2017, with an initial draft to be delivered at a workshop in February 2017.
ANOTHER MILESTONE IN 2016 WAS THE INITIATION OF THE COMPLETE STREET/ROADS DESIGN STANDARDS PROJECT.
Impacted Corporate Measures
3.2 Journey to work mode

66
PHASE 1 OF IMPLEMENTATION (from mid-2015 to early 2016) focused on creating this framework, including:
• establishing City Policy C-585 – entrenching City Council’s commitment to an energy sustainable Edmonton along with key elements of the Strategy
• Approving new operational funding to advance key initiatives in the Strategy (i.e., $5.3 million through the 2016-18 operating budget)
• Creating a new City Council advisory committee to provide broad independent advice on the Strategy to City Council
• Creating a new Council Initiative (re: energy transition and climate adaptation) to ensure Council leadership and engagement
• Recognizing the Strategy in The Way Ahead Implementation Plan as one of the City’s key strategic actions for the 2016-2018 timeframe
• Establishing Corporate Measures and Targets (and regular feedback loops) to reduce greenhouse gas emissions in City operations and the community
Edmonton’s Community Energy Transition Strategy Implementation
PHASE 2 OF THE STRATEGY (Gearing-Up for Community Scale Programs) commenced in 2016, focused on:
• Engaging and mobilizing a majority of Edmontonians to work individually and as a community to make Edmonton an energy sustainable city
• Leading-by-example in City operations by applying best practices (re: energy transition) that can be shared with and used to inspire the larger community
• Piloting energy efficiency and clean energy programs that will potentially grow to become community-scale programs
• Continuing to refine the Strategy in areas where information and knowledge gaps exist and where more detailed action plans are needed
• Collaborating with other municipal, provincial and federal governments to share knowledge, leverage resources and align strategies
Annual Report 2016 discusses 16 specific projects that were launched in 2016 to engage edmontonians; advance wise energy use in buildings; advance clean energy generation; advance wise energy use in local industry, advance energy efficient transportation; and lead-by-example in City operations.
2016 was the first full-year of implementation for the City of Edmonton’s Energy Transition Program. With a mandate to lead Edmonton to an energy-sustainable future as defined in Edmonton’s Community Energy Transition Strategy, the City launched efforts on a number of fronts. As a starting point, it was understood that becoming an energy sustainable Edmonton would take decades to achieve and that success required a strong accountability framework.
WITH A MANDATE TO LEAD EDMONTON TO AN ENERGY-SUSTAINABLE FUTURE... THE CITY LAUNCHED EFFORTS ON A NUMBER OF FRONTS
Impacted Corporate Measures
3.2 Journey to work mode 8.1 City operations greenhouse gas emissions 9.1 Community greenhouse gas emissions
67
Our Progress on The Way Ahead | 2016 Results city of edmonton
Edmonton is a global destination for innovation, new business activity, research and small business growth—and these initiatives will ensure it stays this way. The City meets small business needs in Business Improvement Areas and neighbourhood retail centres close to transit and other services. An example is the Open Window program, an appointment based service where small business owners can consult with staff on options for site specific business operating opportunities and access customer process support. Since implementation in June 2016 the program has reached over 450 small businesses. Another example is Pop Up support, organizers have access to a separate process that streamlines steps to host short term, temporary retail shops for local vendors. In 2016, we supported four pop-up experiences in the downtown core.
It also partners with multiple organizations to enhance entrepreneurial and innovation capacities. Specifically, the City supports and partners with the Edmonton Economic Development Innovation & Entrepreneurship Ecosystem comprised of Startup
Entrepreneurial & Innovation Capacity Building
Edmonton, the Advanced Technology Centre at the Edmonton Research Park and TEC Edmonton. These three organizations continue to expand their programs and reach to the continually growing community of Edmonton entrepreneurs. Newly launched is the Edmonton Made pilot program that showcases locally grown Edmonton businesses while at the same time making a direct connection to the full range of small business support services.
The mission of Edmonton Made is to provide the best possible environment for local entrepreneurs, making it easier and faster to thrive and grow. To date, over 600 Edmonton Made businesses have joined the community and signed up to the newsletter. EdmontonMade.com has had over 13,000 views through direct, Facebook and Google referrers. Edmonton Made collateral is distributed by 14 different pick up points.
IN 2016, WE SUPPORTED FOUR POP-UP EXPERIENCES IN THE DOWNTOWN CORE. IT ALSO PARTNERS WITH MULTIPLE ORGANIZATIONS TO ENHANCE ENTREPRENEURIAL AND INNOVATION CAPACITIES.
Impacted Corporate Measures
11.1 Edmonton Economic Diversity Index 11.2 Edmonton small to medium-sized business
68
The Facility Renewal Strategy will ensure that existing infrastructure is maintained to the standards Edmontonians expect while emphasizing value for public investment. In 2016, the project team produced a work plan or roadmap that will guide the development of the Facility Renewal Strategy in 2017.
Three phases of work were conducted with the following activities and deliverables in each phase:
FOUNDATIONAL PHASE In the Foundational phase, the project was kicked off and roles and responsibilities, project governance, desired outcomes, participants and deliverables were validated with key stakeholders. Deliverables developed during this phase include the Project Charter and the bi-weekly reporting template.
ENVIRONMENTAL SCAN Focused on understanding leading practices in other jurisdictions to support the development of the Strategy Development Workplan. Participants were identified, shortlisted and interviewed, and the minutes from the interviews were analyzed for key findings and themes. Findings from the environmental scan were presented to
the City and were used as a key input into the Strategy Development Workplan. The deliverable developed during this phase was the Environmental Scan Report.
STRATEGY DEVELOPMENT WORKPLAN Focused on outlining the required phases of work, steps, activities, required resources, objectives, forecasted outcomes and timelines within the Workplan (this document) to support the development of the Facility Renewal Strategy. Key inputs into the Strategy Development Workplan included findings from the current state assessment (e.g., existing City policies and frameworks), environmental scan key findings and themes, discussions from stakeholder workshops and feedback from City project members. The deliverable developed during this phase was the Strategy Development Workplan.
Facility Renewal Strategy
EXISTING INFRASTRUCTURE IS MAINTAINED TO THE STANDARDS EDMONTONIANS EXPECT WHILE EMPHASIZING VALUE FOR PUBLIC INVESTMENT.
Impacted Corporate Measures
1.2 Edmontonians’ assessment: well-designed, attractive city 2.2 Edmontonians’ assessment: access to amenities and services that improve quality of life 8.1 City operations greenhouse gas emissions 10.2 City asset sustainability
69
Our Progress on The Way Ahead | 2016 Results city of edmonton
ECSC PREPARED A DRAFT MEMORANDUM OF UNDERSTANDING (MOU) IN 2016 TO FORMALIZE THE COLLABORATIVE WORKING RELATIONSHIP BETWEEN ORDERS OF GOVERNMENT.
ELEVATE UPDATE Edmonton Community Sustainability Coalition (ECSC), made up of representatives from the Province of Alberta, City of Edmonton, the Edmonton Public School District, Edmonton Catholic School District, Conseil scolaire Centre-Nord, met in early 2016 to work towards creating a process whereby sharing, assessing and aligning jurisdictional capital plans and budget processes would become an annual priority in an effort to advance the ELEVATE vision.
ECSC prepared a draft Memorandum of Understanding (MOU) in 2016 to formalize the collaborative working relationship between orders of government. MOU to be confirmed and ratified by each jurisdiction in 2017.
NEIGHBORHOOD REVITALIZATION FRAMEWORK UPDATE There was continued delivery of targeted capital and operational investment in 13 higher needs neighbourhoods by working directly with residents, local businesses and community organizations to carry out a strategic set of community-led actions to improve quality of life in these communities.
Great Neighbourhoods Implementation
A strategic planning framework was developed to evaluate the completed implementation of a Revitalization Strategy as well ass enable a well-informed and thoughtful transition of the initiative out of the neighbourhood(s). Future transition will enable the revitalization resources to be deployed to other neighbourhoods.
GREAT NEIGHBORHOODS CAPITAL PROGRAM UPDATE The remainder of the Great Neighbourhoods Capital Program ($150M over 10 years) will be allocated through to 2018 per the three funding envelopes approved by Senior Management Team in 2010:
• Neighbourhood Revitalization
• Coordinated Neighbourhood Redevelopment and Improvements (coordinated with Neighbourhood Transportation and Drainage Renewal)
• Business Development (e.g. Corner Stores)
There was the initiation of the development of options for the future state of the Great Neighbourhoods Capital Program 2019 and beyond.
Impacted Corporate Measures
5.2 Edmontonians’ assessment: connected to community 6.1 Health and wellness
70
From earning top national and international rankings; generating economic impact; garnering local, national, international media attention; to increasing collaborations with community partners, we elevated Edmonton as a more attractive, connected and economically diverse city in 2016, making progress in various corporate outcomes.
Achievements include:
• Earning Around the Rings’ “World’s Top 10 Sports Cities” status, the only North American city on the top 10 list
• Named as the 2nd best Canadian city for doing business by Profit magazine
• Securing the hosting of Canadian Track & Field Olympic & Paralympic Trials, FISE World Edmonton and Tour of Alberta, in collaboration with EEDC and Edmonton Tourism
• Being the first Canadian city to host the Ice Castle attraction, in Hawrelak Park
• Being the first and only Canadian city to host FISE World Series, one of the world’s largest summer extreme sports festivals
Image & Reputation Management Plan
• Host city of the Tour of Alberta, which is Canada’s first and highest ranked UCI (Union Cycliste Internationale - the international body of professional cycling)-sanctioned professional road cycling stage race, since its inception in 2013
• Kicking off Canada’s 150th anniversary of Confederation with a spectacular New Year’s Eve celebration in downtown
• Continuously promoting our revitalized downtown, including the openings of Rogers Place and Edmonton Tower, by working with the Downtown Partners Working Group (DPWG), a community-based group of 14 public and private organizations
• Increased visitation to downtown with the opening of Rogers Place, drawing in over 870,000 event-goers in just 115 days
• Soft launching the Blatchford community brand to maintain awareness while awaiting Council’s approval of district energy system
WE ELEVATED EDMONTON AS A MORE ATTRACTIVE, CONNECTED AND ECONOMICALLY DIVERSE CITY IN 2016
Impacted Corporate Measures
1.2 E dmontonians’ assessment: well-designed, attractive city 5.2 Edmontonians’ assessment: connected to community 11.1 Edmonton Economic Diversity Index
71
Our Progress on The Way Ahead | 2016 Results city of edmonton
Growth Coordination Strategy Implementation actions a number of strategies and initiatives to better coordinate private and public infrastructure investment and public service delivery. Ongoing informed discussions within the City and between the City and city-building stakeholders to properly sequence and time the application of public programs and services, and investment in public and private infrastructure supports the effective and efficient pursuit of a liveable and sustainable city.
This coordination starts with an ongoing understanding of Edmonton’s current state and trends relative to growth and regeneration via a number of indicators, including population growth by geography, land supply and absorption by sector, and housing starts within the city and the surrounding region. Growth monitoring continues to gather appropriate data to inform this foundational work during 2016.
As per the Up, In and Out approach to growth and regeneration Administration continued to pursue supply and opportunity for growth In 2016 advances were made in Evolving Infill completing their 24 actions.
The project is now transitioning to Evolving Infill 2.0, which is being shaped and formed through extensive consultation to promote urban intensification on infill. The goal is to achieve a sustainable, compact, and liveable city and the efficient use of infrastructure that is already in place.
The promotion of urban intensification also influenced understanding in regards to the fiscal impacts of growth. Data gathered and analyzed is being merged with completed actions of Evolving Infill. It allows for a fiscal case to focus on building up and in. This is balanced by assuring the city maintains a healthy supply of single family housing while still efficiently utilizing infrastructure and providing a compact, liveable city
Due to our directing of growth to the downtown core, coupled with economic climate, we were able to achieve targets on growth in core/mature neighbourhoods.
Growth Strategy Implementation
THE GOAL IS TO ACHIEVE A SUSTAINABLE, COMPACT, AND LIVEABLE CITY AND THE EFFICIENT USE OF INFRASTRUCTURE THAT IS ALREADY IN PLACE.
Impacted Corporate Measures
1.1 New residential units in mature areas 2.1 Infrastructure density 4.2 Travel time and reliability for goods and services movement 9.1 Community greenhouse gas emissions 9.2 Ecological footprint 10.2 City asset sustainability
72
In September 2015, Edmonton CIty Council approved the Edmonton Road Safety Strategy 2016 - 2020, which built on the safe system approach and a long term goal of Vision Zero. During 2016, initiatives identified in the Road Safety Strategy were developed, implemented and evaluated. An annual report for 2016 is being prepared for Council and will likely be completed by the first quarter of 2017.
Initiatives relating to the 5 E’s of traffic safety, namely: engineering, enforcement, education, evaluation, and engagement will be highlighted in the 2016 annual report. General trends noted reductions in serious and minor
Joint Road Safety Implementation
injury collisions and collisions overall, when compared to previous years. The 22 fatalities in 2016 was much lower than the 32 in 2015, but in line with the lowest amount over the past ten years.
The two corporate target results for 2016, relating to collisions in intersections per 1000 (14.8 for 2016) and injuries from collisions per 1000 (3.4 for 2016) are 14.3 collisions in intersections and 3.5 in injuries per 1000.
ENGINEERING, ENFORCEMENT, EDUCATION, EVALUATION, AND ENGAGEMENT WILL BE HIGHLIGHTED IN THE 2016 ANNUAL REPORT.
Impacted Corporate Measures
7.2 Edmontonians’ assessment: safe city
73
Our Progress on The Way Ahead | 2016 Results city of edmonton
All projects identified in The Way Ahead under LRT Planning, Construction and Development are complete or on track. In addition to projects underneath the initiative’s umbrella, in 2016 the Government of Canada introduced the Public Transit Infrastructure Fund (PTIF) which injected approximately $220-million dollars into Edmonton’s transit projects, the majority of which are associated with LRT. All PTIF projects have commenced and are scheduled for completion within this iteration of The Way Ahead.
In February 2016, the City of Edmonton and TransEd Partners signed the P3 Project Agreement to design, build, finance, operate, and maintain Valley Line Stage 1. Design and construction activities are underway along the length of the line and are tracking within project parameters.
Administration completed an LRT prioritization study in 2016 which outlined the recommended staging of the unfunded portions of the network. In May 2016, Council
approved construction prioritization for Valley Line West and the Metro Line extension to Blatchford as well as concept and design work for three other segments of the LRT Network Plan.
PTIF funded preliminary design on the Metro Line NAIT to Campbell Road extension, a procurement ready build package for the Metro Line NAIT to Blatchford leg, preliminary design and a procurement ready build package on Valley Line Stage 2, preliminary design on the Capital Line extension (south to Ellerslie Road), preliminary design and construction of the Heritage Valley Park and Ride, and concept planning for the Downtown Circulator.
LRT Planning, Construction & Development
GOVERNMENT OF CANADA INTRODUCED THE PUBLIC TRANSIT INFRASTRUCTURE FUND (PTIF) WHICH INJECTED APPROXIMATELY $220-MILLION DOLLARS INTO EDMONTON’S TRANSIT PROJECTS
Impacted Corporate Measures
3.1 Transit ridership 3.2 Journey to work mode
74
The City of Edmonton continued to participate in the Municipal Government Act (MGA) Review process throughout 2016. The Review began in 2012 and is expected to be completed in time for the municipal elections in the fall of 2017.
In December 2016, Bill 21: the Modernized Municipal Government Act received Royal Assent at the Alberta Legislature. Bill 21 is the second legislative piece resulting from the MGA Review process and includes some enabling provisions that are important to the City of Edmonton, such as new tools for social housing, expanded scope of offsite levies and amendments to encourage regional collaboration. The first legislative piece, Bill 20: Municipal Government Amendment Act, was introduced and passed in 2015.
The City provided a Council endorsed submission on Bill 21 in July 2016, as input to the province’s summer consultation.
Throughout 2016, the City of Edmonton, along with the City of Calgary and Government of Alberta, also continued to work on developing draft policy proposals
New Legislative Framework: City Charter & MGA
THE CITY OF EDMONTON CONTINUED TO PARTICIPATE IN THE MUNICIPAL GOVERNMENT ACT (MGA) REVIEW PROCESS THROUGHOUT 2016
for the City Charter on administrative and government efficiency, community well-being, community planning, environmental stewardship and fiscal matters. Public engagement sessions were held in October 2016 to share the results of the above work.
The City Charter will also result in the creation of a collaboration structure that will formalize the cooperation of the three parties on issues of mutual interest by aligning ongoing work in priority areas and ensuring that efforts are strategic and coordinated. Work is already underway for establishing some of the collaboration structures, for example through the Housing Collaboration with the province and the City of Calgary. The City Charters are scheduled to be finalized in 2017.
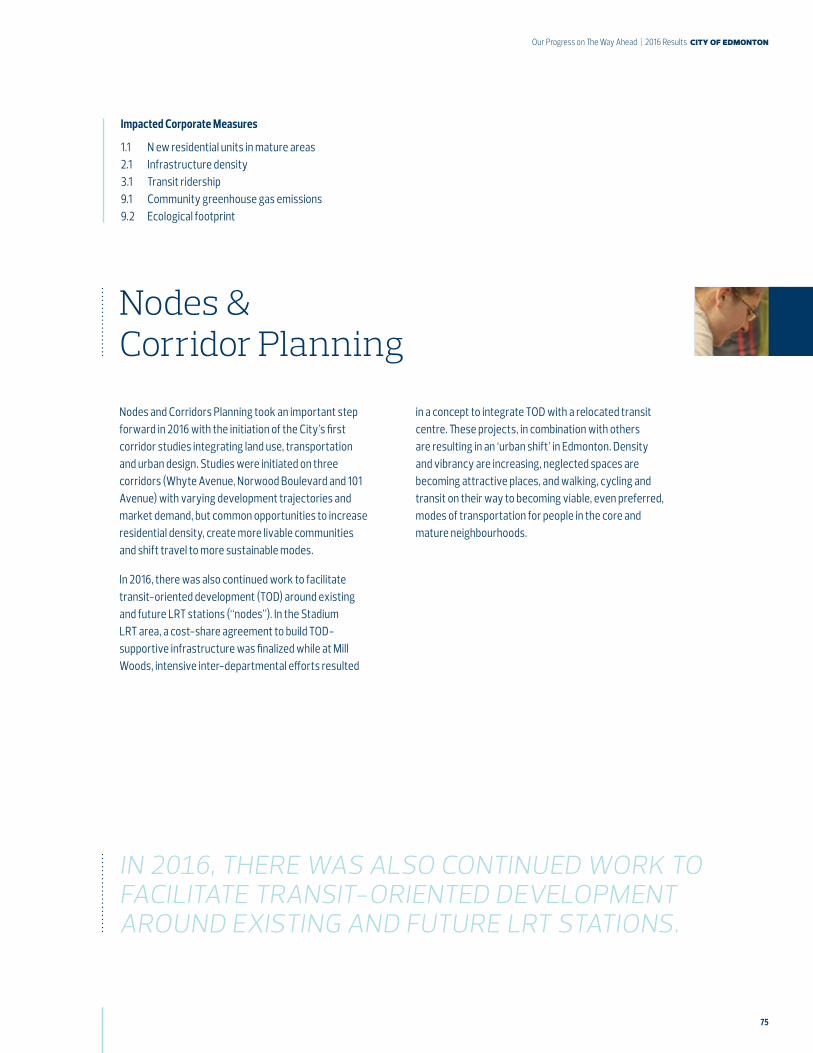
75
Our Progress on The Way Ahead | 2016 Results city of edmonton
Nodes and Corridors Planning took an important step forward in 2016 with the initiation of the City’s first corridor studies integrating land use, transportation and urban design. Studies were initiated on three corridors (Whyte Avenue, Norwood Boulevard and 101 Avenue) with varying development trajectories and market demand, but common opportunities to increase residential density, create more livable communities and shift travel to more sustainable modes.
In 2016, there was also continued work to facilitate transit-oriented development (TOD) around existing and future LRT stations (“nodes”). In the Stadium LRT area, a cost-share agreement to build TOD-supportive infrastructure was finalized while at Mill Woods, intensive inter-departmental efforts resulted
Nodes & Corridor Planning
IN 2016, THERE WAS ALSO CONTINUED WORK TO FACILITATE TRANSIT-ORIENTED DEVELOPMENT AROUND EXISTING AND FUTURE LRT STATIONS.
in a concept to integrate TOD with a relocated transit centre. These projects, in combination with others are resulting in an ‘urban shift’ in Edmonton. Density and vibrancy are increasing, neglected spaces are becoming attractive places, and walking, cycling and transit on their way to becoming viable, even preferred, modes of transportation for people in the core and mature neighbourhoods.
Impacted Corporate Measures
1.1 N ew residential units in mature areas 2.1 Infrastructure density 3.1 Transit ridership 9.1 Community greenhouse gas emissions 9.2 Ecological footprint
76
The Open City Initiative, published in June of 2014, is a municipal perspective on the philosophy of open government and is premised on the principles of transparency, participation, collaboration, inclusion and innovation. The initiative plays a key role in enabling the The Way Ahead principles of livability, integration, sustainability and innovation by supporting initiatives which help the Corporation to become more innovative, effective and efficient while utilizing technology to enhance the quality of life for citizens.
The Open City Initiative informed the development of the Open City Policy adopted by City Council in March of 2015. The Policy was developed in collaboration with the Edmonton Insight Community whereby over 800 individuals collectively generated 9,600 ideas,
Open City Initiative
THE INITIATIVE PLAYS A KEY ROLE IN ENABLING THE THE WAY AHEAD PRINCIPLES OF LIVABILITY, INTEGRATION, SUSTAINABILITY AND INNOVATION
comments and questions. The Policy confirms that as an Open City, the City of Edmonton will create opportunity for diverse input and participation, inviting Edmontonians to play a larger role in shaping the community and enabling social and economic growth.
The initiative will be refreshed in 2017 to continue Edmonton’s commitment to transparency and openness - an organization that is connected to the public and responsive to their vision for government.
Impacted Corporate Measures
5.2 Edmontonians’ assessment: connected to community
77
Our Progress on The Way Ahead | 2016 Results city of edmonton
Significant progress was made in 2016 to advance the development of the Open Space Master Plan, now branded as Breathe: Edmonton’s Green Network Strategy. This strategy replaces the Urban Parks Management Plan and Natural Connections, bringing together the planning perspectives of recreational and natural systems.
The City’s green network, comprised of public parks, open space and natural areas, has been analyzed for overall supply and demand, with ten new strategic priorities identified. Breathe applies an evidence-based approach, based upon data compiled from over 70 city-sourced Geographic Information System datasets, providing the ability to measure the supply (quantity), function (quality), distribution (access) and diversity of Edmonton’s green network. The conceptual model for the strategy is based upon the understanding that open space themes and functions support a multifunctional network, which optimizes the effectiveness and efficiency of the City’s land resources.
Open Space Plan
PROGRESS WAS MADE IN 2016 TO ADVANCE THE DEVELOPMENT OF THE OPEN SPACE MASTER PLAN, NOW BRANDED AS BREATHE: EDMONTON’S GREEN NETWORK STRATEGY.
Three phases of public engagement were completed in 2016, engaging over 1,000 people through 11 open houses and 17 community events and festivals, and over 2,500 people engaged via an online survey.
The draft strategy was submitted in late 2016 and is under review in Q1 2017. Following public review of the draft Strategy in Q1 2017, it is anticipated that the strategy will be presented to Council in Q2 2017. A detailed implementation plan, along with updated standards and guidelines, will be developed throughout 2017 and 2018, in consultation with internal and external stakeholders.
Impacted Corporate Measures
1.2 Edmontonians’ assessment: well-designed, attractive city 2.2 Edmontonians’ assessment: access to amenities and services that improve quality of life 6.1 Health and wellness 6.3 City park usage
78
The 2020-2040 Recreation Facility Master Plan will ensure public recreation spaces and places continue to be accessible, welcoming and respond to community needs and resources. The City of Edmonton’s Strategic Plan: The Way Ahead goals, outcomes and four principles of integration, sustainability, livability and innovation will underpin this master plan. A refreshed facility model approach with principles and a continuum will describe the preferred future, help make good decisions, and effectively coordinate public recreation facility planning, development and program delivery for the City and its partners.
Recreation Facility Master Plan
ENSURE PUBLIC RECREATION SPACES AND PLACES CONTINUE TO BE ACCESSIBLE, WELCOMING AND RESPOND TO COMMUNITY NEEDS AND RESOURCES.
The City’s overarching plan will provide a focus to the City’s and partners’ efforts to deliver the greatest value of public recreation facilities, programs, and services that are most important to Edmontonians while managing the opportunities and challenges of an ever-changing city. The plan will identify opportunities and challenges and proactively address these through a facility model and service delivery system now and in the future.
Impacted Corporate Measures
2.2 Edmontonians’ assessment: access to amenities and services that improve quality of life 5.2 Edmontonians’ assessment: connected to community 6.1 Health and wellness 6.2 Recreation facility and library attendance
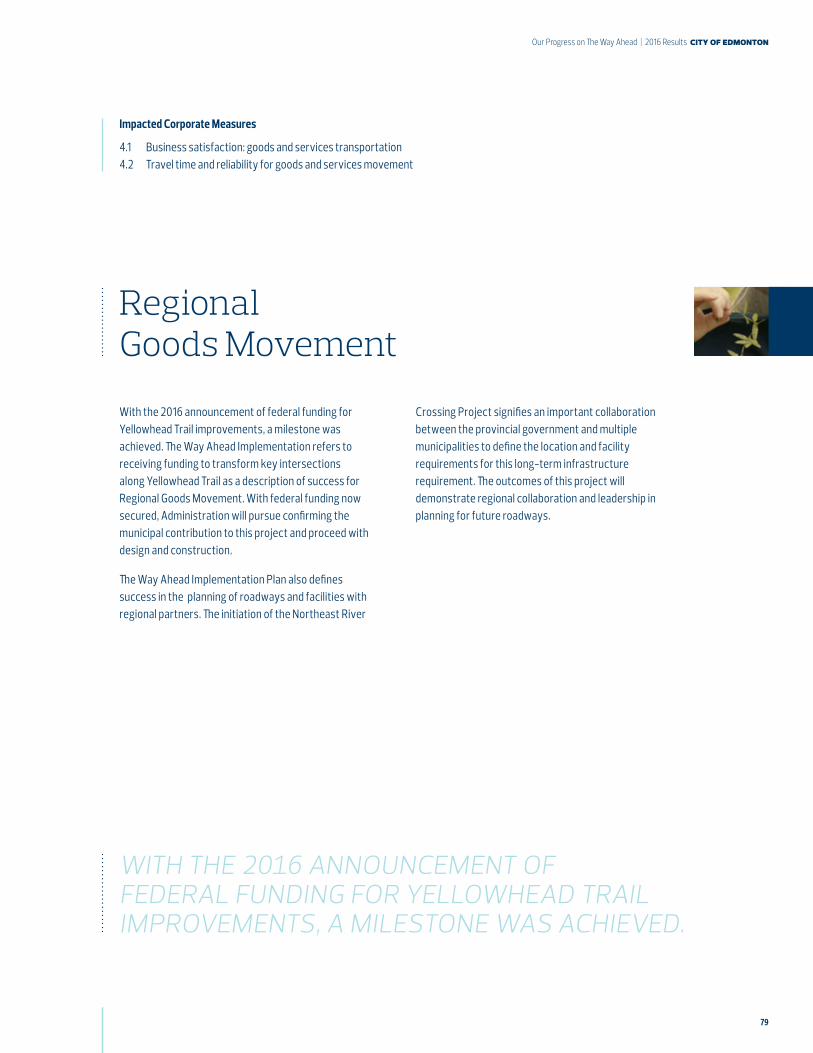
79
Our Progress on The Way Ahead | 2016 Results city of edmonton
With the 2016 announcement of federal funding for Yellowhead Trail improvements, a milestone was achieved. The Way Ahead Implementation refers to receiving funding to transform key intersections along Yellowhead Trail as a description of success for Regional Goods Movement. With federal funding now secured, Administration will pursue confirming the municipal contribution to this project and proceed with design and construction.
The Way Ahead Implementation Plan also defines success in the planning of roadways and facilities with regional partners. The initiation of the Northeast River
Regional Goods Movement
WITH THE 2016 ANNOUNCEMENT OF FEDERAL FUNDING FOR YELLOWHEAD TRAIL IMPROVEMENTS, A MILESTONE WAS ACHIEVED.
Crossing Project signifies an important collaboration between the provincial government and multiple municipalities to define the location and facility requirements for this long-term infrastructure requirement. The outcomes of this project will demonstrate regional collaboration and leadership in planning for future roadways.
Impacted Corporate Measures
4.1 Business satisfaction: goods and services transportation 4.2 Travel time and reliability for goods and services movement
80
Through the Social Development Plan, the City aims to improve community wellness and social outcomes. Specific initiatives within the Social Development Plan initiative include End Poverty Edmonton, Affordable Housing and Homelessness Prevention, Low Income Transit, and the Social Development Framework.
Significant progress was made in 2016 to advance the Social Development Plan initiative. All of the projects supporting this initiative are on track and achieved major milestones in 2016. Implementation of this work continues into 2017.
In 2016, Council endorsed the End Poverty Edmonton Strategy and Road Map and committed to investing in the implementation of 35 actions intended to lift 10,000 people out of poverty in five years.
There were several pieces of work related to affordable housing and homelessness prevention carried out in 2016. The Affordable Housing Strategy was developed and began implementation. Through the strategy,
Social Development Plan
ALL OF THE PROJECTS SUPPORTING THIS INITIATIVE ARE ON TRACK AND ACHIEVED MAJOR MILESTONES IN 2016.
multiple programs and projects were put in place to increase the supply of affordable housing and reduce homelessness in Edmonton.
THE LOW INCOME TRANSIT PASS received approval as a pilot program from City Council and the Government of Alberta. The program will provide a subsidized monthly pass to individuals and families that are in income thresholds below the Statistics Canada Low Income Cut Off.
THE SOCIAL DEVELOPMENT FRAMEWORK will give City staff a decision-guiding framework based on shared principles, priorities and outcomes around social development. Outcomes include: Social Inclusion, Accessibility, Equity, and Accountability and key priorities include: Poverty Elimination, Homelessness / Affordable Housing, Community Safety, Health and Wellness, and Vibrant Communities.
Impacted Corporate Measures
5.2 Edmontonians’ assessment: connected to community 7.2 Edmontonians’ assessment: safe city 7.3 Edmonton Crime Severity Index
81
Our Progress on The Way Ahead | 2016 Results city of edmonton
The development of the Transit Strategy made great strides in 2016. In June 2016, the comprehensive, three-phase public engagement program initiated in 2015, was completed. This public engagement program was one of the most extensive exercises undertaken by the City of Edmonton, with over 20,000 individuals participating in one of 28 workshops, interacting with the street team on the engagement bus or at 45 community events and through online surveys.
The results of the public engagement and technical analysis were used to inform the development of a Strategic Direction report, which was delivered to Urban Planning Committee in December 2016. This report proposed a set of foundational Pillars and Guiding Principles for transit, which will form the core of the
Transit Strategy & Implementation
IN JUNE 2016, THE COMPREHENSIVE, THREE-PHASE PUBLIC ENGAGEMENT PROGRAM INITIATED IN 2015, WAS COMPLETED.
Transit Strategy. Based on the recommendations from this report, work was initiated on the draft Transit Strategy document and developing a bus network concept to illustrate the strategy principles.
The Transit Strategy is currently being drafted and will be delivered to Council in the third quarter of 2017. A comprehensive What We Heard report is also being finalized for delivery to the public in spring 2017. Concurrently, a business case and budget for the first implementation project - redesign of the bus network plan - is being developed for funding consideration.
Impacted Corporate Measures
3.1 Transit ridership 3.2 Journey to work mode
82
In 2016, great progress was made to advance the Urban Core Developments initiative. The majority of projects and programs in the initiative are on track with a number of key milestones being achieved.
In the downtown, two major milestones achieved were the substantial completion of Roger’s Place and Edmonton Tower. Roger’s Place will be a focal point in the city core that will anchor several developments including Stantec Tower and the JW Marriott, both of which started construction in late 2016. Edmonton Tower is one component of a Civic Accommodation Transformation project that will change the way City staff work and collaborate. In the Quarters, two major projects were completed - the Armature and Hyatt Place - which will catalyze the revitalization of the area. In addition to the major developments, infrastructure
Urban Core Development
THE MAJORITY OF PROJECTS AND PROGRAMS IN THE INITIATIVE ARE ON TRACK WITH A NUMBER OF KEY MILESTONES BEING ACHIEVED.
and streetscaping improvements in the Quarters and Downtown Community Revitalization Levies (CRL) was undertaken in 2016 and will continue in 2017. This work includes drainage upgrades, the Jasper Avenue New Vision, and the implementation of a Downtown Bike Grid.
In the areas outside downtown, servicing on Blatchford began in 2016 and stage 1A is expected to be completed in 2017. Council also approved a district energy system to serve the entire community. Additionally, construction on the Mechanized River Valley Access began in 2016 and is anticipated to be complete by the end of 2017.
Impacted Corporate Measures
1.1 New residential units in mature areas 2.1 Infrastructure density 3.2 Journey to work mode
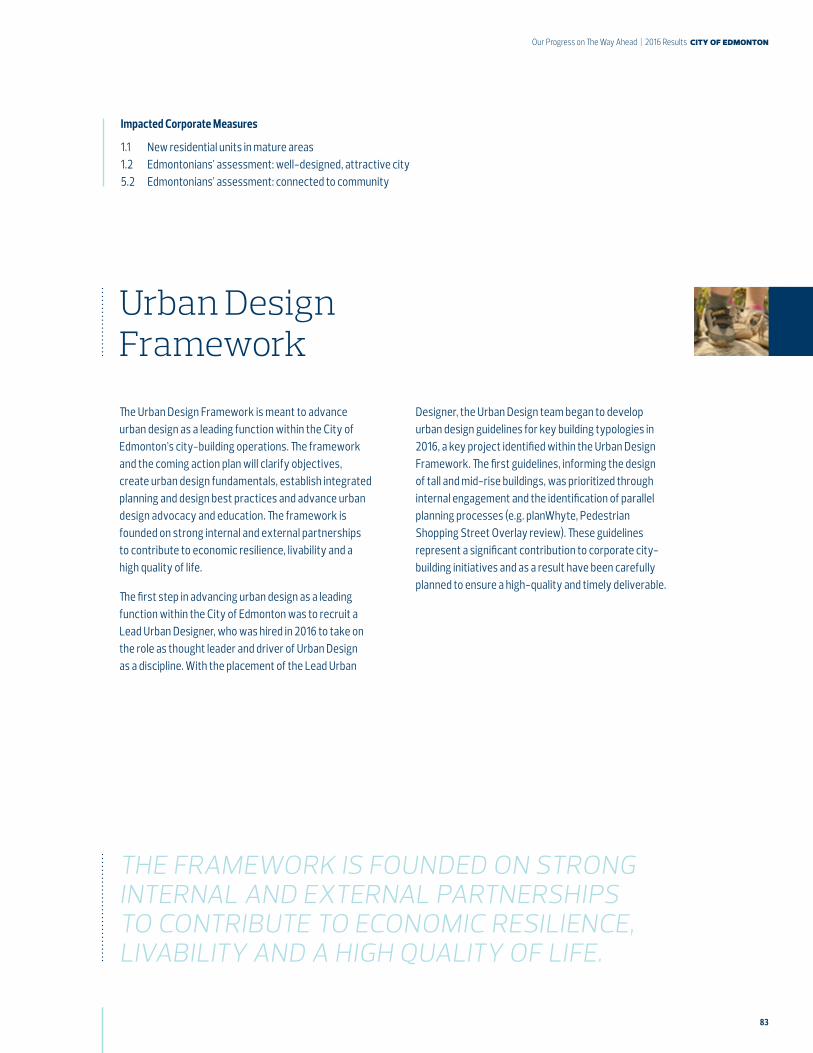
83
Our Progress on The Way Ahead | 2016 Results city of edmonton
The Urban Design Framework is meant to advance urban design as a leading function within the City of Edmonton’s city-building operations. The framework and the coming action plan will clarify objectives, create urban design fundamentals, establish integrated planning and design best practices and advance urban design advocacy and education. The framework is founded on strong internal and external partnerships to contribute to economic resilience, livability and a high quality of life.
The first step in advancing urban design as a leading function within the City of Edmonton was to recruit a Lead Urban Designer, who was hired in 2016 to take on the role as thought leader and driver of Urban Design as a discipline. With the placement of the Lead Urban
Urban Design Framework
THE FRAMEWORK IS FOUNDED ON STRONG INTERNAL AND EXTERNAL PARTNERSHIPS TO CONTRIBUTE TO ECONOMIC RESILIENCE, LIVABILITY AND A HIGH QUALITY OF LIFE.
Designer, the Urban Design team began to develop urban design guidelines for key building typologies in 2016, a key project identified within the Urban Design Framework. The first guidelines, informing the design of tall and mid-rise buildings, was prioritized through internal engagement and the identification of parallel planning processes (e.g. planWhyte, Pedestrian Shopping Street Overlay review). These guidelines represent a significant contribution to corporate city-building initiatives and as a result have been carefully planned to ensure a high-quality and timely deliverable.
Impacted Corporate Measures
1.1 New residential units in mature areas 1.2 Edmontonians’ assessment: well-designed, attractive city 5.2 Edmontonians’ assessment: connected to community
84
baseline A starting point used for comparative purposes when analyzing and reporting results.
corporate outcome The result City Council uses to define success in the journey to achieving the Strategic Goals. These are City Council’s priorities.
corporate outcome measure The evidence that the City of Edmonton has been successful in achieving the outcomes.
indicator The state or condition of something, generally at a community level, for which an organization has limited influence. Indicators are not considered measures of performance as the organization has little ability to move the indicator. Deciding the difference between a performance measure and an indicator can be subjective and level of control is important to discuss when identifying performance measures.
level of control Degree of influence on the desired result. As measures become more strategic in nature, the level of control will decrease.
performance measure A measure of progress toward a desired result. The organization must have the ability to directly influence the desired result. The two general categories of performance measures are effectiveness and efficiency.
performance measurement The use of performance measures to monitor progress, report and analyze results to inform decision making.
strategic goal (10-YEAR STRATEGIC GOAL) An area of significant change required to achieve a future state or vision. The 10-year Strategic Goals describe six areas where City Council believes significant change is required to achieve its vision.
target A measurable performance or success level to be achieved within a specified time period. The Corporate Outcome Measure targets guide Administration in focusing resources to achieve the outcome that City Council expects within the time horizon.
appendix iii
glossary
For more information about the performance of municipal services, please visit dashboard.edmonton.ca
Contact Information: phone: 780-496-5069 email: [email protected]
Corporate Strategy Office City of Edmonton 19th floor, Edmonton Tower 10111-104 Avenue Edmonton, AB T5J 0J4

OUR PROGRESS
ON THE WAY AHEAD 2016 RESULTS