Embed Size (px)
Citation preview

8/8/2019 The Weekly Peak - December 10, 2010
http://slidepdf.com/reader/full/the-weekly-peak-december-10-2010 1/7
Abigail F. Doolittle | [email protected]
December 10, 2010
The Weekly Peak
The Bond Bust Has Begun
There’s no question that the last thirty years have been very good to the bond market.
In fact, the chart above may even paint the picture of what could be called the Great Bond Bull Market with price moving inverse to yield.
While I have been writing for months about thinking the “bond bash” is coming to an end, I think we may have seen the true beginning of that end
this week with the 10-Year Treasury yield spiking almost 40 bps higher in just three days to an intra-day high of 3.33% from 2.95%.
And what might have been the impetus to bring about this potential end to the bull market in bonds?
Interestingly, the most obvious possibility is also all but impossible and perhaps the reason why many seem to be surprised by the 95 bps or almost
1.0% move up in the 10-Year on an intraday basis in less than two months.
This “impossible” possibility is the Federal Reserve raising rates. While Fed Chairman Ben Bernanke said he could raise rates very quickly if need be
in a recent interview, such a raise would be in response to any possible inflation down the road that might stem from QE2 or a need to slow the
economy.
Today’s concern is quite the opposite or possible disinflation, even deflation, as shown by paltry CPI figures while equally unimpressive GDP
numbers point to an already slow economy. Putting aside the fact that raising rates today would throw the economy back into a recession, it is
something that clearly did not happen this week or in any recent time, and thus can be eliminated as the harbinger of the bond bubble’s end.
Rather, I think it makes it sense to take a look at the following factors.
- Stronger prospects for the economy,
- Budget deficit or fiscal worries,
- Inflation expectations/risk, and,
- Loss of confidence in the Fed, its monetary policy and QE2.
This week, we’ve seen the perfect storm of these four factors coming to play and there have been two sources to bring this confluence about.
First, the tax compromise between President Obama and congressional Republicans has been viewed by many as a “second stimulus” for the U.S.
economy with many economists viewing the extension of the Bush-era tax cuts and payroll tax cut as a reason to raise their 2011 GDP forecasts. In
turn, such economic growth could have the potential to bring about a rise in prices or inflation. Simultaneous, however, this tax deal has caused
concerns around its effect on the U.S. budget deficit with some economists pointing to the possibility that the tax breaks could bring the deficit
close to 10% of GDP next year.
So with Obama’s deal-making, three of those four factors occurred that could bring about an overall decline in the bond market.
1
3
5
7
9
11
13
15
17
J an- 78 J an- 82 J an- 86 J an- 90 J an- 94 J an- 98 J an- 02 J an- 06 J an -10
10-Year U.S. Treasury Yield % (Monthly Thru 11/10)

8/8/2019 The Weekly Peak - December 10, 2010
http://slidepdf.com/reader/full/the-weekly-peak-december-10-2010 2/7
Peak Theories Research LLC
The Weekly Peak
December 10, 2010
Please see important disclosure statements at the end of this document. www.peaktheories.com
The first – economic growth – is likely to drive investors toward equities and out of bonds since stocks should perform better than bonds during a
time of economic expansion.
The second – unsustainable fiscal policy – is likely to drive investors toward precious metals and other physical and transferrable stores of intrinsic
value and out of bonds that will suffer from such policy.
The third – inflation – is related to that unsustainable fiscal policy and will be the most powerful force of these three, in my view, to drive
investors out of bonds since rising rates will cause the value of bonds to decline while curbing the value of interest received.
The second source to bring about two of the aforementioned factors, in my view, was Fed Chairman Ben Bernanke’s recent 60 Minutes interview.
For in that interview, Mr. Bernanke hinted at the idea that the Fed’s current round of quantitative easing to help stimulate the economy could be
altered – as in expanded – as needed.
In the past, this communication may have been received by bond investors with cheer since the possibility would exist for a steady stream of the
government’s support for the Treasury market. In fact, this may have been the initial reaction out of investors with the 10-year’s yield dropping to
2.95% on Monday from 3.03% on Friday but with this yield as high as 3.33% on Wednesday, investors seemed to have gotten sick from the
potential for an ongoing QE Drip. Sick because Mr. Bernanke committed to nothing specific about such bond purchases while intimating that the
Fed could be a constant inflationary force on the markets for some time to come.
Mr. Bernanke may be “100% confident” that he and his team could tame inflation quickly by raising rates but that view does not seem to be shared
by ixed income investors and perhaps the early bond vigilantes.
While most of the analysis I have read has attached this week’s spike in yield to growth expectations for the economy, this would seem more
plausible if stocks had rallied significantly.
If investors really thought the tax deal was going to juice the economy, it would be showing up in the equity markets and not the dollar.
And perhaps it will show up in the equity markets over time and I tend to think it has been over recent months – last week in particular perhaps –
and will continue to slowly, but if the particulars related to the tax compromise were likely to bring such growth to the economy in 2011, it seems
to me it would have deserved at least a 1% rally after the fact and especially in light of the steep decline seen in Treasurys.
It is for this reason that I think much of this week’s sell-off has more to do with investors signaling to the Fed that as a collective the fixed income
markets will not tolerate the Fed Chairman’s continued puppeteering especially when his proposed actions could bring about inflation that cannot
be tamed overnight. Put otherwise, I think this week’s decline in Treasurys signals some loss of confidence in Ben Bernanke’s Federal Reserve.
Putting aside any early action out of the bond vigilantes, however, and returning to the idea that increased economic expectations might support a
bust in the bond markets, I think we’re looking at a slow dynamic rather than a dramatic sell-off of bonds as was seen earlier this week.
Rather, I believe investors will assess – cautiously – that the economic recovery is, in fact, underway and creep from the safety of bonds for the
higher returns offered by other investment classes such as equities and commodities.
And while this unwind is likely to be slow, it’s very much underway as the previous charts of an investment grade bond ETF show us.
8/8/2019 The Weekly Peak - December 10, 2010
http://slidepdf.com/reader/full/the-weekly-peak-december-10-2010 3/7
Peak Theories Research LLC
The Weekly Peak
December 10, 2010
Please see important disclosure statements at the end of this document. www.peaktheories.com
The 6-month chart to the left is weak considering that LQD appears to be in somewhat of a near-term downward arc and while there’s support at
various levels, the longer-term chart points to the real support being around $100 or more than 7% lower than current levels.
In addition, as I discussed last week, the S&P 500 earnings yield of about 6.5% suggests that bonds are expensive with the 10-year yield at 3.23%.
The Fed Model points to the idea that equilibrium between the two markets is found when the S&P earnings yield is close to that of the 10-year
yield and, if correct, and it should be noted that it may not be but this non-Fed endorsed methodology does seem to point to meaningful
relationships over longer periods of time, seems to point to the idea that yields are likely to increase as will the S&P 500.
And so it is this inflation expectation/risk and perhaps an increasingly less tolerant stance toward the Fed’s until now artful maneuvering of markets
to create movement that is the most likely driver of the end of the Great Bond Bull Market, in my view,
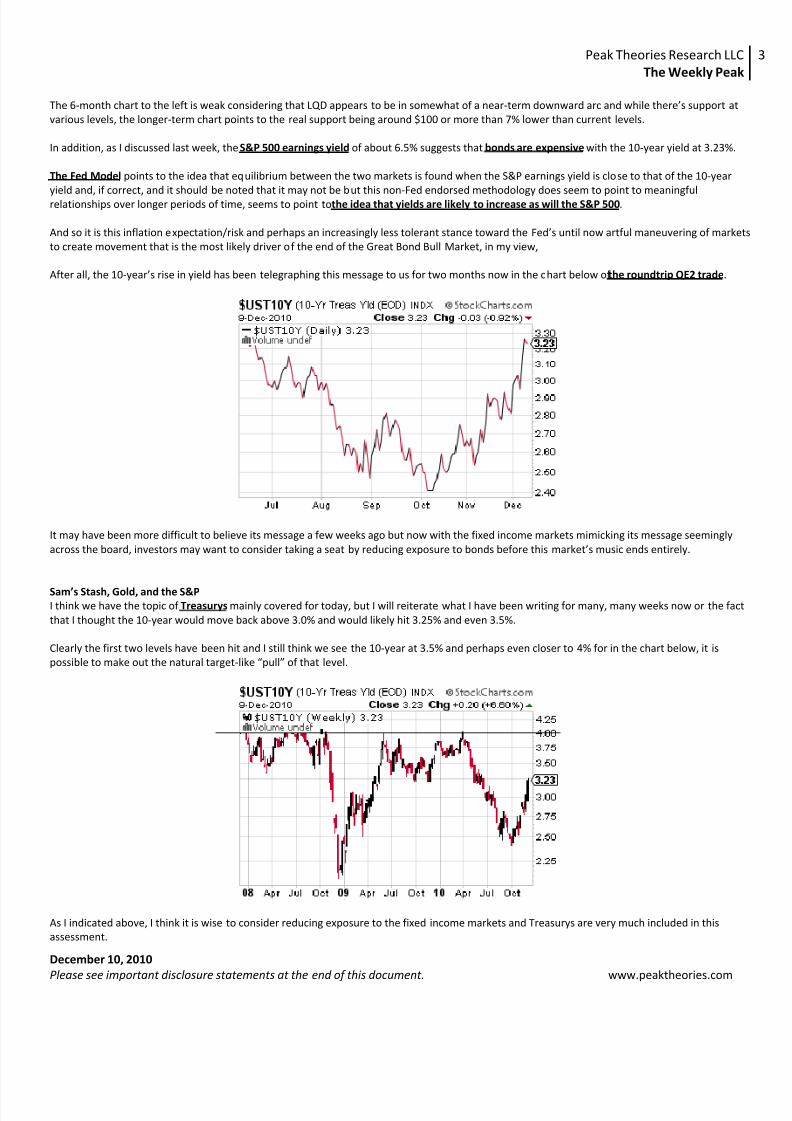
After all, the 10-year’s rise in yield has been telegraphing this message to us for two months now in the chart below of the roundtrip QE2 trade.
It may have been more difficult to believe its message a few weeks ago but now with the fixed income markets mimicking its message seemingly
across the board, investors may want to consider taking a seat by reducing exposure to bonds before this market’s music ends entirely.
Sam’s Stash, Gold, and the S&PI think we have the topic of Treasurys mainly covered for today, but I will reiterate what I have been writing for many, many weeks now or the fact
that I thought the 10-year would move back above 3.0% and would likely hit 3.25% and even 3.5%.
Clearly the first two levels have been hit and I still think we see the 10-year at 3.5% and perhaps even closer to 4% for in the chart below, it is
possible to make out the natural target-like “pull” of that level.
As I indicated above, I think it is wise to consider reducing exposure to the fixed income markets and Treasurys are very much included in this
assessment.
8/8/2019 The Weekly Peak - December 10, 2010
http://slidepdf.com/reader/full/the-weekly-peak-december-10-2010 4/7
Peak Theories Research LLC
The Weekly Peak
December 10, 2010
Please see important disclosure statements at the end of this document. www.peaktheories.com
Lastly, Treasurys remain my barometer around the real severity of the euro-zone debt crisis because I believe that this safe-haven investment will
be ploughed into by investors if a true blow-up in Europe is imminent regardless of inflation expectations here in the U.S. unless such expectations
were all of the sudden grossly prohibitive as they may become at some point down the road.
We’re seeing quite the obvious at this moment, and thus I tend to believe that this round of the sovereign debt crisis was either a dress rehearsal
for what could be “the real thing” down the road or perhaps the seemingly superficial fixes will go deeper and there will be no next round.
All of this being said, if Treasurys were to do something that I do not see in any of the 10-year’s charts, I will take such a spike as a precursor to a
worsening of the debt crisis when and if such a spike does present itself.
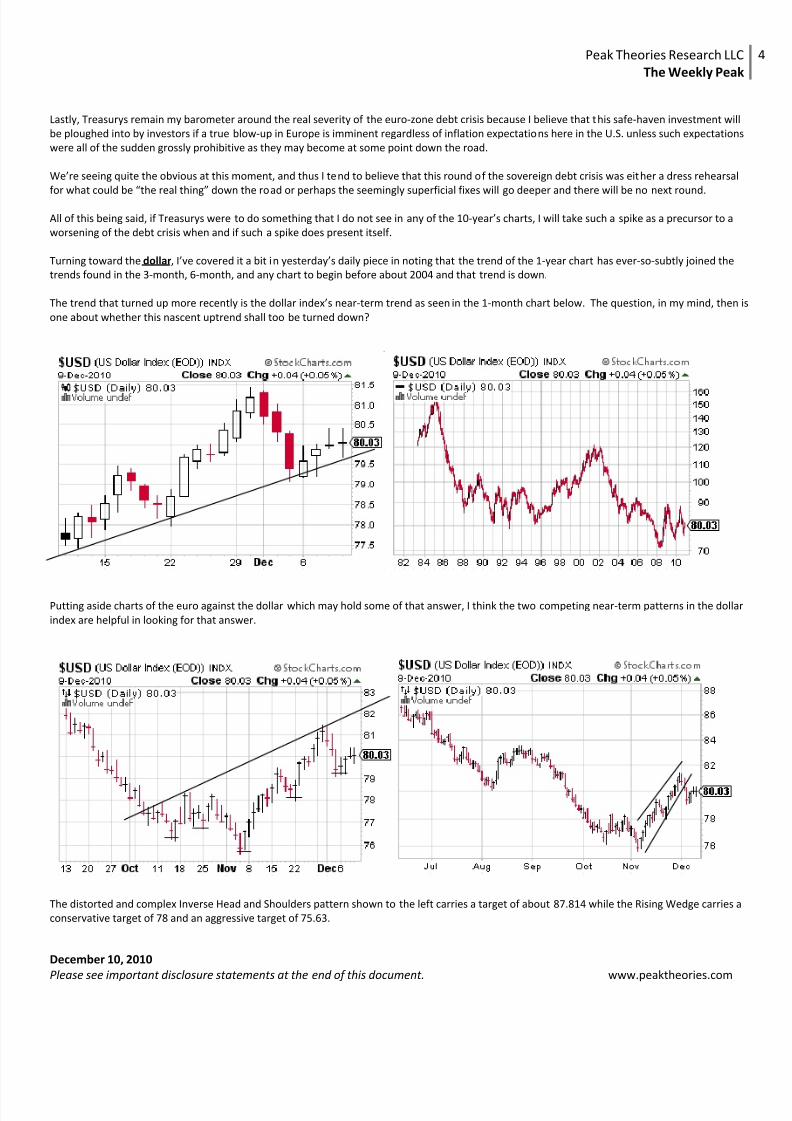
Turning toward the dollar, I’ve covered it a bit in yesterday’s daily piece in noting that the trend of the 1-year chart has ever-so-subtly joined the
trends found in the 3-month, 6-month, and any chart to begin before about 2004 and that trend is down.
The trend that turned up more recently is the dollar index’s near-term trend as seen in the 1-month chart below. The question, in my mind, then is
one about whether this nascent uptrend shall too be turned down?
Putting aside charts of the euro against the dollar which may hold some of that answer, I think the two competing near-term patterns in the dollar
index are helpful in looking for that answer.
The distorted and complex Inverse Head and Shoulders pattern shown to the left carries a target of about 87.814 while the Rising Wedge carries a
conservative target of 78 and an aggressive target of 75.63.
8/8/2019 The Weekly Peak - December 10, 2010
http://slidepdf.com/reader/full/the-weekly-peak-december-10-2010 5/7
Peak Theories Research LLC
The Weekly Peak
December 10, 2010
Please see important disclosure statements at the end of this document. www.peaktheories.com
I tend to believe that the Rising Wedge pattern is likely to carry more weight since it is in some stage of fulfillment as shown in the chart to the
right. Its true fulfillment comes when it hits that 78 and unless this patterns very quickly, as may happen, it should turn the near-term trend back
down.
If this turns out to be the case, if this Rising Wedge fulfills itself, we will be looking once more to the Descending Triangle which has l ingered on the
cusp of confirmation all week with the dollar index playing tug-of-war over 80.
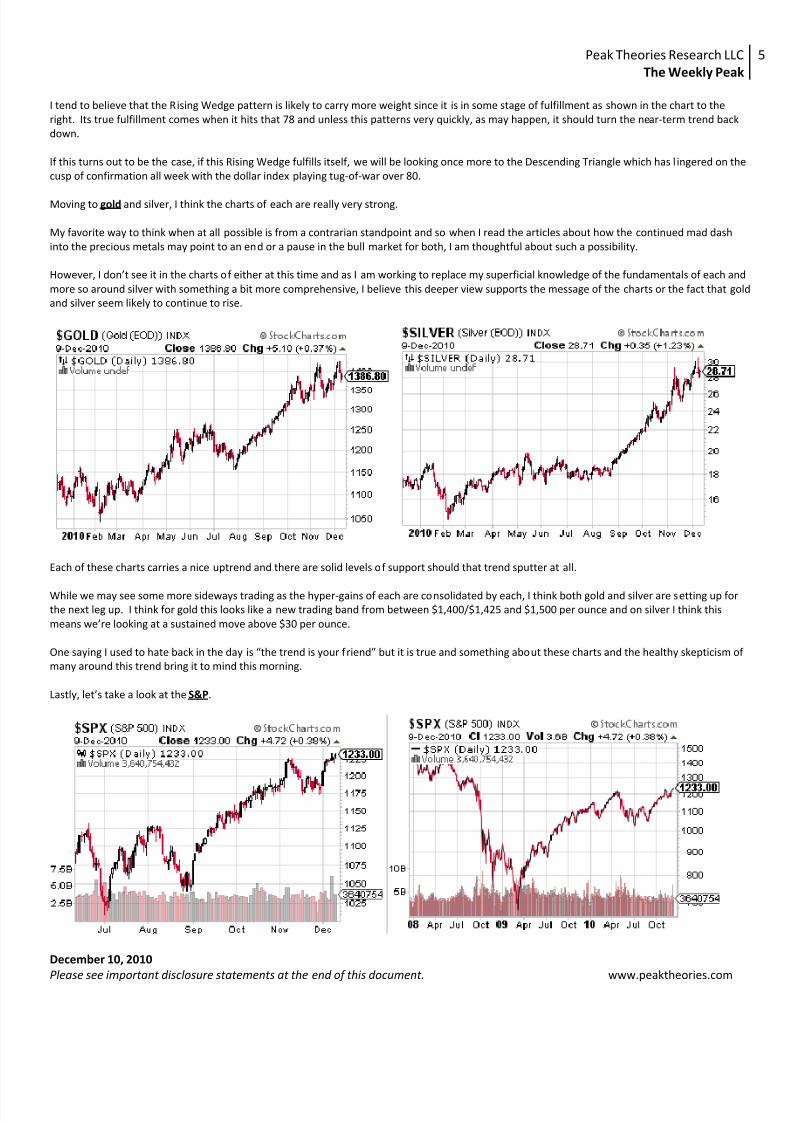
Moving to gold and silver, I think the charts of each are really very strong.
My favorite way to think when at all possible is from a contrarian standpoint and so when I read the articles about how the continued mad dash
into the precious metals may point to an end or a pause in the bull market for both, I am thoughtful about such a possibility.
However, I don’t see it in the charts of either at this time and as I am working to replace my superficial knowledge of the fundamentals of each and
more so around silver with something a bit more comprehensive, I believe this deeper view supports the message of the charts or the fact that gold
and silver seem likely to continue to rise.
Each of these charts carries a nice uptrend and there are solid levels of support should that trend sputter at all.
While we may see some more sideways trading as the hyper-gains of each are consolidated by each, I think both gold and silver are setting up for
the next leg up. I think for gold this looks like a new trading band from between $1,400/$1,425 and $1,500 per ounce and on silver I think this
means we’re looking at a sustained move above $30 per ounce.
One saying I used to hate back in the day is “the trend is your friend” but it is true and something about these charts and the healthy skepticism of
many around this trend bring it to mind this morning.
Lastly, let’s take a look at the S&P.

8/8/2019 The Weekly Peak - December 10, 2010
http://slidepdf.com/reader/full/the-weekly-peak-december-10-2010 6/7
Peak Theories Research LLC
The Weekly Peak
December 10, 2010
Please see important disclosure statements at the end of this document. www.peaktheories.com
I will be the first person to admit that I’m a bit surprised by how well the S&P has held on to the gains from last week’s spike – maybe that was the
long-awaited Obama Rally – and the charts appear to say that the index very well may hold on to those gains without needing to consolidate.
However, there remains the chance that we will see some backwards trading and if so, the levels of support to watch are 1,207 and then a small
band around 1,200 with some back-up at 1,193/1,194 and ultimately 1,171.7.
More in keeping with the S&P’s having kept those gains are levels of resistance found at 1,234/1237, 1,241, 1,247, and then 1,252, which, as I have
been pointing out in my recent daily pieces, is the precise target of the confirmed Inverse Head and Shoulders pattern that we’ve been following
since late August.
My 3 to 6 month target on the S&P remains 1,300 while my investment stance for this time period is Constructive with Immediate-Term Caution.
This is still a cyclical bull moving up in a secular bear and until it clears its next hurdle, I think caution is still advisable and around that 1,172 level in
particular should we visit it again.
Speaking of the secular bear, it is for this reason that my longer-term target for the S&P remains 425 and my investment view bearish.
It is the middle ground that remains up for debate at the moment, but we’re receiving much information around it and when such information
becomes nearly overwhelming, I will set a target for that tricky time period of what is either a bear taking over or a late bull in a long-lived bear.
S&P Targets and Qualitative Views for Various Time Periods December 10, 2010
3 to 6 Months 1,300 Constructive with Immediate-Term Caution (Changed from Constructive on November 22, 2010)
6 to 36 Months TBD TBD
36 Months+ 425 Bearish
As always, thank you for taking the time to read this week’s piece.

8/8/2019 The Weekly Peak - December 10, 2010
http://slidepdf.com/reader/full/the-weekly-peak-december-10-2010 7/7
Peak Theories Research LLC
The Weekly Peak
December 10, 2010
Please see important disclosure statements at the end of this document. www.peaktheories.com
DISCLAIMER
Opinions expressed herein are strictly that of the author and are subject to change without notice and may differ or becontrary to the opinions or recommendations of any professional associations held by the author including the author’semployer. The opinions contained herein should not be taken as specific recommendations to be acted upon. Any pricesor quotations contained herein are indicative only and do not constitute an offer to buy or sell any securities at any givenprice. No representation or warranty, either expressed or implied, is provided in relation to the accuracy, completenessreliability or appropriateness of the information, methodology and any derived price contained within this material. Thesecurities and related financial instruments described herein may not be eligible for sale in all jurisdictions or to certaincategories of investors. The author may have or have had interests long or short positions in the securities or relatedfinancial instruments referred to herein, and may at any time make purchase and/or sales in them. Neither the author oany person or entity related to the author nor the author’s professional associations, including the author’s employer,accept any liability for any loss or damage arising out of the use of all or any part of these materials.