Embed Size (px)
Citation preview
THOMAS BRANCH, OLIVER RITTER, UTE WECKMANN, REINHARD F. SACHSENHOFER AND FRANK SCHILLING 465
IntroductionHigh electrical conductivity for the Whitehill Formationof the Lower Karoo Supergroup was first identified by insitu borehole measurements during SOEKOR’s regionaloil exploration program in the 1960’s (Cole andMcLachlan, 1994). Recently Van Zijl (2006) reviewed theresults of some 280 deep DC electrical soundings thatwere conducted between 1966 and 1980 in the KarooBasin. Most of the sedimentary or meta-sedimentary
rocks of the upper Karoo are associated with resistivitiesin the order of a few hundred Ωm. At some locations,however, the DC sounding curves indicate a significantdrop in the apparent resistivity curves for very longelectrode separations (AB/2 > 10 km). From thesecurves, Van Zijl (2006) estimated resistivities as low as 1 Ωm on average and associated these zones to highconductivities of the Whitehill Formation within theKaroo sedimentary basin. A much deeper high
The Whitehill Formation – a high conductivity marker horizon
in the Karoo Basin
Thomas BranchGeoForschungsZentrum Potsdam, Telegrafenberg, 14473 Potsdam, Germany
AEON-Africa Earth Observatory Network and Department of Geological Sciences,University of Cape Town, Rondebosch 7700, South Africa.
e-mail: [email protected]
Oliver RitterGeoForschungsZentrum Potsdam, Telegrafenberg, 14473 Potsdam, Germany
e-mail: [email protected] (corresponding author)
Ute WeckmannGeoForschungsZentrum Potsdam, Telegrafenberg, 14473 Potsdam, Germany
Universität Potsdam, Institut für Geowissenschaften, Karl-Liebknecht-Strasse 24, 14476 Potsdam, Germanye-mail: [email protected]
Reinhard F. SachsenhoferGeologie und Lagerstättenlehre am Department Angewandte Geowissenschaften und Geophysik,
Montanuniversität, A-8700 Leoben, Austriae-mail: [email protected]
Frank SchillingGeoForschungsZentrum Potsdam, Telegrafenberg, 14473 Potsdam, Germany
e-mail: [email protected]
© 2007 September Geological Society of South Africa
ABSTRACT
Within the Inkaba yeAfrica project, magnetotelluric (MT) data were acquired along three profiles across the Karoo Basin in South
Africa. The entire Karoo Basin and its sedimentary sequences are intersected by a number of deep boreholes, which were drilled
during exploration for coal, oil and uranium. One of the most consistent and prominent features in the electrical conductivity
images is a shallow, regionally continuous, sub-horizontal band of high conductivity that seems to correlate with the Whitehill
Formation. The Whitehill Formation in particular is known to be regionally persistent in composition and thickness and can be
traced throughout the entire Karoo Basin. In the region of our experiments, the Whitehill Formation varies in thickness between
50 to 70 m and consists of pyritic black shales with up to 14 weight % carbonaceous matter. Rocks can exhibit high electrical
conductivity if electronically conducting minerals, such as graphite, are interconnected. To study physical properties and the
maturity of the carbon present in the Whitehill Formation, impedance spectroscopy and vitrinite reflectance were applied to core
samples from the SA1/66 borehole, taken from this formation at a depth range between 2750 m and 2800 m. Vitrinite reflectance
analysis of the pseudo-coal and oil shale rocks indicates that most of the carbon is in the meta-anthracite maturity field,
approaching, in one sample, the “graphite window”. Impedance spectroscopy reveals that the highest electrical conductivities are
associated with the pyrite rich portion of one sample, showing conductivities well above 1 S/m. Recordings on pyrite-poor samples
are less conclusive, with observed conductivities varying in the range of a few S/m to mS/m. Measurements on samples from the
Whilehill Formation, on the other hand, show consistently low resistivities in the range between 4 to 6 Ωm. This result suggests
strongly that the sub-horizontal conductivity anomaly in the MT models is linked with the carbon-rich sequences of the Whitehill
Formation
SOUTH AFRICAN JOURNAL OF GEOLOGY, 2007, VOLUME 110 PAGE 465-476
doi:10.2113/gssajg.110.2/3.465
conductivity zone in South Africa was identified byGough at al. (1973) with magnetometer array studies,the so-called Southern Cape Conductive Belt (SCCB).The location of the east to west striking (SCCB) wasinferred from a reversal of induction vectors for verylarge penetration depths. The anomalous highconductivity zone seems to be situated in the lower crustof the Namaqua Natal Mobile Belt (NNMB) with anapproximate width of 200 km.
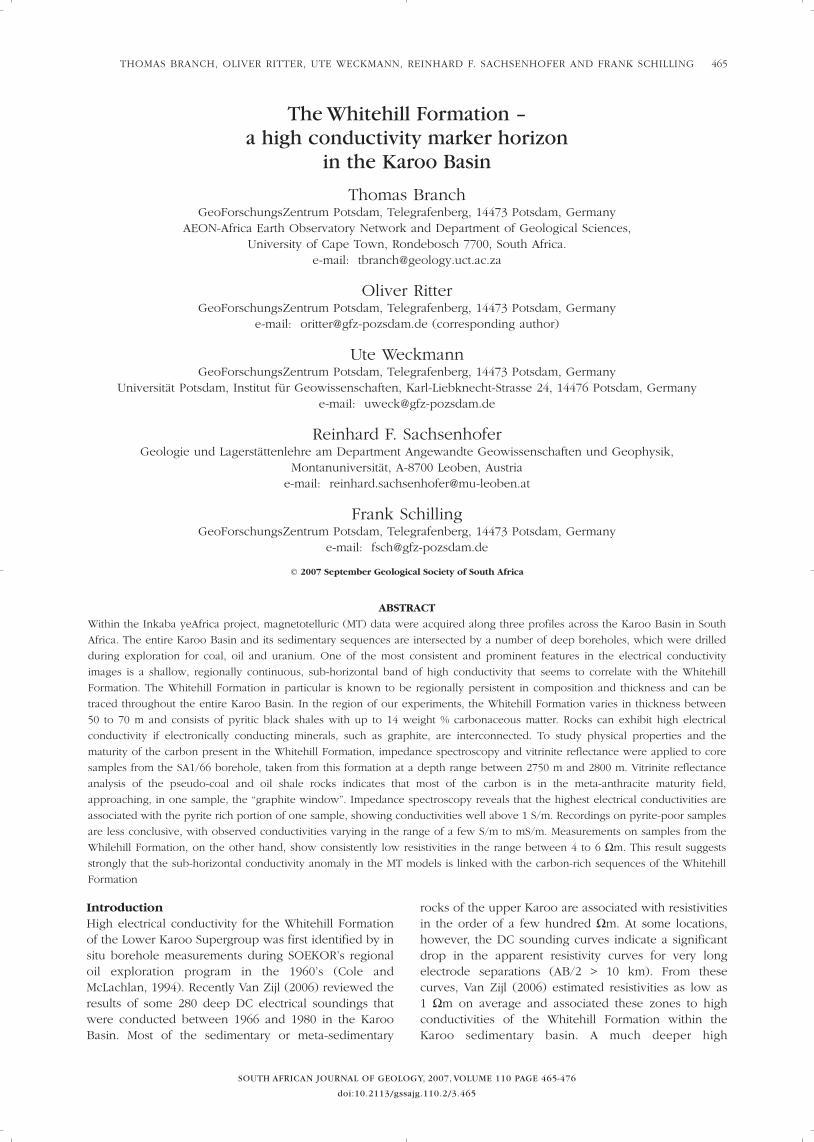
More recently, between 2004 and 2006 high-resolution magnetotelluric (MT) profiles were completedin the southern Karoo. The MT profiles cross the KarooBasin in the NNMB (Figure 1). In the south, starting atPrince Albert, the profile extends northwards across theGreat Karoo to Fraserburg which is situated on top ofthe Great Escarpment. From Fraserburg, the profilecontinues north-eastwards onto the Kaapvaal craton.The surveys are part of the Inkaba yeAfrica project andspecifically targeted the conductive nature of the SCCBalong with the collinear Beattie Magnetic Anomaly
(BMA) (Weckmann et al., 2007a). The BMA was also thetarget of an additional 70 km long profile (MT4), 350 kmfarther east (see also Weckmann et al., 2007b).
One of the most prominent and consistent features inthe MT data is a continuous, near-horizontal conductorat shallow crustal depths (above 6 km). With the muchlarger sounding depths of MT when compared with DC methods, this formation can be identified moreclearly. It is also possible to trace this layer over verylarge distances in the east and north directions.
On the basis of these new MT data, we discuss theobserved high conductivities in the shallow crust in viewof results from laboratory measurements on rocksamples from the Whitehill and underlying formations.Hand samples were obtained from borehole SA1/66, 50 km to the west of the MT profiles, at depths thatcorrelate with the conductor in the MT model. Thesesamples were attained from the South African BoreholeLibrary in Pretoria. At the GeoForschungsZentrum, theirelectrical conductivity was determined using impedance
SOUTH AFRICAN JOURNAL OF GEOLOGY
A HIGH CONDUCTIVITY MARKER HORIZON IN THE KAROO BASIN466
Figure 1. The MT profiles cross the entire Karoo Basin (hatched). Profile MT1 (black line) starts at Prince Albert and extends northwards
away from the exposed Cape Fold Belt across the Great Karoo to Fraserburg. The northern profile segment MT3 (red line) extends in
northeast direction from Fraserberg onto the Kaapval Craton. Profiles MT1 and MT4 (blue line) cross the centre of the Beattie Magnetic
Anomaly (BMA) and the Southern Cape Conductive Belt (SCCB). SA1/66 indicates the location of the deep borehole from which the rock
samples for this investigation were obtained. KL1/65, QU1/65, KW1/67, and CR1/68 mark positions of other boreholes discussed in the
text. CFB – Cape Fold Belt; NNMB – Namaqua Natal Mobile Belt; BMA – Beattie Magnetic Anomaly.
THOMAS BRANCH, OLIVER RITTER, UTE WECKMANN, REINHARD F. SACHSENHOFER AND FRANK SCHILLING
SOUTH AFRICAN JOURNAL OF GEOLOGY
467
spectroscopy. Vitrinite reflectance analysis, carried out atthe Montanuniversität in Leoben, was used to examinethe possible relation to carbon maturation.
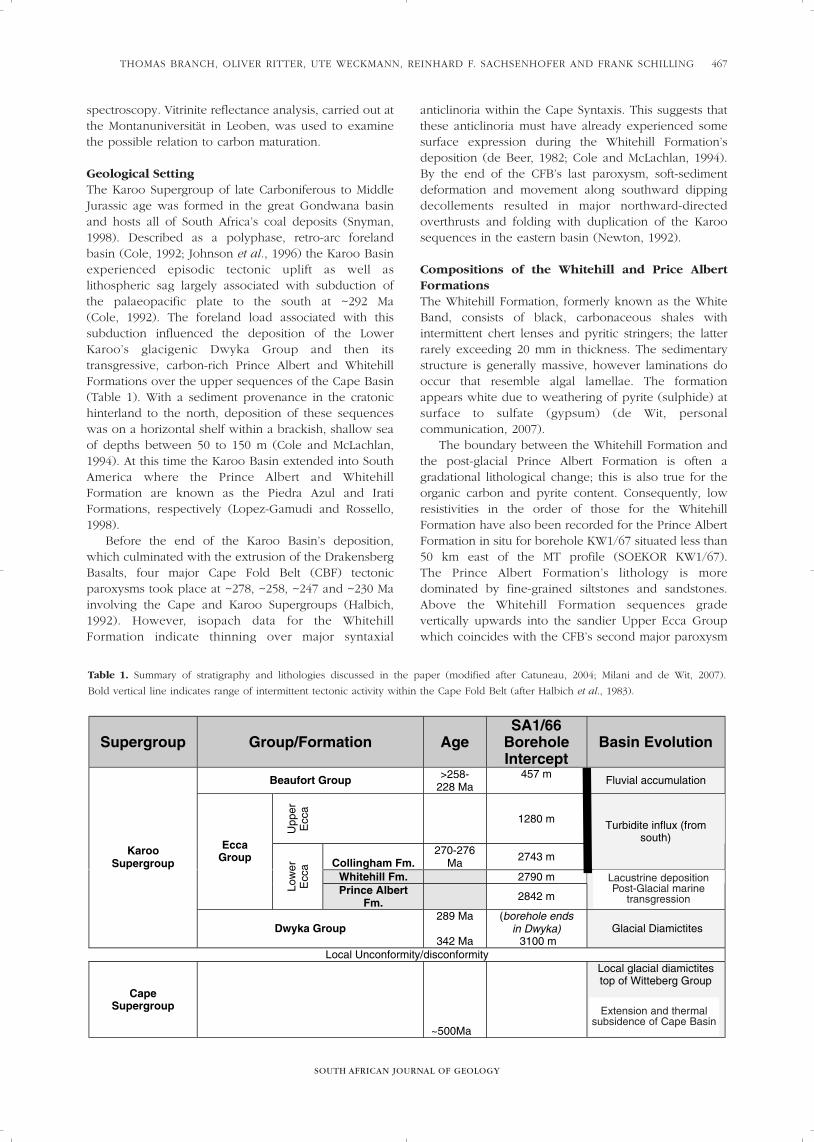
Geological SettingThe Karoo Supergroup of late Carboniferous to MiddleJurassic age was formed in the great Gondwana basinand hosts all of South Africa’s coal deposits (Snyman,1998). Described as a polyphase, retro-arc forelandbasin (Cole, 1992; Johnson et al., 1996) the Karoo Basinexperienced episodic tectonic uplift as well aslithospheric sag largely associated with subduction ofthe palaeopacific plate to the south at ~292 Ma (Cole, 1992). The foreland load associated with thissubduction influenced the deposition of the LowerKaroo’s glacigenic Dwyka Group and then itstransgressive, carbon-rich Prince Albert and WhitehillFormations over the upper sequences of the Cape Basin(Table 1). With a sediment provenance in the cratonichinterland to the north, deposition of these sequenceswas on a horizontal shelf within a brackish, shallow seaof depths between 50 to 150 m (Cole and McLachlan,1994). At this time the Karoo Basin extended into SouthAmerica where the Prince Albert and WhitehillFormation are known as the Piedra Azul and IratiFormations, respectively (Lopez-Gamudi and Rossello,1998).
Before the end of the Karoo Basin’s deposition,which culminated with the extrusion of the DrakensbergBasalts, four major Cape Fold Belt (CBF) tectonicparoxysms took place at ~278, ~258, ~247 and ~230 Mainvolving the Cape and Karoo Supergroups (Halbich,1992). However, isopach data for the WhitehillFormation indicate thinning over major syntaxial
anticlinoria within the Cape Syntaxis. This suggests thatthese anticlinoria must have already experienced somesurface expression during the Whitehill Formation’sdeposition (de Beer, 1982; Cole and McLachlan, 1994).By the end of the CFB’s last paroxysm, soft-sedimentdeformation and movement along southward dippingdecollements resulted in major northward-directedoverthrusts and folding with duplication of the Karoosequences in the eastern basin (Newton, 1992).
Compositions of the Whitehill and Price AlbertFormationsThe Whitehill Formation, formerly known as the WhiteBand, consists of black, carbonaceous shales withintermittent chert lenses and pyritic stringers; the latterrarely exceeding 20 mm in thickness. The sedimentarystructure is generally massive, however laminations dooccur that resemble algal lamellae. The formationappears white due to weathering of pyrite (sulphide) atsurface to sulfate (gypsum) (de Wit, personalcommunication, 2007).
The boundary between the Whitehill Formation andthe post-glacial Prince Albert Formation is often agradational lithological change; this is also true for theorganic carbon and pyrite content. Consequently, lowresistivities in the order of those for the WhitehillFormation have also been recorded for the Prince AlbertFormation in situ for borehole KW1/67 situated less than50 km east of the MT profile (SOEKOR KW1/67). The Prince Albert Formation’s lithology is moredominated by fine-grained siltstones and sandstones.Above the Whitehill Formation sequences gradevertically upwards into the sandier Upper Ecca Groupwhich coincides with the CFB’s second major paroxysm
Table 1. Summary of stratigraphy and lithologies discussed in the paper (modified after Catuneau, 2004; Milani and de Wit, 2007).
Bold vertical line indicates range of intermittent tectonic activity within the Cape Fold Belt (after Halbich et al., 1983).
Supergroup Group/Formation AgeSA1/66
BoreholeIntercept
Basin Evolution
Beaufort Group >258-228 Ma
457 m Fluvial accumulation
Upp
erE
cca
1280 m
Collingham Fm.270-276
Ma 2743 m
Turbidite influx (fromsouth)
Whitehill Fm. 2790 m
EccaGroup
Low
erE
cca
Prince AlbertFm.
2842 m
Lacustrine depositionPost-Glaciial marine
transgression
KarooSupergroup
Dwyka Group289 Ma
342 Ma
(borehole endsin Dwyka) 3100 m
Glacial Diamictites
Local Unconformity/disconformity
CapeSupergroup
~500Ma
Local glacial diamictitestop of Witteberg Group
Extension and thermalsubsidence: of Cape
Basin.
Lacustrine depositionPost-Glacial marine
transgression
Extension and thermalsubsidence of Cape Basin
SOUTH AFRICAN JOURNAL OF GEOLOGY
A HIGH CONDUCTIVITY MARKER HORIZON IN THE KAROO BASIN468
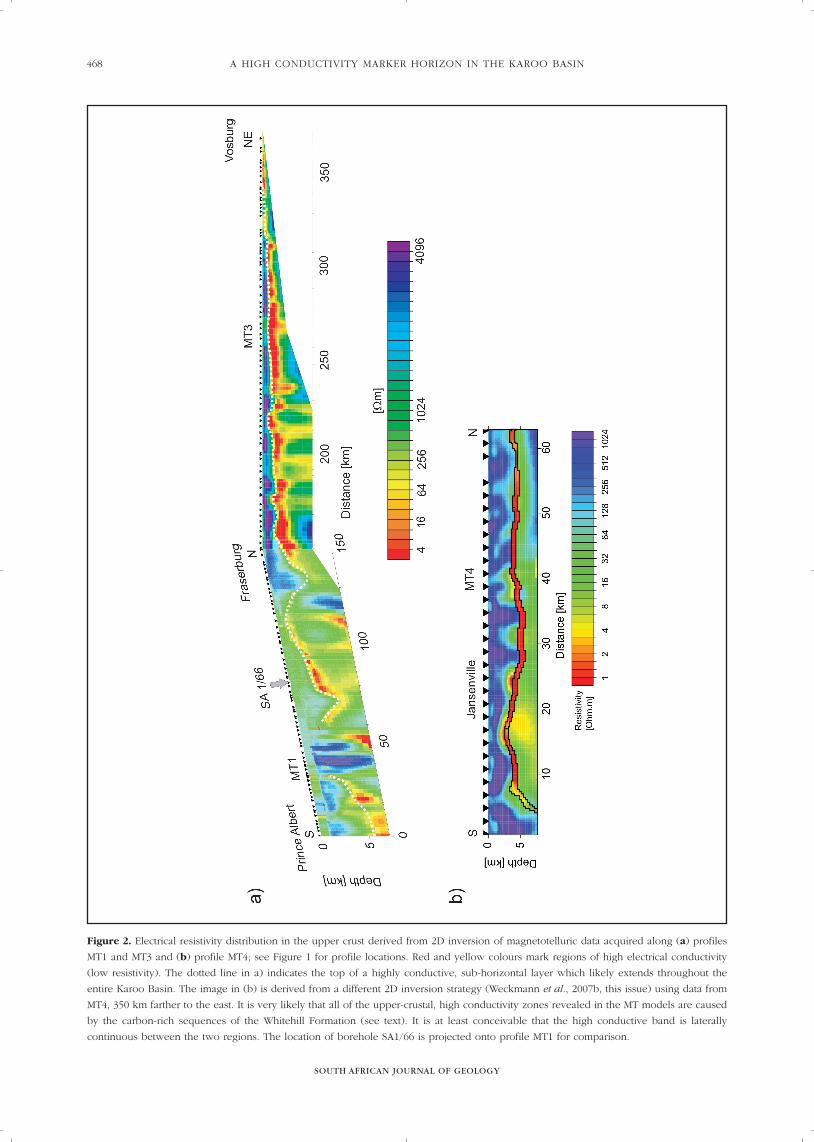
Figure 2. Electrical resistivity distribution in the upper crust derived from 2D inversion of magnetotelluric data acquired along (a) profiles
MT1 and MT3 and (b) profile MT4; see Figure 1 for profile locations. Red and yellow colours mark regions of high electrical conductivity
(low resistivity). The dotted line in a) indicates the top of a highly conductive, sub-horizontal layer which likely extends throughout the
entire Karoo Basin. The image in (b) is derived from a different 2D inversion strategy (Weckmann et al., 2007b, this issue) using data from
MT4, 350 km farther to the east. It is very likely that all of the upper-crustal, high conductivity zones revealed in the MT models are caused
by the carbon-rich sequences of the Whitehill Formation (see text). It is at least conceivable that the high conductive band is laterally
continuous between the two regions. The location of borehole SA1/66 is projected onto profile MT1 for comparison.
THOMAS BRANCH, OLIVER RITTER, UTE WECKMANN, REINHARD F. SACHSENHOFER AND FRANK SCHILLING
SOUTH AFRICAN JOURNAL OF GEOLOGY
469
characterized by deeper water conditions, submarine fandeposits and distal turbidites (Cole, 1992).
Maximum COrg values of 7.9% and 5.1% for theCollingham Formation (above the Whitehill Formation)and Prince Albert Formation (below the WhitehillFormation) respectively have been reported by Cole andMcLachlan (1994). However, COrg contents areconsistently higher for the Whitehill Formation and thisis especially the case for boreholes proximal to the MTprofiles (such as QU1/65 and KL1/65) with a COrg
maximum of 14.8% and 8.1% respectively. In general,the southernmost basin had a 3.0% higher COrg contentthan samples from the north of the basin; this is largelydue to gasification effects from the doleritic dike swarmsin the north (Cole and McLachlan, 1994).
The entire Lower Karoo sequence has pervasivepyritic stringers, yet these become distinctly morecommon as one stratigraphically approaches theWhitehill Formation (Cole and McLachlan, 1994;SOEKOR KW 1/67). In borehole CR1/68, some 400 kmto the east of profile MT1 and in the vicinity of profileMT4, between the depths of 3670 m to 3717 m, pyrite reaches a rock average of 10% (SOEKOR CR1/68). Carbonaceous stringers containing pyrite crystalsare found in several boreholes (Cole and McLachlan,1994).
Metamorphic grade for the Karoo Basin increasesfrom un-metamorphosed to lower anchi-grade (150º C /3.5 kbar) in the north to epizonal (350º C / 2.5 kbar)adjacent to the CFB in the south (Halbich, 1983). Thisincludes four types of metamorphism: burial, dynamo-thermal (related the CFB), contact (from dolerite swarmsin the north), and hydrothermal (related to the extrusionof the Drakensberg basalts). Rocks in the tectonictransition in the frontal ranges of the Cape Fold Beltzone have undergone significant deformation (Craddocket al., 2007). Regional fluid inclusion analyses on quartzand calcite from syntectonic veins revealed temperaturesbetween 150 to 200°C and pressures between 1 and 2kbar during the peak of deformation for this region(Egle, 1996; Egle et al., 1998). For carbonaceoushorizons this resulted in maturation of organic matterand the formation of coal. Contact metamorphism from pervasive doleritic intrusions which werecontemporaneous with the Drakensberg flood basalts,
along with a lack of reservoirs for the Karoo Basin,ultimately destroyed the Whitehill Formation’spetroleum potential (Cole and McLachlan, 1994).
Magnetotelluric dataFrom 2004 to 2006, MT data was recorded in threeexperiments along four profiles crossing the KarooBasin. Profiles MT1 and MT3 (Figure 1) followed themajor Agulhas-Karoo transect of the Inkaba yeAfricaproject and covered a section from Prince Albert toFraserburg (MT1), crossing the BMA and the SCCB, andfurther on towards Strydenberg (MT3). The 70 km longprofile MT4 is centred on Jansenville, 350 km farther east(see Weckmann et al., 2007b, this issue). Naturalelectromagnetic field variations were recorded with asite spacing of 2-3 km in a period range from 0.001 s –1000 s along all profiles. Data analysis and interpretationof profile MT1 are described in detail in Weckmann et al.(2007a) and in Weckmann et al. (2007b, this issue) forMT4. Figure 2 shows an image of the subsurfaceelectrical conductivity distribution of the upper 5 to 7 km across the entire Karoo Basin. The sectionfollowing MT1 is taken from a 2D inversion modelpresented in Weckmann et al. (2007a). The north-eastward extension along MT3 is a 2D inversion resultusing only the short period data (0.01 s to 1 s) frompreliminary (in-field) processing. The restriction to asmaller period band is necessary as most of the longerperiod data require re-processing (using a remotereference) to increase data quality in the so-called deadband at around 10 s. Strike and dimensionality analysisfor the short period data reveals a predominantly layered(1D) conductivity distribution. This is consistent with thegeological setting of sub-horizontal layering of the Karoosediments in the upper crust (< ~5 km). At periods >1 s,the longest periods of our analysis, the data show amore pronounced strike direction of approximately 45°.Eventually, we rotated the data accordingly prior to theinversion.
The 2D inversion algorithm after Rodi and Mackie(2001) was used to fit the MT data of both polarisations,representing electrical current systems parallel (E-polarisation) and perpendicular (B-polarisation) tothe strike direction of the conductive structures of thesubsurface. The regularization parameter t was set to 30
Table 2. Description of the samples attained from the South African Borehole Library in Pretoria for further examination. The second
column gives the results of the impedance spectroscopy measurements; see Table 3 for details. Par. /perp.: measurements were taken
parallel/perpendicular to the bedding of the sample.
Resistivity Resistivity Depth
Sample m (min) m (max) Formation (m) ID Lithology
A 4 6 Whitehill 2789 9 Laminated fragile black shale. Trace pyrite and Fe-oxidation along
fabric (Figure 3a).
B 363 4917 Prince Albert 2817 8 Laminated black shale. Pervasive irregular calcite veins (Figure 3b).
C (par.) 0.008 1710 Prince Albert 2863 1 Massive black-grey mudrock. One thick pyritic stringer (Figure 3c).
C (perp.) 46 322
D (par.) 485 808 Prince Albert 2874 6 Homogenous, massive black-grey mudrock (Figure 3d).
D (perp.) 447 805
after computing an L-curve, trading-off misfit againstroughness. For the inversion, emphasis was placed onfitting the MT phases, setting an error floor of 0.6°,whereas the apparent resistivities of the E-polarisationdata was down-weighted (error floor 100%) to avoidproblems with static shift effects. The error floor of theB-polarisation apparent resistivities was set to 5%. Withthese settings, the inversion of MT3, as shown in Figure2, achieved an rms misfit of 2.1. Clearly, with the limiteddata set this model must be taken as preliminary; weblanked areas where we cannot be certain how wellstructures are resolved.
However, the existence and the position of the sub-horizontal high conductivity band are well resolved.This conductive layer can be traced from the southernend of profile MT1 almost 200 km further to thenortheast. From a depth of more than 5 km in the south,the layer becomes continuously shallower towards thenortheast and outcrops in the vicinity of Vosburg. The resistivities of this layer along profiles MT1 and MT3 are in the order of 1 to 4 Ωm with an averagethickness of approximately 300 - 500 m. Modellingstudies based on the inclusion of tear zones in theinversion along profile MT4, 350 km further to the east,indicate that this layer can be much thinner (~100 m) iflower resistivities (0.3 Ωm) are assumed (Weckmann et al., 2007b).
In summary, the MT data reveal a continuous,conductive layer - probably associated with the WhitehillFormation – that can be traced throughout the entireKaroo Basin in a north to south direction and possiblyfor another 350 km towards the east.
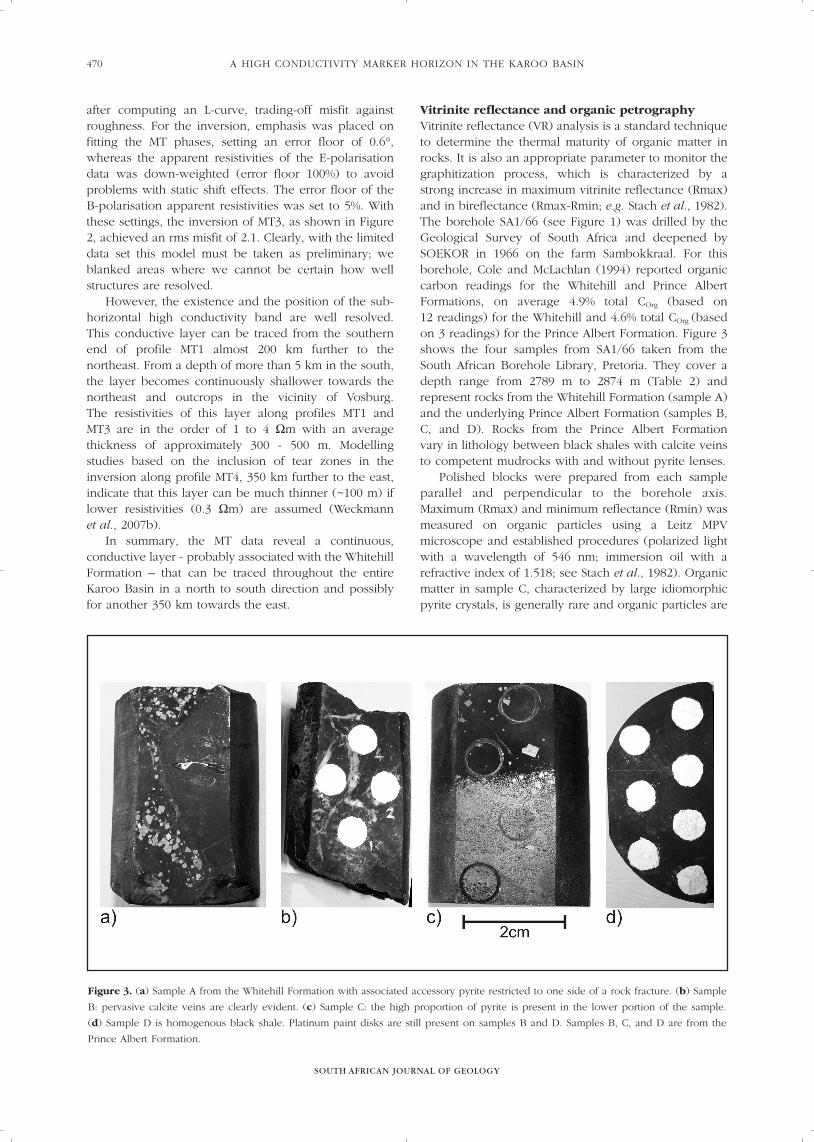
Vitrinite reflectance and organic petrographyVitrinite reflectance (VR) analysis is a standard techniqueto determine the thermal maturity of organic matter inrocks. It is also an appropriate parameter to monitor thegraphitization process, which is characterized by astrong increase in maximum vitrinite reflectance (Rmax)and in bireflectance (Rmax-Rmin; e.g. Stach et al., 1982).The borehole SA1/66 (see Figure 1) was drilled by theGeological Survey of South Africa and deepened bySOEKOR in 1966 on the farm Sambokkraal. For thisborehole, Cole and McLachlan (1994) reported organiccarbon readings for the Whitehill and Prince AlbertFormations, on average 4.9% total COrg (based on 12 readings) for the Whitehill and 4.6% total COrg (basedon 3 readings) for the Prince Albert Formation. Figure 3shows the four samples from SA1/66 taken from theSouth African Borehole Library, Pretoria. They cover adepth range from 2789 m to 2874 m (Table 2) andrepresent rocks from the Whitehill Formation (sample A)and the underlying Prince Albert Formation (samples B,C, and D). Rocks from the Prince Albert Formation vary in lithology between black shales with calcite veinsto competent mudrocks with and without pyrite lenses.
Polished blocks were prepared from each sampleparallel and perpendicular to the borehole axis.Maximum (Rmax) and minimum reflectance (Rmin) wasmeasured on organic particles using a Leitz MPVmicroscope and established procedures (polarized lightwith a wavelength of 546 nm; immersion oil with arefractive index of 1.518; see Stach et al., 1982). Organicmatter in sample C, characterized by large idiomorphicpyrite crystals, is generally rare and organic particles are
SOUTH AFRICAN JOURNAL OF GEOLOGY
A HIGH CONDUCTIVITY MARKER HORIZON IN THE KAROO BASIN470
Figure 3. (a) Sample A from the Whitehill Formation with associated accessory pyrite restricted to one side of a rock fracture. (b) Sample
B: pervasive calcite veins are clearly evident. (c) Sample C: the high proportion of pyrite is present in the lower portion of the sample.
(d) Sample D is homogenous black shale. Platinum paint disks are still present on samples B and D. Samples B, C, and D are from the
Prince Albert Formation.
THOMAS BRANCH, OLIVER RITTER, UTE WECKMANN, REINHARD F. SACHSENHOFER AND FRANK SCHILLING
SOUTH AFRICAN JOURNAL OF GEOLOGY
471
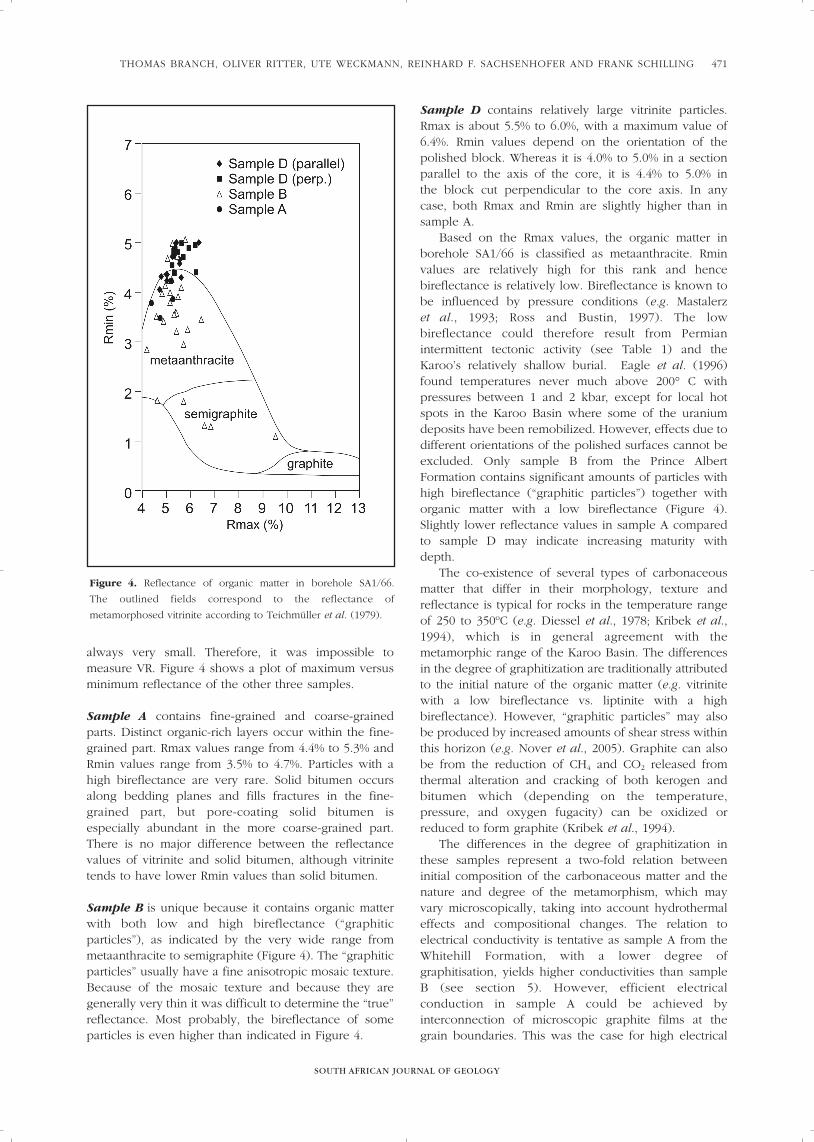
always very small. Therefore, it was impossible tomeasure VR. Figure 4 shows a plot of maximum versusminimum reflectance of the other three samples.
Sample A contains fine-grained and coarse-grainedparts. Distinct organic-rich layers occur within the fine-grained part. Rmax values range from 4.4% to 5.3% andRmin values range from 3.5% to 4.7%. Particles with ahigh bireflectance are very rare. Solid bitumen occursalong bedding planes and fills fractures in the fine-grained part, but pore-coating solid bitumen isespecially abundant in the more coarse-grained part.There is no major difference between the reflectancevalues of vitrinite and solid bitumen, although vitrinitetends to have lower Rmin values than solid bitumen.
Sample B is unique because it contains organic matterwith both low and high bireflectance (“graphiticparticles”), as indicated by the very wide range frommetaanthracite to semigraphite (Figure 4). The “graphiticparticles” usually have a fine anisotropic mosaic texture.Because of the mosaic texture and because they aregenerally very thin it was difficult to determine the “true”reflectance. Most probably, the bireflectance of someparticles is even higher than indicated in Figure 4.
Sample D contains relatively large vitrinite particles.Rmax is about 5.5% to 6.0%, with a maximum value of6.4%. Rmin values depend on the orientation of thepolished block. Whereas it is 4.0% to 5.0% in a sectionparallel to the axis of the core, it is 4.4% to 5.0% in the block cut perpendicular to the core axis. In anycase, both Rmax and Rmin are slightly higher than insample A.
Based on the Rmax values, the organic matter inborehole SA1/66 is classified as metaanthracite. Rminvalues are relatively high for this rank and hencebireflectance is relatively low. Bireflectance is known tobe influenced by pressure conditions (e.g. Mastalerz et al., 1993; Ross and Bustin, 1997). The lowbireflectance could therefore result from Permianintermittent tectonic activity (see Table 1) and theKaroo’s relatively shallow burial. Eagle et al. (1996)found temperatures never much above 200° C withpressures between 1 and 2 kbar, except for local hotspots in the Karoo Basin where some of the uraniumdeposits have been remobilized. However, effects due todifferent orientations of the polished surfaces cannot beexcluded. Only sample B from the Prince AlbertFormation contains significant amounts of particles withhigh bireflectance (“graphitic particles”) together withorganic matter with a low bireflectance (Figure 4).Slightly lower reflectance values in sample A comparedto sample D may indicate increasing maturity withdepth.
The co-existence of several types of carbonaceousmatter that differ in their morphology, texture andreflectance is typical for rocks in the temperature rangeof 250 to 350ºC (e.g. Diessel et al., 1978; Kribek et al.,1994), which is in general agreement with themetamorphic range of the Karoo Basin. The differencesin the degree of graphitization are traditionally attributedto the initial nature of the organic matter (e.g. vitrinitewith a low bireflectance vs. liptinite with a highbireflectance). However, “graphitic particles” may alsobe produced by increased amounts of shear stress withinthis horizon (e.g. Nover et al., 2005). Graphite can alsobe from the reduction of CH4 and CO2 released fromthermal alteration and cracking of both kerogen andbitumen which (depending on the temperature,pressure, and oxygen fugacity) can be oxidized orreduced to form graphite (Kribek et al., 1994).
The differences in the degree of graphitization inthese samples represent a two-fold relation betweeninitial composition of the carbonaceous matter and thenature and degree of the metamorphism, which mayvary microscopically, taking into account hydrothermaleffects and compositional changes. The relation toelectrical conductivity is tentative as sample A from theWhitehill Formation, with a lower degree ofgraphitisation, yields higher conductivities than sampleB (see section 5). However, efficient electricalconduction in sample A could be achieved byinterconnection of microscopic graphite films at thegrain boundaries. This was the case for high electrical
Figure 4. Reflectance of organic matter in borehole SA1/66.
The outlined fields correspond to the reflectance of
metamorphosed vitrinite according to Teichmüller et al. (1979).
conductivities of black shales from the Münsterland-1borehole where grain-boundary carbon was depositedduring pyrolisis of organic carbon (Duba et al., 1988).
Apart from the primary organic matter, solid bitumenis a common constituent in most samples. It is especiallyenriched in sample A where it is concentrated alongbedding planes, fills fractures or coats pores in coarse-grained material. Solid bitumen has also been describedfrom the Whitehill Formation by Cole and McLachlan(1994).
Impedance spectroscopy (IS)Impedance spectroscopy is used to measure a rocksample’s complex electrical impedance (Z). By measuring the phase shift between an appliedoscillating potential difference and the measured currentacross a sample, the method identifies both the sample’sresistivity and dielectric properties (Barsoukov andMacDonald, 2005). Out of phase polarization of boundcharges within the applied oscillating fields results in acharge accumulation at grain boundaries and electrodes.Such dielectric effects are strongly dependant on themicrostructure, porosity and composition of the sample(Guegen and Palciauskas, 1994). At higher frequenciesthis results in an energy loss which reaches a maximumat the resonant / critical frequency, =1/τ where is thefield’s angular frequency and τ defines the relaxationtime of the polarized bound charges. This capacitiveeffect is incorporated into the imaginary part of Z whileat frequencies approaching that of direct currents thesample’s bulk conductivity can be obtained from the realpart of Z. The bulk properties, grain boundarybehaviour and electrode polarizations can be separatedby their differing time constants.
The complex frequency response of a rock samplecan be interpreted in terms of an analogous electricalcircuit (Guegen and Palciauskas, 1994), composed of acapacitor C in parallel with a resistor R (withconductance G=1/R) and driven by an oscillating voltageV ~eit. In a “Cole-Cole” diagram, the Im(Z) is plottedover the Re(Z). The data points should form a semi-circle with radius R, centred on the Re(Z) axis, while theIm(Z) is at maximum at the resonant/critical frequency.For the lowest frequencies, the imaginary part of Zbecomes 0. The bulk resistivity of a sample is thencalculated at Z0 (0) as a function of the geometry ofthe sample if electrode polarizations can be neglected:
A being the surface area, l the length of the sample.
To prepare the rock samples for IS, they were cutand ground to obtain parallel sides. Samples were thenaerated for a month to dry the ground surfaces.Eventually, circular patches of platinum paint were
applied to the samples using a stencil of 0.8 cm diameterat 0.5 cm spacing (see Figure 3). These platinum paintelectrodes optimize connection with the sample’ssurface area by decreasing the polarization effects of theelectrode-sample interfaces and delimit a specificsurface area from which the bulk conductivity isobtained. Depending on the size of the sample, up toseven different positions to place the electrodes arepossible on one side. Electrodes were connected to theplatinum locations with a rubber sealed clamp. The datawere measured with a BAS Zahner IMP6 potentiostatand analyzed using the Thales software package(http://www.bioanalytical.com/products/ec.html) at theGeoForschungsZentrum.
The experiments were conducted in a two-polearrangement. However, four terminals were connectedto the sample through the potentiostat which contains acontrol loop to maintain a constant stimulus voltage forthe frequency response analyzer. The current wasprovided to the sample through a counter electrode andthe output current was measured by a working electrodewhile two reference electrodes measured the potentialdifference between the poles.
Results of the IS for the samples of borehole SA1/66are summarized in Table 2 and shown for individualsamples and electrode configurations in Figure 5; furtherdetails of the IS measurements are given in Table 3. For most of the samples and electrode combinations acomplete impedance arc could not be obtained by themeasurements. This effect is caused by high impedancesof the samples at a specific electrode point and relatedelectrode effects at lower frequencies. However,extrapolated values for Z0 can be computed based on anidealized, simple RC-model if the high frequency part ofthe impedance data are used (solid lines in the diagramsof Figure 5). For the rock samples of the Prince AlbertFormation (samples B, C, and D), resistivities varytremendously between 4917 Ωm and 0.008 Ωm. One recording of sample C, in particular, revealsexceptional conductivity values. For measurementstaken through a pyrite stringer (Figure 3c; bottomportion of the sample) the sample responded almost likea perfect (metallic) conductor. When measurementswere taken on pyrite free portions, the measured rockresistivity values were very high (> 1000 Ωm).
Sample B also exhibits a broad range of bulkresistivities of between 363 Ωm and 4917 Ωm. This broad range can be explained by the pervasivecalcite veining that is dominant throughout the sample(Figure 3b). These calcite veins prevent charge transportacross the sample. This infilling of laterally extensivecracks with calcite noticeably destroys secondaryporosity and was described in borehole KW1/67(SOEKOR KW1/67). For one recording on sample B wemanaged to set the electrode points avoiding theresistive calcite veins; the resulting resistivities areintermediate at 363 Ωm.
For sample A from the Whitehill Formation thereadings were more consistent and Z0 could be
SOUTH AFRICAN JOURNAL OF GEOLOGY
A HIGH CONDUCTIVITY MARKER HORIZON IN THE KAROO BASIN472

THOMAS BRANCH, OLIVER RITTER, UTE WECKMANN, REINHARD F. SACHSENHOFER AND FRANK SCHILLING
SOUTH AFRICAN JOURNAL OF GEOLOGY
473
Figure 5. Impedance Z plotted as a “Cole-Cole” diagram. Solid lines represent a RC- model to fit the measured data (black diamonds). The
bulk resistivity of a rock sample is calculated from the low frequency (or DC) impedance Z0 (see text). Sample D in (a) and (b) shows
consistently high impedance values with a bulk rock resistivity varying between approximately 450 Ωm and 800 Ωm (see also Table 2).
Sample C in (c) and (d) shows immensely varying conductivities, ranging over 5 orders of magnitude. The high conductivity is largely
controlled by the presence of a pyritic-rich stringer. Sample B in (e) indicates high resistivity, probably caused by the presence of calcite
veins. In one of the readings with lower resistivity values, these calcite veins may have been avoided. Sample A from the Whitehill
Formation in (f) has consistently low resistivities on the order of 5 Ωm.
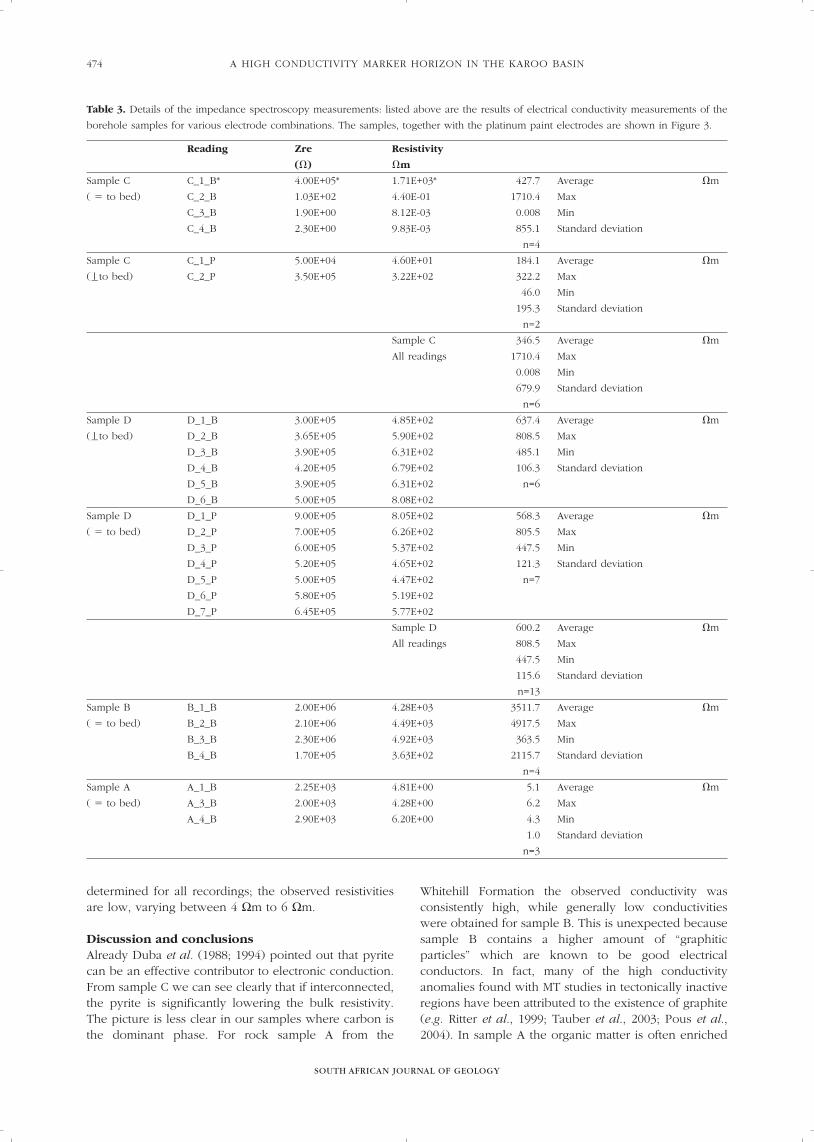
determined for all recordings; the observed resistivitiesare low, varying between 4 Ωm to 6 Ωm.
Discussion and conclusionsAlready Duba et al. (1988; 1994) pointed out that pyritecan be an effective contributor to electronic conduction.From sample C we can see clearly that if interconnected,the pyrite is significantly lowering the bulk resistivity.The picture is less clear in our samples where carbon isthe dominant phase. For rock sample A from the
Whitehill Formation the observed conductivity wasconsistently high, while generally low conductivitieswere obtained for sample B. This is unexpected becausesample B contains a higher amount of “graphiticparticles” which are known to be good electricalconductors. In fact, many of the high conductivityanomalies found with MT studies in tectonically inactiveregions have been attributed to the existence of graphite(e.g. Ritter et al., 1999; Tauber et al., 2003; Pous et al.,2004). In sample A the organic matter is often enriched
SOUTH AFRICAN JOURNAL OF GEOLOGY
A HIGH CONDUCTIVITY MARKER HORIZON IN THE KAROO BASIN474
Table 3. Details of the impedance spectroscopy measurements: listed above are the results of electrical conductivity measurements of the
borehole samples for various electrode combinations. The samples, together with the platinum paint electrodes are shown in Figure 3.
Reading Zre Resistivity
() m
Sample C C_1_B* 4.00E+05* 1.71E+03* 427.7 Average m
( to bed) C_2_B 1.03E+02 4.40E-01 1710.4 Max
C_3_B 1.90E+00 8.12E-03 0.008 Min
C_4_B 2.30E+00 9.83E-03 855.1 Standard deviation
n=4
Sample C C_1_P 5.00E+04 4.60E+01 184.1 Average m
( to bed) C_2_P 3.50E+05 3.22E+02 322.2 Max
46.0 Min
195.3 Standard deviation
n=2
Sample C 346.5 Average m
All readings 1710.4 Max
0.008 Min
679.9 Standard deviation
n=6
Sample D D_1_B 3.00E+05 4.85E+02 637.4 Average m
( to bed) D_2_B 3.65E+05 5.90E+02 808.5 Max
D_3_B 3.90E+05 6.31E+02 485.1 Min
D_4_B 4.20E+05 6.79E+02 106.3 Standard deviation
D_5_B 3.90E+05 6.31E+02 n=6
D_6_B 5.00E+05 8.08E+02
Sample D D_1_P 9.00E+05 8.05E+02 568.3 Average m
( to bed) D_2_P 7.00E+05 6.26E+02 805.5 Max
D_3_P 6.00E+05 5.37E+02 447.5 Min
D_4_P 5.20E+05 4.65E+02 121.3 Standard deviation
D_5_P 5.00E+05 4.47E+02 n=7
D_6_P 5.80E+05 5.19E+02
D_7_P 6.45E+05 5.77E+02
Sample D 600.2 Average m
All readings 808.5 Max
447.5 Min
115.6 Standard deviation
n=13
Sample B B_1_B 2.00E+06 4.28E+03 3511.7 Average m
( to bed) B_2_B 2.10E+06 4.49E+03 4917.5 Max
B_3_B 2.30E+06 4.92E+03 363.5 Min
B_4_B 1.70E+05 3.63E+02 2115.7 Standard deviation
n=4
Sample A A_1_B 2.25E+03 4.81E+00 5.1 Average m
( to bed) A_3_B 2.00E+03 4.28E+00 6.2 Max
A_4_B 2.90E+03 6.20E+00 4.3 Min
1.0 Standard deviation
n=3
THOMAS BRANCH, OLIVER RITTER, UTE WECKMANN, REINHARD F. SACHSENHOFER AND FRANK SCHILLING
SOUTH AFRICAN JOURNAL OF GEOLOGY
475
in distinct organic-rich layers, which could increase theconnectivity of the graphite crystals and thereby increasethe bulk electrical conductivity. Alternatively, theinterconnection needed for efficient electricalconduction could be related to the deposition of fine-grained kerogen and solid bitumen at grain boundariesbetween highly conductive graphite crystals within thepreviously porous laminae of sample A. This seemsplausible considering the nature of the pyrite in thissample, which appears to have formed by fluid flow(Figure 3a). Such hydrothermally driven events are welldocumented for the Karoo Basin (Duane and Brown,1992; McDonald and Rozendaal, 1995) and its uraniumdeposits (Duane et al., 1989). The organic petrologicaldata for sample A would support this hypothesis and isconsistent with the observations of Duba et al. (1988).
Even if the rocks appear to have low porosity,decompression and drying of the samples may have ledto higher grain boundary resistivities due to an increaseof pressure release induced micro-cracks. Therefore, themeasured conductivities of the rock samples represent aminimum conductivity of the formations. Judging fromperturbation estimates (Bahr, 1997; Weidenfeller et al.,2002) an extremely high pyrite fraction would berequired to sustain an interconnected network of pyritewithin the Prince Albert Formation. Small clusters ofpyrite – as observed in the drill cores – enhance theelectrical conductivity only locally. Jones et al. (1997)discuss that pyrite in fold-hinges could partly beresponsible for the North American Central Plainconductivity anomaly. However, given the huge arealextend of the observed MT conductivity anomaly, itseems more plausible, to attribute the cause of theanomaly to another stratigraphic unit. The high averageconductivity of 4 to 6 Ωm of the Whilehill Formationseems better suited to explain the observations.
In summary, it is plausible that the sub-horizontalconductivity anomaly in the MT model is at least partlycaused by the transgressive, fine-grained, carbon-richsequences of the Whitehill Formation. However, thelower Prince Alfred Formation with similarly gradationalcomposition changes, especially regarding carboncontent (Cole and McLachlan, 1994), cannot be excludedas an additional contributor. Constrained inversions ofthe MT data show that the high conductivity layerassociated with the Whitehill Formation must behorizontally continuous. The best resolved parameter ofa layered conductor in any MT model is the product ofthe layer’s thickness and its conductivity, the so-calledintegrated conductance. The model in Figure 2 revealsan integrated conductance (in excess) of 300 S, if weassume an average thickness of 300 m with a resistivityof around 1 Ωm for the Whitehill Formation. If resistivities are as low as 0.3 Ωm, as discussed inWeckmann et al. (2007b), this would lead to a layerthickness of 100m, more in line with the averagethickness reported for the Whitehill Formation of 50 mto 70 m. Either way, the MT models suggest that thishighly conductive layer is more or less continuously
extending throughout the entire Karoo Basin except forthe southernmost portion of the basin where aduplication of the sequences is documented (Newton,1992). The high conductivity layer is also present in aprofile crossing the Beattie Magnetic Anomaly some 350 km further to the west of the main profiles (seeFigure 1 and Weckmann et al., 2007b). This would makethe high conductivity layer an effective marker horizonfor the lower Karoo (Ecca Group) and, by taking thethickness of the underlying Dwayka Formation intoaccount, an indirect marker to the top of the Namaquabasement.
AcknowledgementsTB was generously supported by the GFZ Potsdam. UW was funded by the Emmy Noether fellowship of theGerman Science Foundation (DFG). The MT instrumentsfor the experiments were provided by the GeophysicalInstrument Pool Potsdam. The field and laboratoryexperiments were funded by the GFZ Potsdam. We thank Brian Horsfield (GFZ) for initiating the VR analyses. We are grateful for helpful comments inreviews by Maarten de Wit (editor), Arne Hoffmann-Rothe, and A.G. Jones. We would like to sincerely thankMaarten de Wit and Brian Horsfield for all the hard workthey put into Inkaba yeAfrica, including this specialvolume of South African Journal of Geology. This isInkaba yeAfrica contribution number 16.
ReferencesBahr K. (1997). Electrical anisotropy and conductivity distribution functions
of fractal random networks and of the crust: the scale effect of connectivity.
Geophysical Journal International, 130, 649–660.
Barsoukov E. and Macdonald J.R. (Editors) (2005). Impedance Spectroscopy
Theory, Experiment and Applications. John Wiley and Sons, New York,
United States of America, 616pp.
Catuneanu O. (2004). Basement control on flexural profiles and the
distribution of foreland facies: The Dwyka Group of the Karoo Basin.
South Africa, Geology, 32, 517-520.
Cole D.I. (1992). Evolution and development of the Karoo Basin, In: M.J. de
Wit and I.D.G. Ransome (Editors) Inversion tectonics of the Cape Fold Belt.
Karoo and Cretaceous Basins of Southern Africa, A. A. Balkema,
Rotterdam, The Netherlands, 87-100.
Cole D.I. and McLachlan I.R. (1994). Oil shale potential and depositional
environment of the Whitehill Formation in the main Karoo Basin. SOEKOR,
now PASA, South African Petroleum Agengy, Cape Town. Unpublished
Report No. 1994-0213.
Craddock J.P., McKiernan A.W., de Wit M.J. (2007). Calcite twin analysis in
syntectonic calcite, Cape Fold Belt, South Africa: Implications for fold and
cleavage formation within a shallow thrust front. Journal of Structural
Geology, 29, 1100-1113.
de Beer J., van Zijl J. and Gough D. (1982). The Southern Cape Conductive
Belt (South Africa): Its Composition, Origin and Tectonic Significance.
Tectonophysics, 83, 205-225.
Diessel C.F.K., Brothers R.N. and Black P.M. (1978). Coalification and
graphitization in high-pressure schists in New Caledonia. Contributions to
Mineralogy and Petrology, 68, 63-78.
Duane M.J., Welke H.J. Allsopp H.L. and Wilsher W.A. (1989). U-Pb isotope
systematics, ages and genesis of Karoo uranium deposits, South Africa.
South African Journal of Geology, 92, 49-64.
Duane M.J. and Brown R. (1992). Geochemical open-system behaviour
related to fluid-flow and metamorphism in the Karoo. In: M.J. de Wit and
I.G.D. Ransome (Editors), Inversion tectonics of the Cape Fold Belt, Karoo
and Cretaceous Basins of Southern Africa, Balkema, Rotterdam, The
Netherlands, 127-140.
Duba A., Heikamp S., Meurer W., Nover G. and Will G. (1994). Evidence
from borehole samples for the role of accessory minerals in lower-crustal
conductivity. Nature, 367, 59-61.
Duba A., Huenges E., Nover G. and Will G. (1988). Impedance of black shale
from Munsterland 1 borehole: an anomalously good conductor.
Geophysical Journal, 94, 413-419.
Egle S. (1996). Paleohydrology of the Cape fold belt and Karoo Basin, South
Africa. Unpublished PhD thesis, University of Cape Town, South Africa,
155pp.
Egle S., de Wit M.J., Hoernes S. (1998). Gondwana fluids and subsurface
palaeohydrology of the Cape Fold belt and the Karoo Basin, South Africa.
Journal of African Earth Sciences, 27, 63-64.
Gough D.I., de Beer J.H. and van Zijl J.S.V. (1973). A magnetometer array in
Southern Africa. Geophysical Journal of the Royal Astronomical Society,
34, 421-433.
Guegen Y. and Palciauskas V. (1994). Introduction to Physics of Rocks.
Princeton University Press, Princeton, New Jersey, U.S.A., 294p.
Halbich I.W. (1983). In: A.O.G. Sohnge and I.W. Halbich (Editors). A
tectogenesis of the Cape Belt (CBF). Geodynamics of the Cape Fold Belt,
The Geological Society of South Africa Special Publication, 12, 165-175.
Halbich I.W. (1992). The Cape Fold Belt Orogeny: State of the art 1970s-
1980s. In: M.J. de Wit and I.D.G. Ransome (Editors) Inversion tectonics of
the Cape Fold Belt, Karoo and Cretaceous Basins of Southern Africa, A. A.
Balkema, Rotterdam, The Netherlands, 141-158.
Johnson M.R., van Vuuren C.J., Hegenberger W.F., Key R. and Shoko U.
(1996). Stratigraphy of the Karoo Supergroup in South Africa: an overview.
Journal of African Earth Science, 23, 3-15.
Kribek B., Hrabal J., Landais P. and Hladikova J. (1994). The association of
poorly ordered graphite, coke and bitumens in greenschist facies rocks of
the Ponikl Group, Lugicum, Czech Republic: the results of graphitization
of various types of carbonaceous matter. Journal of Metamorphic Geology,
12, 493-503.
Lopez-Gamudi O.R. and Rossello E.A. (1998). Basin fill evolution and
paleotectonic patterns along the Samfrau geosyncline: the Sauce Grande
basin-Ventana foldbelt (Argentina) and Karoo basin-Cape foldbelt (South
Africa) revisited. Geologische Rundschau, 86, 819-834.
Mastalerz M., Wilks K. R., Bustin R. M. and Ross J. V. (1993). The effect of
temperature, pressure and strain on carbonization in high-volatile
bituminous and anthracitic coals. Organic Geochemistry, 20, 315-325.
McDonald W.G. and Rozendaal A. (1995). The Geelwal Karoo heavy mineral
deposit: a modern day beach placer. Journal of African Earth Science,
21, 187-200.
Milani E.J. and de Wit M.J. (2007). Correlations between the classic Paraná
and Cape-Karoo sequences of South America and southern Africa and their
basin infills flanking the Gondwanides: Du Toit revisited. In: R. Pankhurst
et al. (Editors), Western Gondwana - the Ties that Bind. The Geological
Society, London, (in press).
Newton A.R. (1992). Thrusting on the northern margin of the Cape Fold Belt,
near Laingsburg. In: M.J. de Wit and I.D.G. Ransome (Editors) Inversion
tectonics of the Cape Fold Belt, Karoo and Cretaceous Basins of Southern
Africa, A. A. Balkema, Rotterdam, The Netherlands, 193-196.
Nover G., Stoll J.B. and von der Gönna, J. (2005). Promotion of graphite
formation by tectonic stress - a laboratory experiment. Geophysical Journal
International, 160 (3), 1059–1067, doi:10.1111/j.1365-246X.2005.02395.x.
Pous J., Munoz G., Heise W., Melgarejo J.C. and Quesada C. (2004).
Electromagnetic imaging of Variscan crustal structures in southwest Iberia:
the role of interconnected graphite. Earth and Planetary Science Letters,
217, 435–450.
Ritter O., Haak V., Rath V., Stein E. and Stiller M. (1999). Very high
electrical conductivity beneath the Münchberg Gneiss area in Southern
Germany: implications for horizontal transport along shear planes.
Geophysical Journal International, 139, 161–170, doi:10.1046/j.1365-
246X.1999.00937.x.
Rodi W. and Mackie R. L. (2001). Nonlinear conjugate gradients algorithm for
2D magnetotelluric inversion. Geophysics, 66, 174-187.
Ross J.V. and Bustin R.M. (1997). Vitrinite anisotropy resulting from simple
shear experiments at high temperature and high confining pressure.
International Journal of Coal Geology, 33, 153-168.
Snymann C.P (1998). Coal. In: M.G.C. Wilson and C.R. Anhaeusser (Editors),
The Mineral Resources of South Africa Council for Geoscience, South
Africa, Handbook, 16, 136-205.
SOEKOR FILE CR1/68, CR 1/68. Borehole Master Report Log, Open File report,
Council for Geoscience library, Pretoria, South Africa.
SOEKOR FILE KW1/67, KW1/67. Borehole Master Report Log, Open File
report, Council for Geoscience library, Pretoria, South Africa.
Stach E., Taylor G.H., Mackowsky M.-Th., Chandra D., Teichmüller M., and
Teichmüller R. (1982). Stach’s Textbook of Coal Petrology. 3rd Edition,
Gebrüder Bornträger, Berlin, Germany, 535p.
Tauber S., Banks R., Ritter O. and Weckmann U. (2003). A high-resolution
magnetotelluric survey of the Iapetus Suture Zone in southwest Scotland.
Geophysical Journal International, 153, 548–568, doi:10.1046/j.1365-
246X.2003.01912.x.
Teichmüller M., Teichmüller R. and Weber M. (1979). Inkohlung und Illit-
Kristallinität (Vergleichende Untersuchungen im Mesozoikum und
Paläozoikum von Westfalen). Fortschritte der Geologie Rheinland und
Westfalen, 27, 201-276.
Van Zijl J.S.V. (2006). A review of the resistivity structure of the Karoo
Supergroup, South Africa, with emphasis on the dolerites: A study in
anisotropy. South African Journal of Geology, 109, 315-328.
Weckmann U., Ritter O., Jung A., Branch T. and de Wit M. (2007a).
Magnetotelluric measurements across the Beattie magnetic anomaly and
the Southern Cape Conductive Belt, South Africa. Journal of Geophysical
Research, 112, B05416, doi:10.1029/2005JB003975.
Weckmann U., Jung A., Branch T. and Ritter O. (2007b). Comparison of
electrical conductivity structures and 2D magnetic modelling along two
profiles crossing the Beattie Magnetic Anomaly, South Africa. South African
Journal of Geology, 110, 449-464.
Weidenfeller B., Höfer M. and Schilling F. (2002). Thermal and electrical
properties of magnetite filled polymers. Composites: Part A, 33, 1041–1053.
Editorial handling: M.J. de Wit and Brian Horsfield
SOUTH AFRICAN JOURNAL OF GEOLOGY
A HIGH CONDUCTIVITY MARKER HORIZON IN THE KAROO BASIN476