Embed Size (px)
Citation preview
Sponsors:

@APA_Planning @APAadvocates
#APAlive
@ArlingtonVA @planArlingtonVA
@dcwater
@APA_Planning @APAadvocates
#APAlive
1.0
www.planning.org/tuesdaysatapa

APA Resources
• The Wildland-Urban Interface (PAS QuickNotes 69) – www.planning.org/media/document/9131011/
• Fire-Resilient Community Design: A New Planning Subfield? (Planning, Nov. 2016) – www.planning.org/planning/2016/nov/research/
• In the Path of the Inferno (Planning, July 2013) – www.planning.org/planning/2013/jul/inferno.htm
• Limiting Wildfire Risk Through Land-Use Controls (Zoning Practice, May 2012) – www.planning.org/media/document/9006915/
The Wildland-Urban Interface and Rebuilding after Wildfire
December 12, 2017
Speaker: Miranda Mockrin Research Scientist US Forest Service, Northern Research Station

The Wildland-Urban Interface and Rebuilding after Wildfire
Miranda H. Mockrin1, Volker Radeloff2, H. Anu Kramer2, David P. Helmers, Hillary K. Fishler3, Patricia Alexandre2 & Susan I. Stewart2
1USDA Forest Service, Northern Research Station, 2University of Wisconsin,
3Oregon State University
December 12, 2017 American Planning Association

Outline • Wildland-Urban Interface (WUI)
• Growth over time • Data set online
• Rebuilding after wildfire • Case study work • What happens after fire?
• Conclusion: many opportunities for collaboration with planners
6
Outline • Wildland-Urban Interface (WUI)
• Growth over time • Data set online
• Rebuilding after wildfire • Case study work • What happens after fire?
• Conclusion: many opportunities for collaboration with planners
7

Wildland-Urban Interface (WUI)
Where houses meet or intermingle with undeveloped wildland.
8
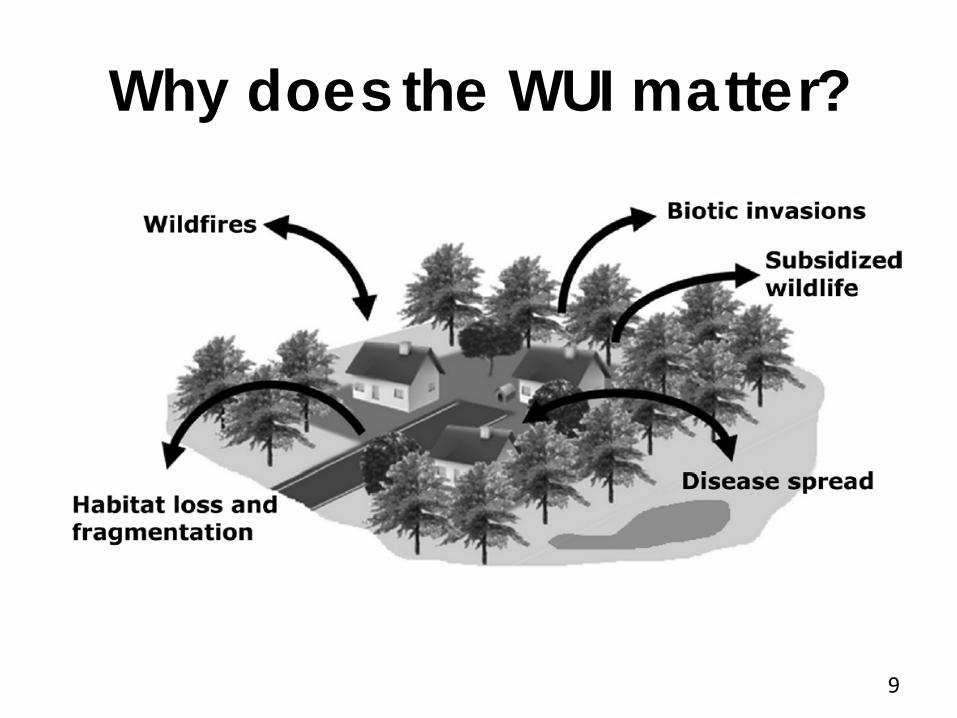
Why does the WUI matter?
9

Wildfire management
10

Wildfire management
11
Forest Service mission: To sustain the health, diversity, and productivity of the Nation’s forests and grasslands to meet the needs of present and future generations.

• Location, extent, and change over time: – Housing from U.S. Census blocks – Wildland Vegetation, National Land Cover
Database – Thresholds from Federal Register
• Coterminous U.S.
Mapping the WUI
Radeloff et al. (2005). "The wildland-urban interface in the United States." Ecological Applications 15(3): 799-805.
12

13

• Census blocks change every decade, preventing fine-scale change analyses
WUI Mapping
14

• Map WUI change from 1990 to 2010 across the conterminous U.S.
• Identify the causes of WUI change
• Change in housing density, • Or wildland vegetation
New data set
15

Methods Wildland
Vegetation 1992 NLCD
(retrofit)
Wildland Vegetation 2001 NLCD
Wildland Vegetation 2011 NLCD
1990 Housing
Units
2000 Housing
Units
2010 Census blocks
2010 Housing
Units
1990-2000-2010 WUI Change
16

Methods
10
10
1-to-1
6
10
4
1-to-Many
7 3
10
Many-to-1
7 3
3 2
5
Many-to-Many
1990/2000
2010
17

Interface WUI - “where houses meet”
Intermix WUI - “where houses mingle”
Types of WUI
>75% wildland vegetation >500 hectares
>1 house per 40 acres >50% wildland vegetation
>1 house per 40 acres <50% wildland vegetation
Within 1.5 miles
18

1990
19
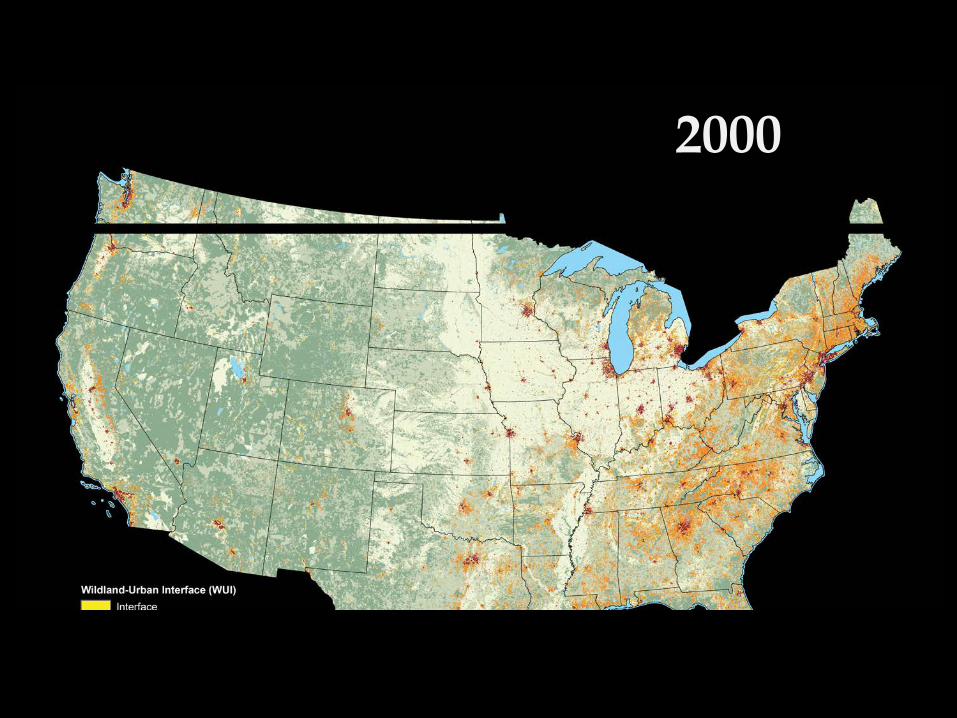
2000
20

2010
21

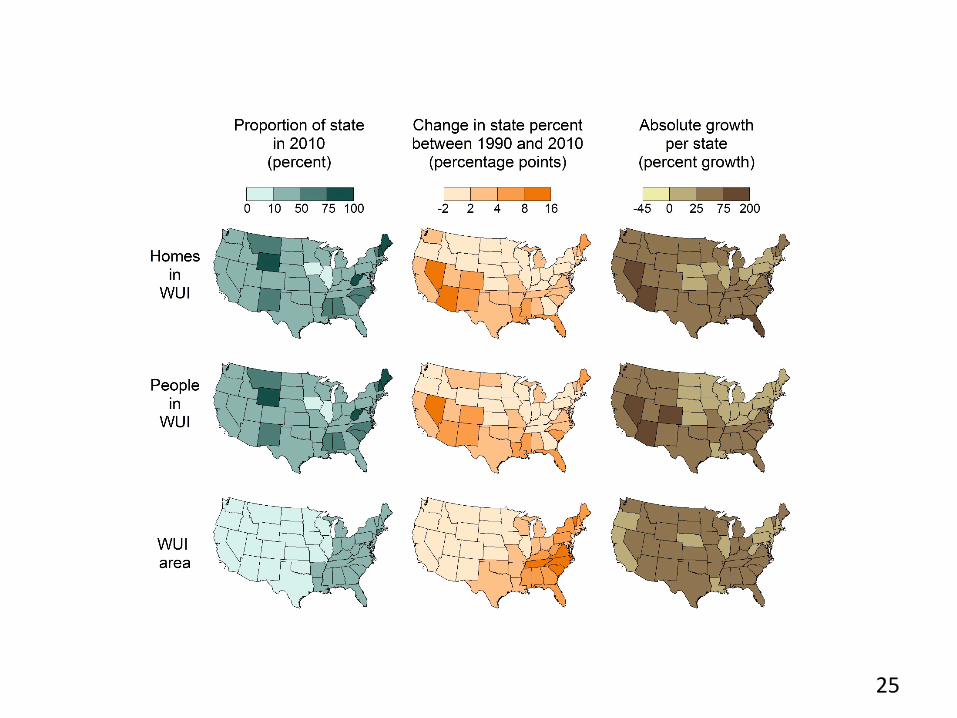
U.S. WUI grew rapidly from 1990 to 2010: WUI Houses: 30.8 to 43.4 million
41% growth WUI Area: 581,000 to 770,000 km2
33% growth
22

23

24
25

-100
0
100
200
300
400
500
600
Moved out of WUI Moved into WUI Stayed WUI
Are
a km
2 (th
ousa
nds)
Area change, 1990-2010
No longer WUI Became WUI Stayed WUI
26
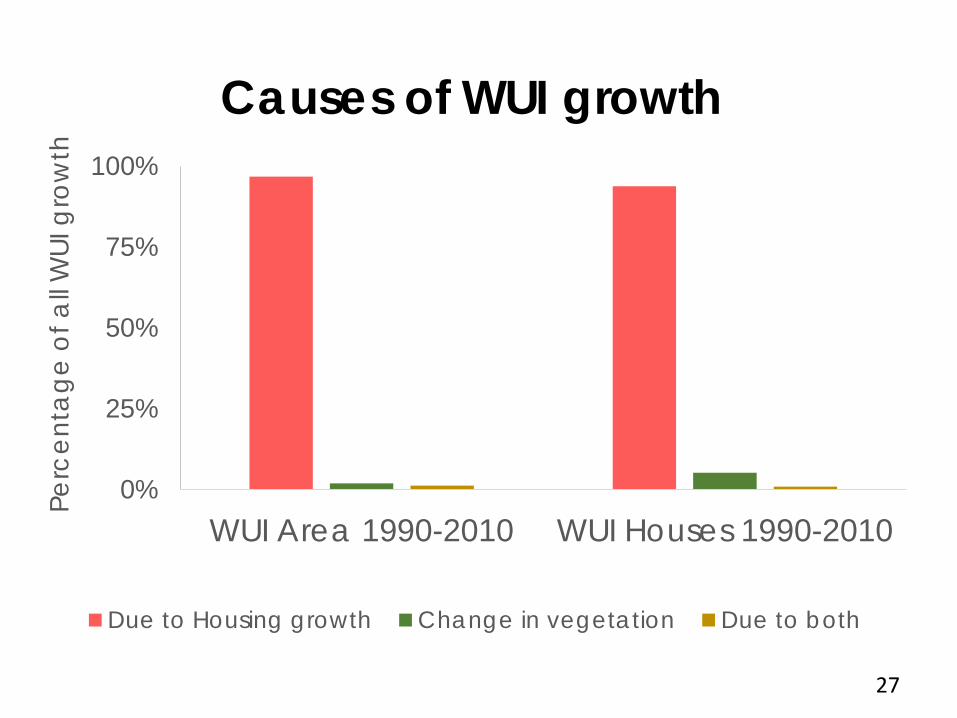
0%
25%
50%
75%
100%
WUI Area 1990-2010 WUI Houses 1990-2010
Perc
enta
ge o
f all W
UI g
row
th
Causes of WUI growth
Due to Housing growth Change in vegetation Due to both
27

Outline • Wildland-Urban Interface (WUI)
• Growth over time • Data set online
• Rebuilding after wildfire • Case study work • What happens after fire?
• Conclusion: many opportunities for collaboration with planners
29

Post-fire response • Could be an obvious time to see
adaptation or change • Does post-fire change provide
broader insight for WUI planning? • Rebuilding • Local policy
30
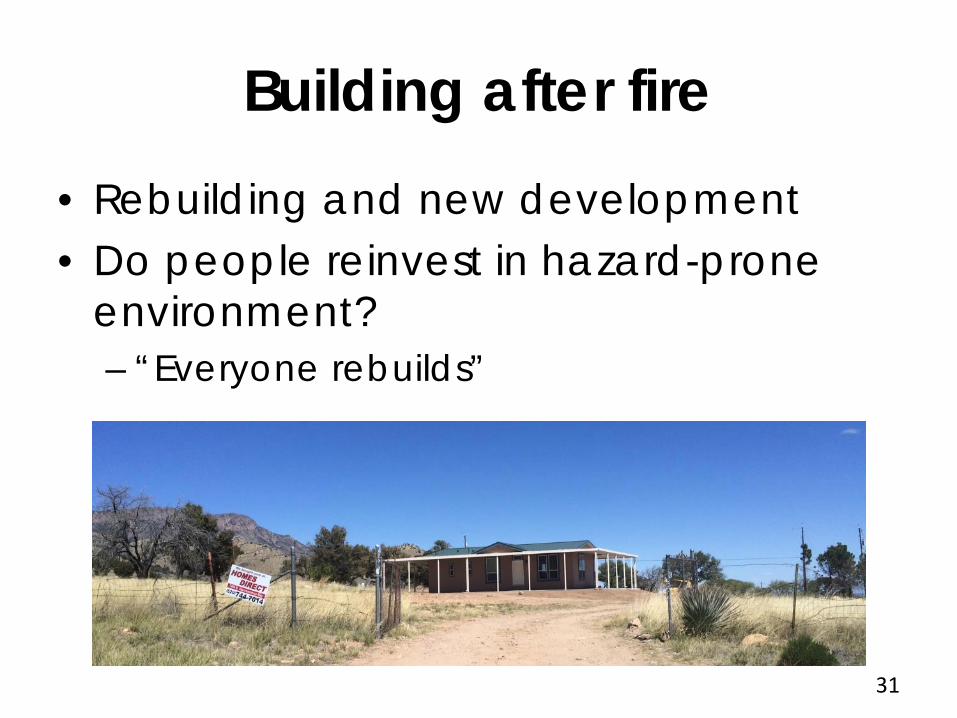
Building after fire • Rebuilding and new development • Do people reinvest in hazard-prone
environment? – “Everyone rebuilds”
31

Quantify rebuilding and new development
• All fires from 2000-2013 – 3,087 fires digitized (466 lost buildings)
• Buildings before and after fire – Burned, rebuilt, and new for ~2.5 years
• Alexandre, P.M.; Mockrin, M.H.; Stewart, S.I.; Hammer, R.B.; Radeloff, V.C. 2015. Rebuilding and new housing development after wildfire. International Journal of Wildland Fire. 24: 138-149.
• Kramer, H. A. et al. Where are buildings destroyed by wildfire in the US relative to the wildland urban interface and national fire outreach programs. in prep 32

33
133,857
34,918
17,079
11,930
0
20,000
40,000
60,000
80,000
100,000
120,000
140,000
160,000
All fires (n=3,087) Most destructive fires(n=20)
Buildings destroyed and surviving, 2000-2013
DestroyedSurvived
*466 lost buildings

34
4,063 3,417
13,016
8,513
0
5,000
10,000
15,000
20,000
All fires Top 20
Rebuilding post-fire, 2000-2013
Not rebuilt
Rebuilt
n=466

35
4,063 3,417
6,554
633
13,016
8,513
0
5,000
10,000
15,000
20,000
25,000
All fires Top 20
Rebuilding and new buildings post-fire, 2000-2013
Not rebuilt
New
Rebuilt
n=466
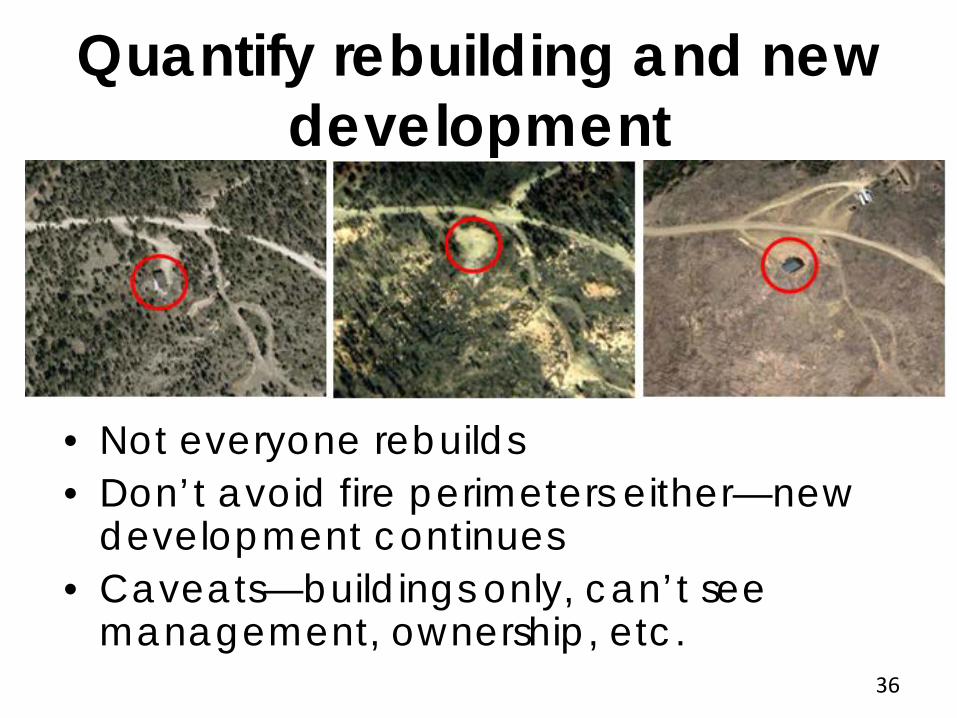
Quantify rebuilding and new development
• Not everyone rebuilds • Don’t avoid fire perimeters either—new
development continues • Caveats—buildings only, can’t see
management, ownership, etc. 36

Post-fire policy response
Fire Adapted Communities Coalition, 2014, Guide to Fire Adapted Communities. http://www.fireadapted.org/~/media/Fire%20Adapted/Files/FAC%20Reference%20Guide%202014%20FINAL%20reduced%202.pdf (accessed April 19, 2017). 37

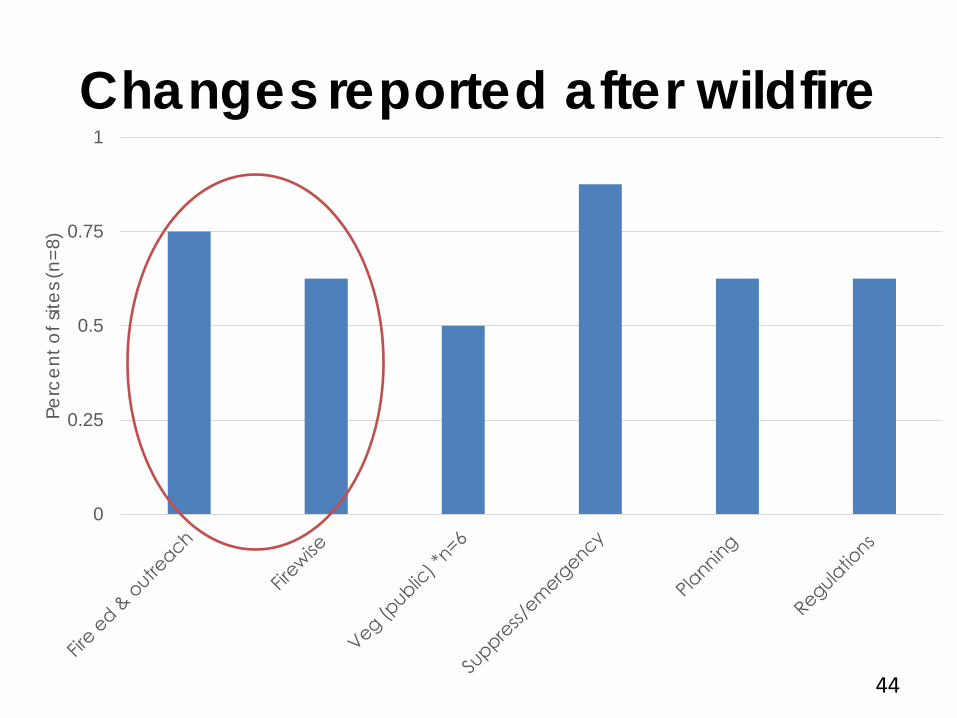
Post-fire policy response 1. Fire education &
outreach 2. Firewise programs 3. Vegetation manage.
public lands 4. Suppression and
emergency response 5. Planning (CWPP,
hazards) 6. Regulations (WUI regs
for homes, burning) 38

Methods • Case studies (n=8) • Fires from 2009-2011
burned 20+ homes • Interviews with
officials and local leaders & document analysis
• 6-10 interviews per site
39
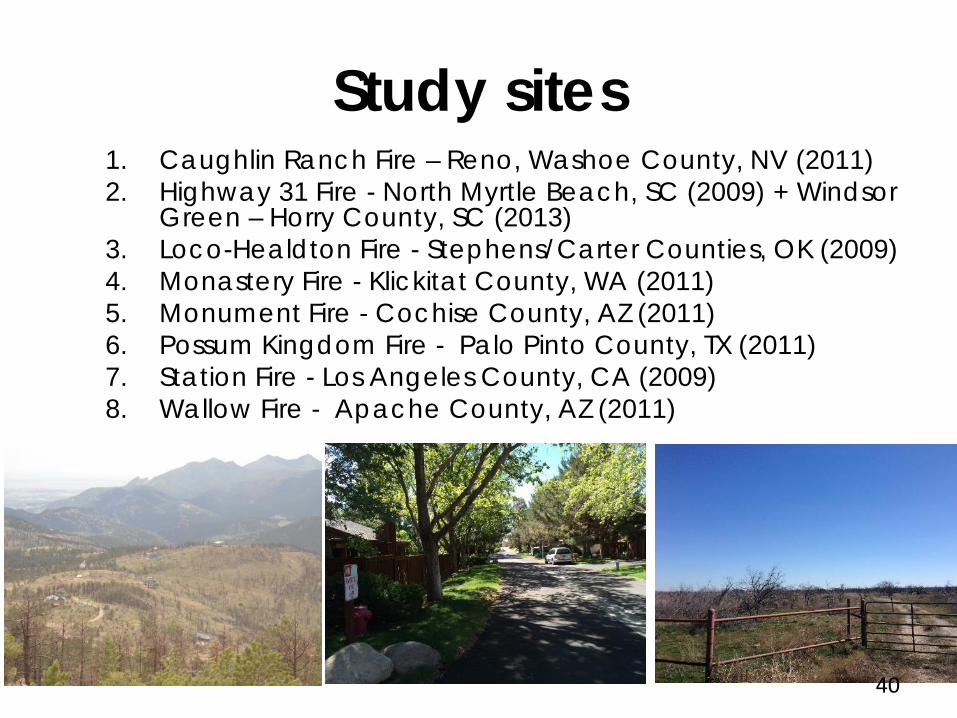
1. Caughlin Ranch Fire – Reno, Washoe County, NV (2011) 2. Highway 31 Fire - North Myrtle Beach, SC (2009) + Windsor
Green – Horry County, SC (2013) 3. Loco-Healdton Fire - Stephens/Carter Counties, OK (2009) 4. Monastery Fire - Klickitat County, WA (2011) 5. Monument Fire - Cochise County, AZ (2011) 6. Possum Kingdom Fire - Palo Pinto County, TX (2011) 7. Station Fire - Los Angeles County, CA (2009) 8. Wallow Fire - Apache County, AZ (2011)
Study sites
40

Results
Fire education & outreach
Firewise programs
Vegetation manage. public lands
Suppression and emergency response
Planning (e.g., CWPP)
Regulations (homes, burning)
Formal & difficult
41

Changes reported after wildfire
0
0.25
0.5
0.75
1
Perc
ent o
f site
s (n=
8)
42

Changes reported after wildfire
0
0.25
0.5
0.75
1
Perc
ent o
f site
s (n=
8)
43
Changes reported after wildfire
0
0.25
0.5
0.75
1
Perc
ent o
f site
s (n=
8)
44

Changes reported after wildfire
0
0.25
0.5
0.75
1
Perc
ent o
f site
s (n=
8)
45

Before Location: CWPP Burn
bans Build. code
WUI regs
Caughlin Ranch NV Yes* Yes Yes Yes, county
Hwy 31 + WG SC Yes Yes
Loco-Healdton OK Yes
Monastery WA Yes* Yes Yes
Monument AZ Yes
Yes (county,
1 fire dept)
Possum Kingdom TX Yes
Station CA Yes Yes Yes
Wallow AZ Yes Yes Yes 46

Before AFTER Location: CWPP Burn
bans Build. code
WUI regs CWPP Burn
bans Build. code
WUI regs Other
Caughlin Ranch NV Yes* Yes Yes Yes, county
+IWUI, county
only
Hazard Mit Plan
Hwy 31 + WG SC Yes Yes City
banned, county stronger
Hazard/ Comp plan
Loco-Healdton OK Yes Public Safety
Tax
Monastery WA Yes* Yes Yes
Monument AZ Yes
Yes (county,
1 fire dept)
New + 1 fire dept Hazard
Mit Plan
Possum Kingdom TX Yes Emerg. Oper. Plan
Station CA Yes Yes Yes FS regs
Wallow AZ Yes Yes Yes Revising Hazard Mit Plan 47

Do Wildfires Lead to Local Adaptation?
• Yes! but: • Many changes focus on emergency
response/suppression or education • Narrow policy window
– WUI regs after wildfire? 1/8 places – Government effort on repairing
community relationships
48

Challenges to adaptation • Existing housing stock and access is not
easily changed • Government officials and comm.
members for whom it was a ‘non-event’: • Accepted risk—long experience with fire,
but relatively little change post-incident: – Extensive formal governance & capacity (LA
County) – Limited local government & capacity(OK)
• Not accepted risk - isolated incident, unlikely to return (TX) 49

Outline
50
• Wildland-Urban Interface (WUI) • Growth over time • Data set online
• Rebuilding after wildfire • Case study work • What happens after fire?
• Conclusion: many opportunities for collaboration with planners

Conclusions
51
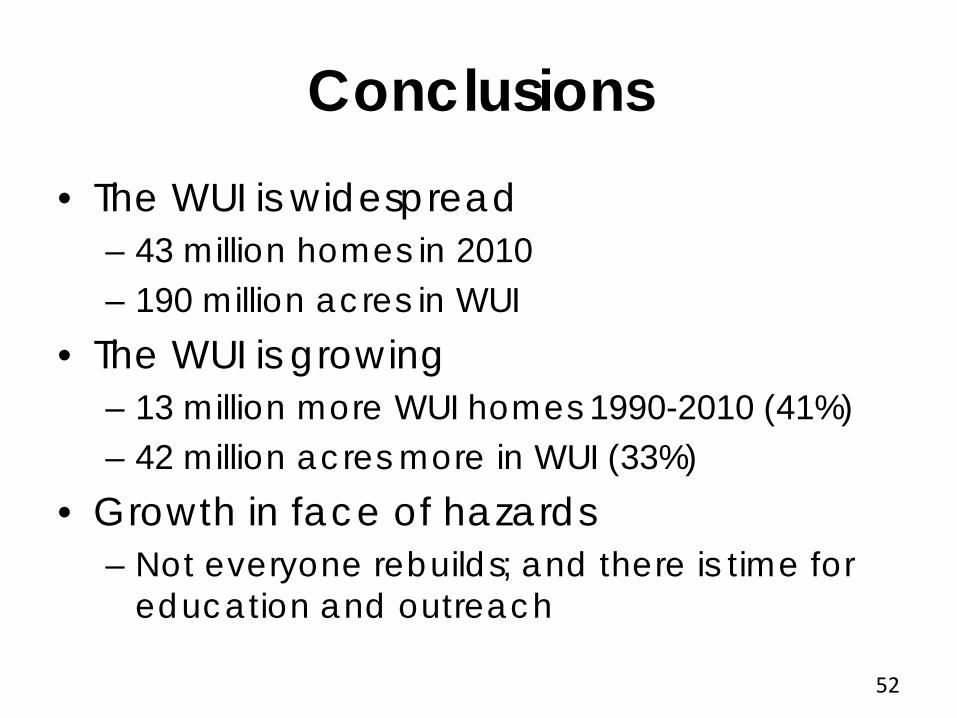
Conclusions • The WUI is widespread
– 43 million homes in 2010 – 190 million acres in WUI
• The WUI is growing – 13 million more WUI homes 1990-2010 (41%) – 42 million acres more in WUI (33%)
• Growth in face of hazards – Not everyone rebuilds; and there is time for
education and outreach
52

Rebuilding and policy response
• No large scale land use/regulation changes
• Planning and regulation do happen with state and federal mandates
• Change after fire focuses on interventions most common before fire – Voluntary, education, and planning – Staff & resources were key
53
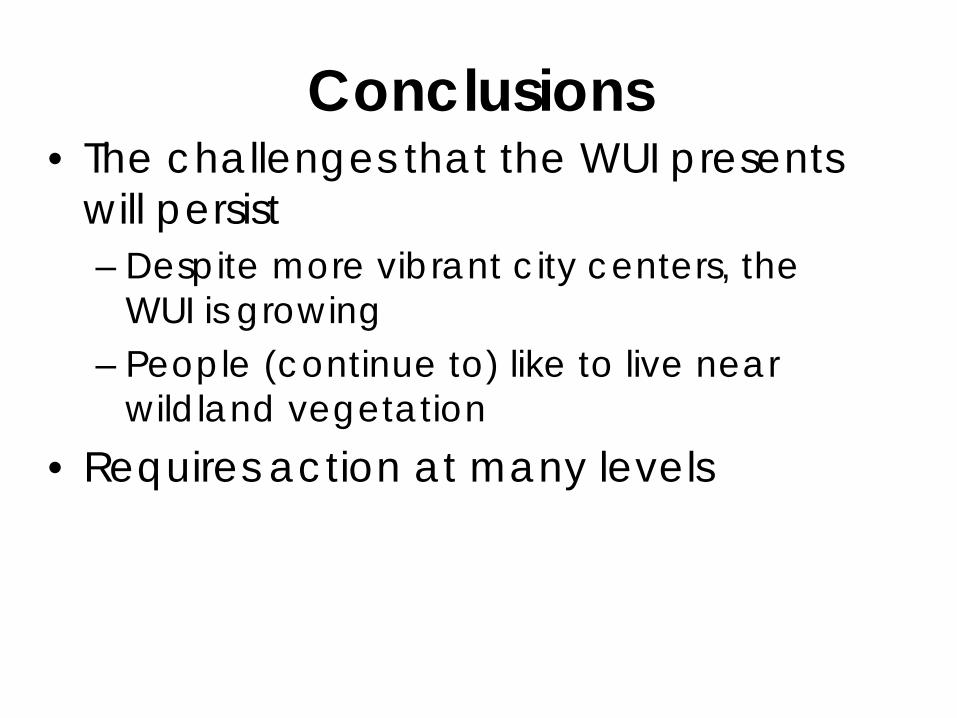
• The challenges that the WUI presents will persist – Despite more vibrant city centers, the
WUI is growing – People (continue to) like to live near
wildland vegetation • Requires action at many levels
Conclusions
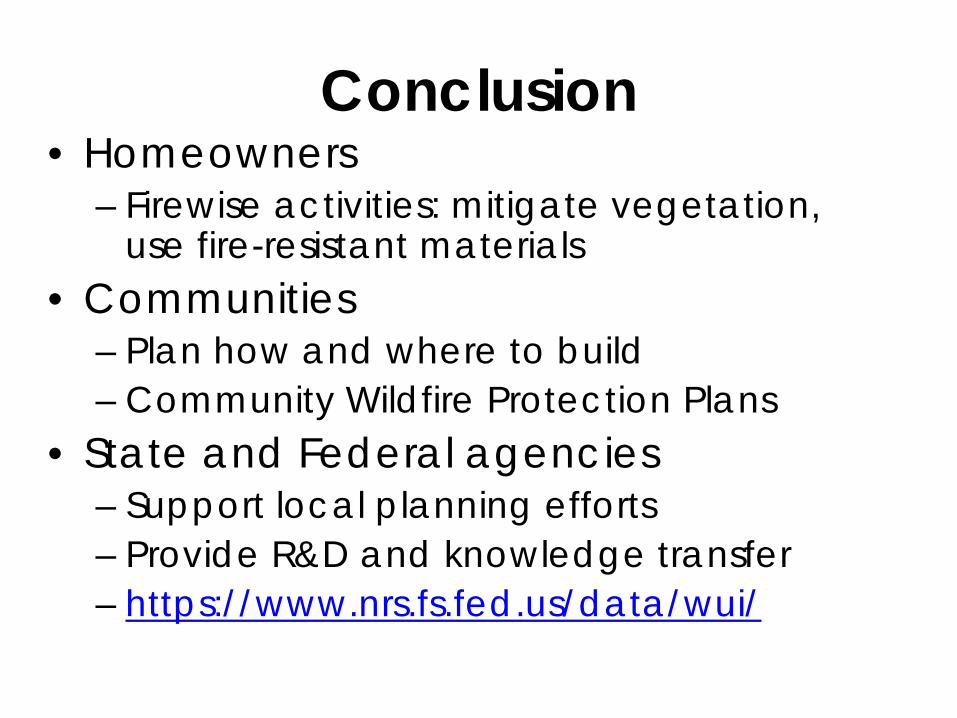
• Homeowners – Firewise activities: mitigate vegetation,
use fire-resistant materials • Communities
– Plan how and where to build – Community Wildfire Protection Plans
• State and Federal agencies – Support local planning efforts – Provide R&D and knowledge transfer – https://www.nrs.fs.fed.us/data/wui/
Conclusion

• Joint Fire Science Program(14-2016) • USDA Forest Service (NRS and RMRS) • Many people we interviewed • Email: [email protected]
Thank you & questions
56

57
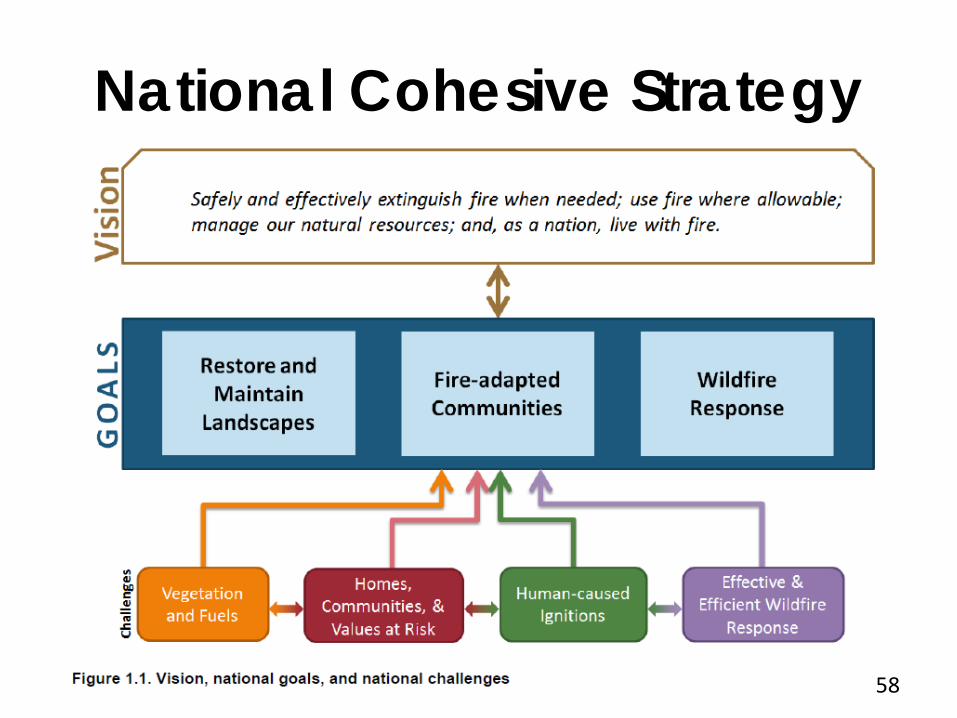
National Cohesive Strategy
58

“Community leaders and residents accept responsibility for living in an area with wildfire hazards. They have the knowledge and skills and have adopted tools and behaviors to prepare in advance for their community’s resilience in a wildfire prone environment.”
Fire-adapted communities
Fire Adapted Communities Coalition, 2014, Guide to Fire Adapted Communities. http://www.fireadapted.org/~/media/Fire%20Adapted/Files/FAC%20Reference%20Guide%202014%20FINAL%20reduced%202.pdf (accessed April 19, 2017). 59

Post-fire: time to adapt? • “Policy window” (Birkland 2006, Kingdon 2010)
• “Accepted wisdom has held that natural disasters serve as focusing events that generate policy windows in their wake”(Solecki & Michaels 1994)
• WUI regulations-homes & veg-often adopted after wildfires (Duerksen et al. 2011).
60
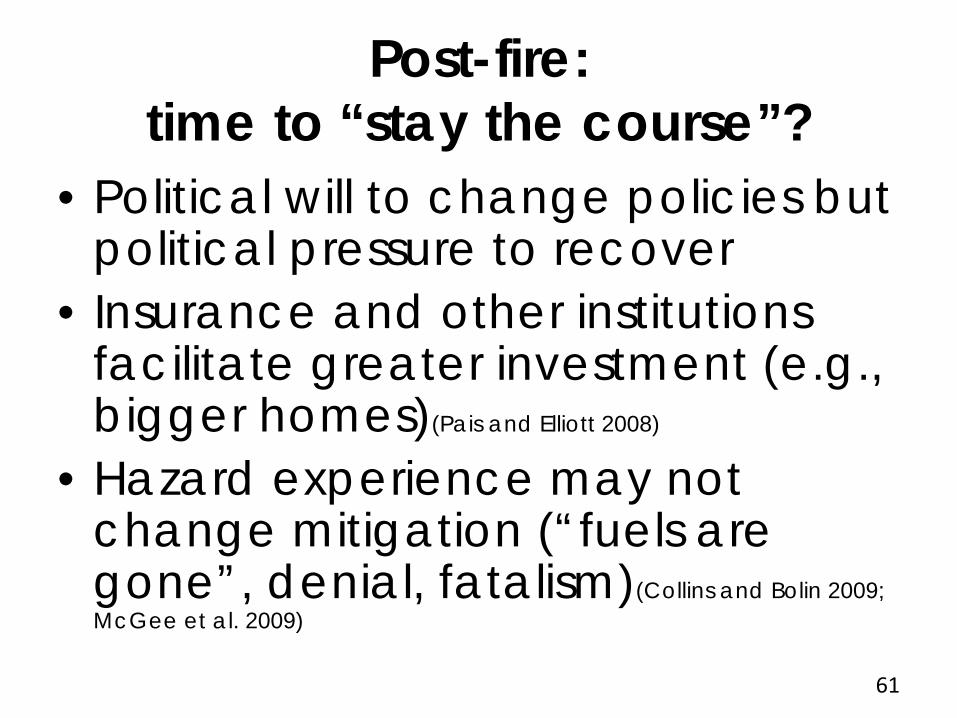
• Political will to change policies but political pressure to recover
• Insurance and other institutions facilitate greater investment (e.g., bigger homes)(Pais and Elliott 2008)
• Hazard experience may not change mitigation (“fuels are gone”, denial, fatalism)(Collins and Bolin 2009; McGee et al. 2009)
Post-fire: time to “stay the course”?
61

CO Front Range
62

Site Landscape
Type Economy
base Political
Affiliation Socioeco.
Status Community
Type Ignition Source Other Hazards
Caughlin R NV High desert shrubland
Lottery, Misc. Dem. $$$ Suburban,
Exurban
Electrical fire, high
winds
Drought, Earthquake
Hwy 31 (&Windsor Green) SC
Peat, subtropical
coastal forest
Tourism, Resorts Rep. $$$ Suburban
Residential debris
burning, unknown
Hurricane, Flooding
Loco-Healdton OK Grassland Agriculture Rep. $ Rural
High winds, arcing power lines
Tornadoes, Flooding, Fracking Induced
Earthquake, Drought
Monastery WA Conifer Forest to
Grassland
Tourism, Forestry Rep. $ Exurban
Tractor-trailer
defect
Earthquake, Landslides
Monument AZ Desert Military Rep. $$ Exurban, Rural
Human ignition-disputed
Drought, Flooding
Possum Kingdom TX
Grassland, Shrubland Tourism Rep. $$$$ Suburban Disputed Drought
Station CA High Desert,
Conifer Forest
Misc., Entertain-
ment Industry
Dem. $$$$ Exurban Arson
Earthquake, Drought, Flood, Mud & Debris
Flows
Wallow AZ High desert, alpine forest Tourism Rep. $ Exurban Unattend.
campfire Drought, Flooding 63

Government and local response: • Recovery policy • Rebuilding • Homes and
mitigation
Colorado Front Range, 2010-2012 wildfires
64
• Mockrin M.H., Stewart S.I., Radeloff V.C., Hammer R.B. 2016. Recovery and adaptation after wildfire on the Colorado Front Range (2010–12). International Journal of Wildland Fire 25: 1144-1155.
• Mockrin M.H., S.I. Stewart, P. Alexandre, V. C. Radeloff, R. B. Hammer. 2015. Adapting after wildfire: recovery from home loss. Society and Natural Resources 28: 839-856.
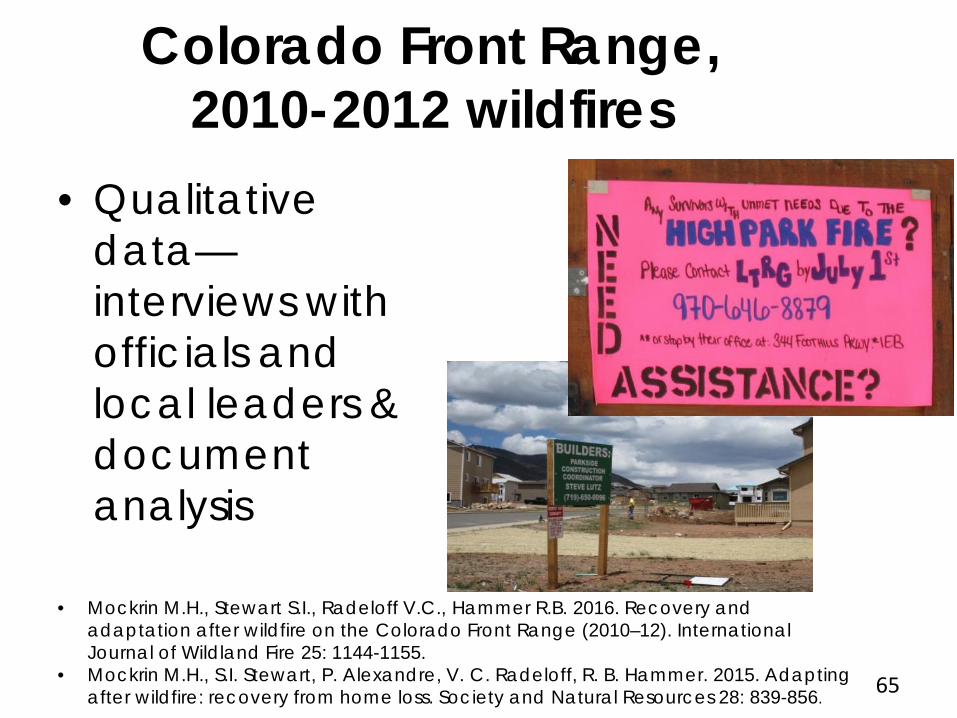
• Qualitative data— interviews with officials and local leaders & document analysis
Colorado Front Range, 2010-2012 wildfires
65
• Mockrin M.H., Stewart S.I., Radeloff V.C., Hammer R.B. 2016. Recovery and adaptation after wildfire on the Colorado Front Range (2010–12). International Journal of Wildland Fire 25: 1144-1155.
• Mockrin M.H., S.I. Stewart, P. Alexandre, V. C. Radeloff, R. B. Hammer. 2015. Adapting after wildfire: recovery from home loss. Society and Natural Resources 28: 839-856.
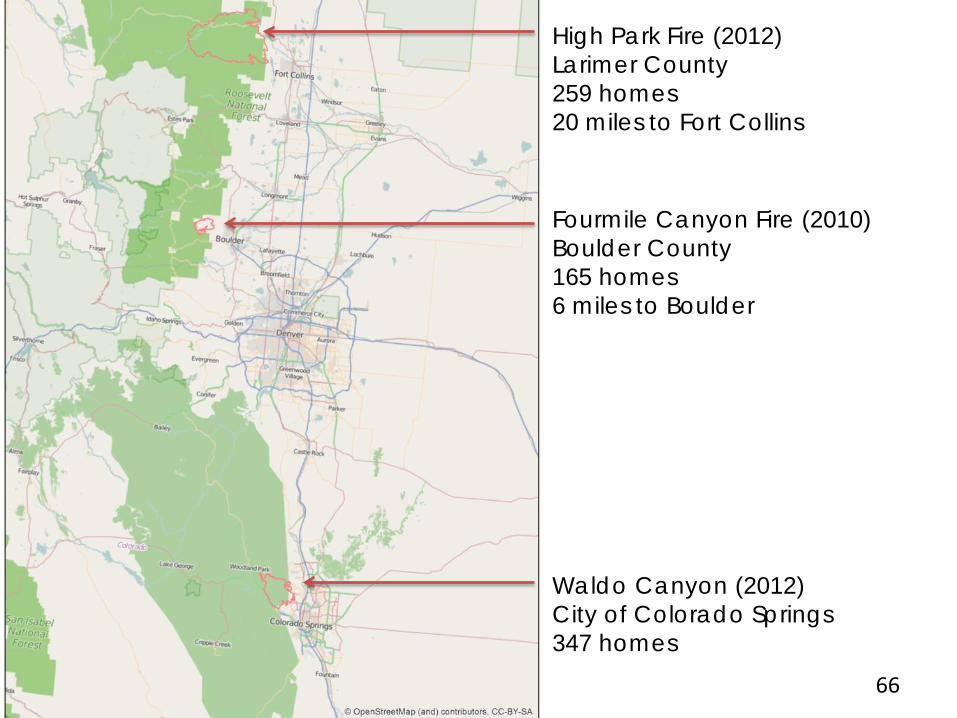
High Park Fire (2012) Larimer County 259 homes 20 miles to Fort Collins
Fourmile Canyon Fire (2010) Boulder County 165 homes 6 miles to Boulder
Waldo Canyon (2012) City of Colorado Springs 347 homes
66
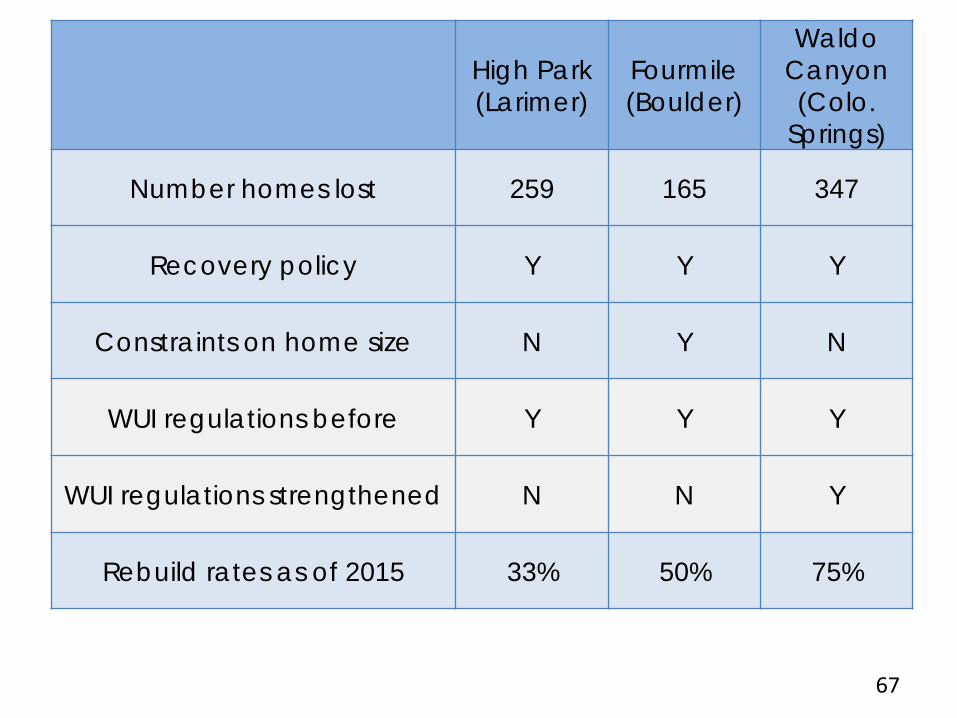
High Park (Larimer)
Fourmile (Boulder)
Waldo Canyon (Colo.
Springs)
Number homes lost 259 165 347
Recovery policy Y Y Y
Constraints on home size N Y N
WUI regulations before Y Y Y
WUI regulations strengthened N N Y
Rebuild rates as of 2015 33% 50% 75%
67

• All new homes, in each CO location: – Fire-resistant materials – Vegetation thinned or landscaped
• New regulations in Colorado Springs – Replaced 1993 older standards
• Time for education and outreach, especially in foothills
Fire-adapted?
68
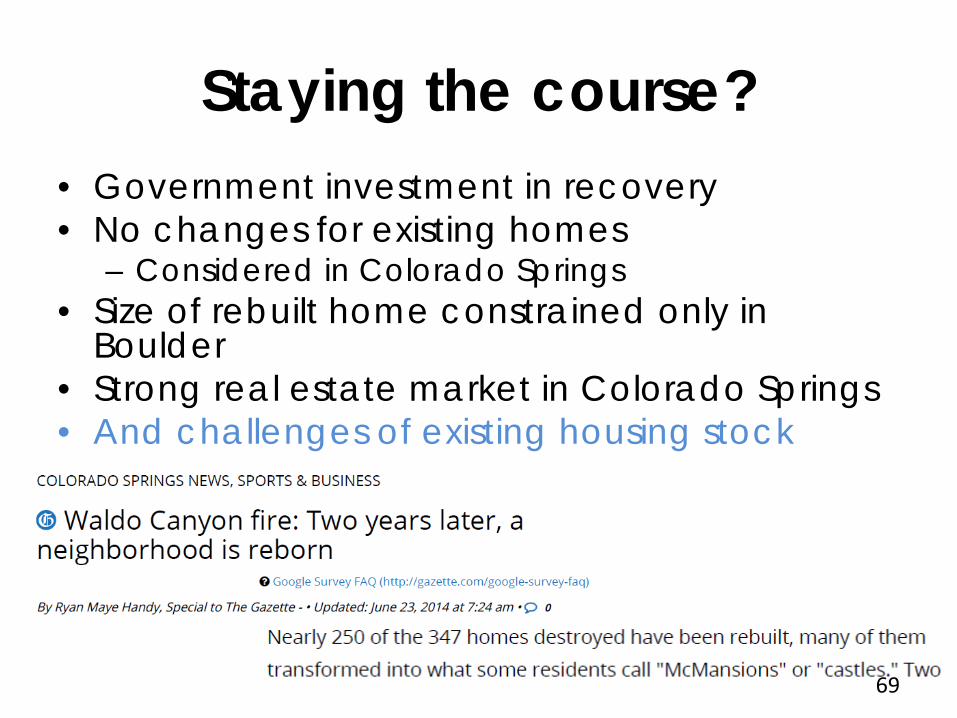
• Government investment in recovery • No changes for existing homes
– Considered in Colorado Springs • Size of rebuilt home constrained only in
Boulder • Strong real estate market in Colorado Springs • And challenges of existing housing stock
Staying the course?
69
planning.org