Embed Size (px)
Citation preview

The Women’s Health Initiative, Cohort The Women’s Health Initiative, Cohort Studies, and the Population Science Studies, and the Population Science
Research AgendaResearch Agenda
Ross L. PrenticeRoss L. Prentice
Fred Hutchinson Cancer Research CenterFred Hutchinson Cancer Research Center
and University of Washingtonand University of Washington
How can we obtain answers concerning health benefits and risks of behavior changes (interventions), and know that
the answers are reliable?
• Major research tools each have important limitations (RCT; intermediate outcome trial; cohort and case-control studies)
• Most population science research is outcome-centric, rather than intervention-centric.
• Suitable forums for identifying priority research opportunities and needed methodology development are generally lacking.

Major Research Tools Major Research Tools Each Have Important LimitationsEach Have Important Limitations
Randomized controlled intervention trialsRandomized controlled intervention trials
• Cost, logistics, intervention adherence?Cost, logistics, intervention adherence?
• Only a small number are feasible at any time.Only a small number are feasible at any time.
Intermediate outcome clinical trialsIntermediate outcome clinical trials
• Sufficiently comprehensive outcomes?Sufficiently comprehensive outcomes?
• Methods to integrate data across many short-term outcomes?Methods to integrate data across many short-term outcomes?
• Ability to replace full-scale clinical outcome trial? (surrogate Ability to replace full-scale clinical outcome trial? (surrogate outcomes)outcomes)
Observational studiesObservational studies
• When are potential biases negligible? (confounding, selection, When are potential biases negligible? (confounding, selection, measurement error)measurement error)
• What assurance can be provided by replication in multiple What assurance can be provided by replication in multiple populations?populations?
• How does reliability depend on nature of exposure variable/potential How does reliability depend on nature of exposure variable/potential intervention and its measurement characteristics?intervention and its measurement characteristics?

Some Possible Ways ForwardSome Possible Ways Forward
Comparative and joint analysis of RCT and Observational Study dataComparative and joint analysis of RCT and Observational Study data
• Differences may reflect residual bias in observational study (or Differences may reflect residual bias in observational study (or differences in study populations; limitations of data analysis differences in study populations; limitations of data analysis procedures; study power or adherence issues, or differential procedures; study power or adherence issues, or differential outcome ascertainment in either study type).outcome ascertainment in either study type).
• Joint analyses may usefully extend RCT results.Joint analyses may usefully extend RCT results.
Enhanced role of biomarkers to strengthen each type of studyEnhanced role of biomarkers to strengthen each type of study
• Biomarkers to calibrate difficult-to-measure exposures in Biomarkers to calibrate difficult-to-measure exposures in observational studies, and for explanatory analysis of intervention observational studies, and for explanatory analysis of intervention effects on RCTs.effects on RCTs.
• Biomarkers to enhance comprehensiveness of intermediate Biomarkers to enhance comprehensiveness of intermediate outcome RCTs.outcome RCTs.
Cooperative group to advise NIH and other funding sources on Cooperative group to advise NIH and other funding sources on research research
opportunities and needs in chronic disease population researchopportunities and needs in chronic disease population research

Design of WHI
DM HRT
CaD
os
48,835 27,347
36,282
93,676
CT=68,132
WHI =161,808
WHI Hormone Program Design
Hysterectomy
Conjugated equine estrogen (CEE) 0.625 mg/d
Placebo
CEE 0.625 mg/d + medroxyprogesterone acetate (MDA) 2.5 mg/d
N= 16,608
N= 10,739YES
NO
Placebo

Clinical Outcomes in the WHI Postmenopausal Hormone Therapy Trials
(JAMA 2002, 2004)
Hazard Ratio 95% CI Hazard Ratio 95% CI
Coronary heart disease 1.29 1.02 - 1.63 0.91 0.75 - 1.12Stroke 1.41 1.07 - 1.85 1.39 1.10 - 1.77Venous thromboembolism 2.11 1.58 - 2.82 1.33 0.99 - 1.79Invasive breast cancer 1.26 1.00 - 1.59 0.77 0.59 - 1.01Colorectal cancer 0.63 0.43 - 0.92 1.08 0.75 - 1.55Endometrial cancer 0.83 0.47 - 1.47 Hip fracture 0.66 0.45 - 0.98 0.61 0.41 - 0.91Death due to other causes 0.92 0.74 - 1.14 1.08 0.88 - 1.32Global index 1.15 1.03 - 1.28 1.01 0.91 - 1.12
Number of women 8506 8102 5310 5429Follow-up time, mean (SD), mo 62.2 (16.1) 61.2 (15.0) 81.6 (19.3) 81.9 (19.7)
E+P Trial E-Alone TrialOutcomes

Postmenopausal Hormone Therapy (E+P) and Cardiovascular Disease
Women’s Health Initiative study of estrogen plus progestin among postmenopausal women in the age range 50-79 at baseline*
CT OS Age-adj Age-adj Placebo E+P HR Control E+P HR
Number of women 8102 8506 35,551 17,503
Number of events:
CHD 147 188 1.21 615 158 0.71
Stroke 107 151 1.33 490 123 0.77
VT 76 167 2.10 336 153 1.06
*Prentice RL, Langer R, Stefanick ML, Howard BV, Pettinger M, Anderson G, Barad D, Curb D, Kotchen J, Kuller L, Limacher M, Wactawski-Wende J. American Journal of Epidemiology 162:404-414; 2005.

Cox Model
h(t; Z(t)) = hos(t)exp(x(t)/β)
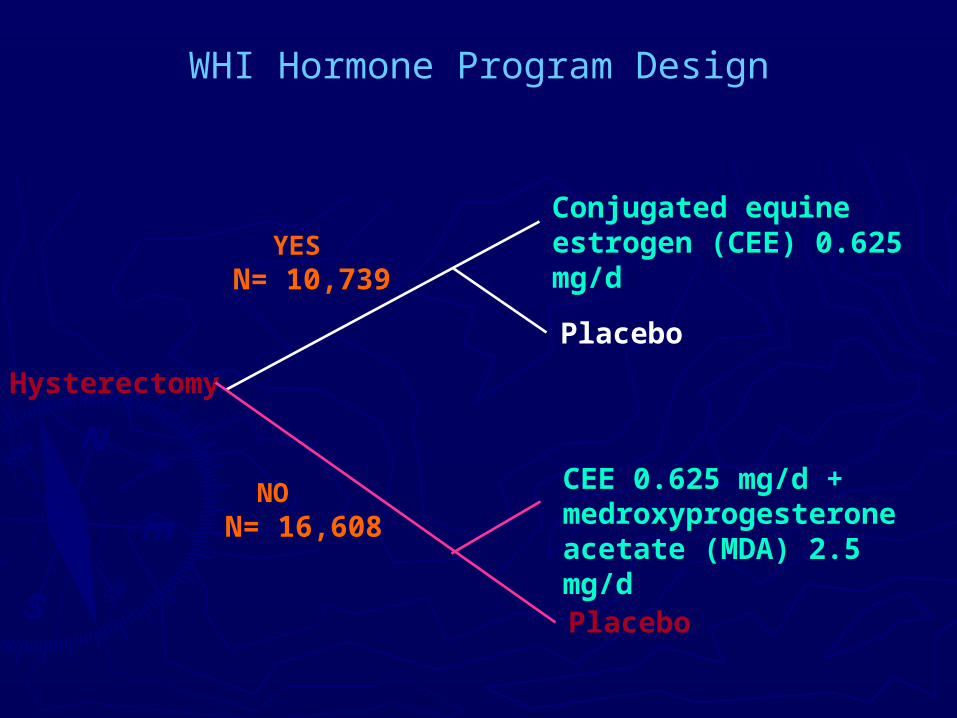
HR (95% CI) HR (95% CI) HR (95% CI)Factor CHD Stroke VT
E+P in CT 1.27 (1.00, 1.61) 1.21 (0.93, 1.59) 2.13 (1.59, 2.85)E+P in OS 0.87 (0.72, 1.05) 0.86 (0.70, 1.07) 1.31 (1.07, 1.61)E+P in OS/E+P in CT 0.70 (0.52, 0.95) 0.72 (0.52, 1.02) 0.62 (0.43, 0.88)
CVD Hazard Ratios for E+P Use,in Joint Analyses of Data from CT and OS
Cohorts, Controlling for Potential Confounding Factors
Adjusted for age (linear), ethnicity, bmi (categorical plus linear), education, smoking, age at menopause, physical functioning.
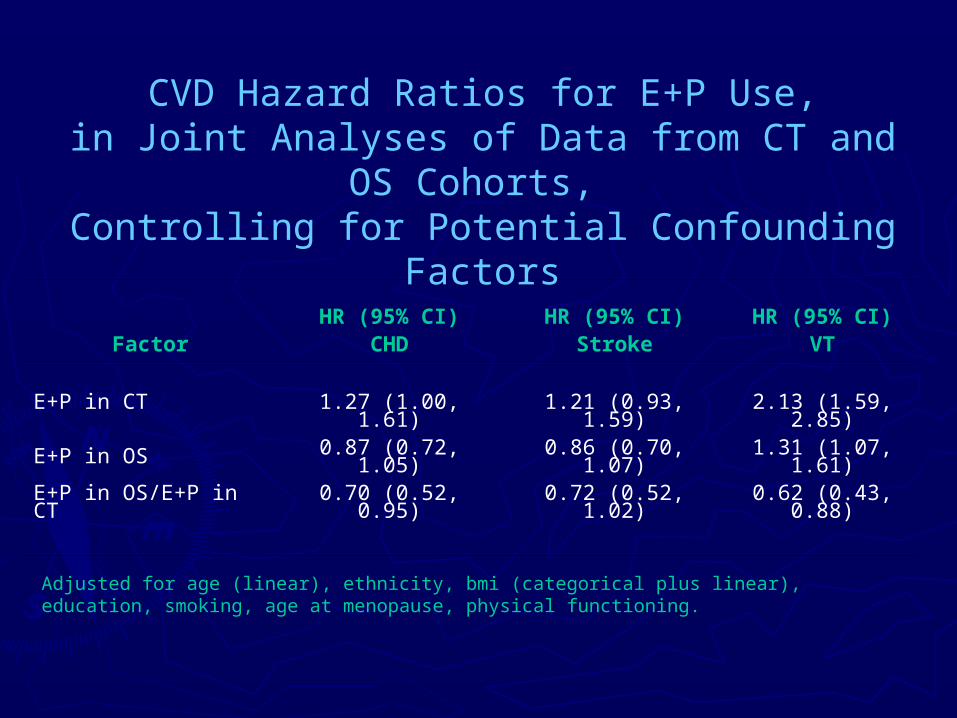
Years From E+P
InitiationHR in CT HR in OS
HR in CT Under Constant OS to CT
Ratio
HR Common to CT and OS
2 1.68 (1.15, 2.45; 80) 1.12 (0.46, 2.74; 5) 1.58 (1.12, 2.24) 1.56 (1.12, 2.19)
(2, 5) 1.25 (0.87, 1.79; 80) 1.05 (0.70, 1.58; 27) 1.19 (0.87, 1.63) 1.16 (0.89, 1.51)
> 5 0.66 (0.36, 1.21; 28) 0.83 (0.67, 1.01; 126) 0.86 (0.59, 1.26) 0.81 (0.67, 0.99)
E+P in OS/E+P in CT 0.93 (0.64, 1.36)
E+P Hazard Ratio in the CT and OS as a Function of Time
from Initiation of E+P Use
Coronary Heart Disease

ObservationalStudy
1.16CHD HR
0.81
Clinical Trial
1.56
Difference in Distribution in Years from E+P Initiationbetween WHI Cohorts

0.61 (0.46, 0.81)
0.93 (0.64, 1.36)
0.71 (0.52, 0.95)
0.58 (0.42, 0.80)
0.52 (0.37, 0.73)
0.72 (0.52, 1.02)
0.76 (0.49, 1.18)
0.62 (0.43, 0.88)
0.84 (0.54, 1.28)
0.3 0.4 0.5 0.6 0.7 0.8 0.9 1.0 1.1 1.2 1.3 1.4 1.5
Coronary Heart Disease
Stroke
Venous Thromboembolism
HR in OS / HR in CT
Ratio of OS to CT Hazard Ratios for E+P Use

E+P Hazard Ratios (95% CIs) as a Function of Years from E+P Initiation, and Average HRs over Various Times from E+P Initiation, Assuming Common HR
Functions in the CT and OS
Years from Coronary Heart Disease Venous ThromboembolismE+P Initiation HR (95% CI) HR (95% CI)
< 2 1.56 (1.12, 2.19) 2.87 (1.89, 4.35) 2 – 5 1.16 (0.89, 1.51) 1.70 (1.28, 2.26) > 5 0.81 (0.67, 0.99) 1.26 (1.02, 1.56)
Average HR (95% CI) Average HR (95% CI)
2 1.56 (1.12, 2.19) 2.87 (1.89, 4.35) 4 1.36 (1.09, 1.70) 2.28 (1.72, 3.03) 6 1.27 (1.04, 1.54) 2.07 (1.62, 2.63) 8 1.13 (0.96, 1.33) 1.83 (1.50, 2.23) 10 1.07 (0.92, 1.24) 1.71 (1.43, 2.05)
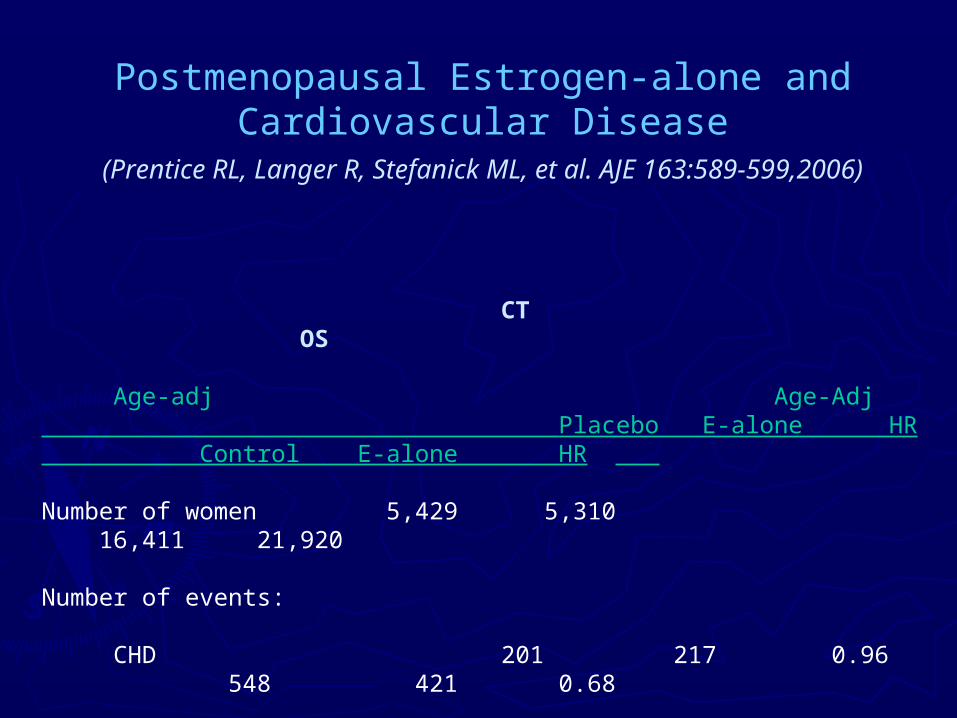
Postmenopausal Estrogen-alone andCardiovascular Disease
(Prentice RL, Langer R, Stefanick ML, et al. AJE 163:589-599,2006)
CT OS Age-adj Age-Adj Placebo E-alone HR Control E-alone HR
Number of women 5,429 5,310 16,411 21,920
Number of events:
CHD 201 217 0.96 548 421 0.68
Stroke 127 168 1.37 408 431 0.95
VT 86 111 1.33 274 265 0.78
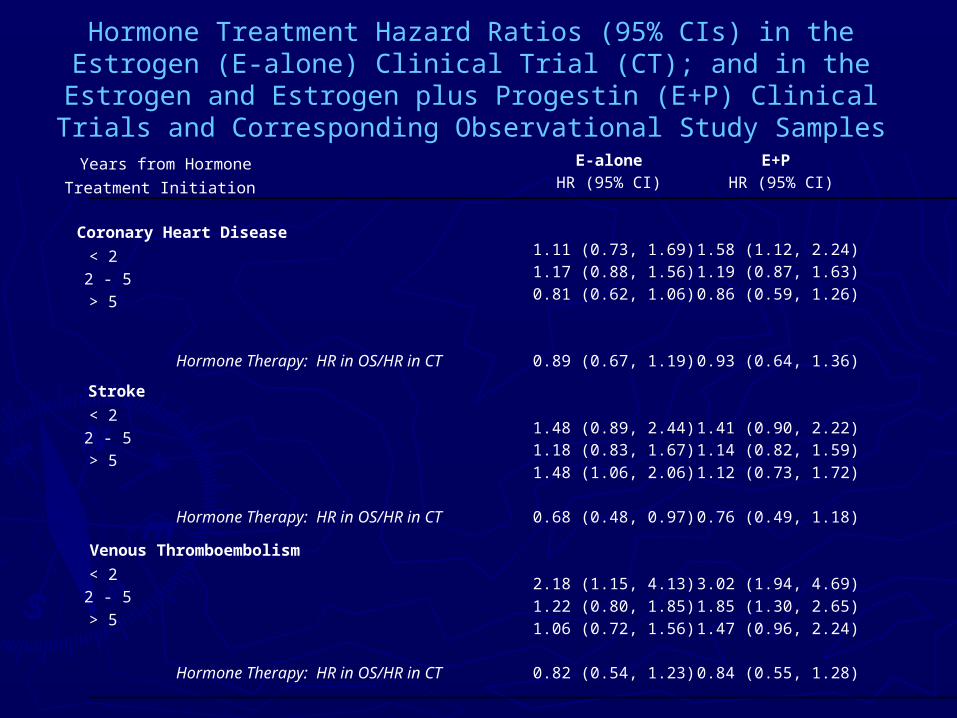
Hormone Treatment Hazard Ratios (95% CIs) in the Estrogen (E-alone) Clinical Trial (CT); and in the Estrogen and Estrogen
plus Progestin (E+P) Clinical Trials and Corresponding Observational Study Samples
Years from Hormone E-alone E+P
Treatment Initiation HR (95% CI) HR (95% CI)
Coronary Heart Disease
< 2 1.11 (0.73, 1.69) 1.58 (1.12, 2.24)
2 - 5 1.17 (0.88, 1.56) 1.19 (0.87, 1.63)
> 5 0.81 (0.62, 1.06) 0.86 (0.59, 1.26)
Hormone Therapy: HR in OS/HR in CT 0.89 (0.67, 1.19) 0.93 (0.64, 1.36)
Stroke
< 21.48 (0.89, 2.44) 1.41 (0.90, 2.22)
2 - 51.18 (0.83, 1.67) 1.14 (0.82, 1.59)
> 51.48 (1.06, 2.06) 1.12 (0.73, 1.72)
Hormone Therapy: HR in OS/HR in CT 0.68 (0.48, 0.97) 0.76 (0.49, 1.18)
Venous Thromboembolism
< 22.18 (1.15, 4.13) 3.02 (1.94, 4.69)
2 - 51.22 (0.80, 1.85) 1.85 (1.30, 2.65)
> 5 1.06 (0.72, 1.56) 1.47 (0.96, 2.24)
Hormone Therapy: HR in OS/HR in CT 0.82 (0.54, 1.23) 0.84 (0.55, 1.28)
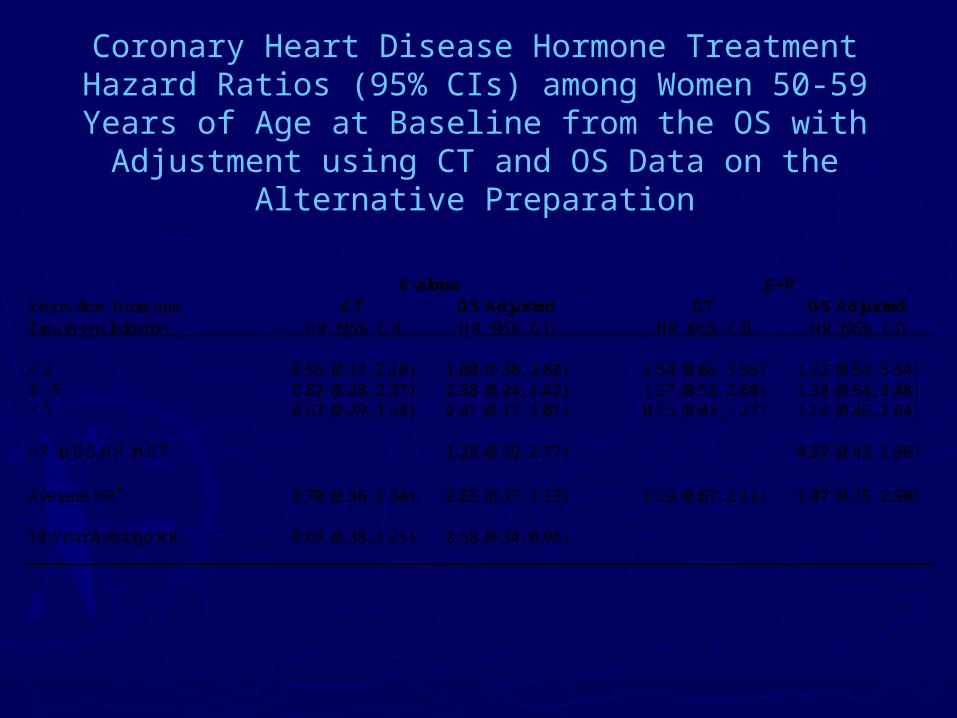
Years from Hormone CT OS Adjusted CT OS AdjustedTreatment Initiation HR (95% CI) HR (95% CI) HR (95% CI) HR (95% CI)
< 2 0.55 (0.14, 2.18) 1.00 (0.38, 2.60) 1.54 (0.66, 3.55) 1.72 (0.54, 5.54)2 - 5 0.82 (0.28, 2.37) 0.58 (0.24, 1.40) 1.17 (0.52, 2.60) 1.38 (0.54, 3.48)> 5 0.67 (0.29, 1.54) 0.41 (0.17, 1.01) 0.15 (0.02, 1.27) 1.14 (0.46, 2.84)
HR in OS/HR in CT 1.28 (0.59, 2.77) 0.92 (0.43, 1.96)
Average HR‡ 0.70 (0.36, 1.34) 0.65 (0.37, 1.13) 1.19 (0.67, 2.11) 1.47 (0.75, 2.90)
10-Year Average HR 0.69 (0.38, 1.25) 0.58 (0.34, 0.98)
E-alone E+P
Coronary Heart Disease Hormone Treatment Hazard Ratios (95% CIs) among Women 50-59
Years of Age at Baseline from the OS with Adjustment using CT and OS Data on the
Alternative Preparation
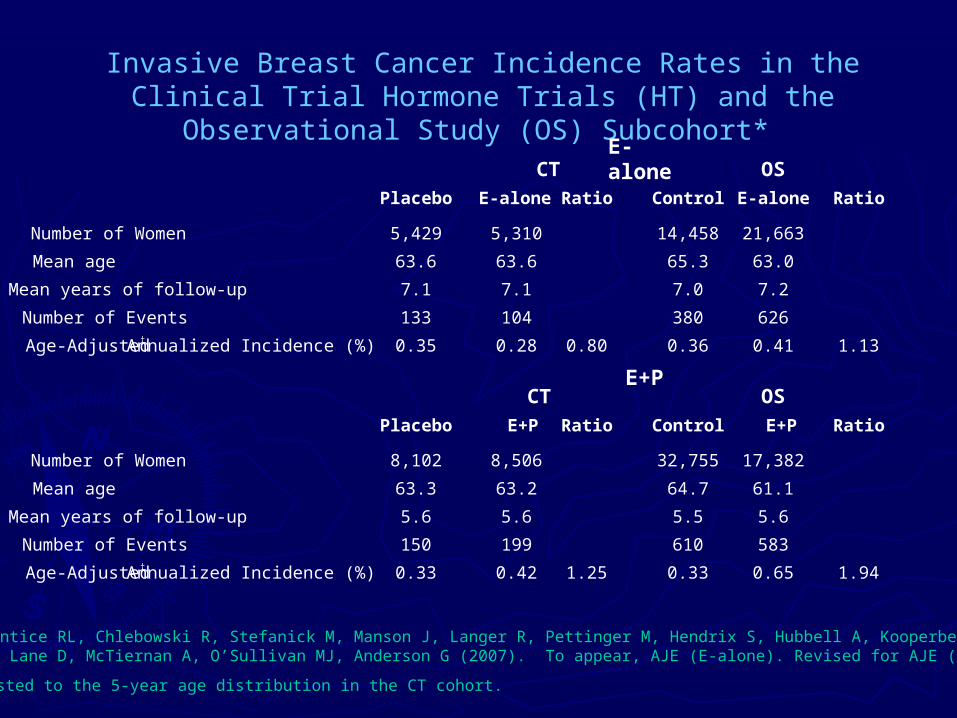
Invasive Breast Cancer Incidence Rates in the Clinical Trial Hormone Trials (HT) and the Observational Study (OS)
Subcohort*
*From Prentice RL, Chlebowski R, Stefanick M, Manson J, Langer R, Pettinger M, Hendrix S, Hubbell A, Kooperberg C, Kuller L, Lane D, McTiernan A, O’Sullivan MJ, Anderson G (2007). To appear, AJE (E-alone). Revised for AJE (E+P).
†Age-adjusted to the 5-year age distribution in the CT cohort.
Placebo E-alone Ratio Control E-alone Ratio
Number of Women 5,429 5,310 14,458 21,663
Mean age 63.6 63.6 65.3 63.0
Mean years of follow-up 7.1 7.1 7.0 7.2
Number of Events 133 104 380 626
Age-Adjusted† Annualized Incidence (%) 0.35 0.28 0.80 0.36 0.41 1.13
Placebo E+P Ratio Control E+P Ratio
Number of Women 8,102 8,506 32,755 17,382
Mean age 63.3 63.2 64.7 61.1
Mean years of follow-up 5.6 5.6 5.5 5.6
Number of Events 150 199 610 583
Age-Adjusted† Annualized Incidence (%) 0.33 0.42 1.25 0.33 0.65 1.94
CT OS
CT OSE+P
E-alone
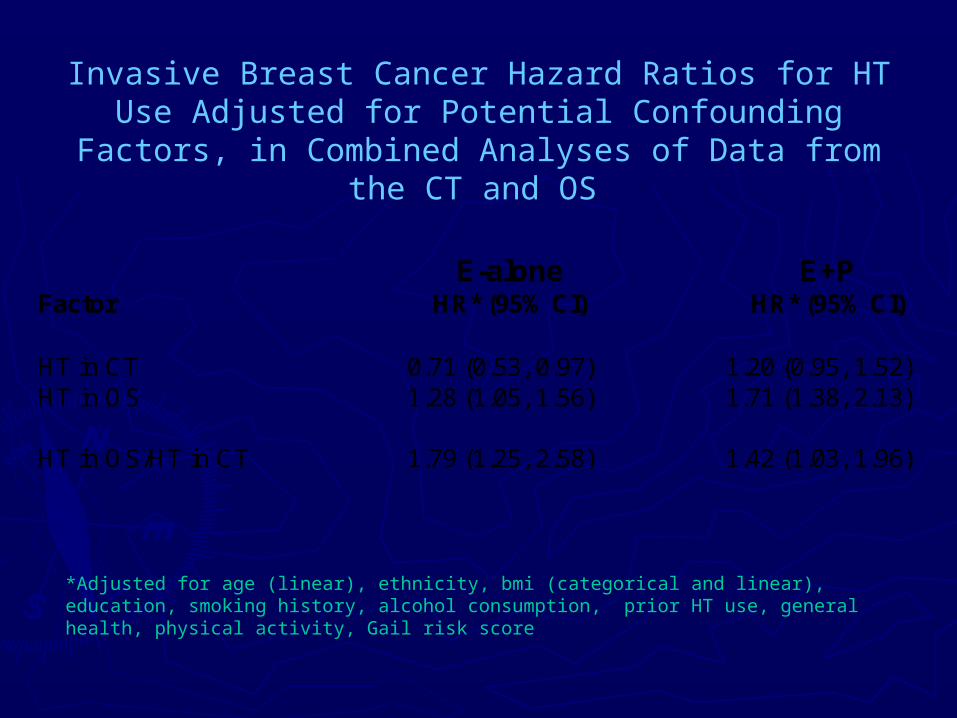
Invasive Breast Cancer Hazard Ratios for HT Use Adjusted for Potential Confounding Factors, in
Combined Analyses of Data from the CT and OS
*Adjusted for age (linear), ethnicity, bmi (categorical and linear), education, smoking history, alcohol consumption, prior HT use, general health, physical activity, Gail risk score
Factor
HT in CT 0.71 (0.53, 0.97) 1.20 (0.95, 1.52)HT in OS 1.28 (1.05, 1.56) 1.71 (1.38, 2.13)
HT in OS/HT in CT 1.79 (1.25, 2.58) 1.42 (1.03, 1.96)
E-alone E+PHR* (95% CI) HR* (95% CI)

Breast Cancer Hazard Ratio Estimates according to Prior Postmenopausal Hormone Therapy Status and
Years from Hormone Therapy Initiation
CEE CEE/MPA Prior HT No Prior HT Prior HT No Prior HT HR (95% CI) HR (95% CI) HR (95% CI) HR (95% CI) Years from HT Initiation < 2 1.23 (0.57, 2.68) 0.53 (0.25, 1.12) 1.12 (0.58, 2.15) 0.64 (0.40, 1.04) 2 - 5 0.72 (0.42, 1.24) 0.74 (0.48, 1.15) 2.17 (1.31, 3.58) 1.23 (0.42, 1.65) > 5 0.84 (0.52, 1.34) 0.73 (0.48, 1.11) 2.44 (1.34, 4.43) 1.91 (1.34, 2.71) HT in OS/HT in CT 1.42 (0.93, 2.16) 1.28 (0.90, 1.83)

Distribution of Women in the WHI Hormone Therapy Clinical Distribution of Women in the WHI Hormone Therapy Clinical Trials (CT), and in Corresponding Observational Study (OS) Trials (CT), and in Corresponding Observational Study (OS)
Subcohorts, According to Prior Use of Postmenopausal Hormone Subcohorts, According to Prior Use of Postmenopausal Hormone Therapy (HT) and Gap Time from Menopause to First Use of HT, Therapy (HT) and Gap Time from Menopause to First Use of HT,
Among Hormone Therapy UsersAmong Hormone Therapy Users
Prior HT*Gap time (yrs) < 5 5 - 15 > 15 < 5 5 - 15 > 15 < 5 5 - 15 > 15 < 5 5 - 15 > 15
Number of women 198 618 1136 2129 294 113 6626 1454 597 1662 213 30% of Women 10% 32% 58% 84% 12% 4% 76% 17% 7% 87% 11% 2%
Number of women 952 2338 2160 1864 302 63 4257 1115 338 916 113 17% of Women 17% 43% 40% 84% 14% 3% 75% 20% 6% 88% 11% 2%
CT OS
CEE Users
CEE/MPA Users
No Yes No Yes
*Prior HT is defined relative to WHI enrollment in the CT and in the non-user groups in the OS. Prior HT in the user groups in the OS is defined relative to the beginning of the on-going HT episode at enrollment.

Breast Cancer Hazard Ratio Estimates according to Prior Postmenopausal Hormone Therapy Status, Years from Hormone Therapy Initiation, and
Gap Time from Menopause to Hormone Therapy Initiation, among Women Adhering to their Baseline Hormone Therapy Status
*Gap time in years from menopause to first use of HT
Prior HT No Prior HT Gap Time Periods* <5 5-15 >15 HR (95% CI) HR (95% CI) HR (95% CI) HR (95% CI)
CEE Years from HT Initiation < 2 1.52 (0.63, 3.65) 1.08 (0.14, 8.19) 0.56 (0.13, 2.43) 0.92 (0.34, 2.47) 2 - 5 0.76 (0.40, 1.45) 1.61 (0.67, 3.88) 0.76 (0.29, 1.99) 0.61 (0.25, 1.46) > 5 0.85 (0.46, 1.58) 0.98 (0.54, 1.75) 0.77 (0.40, 1.50) 0.76 (0.35, 1.64) HT in OS/HT in CT 1.07 (0.61, 1.89)
CEE/MPA Years from HT Initiation < 2 1.61 (0.76, 3.41) 1.32 (0.56, 3.11) 0.73 (0.35, 1.52) 0.37 (0.13, 1.06) 2 - 5 3.51 (1.81, 6.81) 1.85 (1.03, 3.34) 1.61 (1.00, 2.59) 0.81 (0.44, 1.48) > 5 2.76 (1.31, 5.79) 2.75 (1.73, 4.39) 2.00 (1.19, 3.36) 1.23 (0.53, 2.86) HT in OS/HT in CT 1.15 (0.74, 1.80)

Estimated Hazard Ratios (HRs) for CEE and CEE/MPA for Women Estimated Hazard Ratios (HRs) for CEE and CEE/MPA for Women Who Begin Hormone Therapy (HT) Immediately Following the Who Begin Hormone Therapy (HT) Immediately Following the Menopause and Adhere to their HT Regimen, from Combined Menopause and Adhere to their HT Regimen, from Combined
Analysis of WHI Clinical Trial (CT) and Observational Study (OS) Analysis of WHI Clinical Trial (CT) and Observational Study (OS) DataData
5-year Ratio ofGap Time HR in OS to
< 2 2 - 5 > 5 < 2 2 - 5 > 5 Increase HR in CTHR (95% CI) HR (95% CI) HR (95% CI) HR (95% CI) HR (95% CI) HR (95% CI) HR (95% CI) Ratio (95% CI)
CHD CEE 1.06 (0.53, 2.10) 0.92 (0.49, 1.72) 0.57 (0.44, 0.75) 1.25 (0.64, 2.45) 1.44 (0.80, 2.61) 0.84 (0.53, 1.33) 0.99 (0.87, 1.14) 0.95 (0.57, 1.58)CEE/MPA 1.32 (0.72, 2.39) 1.19 (0.66, 2.12) 0.93 (0.63, 1.38) 2.59 (1.09, 6.15) 1.04 (0.44, 2.43) 1.81 (0.71, 4.58) 1.04 (0.87, 1.24) 0.75 (0.41, 1.40)
Stroke CEE 1.29 (0.60, 2.75) 1.44 (0.72, 2.88) 1.12 (0.84, 1.49) 1.33 (0.58, 3.06) 1.24 (0.68, 2.27) 1.39 (0.89, 2.18) 1.04 (0.92, 1.18) 0.44 (0.24, 0.82)CEE/MPA 1.30 (0.59, 2.87) 1.45 (0.73, 2.89) 1.21 (0.78, 1.88) 1.53 (0.50, 4.70) 0.89 (0.40, 2.00) 0.80 (0.32, 2.00) 0.96 (0.77, 1.19) 0.34 (0.14, 0.79)
VT CEE 1.01 (0.37, 2.74) 0.70 (0.30, 1.62) 0.66 (0.47, 0.94) 3.70 (1.23, 11.13) 1.92 (0.90, 4.11) 1.20 (0.64, 2.23) 1.14 (0.97, 1.34) 0.66 (0.33, 1.36)CEE/MPA 5.00 (2.43, 10.28) 2.33 (1.26, 4.29) 1.73 (1.16, 2.59) 1.58 (0.68, 3.66) 1.94 (0.78, 4.85) 1.06 (0.30, 3.71) 1.04 (0.87, 1.26) 0.59 (0.31, 1.15)
Breast cancer CEE 1.48 (0.57, 3.86) 1.20 (0.66, 2.18) 1.07 (0.82, 1.39) 1.64 (0.68, 3.95) 0.83 (0.44, 1.57) 0.95 (0.58, 1.56) 0.84 (0.73, 0.98) 1.07 (0.60, 1.93)(Invasive) CEE/MPA 1.08 (0.59, 1.98) 2.27 (1.51, 3.41) 3.34 (2.64, 4.22) 1.81 (0.85, 3.86) 4.17 (2.22, 7.85) 3.29 (1.67, 6.48) 0.80 (0.69, 0.92) 1.06 (0.66, 1.71)
Colorectal Cancer CEE 1.20 (0.39, 3.64) 1.01 (0.30, 3.40) 0.73 (0.42, 1.29) 0.90 (0.31, 2.64) 0.38 (0.10, 1.39) 1.85 (0.81, 4.25) 0.95 (0.72, 1.25) 0.32 (0.09, 1.17)(Invasive) CEE/MPA 0.64 (0.20, 2.10) 0.62 (0.23, 1.68) 0.90 (0.48, 1.70) 0.56 (0.13, 2.34) 0.30 (0.06, 1.45) 1.08 (0.29, 4.01) 1.16 (0.84, 1.62) 1.85 (0.68, 5.01)
Endometrial Cancer CEE/MPA 1.62 (0.26, 10.16) 1.76 (0.62, 4.98) 2.22 (1.28, 3.87) 0.34 (0.04, 2.92) 0.59 (0.16, 2.21) 0.90 (0.25, 3.28) 0.71 (0.48, 1.04) 1.13 (0.35, 3.67)(Invasive)
No Prior HT Prior HTYears from HT Initiation Years from HT Initiation
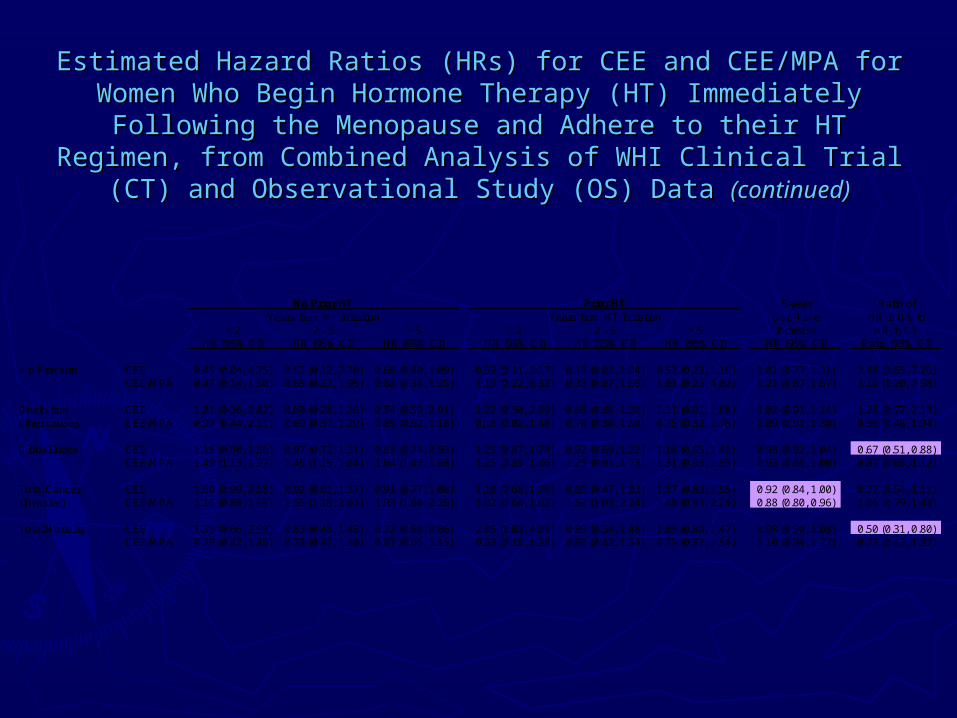
Estimated Hazard Ratios (HRs) for CEE and CEE/MPA for Women Estimated Hazard Ratios (HRs) for CEE and CEE/MPA for Women Who Begin Hormone Therapy (HT) Immediately Following the Who Begin Hormone Therapy (HT) Immediately Following the Menopause and Adhere to their HT Regimen, from Combined Menopause and Adhere to their HT Regimen, from Combined
Analysis of WHI Clinical Trial (CT) and Observational Study (OS) Analysis of WHI Clinical Trial (CT) and Observational Study (OS) Data Data (continued)(continued)
5-year Ratio ofGap Time HR in OS to
< 2 2 - 5 > 5 < 2 2 - 5 > 5 Increase HR in CTHR (95% CI) HR (95% CI) HR (95% CI) HR (95% CI) HR (95% CI) HR (95% CI) HR (95% CI) Ratio (95% CI)
Hip Fracture CEE 0.45 (0.04, 4.75) 0.52 (0.12, 2.30) 0.66 (0.40, 1.09) 0.59 (0.11, 3.17) 0.13 (0.02, 1.04) 0.52 (0.23, 1.16) 1.01 (0.77, 1.31) 2.48 (0.85, 7.26)CEE/MPA 0.47 (0.14, 1.60) 0.65 (0.22, 1.95) 0.68 (0.34, 1.35) 1.19 (0.22, 6.32) 0.33 (0.07, 1.66) 1.01 (0.25, 4.02) 1.21 (0.87, 1.67) 3.10 (1.20, 7.98)
Death from CEE 1.01 (0.36, 2.82) 0.60 (0.28, 1.26) 0.74 (0.59, 0.91) 1.22 (0.50, 2.99) 0.68 (0.36, 1.30) 1.31 (0.91, 1.88) 1.02 (0.91, 1.14) 1.28 (0.77, 2.13)other causes CEE/MPA 0.97 (0.44, 2.11) 0.69 (0.37, 1.29) 0.85 (0.62, 1.18) 0.18 (0.02, 1.48) 0.70 (0.30, 1.60) 0.75 (0.32, 1.76) 1.09 (0.91, 1.30) 0.96 (0.48, 1.94)
Global Index CEE 1.15 (0.80, 1.66) 0.97 (0.72, 1.31) 0.83 (0.74, 0.93) 1.25 (0.87, 1.78) 0.92 (0.69, 1.22) 1.16 (0.95, 1.42) 0.98 (0.92, 1.04) 0.67 (0.51, 0.88)CEE/MPA 1.49 (1.13, 1.97) 1.45 (1.15, 1.84) 1.64 (1.43, 1.88) 1.25 (0.85, 1.86) 1.25 (0.91, 1.73) 1.31 (0.93, 1.85) 0.93 (0.86, 1.00) 0.87 (0.68, 1.12)
Total Cancer CEE 1.60 (0.99, 2.58) 0.92 (0.61, 1.37) 0.91 (0.77, 1.08) 1.10 (0.68, 1.76) 0.69 (0.47, 1.03) 1.17 (0.89, 1.55) 0.92 (0.84, 1.00) 0.77 (0.54, 1.11)(Invasive) CEE/MPA 1.16 (0.80, 1.68) 1.55 (1.18, 2.03) 1.93 (1.64, 2.26) 1.02 (0.64, 1.62) 1.52 (1.03, 2.24) 1.48 (0.98, 2.24) 0.88 (0.80, 0.96) 1.06 (0.79, 1.43)
Total Mortality CEE 1.39 (0.66, 2.90) 0.83 (0.48, 1.45) 0.72 (0.60, 0.86) 2.06 (1.03, 4.09) 0.89 (0.54, 1.48) 1.09 (0.80, 1.47) 0.98 (0.90, 1.08) 0.50 (0.31, 0.80)CEE/MPA 0.79 (0.42, 1.49) 0.78 (0.47, 1.30) 0.87 (0.65, 1.15) 0.53 (0.18, 1.58) 0.80 (0.42, 1.54) 0.75 (0.37, 1.54) 1.10 (0.94, 1.27) 0.77 (0.43, 1.37)
No Prior HT Prior HTYears from HT Initiation Years from HT Initiation

Factors Included in Observational Study (OS) Hazard Ratio Factors Included in Observational Study (OS) Hazard Ratio Analyses to Control Confounding. Corresponding Coefficients are Analyses to Control Confounding. Corresponding Coefficients are
Estimated Separately for Subsets of Women With or Without Estimated Separately for Subsets of Women With or Without Prior Postmenopausal Hormone Therapy (HT)Prior Postmenopausal Hormone Therapy (HT)
CHD, stroke, VT,total mortality, total deaths from breast hip colorectal endometrial invasive
Variables other causes cancer fracture cancer cancer cancer global indexage (linear) x x x x x x xnon-white ethnicity (yes vs. no) x x x x x x xBMI* 25-29.9 x x x x x x xBMI 30-34.9 x x x x x x xBMI >= 35 x x x x x x xBMI (linear) x x x x x x xschool after HS (yes vs. no) x x x xcollege degree or higher (yes vs. no) x x x xpast smoker (yes vs. no) x x x x x x xcurrent smoker (yes vs. no) x x x x x x xage at menopause (linear)physical funtioning construct xpast drinker (yes vs. no) x x x xcurrent drinker, <1dr/wk x x x xcurrent drinker, 1-7 dr/wk x x x xcurrent drinker, > 7 dr/wk x x x xself reported general health (good/vgood/excl vs fair/poor) xtotal expenditure from physical activity (quartiles vs none) xfamily history of breast cancer (yes vs. no) xbilateral oophorectomy (yes vs. no) x x x xGail 5yr breast cancer risk score (linear) xGail 5yr breast cancer risk score 1.25- <1.75 xGail 5yr breast cancer risk score >=1.75 x
*BMI, body mass index

Factors Included in Observational Study (OS) Hazard Ratio Factors Included in Observational Study (OS) Hazard Ratio Analyses to Control Confounding. Corresponding Coefficients are Analyses to Control Confounding. Corresponding Coefficients are
Estimated Separately for Subsets of Women With or Without Estimated Separately for Subsets of Women With or Without Prior Postmenopausal Hormone Therapy (HT) Prior Postmenopausal Hormone Therapy (HT) (continued)(continued)
CHD, stroke, VT,total mortality, total deaths from breast hip colorectal endometrial invasive
Variables other causes cancer fracture cancer cancer cancer global indexDuration of prior E+P use < 5yr†
x x x x x x xDuration of prior E+P use 5-10yr†
x x x x x x xDuration of prior E+P use >10yr†
x x x x x x xDuration of prior E-alone use < 5yr†
x x x x x x xDuration of prior E-alone use 5-10yr†
x x x x x x xDuration of prior E-alone use >10yr†
x x x x x x xnumber of falls xtotal calcium intake, grams/day xfamily history of fracture (yes vs. no) xpersonal history of fracture (yes vs. no) xfamily history of colorectal cancer (yes vs. no) xwaist circumference (tertiles or 88cm cutoff) xheight (tertiles) xhistory of polyp removal (yes vs. no) xdietary selenium intake xhistory of treated diabetes (yes vs. no) x xNSAID* use (yes vs. no) xPrior OC* use (yes vs. no) xhistory of hypertension (yes vs. no) xfamily history of any cancer (yes vs. no) xpersonal history of non-melanoma skin cancer (yes vs. no) x
*NSAID, non-steroidal anti-inflammatory drug; OC, oral contraceptive†These factors included only for women with prior hormone therapy.

Lessons from Comparative and Joint CT and Lessons from Comparative and Joint CT and OS Analysis of Postmenopausal Hormone OS Analysis of Postmenopausal Hormone
Therapy EffectsTherapy Effects
• Ability to control prescription/confounding biases in OS may Ability to control prescription/confounding biases in OS may differ by clinical outcome (e.g., stroke, hip fracture).differ by clinical outcome (e.g., stroke, hip fracture).
• Careful design and analysis methods needed to obtain accurate Careful design and analysis methods needed to obtain accurate information from observational studies (allow for departures information from observational studies (allow for departures from proportional hazards, possible effect modification, …).from proportional hazards, possible effect modification, …).
• Clinical trial and observational study data may be able to be Clinical trial and observational study data may be able to be combined to obtain useful benefits and risk assessments combined to obtain useful benefits and risk assessments (important subsets, longer durations, …).(important subsets, longer durations, …).
• Intervention trials may be needed if public health implications Intervention trials may be needed if public health implications are sufficiently great.are sufficiently great.
• Comparative trial and observational study results for other Comparative trial and observational study results for other preventive interventions could be informative.preventive interventions could be informative.
Enhanced Role for Biomarkers in Enhanced Role for Biomarkers in Population Science ResearchPopulation Science Research
• Exposure biomarkers for difficult to measure Exposure biomarkers for difficult to measure exposures (e.g., dietary consumption or physical exposures (e.g., dietary consumption or physical activity patterns)activity patterns)
• High-dimensional biologic data to augment value of High-dimensional biologic data to augment value of intermediate outcome trialsintermediate outcome trials
e.g., Dietary fat and cancere.g., Dietary fat and cancer

Age-Adjusted Breast Cancer Incidence among Women of Ages 55-69 in 1980 versus per capita for
Consumption in 1975

Dietary Fat and Postmenopausal Breast Cancer
Fat Intake Quintile
Case-control StudiesHowe et al (1990, JCNI) 1 1.20 1.24 1.24 1.46
(p<0.0001)
Cohort StudiesHunter et al (1996, NEJM) 1 1.01 1.12 1.07 1.05 (p =
0.21)
Any reason to continue research on this topic?
Ability to adequately characterize and adjust for measurement error?

Underreporting of Energy and Protein
(Heitmann and Lissner, 1995, BMJ)

Dietary Change Goals:Intervention Group
Photos courtesy of USDA Agricultural Research Service
• 20% energy from fat
• 5 or more fruit and vegetable servings daily
• 6 or more grain servings daily

Mean (SD) of Nutrient Consumption by Randomization Group
*Difference significant at p<0.001 from a two sample t-test
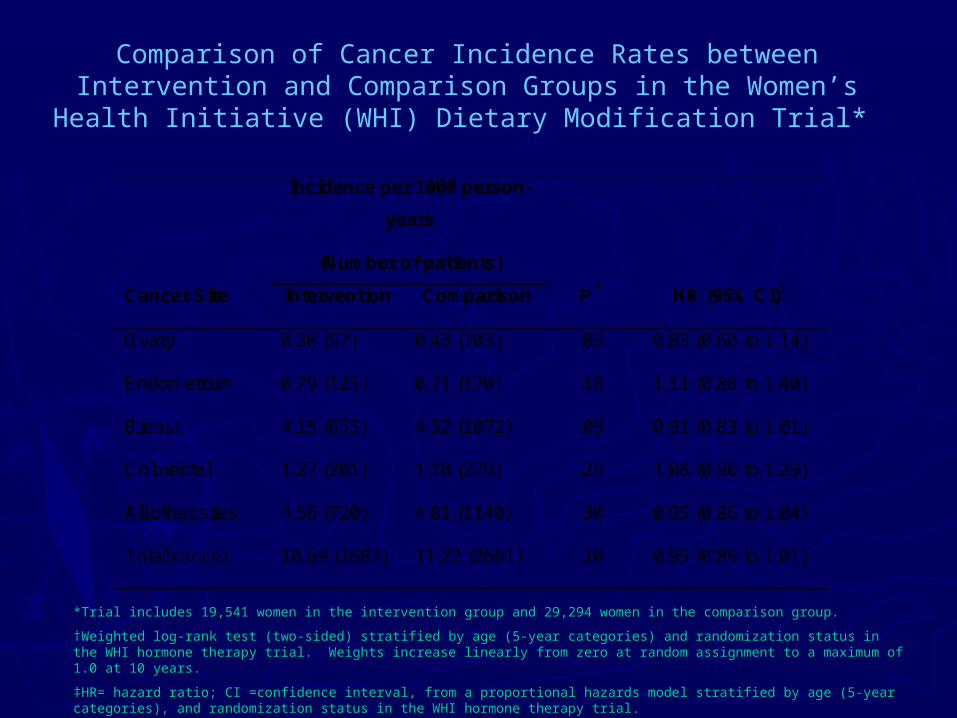
Comparison of Cancer Incidence Rates between Intervention and Comparison Groups in the Women’s Health Initiative
(WHI) Dietary Modification Trial*
Incidence per 1000 person-
years
(Number of patients)
Cancer Site Intervention Comparison P † HR (95% CI)‡
Ovary 0.36 (57) 0.43 (103) .03 0.83 (0.60 to 1.14)
Endometrium 0.79 (125) 0.71 (170) .18 1.11 (0.88 to 1.40)
Breast 4.15 (655) 4.52 (1072) .09 0.91 (0.83 to 1.01)
Colorectal 1.27 (201) 1.18 (279) .29 1.08 (0.90 to 1.29)
All other sites 4.56 (720) 4.81 (1140) .30 0.95 (0.86 to 1.04)
Total cancer 10.69 (1687) 11.22 (2661) .10 0.95 (0.89 to 1.01)
*Trial includes 19,541 women in the intervention group and 29,294 women in the comparison group.
†Weighted log-rank test (two-sided) stratified by age (5-year categories) and randomization status in the WHI hormone therapy trial. Weights increase linearly from zero at random assignment to a maximum of 1.0 at 10 years.
‡HR= hazard ratio; CI =confidence interval, from a proportional hazards model stratified by age (5-year categories), and randomization status in the WHI hormone therapy trial.
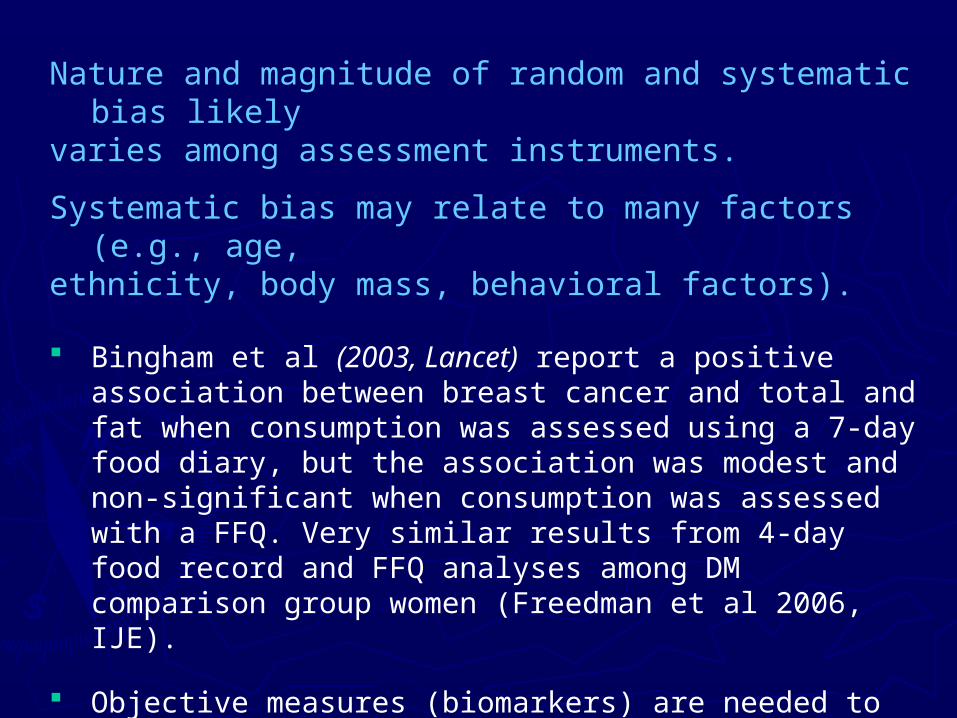
Nature and magnitude of random and systematic bias likely varies among assessment instruments.
Systematic bias may relate to many factors (e.g., age, ethnicity, body mass, behavioral factors).
Bingham et al (2003, Lancet) report a positive association between breast cancer and total and fat when consumption was assessed using a 7-day food diary, but the association was modest and non-significant when consumption was assessed with a FFQ. Very similar results from 4-day food record and FFQ analyses among DM comparison group women (Freedman et al 2006, IJE).
Objective measures (biomarkers) are needed to make progress in this important research area. Biomarker assessments in substudies (such as DLW measures of total energy expenditure) can be used to calibrate self-report assessments.

Nutrient Biomarker Substudy in the WHI DM Trial and Nutrition and Physical Activity Assessment Study in
WHI Observational Study
• 544 women completed two-week DLW protocol with urine and blood 544 women completed two-week DLW protocol with urine and blood collection and with FFQ and other questionnaire data collection collection and with FFQ and other questionnaire data collection (50% intervention, 50% control). A 20% reliability subsample (50% intervention, 50% control). A 20% reliability subsample repeated protocol separated, by about 6 months from original data repeated protocol separated, by about 6 months from original data collection.collection.
• Biomarker study among 450 women in the WHI Observational Study Biomarker study among 450 women in the WHI Observational Study for calibrating baseline FFQ, 4DFR, and PA questions, and for for calibrating baseline FFQ, 4DFR, and PA questions, and for evaluating measurement properties of prominent dietary and evaluating measurement properties of prominent dietary and physical activity assessment approaches (frequencies, records, and physical activity assessment approaches (frequencies, records, and recalls) and their combination.recalls) and their combination.

Associations of Participants Characteristics with Associations of Participants Characteristics with Measurement Error in Self-Reported Diet in the Measurement Error in Self-Reported Diet in the
Women’s Health Initiative Nutritional Biomarkers Women’s Health Initiative Nutritional Biomarkers StudyStudy
Characteristic
β (SE)
Total Energy
FFQ –TEE
(WHI RQ)
β (SE)
Protein
FFQ – UN
β (SE)
% Energy from Protein
FFQ – UN
Diet Change Intervention Group -80.3 (45.7) -2.6 (2.3) 0.5 (0.4)
BMI -23.4 (4.9) -0.4 (0.2) 0.1 (0.04)
Age 12.3 (3.9) 0.6 (0.2) 0.04 (0.03)
Black -176.1 (88.8) -7.7 (4.0) -0.9 (0.6)
Hispanic -200.8 (96.6) -8.7 (5.4) -0.4 (0.8)
Other race 225.7 (94.3) 6.2 (4.6) -0.2 (1.0)

Measurement Models for Nutritional Epidemiology(Carroll, Freedman, Kaaks, Kipnis, Spiegelman, Rosner, Prentice…)
Recovery Biomarkers:
Xbiomarker = Z + eWself-report = a0 + a1Z + a2V + a3ZV + r + ε
Can estimate odds ratios (Sugar et al, 2007,Bmcs), or hazard ratios (Shaw et al, 2007), corresponding to Z from cohort data on W and subcohort data on X.
Concentration Biomarkers:
Xbiomarker = b0 + b1Z + s + e
Inability to disassociate actual intake ‘Z’ from person-specific bias ‘s’ is a major limitation.
Needed research:
• Development of additional recovery-type biomarkers
• Methodologic work (e.g., feeding study designs) to facilitate use of concentration biomarkers

Regression Calibration Coefficients for Log-Regression Calibration Coefficients for Log-Transformed Total Energy, Total Protein and Transformed Total Energy, Total Protein and
Percent Energy from ProteinPercent Energy from Protein
Characteristic
a Coefficient
(SE) Total Energy
a Coefficient
(SE) Protein
a Coefficient (SE)
% Energy from Protein
Intercept 7.61 (0.13) 4.28 (0.024) 2.66 (0.01)
FFQ 0.062 (0.018) 0.212 (0.032) 0.439 (0.058)
BMI 0.013 (0.001) 0.012 (0.002) -0.004 (0.002)
Age -0.005 (0.001) -0.008 (0.002) -0.005 (0.002)
Black -0.016 (0.017) -0.130 (0.047) ---
Hispanic -0.004 (0.030) -0.021 (0.056) ---
Other Race -0.093 (0.027) -0.100 (0.058) ---
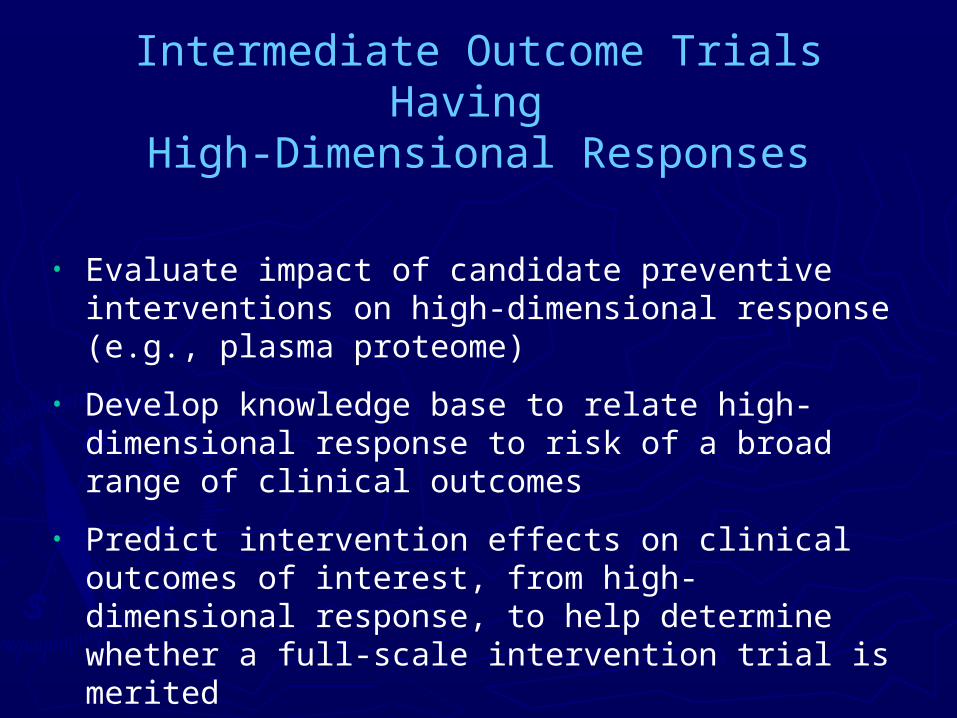
Intermediate Outcome Trials Having High-Dimensional Responses
• Evaluate impact of candidate preventive interventions on high-dimensional response (e.g., plasma proteome)
• Develop knowledge base to relate high-dimensional response to risk of a broad range of clinical outcomes
• Predict intervention effects on clinical outcomes of interest, from high-dimensional response, to help determine whether a full-scale intervention trial is merited
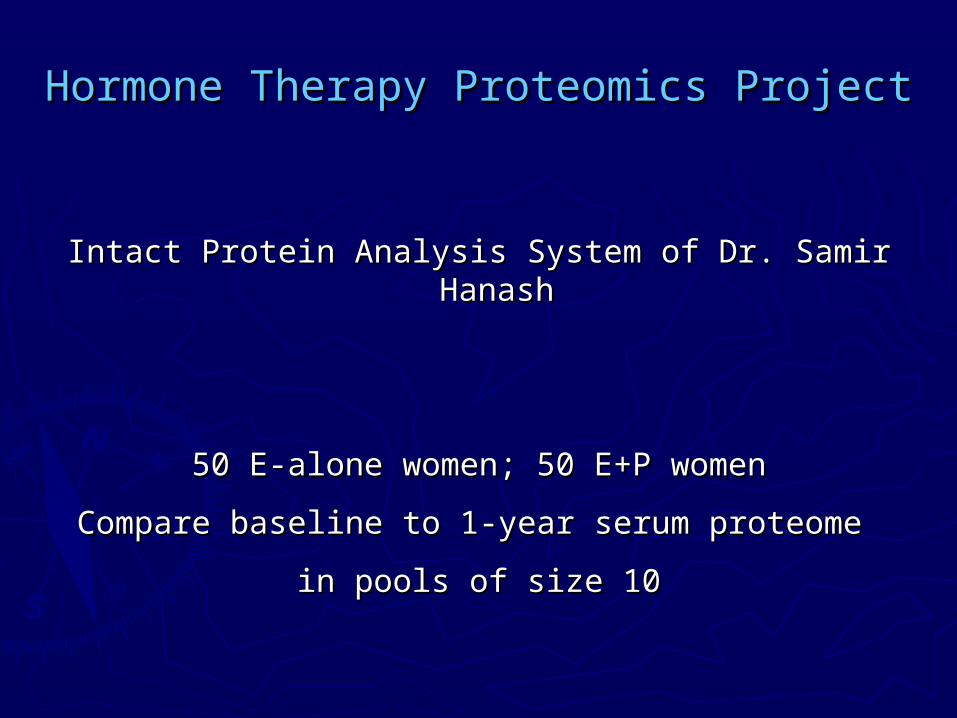
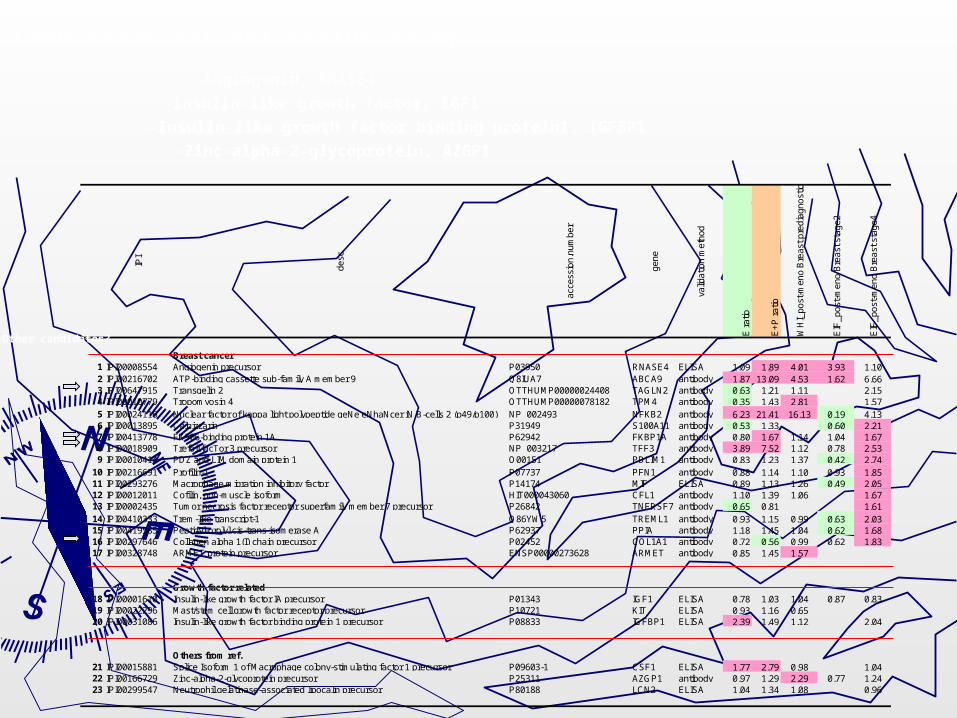
Hormone Therapy Proteomics ProjectHormone Therapy Proteomics Project
Intact Protein Analysis System of Dr. Samir HanashIntact Protein Analysis System of Dr. Samir Hanash
50 E-alone women; 50 E+P women50 E-alone women; 50 E+P women
Compare baseline to 1-year serum proteome Compare baseline to 1-year serum proteome
in pools of size 10in pools of size 10

BaselineBaseline HT 1yrHT 1yr Immunodepletion(top six proteins)
Concentration, buffer exchange and labeling
SAMPLES MIXED
ANION EXCHANGE CHROMATOGRAPHY
(12 pools)
REVERSE-PHASECHROMATOGRAPHY(11 fractions / AEX)
SAMPLE ALight Acrylamide
SAMPLE ALight Acrylamide
SAMPLE BHeavy Acrylamide(13Cx3=3Da shift)
SAMPLE BHeavy Acrylamide(13Cx3=3Da shift)
Reduction with DTT and Alkylation
12 x 11= 132 Fractions/IPAS
SHOTGUN LC-MS/MS
5 E+P: 132 x 5=660
5 E: 132 x 5=660
Total: 1,320 fractions
IPAS
Faca V et al., J. Proteome Res., 5, 2006, 2009-2018
Faca V et al., J. Proteome Res., 2007 accepted
“Quantitative analysis of acrylamide labeled serum proteins by LC-MS/MS”
“Contribution of protein fractionation to depth of analysis of the serum and plasma proteomes”
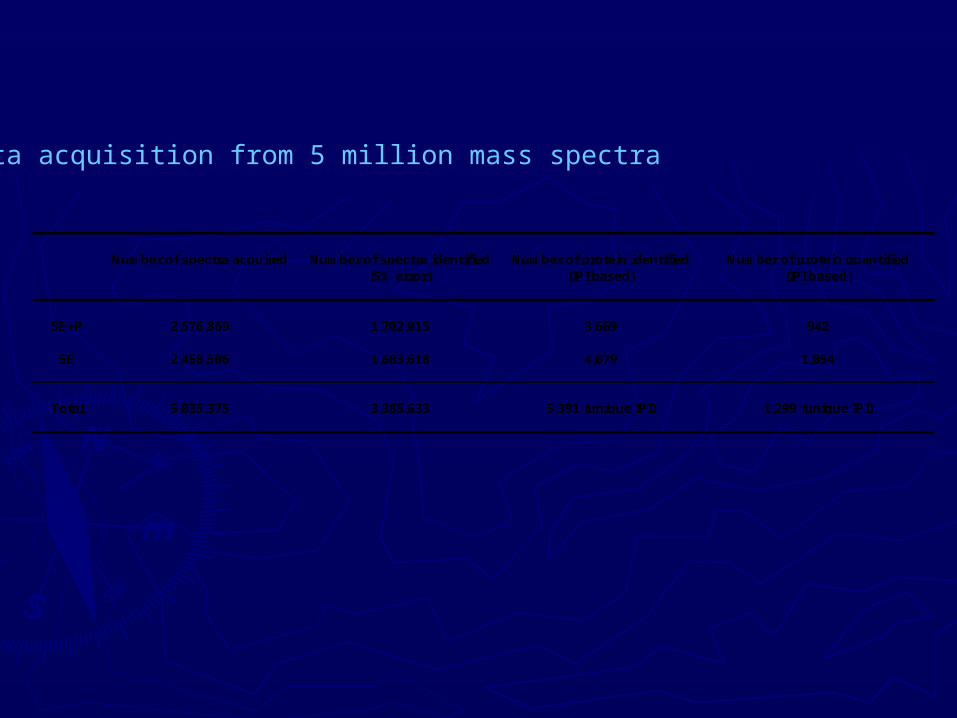
Number of spectra acquired Number of spectra identified Number of protein identified Number of protein quantified(5% error) (IPI based) (IPI based)
5E+P 2,576,869 1,702,015 3,669 942
5E 2,458,506 1,683,618 4,079 1,054
Total 5,035,375 3,385,633 5,391 (unique IPI) 1,299 (unique IPI)
Data acquisition from 5 million mass spectra

Ratio plot_common
-6
-4
-2
0
2
4
6
8
-8 -6 -4 -2 0 2 4 6 8
E log2(Ratio)
E+
P l
og
2(R
atio
)
698
E+P E952 1,054
Protein quant_common

IPI
desc
acce
ssio
n.nu
mbe
r
gene
valid
atio
n m
etho
d
E r
atio
E+
P r
atio
WH
I_po
st-m
eno
Bre
ast p
redi
agno
stic
EIF
_pos
t-m
eno
Bre
ast s
tage
2
EIF
_pos
t-m
eno
Bre
ast s
tage
4
Breast cancer 1 IPI00008554 Angiogenin precursor P03950 RNASE4 ELISA 1.09 1.89 4.01 3.93 1.102 IPI00216702 ATP-binding cassette sub-family A member 9 Q8IUA7 ABCA9 antibody 1.87 13.09 4.53 1.62 6.663 IPI00647915 Transgelin 2 OTTHUMP00000024408 TAGLN2 antibody 0.63 1.21 1.11 2.154 IPI00010779 Tropomyosin 4 OTTHUMP00000078182 TPM4 antibody 0.35 1.43 2.81 1.575 IPI00024116 Nuclear factor of kappa light polypeptide geNe eNhaNcer iN B-cells 2 (p49/p100) NP_002493 NFKB2 antibody 6.23 21.41 16.13 0.19 4.136 IPI00013895 Calgizzarin P31949 S100A11 antibody 0.53 1.33 0.60 2.217 IPI00413778 FK506-binding protein 1A P62942 FKBP1A antibody 0.80 1.67 1.14 1.04 1.678 IPI00018909 Trefoil facTor 3 precursor NP_003217 TFF3 antibody 3.89 7.52 1.12 0.78 2.539 IPI00010414 PDZ and LIM domain protein 1 O00151 PDLIM1 antibody 0.83 1.23 1.37 0.42 2.74
10 IPI00216691 Profilin-1 P07737 PFN1 antibody 0.88 1.14 1.10 0.93 1.8511 IPI00293276 Macrophage migration inhibitory factor P14174 MIF ELISA 0.89 1.13 1.26 0.49 2.0512 IPI00012011 Cofilin, non-muscle isoform HIT000043060 CFL1 antibody 1.10 1.39 1.06 1.6713 IPI00002435 Tumor necrosis factor receptor superfamily member 7 precursor P26842 TNFRSF7 antibody 0.65 0.81 1.6114 IPI00410333 Trem-like transcript-1 Q86YW5 TREML1
no antibody 0.93 1.15 0.99 0.63 2.03
15 IPI00419585 Peptidyl-prolyl cis-trans isomerase A P62937 PPIA antibody 1.18 1.45 1.04 0.62 1.6816 IPI00297646 Collagen alpha 1(I) chain precursor P02452 COL1A1 antibody 0.72 0.56 0.99 0.62 1.8317 IPI00328748 ARMET protein precursor ENSP00000273628 ARMET antibody 0.85 1.45 1.57
Growth factor related18 IPI00001610 Insulin-like growth factor IA precursor P01343 IGF1 ELISA 0.78 1.03 1.04 0.87 0.8319 IPI00022296 Mast/stem cell growth factor receptor precursor P10721 KIT ELISA 0.93 1.16 0.6520 IPI00031086 Insulin-like growth factor binding protein 1 precursor P08833 IGFBP1 ELISA 2.39 1.49 1.12 2.04
Others from ref.21 IPI00015881 Splice Isoform 1 of Macrophage colony-stimulating factor 1 precursor P09603-1 CSF1 ELISA 1.77 2.79 0.98 1.0422 IPI00166729 Zinc-alpha-2-glycoprotein precursor P25311 AZGP1 antibody 0.97 1.29 2.29 0.77 1.2423 IPI00299547 Neutrophil gelatinase-associated lipocalin precursor P80188 LCN2 ELISA 1.04 1.34 1.08 0.96
Candidates for validation assay
-Angiogenin, RNASE4
-Insulin-like growth factor, IGF1
-Insulin-like growth factor binding protein1, IGFBP1
-Zinc-alpha-2-glycoprotein, AZGP1
Other candidates?

Population Science Research NeedsPopulation Science Research Needs
• An enhanced preventive intervention development An enhanced preventive intervention development enterpriseenterprise
• Observational studies of maximal reliability for Observational studies of maximal reliability for promising intervention conceptspromising intervention concepts
• Full-scale intervention trials when rationale strong Full-scale intervention trials when rationale strong enough, and public health potential sufficiently greatenough, and public health potential sufficiently great
• Vigorous methodology development (e.g., to Vigorous methodology development (e.g., to incorporate exposure and intermediate outcome incorporate exposure and intermediate outcome biomarkers into research agenda)biomarkers into research agenda)
Infrastructure to facilitate?Infrastructure to facilitate?

Population Science Cooperative GroupPopulation Science Cooperative Group
• Identify preventive interventions that merit initial testing or Identify preventive interventions that merit initial testing or full-scale evaluationfull-scale evaluation
• Receive and evaluate preventive trial proposalsReceive and evaluate preventive trial proposals
• Identify and facilitate needed methodologic researchIdentify and facilitate needed methodologic research
Group CompositionGroup Composition
• Population, basic and clinical scientistsPopulation, basic and clinical scientists
• Leaders in key areas for intervention developmentLeaders in key areas for intervention development
• Leaders in major chronic disease research areasLeaders in major chronic disease research areas
• Representatives from within and outside of NIHRepresentatives from within and outside of NIH