Embed Size (px)
Citation preview
THE WONDERFUL WORLD OF DATA : BEYOND THE BASICS
Anne Klein Barna, MA, Health AnalystBarry-Eaton District Health [email protected]

Outline
Data Visualization Charts: Best Practices Using data in coalition and program
evaluation. Social determinants and health equity
data. Techniques for problem prioritization. New tools in data communication Qualitative analysis techniques Storytelling in prevention
Our eyes provide the greatest amount of information that is processed by our brains. Show, don’t tell!
Visual communication

General Principles of Tufte
http://www.youtube.com/watch?v=HfXSltlDfDw

Grand Principles of Analytical Design (Edward Tufte)
Show comparisons. Compared with what? Show causality. How did it happen? Multivariate analyses. To clarify, add detail. Choose the best mode. Integrate words and
numbers. Don’t restrict yourself. Whatever it takes.
Document everything and tell people about it. Integrity, quality, and credibility are important.
Passion about the content. High quality and high integrity of the content.
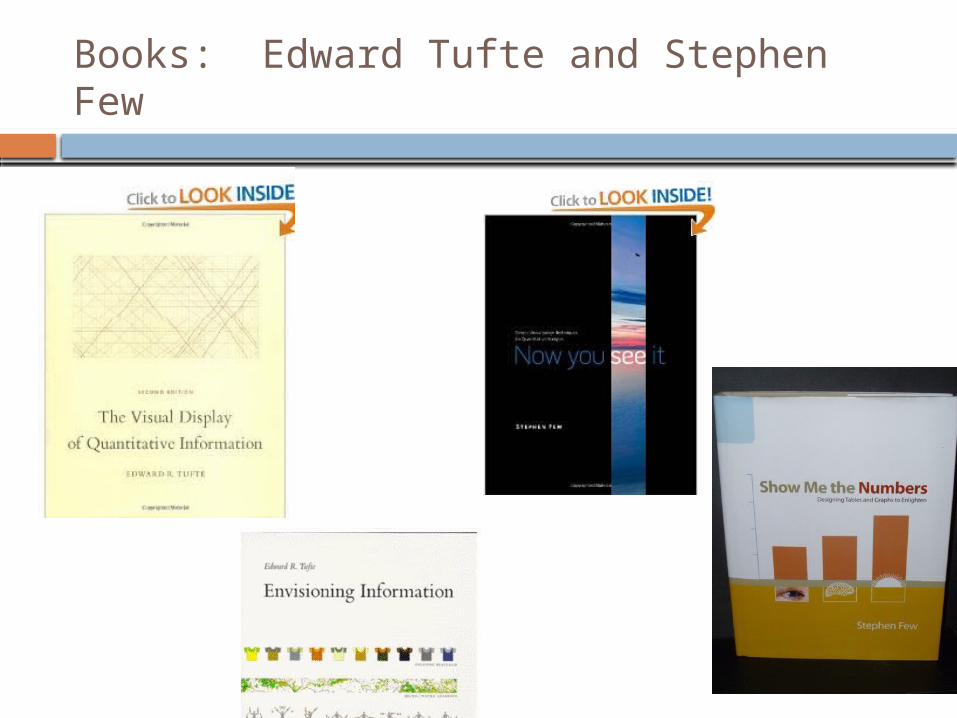
Books: Edward Tufte and Stephen Few
Data Journalism Handbook (free) http://datajournalismhandbo
ok.org/

Enhancing Visual Communications
Attract attention in an aesthetically pleasing way
Integrated into written and oral communications
Relevant and tailored to the audience Gender, race, ethnicity, socioeconomics
Simplicity!
Note this section adapted from:Communicating Public Health Information Effectively, 2002, Nelson et.al.
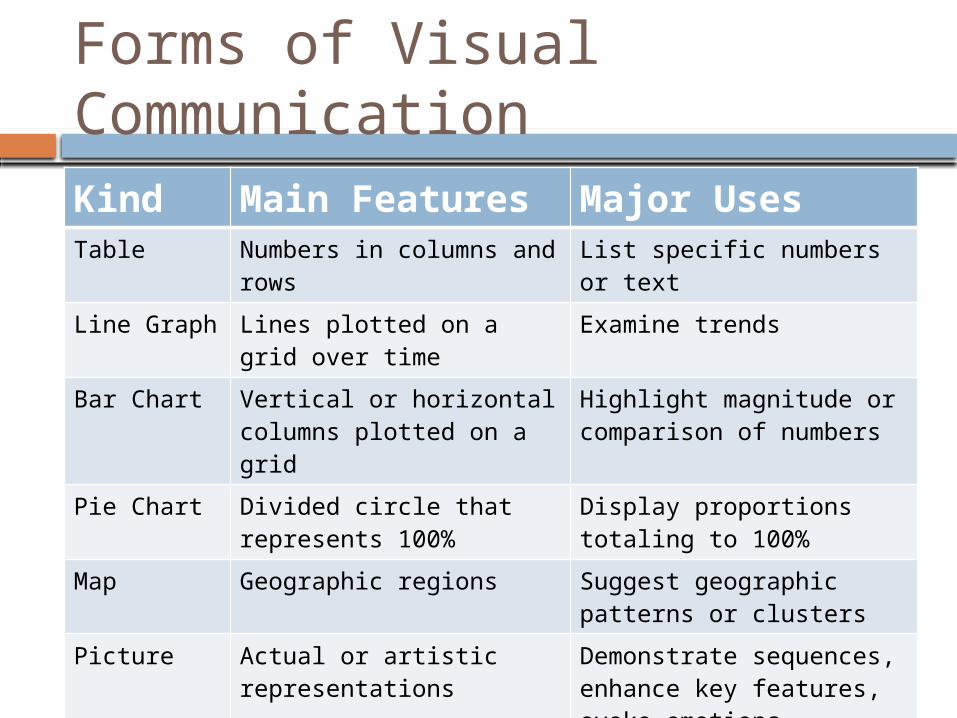
Forms of Visual CommunicationKind Main Features Major UsesTable Numbers in columns and
rowsList specific numbers or text
Line Graph Lines plotted on a grid over time
Examine trends
Bar Chart Vertical or horizontal columns plotted on a grid
Highlight magnitude or comparison of numbers
Pie Chart Divided circle that represents 100%
Display proportions totaling to 100%
Map Geographic regions Suggest geographic patterns or clusters
Picture Actual or artistic representations
Demonstrate sequences, enhance key features, evoke emotions, provide realism
Typography Text Highlight words through layout design

Table
Great way to bore someone! OK for lists Must rapidly display a clear pattern
Actual Causes of Death, 1990Tobacco 400,000
Diet and Physical Activity 300,000Alcohol 100,000Firearms 35,000
Illicit Use of Drugs 20,000
But… a chart would still be better

Misconceptions Handout
Charts and Graphs
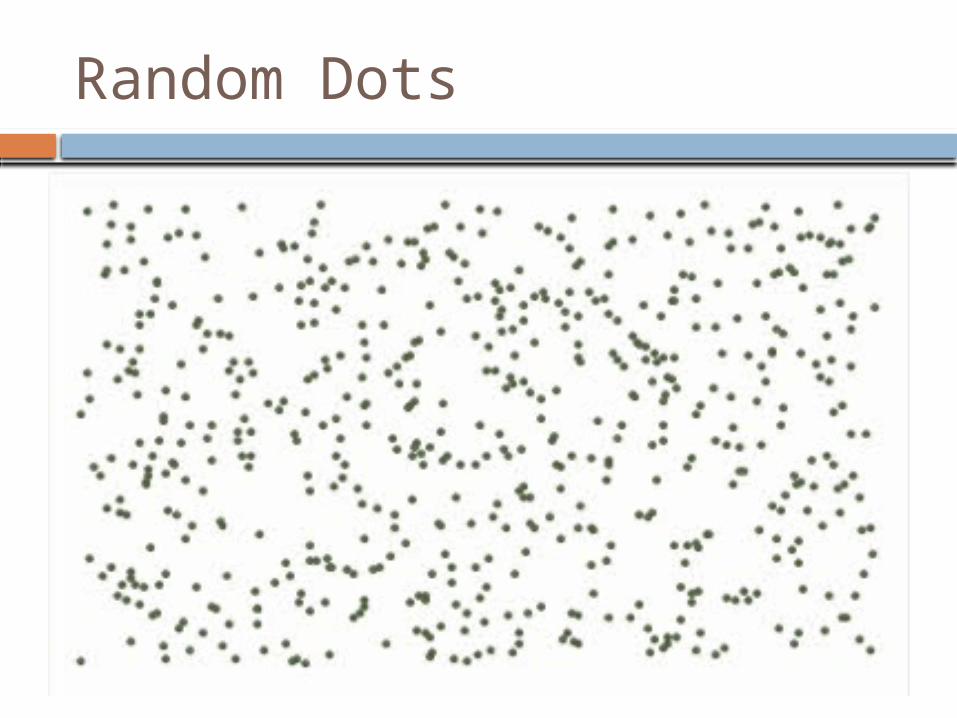
Random Dots
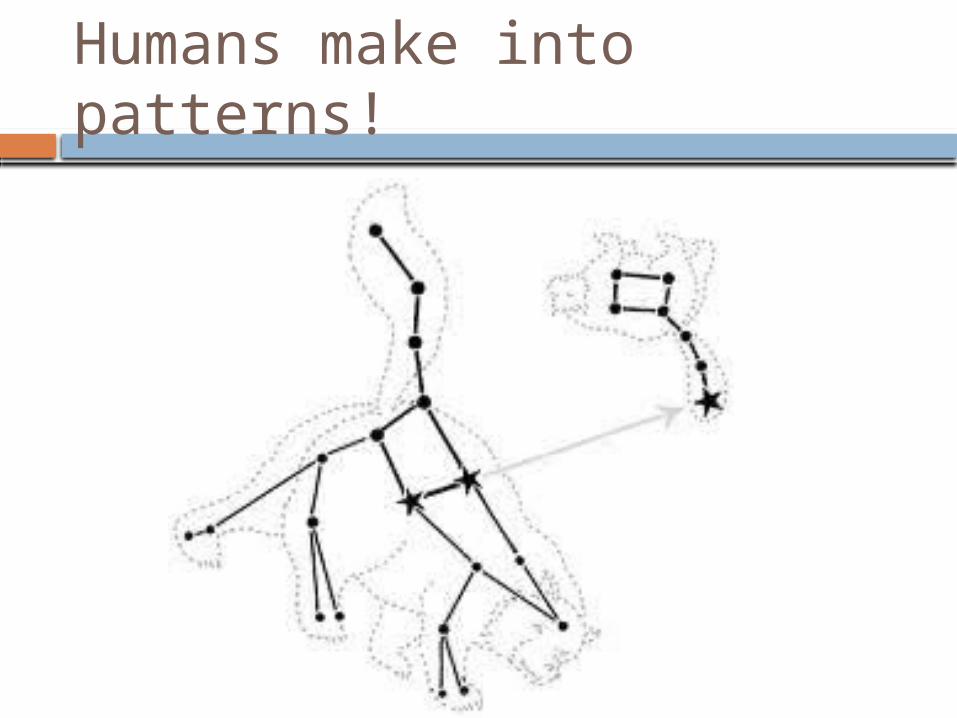
Humans make into patterns!
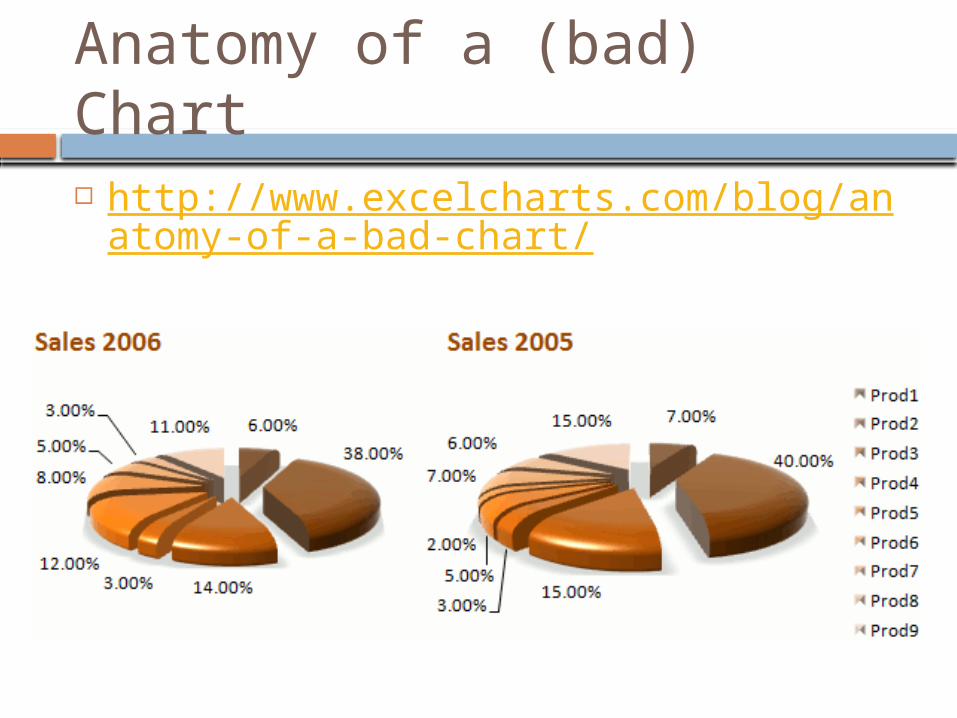
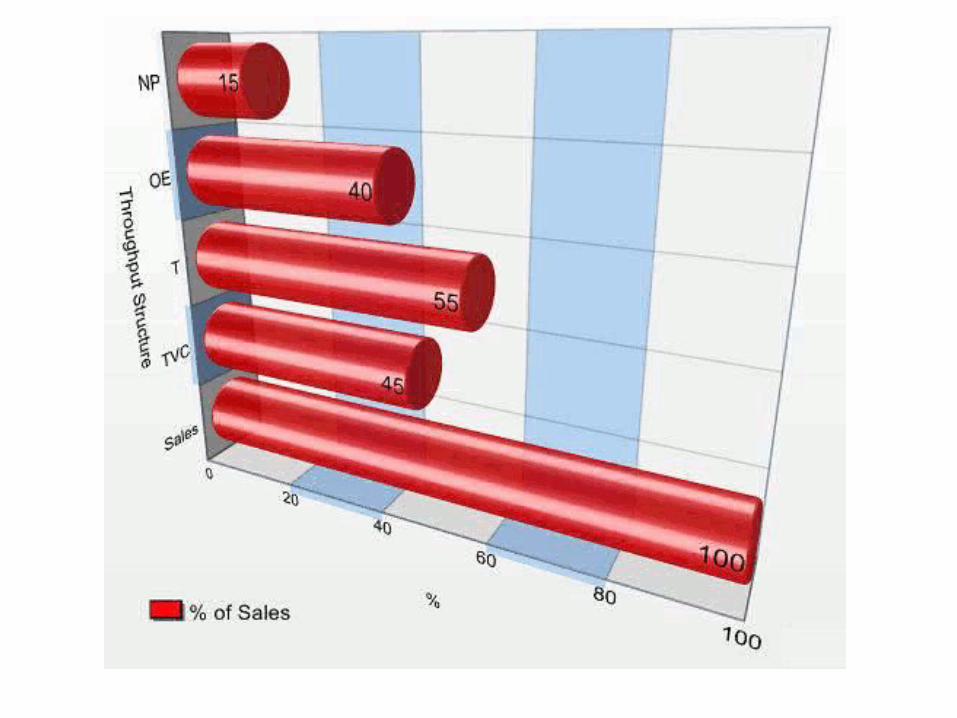
Anatomy of a (bad) Chart
http://www.excelcharts.com/blog/anatomy-of-a-bad-chart/


So, what’s a good chart?
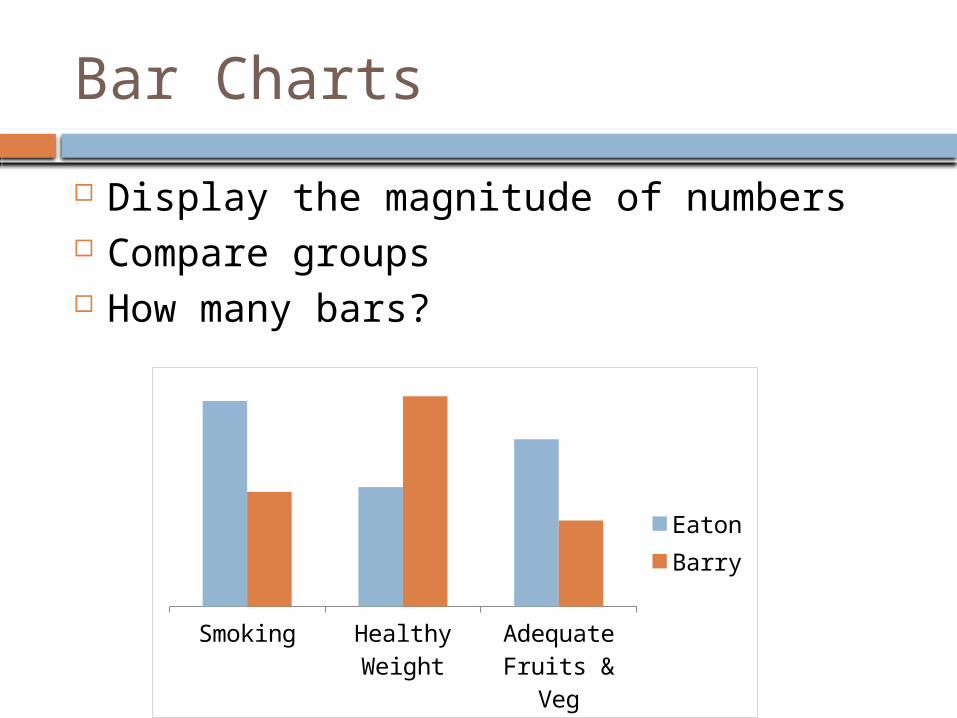
Bar Charts
Display the magnitude of numbers Compare groups How many bars?
Smoking Healthy Weight
Adequate Fruits &
Veg
EatonBarry
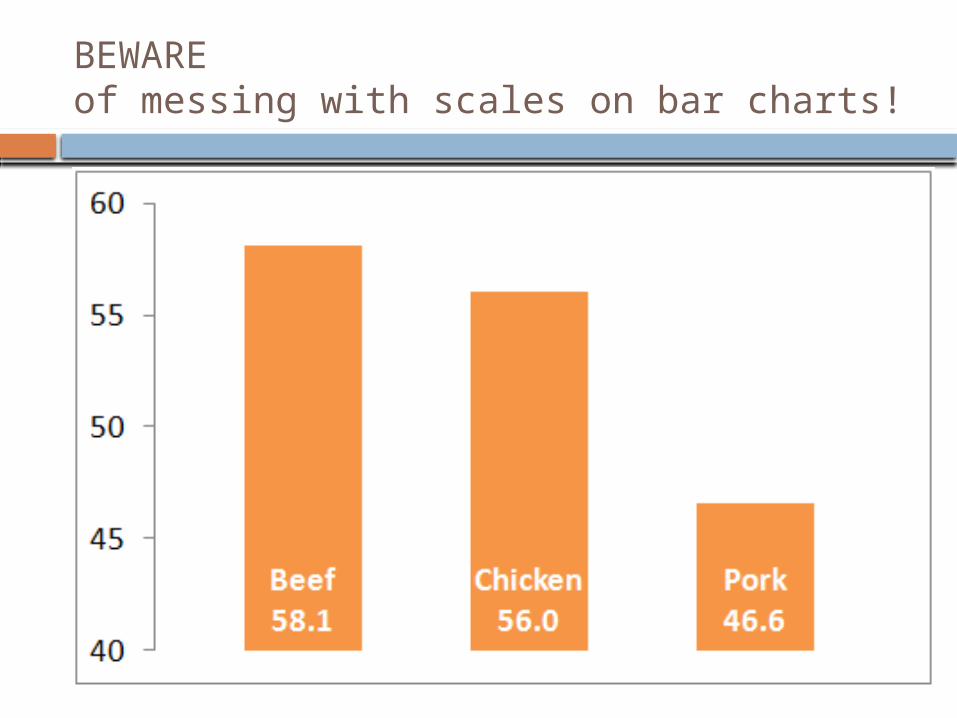
BEWARE of messing with scales on bar charts!
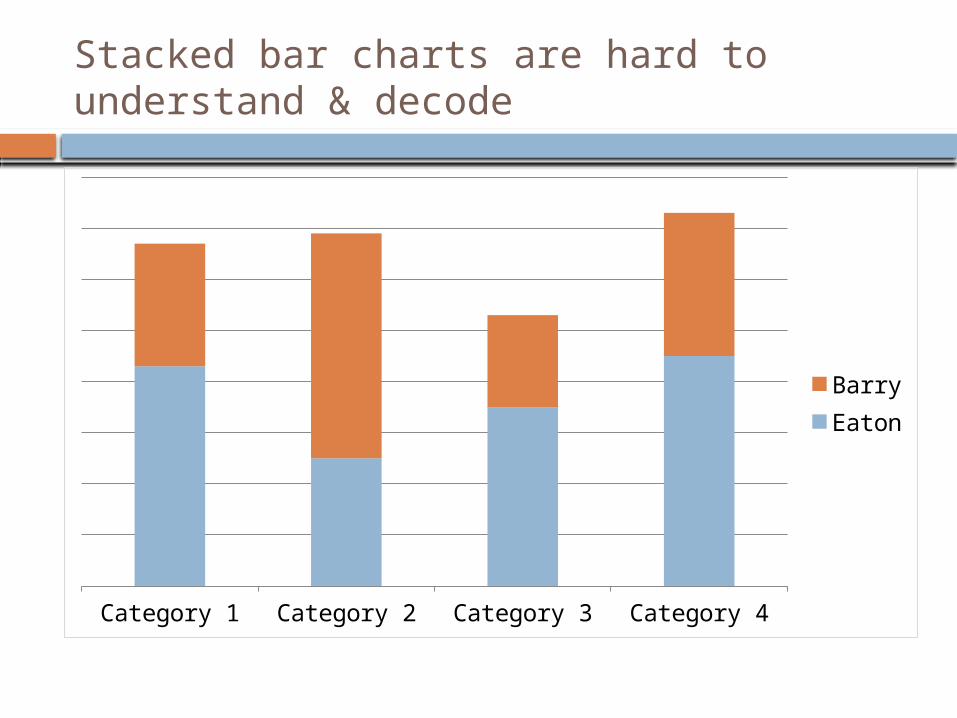
Stacked bar charts are hard to understand & decode
Category 1 Category 2 Category 3 Category 4
BarryEaton
Line Graphs
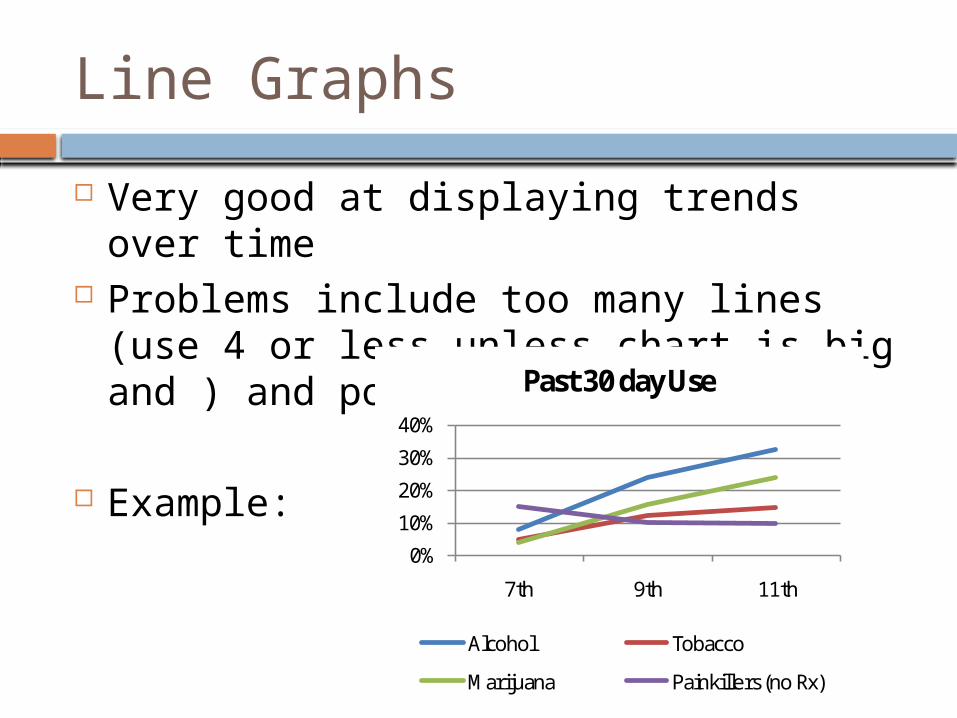
Very good at displaying trends over time Problems include too many lines (use 4
or less unless chart is big and ) and poor labeling
Example:
0%
10%
20%
30%
40%
7th 9th 11th
Past 30 day Use
Alcohol Tobacco
Marijuana Painkillers (no Rx)
Data Visualization in Excel
http://www.excelcharts.com/blog/data-visualization-excel-users/
This is an in-process online tutorial
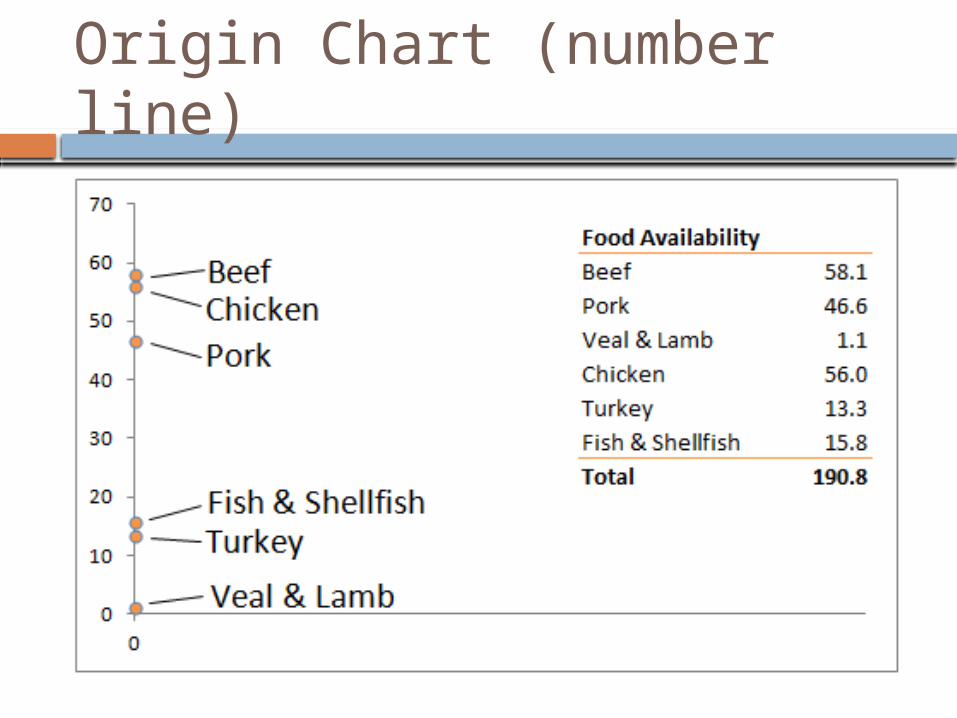
Origin Chart (number line)
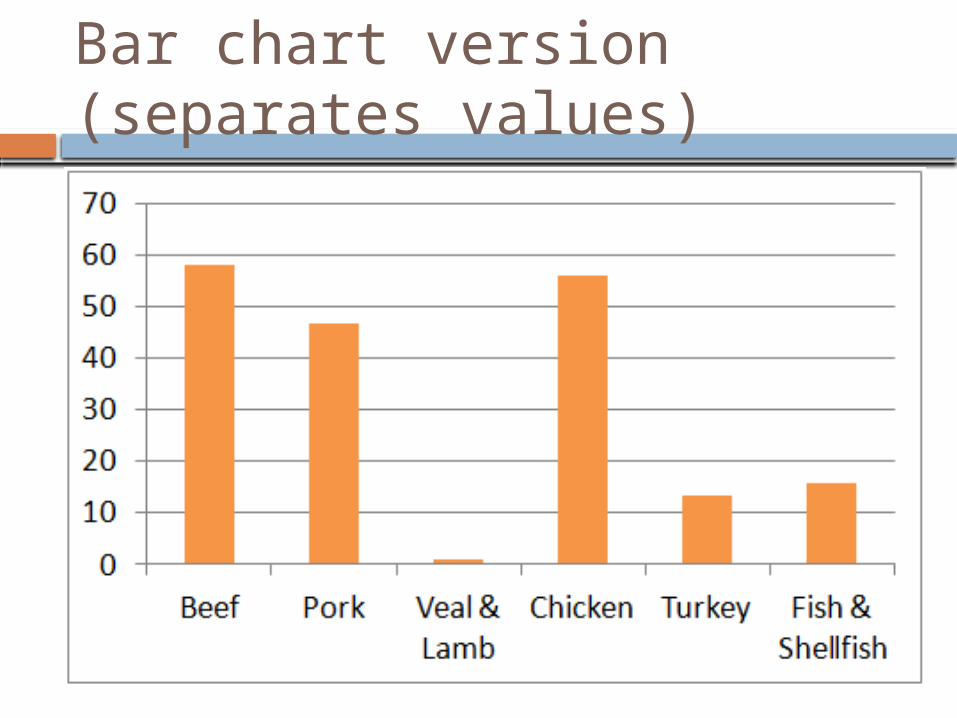
Bar chart version (separates values)
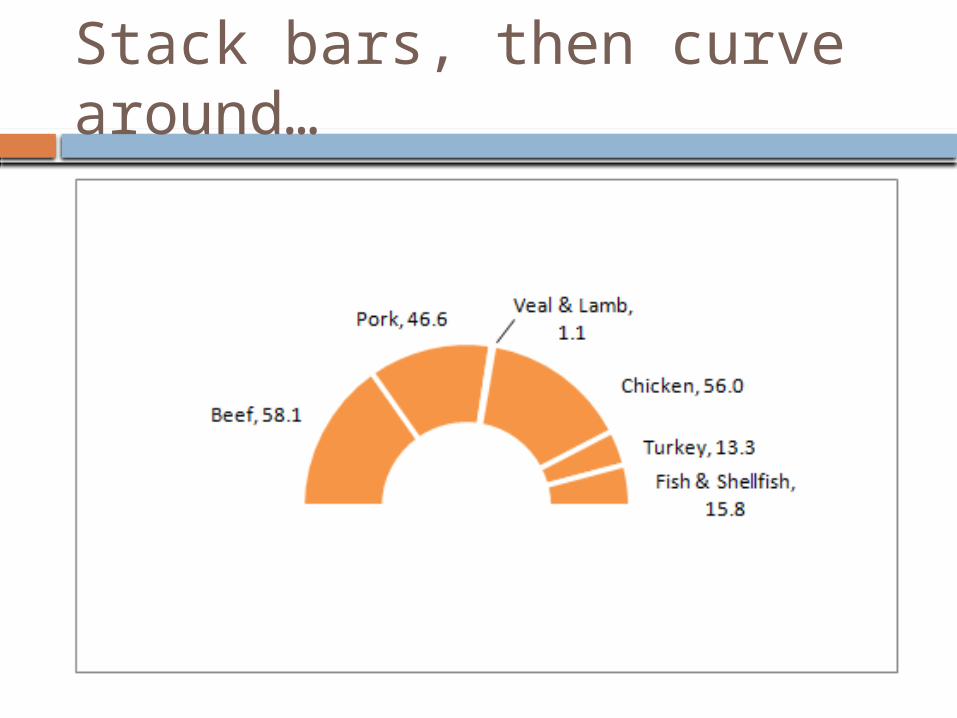
Stack bars, then curve around…
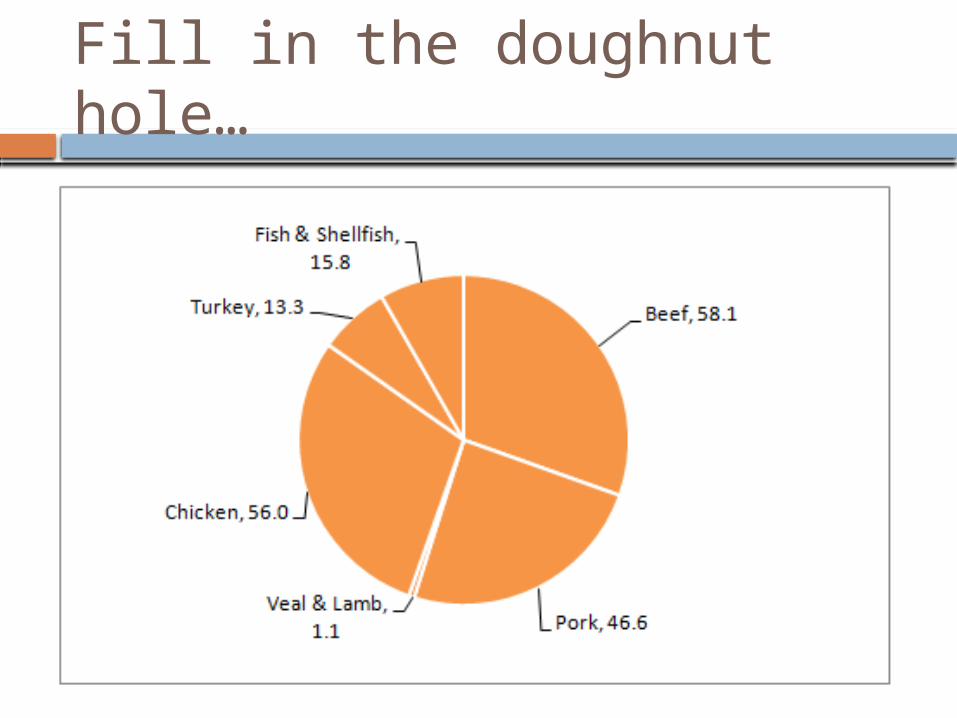
Fill in the doughnut hole…
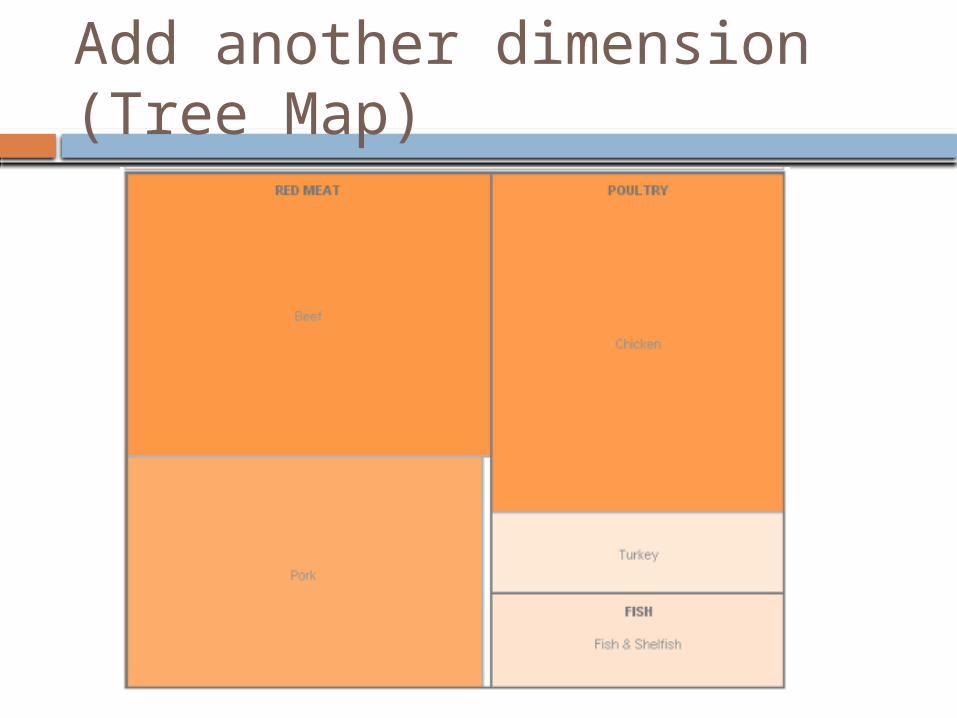
Add another dimension (Tree Map)
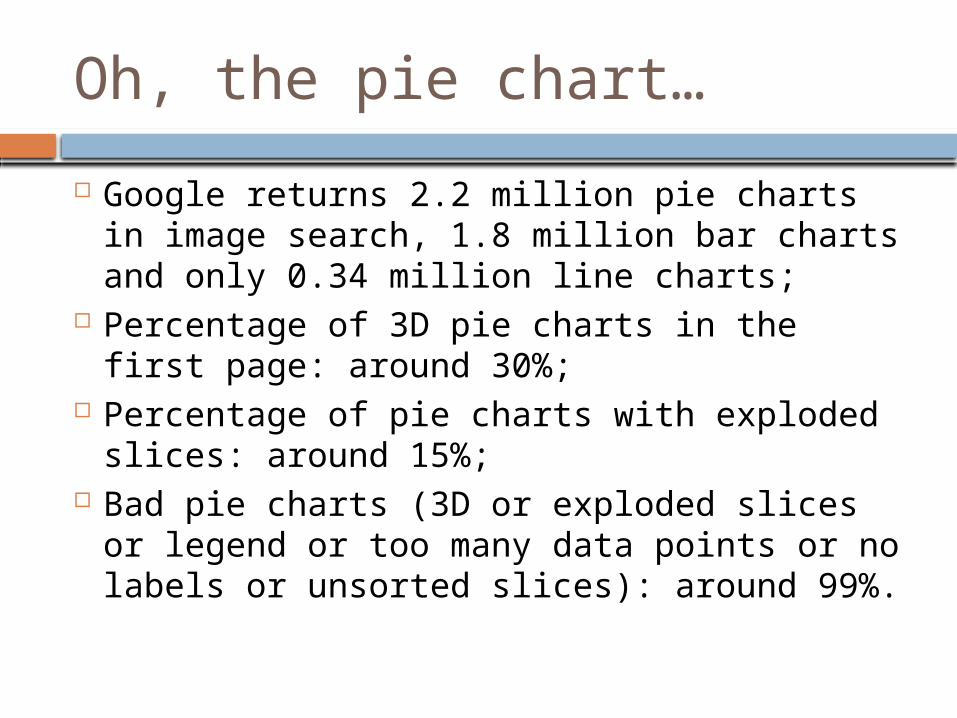
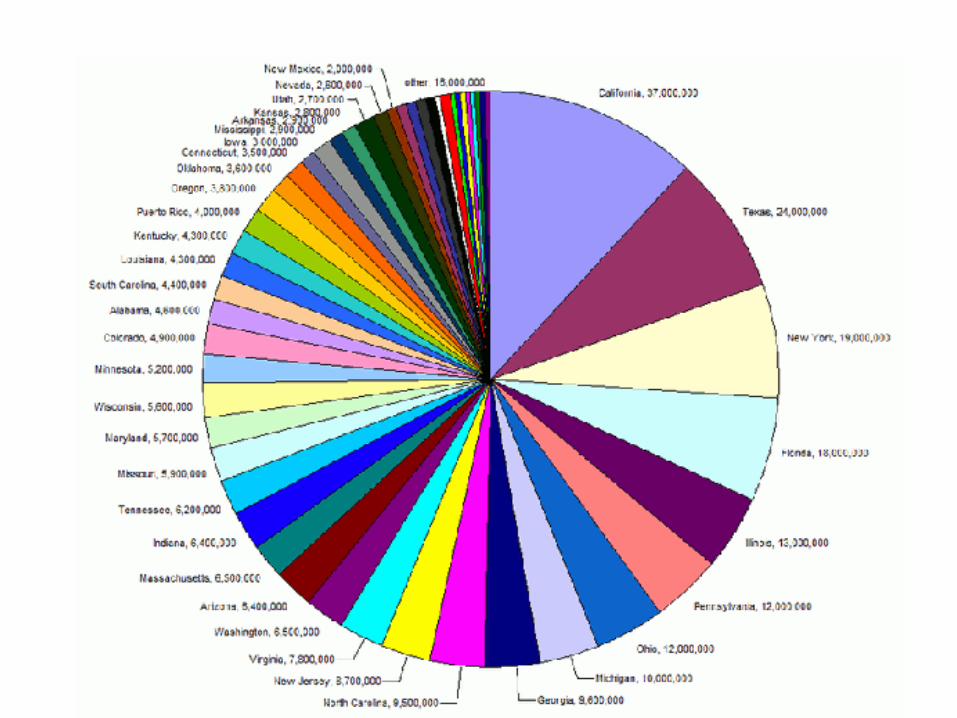
Oh, the pie chart…
Google returns 2.2 million pie charts in image search, 1.8 million bar charts and only 0.34 million line charts;
Percentage of 3D pie charts in the first page: around 30%;
Percentage of pie charts with exploded slices: around 15%;
Bad pie charts (3D or exploded slices or legend or too many data points or no labels or unsorted slices): around 99%.
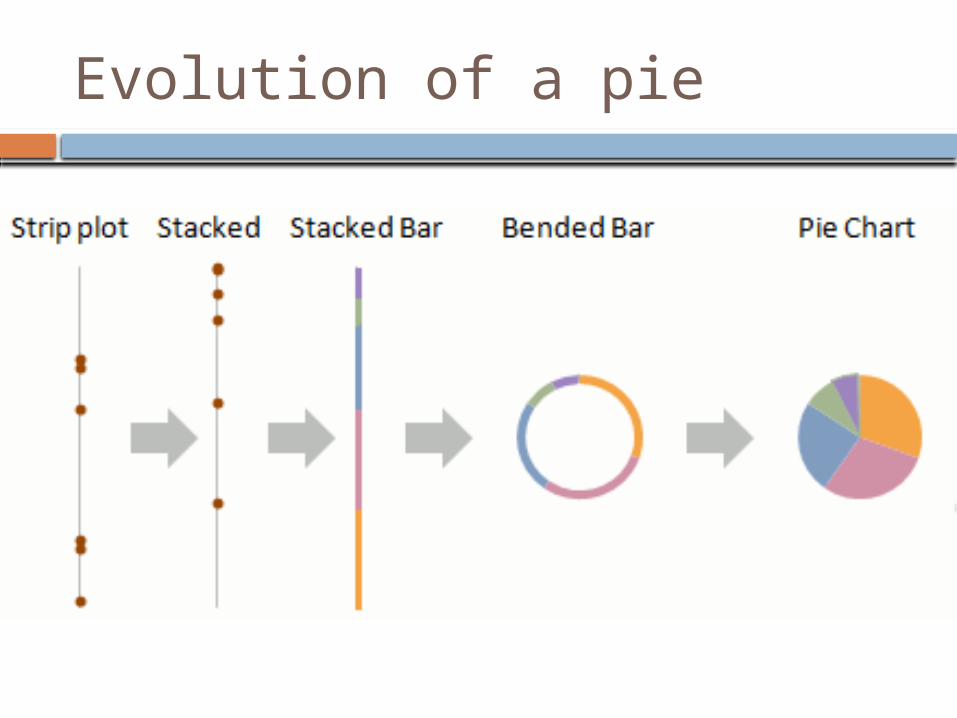
Evolution of a pie

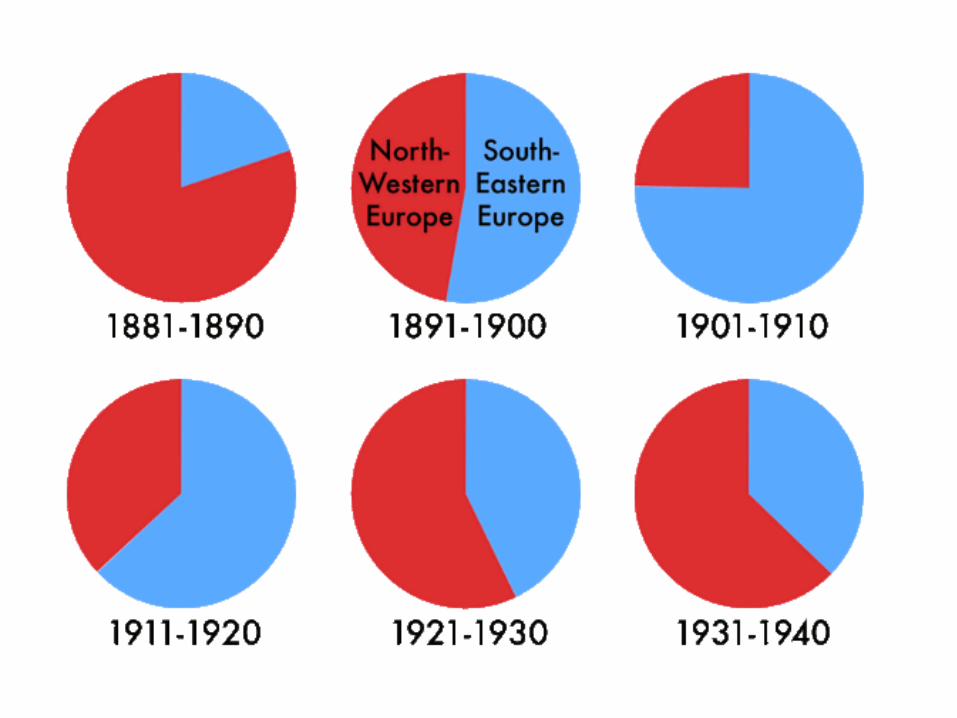
HARD to compare: Area, Arc, and Angle

Pie Chart Do’s and Don’ts
Don’t use 3D Don’t explode your pies Don’t use a legend Don’t use too many chunks (groups of
slices) Label the slices Sort the slices Don’t compare pie charts
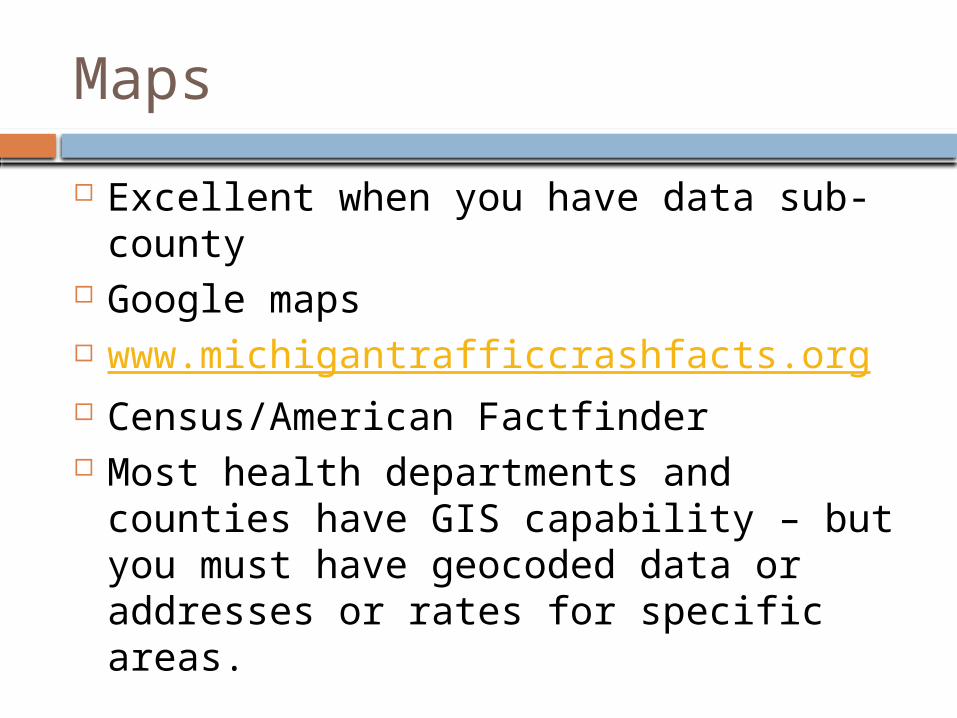
Maps
Excellent when you have data sub-county
Google maps www.michigantrafficcrashfacts.org Census/American Factfinder Most health departments and counties
have GIS capability – but you must have geocoded data or addresses or rates for specific areas.

Pictures
Use as part of the design, not part of the chart.
Typography & Good Design
Proximity Alignment Repetition Contrast & White Space Fonts
You know it when you see it…or do you?
Data-to-ink ratio
Examine your chart – what is the amount of ink used to display your data? What is the amount of ink used for other parts of the display?
The more ink used for data, the better. Using Excel 2007 versus an earlier
version will help do this for you.
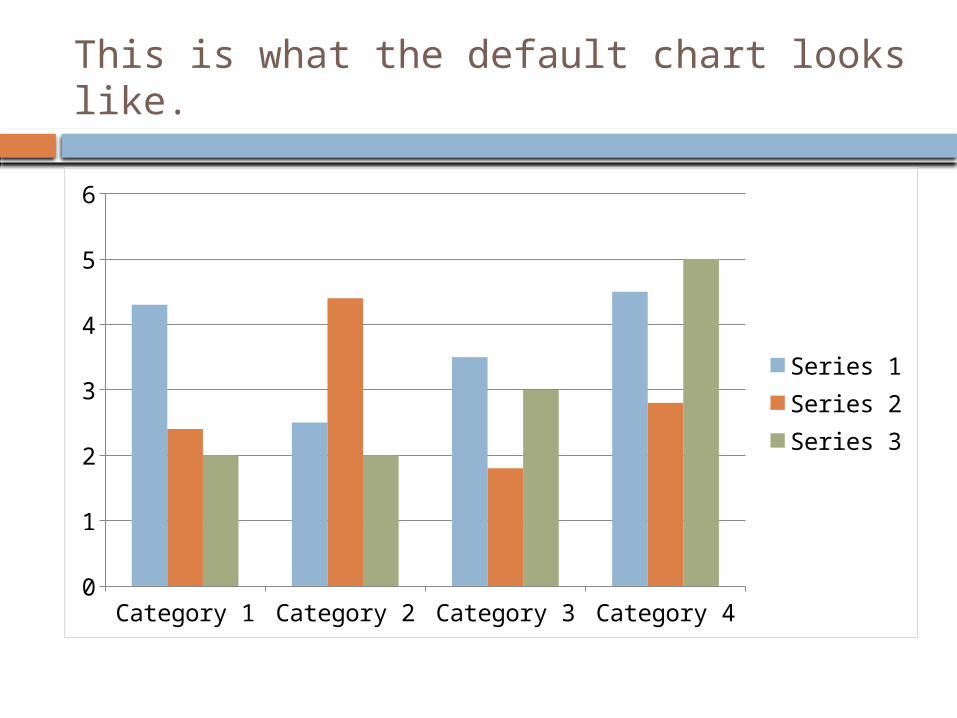
This is what the default chart looks like.
Category 1 Category 2 Category 3 Category 40
1
2
3
4
5
6
Series 1Series 2Series 3
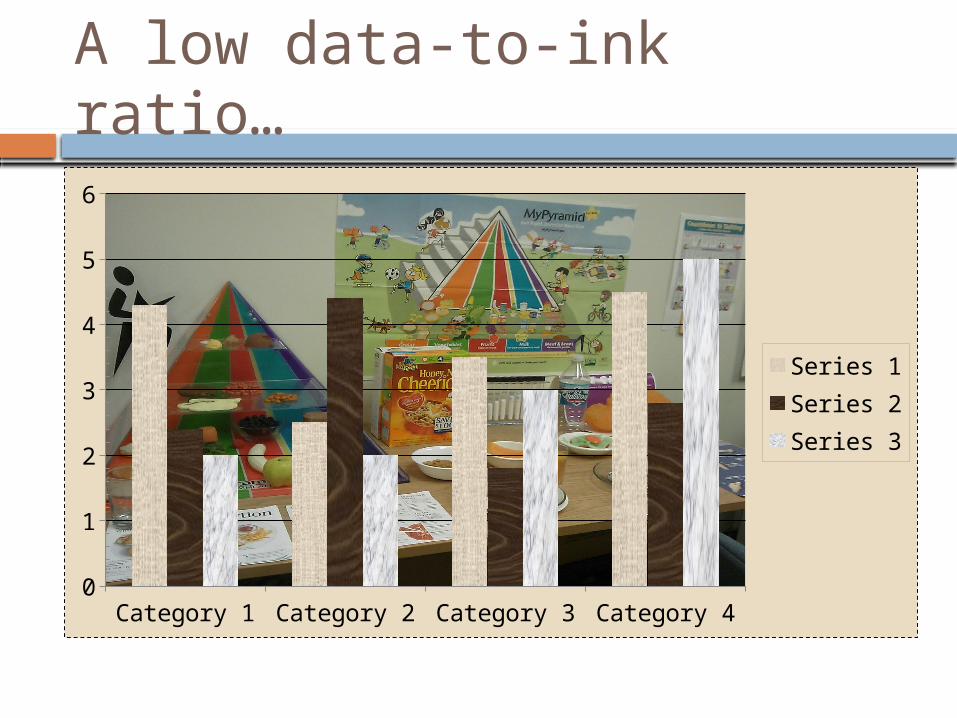
A low data-to-ink ratio…
Category 1 Category 2 Category 3 Category 40
1
2
3
4
5
6
Series 1Series 2Series 3

Color and Shading
Cost Warm colored objects set on cool
backgrounds Cultural meanings of colors Shading can convey meaning, esp, maps Consider the color blind – can they still
read it? Fill patterns
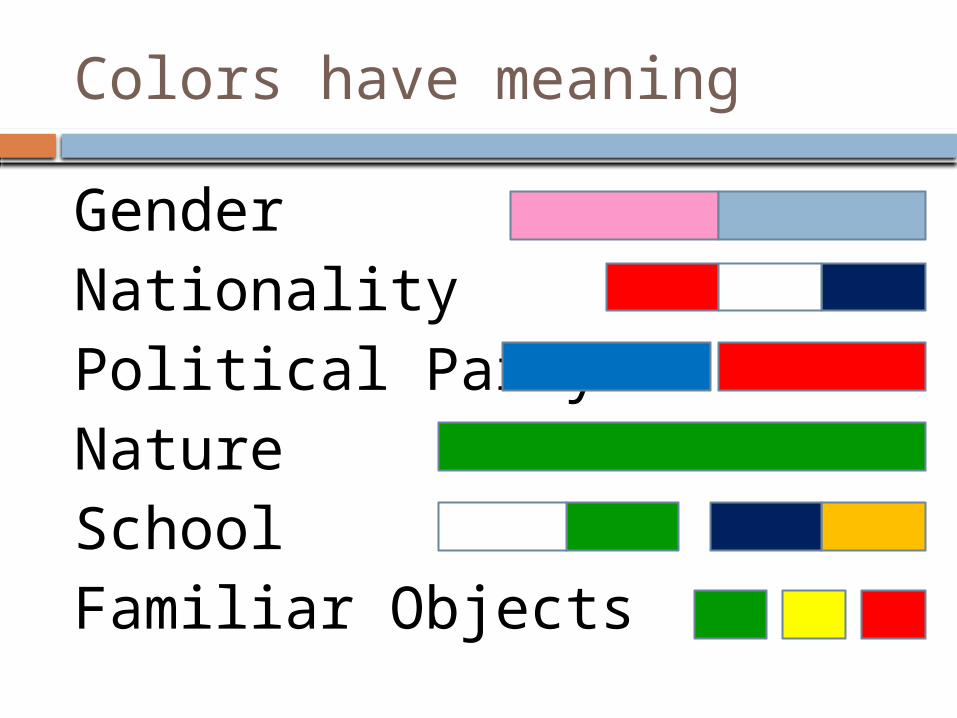
Colors have meaning
GenderNationalityPolitical PartyNatureSchoolFamiliar Objects

Colors have meaning

Titles and Labels
Convey meaning with your title if possible
Label your axes unless it’s obvious or previously explained
Thoughts on legends? Get rid of every other line that you can! Date Source
Distortion
Sometimes the same data can be plotted with different y-value axes, and it looks very different.
Consider whether you are accurately displaying a trend if you “zoom in”.
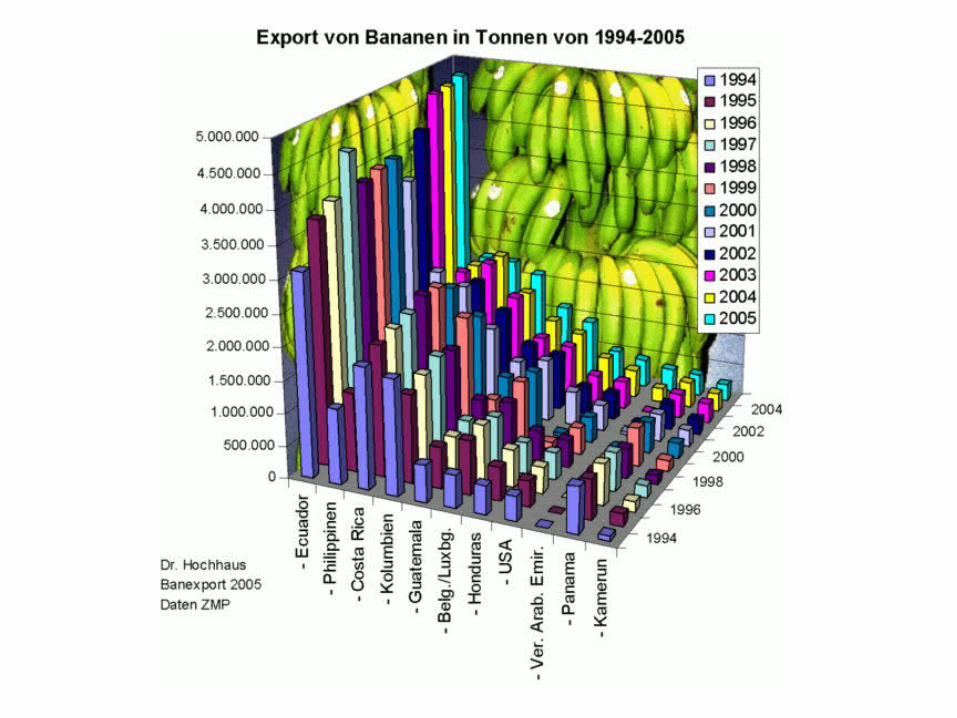
3-D Charts
Please don’t.
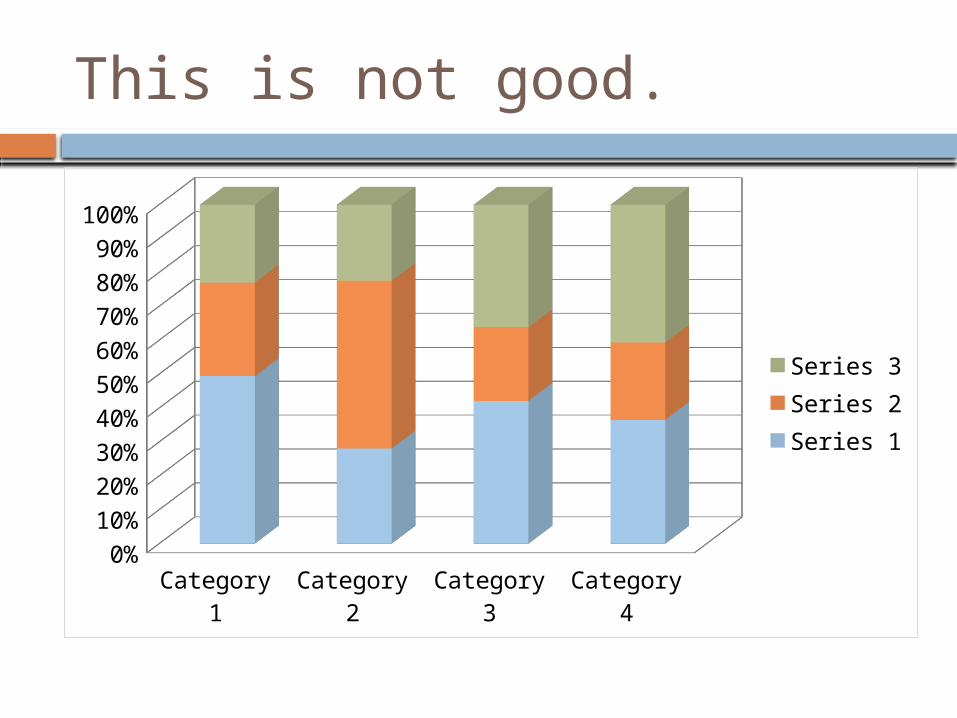
This is not good.
Category 1
Category 2
Category 3
Category 4
0%
10%
20%
30%
40%
50%
60%
70%
80%
90%
100%
Series 3Series 2Series 1
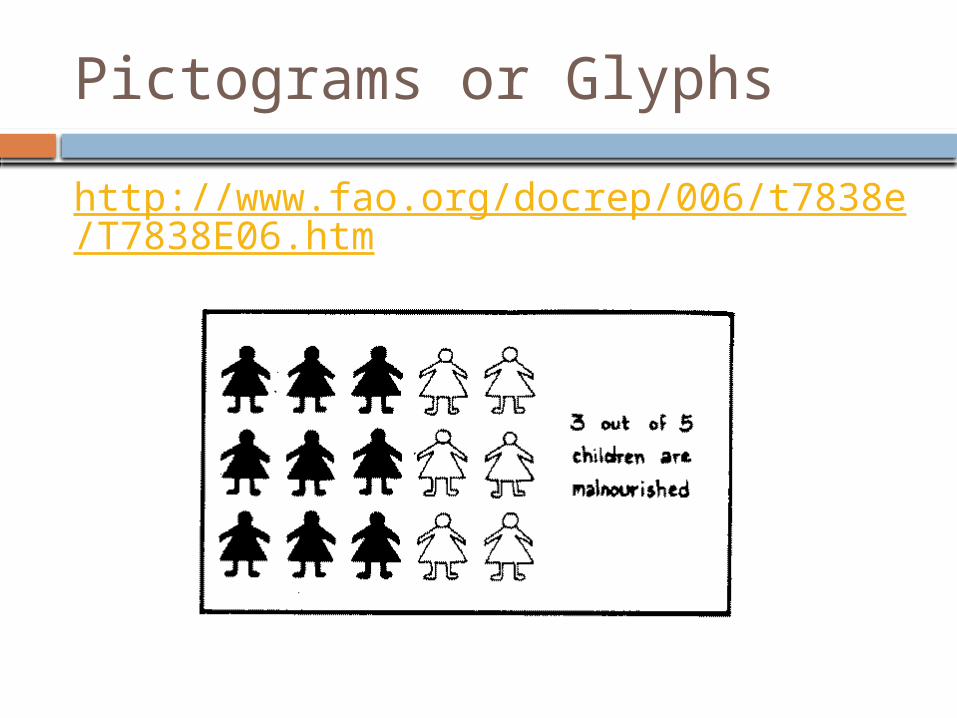
Pictograms or Glyphs
http://www.fao.org/docrep/006/t7838e/T7838E06.htm
50
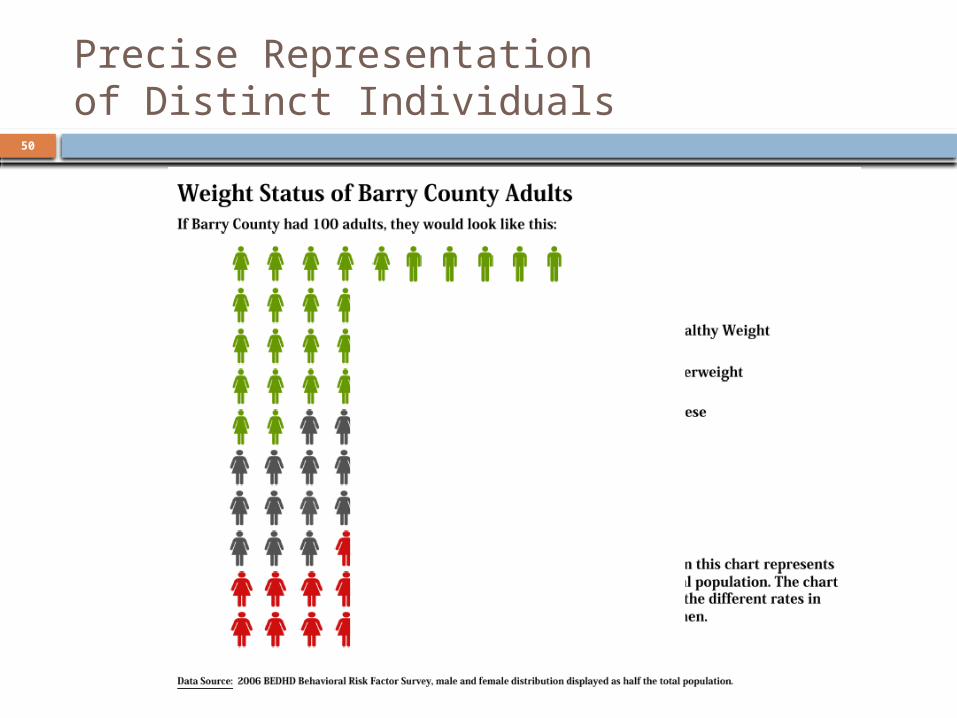
Precise Representation of Distinct Individuals
The Beauty of Data Visualizationshttp://www.ted.com/talks/lang/eng/david_mccandless_the_beauty_of_data_visualization.htmlA fun example:http://www.babynamewizard.com/name-voyager#
Many Eyes is a tool that you can use with your own data:
http://www-958.ibm.com/software/data/cognos/manyeyes/
Interactive Charts
http://www.nytimes.com/interactive/2009/11/06/business/economy/unemployment-lines.html
While many of us may not have the capacity to create interactive charts, they are highly effective at helping people draw insights in a web-based platform or presentation platform.
Using Data in Evaluation

Why use data in evaluation?
Process Evaluation
Measuring “Did we do what we said we were going to do” is incredibly important.
What sort of data is necessary? What kinds of questions can you ask and
answer? Did you provide pro-social interactions for
at-risk youth? Did you talk to five city governments about
adopting smoke-free parks policies? PROGRAM or COALITION !
Outcome Evaluation
Measuring: “Did we have the impact that we predicted?”
What sort of data is necessary? What kinds of questions can you ask and answer?
Did the youth who participated have an improvement in their GPA compared to a control group?
Has the smoking rate in youth decreased over time? Do youth today feel that it’s more risky than in the past?
PROGRAM or COALITION !
Considering Determinants and Equity Data in your work
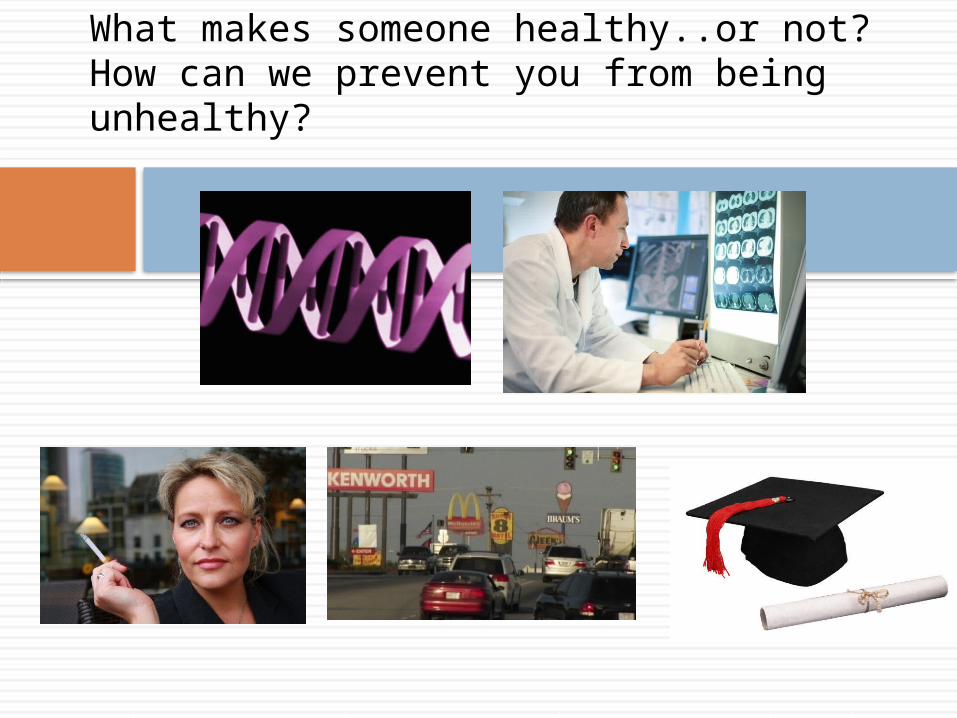
What makes someone healthy..or not?How can we prevent you from being unhealthy?
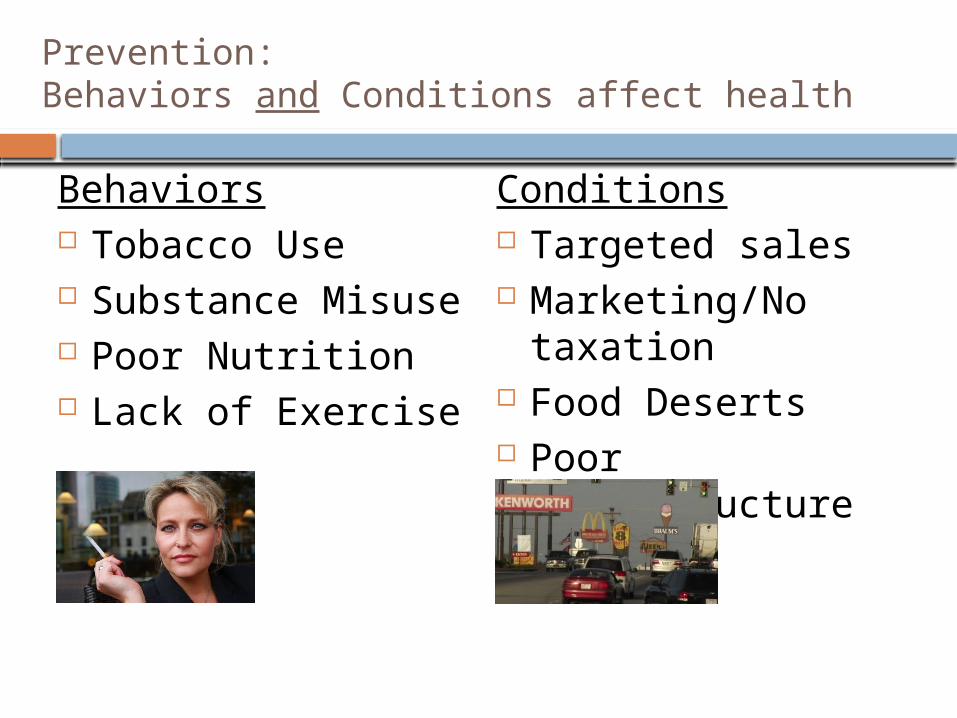
Prevention: Behaviors and Conditions affect health
Behaviors Tobacco Use Substance Misuse Poor Nutrition Lack of Exercise
Conditions Targeted sales Marketing/No
taxation Food Deserts Poor infrastructure
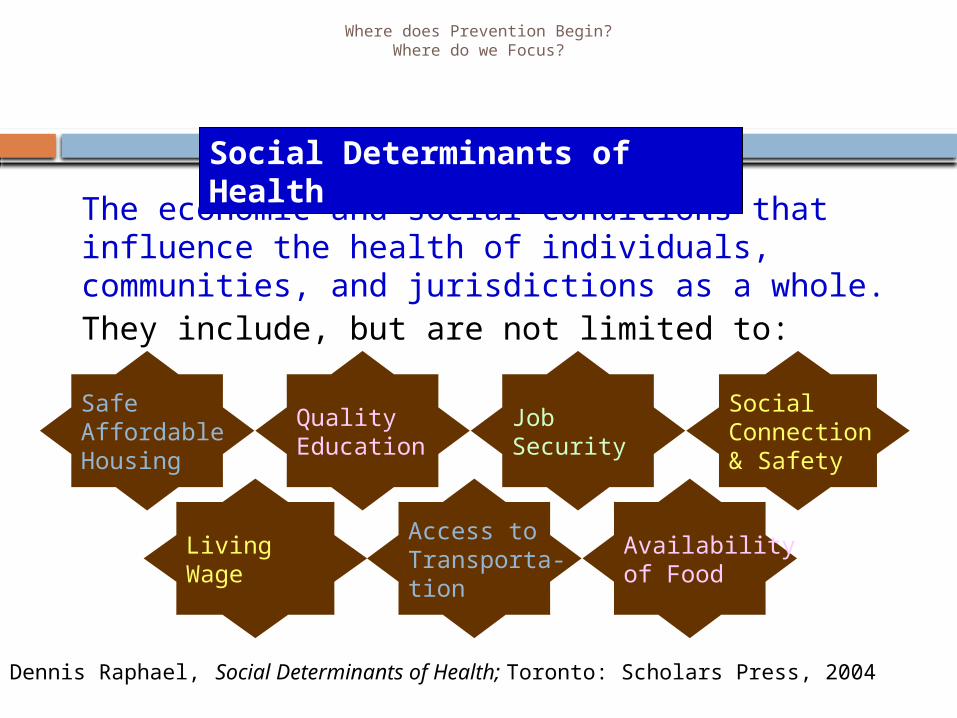
Where does Prevention Begin?Where do we Focus?
Social Determinants of Health
The economic and social conditions that influence the health of individuals, communities, and jurisdictions as a whole.They include, but are not limited to:
SafeAffordableHousing
SocialConnection& Safety
QualityEducation
Job Security
LivingWage
Access toTransporta-tion
Availabilityof Food
Dennis Raphael, Social Determinants of Health; Toronto: Scholars Press, 2004

Root Causes
Power and Wealth ImbalanceLABOR
MARKETS
GLOBALIZATION&
DEREGULATIONHOUSINGPOLICY
EDUCATIONSYSTEMS
TAXPOLICY
Social Determinants of Health
Disparity in the Distribution of Disease, Illness, and Wellbeing
InstitutionalRacism Class Oppression
Gender Discrimination
and Exploitation
SOCIAL NETWORKS
SOCIALSAFETY
NET
SafeAffordableHousing
SocialConnection
& Safety
QualityEducation
Job Security
LivingWage
Transportation Availabilityof Food
Psychosocial Stress / Unhealthy Behaviors
Adapted from R. Hofrichter, Tackling Health Inequities Through Public Health Practice.
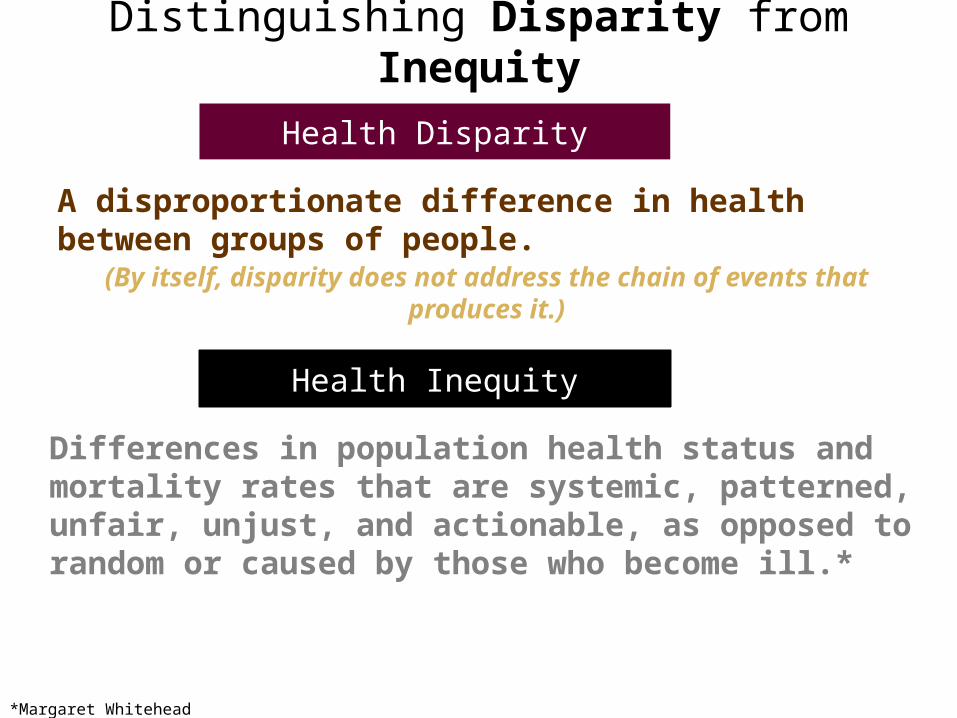
Health Disparity
A disproportionate difference in health between groups of people.
Health Inequity
Differences in population health status and mortality rates that are systemic, patterned, unfair, unjust, and actionable, as opposed to random or caused by those who become ill.*
Distinguishing Disparity from Inequity
(By itself, disparity does not address the chain of events that produces it.)
*Margaret Whitehead
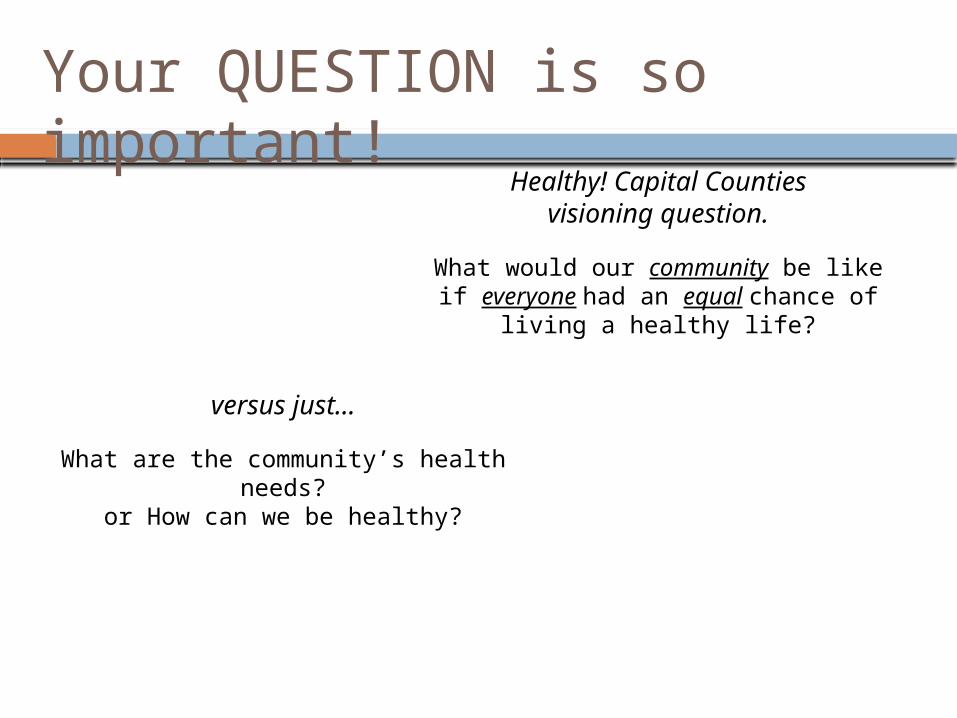
Your QUESTION is so important!
What would our community be like if everyone had an equal chance of
living a healthy life?
Healthy! Capital Counties visioning question.
What are the community’s health needs?
or How can we be healthy?
versus just…
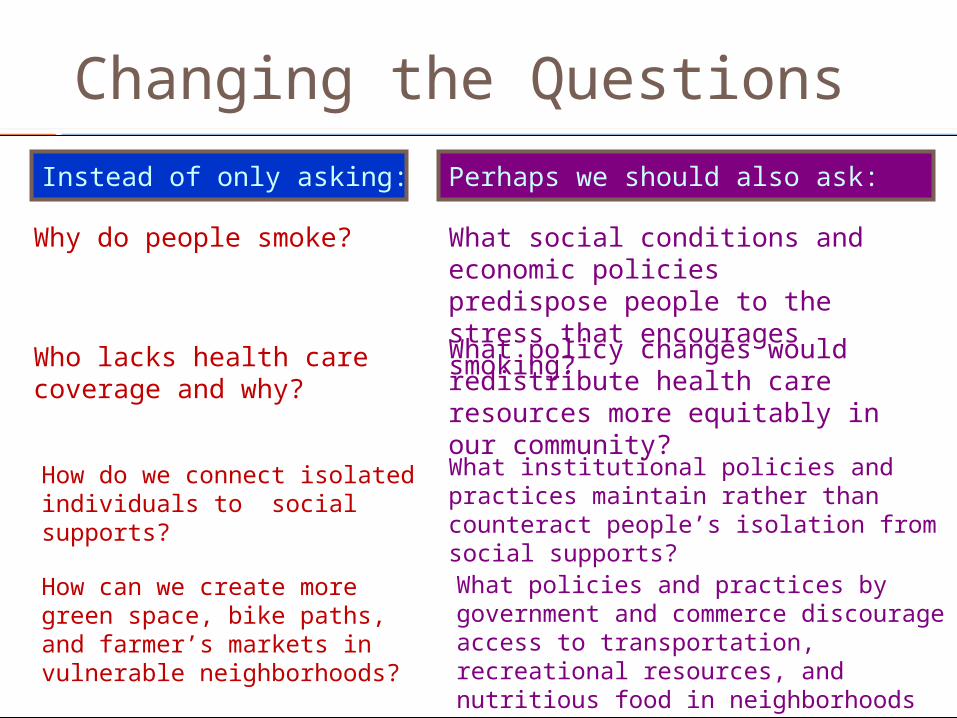
Changing the Questions
Instead of only asking:
Why do people smoke?
Perhaps we should also ask:
What social conditions and economic policies predispose people to the stress that encourages smoking?
Who lacks health care coverage and why?
What policy changes would redistribute health care resources more equitably in our community?
How do we connect isolated individuals to social supports?
What institutional policies and practices maintain rather than counteract people’s isolation from social supports?
How can we create more green space, bike paths, and farmer’s markets in vulnerable neighborhoods?
What policies and practices by government and commerce discourage access to transportation, recreational resources, and nutritious food in neighborhoods where health is poorest?
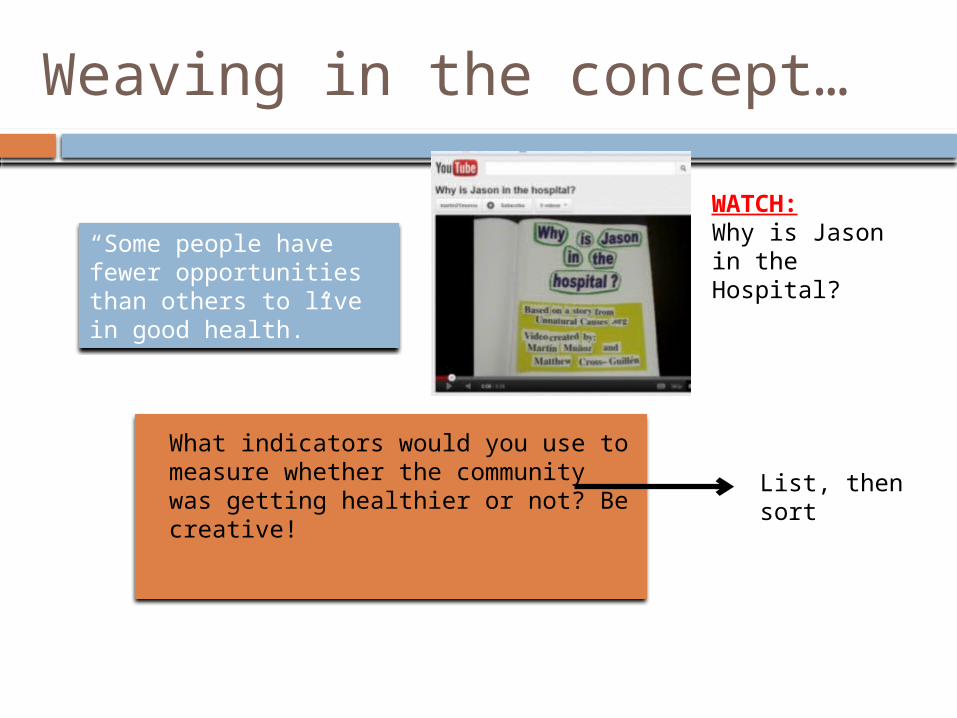
Weaving in the concept…
“Some people have fewer opportunities than others to live in good health.”
WATCH:Why is Jason in the Hospital?
What indicators would you use to measure whether the community was getting healthier or not? Be creative!
List, then sort
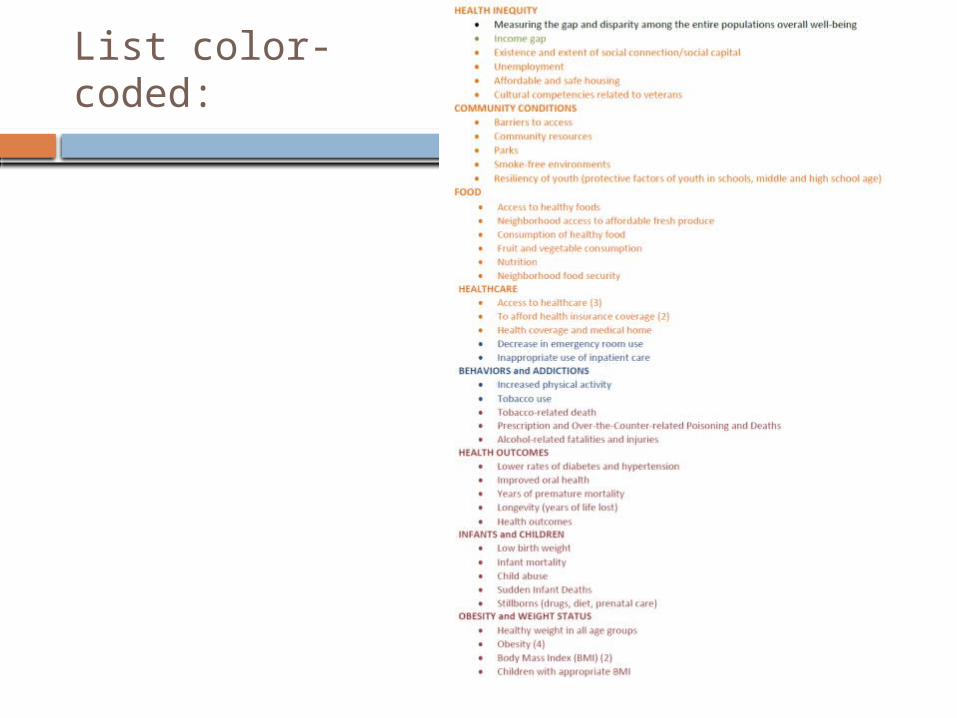
List color-coded:

Our Model for How Health Happens:
Opportunity Measures Evidence of power and wealth inequity resulting from historical legacy, laws & policies, and social programs.
Social, Economic, and Environmental Factors (Social Determinants of Health)
Factors that can constrain or support healthy living
Behaviors, Stress, and Physical Condition Ways of living which protect from or contribute to health outcomes
Health Outcomes Can be measured in terms of quality of life (illness/
morbidity), or quantity of life (deaths/mortality)

Social determinant questions…purple alludes to inequity
Do people have money to meet basic needs? What about enough to live a life of quality?
Are people secure in their employment?
Are kids in our community ready for school? Will every child go to a safe, well-resourced, high-performing school?
Do we have clean air, clean water, in communities built to enhance health?
Can all people get health care? Of high quality?
Can people get where they need to go?
Does everyone have a safe home at a reasonable price?Is the community empowered to improvement through civic action or grassroots action?
Are we safe?
When you really need to know WHY…
Qualitative Data Analysis
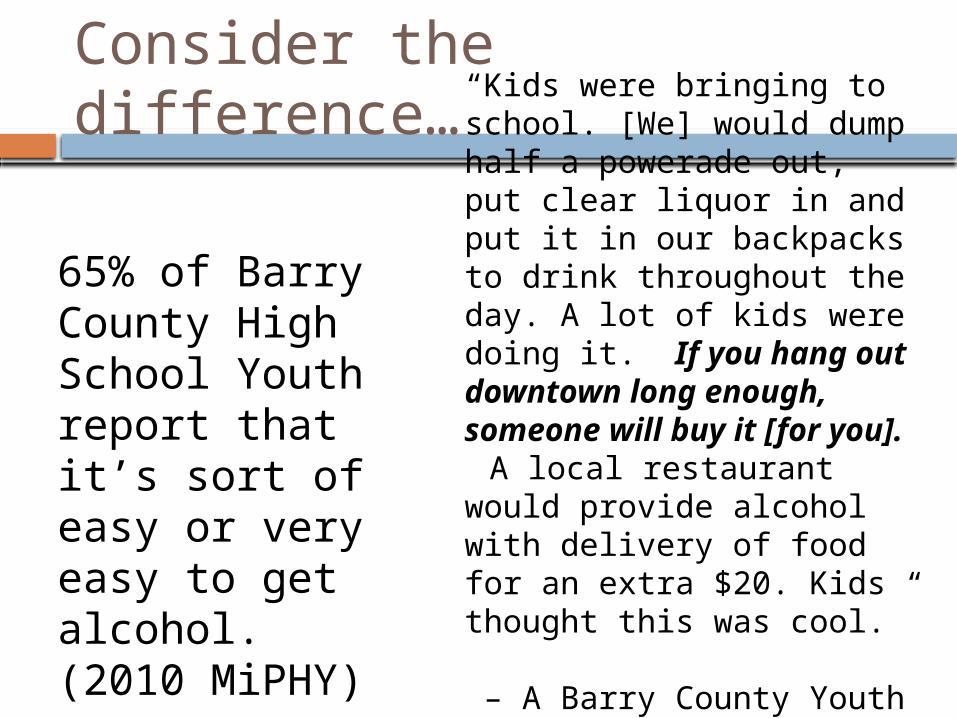
Consider the difference…“Kids were bringing to school. [We] would dump half a powerade out, put clear liquor in and put it in our backpacks to drink throughout the day. A lot of kids were doing it. If you hang out downtown long enough, someone will buy it [for you]. A local restaurant would provide alcohol with delivery of food for an extra $20. Kids thought this was cool.” – A Barry County Youth Offender, interviewed in 2009
65% of Barry County High School Youth report that it’s sort of easy or very easy to get alcohol. (2010 MiPHY)

Underage Use of Alcohol
Problem? 81% yes, 19% no Of those who said no, what did they say?
Kids will always drink I’m not sure Not really a problem in youth I’ve never seen it
Conclusion based on qualitative data? Personal knowledge is a predictor of whether
an individual perceives something as a problem in their community.
Why use qualitative data?
Provide insight into how people make sense of their experience
Help to facilitate the dissemination of research findings
Explains why someone did something or thinks something
Two types to highlight…
Interviews All sorts, most typically used is the “semi-
structured interview” Focus on individuals thoughts and
experiences Focus Groups
Focus on attitudes and experiences, cultural context of knowledge and ideas, how opinions are constructed
Writing Questions
Questions should not lead the person to the “correct answer” or color their response to you. “Given all of the horrible things that underage
drinking causes, what should we do to stop it?” Allow for the whole range of experience and
views through prefacing the question: “Some parents have many rules about drinking and
parties – others have only a few. What do you expect from your teen when it comes to drinking and parties?”
“Some people learn through talking to a doctor or nurse – others prefer to read information on their own. What way would you prefer to get information about family planning choices?
Writing Questions
Open ended questions allow someone to have the opportunity to tell a story that’s meaningful to them.
ProbingThis means that you follow up a general
question with questions aimed to get the person to expand on what they first said.
EXAMPLE: Participant: “I really like the parks in our town.”Interviewer: “What do you enjoy about the parks?”Participant: “I love taking my grandson there to
run around and experience nature.”
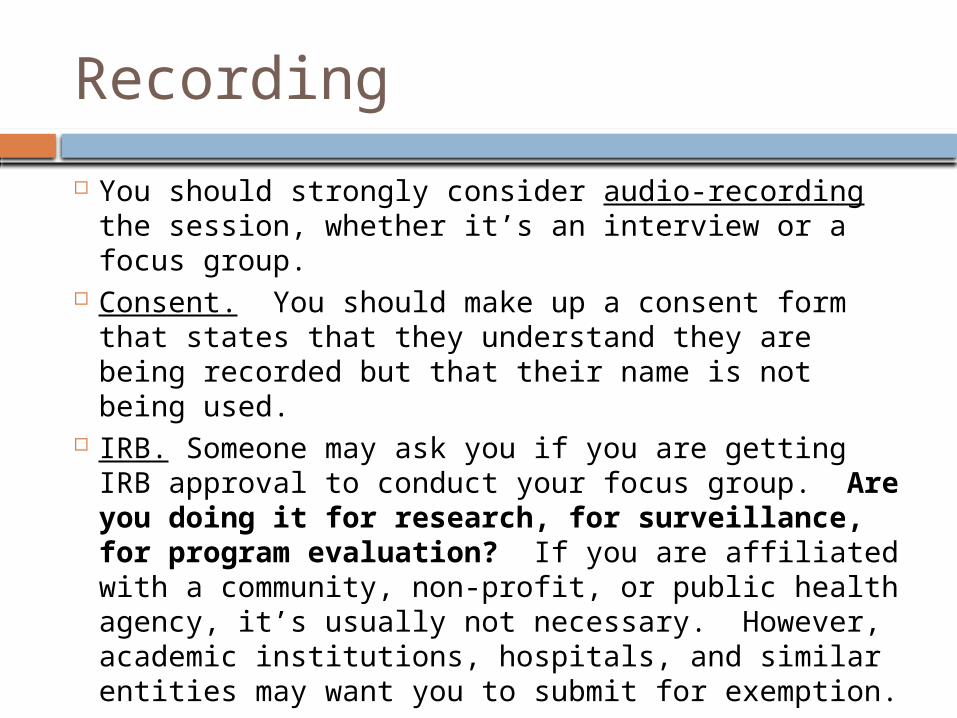
Recording
You should strongly consider audio-recording the session, whether it’s an interview or a focus group.
Consent. You should make up a consent form that states that they understand they are being recorded but that their name is not being used.
IRB. Someone may ask you if you are getting IRB approval to conduct your focus group. Are you doing it for research, for surveillance, for program evaluation? If you are affiliated with a community, non-profit, or public health agency, it’s usually not necessary. However, academic institutions, hospitals, and similar entities may want you to submit for exemption.

Qualitative Analysis
Text (such as an interview transcript)
Codes(descriptive tags)
Themes (an interpretive sentence or two)
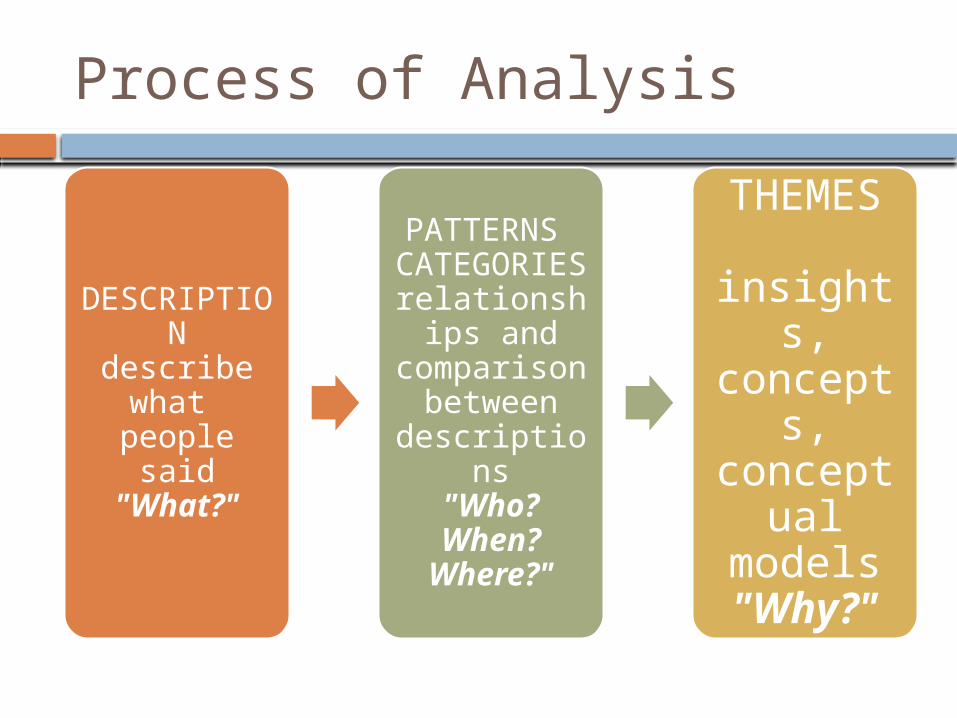
Process of Analysis
DESCRIPTION
describe what
people said"What?"
PATTERNS CATEGORIES relationships
and comparison
between descriptions
"Who? When?
Where?"
THEMES insights, concepts
, conceptu
al models"Why?"
ACTIVITY
You have a copy of a focus group transcript and a copy of a focus group summary of an audio file.
Read through the text. Read through the text again.
Jot down notes on the side that try to summarize the topic of the quote in a few phrases (there are your descriptive codes)
Compare your codes with your neighbor.
Exercise
Exercise was commonly discussed as a way to get and/or stay healthy.
People with chronic diseases discussed the paradox that they know they need to exercise more, but now that they have a chronic disease it’s much more difficult to do so.
Children were perceived as being less physically active than in the past.
Many cited walking as an enjoyable exercise.
Gyms were perceived as out of reach and expensive, however the YMCA and Alive! Center were discussed as having scholarships or free programs or facilities based on need.
Many community attributes were seen as helping to encourage people to exercise, including walkable neighborhoods, living in the country, parks, walking to school, and walking hallways at schools.
Ideas to encourage more people to exercise included more exercise facilities at worksites, places for families to go together to exercise, equipment loans, more low-cost fitness classes, and utilize the schools more to allow public to use gyms and pools.
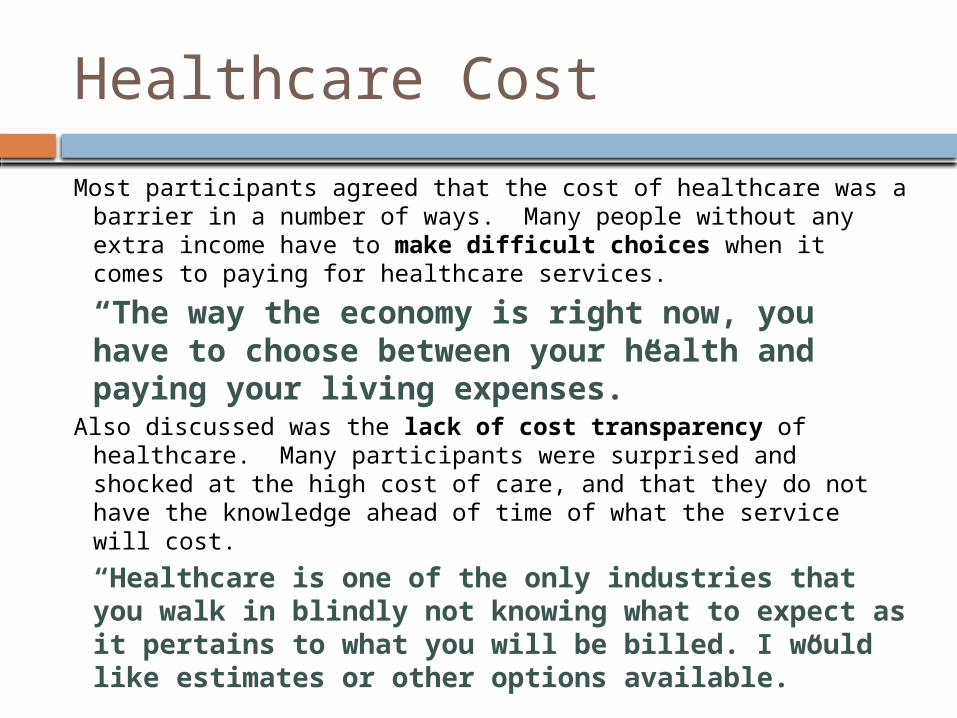
Healthcare Cost
Most participants agreed that the cost of healthcare was a barrier in a number of ways. Many people without any extra income have to make difficult choices when it comes to paying for healthcare services.
“The way the economy is right now, you have to choose between your health and paying your living expenses.”
Also discussed was the lack of cost transparency of healthcare. Many participants were surprised and shocked at the high cost of care, and that they do not have the knowledge ahead of time of what the service will cost.
“Healthcare is one of the only industries that you walk in blindly not knowing what to expect as it pertains to what you will be billed. I would like estimates or other options available.”
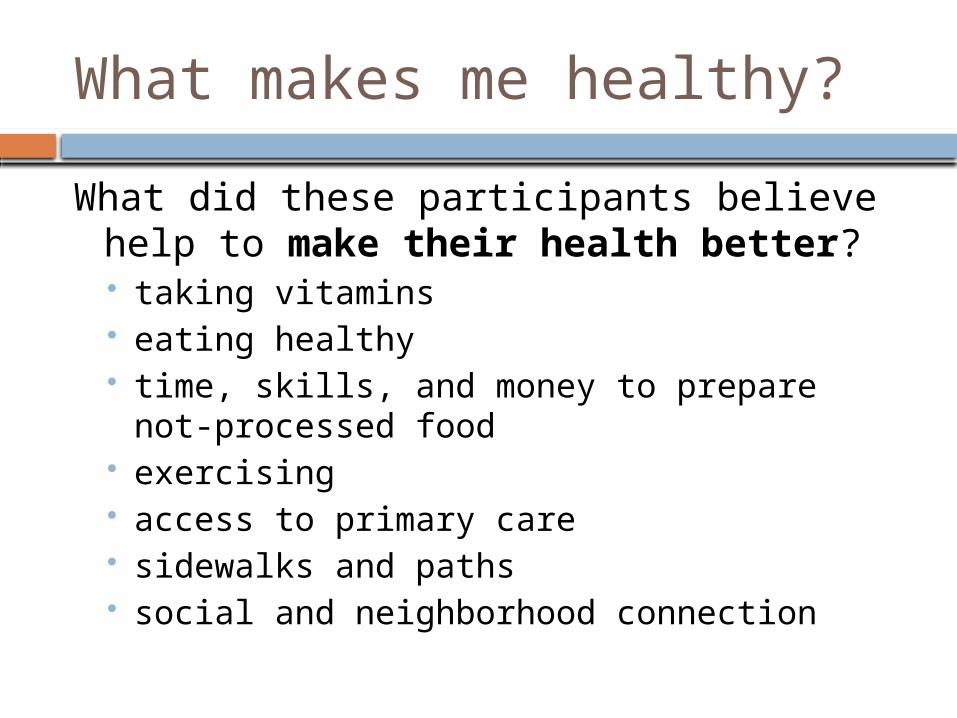
What makes me healthy?
What did these participants believe help to make their health better? taking vitamins eating healthy time, skills, and money to prepare not-
processed food exercising access to primary care sidewalks and paths social and neighborhood connection
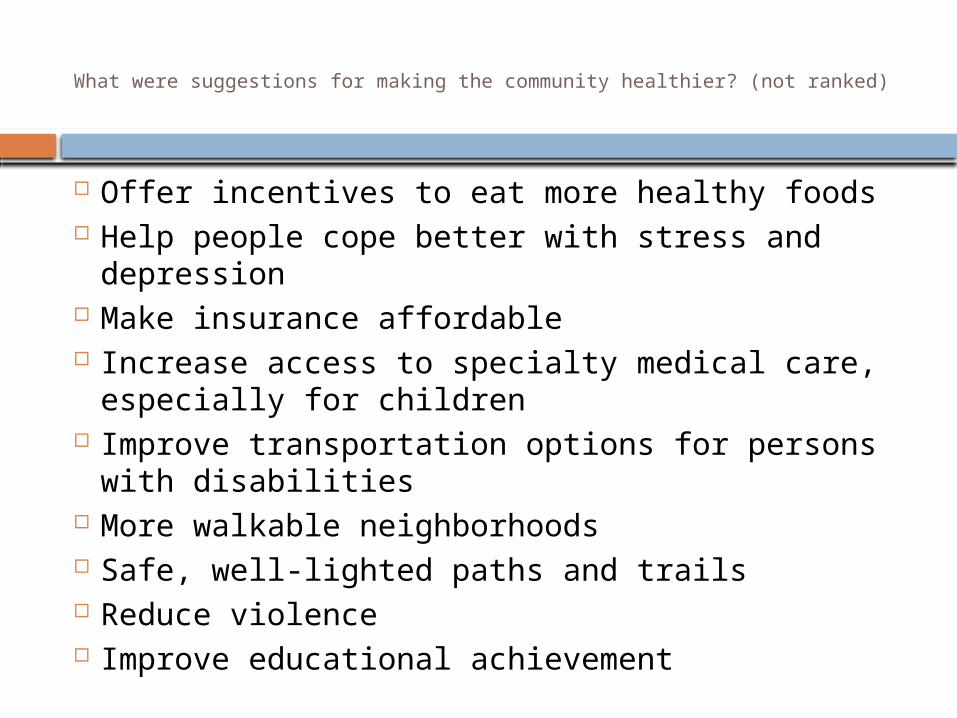
What were suggestions for making the community healthier? (not ranked)
Offer incentives to eat more healthy foods Help people cope better with stress and
depression Make insurance affordable Increase access to specialty medical care,
especially for children Improve transportation options for persons with
disabilities More walkable neighborhoods Safe, well-lighted paths and trails Reduce violence Improve educational achievement
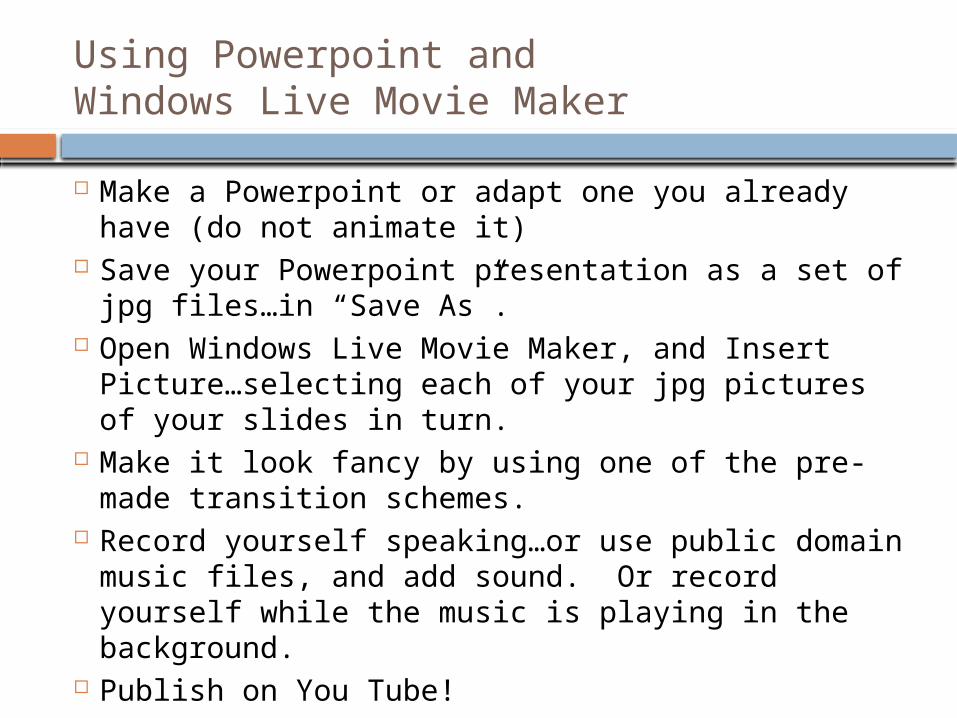
Using Powerpoint and Windows Live Movie Maker
Make a Powerpoint or adapt one you already have (do not animate it)
Save your Powerpoint presentation as a set of jpg files…in “Save As”.
Open Windows Live Movie Maker, and Insert Picture…selecting each of your jpg pictures of your slides in turn.
Make it look fancy by using one of the pre-made transition schemes.
Record yourself speaking…or use public domain music files, and add sound. Or record yourself while the music is playing in the background.
Publish on You Tube!

Making a PREZI!
http://prezi.com/_sto8qf_0vcs/the-how-to-make-a-great-prezi-prezi/
-- Prioritization-- Dialogue
Moving from DATA to PLANNING
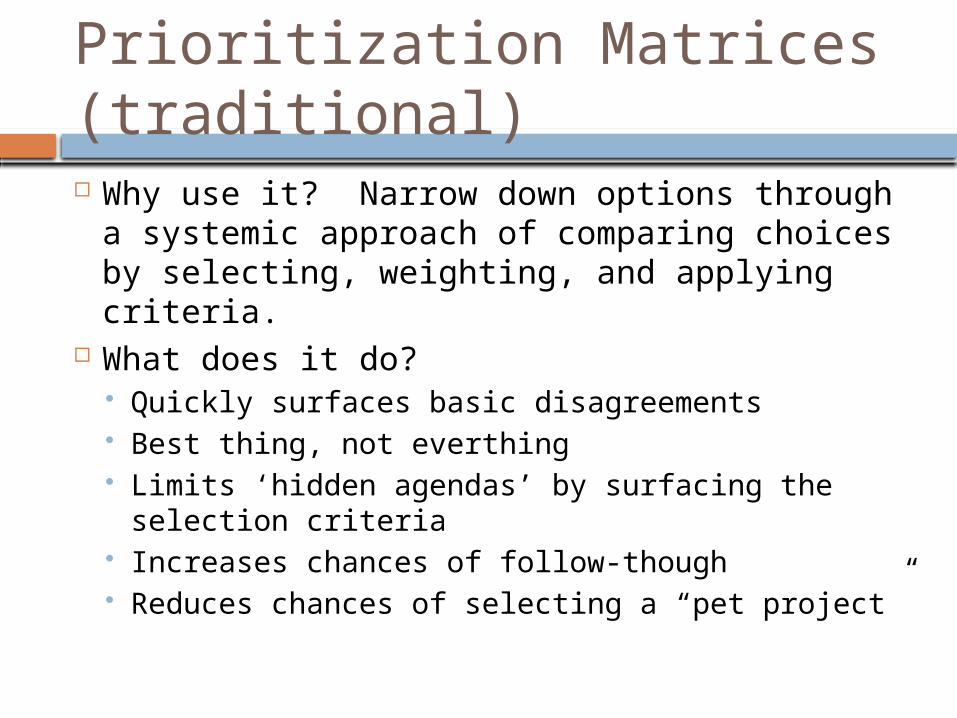
Prioritization Matrices (traditional) Why use it? Narrow down options through a
systemic approach of comparing choices by selecting, weighting, and applying criteria.
What does it do? Quickly surfaces basic disagreements Best thing, not everthing Limits ‘hidden agendas’ by surfacing the
selection criteria Increases chances of follow-though Reduces chances of selecting a “pet project”
Agree on the ultimate goal to be achieved
Choose the most important problem to fix in my house and yard
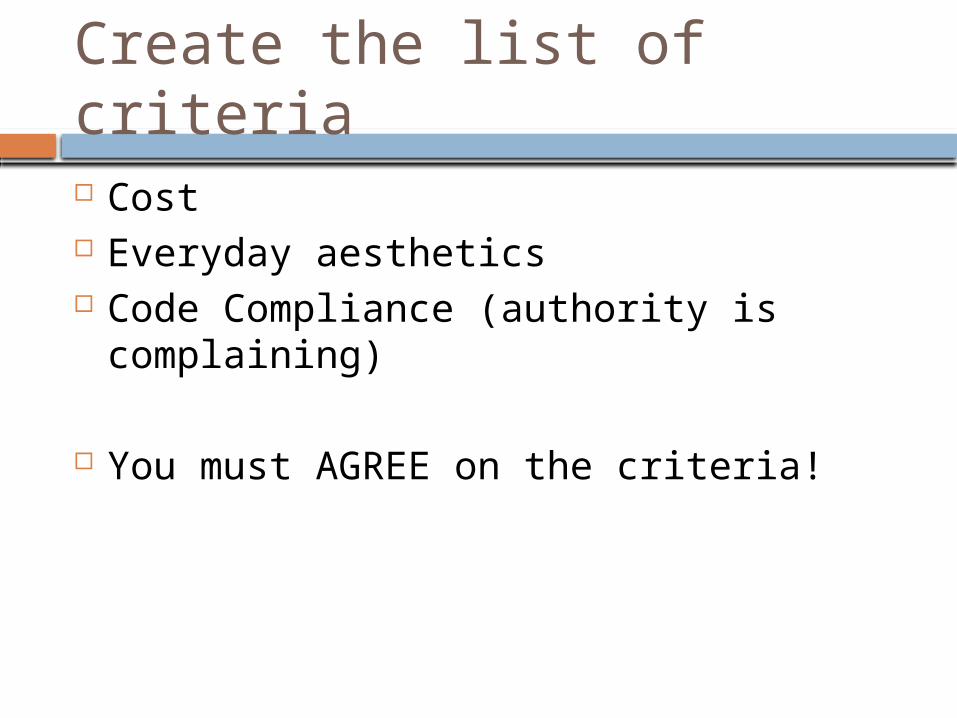
Create the list of criteria
Cost Everyday aesthetics Code Compliance (authority is
complaining)
You must AGREE on the criteria!
Weight each criterion against the other criterions
Use the worksheet from your packet.

Comparing Criteria
Cost Everyday Aesthetics
Code Compliance
Row total Relative Decimal Value
Cost 5 1/10 5.1 .248
Everyday Aesthetics
1/5 1/5 0.4 .020
Code Compliance
10 5 15 .732
TOTALS: 20.5 1.00
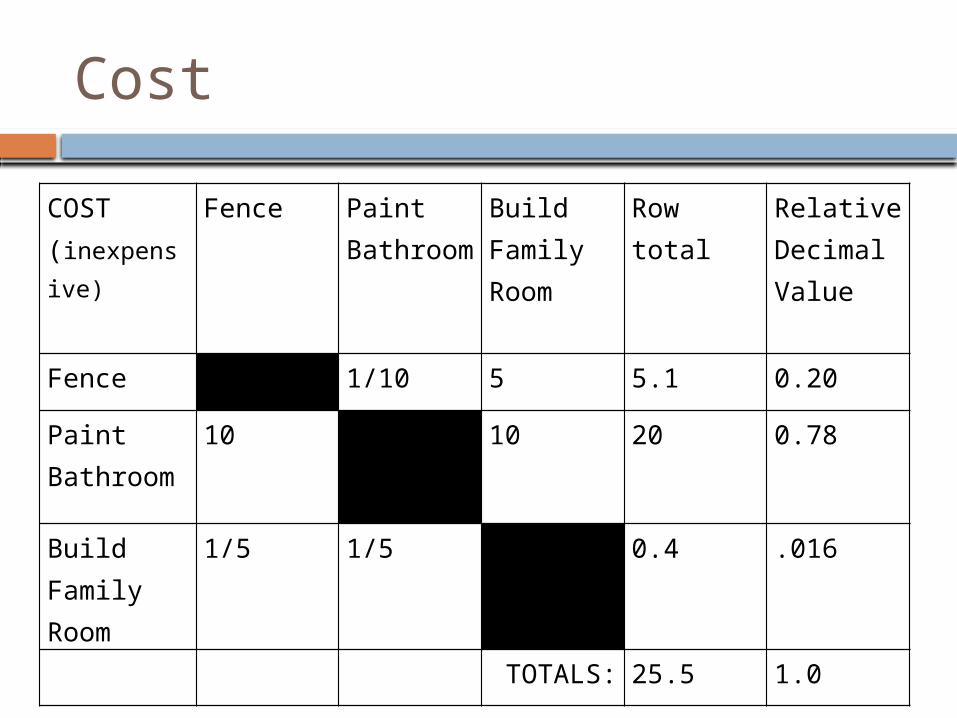
Cost
COST (inexpensive)
Fence Paint Bathroom
Build Family Room
Row total Relative Decimal Value
Fence 1/10 5 5.1 0.20
Paint Bathroom
10 10 20 0.78
Build Family Room
1/5 1/5 0.4 .016
TOTALS: 25.5 1.0
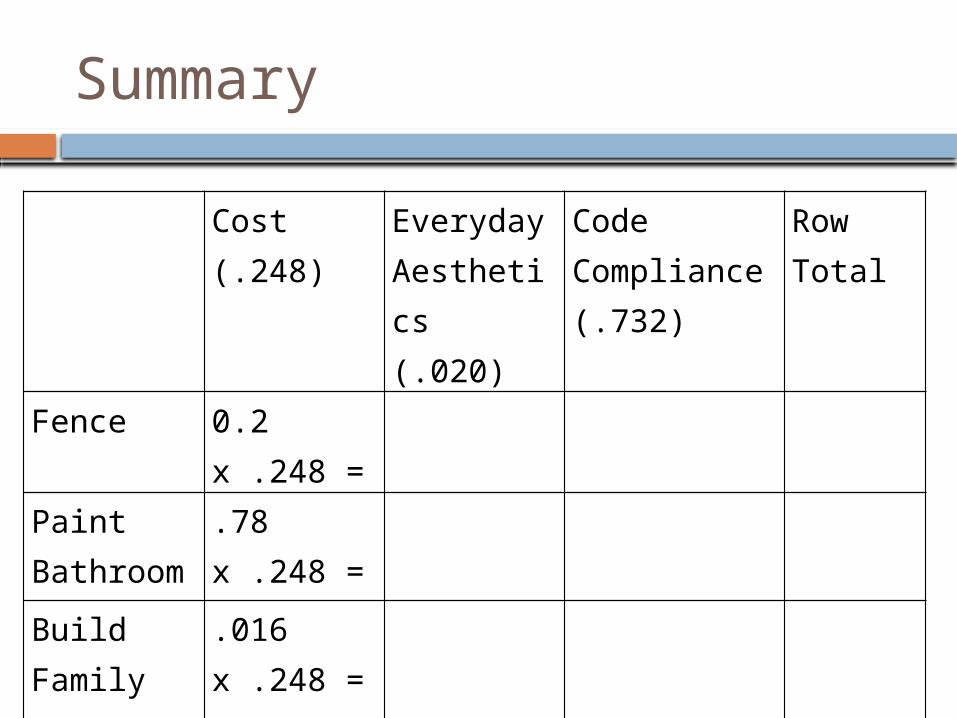
Summary
Cost(.248)
Everyday Aesthetics(.020)
Code Compliance(.732)
Row Total
Fence 0.2 x .248 =
Paint Bathroom
.78 x .248 =
Build Family Room
.016 x .248 =
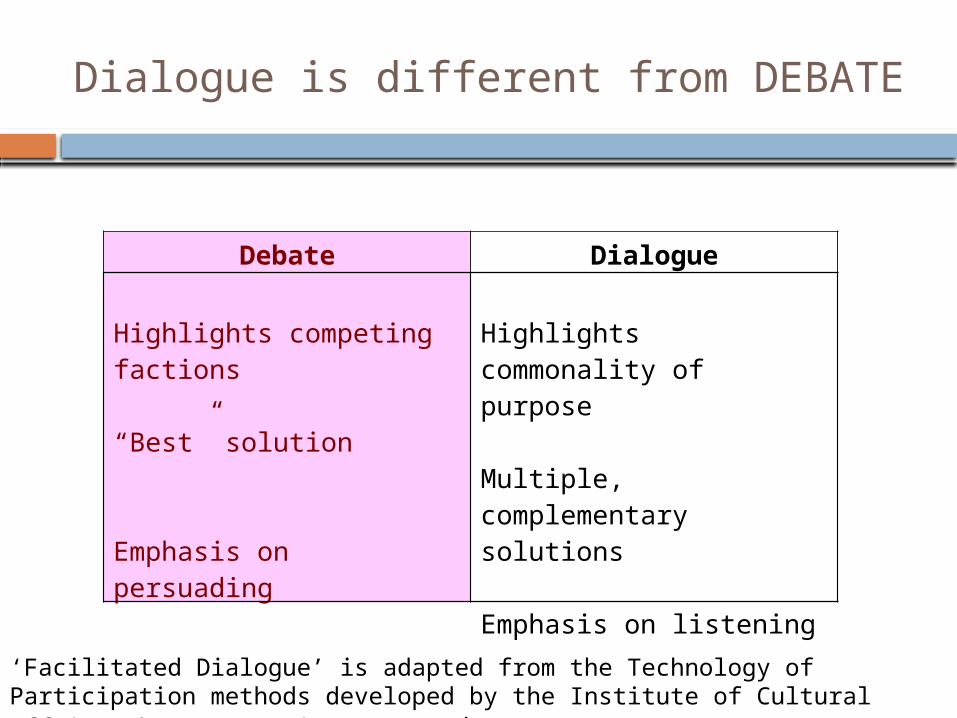
Dialogue is different from DEBATE
‘Facilitated Dialogue’ is adapted from the Technology of Participation methods developed by the Institute of Cultural Affairs. http://www.ica-usa.org/
Debate Dialogue
Highlights competing factions
“Best” solution
Emphasis on persuading
Highlights commonality of purpose
Multiple, complementary solutions
Emphasis on listening
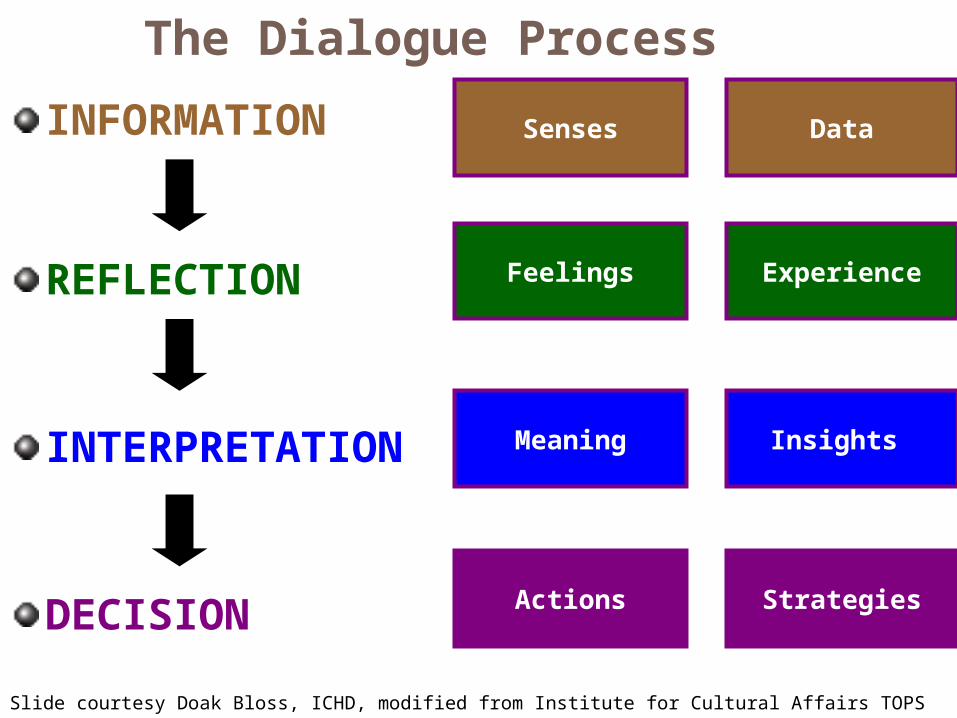
INFORMATION
REFLECTION
INTERPRETATION
DECISION
Senses Data
Feelings Experience
Meaning Insights
Actions Strategies
The Dialogue Process
Slide courtesy Doak Bloss, ICHD, modified from Institute for Cultural Affairs TOPS
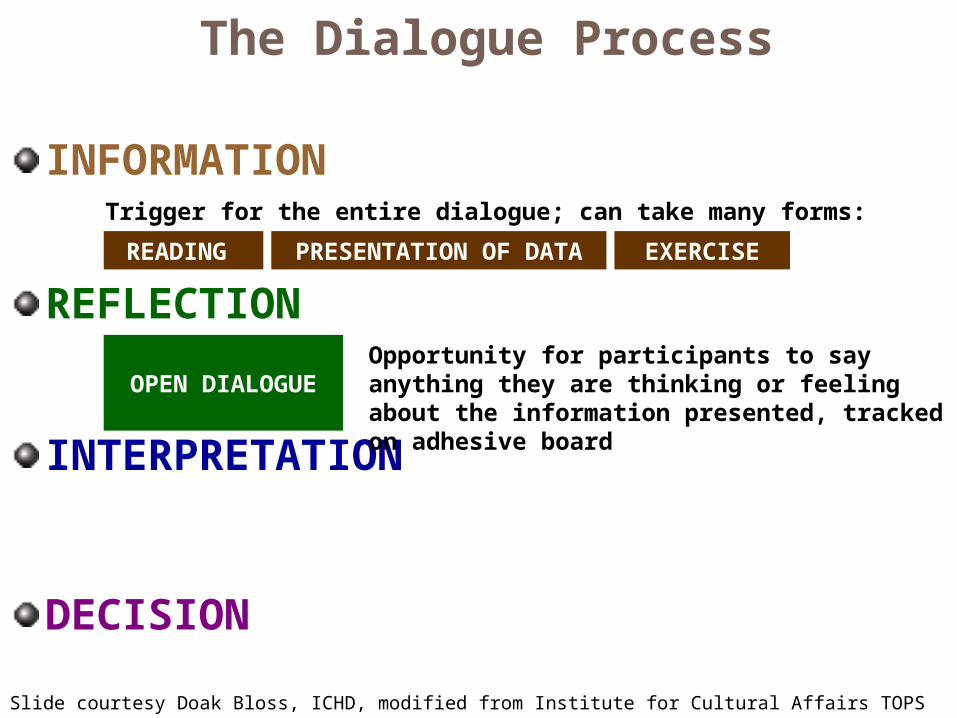
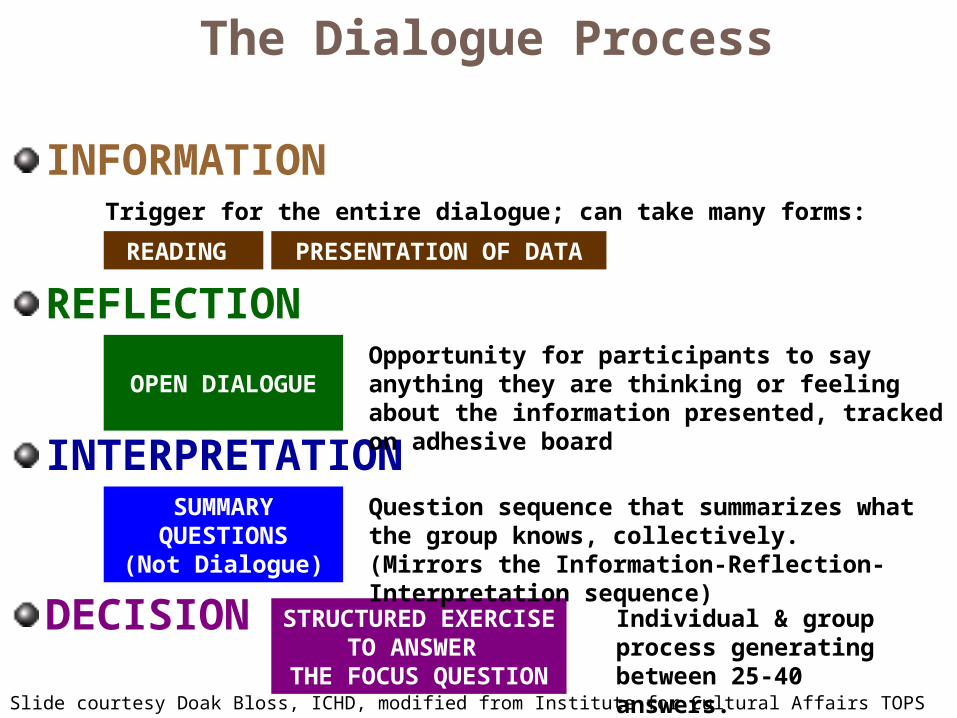
The Dialogue Process
INFORMATION
REFLECTION
INTERPRETATION
DECISION
Trigger for the entire dialogue; can take many forms:
PRESENTATION OF DATA
OPEN DIALOGUEOpportunity for participants to say anything they are thinking or feeling about the information presented, tracked on adhesive board
READING EXERCISE
Slide courtesy Doak Bloss, ICHD, modified from Institute for Cultural Affairs TOPS
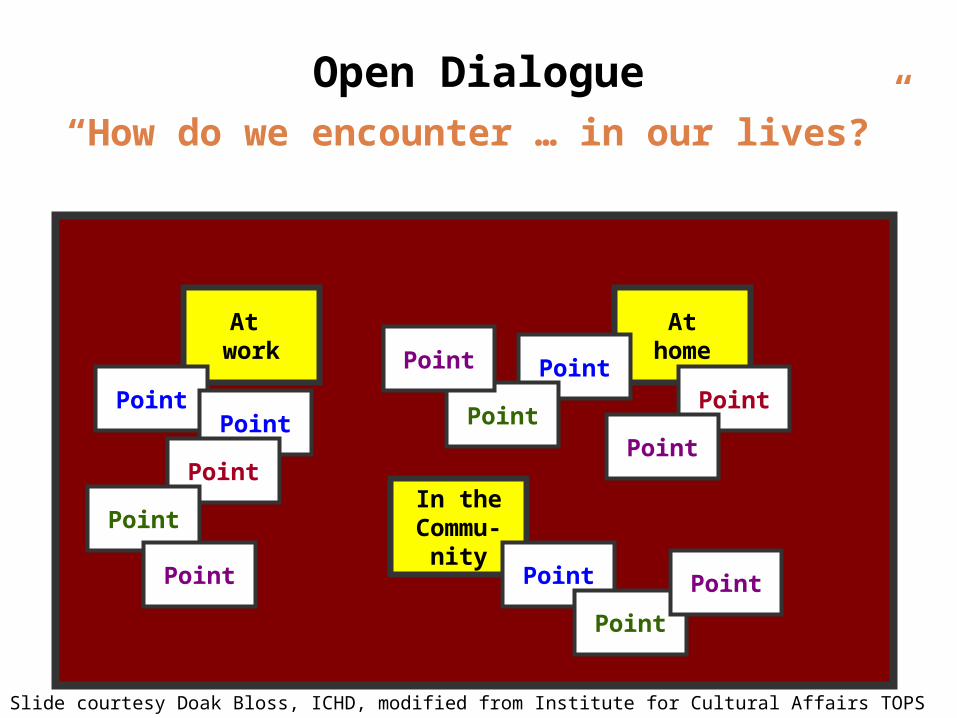
At work
Athome
In theCommu-
nity
PointPoint
Point
Point
Point
Open Dialogue“How do we encounter … in our lives?”
Point
Point
Point
Point
Point
Point
Point
Point
Slide courtesy Doak Bloss, ICHD, modified from Institute for Cultural Affairs TOPS

INFORMATION
REFLECTION
INTERPRETATION*
DECISION
Trigger for the entire dialogue; can take many forms:
OPEN DIALOGUE
SUMMARY QUESTIONS
(Not Dialogue)
Opportunity for participants to say anything they are thinking or feeling about the information presented, tracked on adhesive board
Question sequence that summarizes what the group knows, collectively. (Mirrors the Information-Reflection-Interpretation sequence)
The Dialogue Process
PRESENTATION OF DATA
READING
Slide courtesy Doak Bloss, ICHD, modified from Institute for Cultural Affairs TOPS
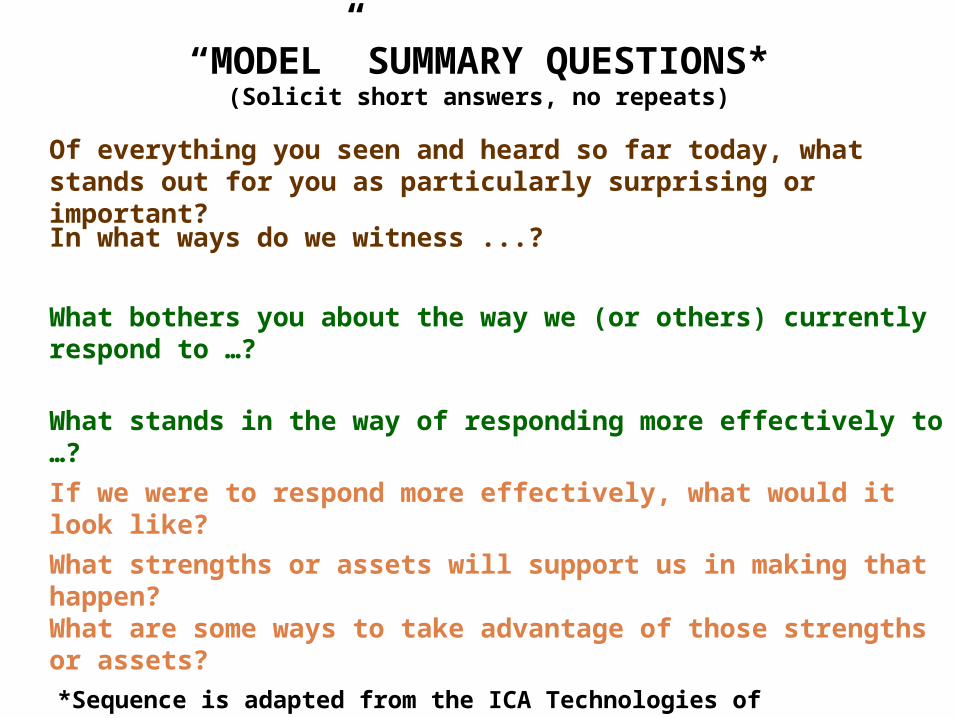
Of everything you seen and heard so far today, what stands out for you as particularly surprising or important?
“MODEL” SUMMARY QUESTIONS*(Solicit short answers, no repeats)
In what ways do we witness ...?
What bothers you about the way we (or others) currently respond to …?
What stands in the way of responding more effectively to …?
If we were to respond more effectively, what would it look like?
What strengths or assets will support us in making that happen?What are some ways to take advantage of those strengths or assets?*Sequence is adapted from the ICA Technologies of Participation ® training.
INFORMATION
REFLECTION
INTERPRETATION
DECISION
Trigger for the entire dialogue; can take many forms:
OPEN DIALOGUE
SUMMARY QUESTIONS
(Not Dialogue)
STRUCTURED EXERCISE TO
ANSWER THE FOCUS QUESTION
Individual & group process generating between 25-40 answers.
Opportunity for participants to say anything they are thinking or feeling about the information presented, tracked on adhesive board
Question sequence that summarizes what the group knows, collectively. (Mirrors the Information-Reflection-Interpretation sequence)
The Dialogue Process
PRESENTATION OF DATA
READING
Slide courtesy Doak Bloss, ICHD, modified from Institute for Cultural Affairs TOPS
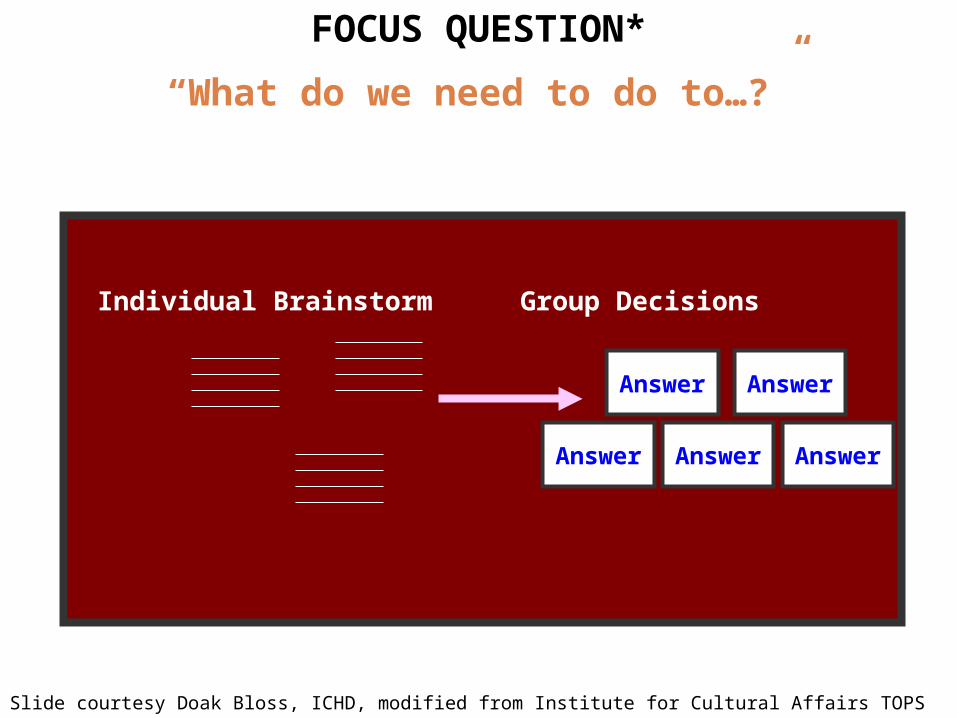
Individual Brainstorm Group Decisions
Answer
AnswerAnswer Answer
Answer
FOCUS QUESTION*
“What do we need to do to…?”
Slide courtesy Doak Bloss, ICHD, modified from Institute for Cultural Affairs TOPS

Answer
Answer
Answer
Answer
AnswerAnswer
Answer
AnswerAnswer
Answer
FOCUS QUESTION*
“What do we need to do to…?”
Slide courtesy Doak Bloss, ICHD, modified from Institute for Cultural Affairs TOPS

Answer
Answer
Answer
Answer
AnswerAnswer
Answer
Answer
Answer
Pairing Similar Answers Answer
FOCUS QUESTION*
“What do we need to do to…?”
Slide courtesy Doak Bloss, ICHD, modified from Institute for Cultural Affairs TOPS

Answer
Answer
Answer
Answer
Answer
Answer
Answer
Answer
Answer
Clustering
Answer
Finding
Finding
Finding
Naming the Clusters
FOCUS QUESTION*
“What do we need to do to…?”
Slide courtesy Doak Bloss, ICHD, modified from Institute for Cultural Affairs TOPS
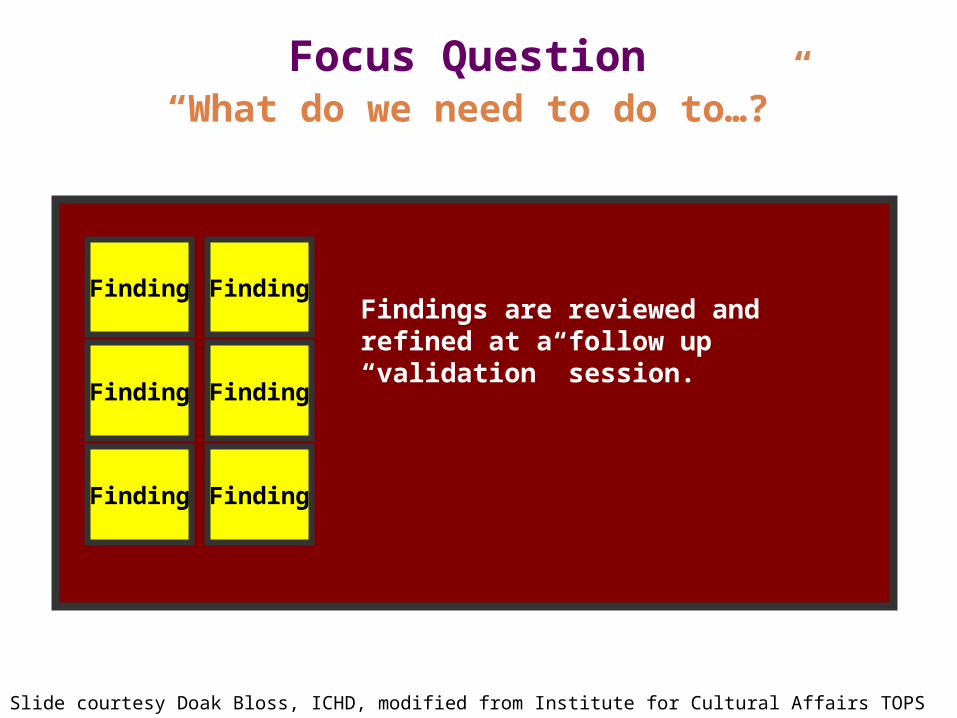
Findings are reviewed and refined at a follow up “validation” session.
Finding
Finding
Focus Question
Finding
Finding
Finding
Finding
“What do we need to do to…?”
Slide courtesy Doak Bloss, ICHD, modified from Institute for Cultural Affairs TOPS
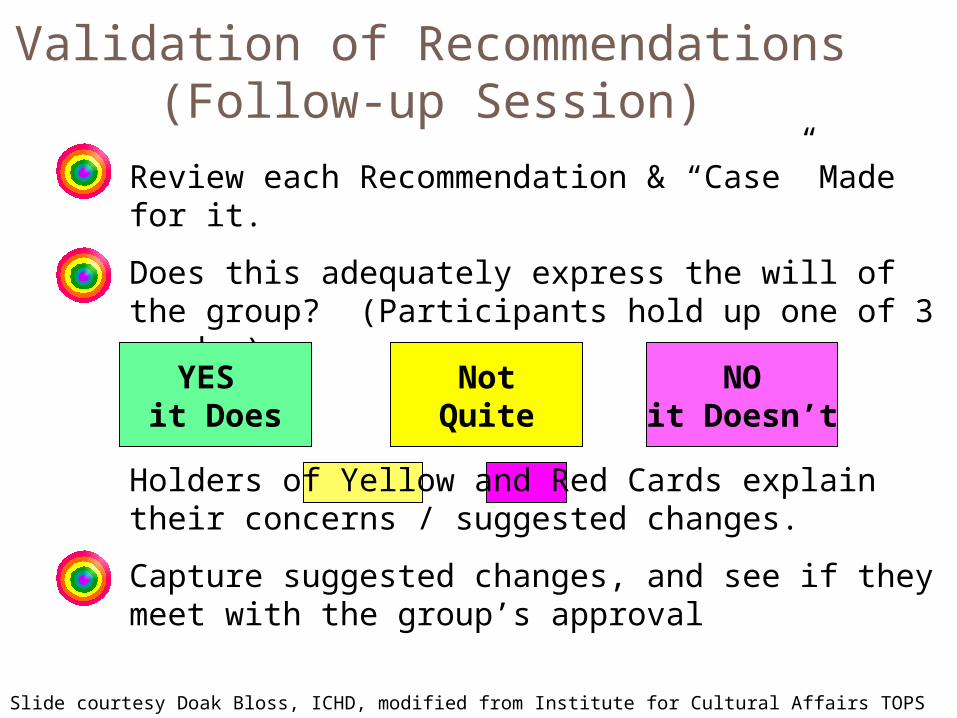
Validation of Recommendations(Follow-up Session)
Review each Recommendation & “Case” Made for it.
Does this adequately express the will of the group? (Participants hold up one of 3 cards.)
Capture suggested changes, and see if they meet with the group’s approval
YES it Does
NotQuite
NOit Doesn’t
Holders of Yellow and Red Cards explain their concerns / suggested changes.
Slide courtesy Doak Bloss, ICHD, modified from Institute for Cultural Affairs TOPS
Storytelling in Prevention
www.preventionspeaks.org
How can story help you?
http://
www.preventionspeaks.org/stories/speak-to-inspire
Share knowledge
Share Knowledge Story shows rather than tells. (example:
one simple technique is highlighted here for teaching about improved pedestrian routes).
What kinds of stories teach? Short, memorable stories that illustrate one
surprising or unexpected fact. A story that shows human experience as
authentic and credible, lending believability to science and research. (example: how a school changed its lunch menu)
Build Commitment
If you are working to change policy and systems, your group needs a strong and united commitment to persevere. Stories can help build, maintain and reinforce this commitment.
What kinds of stories build commitment? Those that build trusted relationships—"why you do what you
do" stories. People talk about: Why they care about the issue they're working on What happened in their life that led them to do this work Do this frequently, and do it when new people join, to:
deepen their relationships with each other, bring out knowledge and skills, clarify and recommit to their own purpose, and strengthen the group collective story or purpose.
(Here are examples)
Influence Change
Influence Change Story has the power to help people believe
in new possibilities. (Here's how a school gotkids excited about eating vegetables.)
What kinds of stories transform? Stories:
with a sympathetic character who changes. The listener can imagine herself changing.
that show achievement and motivation. of success and impact.
Inspire Action
Inspire Action You have to connect with emotions and values for people to make
decisions and act on them, whether it is to join a coalition, visit a legislator, or support your idea.
Stories build trust. The audience doesn't separate the speaker from the message; by telling a personal story you are more likeable, knowable, and easier to trust.
What stories connect with emotions and values? Those that show a likeable, relatable "hero" who takes on a
challenge or conflict and comes to a realization. "What if" or "imagine if" stories that show new possibilities and
futures. Sharing a story is really sharing learning. Your audience will come
to the same realization the lead character has, or at least understand a different point of view.
From this shared base of understanding, you are now prepared to ask the audience to engage in some kind of action.
http://www.preventionspeaks.org/stories/teens-kick-tobacco-ads-out#families-deserve-safe-parks
Debriefing
What part did you like best? What part did you like least? What was working with your group like? What new skills did you learn? What did you already know? Is there anything you need more
information or practice with before you feel you can do it yourself?


![[IJCT V3I4P12] Authors:Mrs. Sandhiya V., Ms. Abarna N.,](https://img.pdfslide.net/doc/110x75/5888a0a71a28ab264b8b5d83/ijct-v3i4p12-authorsmrs-sandhiya-v-ms-abarna-n.jpg)


![[IJCT V3I4P14] Authors: Mrs. Vidhya A.,Ms. Abarna N.,](https://img.pdfslide.net/doc/110x75/5888a0a71a28ab264b8b5d7f/ijct-v3i4p14-authors-mrs-vidhya-ams-abarna-n.jpg)
![[IJCT V3I4P13] Authors:Ms. Swathi G.,2 Ms. Abarna N](https://img.pdfslide.net/doc/110x75/5888a0a71a28ab264b8b5d81/ijct-v3i4p13-authorsms-swathi-g2-ms-abarna-n.jpg)