Embed Size (px)
Citation preview
The Work of NOAA's U.S. Coast and Geodetic Survey
THE NATIONAL GEODETIC REFERENCE SYSTEMMelvyn C. Grunthal
National Geodetic Survey, NOAA
Introduction
Oneof the primary concerns ofgovernment (federal, state, and local) mustbe to protect the coastal environment while maximizing the use ofcoastal resources.This is becoming even more important today with increasing population pressureupon the fragile coastal environment. Essential to the protection process are suchactivities as mapping and charting of the coastal zone; development and use ofgeographic information systems (GIS) to display, analyze and model the interactionsbetween environmental and cultural parameters; definition of legal boundaries;development of safe and effective means of navigation; and monitoring of changesin the land/sea boundary. All of these activities require accurate horizontalpositioning or determination of elevation. Positions or elevations determined andused by different agencies be compatible. The primary mission of the NationalGeodetic Survey (NGS), a division of the National Oceanic and AtmosphericAdministration (NOAA), is to provide a means for everyone performing horizontal,vertical or gravity measurements to use the same coordinate system, therebymaking all measurements compatible. We refer to the positional framework thatmakes this possible as the National Geodetic Reference System (NGRS). Thispaper describes NGRS, its applications in the coastal zone, and the products andservices of NGS.
NGRS
Geodesy is the earth science used to determine the size and shape of theearth; exact positions/elevations of points on its surface; and its gravity field. NGSuses geodetic surveying techniques to develop and maintain NGRS, which iscomposed primarily of the nation's three geodetic control networks horizontal(270,000 stations), vertical (585.000 stations), and gravity (2,100,000 stations).Points defined by these networks are the basic geographic location and elevationstarting positions for land surveys, cartography, engineering, construction, environmental control measures, and earthsciencestudies. The primary value of NGRSis universal compatibility of spatialproducts. Simply put, this means that data whosegeographic positions are determined through reference to NGRS are compatible withall other data whose geographic positions have been determined relative toNGRS—no costly transformations will be required to make the two data setscompatible.
To create NGRS, NGS defined both vertical and horizontal referencesystems and provided users with a means to determine positions and elevationsrelative to these coordinate systems.The reference systems are the North AmericanVertical Datum of 1988 (NAVD 88) and the North American Datum of 1983 (NAD83), respectively.
An essential element of NGRS is a large network of monumented pointswhose horizontal positions and/or elevations are known relative to NAD 83 or NAVD88. The user can determine the geographic positions or elevations of unknown
189
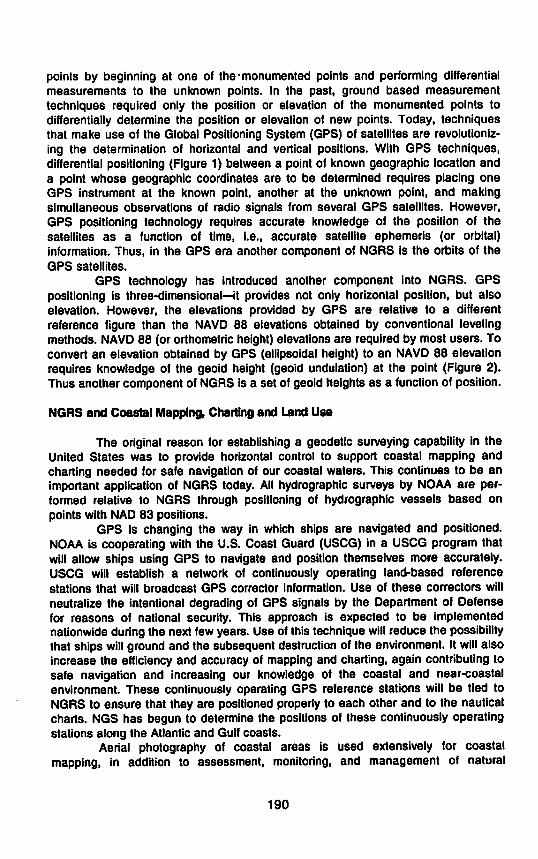
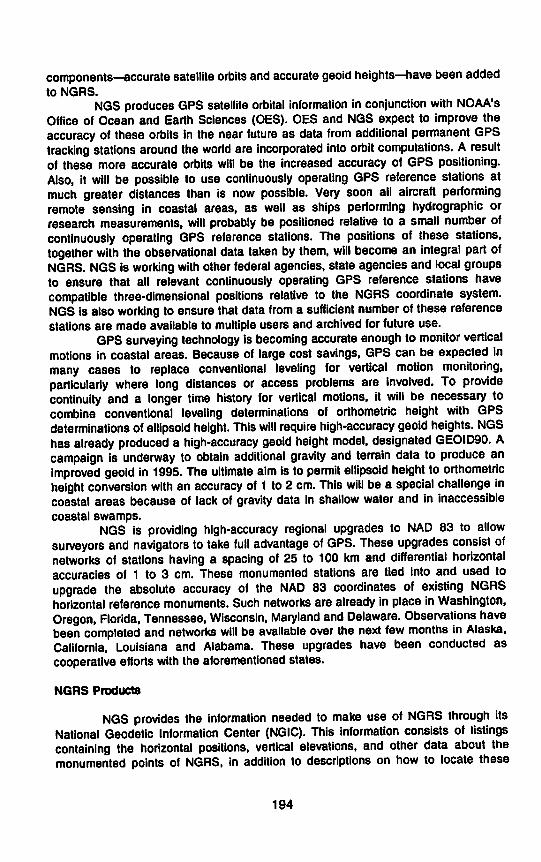
points by beginning at one of the-monumented points and performing differentialmeasurements to the unknown points. In the past, ground based measurementtechniques required only the position or elevation of the monumented points todifferentially determine the position or elevation of new points. Today, techniquesthat make use of the Global Positioning System (GPS) of satellites are revolutionizing the determination of horizontal and vertical positions. With GPS techniques,differential positioning (Figure 1) between a point of known geographic location anda point whose geographic coordinates are to be determined requires placing oneGPS instrument at the known point, another at the unknown point, and makingsimultaneous observations of radio signals from several GPS satellites. However,GPS positioning technology requires accurate knowledge of the position of thesatellites as a function of time, i.e., accurate satellite ephemeris (or orbital)information. Thus, in the GPS era another component of NGRS is the orbits of theGPS satellites.
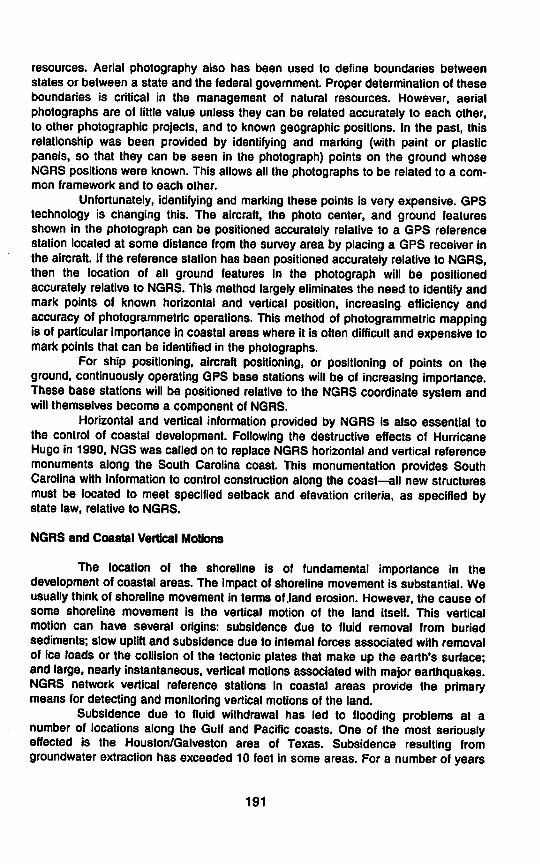
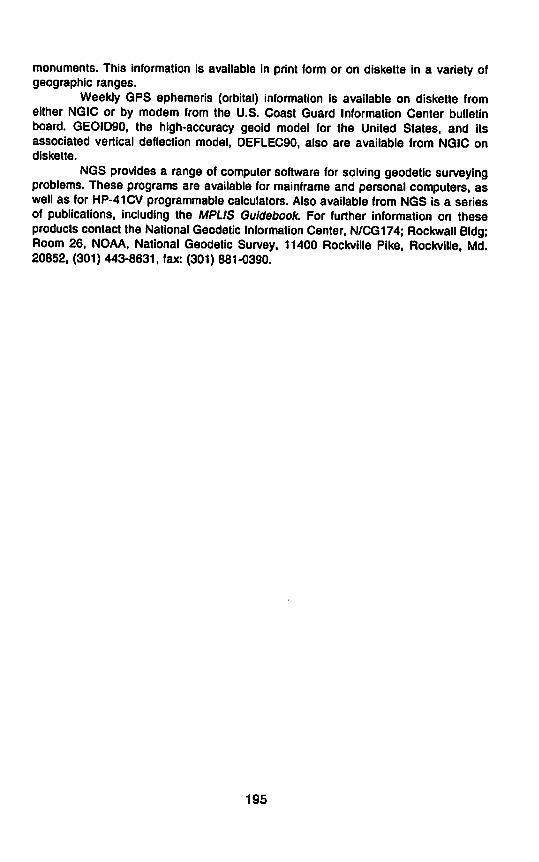
GPS technology has introduced another component into NGRS. GPSpositioning is three-dimensional—it provides not only horizontal position, but alsoelevation. However, the elevations provided by GPS are relative to a differentreference figure than the NAVD 88 elevations obtained by conventional levelingmethods. NAVD 88 (or orthometric height) elevations are required by most users. Toconvert an elevation obtained by GPS (ellipsoidal height) to an NAVD 88 elevationrequires knowledge of the geoid height (geoid undulation) at the point (Figure 2).Thus another component of NGRS is a set of geoid heights as a function of position.
NGRS and Coastal Mapping, Charting and Land Use
The original reason for establishing a geodetic surveying capability in theUnited States was to provide horizontal control to support coastal mapping andcharting needed for safe navigation of our coastal waters. This continues to be animportant application of NGRS today. All hydrographic surveys by NOAA are performed relative to NGRS through positioning of hydrographic vessels based onpoints with NAD 83 positions.
GPS is changing the way in which ships are navigated and positioned.NOAA is cooperating with the U.S. Coast Guard (USCG) in a USCG program thatwill allow ships using GPS to navigate and position themselves more accurately.USCG will establish a network of continuously operating land-based referencestations that will broadcast GPS corrector information. Use of these correctors willneutralize the intentional degrading of GPS signals by the Department of Defensefor reasons of national security. This approach is expected to be implementednationwide during the next few years. Use of this technique will reduce the possibilitythat ships will ground and the subsequent destruction of the environment. It will alsoincrease the efficiency and accuracy of mapping and charting, again contributing tosafe navigation and increasing our knowledge of the coastal and near-coastalenvironment. These continuously operating GPS reference stations will be tied toNGRS to ensure that they are positioned properly to each other and to the nauticalcharts. NGS has begun to determine the positions of these continuously operatingstations along the Atlantic and Gulf coasts.
Aerial photography of coastal areas is used extensively for coastalmapping, in addition to assessment, monitoring, and management of natural
190
resources. Aerial photography also has been used to define boundaries betweenstates or between a state and the federal government. Proper determination of theseboundaries is critical in the management of natural resources. However, aerialphotographs are of little value unless they can be related accurately to each other,to other photographic projects, and to known geographic positions. In the past, thisrelationship was been provided by identifying and marking (with paint or plasticpanels, so that they can be seen in the photograph) points on the ground whoseNGRS positions were known. This allows all the photographs to be related to a common framework and to each other.
Unfortunately, identifying and marking these points is very expensive. GPStechnology is changing this. The aircraft, the photo center, and ground featuresshown in the photograph can be positioned accurately relative to a GPS referencestation located at some distance from the survey area by placing a GPS receiver inthe aircraft. If the reference station has been positioned accurately relative to NGRS,then the location of all ground features in the photograph will be positionedaccurately relative to NGRS. This method largely eliminates the need to identify andmark points of known horizontal and vertical position, increasing efficiency andaccuracy of photogrammetric operations. This method of photogrammetric mappingis of particularimportance in coastal areas where it is often difficult and expensive tomark points that can be identified in the photographs.
For ship positioning, aircraft positioning, or positioning of points on theground, continuously operating GPS base stations will be of increasing importance.These base stations will be positioned relative to the NGRS coordinate system andwill themselves become a component of NGRS.
Horizontal and vertical information provided by NGRS is also essential tothe control of coastal development. Following the destructive effects of HurricaneHugo in 1990, NGS was called on to replace NGRS horizontal and vertical referencemonuments along the South Carolina coast. This monumentation provides SouthCarolina with information to control construction along the coast—all new structuresmust be located to meet specified setback and elevation criteria, as specified bystate law, relative to NGRS.
NGRS and Coastal Vertical Motions
The location of the shoreline is of fundamental importance in thedevelopment of coastal areas. The impact of shoreline movement is substantial. Weusually think of shoreline movement in terms of .land erosion. However, the cause ofsome shoreline movement is the vertical motion of the land itself. This verticalmotion can have several origins: subsidence due to fluid removal from buriedsediments; slow uplift and subsidence due to internal forces associated with removalof ice loads or the collision of the tectonic plates that make up the earth's surface;and large,nearly instantaneous, vertical motions associated with major earthquakes.NGRS network vertical reference stations in coastal areas provide the primarymeans for detecting and monitoring vertical motions of the land.
Subsidence due to fluid withdrawal has led to flooding problems at anumber of locations along the Gulf and Pacific coasts. One of the most seriouslyeffected is the Houston/Galveston area of Texas. Subsidence resulting fromgroundwaterextraction has exceeded 10 feet in some areas. For a number of years
191
NGS has supported the Harris-Galveston Coastal Subsidence District by establishingand monitoring a dense network of level lines and vertical reference stations.
Based on the information from NGS studies, the subsidence district
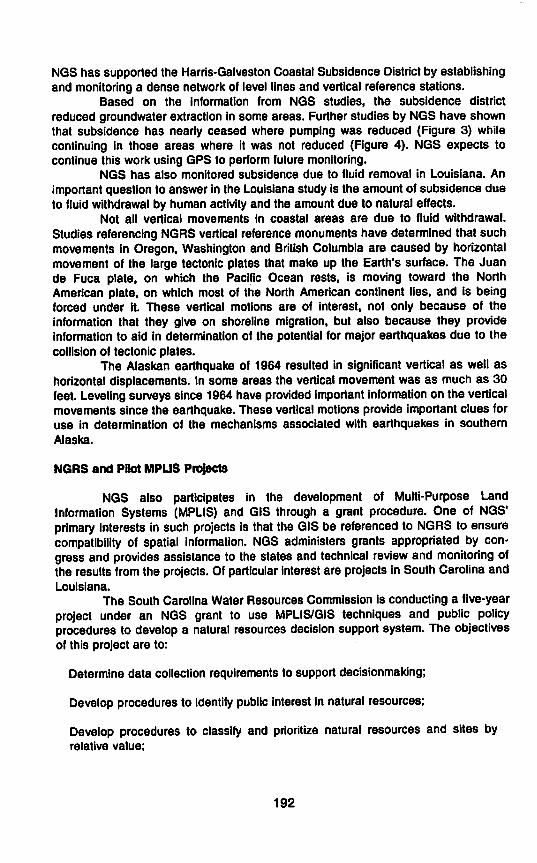
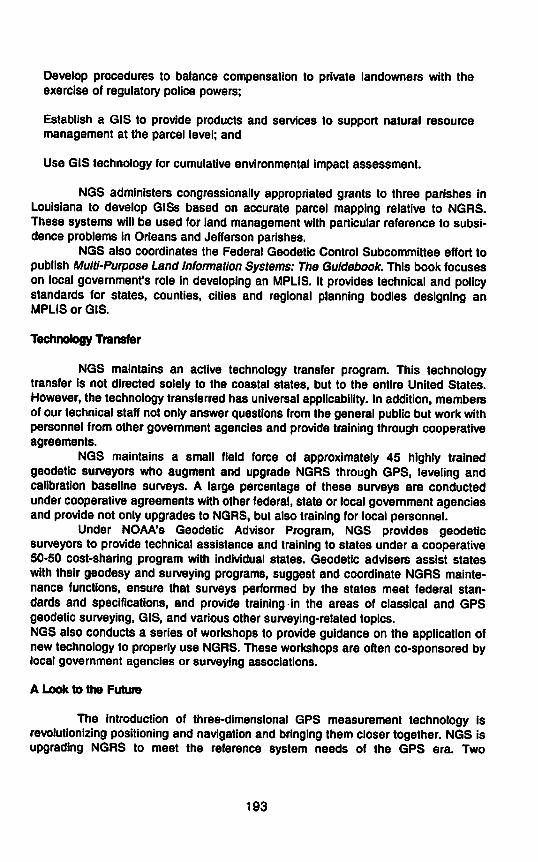
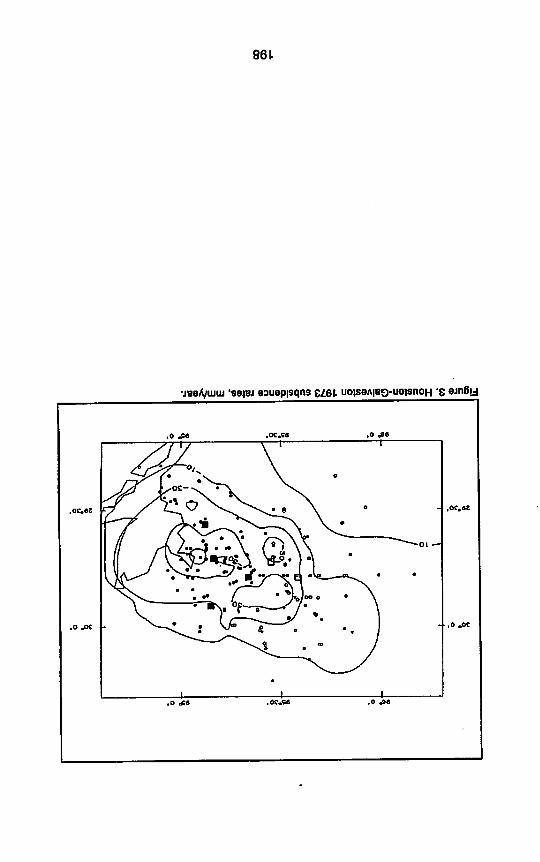
reduced groundwater extraction in some areas. Further studies by NGS have shownthat subsidence has nearly ceased where pumping was reduced (Figure 3) whilecontinuing in those areas where it was not reduced (Figure 4). NGS expects tocontinue this work using GPS to perform future monitoring.
NGS has also monitored subsidence due to fluid removal in Louisiana. An
important question to answer in the Louisiana study is the amount of subsidence dueto fluid withdrawal by human activity and the amount due to natural effects.
Not all vertical movements in coastal areas are due to fluid withdrawal.Studies referencing NGRS vertical reference monuments have determined that suchmovements in Oregon, Washington and British Columbia are caused by horizontalmovement of the large tectonic plates that make up the Earth's surface. The Juande Fuca plate, on which the Pacific Ocean rests, is moving toward the NorthAmerican plate, on which most of the North American continent lies, and is beingforced under it. These vertical motions are of interest, not only because of theinformation that they give on shoreline migration, but also because they provideinformation to aid in determination of the potential for major earthquakes due to thecollision of tectonic plates.
The Alaskan earthquake of 1964 resulted in significant vertical as well ashorizontal displacements. In some areas the vertical movementwas as much as 30feet. Leveling surveys since 1964 have providedimportantinformation on the verticalmovements since the earthquake. These vertical motions provide important clues foruse in determination of the mechanisms associated with earthquakes in southernAlaska.
NGRS and Pilot MPUS Projects
NGS also participates in the development of Multi-Purpose LandInformation Systems (MPLIS) and GIS through a grant procedure. One of NGS'primary interests in such projects is that the GIS be referenced to NGRS to ensurecompatibility of spatial information. NGS administers grants appropriated by congress and provides assistance to the states and technical review and monitoring ofthe results from the projects. Ofparticular interest are projects in South Carolina andLouisiana.
The South Carolina Water Resources Commission is conducting a five-yearproject under an NGS grant to use MPLIS/GIS techniques and public policyprocedures to develop a natural resources decision support system. The objectivesof this project are to:
Determine data collection requirements to support decisionmaking;
Develop procedures to identify public interest in natural resources;
Develop procedures to classify and prioritize natural resources and sites byrelative value;
192
Develop procedures to balance compensation to private landowners with theexercise of regulatory police powers;
Establish a GIS to provide products and services to support natural resourcemanagement at the parcel level; and
Use GIS technology for cumulative environmental impact assessment.
NGS administers congressionally appropriated grants to three parishes inLouisiana to develop GISs based on accurate parcel mapping relative to NGRS.These systems will be used for land management with particular reference to subsidence problems in Orleans and Jefferson parishes.
NGS also coordinates the Federal Geodetic Control Subcommittee effort topublish Multi-Purpose LandInformation Systems: The Guidebook. This book focuseson local government's role in developing an MPLIS. It provides technical and policystandards for states, counties, cities and regional planning bodies designing anMPLIS or GIS.
Technology Transfer
NGS maintains an active technology transfer program. This technologytransfer is not directed solely to the coastal states, but to the entire United States.However, the technology transferred has universal applicability. In addition, membersof our technical staff not only answer questions from the general publicbut work withpersonnel from other government agencies and provide training through cooperativeagreements.
NGS maintains a small field force of approximately 45 highly trainedgeodetic surveyors who augment and upgrade NGRS through GPS, leveling andcalibration baseline surveys. A large percentage of these surveys are conductedunder cooperative agreements with other federal, state or local government agenciesand provide not only upgrades to NGRS, but also training for local personnel.
Under NOAA's Geodetic Advisor Program, NGS provides geodeticsurveyors to provide technical assistance and training to states under a cooperative50-50 cost-sharing program with individual states. Geodetic advisers assist stateswith their geodesy and surveying programs, suggest and coordinate NGRS maintenance functions, ensure that surveys performed by the states meet federal standards and specifications, and provide training in the areas of classical and GPSgeodetic surveying, GIS, and various other surveying-related topics.NGS also conducts a series of workshops to provide guidance on the application ofnew technology to properly use NGRS. These workshops are often co-sponsored bylocal government agencies or surveying associations.
A Look to the Future
The introduction of three-dimensional GPS measurement technology isrevolutionizing positioning and navigation and bringing them closer together. NGS isupgrading NGRS to meet the reference system needs of the GPS era. Two
193
components—accurate satellite orbits and accurate geoid heights—have been addedto NGRS.
NGS producesGPS satellite orbital information in conjunction with NOAA'sOffice of Ocean and Earth Sciences (OES). OES and NGS expect to improve theaccuracy of these orbits in the near future as data from additional permanent GPStracking stations around the world are incorporated into orbit computations. A resultof these more accurate orbits will be the increased accuracy of GPS positioning.Also, it will be possible to use continuously operating GPS reference stations atmuch greater distances than is now possible. Very soon ail aircraft performingremote sensing in coastal areas, as well as ships performing hydrographic orresearch measurements, will probably be positioned relative to a small number ofcontinuously operating GPS reference stations. The positions of these stations,together with the observational data taken by them, will become an integral part ofNGRS. NGS is working with otherfederal agencies, state agencies and local groupsto ensure that all relevant continuously operating GPS reference stations havecompatible three-dimensional positions relative to the NGRS coordinate system.NGS is also working to ensure thatdata from a sufficient number of these referencestations are made available to multiple users and archived for future use.
GPS surveying technology is becoming accurate enough to monitor verticalmotions in coastal areas. Because of large cost savings, GPS can be expected inmany cases to replace conventional leveling for vertical motion monitoring,particularly where long distances or access problems are involved. To providecontinuity and a longer time history for vertical motions, it will be necessary tocombine conventional leveling determinations of orthometric height with GPSdeterminations ofellipsoid height. This will require high-accuracy geoid heights. NGShas already produced a high-accuracy geoid height model, designated GEOID90. Acampaign is underway to obtain additional gravity and terrain data to produce animproved geoid in 1995. The ultimate aim is to permit ellipsoid height to orthometricheight conversion with an accuracy of 1 to2 cm. This will be a special challenge incoastal areas because of lack of gravity data in shallow water and in inaccessiblecoastal swamps.
NGS is providing high-accuracy regional upgrades to NAD 83 to allowsurveyors and navigators to take full advantage of GPS. These upgrades consist ofnetworks of stations having a spacing of 25 to 100 km and differential horizontalaccuracies of 1 to 3 cm. These monumented stations are tied into and used toupgrade the absolute accuracy of the NAD 83 coordinates of existing NGRShorizontal reference monuments. Such networks are already in place in Washington,Oregon, Florida, Tennessee, Wisconsin, Maryland andDelaware. Observations havebeen completed and networks will be available over the next few months in Alaska.California, Louisiana and Alabama. These upgrades have been conducted ascooperative efforts with the aforementioned states.
NGRS Products
NGS provides the information needed to make use of NGRS through itsNational Geodetic Information Center (NGIC). This information consists of listingscontaining the horizontal positions, vertical elevations, and other data about themonumented points of NGRS, in addition to descriptions on how to locate these
194
monuments. This information is available in print form or on diskette in a variety ofgeographic ranges.
Weekly GPS ephemeris (orbital) information is available on diskette fromeither NGIC or by modem from the U.S. Coast Guard Information Center bulletinboard. GEOID90, the high-accuracy geoid model for the United States, and itsassociated vertical deflection model, DEFLEC90, also are available from NGIC ondiskette.
NGS provides a range of computer software for solving geodetic surveyingproblems. These programs are available for mainframe and personal computers, aswell as for HP-41CV programmable calculators. Also available from NGS is a seriesof publications, including the MPLIS Guidebook For further information on theseproducts contact the National Geodetic Information Center, N/CG174; Rockwall Bldg;Room 26, NOAA, National Geodetic Survey, 11400 Rockville Pike, Rockville, Md.20852, (301) 443-8631, fax: (301) 881-0390.
195
Figure 1. Differential positioning.
196
cuuutguiui
Figure 2. Geoid-ellipsoid relationships.
197
»«• 0* »5»30' 991 0"
1 1" "
•
1
« ^\^-JO* 0'
•
— 10—^.
•
0
%
* -A
Vw \v
• * ^^v
• c 7 /f
«
i x • ,vv_^-
'*srl >^vm'y>' o
1
o
8 T""*.^ "^~\
—1—J»*• 0'
Rgure 3. Houston-Galveston 1973 subsidence rates, mm/year.
198
2»*30'
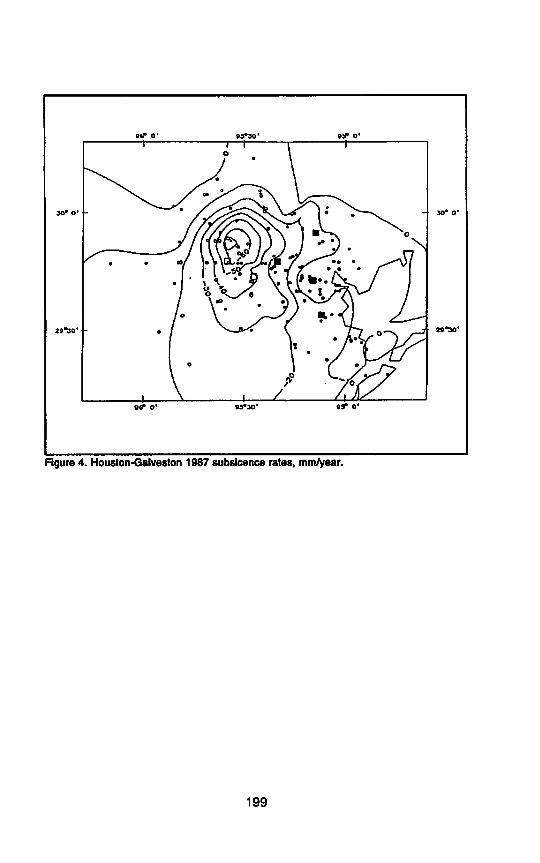
Rgure 4. Houston-Galveston 1987 subsicence rates, mm/year.
199
i I • ••></
,';.•..,i -^..ru.;-.
200
ABSTRACT
SHORELINE SURVEYS: PAST AND PRESENTVictor E. McNeel
Coast and Geodetic Survey
Current shoreline surveys in the Coast and Geodetic Survey (C&GS) resultin the production of shoreline maps and associated data. Also included in the surveyprocess is the collection of high-resolution, metric-quality aerial photographs.Shoreline maps (base maps), associated data and photographs are considered bysome to be merely byproducts of the nautical charting program. However, they arealso complete products in their own right and are available to the public. Theyshould be of particular interest to those who are working in the coastal environment,since modern tide-coordinated surveys provide a starting point for many scientificstudies of the coast. In addition, coastline data from the early 19th century to thepresent offer insight concerning types and rates of change in coastal areas. Thepurpose of this presentation is to provide information about these products.
INTRODUCTION
A shoreline survey is the process of establishing the location of theshoreline in a selected area. The shoreline shown on C&GS charts and mapsrepresents the line of contact between the land and a selected water elevation. Inareas affected by tidal fluctuations, this line of contact is the mean high water line. Inconfined coastal waters of diminished tidal influence, the mean water line may berepresented. In non-tidal waters, the shoreline represented is the land-waterinterface at the time of the photography. In areas of marsh grass, cypress or othersimilar marine vegetation, the shoreline is often obscured. In these areas anapparent shoreline is mapped at the point where the line of vegetation is a definiteline above the shoreline datum. Because this is the line that appears to a navigatoras the shoreline, it is delineated as such and is located in lieu of the actual highwater datum line.
SHOREUNE MAPS
Shoreline maps result from the shoreline survey process. They are special-use planimetric or topographic maps that usually cover a relatively narrow zonealong the shoreline and portray selected features. (Planimetric maps depict thehorizontal placement of natural and manmade features; in addition to these features,topographic maps depict form, usually showing relief as contour lines.)
Shoreline maps are graphic representations derived from plane table andphotogrammetric surveys. The maps contain data relating to the shoreline,alongshore natural and man-made features, and usually a narrow zone of naturaland man-made features inland of the shoreline. This zone may vary, however, fromseveral hundred meters to an area covering the entire map.
When obtainable, shoreline maps depict the low water line within the limitsof the survey. The accurate location of the low water line is extremely valuable forcharting because it may be used as the base line from which offshore boundaries
201
are determined and it eliminates the need for the hydrographer to develop the zerodepth curve.
Shoreline maps produced by C&GS may be grouped into three approximateeras, each of which has certain common characteristics, the most prominent ofwhich is the data source.
Early Era Shoreline Maps (1834-1929)
The framework in the form of triangulation for the first topographic surveybegan in 1816. After a brief period, congressional action caused a break in operations until 1832 when work was resumed (Shalowitz, 1964). The topographic surveywas completed in 1834 and is registered as C&GS's first topographic map. Thatmap and subsequent ones of the era were the graphic recordings of fieldtopographic surveys. The topographic shoreline surveys and the shoreline mapswere essentially the same for these early surveys, since the maps consisted entirelyof direct survey recordings made primarily with the use of a plane table and alidade.The plane table was considered by C&GS's authority on topographic surveying,O. W. Swainson (1928), to be "one of the best instruments for topographic surveying,as with it the map is actually drawn in the field where and when the features can beseen and where the amount of detail to be mapped and the accuracy required canbe judged to best advantage." For most of the earliest shoreline maps, no supplemental information for the interpretation of the topographic maps was preparedapart from the map itself. Later maps in this era were accompanied by descriptivereports that supplemented the maps with interpretive information not readily shownon the maps themselves. Descriptive reports were included as early as 1863 andwere officially mandated in 1887 (Shalowitz, 1964).
Intermediate Era Shoreline Maps (1930-1979)
Most shoreline maps produced in this period included the combined graphicrepresentation of data that originated from aerial photography and field surveys.These maps were field-checked, had supplemental data applied to them if necessary, and were edited prior to registration to ensure that all critical nearshorehazards were represented and that the features depicted were accurately describedand positioned.
Photogrammetric Surveys. During this era the application of photogram-metry was recognized by C&GS as a cost-effective method to survey the shoreline.Photogrammetry is the science of determining the physical dimensions of objectsfrom measurements of photograph images. An investigation into the feasibility ofusing aerial photography in compiling coastal maps was started June 10, 1919(Smith, 1979). From that time through 1926 experimentation included various aircraftand camera lens configurations. By 1927, the full potential of photogrammetry as anaid to the production of charts and maps was recognized by C&GS (Smith, 1979). In1930, the director of C&GS stated: "The Coast and Geodetic Survey is convincedthat it is time for the airplane to take its proper place and be officially recognized inthe Bureau's mapping program" (Smith, 1979). After that, photogrammetric methodswere consistently used in support of the coastal mapping program and also inproviding surveys of the coast for the establishment of marine boundaries. In 1971,
202
this capability was officially recognized and its use stipulated for the survey of thecoast (DOC Organization Order 25-5B, July 11, 1971). In areas where adequatetidal datums were available, photogrammetric methods were often used to developthe low water line.
Aerotriangulation. Ground control for traditional photogrammetric mappingrequired a network of photo-identifiable points on the ground for which values,referred to horizontal andvertical datums, hadbeen established. Aerotriangulation isa method of increasing the density of photo-control, relative to the specifiedhorizontal and vertical datums, for photogrammetric use. Aerotriangulation is definedas the process for the extension of horizontal and/or vertical control whereby themeasurement of angles and/or distances on overlapping aerial photographs arerelated into a spatial solution using the perspective principles of the photograph(American Society of Photogrammetry, 1980). Specifications for photogrammetricsurveys required that the network ofphoto-control be established relative to geodeticand tidal/water level datums established by the National Ocean Service (NOS). Forthe majority of projects, this requirement was met using a combination of fieldsurveying and aerotriangulation methods. The typical practice was to establish andpremark available reference control stations throughout the project area usingground survey methods and then establish the full complement of photo-control byaerotriangulation methods.
Aerial Photography. In coastal surveys, the spectral reflectancecharacteristics of water, land, and sea or lake bed were considered and used toadvantage. Different films are sensitive to particular ranges of the light spectrum.Infrared light, for example, is reflected by dry land and almost completely absorbedby water. For this reason, since about 1970, tide-coordinated black-and-white infrared photography has been used when distinct definition of the low and high waterlineshave been required. Light in the visible range will penetrate clear water, so low-altitude color photography has been used for feature investigations and photo-bathymetry.
Modem Era Shoreline Maps (1980 to present)
Since 1980, aerial photographs have been the sole source used forshoreline mapping. Final maps produced now provide the graphic representation ofdetail interpreted and extracted from the photographs. This method allows theadequate delineation of the shoreline, coastline structures, interior detail, and, whenapplicable, the low water line. Limiting factors, however, may affect the adequaterepresentation and portrayal of open-water features. Open-water features on thesemaps represent only photo-identifiable objects that can be located using photogrammetric disciplines.
Although graphic data from field surveys are not used for compiling thesemaps, field operations provide an important role insupport of photogrammetric mapping. Supporting field functions mayconsistof any or all of the following operations:recovering or establishing ground control, placing targets on control stations prior toaerial photography, observing tides in support of tide-coordinated photography, andconducting feature investigations that use field surveying techniques to supplementor verify photogrammetric data.
203
With Global Positioning System (GPS) technology, the task of establishingphoto-identifiable geodetic control points on the ground has become less labor- andtime-intensivethan in the past. Prior to the availability of GPS, flight lines and photographic coverage were often compromised to accommodate existing horizontalcontrol. With GPS receivers, geodetic control is placed wherever needed formaximum photographic coverage and mapping accuracy, including areas previouslyconsidered too remote for cost-effective ground survey.
RECENT DEVELOPMENTS
Analytical digital compilation has all but replaced conventional analog stereoplotter technology. In addition, photogrammetric operations are benefiting from newtechnology that includes photogrammetric surveys using kinematic GPS, a modemflight management system, and digital data.
Analytical Digital Compilation
Shoreline map compilation in C&GS has shifted from analog to analyticalmethods. The type of compilation can be identified by the registration prefix T, TPorDM. All registered maps compiled by analog methods have the prefix T or TP.These maps are stable-base copies of the original compilations. Registered mapswith the prefix DM are computer-generated using a validated digital data setresulting from analytical compilation. This type of compilation is performed with theaid of analytical stereoscopic measuring instruments that differ from the traditionalanalog instruments in several important aspects. In analog instruments, thephotographs are oriented to the same physical relationship thatexisted at the time ofexposure. While compiling the map, the operator continually adjusts the mechanicalprojection system, and images ofthe shoreline are traced at scale bya pantograph.In analytic instruments, manual adjustment is replaced by a computer with anelectro-servo interface. It continually adjusts the optical projection system by solvinga system of equations. The imagery appears in stereo at all times as the operatormoves the measuring mark throughout the stereo model. Instead of creating agraphic product, the computer displays and stores digital coordinates in the desiredgeodetic reference system. The shoreline map is created from the digital data, butthe digital data are independent of the specific map. Theycan be used for a varietyof final products.
Photogrammetric Surveys Using Kinematic GPS
During photogrammetric surveys using airborne kinematic GPS, theexposure station of the camera, as well as the targeted control, is positioned byGPS methods. Beginning in 1985, the National Oceanic and AtmosphericAdministration (NOAA) Charting Research and Development Laboratory (Lucas,1987) developed an aerotriangulation simulation model that suggested that positioning the aerial camera exposure station to an accuracy ofone meter would eliminatethe need for geodetic control for coastal mapping without compromising shorelineaccuracy (Lapine, 1991a). Subsequently, various practical tests have been conducted by NOAA to confirm these findings. Lapine (1990) demonstrated that ground
204
control points can be positioned from aerial photography toan accuracy offive centimeters from an altitude of 6,000 feet above the ground at a speed of 200 mph(1990). On Oct. 5, 1990, the Photogrammetry Branch conducted photogrammetricoperations over Albemarle Sound. N.C., which demonstrated the practical applicationofGPS-controlled photogrammetry. The photo mission was flown at 24,000 feet andat speeds reaching 345 mph. Differential phase observations from an onboard GPSreceiver significantly reduced the cost of shoreline mapping by eliminating the needfor densely spaced and signalized ground control points. An analysis of the subsequent aerotriangulation process showed virtually no difference between the solutionusing signalized point positions determined by GPS-controlled aerotriangulation andtrue (surveyed) values within 1.0 meter in horizontal and 2.1 meters in vertical(Lapine, 1991b). This technology is being used to map the Florida Keys NationalMarine Sanctuary, where conditions preclude the use of extensive ground controlledphotography.
Modem Flight Management System
A new flight management system within C&GS is based on very precisenear-real-time GPS pseudo-ranging, a CD-ROM digital map file, and modem electronic camera technology. It enables precise navigation of the aircraft over preplanned nearshore and offshore flight lines. This should bring greater efficiency toaerialphotograph operations and result in maintaining mapping accuracy ofoffshore areas.
Digital Data
The new generation analytical photogrammetric systems allow basemapping to be conducted in a totally digital environment. A benefit of this newtechnology is that a database of high-resolution seamless shorelinedata is collectedand can be used for multiple purposes by extracting a portion orall as needed. Anydigital data set includes information about the integrity ofthe data itcontains.
Recordkeeping and product retrieval are also advancing into the digitalarena. The geographic positions of approximately 380,000 aerial photographscontained in the C&GS Photogrammetry Branch's film library have been digitizedfrom photo indexes and correlated with supplemental information. These data are inthe correction and testing phase and will soon be available through interactivecomputer query. Direct additions to this database will be forwarded from the flightmanagement system on digital media.
A shoreline survey inventory database is currently being loaded with thecoordinates andsupplemental data relative to each registered shoreline map C&GShas produced to date. This will allow a quick categorical search of inventory viainteractive computer query. In addition to this, plans are being developed to convertthe historic registered maps to digital form. Each shoreline map will be scanned andthe data stored in both raster and vector form for comparison, retrieval, and plottingpurposes. Associated reports and records will be scanned and stored along with thedigital map data. Ultimately private and commercial users should be able to accessthese data directly via computer modem.
205
COOPERATIVE SHOREUNE MAPPING PROJECTS
There have been a number of cooperative projects in which C&GS hascontributed its shoreline surveying expertise. The latest was to obtain high-precisionbase mapping for the Florida Keys National Marine Sanctuary. It was sponsoredjointly by the National Ocean Service Office of Ocean Resources Conservation andAssessment and Office of Ocean and Coastal Resource Management; the NationalMarine Fisheries Service Southeast Fisheries Laboratory; the State of Florida'sDepartmentof Natural Resources; and Monroe County, Fla.
USES OF COASTAL SURVEY DATA
Coastal survey data not only serve as the database of shoreline andtopography used in NOS nautical chart production but also provide an accurategeographic framework for management purposes, many published data, andenvironmental studies. For example, the National Marine Fisheries Service usesshoreline survey data and aerial photographs to classify, inventory, and mapsubmerged aquatic vegetation. Elements of the NOAA Coastal Ocean Program usethese data to evaluate the effects of physical impacts to coastline regions and forestuarine habitat studies. Historical data resulting from these surveys are often usedin litigation to determine property ownership and to enforce regulatory mandates.Recently, a litigation settlement involving the states of Georgia and South Carolinaresulted in the establishment of the states' boundary by using historical NOS coastalsurvey data as the basis of its determination.
AVAILABILITY
Shoreline Maps
Final shoreline and photobathymetric maps are registeredand permanentlyarchived in the NOS vault. A registered map is a stable base copy of the originalmanuscript. This copy is registered instead of the original because of its superiordurability over time. Associated data, identified as descriptive reports or completionreports, are bound in a single volume and are also registered. They consist of allpertinent reports, records, and listings of production data associated with theshoreline survey and individual maps, beginning with register number T-979,archived in 1863. The shoreline maps are available to the public as stable base orbromide (paper) copies. Copies of the maps and reports may be obtained from theArchivesof the National Ocean Service by contacting Data ControlSection/NCG243,Nation Ocean Service, NOAA, Rockville, Md. 20852, (301) 443-8408.
Digital Shoreline Data
High-resolution seamless shoreline data will be maintained on file in vectorform by the Photogrammetry Branch. For updated information, contact the SupportSection, Photogrammetry Branch, (301) 443-8601.
206
Aerial Photographs
C&GS metric-quality photographs consist of natural-color, false-color, black-and-white (panchromatic), and black-and-white infrared photographs. The majority ofavailable photographs range in scales from 1:20,000 to 1:60,000. Copies of thesephotographs in nominal 23cm x 23cm (9* x 9") contact size are available as prints,and as film negatives or positives. Paper prints are also available as enlargementsranging through 4.44 times the contact size.
To obtain aerial photographs contact Support Section, PhotogrammetryBranch N/CG236, Coast and Geodetic Survey, NOS, NOAA, 6001 Executive Blvd.,Room 719, Rockville, Md. 20852, (301) 443-8601.
Cooperative Mapping Projects
To obtain information about possible cooperative base mapping projectscontact Photogrammetry Branch N/CG23x1; Coast and Geodetic Survey, NOS,NOAA, 6001 Executive Blvd., Rockville, Md. 20852, (301) 443-8006.
REFERENCES
American Society of Photogrammetry. 1980. Manual of Photogrammetry, Fourth Edition.Chester C. Slama, ed. Falls Church, Va. 1,056 p.
Ellis, Melvin Y., ed. 1978. Coastal Mapping Handbook. U.S. Government Printing Office.Washington, D.C.
Fromm, Gregory L. 1989. Shoreline Mapping, Chapter 5, Draft. Hydrographic Manual.
Lapine, Lewis A. 1990. Analytical Calibration of the Airborne Photogrammetric System Using aPrior Knowledge of the Exposure Station Obtainedfrom Kinematic Global Positioning SystemTechniques. Ohio State University, Columbus, Ohio.
Lapine, Lewis A. 1991. Kinematic positioning by GPS in support of aerotriangulation. TheHydrographic Journal (61):25-28.
Lapine, Lewis A. 1991. First national map production controlled by GPS aerotriangulation.Administrator's Weekly Report. Sept. 6,1991.
Lucas, James, R. 1987. Aerotriangulation without ground control. Photogrammetric Engineeringand Remote Sensing. 53:311-314.
Shalowitz, Aaron L. 1964. Shore and Sea Boundaries. Vol. 2. U.S. Government Printing Office,Washington, D.C.
Smith. John T. Jr. 1979. A History of Flying and Photography in the Photogrammetry Divisionof the NationalOcean Survey. U.S. Department of Commerce. Washington. D.C.
Swainson. O. W. 1928. Topographic Manual. Special Publication No. 144. U.S. GovernmentPrinting Office, Washington, D.C.
207
Yeager. Rear Adm. J. Austin, NOAA. W91. Annual Report Coast andGeodetic Survey, FiscalYear 1991. Washington, D.C.
208
HYDROGRAPHIC SURVEYS OF U.S. COASTAL WATERSKenneth W. Wellman
Coast and Geodetic Survey, NOAA
Introduction
Astatedgoal ofThe Coastal Society is to provide an opportunity and forumto promote the exchange of ideas, techniques and experience in the use and management of coastal resources. This paper is intended to provide informationpertaining totheavailability ofcopies ofNational Ocean Service (NOS) hydrographicsurveys and thus further the exchange and sharing of research and information.
It is important to notethat this paperaddresses hydrographic surveysas aproduct rather than hydrography, which is the professional surveying activity. Hydrography deals with the measurement and description of the physical features ofbodies of water and their littoral land areas. In hydrography, emphasis is usuallyplaced on the elements that affect safe navigation and on the publication of suchinformation in a suitable form for use in navigation. The resultant *... information in asuitable formfor use ..." is the hydrographic survey.
Hydrographic surveysare a principal source of information necessary to thecompilation of nautical charts. Perhaps the NOS hydrographic surveys will serve asan invaluable resource for applications in the coastal and marine environments.
Historical Perspective
In the early days of this republic, the conduct of commerce by means ofland transportation presented many difficulties. The difficulties ofland transport alongwith the need for foreign trade, predominantly dependent on coastal shipping,fostered reliance on safe maritime commerce. The responsibility for such safemaritime commerce was recognized as an inherently governmental responsibility. OnFeb. 10, 1807, this national obligation was formally recognized when Congress,acting on the recommendation of President Jefferson, adopted a resolution for a"Survey of the Coast." This resolution had its roots invarious reports, circa 1795-97,which recognized the lack of accurate coastal surveys and the need for accuratecharts of the "Atlantic coast of the United States, including the bays, sounds,harbors, and inlets thereof as have been made from actual observations andsurveys...."
In implementing the Act of 1807 scientists were invited to propose a planfor carrying out the monumental and precedent setting task of surveying. Respondents included Swiss geodeslst and scientist Ferdinand R. Hassler. Hassler's planwas accepted and he was selected to guide the early organization of the survey. Hisplan called for the division of the task into the three primary branches of geodetic,topographic and hydrographic operations.
The establishment of acceptable field procedures, training of surveyingpersonnel, provision for the preparation of charts and maps, and the design andacquisition of precise survey instruments, as well as the War of 1812, combined todelay survey work until 1816. The first field work, accomplished in 1816, consisted ofreconnaissance for the purpose of establishing two geodetic baselines; one in thevicinity of Englewood, N.J. and the second on Long Island, N.Y. However, due to
209
circumstances familiar to today's administrators, i.e., lack of adequate funding, it wasnecessary to suspend the fledgling surveying undertaking. In the early 1830sCongress revived the original act and survey efforts resumed. The first topographicand hydrographic surveys were completed in 1834 and covered the area of GreatSouth Bay, Long Island.
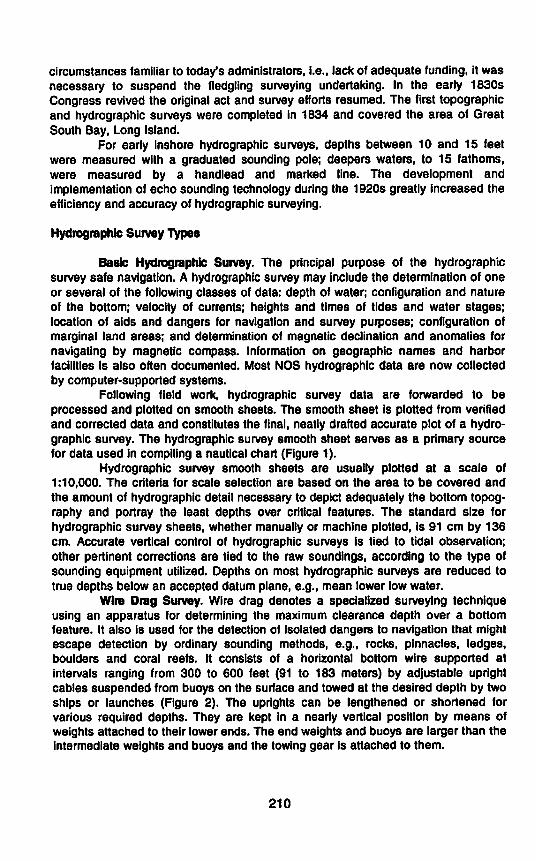
For early inshore hydrographic surveys, depths between 10 and 15 feetwere measured with a graduated sounding pole; deepers waters, to 15 fathoms,were measured by a handlead and marked line. The development andimplementation of echo sounding technology during the 1920s greatly increased theefficiency and accuracy of hydrographic surveying.
Hydrographic Survey Types
Basic Hydrographic Survey. The principal purpose of the hydrographicsurvey safe navigation. A hydrographic survey may include the determination of oneor several of the following classes of data: depth of water; configuration and natureof the bottom; velocity of currents; heights and times of tides and water stages;location of aids and dangers for navigation and survey purposes; configuration ofmarginal land areas; and determination of magnetic declination and anomalies fornavigating by magnetic compass. Information on geographic names and harborfacilities is also often documented. Most NOS hydrographic data are now collectedby computer-supported systems.
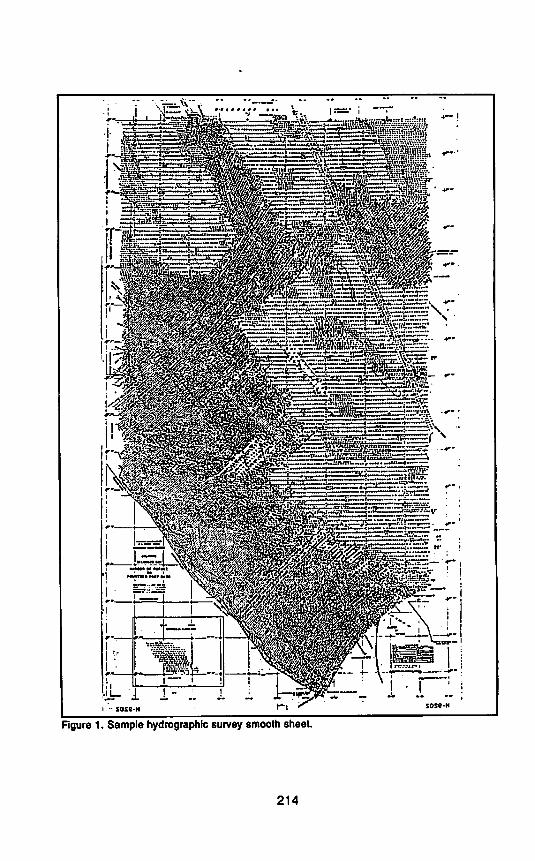
Following field work, hydrographic survey data are forwarded to beprocessed and plotted on smooth sheets. The smooth sheet is plotted from verifiedand corrected data and constitutes the final, neatly drafted accurate plot of a hydro-graphic survey. The hydrographic survey smooth sheet serves as a primary sourcefor data used in compiling a nautical chart (Figure 1).
Hydrographic survey smooth sheets are usually plotted at a scale of1:10,000. The criteria for scale selection are based on the area to be covered andthe amount of hydrographic detail necessary to depict adequately the bottom topography and portray the least depths over critical features. The standard size forhydrographic survey sheets, whether manually or machine plotted, is 91 cm by 136cm. Accurate vertical control of hydrographic surveys is tied to tidal observation;other pertinent corrections are tied to the raw soundings, according to the type ofsounding equipment utilized. Depths on most hydrographic surveys are reduced totrue depths below an accepted datum plane, e.g., mean lower low water.
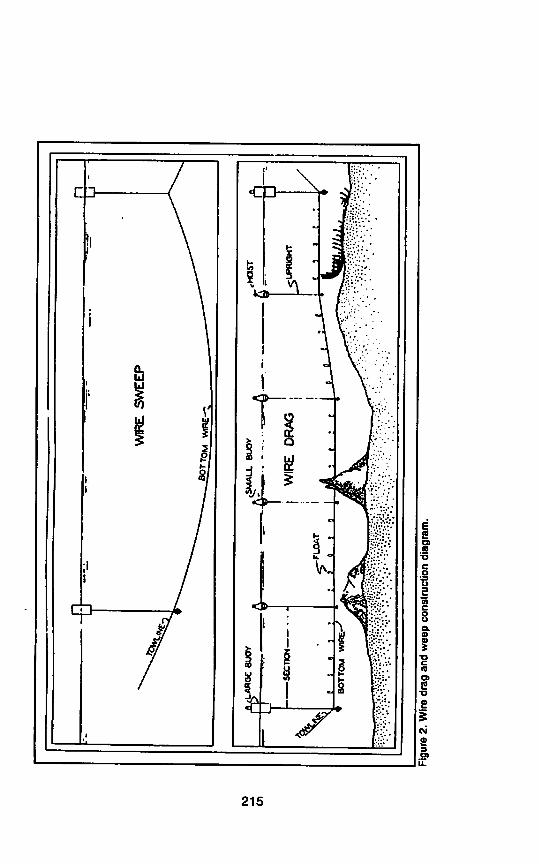
Wire Drag Survey. Wire drag denotes a specialized surveying techniqueusing an apparatus for determining the maximum clearance depth over a bottomfeature. It also is used for the detection of isolated dangers to navigation that mightescape detection by ordinary sounding methods, e.g., rocks, pinnacles, ledges,boulders and coral reefs. It consists of a horizontal bottom wire supported atintervals ranging from 300 to 600 feet (91 to 183 meters) by adjustable uprightcables suspended from buoys on the surface and towed at the desired depth by twoships or launches (Figure 2). The uprights can be lengthened or shortened forvarious required depths. They are kept in a nearly vertical position by means ofweights attached to their lower ends. The end weights and buoys are larger than theintermediate weights and buoys and the towing gear is attached to them.
210
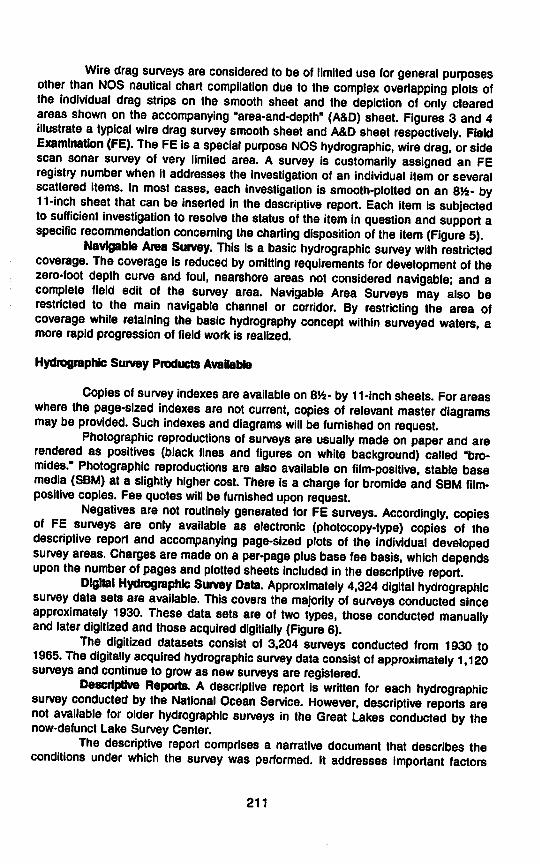
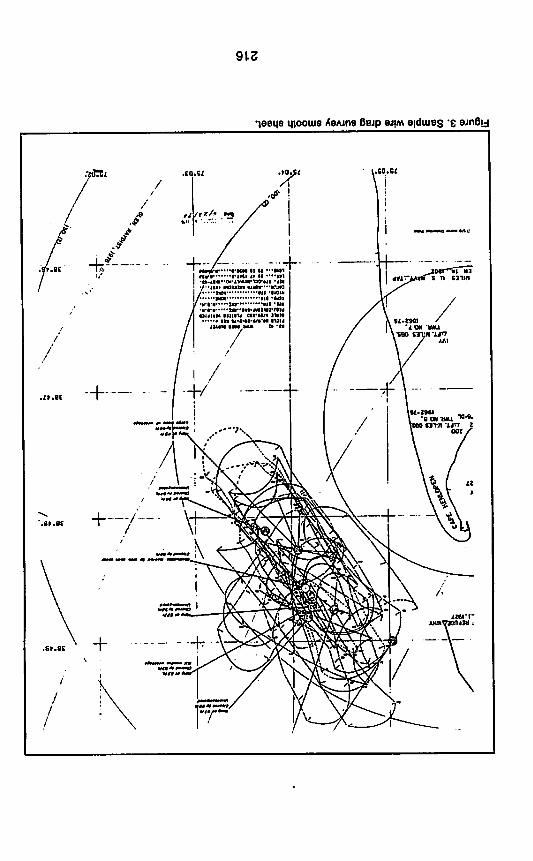
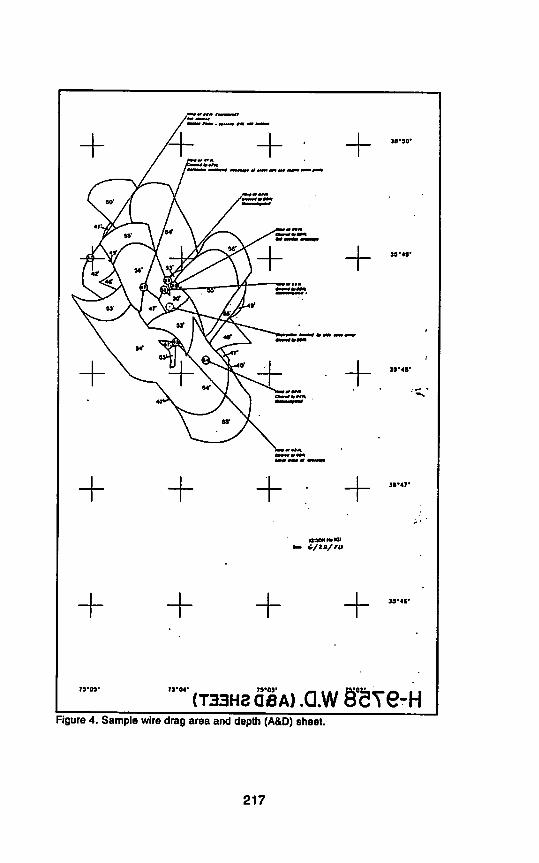
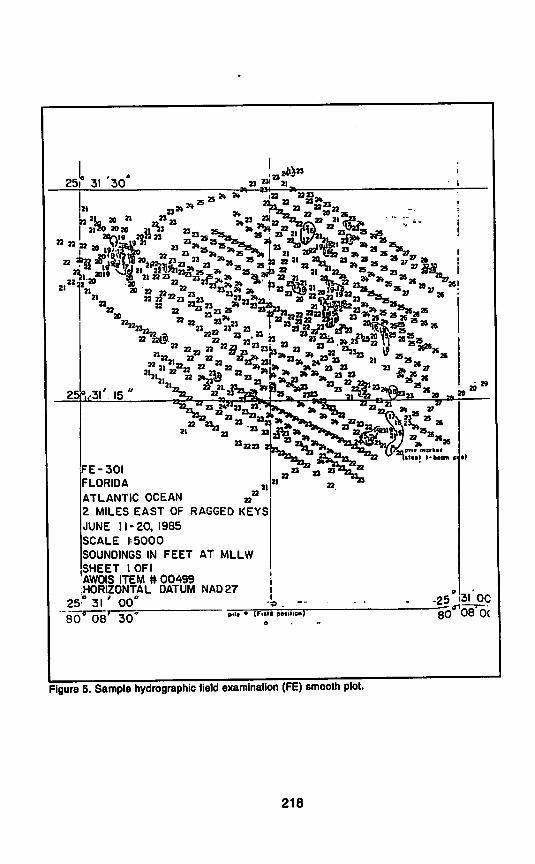
Wire drag surveys are considered to be oflimited use for general purposesother than NOS nautical chart compilation due to the complex overlapping plots ofthe individual drag strips on the smooth sheet and the depiction of only clearedareas shown on the accompanying "area-and-depth" (A&D) sheet. Figures 3 and 4illustrate a typical wire drag survey smooth sheet and A&D sheet respectively. FieldExamination (FE). The FE isa special purpose NOS hydrographic, wire drag, orsidescan sonar survey of very limited area. A survey is customarily assigned an FEregistry numberwhen it addresses the investigation of an individual item or severalscattered items. In most cases, each investigation is smooth-plotted on an 8)4- by11-inch sheet that can be inserted in the descriptive report. Each item is subjectedtosufficient investigation to resolve the status of the item in question and support aspecific recommendation concerning the charting disposition of the item (Figure 5).
Navigable Area Survey. This is a basic hydrographic survey with restrictedcoverage. Thecoverage is reduced by omitting requirements for development ofthezero-foot depth curve and foul, nearshore areas not considered navigable; and acomplete field edit of the survey area. Navigable Area Surveys may also berestricted to the main navigable channel or corridor. By restricting the area ofcoverage while retaining the basic hydrography concept within surveyed waters, amore rapid progression of field work is realized.
Hydrographic Survey Products Available
Copies ofsurvey indexes areavailable on8J4- by 11-inch sheets. For areaswhere the page-sized indexes are not current, copies of relevant master diagramsmay be provided. Such indexes and diagrams will be furnished on request.
Photographic reproductions of surveys are usually made on paperand arerendered as positives (black lines and figures on white background) called "bromides." Photographic reproductions are also available on film-positive, stable basemedia (SBM) at a slightly higher cost. There is a charge for bromide and SBM film-positive copies. Fee quotes will be furnished upon request.
Negatives are not routinely generated for FE surveys. Accordingly, copiesof FE surveys are only available as electronic (photocopy-type) copies of thedescriptive report and accompanying page-sized plots of the individual developedsurvey areas. Charges are made on a per-page plus basefee basis, which dependsupon the number of pages and plotted sheets included in the descriptive report.
Digital Hydrographic Survey Data. Approximately 4,324 digital hydrographicsurvey data sets are available. This covers the majority ofsurveys conducted sinceapproximately 1930. These data sets are of two types, those conducted manuallyand later digitized and thoseacquired digitially (Figure 6).
The digitized datasets consist of 3,204 surveys conducted from 1930 to1965. The digitally acquired hydrographic survey data consist of approximately 1,120surveys and continue to grow as new surveys are registered.
Descriptive Reports. Adescriptive report is written for each hydrographicsurvey conducted by the National Ocean Service. However, descriptive reports arenot available for older hydrographic surveys in the Great Lakes conducted by thenow-defunct Lake Survey Center.
The descriptive report comprises a narrative document that describes theconditions under which the survey was performed. It addresses important factors
211
affecting the adequacy and accuracy of the survey to facilitate survey processingand provide additional information for consideration during the compilation of thenautical chart. In most cases, a copy of the hydrographic survey smooth sheet willbe sufficient to meet the needs of the general user public, obviating the additionalexpense associated with obtaining a copy of the descriptive report. Nevertheless,copies of descriptive reports are available subject to a charge based on a per-pageplus base fee basis. The cost varies depending on the total number of pagesincluded in the descriptive report.
Automated Wreck and Obstruction Information System (AWOIS). TheAutomated Wreck and Obstruction Information System (AWOIS) is a personalcomputer database, using dBASE III Plus software. The AWOIS, developed by theCoast and Geodetic Survey, Nautical Charting Division, Hydrographic SurveysBranch, contains over 8,800 records on wrecks and obstructions reported in U.S.coastal waters. The database was designed primarily as an automated research toolto assist the Coast and Geodetic hydrographic survey program. It also has beenuseful to marine archaeologists and historians, fisherman, divers, salvage operatorsand other users in the marine environment.
Each record in the database has a repetitive format that has information onvessel name, position (latitude/longitude), positional accuracy, survey status, large-scale chart number, project number, survey requirements, history, and description.
Submission of Requests for Products
Requests for photographically reproduced copies of hydrographic surveys,topographic surveys, and photocopy-type copies of descriptive reports are processedupon receipt of payment. The request should be addressed to NOAA, NationalOcean Service, HSB, Data Control Section, N/CG243, WSC1, Room 404, 6001Executive Blvd., Rockville, MD 20852. Make checks payable to U.S. Department ofCommerce, NOAA, N/CG243.
The AWOIS data base is maintained by the Hydrographic Surveys Branch,Operations Section, N/CG241. AWOIS computer listings and digital data on disketteare available to anyone for a fee. For further information about AWOIS, pleasecontact Mark J. Friese, National Ocean Service, Hydrographic Surveys Branch(N/CG241), 6001 Executive Boulevard, Rockville, Md. 20852, (301) 443-8752.
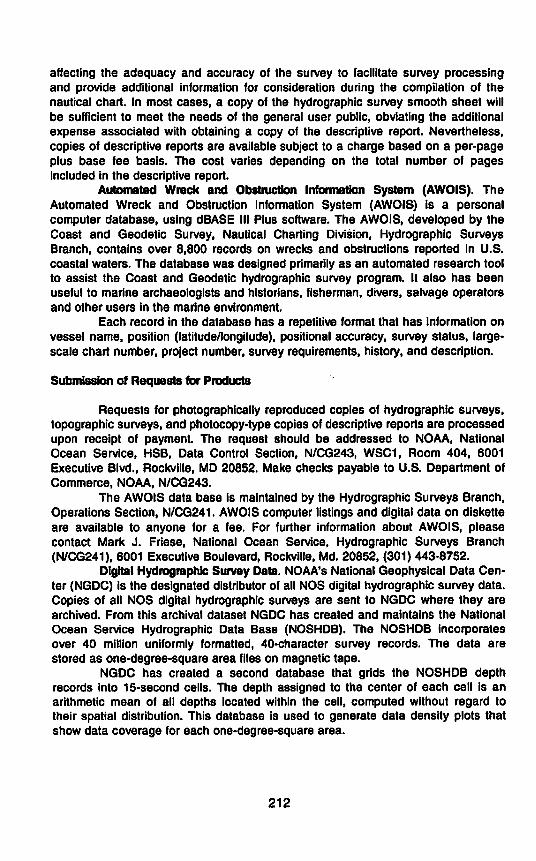
Digital Hydrographic Survey Data. NOAA's National Geophysical Data Center (NGDC) is the designated distributor of all NOS digital hydrographic survey data.Copies of all NOS digital hydrographic surveys are sent to NGDC where they arearchived. From this archival dataset NGDC has created and maintains the National
Ocean Service Hydrographic Data Base (NOSHDB). The NOSHDB incorporatesover 40 million uniformly formatted, 40-character survey records. The data arestored as one-degree-square area files on magnetic tape.
NGDC has created a second database that grids the NOSHDB depthrecords into 15-second cells. The depth assigned to the center of each cell is anarithmetic mean of all depths located within the cell, computed without regard totheir spatial distribution. This database is used to generate data density plots thatshow data coverage for each one-degree-square area.
212
All inquiries regarding NOS digital hydrographic survey data should bedirected to National Geophysical Data Center, NOAA, NESDIS, E/GC3 325Broadway, Boulder, Colo. 80303-3328, (303) 497-6338.
Conclusion
Requests for copies of hydrographic surveys, field examination surveys,topographic surveys, and descriptive reports have been received from private sectorconsultants, attorneys, surveyors, various federal, state and local governmentagencies, universities and various private individuals. Perhaps some of theseproductswill prove useful foryour particular research endeavors.
References
Adams. K.T. 1942. Hydrographic Manual. Special Publication No. 143, Revised (1942) EditionCoast and Geodetic Survey, U.S. Government Printing Office, Washington, D.C.
Shalowitz, Aaron L. 1964. Shore and Sea Boundaries. U.S. Department of Commerce, Coastand Geodetic Survey, U.S. Government Printing Office, Washington. D.C.
Ulm, Kenneth S.1959. Wire Drag Manual. Publication 20-1, Coast and Geodetic Survey USGovernment Printing Office, Washington, D.C.
213
' SOH-Hsose-M
Figure 1. Sample hydrographic survey smooth sheet.
214
ro—A
Ol
L
LABOCBUOY JUi-
—&SECTION
Figure2.Wiredragandweepconstructiondiagram.
(SMALLBUOV raiwu-Louor
f-~i :WIREDRAG
<KXT
•$-4-UPRIGHT
IFigure 3. Sample wire drag survey smooth sheet.
216
/mm#Mt.mmmmn
+M'50*
\ w«**l<*
\ / \ /^^
\ vr
V" SV jM /
8*' \T\/ \^
r^L ••"{— —1— Mwr
CMM*«M
+ +
anoNMHi
+ + __1_ _l_ «•«•
79'OS*
'"°" (T33H8 aeA) .Q.W 8'STe-HFigure 4. Sample wire drag area and depth (A&D) sheet.
217
25i 31 30
"XI
,3V 15'V*=*$> aa»iv V»%, *****'I,, 22 a Jin «Tw8 'vi "a ^'swnL 8xA ^;»g^
X
FE-301
FLORIDA
ATLANTIC OCEAN „2 MILES EAST OF RAGGED KEYS
JUNE 11-20, I9B5
SCALE h5000
SOUNDINGS IN FEET AT MLLW
SHEET 10F1AWOIS ITEM # 00499:HORIZONTAL DATUM NAD27 j
25° 31 ' 00"80° 08' 30"
»ii« • (Fitio eotiiton)
Figure 5. Sample hydrographic field examination (FE) smooth plot.
218
^•priv morkarlllMI I-Mom V •)
,25 31 PCSOLOS'0~C
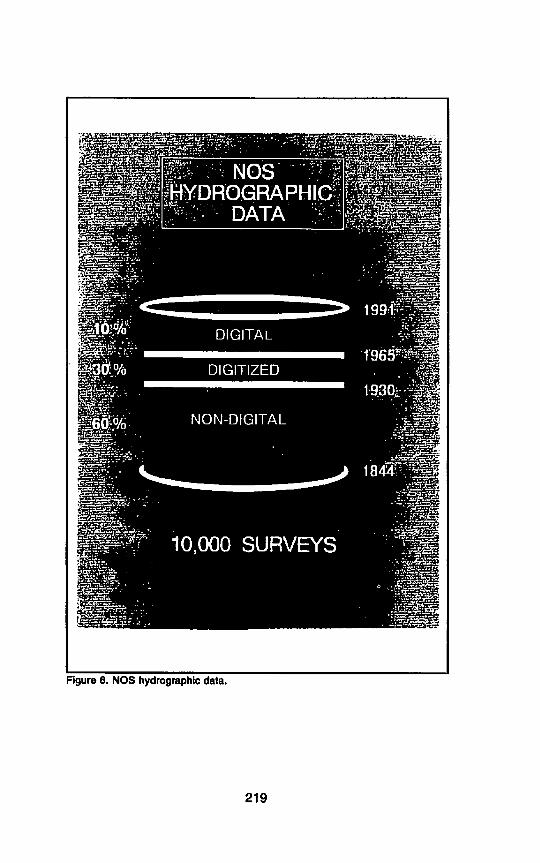
Figure 6. NOS hydrographic data.
219
NOAA'S PROGRAM TO MAPTHE U.S. EXCLUSIVE ECONOMIC ZONE
AND THE AVAILABILITY OF RESULTING BATHYMETRIC DATAPaul J. Grim
Coast and Geodetic Survey, NOAA
Abstract
In response to a 1983 presidential proclamation, NOAA's Coast andGeodetic Survey began surveying with multibeam sounding techniques the U.S.Exclusive Economic Zone, extending seaward for 200 nautical miles from thecoastline. The resulting maps and data are needed in this largely unexplored areafor the conservation and management of living and non-living resources as well asfor various types of planning. To date, 71 bathymetric maps have been made, eachhaving a scale of 1:100,000 and generally measuring 1° in longitude by 0.5° inlatitude. The basic data are in a digital format. These include full-resolution data (allsoundings collected which typically number 5-10 million permap area) andtwo typesof grids derived from these full-resolution data. NOAA is making all maps and digitaldata availableto the public. Gridded data for a single map area are disseminated ondiskette in ASCII format for use on PC desktop computers. Full-resolution data aredisseminated on magnetic tape.
Introduction
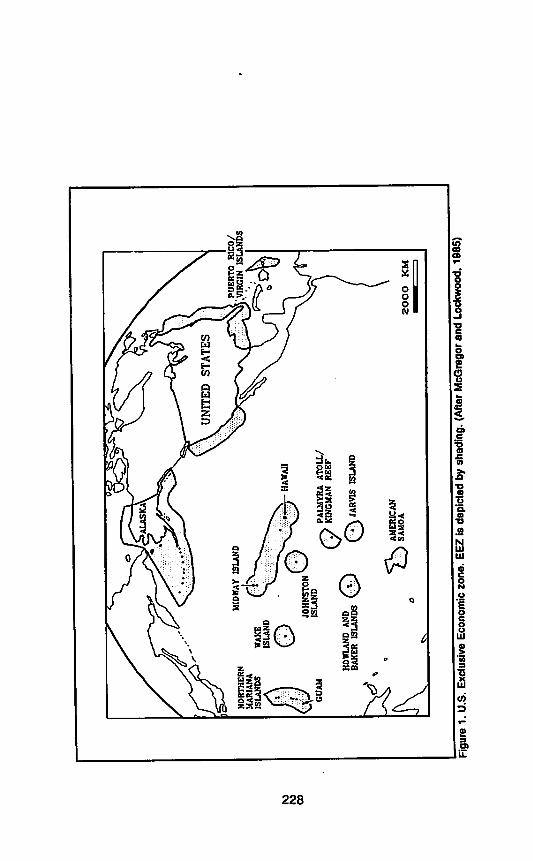
In March 1983, President Reagan signed a proclamation establishing theU.S. Exclusive Economic Zone (EEZ). This zone (Figure 1)extendsseaward for 200nautical miles from the coastline of the United States, its overseas territories andpossessions, and the commonwealths of Puerto Rico and the Northern MarianaIslands. As a result of this proclamation, the United States has sovereign rights, inaccordance with the rules ofinternational law, over all living and non-living resourcesin the EEZ. The area of the EEZ is about 1.7 timesgreater than the combined areasof the above-mentioned land masses. Although the undersea topography andmineral resources ofonly small parts of this enormous area have been surveyed andare relatively well known, systematic mapping of the EEZ, until recently, has notbeen done. Such surveys of the seafloor, through the resulting maps and digitaldata, are expected to yield vast amounts of information that can be used fordiversepurposes, including interpretation of geologic features, planning of scientific andenvironmental studies, wise management of living and non-living resources, andeducation of students at many levels of study.
This paper describes NOAA's EEZ program and the nature of the resultingdata, as well as formats, products, and the availability ofboth maps and digital data.Numerous publications give technical details on the multibeam systems used byNOAA (Farr, 1980; Renard and Allenou. 1979). A description of how NOAAmanages and processes the data, as well as details of how soundings are used toproduce maps, is given by Herlihy et al. (1988). Abibliography concerning the policyand science of EEZ mapping has been prepared by NOAA (1989). This bibliographyincludes numerous references to the complementary GLORIA sidescan datacollected by the U.S. Geological Survey in the EEZ. Also, see papers given in the
221
recent EEZ Symposium held in Portland, Ore. (Mills and Perry, 1991; Matula, 1991;Grim, 1991).
Because of the wealth of bathymetric detail revealed by NOAA's EEZ multi-beam program, the dissemination of data was stringently controlled by the U.S. Navyprior to the spring of 1989. At that time the Navy removed all restrictions on datadissemination with the exception of two areas: the EEZ in the Pacific, north of 46°N(essentially the entire EEZ off the coast of Washington); and the Atlantic EEZextending from Cape Romain, S.C. to Fort Pierce, Fla. The data collected in thesetwo areas from NOAA's EEZ multibeam program (but not from university multibeamresearch cruises) remain classified.
Thus, it has only been about three years that these data have beenadvertised and disseminated to the general public. Because of this small time period,the nature and availability of these multibeam data remain unknown to manypotential data users.
One measure of the usefulness of the data is shown by scientificpublications using the data to interpret geologic features on the seafloor (Greene etal. 1989; Jackson et al., 1990; Bryant et al., 1991).
Map Areas in Depths Less than 150 M.
It is important to understand, especially when NOAA EEZ maps are used incoastal areas, that the sounding data used in making maps in depths less than 150m have not been collected by the highly accurate multibeam techniques described inthis paper. Instead, these shallow soundings have been obtained from single-beamhydrographic surveys, some of which were made as long ago as the early 1930s.Sounding data from such hydrographic surveys are not as dense or as accurate (inpositioning or depth) as soundings obtained by the adjacent multibeam surveys,which are generally conducted in water deeper than 150 m.
Status of Map Production
Every year since 1984, NOAA has conducted EEZ mapping operations withmultibeam techniques. Five vessels have been involved in data collection. Off theEast Coast and in the Gulf of Mexico, the work has been carried out by NOAA shipsMt. Mitchell and Whiting. Surveying along the West Coast, and in Hawaiian andAlaskan waters has been conducted by NOAA ships Davidson, Surveyor andDiscoverer. Seventy-one 1:100,000 EEZ maps are available in either a published,multicolored format or as black-and-white copies of preliminary maps. The numericalbreakdown according to geographic region, to date, is as follows: Central andNorthern California (13), Oregon (16), Alaska (4), Hawaii (7), East Coast (2), Gulf ofMexico (29). The exact locations of these maps are shown in a series of index maps(periodically updated) provided free to the public at the address given below.
General Characteristics of EEZ Soundings
Much interest has been expressed about the full-resolution multibeam data,which are collected as follows. A multibeam ship collects data from a swath ofsoundings along the sea floor. This swath is normal to the ship's heading. Typically
222
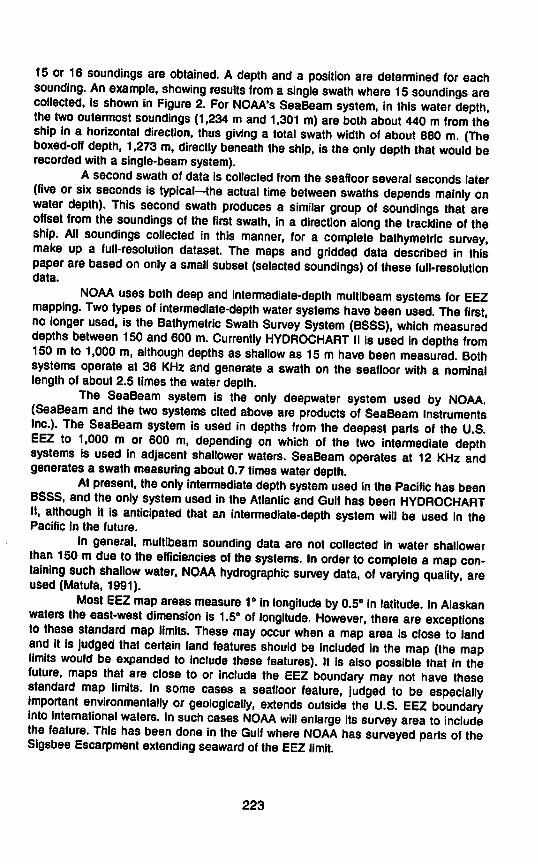
15 or 16 soundings are obtained. Adepth and a position are determined for eachsounding. An example, showing results from a single swath where 15 soundings arecollected, is shown in Figure 2. For NOAA's SeaBeam system, in this water depth,the two outermost soundings (1,234 m and 1,301 m) are both about 440 m from theship in a horizontal direction, thus giving a total swath width of about 880 m. (Theboxed-off depth, 1,273 m, directly beneath the ship, is the only depth that would berecorded with a single-beam system).
A second swath of data is collected from the seafloor several seconds later(five or six seconds is typical—the actual time between swaths depends mainly onwater depth). This second swath produces a similar group of soundings that areoffset from the soundings of the first swath, in a direction along the trackline of theship. All soundings collected in this manner, for a complete bathymetric survey,make up a full-resolution dataset. The maps and gridded data described in thispaperare based on only a small subset (selected soundings) of these full-resolutiondata.
NOAA uses both deep and intermediate-depth multibeam systems for EEZmapping. Two types of intermediate-depth water systems have been used. The first,no longer used, is the Bathymetric Swath Survey System (BSSS), which measureddepths between 150 and 600 m. Currently HYDROCHART II is used in depths from150 m to 1,000 m, although depths as shallow as 15 m have been measured. Bothsystems operate at 36 KHz and generate a swath on the seafloor with a nominallength of about 2.5 times the water depth.
The SeaBeam system is the only deepwater system used by NOAA.(SeaBeam and the two systems cited above are products of SeaBeam InstrumentsInc.). The SeaBeam system is used in depths from the deepest parts of the U.S.EEZ to 1,000 m or 600 m, depending on which of the two intermediate depthsystems is used in adjacent shallower waters. SeaBeam operates at 12 KHz andgenerates a swath measuring about 0.7times water depth.
At present, the only intermediate depthsystem used in the Pacific has beenBSSS. and the only system used in the Atlantic and Gulf has been HYDROCHARTII, although it is anticipated that an intermediate-depth system will be used in thePacific in the future.
In general, multibeam sounding data are not collected in water shallowerthan 150 mdue to the efficiencies of the systems. In order to complete a map containing such shallow water, NOAA hydrographic survey data, ofvarying quality, areused (Matula, 1991).
Most EEZ map areas measure 1"in longitude by 0.5" in latitude. In Alaskanwaters the east-west dimension is 1.5° of longitude. However, there are exceptionsto these standard map limits. These may occur when a map area is close to landand it is judged that certain land features should be included in the map (the maplimits would be expanded to include these features). It is also possible that in thefuture, maps that are close to or include the EEZ boundary may not have thesestandard map limits. In some cases a seafloor feature, judged to be especiallyimportant environmentally or geologically, extends outside the U.S. EEZ boundaryinto international waters. In such cases NOAA will enlarge its survey area to includethe feature. This has been done in the Gulf where NOAA has surveyed parts of theSigsbee Escarpmentextending seaward of the EEZ limit.
223
The coverage of the seafloor using multibeam systems is 100 percent. Theprevalent trend of the topography is known before a survey starts and ship tracklines(mainscheme lines) usually run parallel or subparallel to this trend. Swaths fromadjacent, parallel mainscheme lines overlap by 10 percent or more. Crosslines,which generate about 5 percent of the total data collected, are run normal to themainscheme lines and are used to verify soundings collected on the mainschemelines.
Sound velocity profiles are developed from conductivity, temperature anddepth (CTD) data collected prior to surveying. These results are used to applyvelocity corrections to the raw sounding data. Daily expendable bathythermograph(XBT) data are used to see if significant temperature changes have occurred in thewater column. If so, new CTD data are collected and used to derive a new soundvelocity profile, which is applied to the sounding data.
Positions have been determined by satellite systems (e.g., STARFIX ofJohn Chance Inc. and differential GPS) and shore-based systems, such as ARGOand RAYDIST. LORAN-C positioning is not used because of its limited accuracy(about 0.25 nautical miles or 463 m). All surveys are based on the 1983 NorthAmerican Datum (NAD83).
The accuracy of the depths and positions are judged to be well within theInternational HydrographicOrganization (IHO) standards of: (1) one percent of actualdepth (we believe that in most cases our depths are better than 0.5 percent of truedepth); and (2) within 50 m (based on the scale of our 1:100,000 scale maps) of trueposition.
Preliminary and Published Maps
NOAA disseminates both printed (i.e., published) maps and preliminarymaps (black-and-white photocopies of maps not yet published). Both show identicalbathymetric contours except for shallow areas (less than 150 m) where, in general,there are no contours on the preliminary maps. The purpose of disseminatingpreliminary maps is to make the data available to the public before the map ispublished. Once a map is published, the preliminary map is no longer used.
The 250-m grids and resulting contours for both types of maps are madeusing commercial software (Radian Corporation's CPS-1 contouring program)running on a DEC minicomputer. CPS-1 is also used to create the physiographicplots described below.
Both types of maps have the following characteristics: the scale is1:100,000; contours are in corrected meters; the contour interval is 20 m; theprojection is Universal Transverse Mercator; and LORAN-C lines (rates) are shown.
The published maps differ from the preliminary maps as follows: the preliminary maps generally do not show contours in water depths less than 150 m, andpublished maps may also omit contours in such shallow depths when future mapsare published if the hydrographic data, from which these shallow contours arederived, are judged inadequate; the published maps show, where available, labeledlease block outlines provided by the Minerals Management Service; the publishedshowing depth ranges; the published maps include at least one relatively smallthree-dimensional view of the whole map area (this 3D view is derived from thesame 250-m grid (described below) used to generate the map contours); the
224
published maps label both established names of seafloor features and in manycases new names proposed by NOS or others for relatively large and distinctivefeatures (i.e., features newly discovered or precisely defined for the first time as aresult of NOAA's EEZ multibeam surveying. All names shown on the publishedmaps have been approved by the U.S. Board on Geographic Names).
Physiographic Maps
A new product is a multicolored physiographic map consisting of a three-dimensional fishnet plot overlain by a generalized contour map with major seafloorfeatures labeled. This type of map will commonly be made by combining the 250-mgrids of six adjacent maps (e.g., 2 across and 3 down giving dimensions of 2° oflongitude by 1.5° of latitude) into one large grid. To date, NOAA has published twoof these physiographic maps: one in the Gulf of Mexico and one off centralCalifornia. A third, off northern Oregon, is currently in preparation.
Gridded Data
Gridded data for a map area are produced from a small subset of the full-resolution data. Typically, the number of full-resolution soundings for a map area isabout 5 million to 10 million (the actual number being a function of water depth). Thesubset used for gridding purposes is generallyabout 350,000 to 400,000 soundingswith each sounding having an associated latitude and longitude. The subset(generally referenced as "selected soundings") are randomly or almost randomlydistributed over the map area. These are used to produce a 250-m grid usuallyhaving 80,000 to 100,000 grid points. A typical grid might have 400 columns and230 rows. This grid is linked to the UTM map projection with coordinates of all X andY UTM grid points being evenly divisible by 250.
This 250-m UTM grid is used to automatically produce the contours shownon the preliminary and published maps. This grid is also used to produce a geographic grid with a grid spacing of 15' in both latitude and longitude directions. Thegeographic grid consists of 241 columns and 121 rows for the standard map area. Itis moreconveniently manipulated by microcomputers since the numberof grid points(29,161) is about one-third the numberof points in the 250-m grid. For example, weare able to fit an entire geographic grid into SURFER software (Golden SoftwareInc.), but the 250-m grid for a complete map is too large for SURFER.
Gridded data are disseminated for a single map area on a diskette, eachcontaining both the 250-m grid and the geographic grid and a parameter file foreach. The parameter files give information needed to interpret the grid files. In addition a READ.ME file is included. All five files are provided in ASCII format. Nosoftware is provided.
Full-Resolution Data
The full-resolution data for a single map area typically total about 5 to 10million soundings. The actual number is determined mainly from the water depth, butalso from the latitude of the map, the average speed of the ship, and several otherfactors.
225
These soundings, each of which is defined by a latitude, longitude anddepth value, are important because they contain seafloor details, especially inrelatively shallow water, that may not be contained in the 250-m grid used formaking our maps (as already mentioned, the 250-m grid is derived from only afraction of the full-resolution data).
Full-resolution data include sounding data judged to meet IHO standards fordepth and position. This means that some of the collected data have been rejectedbecause they have been deemed artifacts of the data collection process (deMoustier, 1986) or data collected during a tight turn of the ship. Typically theserejected data amount to no more than one to two percent or less of the total datacollected. They are saved in a "cull" file. A number of corrections are applied to thefull-resolution data in order to make them as accurate as possible. Several of theseare corrections for the velocity of sound in seawater (including refraction of non-vertical beams), the depth of the transducer (draft correction), tidal corrections (forthe intermediate depth multibeam systems only), and a correction for the offset ofthe transducers from the positioning antenna. All corrections applied are listed in anASCII header file and provided on diskette.
The format of the full-resolution data (NOAA refers to this format as theSBO format) is the same as the University of Rhode Island (URI) format. The dataare written in a binary format on a DEC minicomputer running under VMS. The dataare not in ASCII format.
Data Dissemination
NOAA's EEZ maps are made available to the public from the NationalOcean Service (NOS) in the Washington, D.C, area. Preliminary maps (black-and-white photocopies of maps prior to publication) are available from the NOS OceanMapping Section in Rockville, Md. Printed (published) maps are available from theNOS Distribution Division in Riverdale, Md. All maps (preliminary and published) aresent in mailing tubes. Folded maps are not available.
Gridded data on diskette and full-resolution data on magnetic tape areavailable from NOAA's National Geophysical Data Center in Boulder, Colo.
Additional Information
Additional information on NOAA's program to map the U.S. EEZ, plus mapindexes that show locations of maps and how to order them, may be obtained fromthe Ocean Mapping Section, Code N/CG224, NOAA/NOS, Rockville, Md. 20852,(301)443-8251.
Digital data may be ordered from the National Geophysical DataCenter/NOAA, Code E/GC3, 325 Broadway, Boulder, Colo. 80303, (303) 497-6338.
The use of commercial names and products in this paper does notconstitute endorsement of the names or products by NOAA or any other part of theU.S. government.
226
References
Bryant W.R., G.R. Simmons and P.J. Grim. 1991. The Morphology and Evolution ofBasins onthe Continental Slope Northwest Gulf of Mexico. Transactions, Gulf Coast Association ofGeological Societies, Vol. XL.
de Moustier, C, and M.C. Kleinrock. 1986. Bathymetric artifacts in SeaBeam data: How torecognize them and what causes them. Journal ofGeophysical Research 91 (B3):3407-3424.
Farr. H.K. 1980. Multibeam bathymetric sonar SEABEAM and HYDRO CHART. MarineGeodesy 4(2).
Greene, H.G., W.L. Stubblefield and A.E. Theberge Jr. Geology of the Monterey SubmarineCanyon system and adjacent areas, offshore central California. U.S. Geological Survey OpenFileReport No. 89-221. Menlo Park,Calif.
Grim. P.J. 1990. Results of Multibeam Swath Surveying by NOAA in the Gulf of MexicoExclusive Economic Zone. Transactions. Gulf Coast Association of Geological Societies, Vol
Grim. P.J. 1991. Dissemination of NOAA/NOS EEZ multibeam bathymetric data. WorkingTogether in the Pacific EEZ. Implementation of the National Ten-Year Plan for Mapping andResearch inthe Exclusive Economic Zone. Portland, Ore.
Herlihy, D.R., S.P. Matula and C. Andreasen. 1988. Swath mapping data management withinthe National Oceanic and Atmospheric Administration. International Hydrographic Review65(2). Monaco.
Jackson, M.P.A.. R.R. Cornelius, C.H. Craig, A. Gansser, J. Stocklin and C.J. Talbot. 1990.Salt diapirs of the Great Kavir. Central Iran. Geological Society of America. Memoir 177Boulder, Colo.
Matula, S.P. 1991. Bridging the gap: Creating nearshore bathymetric maps from multibeamswath sonar systems and conventional data. Working Together in the Pacific EEZ.Implementation of the National Ten-Year Plan for Mapping and Research in the ExclusiveEconomic Zone. Portland, Ore.
McGregor. B.A., and M. Lockwood. 1985. Mappng and Research in the Exclusive EconomicZone. USGS / Dept. Interior andNOAA / Dept. Commerce.
Mills. G.. and R. Perry. 1991. NOAA's multibeam bathymetric surveys and products off Hawaiiand the Northeast Pacific Margin. Working Together in the Pacific EEZ. Implementation oftheNational Ten-Year Plan for Mapping and Research in the Exclusive Economic Zone. PortlandOre.
NOAA. 1989. Policy and Science of Exclusive Economic Zone Mapping: ABibliography USDept. Commerce. NOAA. NESDIS. National Oceanographic Data Center. Washington. D.C.
Renard. V.. and J.P. Allenou. 1979. SeaBeam multi-beam echo-sounding in -Jean Charcot":Description, evaluation and first results. International Hydrographic Review 56^). Monaco.
227
rooo
PUERTORICO/VIRGINISLANDS
Figure1.U.S.ExclusiveEconomiczone.EEZisdepictedbyshading.(AfterMcGregorandLockwood.1985)
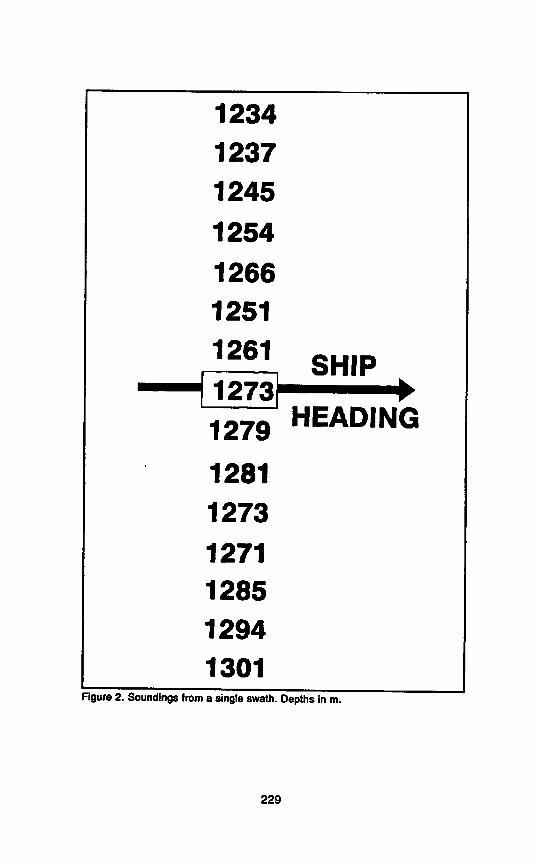
Figure 2. Soundings from a singleswath.Depths in m
229