Embed Size (px)
Citation preview

1 POVERTY REDUCTION AND ECONOMIC MANAGEMENT (PREM) NETWORK www.worldbank.org/economicpremise
NOVEMBER 2012 • Number 96
JUN 010 • Numbe 18
Economic Premise
POVERTYREDUCTION
AND ECONOMICMANAGEMENT
NETWORK (PREM)
THE WORLD BANK
Service with a Smile Ejaz Ghani, Arti Grover Goswami, and Homi Kharas
Fundamentals
For more than 200 years, it was argued that economic devel-opment and growth were associated with growth of the man-ufacturing sector (Baumol 1967; Kaldor 1966). Services were considered as menial, low skilled, and not very innovative (McCredie and Bubner 2010). But today, services can be among the most dynamic sectors. The range of services that can be digitized and traded globally is exploding—processing insurance claims; call centers; desktop publishing; compiling audits; completing tax returns; transcribing medical records; providing online education; and many more. Labor market matching is increasingly conducted online, and platforms like Odesk can connect employers and employees electronically across national boundaries. The old idea of services being nontransportable, nontradable, and nonscalable no longer holds. Services can be unbundled and splintered in a value chain just like goods, and exported at low cost (Bhagwati 1984).
But can developing countries benefit from the services revolution? Figure 1 compares the contribution of services
Can service be a growth escalator? The world is experiencing its third industrial revolution, and services are at the forefront of this revolution. Services have already surpassed industry as a source of economic growth and job creation, in both developed and developing economies. In the industrial sector, technologies have matured and employment is shrink-ing. However, services are getting more sophisticated and jobs are expanding. Services growth is also more inclusive and sustainable. It increases the participation of women in the labor force and places a lighter burden on natural resources. The promise of the services revolution is that countries do not need to wait to get started with rapid development. There is a new boat that development latecomers can take.
and industry to gross domestic product (GDP) growth in the last 30 years for developed and developing countries. In both cases, the contribution of services to total growth is higher than industry’s contribution. In developing countries, servic-es (and industry) contributed more to growth than in devel-oped countries. The average growth of services exports from developing countries has exceeded that of developed coun-tries (Ghani 2010). Their services exports are growing faster than goods exports. In brief, the globalization of services has enabled developing countries to tap into a new, dynamic source of growth.
What about jobs? Although the conventional wisdom is that the manufacturing sector creates more jobs, recent data suggest otherwise. Employment growth has been most rapid in the services sector in developed and developing economies (figure 1b). And in developed and developing countries alike, labor is being shed from both agriculture and manufacturing. The services sector is also more gender inclusive. Internation-ally, countries with high employment in services tend to have the highest participation of women in the labor market (fig-ure 1c).

2 POVERTY REDUCTION AND ECONOMIC MANAGEMENT (PREM) NETWORK www.worldbank.org/economicpremise
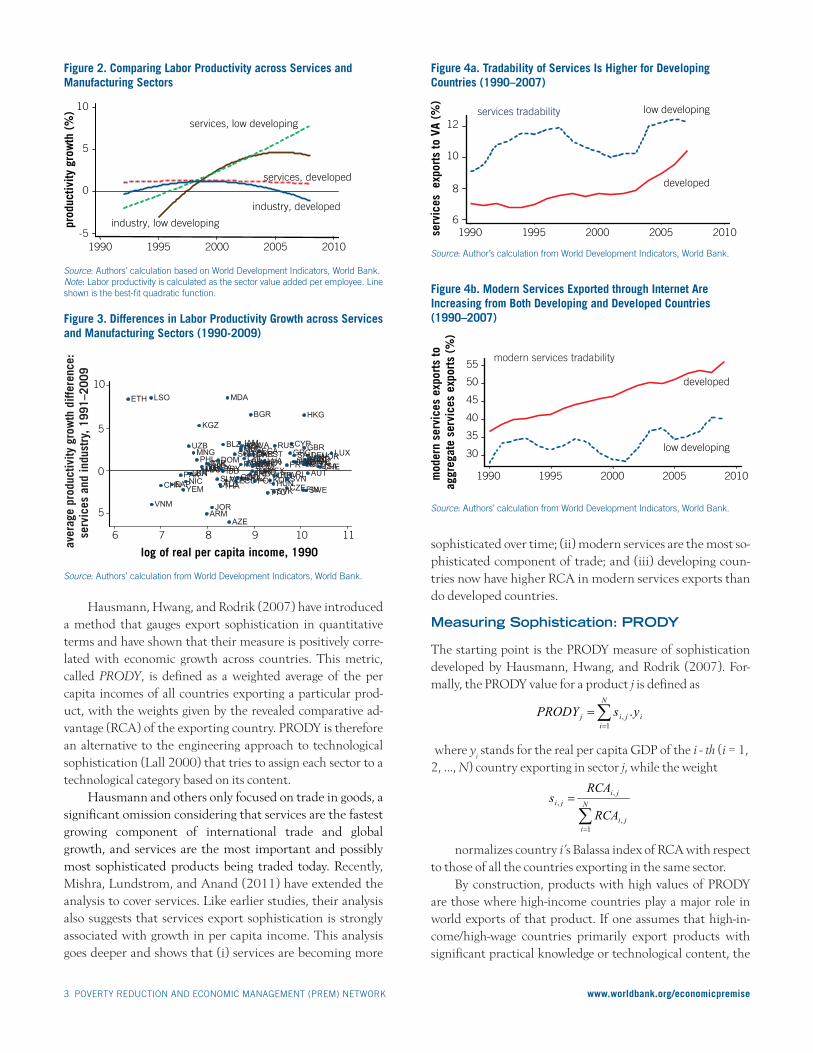
oped countries. Two things stand out: first, the tradability of services has risen over time for both developing and devel-oped countries.1 Second, this ratio is higher for developing countries. The figure also shows that a growing fraction of total services trade is now accounted for by modern services (Ghani 2010). For developed countries, the share of modern services in total service exports is now around 55 percent, while for poor countries the figure is 40 percent. Developing-country services exports are no longer just tourism, but are increasingly linked to modern services exported through the Internet.
Export and Growth: PRODYs across Sectors and Time
Economic growth can result from specialization and trade, but the size of the growth dividend from specialization de-pends on the technological sophistication of exports (Dalum, Laursen, and Verspagen 1999; Feenstra and Rose 2000). Em-pirically, an advanced export structure, higher productivity levels, and faster growth rates are linked.
Are these good jobs? Figure 2 shows that the rise in ser-vices’ contribution to growth is linked to a rise in productivity growth in that sector. Labor productivity growth in developed countries has been higher in services than in industry, and it remains positive. That implies that the global technology frontier for services is still shifting out, while industry has stagnated. At the same time, productivity growth in develop-ing countries in services is accelerating and appears to have outstripped productivity growth in industry. In 58 out of 94 countries for which data are available, productivity growth in services exceeded that in industry.
Figure 3 plots the difference between average labor pro-ductivity growth in services and industry against the log of real per capita incomes. There appears to be no tendency for this differential to be associated with per capita income levels. Developing countries like Ethiopia, Moldova, and Lesotho are just as likely to excel in services, compared to industry, as de-veloped economies like Hong Kong SAR, China.
Figure 4a plots services exports as a ratio of services val-ue added on the left vertical axis for developing and devel-
0
0.51.0
1.52.0
2.53.0
3.5
developed low developing
grow
th c
ontr
ibut
ion
(%)
services industry
Figure 1a. Sources of Growth in Developed and Developing Countries (1980–2009)
Source: Authors’ calculations from World Development Indicators, World Bank. -5-4-3-2-101234
developed developingaver
age
empl
oym
ent g
row
th (
%)
service industry agriculture
Figure 1b. Sources of Job Creation in Developed and Developing Countries (1991–2006)
Source: Authors’ calculations from World Development Indicators, World Bank.
Source: Ghani (2010).
Bangladesh
Bulgaria
Chile
China
Ethiopia Finland
Hong Kong, SAR
Hungary
India
Ireland
Israel
Korea, Rep.Luxembourg
Macao
Mexico
MoroccoPakistan
Panama
Philippines
Portugal
RomaniaRussian Fed.
Saudi Arabia
SingaporeSpain
Sri Lanka
Sweden Switzerland
Turkey
USA
20
40
60
80
tota
l fem
ale
empl
oym
ent /
tota
l fem
ale
popu
latio
n 15
–64
(%, 2
005)
10 20 30 40 50 60
service employment / total population 15–64 (%, 2005)
JapanArgentina
UK
Azerbaijan
IndonesiaItaly
Georgia
Australia
Figure 1c. Service Growth Is More Gender Inclusive
3 POVERTY REDUCTION AND ECONOMIC MANAGEMENT (PREM) NETWORK www.worldbank.org/economicpremise
Hausmann, Hwang, and Rodrik (2007) have introduced a method that gauges export sophistication in quantitative terms and have shown that their measure is positively corre-lated with economic growth across countries. This metric, called PRODY, is defined as a weighted average of the per capita incomes of all countries exporting a particular prod-uct, with the weights given by the revealed comparative ad-vantage (RCA) of the exporting country. PRODY is therefore an alternative to the engineering approach to technological sophistication (Lall 2000) that tries to assign each sector to a technological category based on its content.
Hausmann and others only focused on trade in goods, a significant omission considering that services are the fastest growing component of international trade and global growth, and services are the most important and possibly most sophisticated products being traded today. Recently, Mishra, Lundstrom, and Anand (2011) have extended the analysis to cover services. Like earlier studies, their analysis also suggests that services export sophistication is strongly associated with growth in per capita income. This analysis goes deeper and shows that (i) services are becoming more
sophisticated over time; (ii) modern services are the most so-phisticated component of trade; and (iii) developing coun-tries now have higher RCA in modern services exports than do developed countries.
Measuring Sophistication: PRODY
The starting point is the PRODY measure of sophistication developed by Hausmann, Hwang, and Rodrik (2007). For-mally, the PRODY value for a product j is defined as
where yi stands for the real per capita GDP of the i - th (i = 1,
2, ..., N) country exporting in sector j, while the weight
normalizes country i’s Balassa index of RCA with respect to those of all the countries exporting in the same sector.
By construction, products with high values of PRODY are those where high-income countries play a major role in world exports of that product. If one assumes that high-in-come/high-wage countries primarily export products with significant practical knowledge or technological content, the
Figure 4b. Modern Services Exported through Internet Are Increasing from Both Developing and Developed Countries (1990–2007)
Source: Author’s calculation from World Development Indicators, World Bank.
industry, developed
industry, low developing
services, low developing
services, developed
-5
0
5
10
prod
uctiv
ity g
row
th (
%)
1990 1995 2000 2005 2010
Figure 2. Comparing Labor Productivity across Services and Manufacturing Sectors
Source: Authors’ calculation based on World Development Indicators, World Bank. Note: Labor productivity is calculated as the sector value added per employee. Line shown is the best-fit quadratic function.
Figure 3. Differences in Labor Productivity Growth across Services and Manufacturing Sectors (1990-2009)
Source: Authors’ calculation from World Development Indicators, World Bank.
Figure 4a. Tradability of Services Is Higher for Developing Countries (1990–2007)
low developing
developed
6
8
10
12
serv
ices
exp
orts
to V
A (%
)
1990 1995 2000 2005 2010
services tradability
Source: Authors’ calculation from World Development Indicators, World Bank.
developed
low developing30
35
40
45
50
55
mod
ern
serv
ices
exp
orts
to
aggr
egat
e se
rvic
es e
xpor
ts (
%)
1990 1995 2000 2005 2010
modern services tradability
∑=
=N
iijij ysPRODY
1, .
∑=
= N
iji
jiji
RCA
RCAs
1,
,,
MUS
LTUKAZ
PAN VEN NLDCPNN
ALBARG
ARM
AUS
AUT
AZE
B L
BGR
BLZ
BO BRA
BWA
NCHE CHL
CHN
COL
CRI
CYP
CZE
DEU DNK DOM
DZA
EAP
ECA
ECU EGY
EMU EST
ETH
FIN
GBR
GEO
GRC
HKG
HND HRV
HUN IBD DN RL
JAM
JOR
KGZ
KOR
LAC LKA
LSO
LUX LVA
MAR
MDA
MEX MKD
MNG MYS
NIC
NOR
PAK
PER
PHL
POL
PRPRY ROM
RUS SAU
SGP
SLV
SUR
SVK SVN
SWE
SYR
THA
TJK
TTO
TUR
UKR UMC
URY USA
UZB
VNM
YEM
ZAF
5
0
5
10
6 7 8 9 10 11
log of real per capita income, 1990
ESP
ave
rage
pro
duct
ivity
gro
wth
diff
eren
ce:
serv
ices
and
indu
stry
, 199
1–20
09

4 POVERTY REDUCTION AND ECONOMIC MANAGEMENT (PREM) NETWORK www.worldbank.org/economicpremise
PRODY index is bound to be correlated with the unobserv-able degree of technological sophistication of the product. The intuition is simple: products like airplanes are highly so-phisticated and so are only produced in rich countries. These countries also have a high degree of RCA in the export of air-planes, and so the PRODY for airplanes is high. Over time, the PRODY can grow because the income levels of the main ex-porting countries grow, or because the RCA (the weights) of richer countries grows.
The database for services exports comes from the bal-ance of payments (rather than customs data, as is the case for goods) and is disaggregated by sector rather than product. These sectors are divided into two aggregates: modern ser-vices and traditional services. Modern services are found in information and communication technology (ICT), busi-ness and finance, and other commercial services. Traditional services typically require more face-to-face interaction: for example, sectors such as government and community ser-vices, transport, trade, hotel, restaurant, and beauty shops and barbers.
In 1990, modern services had a PRODY that was 10 per-cent higher than traditional services, but about 8 percent lower than that of goods. By 2007, the PRODY for modern services was 70 percent higher than for traditional services, and 40 percent higher than for goods (figure 5). All sectors had increased the degree of technological sophistication over this period.
What Explains the Rising PRODY in Services?
A simple decomposition exercise explains the forces behind the rise in PRODY. Recall that the PRODY is calculated as the product of two variables, an exporting-country income level and the weight of that country as given by its RCA. Accord-ingly, the PRODY can change over time either because the weights shift for each exporting country (the RCA gets more marked) or because the income levels of the exporting coun-try rise. The decomposition of the change over time of the PRODY is given by the following identity:
This formula is applied to the change in PRODY for three sectors, modern services, traditional services and goods, and then the change between 1987–89 and 1997–99 is compared with the change from 1997–99 to 2007–9 (figure 6).
The decomposition exercise shows the following trends. • First, all products have experienced a higher degree of so-
phistication over time as the per capita incomes of coun-tries have grown.
• Second, the RCA term is negative for five of the six calcu-lations, implying that developed countries are losing their comparative advantage and developing countries are becoming more important exporters.
• Third, the exception to this trend is for modern servic-es exports in this century. Despite the tremendous growth in modern services exports from developing countries, exemplified by business-process outsourc-ing, there has been even more rapid growth in modern services exports in developed countries (relative to their goods exports). The PRODY decomposition assumes that the number of
countries reporting/participating in a sector’s exports re-mains the same throughout all periods. Since this does not hold in this case, the decomposition is inexact. To check ro-bustness, the analysis also applied the decomposition with a balanced panel and for a different time period (change in PRODY from 1995–97 to 2001–3 and from 2001–3 to 2007–9) with minimal change in results.
Conclusion
The pace of growth in developing countries has increased. But the potential for explosive growth was usually only seen in the manufacturing sector: this is no longer the case. Countries
Figure 5. Growing Sophistication of Modern Services, 1990–2007
modern services
goods
traditional services5
10
15
20
PROD
Y (i
n th
ousa
nds)
1990 1995 2000 2005 2010
Source: Authors’ calculations from IMF balance of payments.Note: Modern services are calculated by taking out travel and transport services exports from commercial services exports.
( ) ( ).. 1,,2,,1
1,1
1,2,2,,12 tjitji
N
iti
N
itititjitt ssyyysPRODYPRODY −+−=− ∑∑
==
Figure 6. PRODY Change Decomposition
Source: Authors’ calculations from IMF balance of payments.
20981270 1398
-4065.589
28282893
-810.9497 -744.3112
2199.551
-1005.834-377.3706
-2-101234567
modern services
traditional services
goods modern services
traditional services
goods
1987–89 to 1997–99- 1997–99 to 2007–9
Chan
ge in
PRO
DY (
in th
ousa
nds)
sectors and time periodsper capita income term change RCA term change
-725.2556

5 POVERTY REDUCTION AND ECONOMIC MANAGEMENT (PREM) NETWORK www.worldbank.org/economicpremise
with high growth in services also tend to have high overall eco-nomic growth.
However, the causal connection remains uncertain: after all, there is also a positive relationship—widely accepted in de-velopment economics—between manufacturing growth and overall growth. But what has been overlooked is that the effect of services growth on aggregate economic growth appears to be as strong, if not stronger, than the effect of manufacturing growth on overall growth.
Service-led growth is sustainable, because globalization of services is still in its infancy. Moreover, the long-held view that services are nontransportable, nontradable, and nonscal-able no longer holds for a host of modern impersonal services, which can now be produced and exported at low cost. Devel-oping countries can thus sustain service-led growth, given the huge room they have for catch-up and convergence.
The process of globalization in the late 20th century led to a sharp divergence of incomes between those who indus-trialized and broke into global markets and the “bottom bil-lion” in some 60 countries where incomes stagnated for 20 years. It seemed as if the “bottom billion” would have to wait their turn for development, until giant industrializers like China became rich and uncompetitive in labor-intensive manufacturing.
The globalization of services, however, provides alterna-tive opportunities for developing countries to find niches, be-yond manufacturing, where they can specialize, scale up and achieve explosive growth, just like the industrializers. As the services produced and traded across the world expand with globalization, the possibilities for all countries to develop based on their comparative advantage expand—and that com-parative advantage can just as easily be in services as in manu-facturing or agriculture. The promise of the services revolu-tion is that countries do not have to wait to get on the path to rapid development. There is a new way ahead.
Acknowledgment
This article draws upon The Service Revolution in South Asia (Ghani 2010), and columns in Project Syndicate and VOX EU.
About the Authors
Ejaz Ghani is Lead Economist in Economic Policy and Debt for the Poverty Reduction and Economic Management (PREM) Net-work. Arti Grover is a consultant at the World Bank. Homi Kharas is a Deputy Director for the Global Economy and Devel-opment Program at the Brookings Institution.
Note
1. For an account of the differences between trade in goods and services, see Copeland and Mattoo (2008), Hoekman and Mattoo (2008), and Francois and Hoekman (2010).
References
ADB (Asian Development Bank). 2012. Asian Development Outlook 2012 Update: Services and Asia’s Future Growth.
Alfaro, Laura, and Andrew Charlton. 2007. “Growth and the Qual-ity of Foreign Direct Investment: Is All FDI Equal?” Centre for Economic Performance Discussion Paper 0830, LSE.
Amin, Mohammad, and Aaditya Mattoo. 2006. “Do Institutions Matter More for Services?” Policy Research Working Paper 4032, World Bank, Washington, DC.
———. 2008. “Human Capital and the Changing Structure of the Indian Economy.” Policy Research Working Paper 4576, World Bank, Washington, DC.
Baumol, William J. 1967. “Macroeconomics of Unbalanced Growth: The Anatomy of Urban Crisis.” American Economic Review 57 (3): 415–26.
Bhagwati, J. 2004. In Defense of Globalization. Oxford: Oxford University Press.
Bhagwati, Jagdish N. 1984. “Splintering and Disembodiment of Services and Developing Nations.” The World Economy 7: 133–44.
Blinder, Alan S. 2006. “Offshoring: The Next Industrial Revolu-tion?” Foreign Affairs 85 (2): 113–28.
Borchert, I., B. Gootiiz, and A. Mattoo. 2011. “Services in Doha: What’s on the Table?” In Unfinished Business?, ed. W. Martin and A. Mattoo, 115–144. Washington, DC: World Bank.
———. 2012. “Guide to the Services Trade Restrictions Database.” World Bank Policy Research Working Paper. No. 6108, Wash-ington, DC.
Bosworth, B., and A. Maertens. 2010. “Economic Growth and Job Generation: The Role of the Service Sector.” In The Service Revo-lution in South Asia, ed. E. Ghani. New York: Oxford Univ. Press.
Dalum, B., K. Laursen, and B. Verspagen. 1999. “Does Specializa-tion Matter for Growth?” Industrial and Corporate Change 2: 267–88.
Dasgupta, Sukti, and Ajit Singh. 2006. “Manufacturing, Services and Premature De-Industrialisation in Developing Countries: A Kaldorian Empirical Analysis.” ESRC Centre for Business Research Working Paper 327.
Eichengreen, B., and P. Gupta. 2009. “Two Waves of Services Growth.” National Bureau of Economic Research Working Paper No. 14968, Cambridge, MA.
Eschenbach, Felix, and Bernard Hoekman. 2005. “Services Policy Reform and Economic Growth in Transition Economies, 1990–2004.” Policy Research Working Paper Series 3663, World Bank, Washington, DC.
———. 2006. “Services Policies in Transition Economies: On the EU and WTO as Commitment Mechanisms.” World Trade Review 5 (3): 415–43.
Feenstra, R. C., and A. K. Rose. 2000. “Putting Things in Order: Trade Dynamics and Product Cycles.” Review of Economics and Statistics 82 (3): 369–82.
Francois, J., and B. Hoekman. 2010. “Services Trade and Policy.” Journal of Economic Literature 48 (3): 642–92.
Francois, Joseph, and Bernard Hoekman. 2010. “Services Trade and Policy.” Journal of Economic Literature 48 (3): 642–92.
Freund, Caroline, and Diana Weinhold. 2002. “The Internet and International Trade in Services.” American Economic Review 92 (2): 236–40.

6 POVERTY REDUCTION AND ECONOMIC MANAGEMENT (PREM) NETWORK www.worldbank.org/economicpremise
The Economic Premise note series is intended to summarize good practices and key policy findings on topics related to economic policy. They are produced by the Poverty Reduction and Economic Management (PREM) Network Vice-Presidency of the World Bank. The views expressed here are those of the authors and do not necessarily reflect those of the World Bank. The notes are available at: www.worldbank.org/economicpremise.
Ghani, Ejaz, ed. 2010. The Service Revolution in South Asia. New Delhi: Oxford University Press. http://sitere-sources.worldbank.org/INTRANETTRADE/Resourc-es/239054-1239120299171/5998577-1254498644362/646 1208-1300395869284/SA_Service.pdf
Ghani, Ejaz, Arti Grover Goswami, and Homi Kharas. 2011. “Ser-vice with a Smile: A New Growth Engine for Poor Countries.” VOX EU, http://www.voxeu.org/article/service-smile-new-growth-engine-poor-countries.
Gonzales, F., J. B. Jensen, Y. Kim, and H. K. Nordas. 2012. “Glo-balisation of Services and Jobs.” In Policy Priorities for Interna-tional Trade and Jobs, ed. D. Lippoldt. Paris: Organisation for Economic Co-operation and Development (www.oecd.org/trade/icite).
Goswami, Arti, Aaditya Mattoo, and Sebastian Saez, ed.2011. Exporting Services: A Developing Country Perspective. Washington, DC: World Bank.
Hausmann, Ricardo, Dani Rodrik, and Andres Velasco. 2005. “Growth Diagnostics.” Working Paper, Kennedy School of Government, Harvard University, Cambridge.
Hausmann, Ricardo, Jason Hwang, and Dani Rodrik. 2007. “What You Export Matters.” Journal of Economic Growth 12 (1): 1–25.
Head, Keith, Thierry Mayer, and John Ries. 2008. “How Remote Is the Off-Shoring Threat?” CEPR Discussion Paper 6542 (forth-coming in the European Economic Review).
Hoekman, Bernard. 2006. “Trade in Services, Trade Agreements and Economic Development: A Survey of the Literature.” CEPR Discussion Paper 5760.
Hoekman, Bernard, and C. Braga. 1997. “Protection and Trade in Services: A Survey.” World Bank Policy Research Working Paper 1747, Washington, DC.
Hoekman, Bernard, and Aaditya Mattoo. 2006. “Services, Econom-ic Development and the Doha Round: Exploiting the Compara-tive Advantage of the WTO.” CEPR Discussion Paper 5628.
———. 2008. “Services Trade and Growth.” In Opening Markets for Trade in Services: Countries and Sectors in Bilateral and WTO Negotiations, ed. Juan A. Marchetti and Martin Roy, 21–58. Cambridge, UK: Cambridge University Press.
———. 2011. “Services Trade Liberalization and Regulatory Reform: Re-Invigorating International Cooperation.” World Bank Policy Research Working Paper Series 5517, Washington, DC.
Houseman, S., C. Kurz, P. Lengermann, and B. Mandel. 2011. “Offshoring Bias in U.S. Manufacturing.” Journal of Economic Perspectives 25 (2): 111–32.
Jensen, R. 2007. “The Digital Provide: Information (Technology), Market Performance, and Welfare in the South Indian Fisheries Sector.” The Quarterly Journal of Economics 122 (3): 879–924.
Kaldor, N. 1966. Causes of the Slow Rate of Economic Growth of the United Kingdom. Cambridge University Press.
Kimura, F., and H. Lee. 2004. ‘The Gravity Equation in Interna-tional Trade in Services.” European Trade Study Group Confer-ence, University of Nottingham, September 9–11.
Klonner, S., and P. Nolen. 2008. Does ICT Benefit the Poor? Evidence from South Africa. http://ifap-is-observatory.ittk.hu/node/583.
Kolko, J. 2010. “Urbanization, Agglomeration, and Coagglomera-tion of Service Industries.” In Agglomeration Economics, ed. E. Glaeser, 151–80. Chicago: National Bureau of Economic Research and The Chicago University Press.
Kox, H., and A. Lejour, A. 2005. “Regulatory Heterogeneity as Obstacle for International Services Trade.” CPB Discussion Paper, No. 49.
Kuznets, S. 1959. Six Lectures on Economic Growth. New York: The Free Press of Glencoe.
Lall, S. 2000. “The Technological Structure and Performance of De-veloping Country Manufactured Exports, 1985–98.” Oxford Development Studies 28 (3): 337–69.
McCredie, Andrew, and Darryl Bubner. 2010. Seven Myths about Services. Australian Services Round Table.
Mirza, Daniel, and Giuseppe Nicoletti. 2004. “What Is So Special about Trade in Services?” Leverhulme Centre for Research on Globalisation and Economic Policy, Research Paper 2004/02.
Mishra, S., S. Lundstrom, and R. Anand. 2011. “Service Export So-phistication and Economic Growth.” Policy Research Working Paper 5606, World Bank, Washington, DC.
Sridhar, K. S., and V. Sridhar. 2009. “Telecommunications Infra-structure and Economic Growth: Evidence from Developing Countries.” Applied Economics and International Development 7 (2): 37–56.
World Bank. 2011. An Evaluation of World Bank Group Activities in Information and Communication Technologies: Capturing Technol-ogy for Development. Washington, DC.
———. 2012. Information and Communications for Development: Maxi-mizing Mobile. Washington, DC.