Embed Size (px)
Citation preview
PwC*connectedthinking
Economics
The World in 2050Can rapid global growth be reconciled withmoving to a low carbon economy?*

Contents1 Page
Executive Summary 3 1. Introduction 5 2. Methodology 7 3. Business As Usual (BAU)
scenario for global carbon emissions to 2050
9
4. How might a low carbon world be achieved by 2050?
13
5. Conclusions 20 Annex: Technical description of
long-term economic growth model and references
22
1 This report has been prepared for general guidance on matters of interest only, and does not constitute professional advice. You should not act upon the information contained in this report without obtaining specific professional advice. No representation or warranty (express or implied) is given as to the accuracy or completeness of the information contained in this report, and, to the extent permitted by law, PricewaterhouseCoopers, its members, employees and agents accept no liability, and disclaim all responsibility, for the consequences of you or anyone else acting, or refraining to act, in reliance on the information contained in this report or for any decision based on it. For more information about this report or related issues, please contact the author by e-mail at [email protected]
PricewaterhouseCoopers LLP – July 2008 2
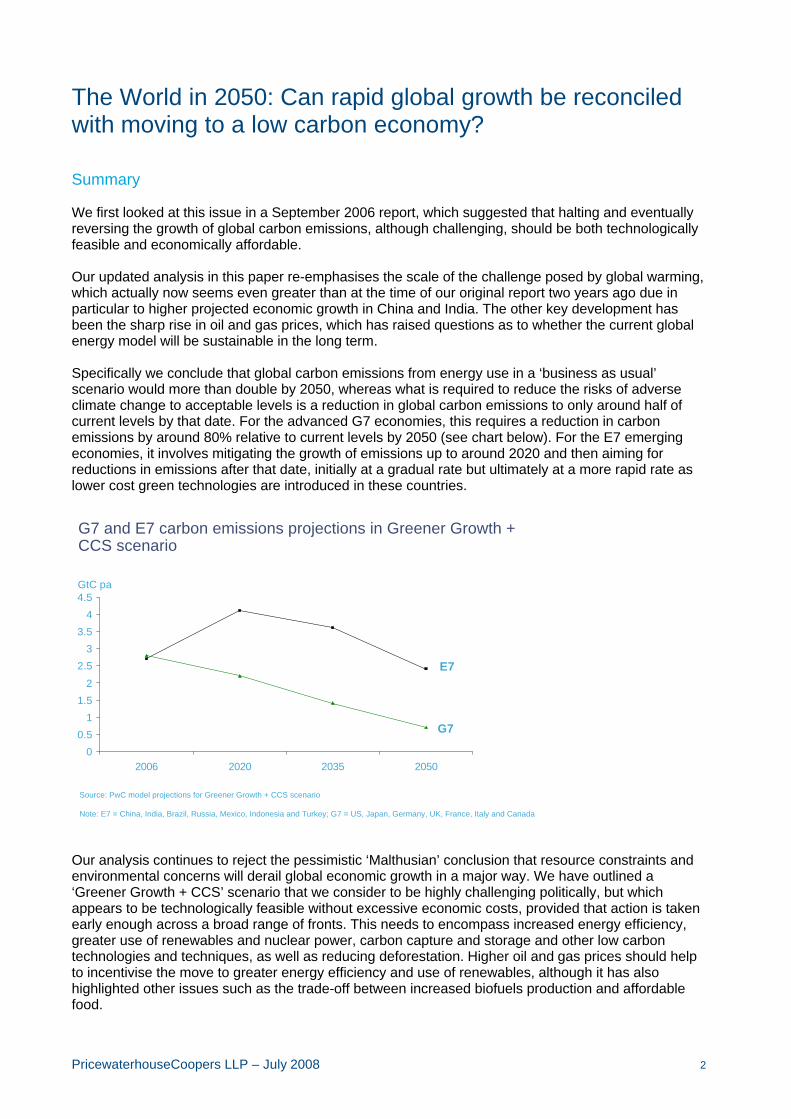
The World in 2050: Can rapid global growth be reconciled with moving to a low carbon economy? Summary We first looked at this issue in a September 2006 report, which suggested that halting and eventually reversing the growth of global carbon emissions, although challenging, should be both technologically feasible and economically affordable. Our updated analysis in this paper re-emphasises the scale of the challenge posed by global warming, which actually now seems even greater than at the time of our original report two years ago due in particular to higher projected economic growth in China and India. The other key development has been the sharp rise in oil and gas prices, which has raised questions as to whether the current global energy model will be sustainable in the long term. Specifically we conclude that global carbon emissions from energy use in a ‘business as usual’ scenario would more than double by 2050, whereas what is required to reduce the risks of adverse climate change to acceptable levels is a reduction in global carbon emissions to only around half of current levels by that date. For the advanced G7 economies, this requires a reduction in carbon emissions by around 80% relative to current levels by 2050 (see chart below). For the E7 emerging economies, it involves mitigating the growth of emissions up to around 2020 and then aiming for reductions in emissions after that date, initially at a gradual rate but ultimately at a more rapid rate as lower cost green technologies are introduced in these countries.
G7 and E7 carbon emissions projections in Greener Growth + CCS scenario
0
0.5
1
1.5
2
2.5
3
3.5
4
4.5
2006 2020 2035 2050
Source: PwC model projections for Greener Growth + CCS scenario
Note: E7 = China, India, Brazil, Russia, Mexico, Indonesia and Turkey; G7 = US, Japan, Germany, UK, France, Italy and Canada
GtC pa
E7
G7
Our analysis continues to reject the pessimistic ‘Malthusian’ conclusion that resource constraints and environmental concerns will derail global economic growth in a major way. We have outlined a ‘Greener Growth + CCS’ scenario that we consider to be highly challenging politically, but which appears to be technologically feasible without excessive economic costs, provided that action is taken early enough across a broad range of fronts. This needs to encompass increased energy efficiency, greater use of renewables and nuclear power, carbon capture and storage and other low carbon technologies and techniques, as well as reducing deforestation. Higher oil and gas prices should help to incentivise the move to greater energy efficiency and use of renewables, although it has also highlighted other issues such as the trade-off between increased biofuels production and affordable food.

PricewaterhouseCoopers LLP – July 2008 3
All sectors of the economy need to achieve major emissions reductions as part of this process. We estimate that the costs of achieving the emission reductions indicated in the chart above would be broadly equivalent to sacrificing only around a year of global GDP growth between now and 2050 (i.e. reaching the same level of GDP in 2051 as might otherwise have happened in 2050). The key requirement now is for governments in all of the major economies to demonstrate their joint political will to establish a policy framework that aims to put a global price on carbon emissions and so send the economic signals to private sector investors and consumers needed to deliver the new technologies and changes in behaviour required to combat global warming. The EU has taken a lead on this with its emissions trading scheme. The US, in particular, needs to take more of a role going forward given its status as the world’s largest economy. Only then can emerging but still relatively low income countries like China and India be expected to follow the lead of the richer nations. Progress on this agenda has been relatively slow over the two years since we wrote our first report: it needs to speed up considerably if the challenge of global warming is to be met. Given the long time lags inherent both in introducing low carbon technologies and infrastructure and in changes in carbon emissions feeding through into climate change, there is no room for further delay in taking co-ordinated global action on this issue.
PricewaterhouseCoopers LLP – July 2008 4
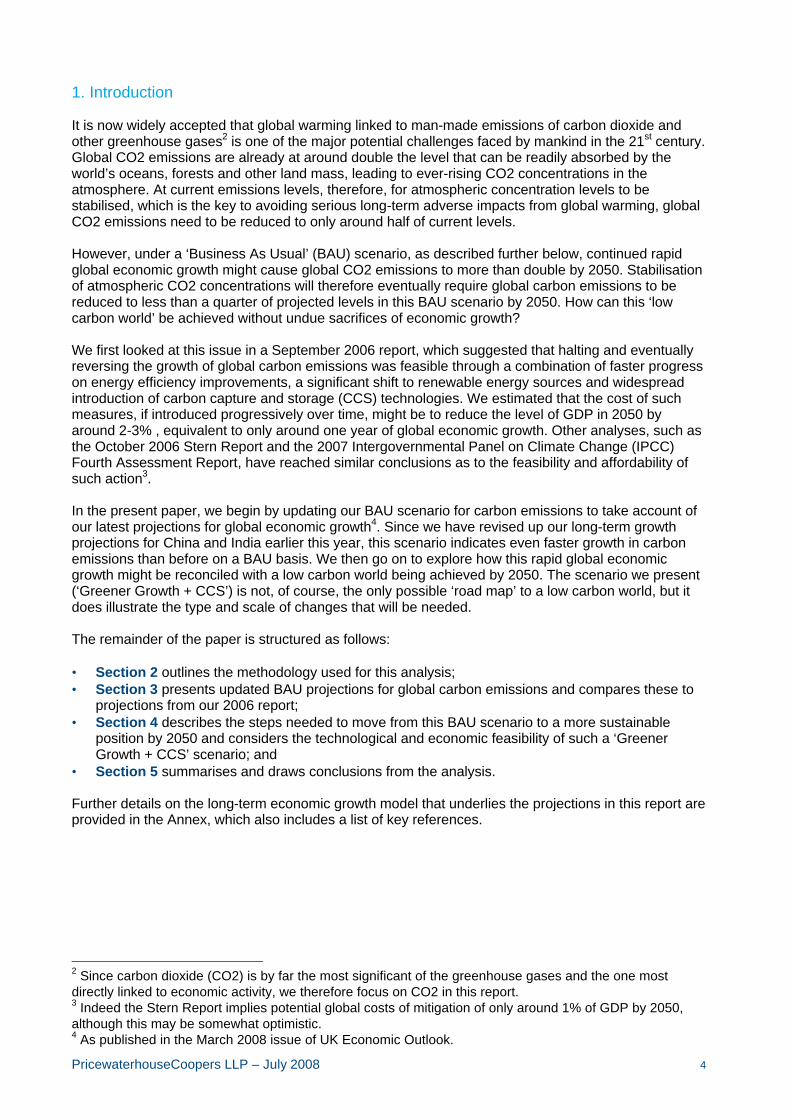
1. Introduction It is now widely accepted that global warming linked to man-made emissions of carbon dioxide and other greenhouse gases2 is one of the major potential challenges faced by mankind in the 21st century. Global CO2 emissions are already at around double the level that can be readily absorbed by the world’s oceans, forests and other land mass, leading to ever-rising CO2 concentrations in the atmosphere. At current emissions levels, therefore, for atmospheric concentration levels to be stabilised, which is the key to avoiding serious long-term adverse impacts from global warming, global CO2 emissions need to be reduced to only around half of current levels. However, under a ‘Business As Usual’ (BAU) scenario, as described further below, continued rapid global economic growth might cause global CO2 emissions to more than double by 2050. Stabilisation of atmospheric CO2 concentrations will therefore eventually require global carbon emissions to be reduced to less than a quarter of projected levels in this BAU scenario by 2050. How can this ‘low carbon world’ be achieved without undue sacrifices of economic growth? We first looked at this issue in a September 2006 report, which suggested that halting and eventually reversing the growth of global carbon emissions was feasible through a combination of faster progress on energy efficiency improvements, a significant shift to renewable energy sources and widespread introduction of carbon capture and storage (CCS) technologies. We estimated that the cost of such measures, if introduced progressively over time, might be to reduce the level of GDP in 2050 by around 2-3% , equivalent to only around one year of global economic growth. Other analyses, such as the October 2006 Stern Report and the 2007 Intergovernmental Panel on Climate Change (IPCC) Fourth Assessment Report, have reached similar conclusions as to the feasibility and affordability of such action3. In the present paper, we begin by updating our BAU scenario for carbon emissions to take account of our latest projections for global economic growth4. Since we have revised up our long-term growth projections for China and India earlier this year, this scenario indicates even faster growth in carbon emissions than before on a BAU basis. We then go on to explore how this rapid global economic growth might be reconciled with a low carbon world being achieved by 2050. The scenario we present (‘Greener Growth + CCS’) is not, of course, the only possible ‘road map’ to a low carbon world, but it does illustrate the type and scale of changes that will be needed. The remainder of the paper is structured as follows: • Section 2 outlines the methodology used for this analysis; • Section 3 presents updated BAU projections for global carbon emissions and compares these to
projections from our 2006 report; • Section 4 describes the steps needed to move from this BAU scenario to a more sustainable
position by 2050 and considers the technological and economic feasibility of such a ‘Greener Growth + CCS’ scenario; and
• Section 5 summarises and draws conclusions from the analysis. Further details on the long-term economic growth model that underlies the projections in this report are provided in the Annex, which also includes a list of key references.
2 Since carbon dioxide (CO2) is by far the most significant of the greenhouse gases and the one most directly linked to economic activity, we therefore focus on CO2 in this report. 3 Indeed the Stern Report implies potential global costs of mitigation of only around 1% of GDP by 2050, although this may be somewhat optimistic. 4 As published in the March 2008 issue of UK Economic Outlook.

PricewaterhouseCoopers LLP – July 2008 5
2. Methodology This articles projects global carbon emissions and atmospheric CO2 concentrations in different scenarios using the same methodology as described in detail in our original September 2006 report, which is available to download from our ‘World in 2050’ website (www.pwc.com/world2050) together with other reports in this series. The structure of this model is outlined in Figure 1, with the key inputs being: • GDP projections to 2050 from the latest March 2008 update of our long-term growth model (see
Annex for details of this model and our World in 2050 website for the full report) for the 175 largest economies in the world, which together account for around 75-80% of global GDP, primary energy consumption and carbon emissions; projections for these countries are then scaled up to give a global total;
• base year data (now for 2006 rather than 2004 in our original study) for primary energy
consumption by fuel type and carbon emissions from the latest BP Statistical Review of World Energy, supplemented in a few cases by additional sources such as the International Energy Agency (IEA); and
• assumptions that can be varied in different scenarios for primary energy intensity, fuel mix, scale of
CCS usage and additional factors relevant to calculating atmospheric concentrations of CO2 from emissions projections (in particular, non-energy-related CO2 emissions and the CO2 absorption capacity of ‘carbon sinks’ such as oceans and forests6).
Figure 1: Outline of PwC carbon emissions model structure
GDP (at PPP) projectionsfrom PwC model to 2050
Primary energyto GDP intensityassumptions
GDP modelassumptions
Primary energyconsumptionprojections
Fuel mix shareassumptions
Oil, gas, coal, otherprimary energyconsumptionprojections
Unit carbonemissions byfossil fuel type
Carbon emissionprojections to 2050(by country and at global level)
Note: all projections done by country then aggregated to global level
Average CO2 levels in atmosphere (ppm)
5 Our long-term GDP model has now been extended from 17 to 30 countries, but since the additional 13 countries account for less than 10% of global GDP and energy consumption, we have not included these separately in our carbon emissions model at this stage. 6 In all of the scenarios below we assume that net non-energy carbon emissions fall from around 1 gigatonnes of carbon (GtC) now to zero by 2050 to reflect measures to eliminate net deforestation, while carbon sinks decline slightly from 4.2GtC to 4GtC over this period. These are the same two assumptions made in our 2006 report and broadly in line with assumptions in other major studies. Although there are clearly significant uncertainties over these variables (in particular as regards differences of scientific view on future trends in global carbon sinks) it is beyond the scope of this article to explore these issues. We focus here on energy-related carbon emissions, since these can be most readily related to economic variables such as GDP.
PricewaterhouseCoopers LLP – July 2008 6
We take the GDP projections as given in all scenarios, focusing instead on the implications of varying assumptions on primary energy intensity, fuel mix and CCS usage in particular. Assumptions are made for each of the 17 large economies, projections for which are then aggregated and grossed up to global level. Sector breakdown of projected carbon emissions For the purposes of this report, we have also extended the model to include an illustrative high level breakdown of global CO2 emissions by industry sector. As discussed further below, this is based on applying relative sector emission growth rates from IEA projections to the scenarios we consider.

PricewaterhouseCoopers LLP – July 2008 7
3. Business As Usual (BAU) scenario for global carbon emissions to 2050 As in our September 2006 report, our BAU scenario assumes, firstly, that improvements in energy intensity (measured in terms of the rate of decline in the ratio of primary energy consumption to GDP) average around 1.5% per annum globally, but with some variations by country and over time to reflect recent trends. This BAU assumption is in line with average global energy intensity improvements in 1980-2005 and can be used to generate projections for primary energy consumption to 2050 both at national and global level. Figure 2 illustrates how, relative to an indexed value of 100 in 2006, global GDP and primary energy consumption growth compare in this BAU scenario. It shows that, while global GDP is projected to grow by around 325% cumulatively between 2006 and 2050 (3.4% per annum on average), primary energy consumption is projected to grow by only around 140% cumulatively over this period (2.0% per annum on average) due to energy efficiency improvements.
Figure 2: GDP and primary energy consumption growth in BAU scenario
0
50
100
150
200
250
300
350
400
450
2006 2020 2035 2050
GDPPrimary energy
Source: World Bank and BP data for 2006, PwC model estimates for later years
Index (2006 = 100)
Our BAU scenario further assumes that: • the fuel mix between gas, coal, oil and others is constant in each country; and • there is no use of carbon capture and storage (CCS). These assumptions are not intended to represent the most likely outcomes7, but just to provide a convenient benchmark against which to assess other scenarios. Given these assumptions, carbon emissions from energy use grow broadly in line with primary energy consumption, increasing by around 140% cumulatively between 2006 and 2050, or by around 2% per annum on average. As shown in Figure 3 below, our updated BAU scenario for global carbon emissions now shows materially stronger growth (2% compared with 1.6% per annum) as compared to the BAU scenario in our original September 2006 report. As the chart indicates, this is primarily due to stronger expected growth in China and India, which have a disproportionate significance in global carbon emissions due to their heavy reliance on coal compared to the OECD countries. China is by far the highest global carbon emitter by 2050 in this scenario (emitting considerably more than the US and EU combined by that date), while India is also projected to overtake the US as the second largest emitter by 2050. Together these two emerging giants are projected to account for around 45% of global carbon
7 In particular, a constant fuel mix looks relatively improbable given recent sharp rises in oil and gas prices, which will in themselves help to promote moves towards the kind of ‘green growth’ scenarios set out later in this report.

PricewaterhouseCoopers LLP – July 2008 8
emissions from energy by 2050, compared to only around 20% of the global total for the US and EU combined.
Figure 3: Global carbon emissions in new and old BAU scenarios (with breakdown for major economies)
0
5
10
15
20
25
2006 2050 (old) 2050 (new)
OtherEUUSIndiaChina
Source: PwC model projections for BAU scenarios from 2006 report (old) and 2008 report (new)
Gigatonnes of carbon (GtC) pa
As noted above, we have supplemented our model with estimates from the 2007 International Energy Agency (IEA) World Energy Outlook report on the relative growth rates of emissions from four broad sectors of the economy: power generation, transport, buildings, and industry/other. Figure 4 presents some illustrative projections of how global carbon emissions might break down by sector over the period to 2050 in our BAU scenario. The power generation and transport sectors see the most rapid growth rates in emissions in this scenario, reflecting the expected patterns of development in the major emerging economies and the rise in car ownership in these countries. But all sectors of the global economy see significant cumulative growth in emissions in this scenario, which reinforces the need for an economy-wide approach to moving to a low carbon world, rather than a strategy focused on a few key sectors.
Figure 4: Global carbon emissions by sector in new BAU scenario
0
5
10
15
20
25
2006 2025 2050
GtC
Industry/ other
Buildings
Transport
Power
Source: BP & IEA for 2006, PwC model estimates and projections (CO2 emissions from energy use only)
PricewaterhouseCoopers LLP – July 2008 9
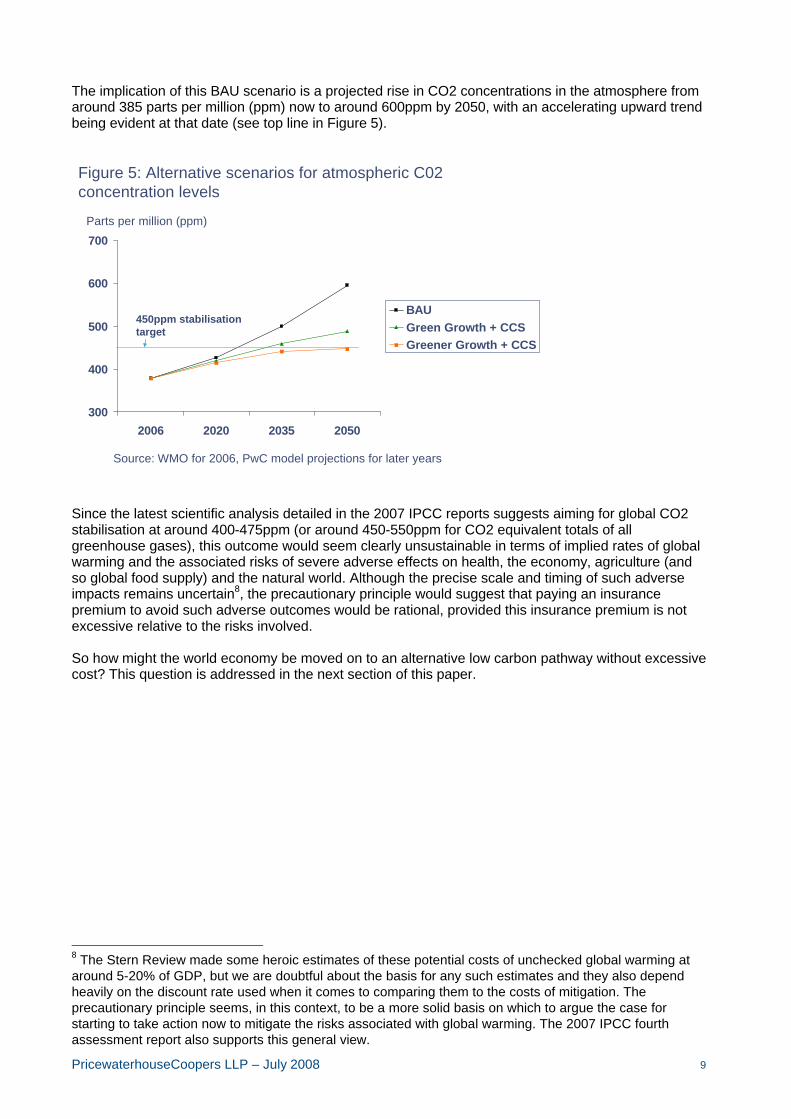
The implication of this BAU scenario is a projected rise in CO2 concentrations in the atmosphere from around 385 parts per million (ppm) now to around 600ppm by 2050, with an accelerating upward trend being evident at that date (see top line in Figure 5).
Figure 5: Alternative scenarios for atmospheric C02 concentration levels
300
400
500
600
700
2006 2020 2035 2050
BAUGreen Growth + CCSGreener Growth + CCS
Source: WMO for 2006, PwC model projections for later years
Parts per million (ppm)
450ppm stabilisationtarget
Since the latest scientific analysis detailed in the 2007 IPCC reports suggests aiming for global CO2 stabilisation at around 400-475ppm (or around 450-550ppm for CO2 equivalent totals of all greenhouse gases), this outcome would seem clearly unsustainable in terms of implied rates of global warming and the associated risks of severe adverse effects on health, the economy, agriculture (and so global food supply) and the natural world. Although the precise scale and timing of such adverse impacts remains uncertain8, the precautionary principle would suggest that paying an insurance premium to avoid such adverse outcomes would be rational, provided this insurance premium is not excessive relative to the risks involved. So how might the world economy be moved on to an alternative low carbon pathway without excessive cost? This question is addressed in the next section of this paper.
8 The Stern Review made some heroic estimates of these potential costs of unchecked global warming at around 5-20% of GDP, but we are doubtful about the basis for any such estimates and they also depend heavily on the discount rate used when it comes to comparing them to the costs of mitigation. The precautionary principle seems, in this context, to be a more solid basis on which to argue the case for starting to take action now to mitigate the risks associated with global warming. The 2007 IPCC fourth assessment report also supports this general view.
PricewaterhouseCoopers LLP – July 2008 10
4. How might a low carbon world be achieved by 2050? The case against Malthusian pessimism A pessimistic ‘Malthusian’ view would be that the global warming problem will be ‘solved’ by resource constraints (for energy, food, water etc) preventing the rapid economic growth in China, India and other emerging markets on which the above CO2 projections rely. This kind of pessimistic view has consistently been proved wrong for the past 200 years due to the fact that technological advances have generated productivity improvements in the use of existing supplies of natural resources, while also enabling new supplies of natural resources to be utilised in an economically viable manner. These technological advances have overcome any potential resource-based limits to growth. Recent rises in global commodity prices, mostly notably for food and fuel, have revived these Malthusian concerns to some degree and there are clearly very important challenges posed here in the short to medium term, particularly as regards the potential impact on the poorest groups in the world. Looking further ahead, however, it is precisely these commodity price rises that will stimulate the investment in previously uneconomic sources of supply and new or under-developed technologies (from renewable energy and CCS to hydrogen fuel cells and genetically-modified foods) that will be necessary to overcome these apparent resource constraints in the longer term. Not all of these technologies will prove to be economically viable and publicly acceptable, and some difficult trade-offs will need to be made (e.g. on the environmental pros and cons of nuclear power, and the balance between food and biofuels production). But the historical record leads us to remain fundamentally optimistic about the ability of human ingenuity to overcome these potential limits to growth. The big question is whether this continued progress can be achieved in a way that is consistent with tackling global warming. To assess this we consider below the scale of the challenge in terms of required carbon emission reductions by 2050 and the technological and economic feasibility of achieving this objective. The required scale of carbon emission reductions In our September 2006 report we outlined a ‘Green Growth + CCS’ scenario that seemed at that time to be sufficient to put global carbon emissions on a path consistent with long-term stabilisation of atmospheric CO2 concentrations at what was judged then to be an acceptable level of around 450ppm (equivalent to around 525ppm in CO2 equivalent terms for all greenhouse gases). The hallmark of this scenario was that it involved progressive reductions in carbon intensity compared to BAU across a broad range of areas, but without any dramatic technological, environmental or political shocks. As such we considered it to be challenging but feasible. In the next 15-20 years, as illustrated in Figure 6, energy efficiency improvements for vehicles, power plants, factories and buildings would play the most important role in this scenario, but renewables9 and CCS would also become increasingly important in delivering the required reductions in carbon emissions beyond around 2025 once these technologies became more mature and their unit costs reduced accordingly.
9 Nuclear power is also assumed to play a somewhat increased role here relative to BAU, at least in those countries where this is politically acceptable.

PricewaterhouseCoopers LLP – July 2008 11
Figure 6 uses our old GDP projections, however, and when we update these to the March 2008 projections the higher growth rates now envisaged for China and India in particular (as discussed above) result in both the BAU and Green Growth + CCS emissions profile shifting upwards as illustrated in Figure 7.
Figure 7: Global carbon emissions in new and old BAU and Green Growth + CCS scenarios
0
5
10
15
20
25
2006 2020 2035 2050
Source: PwC model projections for BAU and Green Growth (GG) + CCS scenarios from 2006 report (old) and 2008 report (new)
GtC pa
BAU (new)
GG + CCS (new)
BAU (old)
GG + CCS (old)
As a result, our original Green Growth + CCS scenario would now succeed only in restraining global carbon emissions from energy use in 2050 to slightly above current levels, albeit with a downward trend being evident at that date. Atmospheric CO2 concentrations, rather than stabilising at around 450ppm in this scenario would now be around 490ppm in 2050 and still on a rising trend (see middle line in Figure 5 above), which does not appear likely to be acceptable in the light of the latest scientific evidence as set out in the 2007 IPCC assessment reports. This new analysis therefore suggests that the challenge is even greater than we recognised two years ago. To address this, we have developed an enhanced ‘Greener Growth + CCS’ scenario which does appear to produce more acceptable results in terms of atmospheric CO2 concentrations stabilising at around 450ppm by 2050 as illustrated by the lowest of the three lines in Figure 5 above. This new scenario has the following enhanced features:

PricewaterhouseCoopers LLP – July 2008 12
• relative to BAU, the rate of reduction in energy intensity is set at 1.5% per annum, as compared to
1% per annum for the Green Growth + CCS scenario; and • the share of renewables and nuclear power in total primary energy consumption is assumed to rise
to around 50% by 2050, as compared to around 30% in the Green Growth + CCS scenario10. Figure 8 illustrates how this scenario would lead to global carbon emissions in 2050 being less than a quarter of projected BAU levels (using our new GDP projections) and just over half of current levels.
Figure 8: Achieving Greener Growth – global carbon emissions projections made in this new report
0
5
10
15
20
25
2006 2025 2050Source: PwC model projections
GtC pa
Business as usual
More nuclear +renewables
Faster energyefficiencyimprovements
Carbon captureand storageGreener Growth
(with CCS)
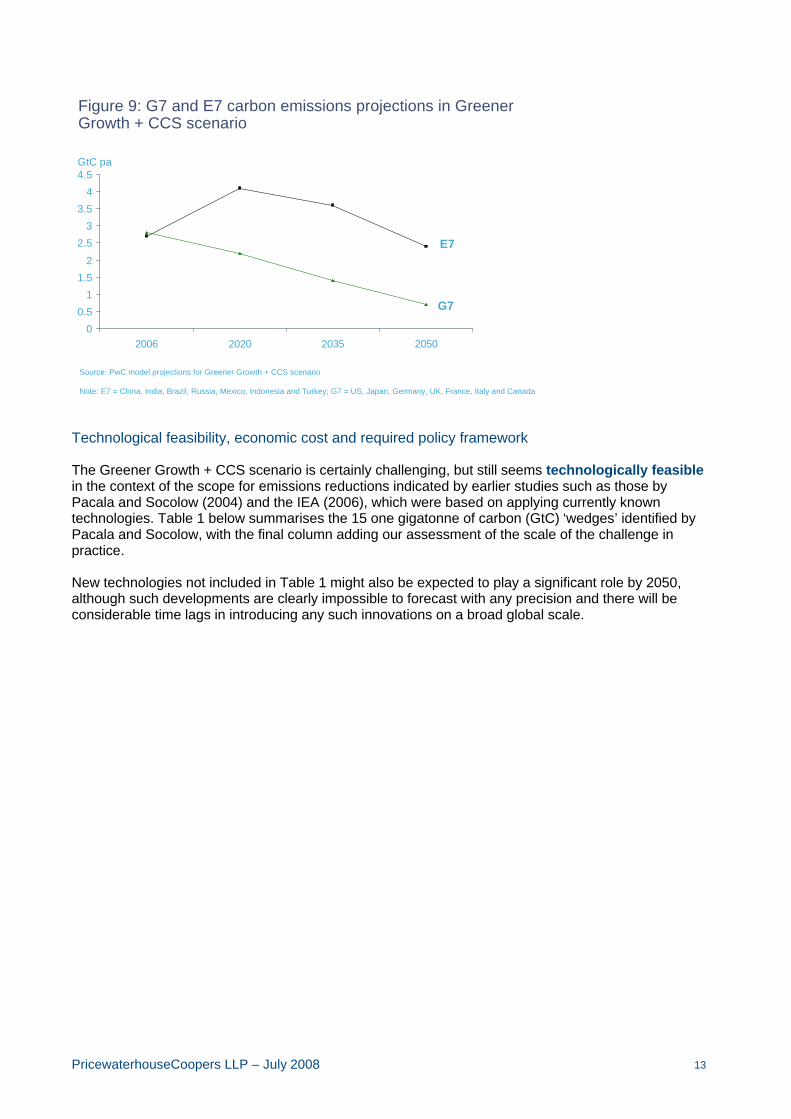
The reductions would encompass all major economies, but with the G7 economies being required to reduce emissions by 2050 by around 80% compared to 2006, whereas the E7 emerging economies (led by China and India) might aim initially to restrain the growth of emissions up to around 2020 and only later start to reduce them at an accelerating rate, as summarised in Figure 9 (see footnote to this chart for definitions of the G7 and E7 groups of countries).
10 A similar result could be obtained by assuming a somewhat smaller increase in renewables and a somewhat larger contribution from CCS. The balance between these different measures will in practice depend on the relative speed of technological advances and unit cost reductions in these areas. Both are likely to play an important role in reducing carbon emissions.
PricewaterhouseCoopers LLP – July 2008 13
Figure 9: G7 and E7 carbon emissions projections in Greener Growth + CCS scenario
0
0.5
1
1.5
2
2.5
3
3.5
4
4.5
2006 2020 2035 2050
Source: PwC model projections for Greener Growth + CCS scenario
Note: E7 = China, India, Brazil, Russia, Mexico, Indonesia and Turkey; G7 = US, Japan, Germany, UK, France, Italy and Canada
GtC pa
E7
G7
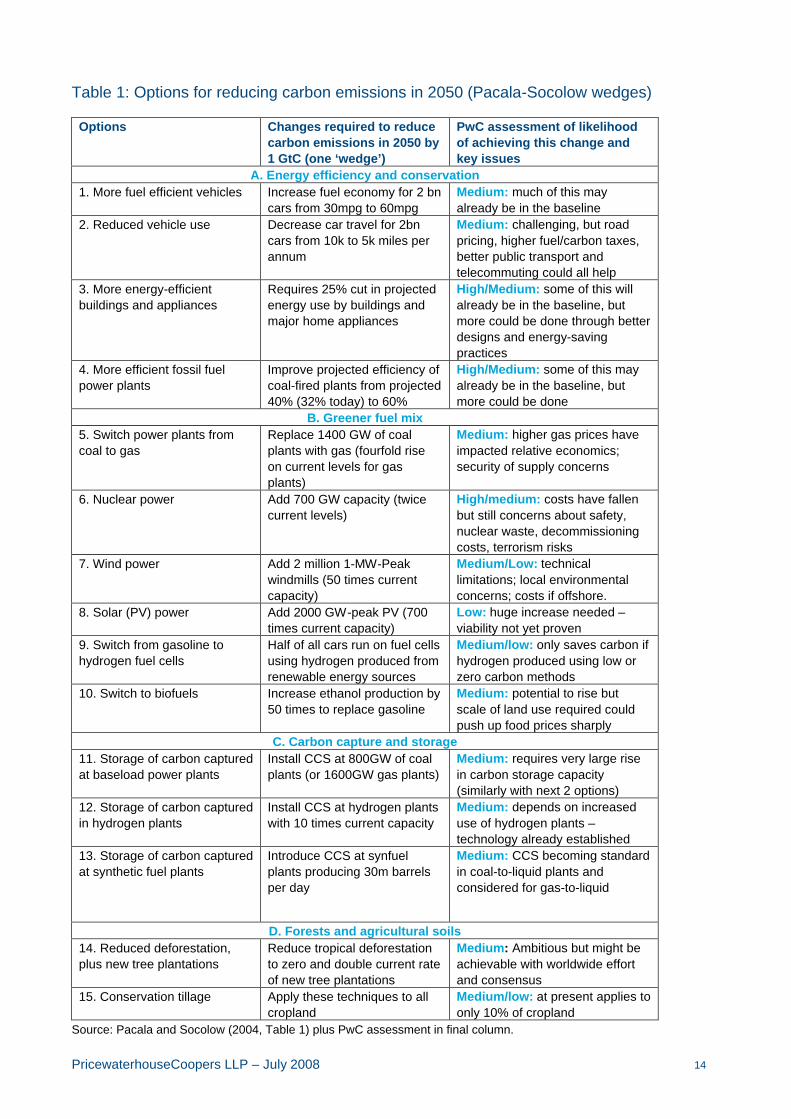
Technological feasibility, economic cost and required policy framework The Greener Growth + CCS scenario is certainly challenging, but still seems technologically feasible in the context of the scope for emissions reductions indicated by earlier studies such as those by Pacala and Socolow (2004) and the IEA (2006), which were based on applying currently known technologies. Table 1 below summarises the 15 one gigatonne of carbon (GtC) ‘wedges’ identified by Pacala and Socolow, with the final column adding our assessment of the scale of the challenge in practice. New technologies not included in Table 1 might also be expected to play a significant role by 2050, although such developments are clearly impossible to forecast with any precision and there will be considerable time lags in introducing any such innovations on a broad global scale.
PricewaterhouseCoopers LLP – July 2008 14
Table 1: Options for reducing carbon emissions in 2050 (Pacala-Socolow wedges)
Options Changes required to reduce carbon emissions in 2050 by 1 GtC (one ‘wedge’)
PwC assessment of likelihood of achieving this change and key issues
A. Energy efficiency and conservation 1. More fuel efficient vehicles Increase fuel economy for 2 bn
cars from 30mpg to 60mpg Medium: much of this may already be in the baseline
2. Reduced vehicle use Decrease car travel for 2bn cars from 10k to 5k miles per annum
Medium: challenging, but road pricing, higher fuel/carbon taxes, better public transport and telecommuting could all help
3. More energy-efficient buildings and appliances
Requires 25% cut in projected energy use by buildings and major home appliances
High/Medium: some of this will already be in the baseline, but more could be done through better designs and energy-saving practices
4. More efficient fossil fuel power plants
Improve projected efficiency of coal-fired plants from projected 40% (32% today) to 60%
High/Medium: some of this may already be in the baseline, but more could be done
B. Greener fuel mix 5. Switch power plants from coal to gas
Replace 1400 GW of coal plants with gas (fourfold rise on current levels for gas plants)
Medium: higher gas prices have impacted relative economics; security of supply concerns
6. Nuclear power Add 700 GW capacity (twice current levels)
High/medium: costs have fallen but still concerns about safety, nuclear waste, decommissioning costs, terrorism risks
7. Wind power Add 2 million 1-MW-Peak windmills (50 times current capacity)
Medium/Low: technical limitations; local environmental concerns; costs if offshore.
8. Solar (PV) power Add 2000 GW-peak PV (700 times current capacity)
Low: huge increase needed – viability not yet proven
9. Switch from gasoline to hydrogen fuel cells
Half of all cars run on fuel cells using hydrogen produced from renewable energy sources
Medium/low: only saves carbon if hydrogen produced using low or zero carbon methods
10. Switch to biofuels Increase ethanol production by 50 times to replace gasoline
Medium: potential to rise but scale of land use required could push up food prices sharply
C. Carbon capture and storage 11. Storage of carbon captured at baseload power plants
Install CCS at 800GW of coal plants (or 1600GW gas plants)
Medium: requires very large rise in carbon storage capacity (similarly with next 2 options)
12. Storage of carbon captured in hydrogen plants
Install CCS at hydrogen plants with 10 times current capacity
Medium: depends on increased use of hydrogen plants – technology already established
13. Storage of carbon captured at synthetic fuel plants
Introduce CCS at synfuel plants producing 30m barrels per day
Medium: CCS becoming standard in coal-to-liquid plants and considered for gas-to-liquid
D. Forests and agricultural soils 14. Reduced deforestation, plus new tree plantations
Reduce tropical deforestation to zero and double current rate of new tree plantations
Medium: Ambitious but might be achievable with worldwide effort and consensus
15. Conservation tillage Apply these techniques to all cropland
Medium/low: at present applies to only 10% of cropland
Source: Pacala and Socolow (2004, Table 1) plus PwC assessment in final column.
PricewaterhouseCoopers LLP – July 2008 15
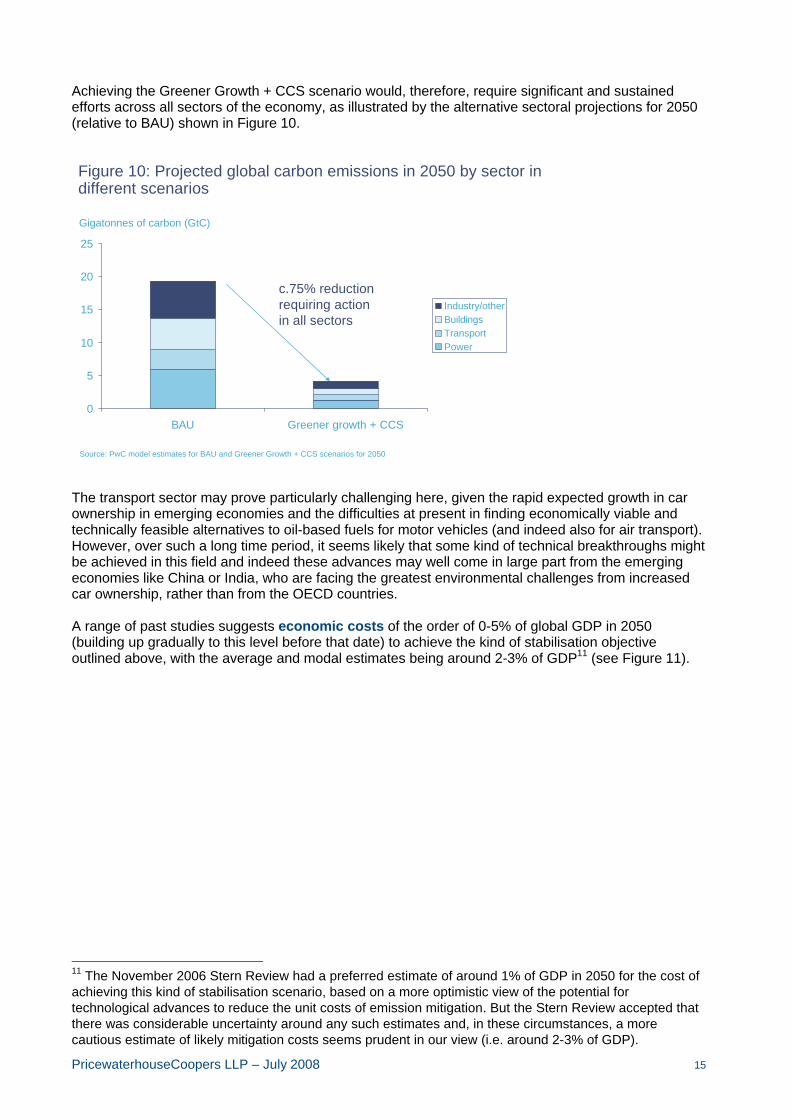
Achieving the Greener Growth + CCS scenario would, therefore, require significant and sustained efforts across all sectors of the economy, as illustrated by the alternative sectoral projections for 2050 (relative to BAU) shown in Figure 10.
Figure 10: Projected global carbon emissions in 2050 by sector in different scenarios
0
5
10
15
20
25
BAU Greener growth + CCS
Industry/otherBuildingsTransportPower
Source: PwC model estimates for BAU and Greener Growth + CCS scenarios for 2050
Gigatonnes of carbon (GtC)
c.75% reductionrequiring actionin all sectors
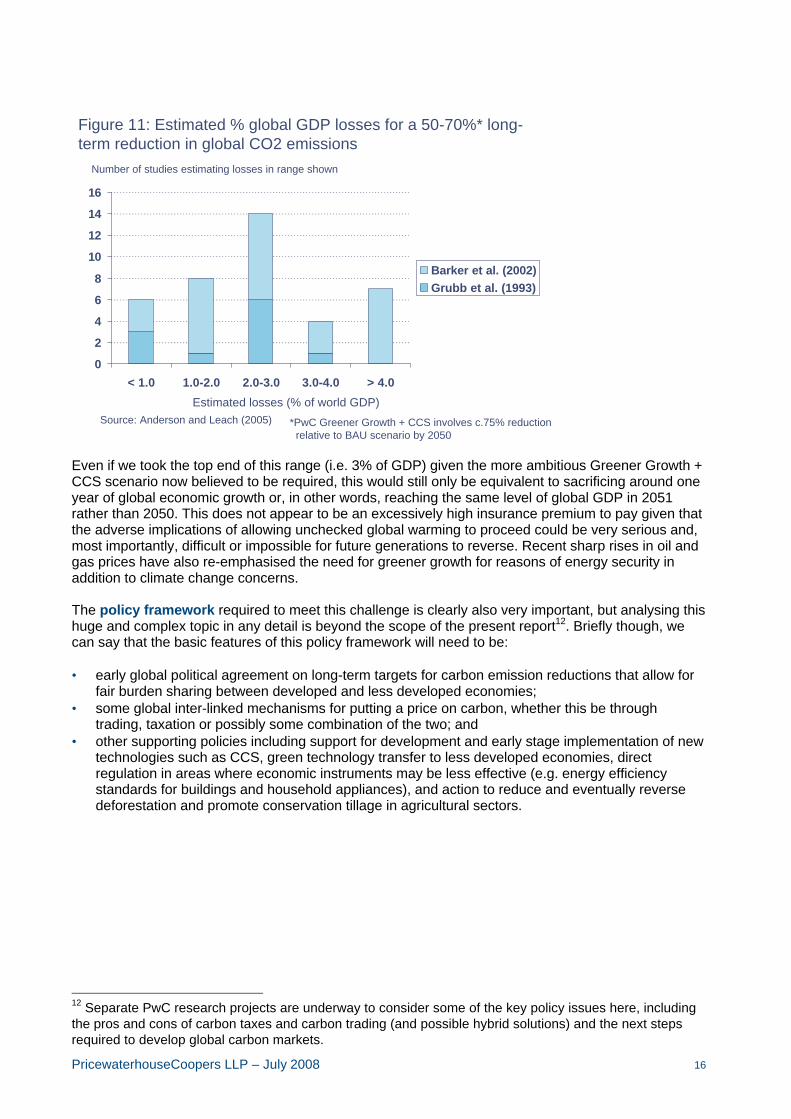
The transport sector may prove particularly challenging here, given the rapid expected growth in car ownership in emerging economies and the difficulties at present in finding economically viable and technically feasible alternatives to oil-based fuels for motor vehicles (and indeed also for air transport). However, over such a long time period, it seems likely that some kind of technical breakthroughs might be achieved in this field and indeed these advances may well come in large part from the emerging economies like China or India, who are facing the greatest environmental challenges from increased car ownership, rather than from the OECD countries. A range of past studies suggests economic costs of the order of 0-5% of global GDP in 2050 (building up gradually to this level before that date) to achieve the kind of stabilisation objective outlined above, with the average and modal estimates being around 2-3% of GDP11 (see Figure 11).
11 The November 2006 Stern Review had a preferred estimate of around 1% of GDP in 2050 for the cost of achieving this kind of stabilisation scenario, based on a more optimistic view of the potential for technological advances to reduce the unit costs of emission mitigation. But the Stern Review accepted that there was considerable uncertainty around any such estimates and, in these circumstances, a more cautious estimate of likely mitigation costs seems prudent in our view (i.e. around 2-3% of GDP).
PricewaterhouseCoopers LLP – July 2008 16
Figure 11: Estimated % global GDP losses for a 50-70%* long-term reduction in global CO2 emissions
0
2
4
6
8
10
12
14
16
< 1.0 1.0-2.0 2.0-3.0 3.0-4.0 > 4.0
Barker et al. (2002)Grubb et al. (1993)
Source: Anderson and Leach (2005)
Number of studies estimating losses in range shown
Estimated losses (% of world GDP)
*PwC Greener Growth + CCS involves c.75% reductionrelative to BAU scenario by 2050
Even if we took the top end of this range (i.e. 3% of GDP) given the more ambitious Greener Growth + CCS scenario now believed to be required, this would still only be equivalent to sacrificing around one year of global economic growth or, in other words, reaching the same level of global GDP in 2051 rather than 2050. This does not appear to be an excessively high insurance premium to pay given that the adverse implications of allowing unchecked global warming to proceed could be very serious and, most importantly, difficult or impossible for future generations to reverse. Recent sharp rises in oil and gas prices have also re-emphasised the need for greener growth for reasons of energy security in addition to climate change concerns. The policy framework required to meet this challenge is clearly also very important, but analysing this huge and complex topic in any detail is beyond the scope of the present report12. Briefly though, we can say that the basic features of this policy framework will need to be: • early global political agreement on long-term targets for carbon emission reductions that allow for
fair burden sharing between developed and less developed economies; • some global inter-linked mechanisms for putting a price on carbon, whether this be through
trading, taxation or possibly some combination of the two; and • other supporting policies including support for development and early stage implementation of new
technologies such as CCS, green technology transfer to less developed economies, direct regulation in areas where economic instruments may be less effective (e.g. energy efficiency standards for buildings and household appliances), and action to reduce and eventually reverse deforestation and promote conservation tillage in agricultural sectors.
12 Separate PwC research projects are underway to consider some of the key policy issues here, including the pros and cons of carbon taxes and carbon trading (and possible hybrid solutions) and the next steps required to develop global carbon markets.

PricewaterhouseCoopers LLP – July 2008 17
5. Conclusions Our analysis in this article re-emphasises the scale of the challenge posed by global warming, which actually now seems even greater than at the time of our original report two years ago due in particular to higher projected economic growth in China and India. The other key development has been the further sharp rise in oil and gas prices since 2006, which has re-emphasised that the current global energy model may not be sustainable in the long term. We conclude in this paper that global carbon emissions from energy use in a ‘business as usual’ scenario would more than double by 2050, whereas what is required to reduce the risks of adverse climate change to acceptable levels is a reduction in global carbon emissions to only around half of current levels by that date. For the advanced G7 economies, this requires a reduction in carbon emissions by around 80% relative to current levels by 2050. For the E7 emerging economies, it involves mitigating the growth of emissions up to around 2020 and then aiming for reductions in emissions after that date, initially at a gradual rate but ultimately at a more rapid rate as lower cost green technologies are introduced in these countries. Despite the scale of the challenge, the analysis continues to reject the pessimistic ‘Malthusian’ conclusion that resource constraints and environmental concerns will derail global economic growth in a major way. We have outlined a ‘Greener Growth + CCS’ scenario that we consider to be highly challenging politically, but which appears to be technologically feasible without excessive economic cost, provided that action is taken early enough across a broad range of fronts. This needs to encompass increased energy efficiency, greater use of renewable energy sources and nuclear power, carbon capture and storage and other low carbon technologies and techniques, as well as reducing deforestation. Higher oil and gas prices should help to incentivise the move to greater energy efficiency and use of renewables, although it has also highlighted other issues such as the trade-off between increased biofuels production and affordable food. All sectors of the economy need to achieve major carbon emission reductions as part of this process. We estimate that the costs of achieving the emission reductions indicated in the chart above would be broadly equivalent to sacrificing only around a year of global GDP growth between now and 2050 (i.e. reaching the same level of GDP in 2051 as might otherwise have happened in 2050). The key requirement now is for governments in all of the major economies to demonstrate their joint political will to establish a policy framework that aims to put a global price on carbon emissions and so send the economic signals to private sector investors and consumers needed to deliver the new technologies and changes in behaviour required to combat global warming. The EU has taken a lead on this with its emissions trading scheme. The US, in particular, needs to take more of a role going forward given its status as the world’s largest economy. Only then can emerging but still relatively low income countries like China and India be expected to follow the lead of the richer nations. Progress on this agenda has been relatively slow over the two years since we wrote our first report: it needs to speed up considerably if the challenge of global warming is to be met. Given the long time lags inherent both in introducing low carbon technologies and infrastructure and in changes in carbon emissions feeding through into climate change, there is no room for further delay in taking co-ordinated global action on this issue.

PricewaterhouseCoopers LLP – July 2008 18
Annex: Technical description of long-term economic growth model In line with mainstream economic growth theory since the late 1950s13, we assume that output can be modelled using a Cobb-Douglas production function with constant returns to scale and constant factor shares. Specifically output (i.e. GDP, which we denote below as Y) is given by the following equation: Y = AKaL1-a Where: A = total factor productivity, which is determined by technological progress in the leading country (here assumed to be the US) plus a country-specific catch-up factor related to the initial productivity gap versus the US a = the share of capital in total national income and so (1-a) is the share of labour, both of which are assumed constant over time in this model K = the physical capital stock, which grows according to the standard formula:
Kt = Kt-1 (1-d) + It where: d = the depreciation rate; It = gross investment in year t L = the quality-adjusted input of labour, which can be broken down into: L = h(s)eN
where: h(s) is a quality adjustment related to the average years of school education of the working age population; e is the employment rate defined as a share of the working age population; and N is the number of people of working age.
Key assumptions The key parameter assumptions we make in the baseline scenario are that: • The parameters a and d are set at 1/3 and 5% respectively, in line with the values used in many
past academic studies. • The catch-up rate of A is assumed to converge to 1.5% per annum for all of the E7 economies in
the long run, in line with the typical 1-2% estimate found in past academic studies. In the shorter term, however, catch-up speeds are lower at around 0.5-1% per annum for emerging economies that we judge to have some way to go before they achieve political, economic and institutional frameworks that are fully supportive of growth convergence. In particular, we assume a catch-up speed of only 0.5% per annum up to 2020 for India, Brazil and Indonesia and 1% per annum for Mexico and Turkey. China and Russia are assumed to have higher productivity catch-up speeds in the short to medium term, reflecting recent strong performance in these economies.
• Initial capital stock estimates (K) for the mid-1980s were updated to 2006 using data on investment to GDP ratios from the Penn World Tables (v. 6.1) and the IMF. These investment (I/Y) ratios were then projected forward assuming recent trends continue up to 2010, followed by a slow convergence to around 20% from 2025 onwards, with the exception of China (25%) and Indonesia (22%).
• Initial estimates of average education levels (s) were projected forward based on a continuation of trends over the past 5-20 years (using judgement as to what to take as the appropriate reference period in each case).
13 This general approach was introduced by Robert Solow. A similar modelling approach was taken by Wilson and Purushothaman (2003) in Goldman Sachs’ well known BRICs analysis.

PricewaterhouseCoopers LLP – July 2008 19
• The working age population projections (N) are the central case from the 2006-based United Nations (UN) projections for 15-59 year olds. Employment rates (e) are assumed to be constant over time.
Exchange rate projections Purchasing power parity (PPP) exchange rates14 are assumed to remain constant over time in real terms, while market exchange rates converge gradually over time to these levels in the very long term. Since we focus in this paper only on results for GDP at PPP rates as the key driver of energy demand, however, the details of how this market exchange rate convergence process is modelled do not need to concern us here.
14 Initial estimates of GDP at PPPs were taken from the World Bank (2007).

PricewaterhouseCoopers LLP – July 2008 20
References Anderson, D., and M. Leach (2005), ‘The costs of mitigating climate change’, World Economics, Vol. 6, No.3, July-September 2005: 71-90. Barker, T., J. Koehler and M. Villena (2002), ‘The costs of greenhouse gas abatement: a meta-analysis of post-SRES mitigation scenarios’, Environmental Economics and Policy Studies, Vol. 5, 2002: 135-166. Intergovernmental Panel on Climate Change (2007), Fourth Assessment Report, Cambridge University Press. IEA (2006), Energy Technology Perspectives: Scenarios and Strategies to 2050 (Paris: International Energy Agency/OECD Publications). Pacala, S. and R. Socolow (2004), ‘Stabilization Wedges: Solving the Climate Problem for the Next 50 Years with Current Technologies’, Science, Vol. 305, 13 August 2004. Stern, N. (2006), The Economics of Climate Change, HM Treasury. United Nations (2007), World Population Prospects: The 2006 Revision. Wilson, D., and R. Purushothaman (2003), ‘Dreaming with BRICs: The Path to 2050’, Goldman Sachs, Global Economics Paper No. 99, October 2003. World Bank (2007), World Development Indicators database and 2005 International Comparison Program - Preliminary Results, 17 December 2007. Other relevant PricewaterhouseCoopers economic research The World in 2050: How big will the major emerging economies get and how can the OECD compete? (March 2006) The World in 2050: Implications of global growth for carbon emissions and climate change policy (September 2006) Which are the largest city economies in the world and how might this change by 2020? (Article in UK Economic Outlook, March 2007) Banking in 2050: How big will the emerging markets get? (June 2007) Emerging markets: Balancing risk and reward – the PricewaterhouseCoopers EM20 index (July 2007, with an updated report being published in late June 2008) Consumer Markets beyond Shanghai (September 2007). The World in 2050: Beyond the BRICs – a broader look at emerging market growth prospects (March 2008)

PricewaterhouseCoopers LLP – July 2008 21
PricewaterhouseCoopers PricewaterhouseCoopers (www.pwc.com) provides industry-focused assurance, tax and advisory services to build public trust and enhance value for its clients and their stakeholders. More than 146,000 people in 150 countries across our network share their thinking, experience and solutions to develop fresh perspectives and practical advice. “PricewaterhouseCoopers” refers to the network of member firms of PricewaterhouseCoopers International Limited, each of which is a separate and independent legal entity. Economics This report was written by John Hawksworth, Head of Macroeconomics in the PricewaterhouseCoopers LLP economics group in London, with research assistance from Gordon Cookson. Helpful comments were provided by Tim Ogier, Richard Gledhill, Mark Hughes and Michael Hurley. In addition to macroeconomic analysis of the kind contained in this report, our Economics practice provides a wide range of services covering competition and regulation issues, litigation support, bids and business cases, public policy and project appraisals, financial economics, brand economics, the economics of sustainability and business forecasting. For more details about these economics services, please visit our website (www.pwc.co.uk/economics) or contact: Tim Ogier Partner, Economics +44 (0)20 7804 5207 [email protected]
Thomas Hoehn Partner, Economics +44 (0)20 7804 0872 [email protected]
John Hawksworth Head of Macroeconomics +44 (0)20 7213 1650 [email protected]
Energy, climate change and sustainability For more information about our experience and wide range of services in the energy, climate change and sustainability areas, please contact: Richard Gledhill Climate change and [email protected] carbon markets Mark Hughes Power generation [email protected] Michael Hurley Oil and gas [email protected] Erica Hauver Sustainability [email protected] Geoff Lane Sustainability [email protected] Andrew Smith Sustainability [email protected] John Manning Environmental tax [email protected] and regulation David Clayton Environmental tax [email protected] This publication (and any extract from it) must not be copied, redistributed or placed on any website without PricewaterhouseCoopers’ prior written consent.

pwc.co.uk/economics
© 2008 PricewaterhouseCoopers LLP. All rights reserved. "PricewaterhouseCoopers" refers to PricewaterhouseCoopers LLP (a limited liability partnership incor-porated in England). PricewaterhouseCoopers LLP is a member firm of PricewaterhouseCoopers International Limited.