Embed Size (px)
Citation preview

By Karen Ward
A new economic world order is emerging at extraordinary speed
This publication broadens our list of the worldrsquos top 30 economies to the top 100
The underlying theme is that the economies we currently call ldquoemergingrdquo are going to power
global growth over the next four decades
Our update tells the story of the emergence of parts of Africa the rise of some of the central Asian
republics as well as some startling advances for countries such as the Philippines and Peru
Disclosures and Disclaimer This report must be read with the disclosures and analyst
certifications in the Disclosure appendix and with the Disclaimer which forms part of it
The World in 2050From the Top 30 to the Top 100
Global Economics
January 2012

1
Economics Global 11 January 2012
abc
When we published lsquoThe World in 2050rsquo a year ago (4 January 2011) we gave a projection for the Top
30 economies by size in 2050 from a pool of the largest 40 economies today This update casts a wider
net and seeks to identify the Top 100 economies by size A larger universe increases competition for the
Top 30 and allows us to consider the lsquonew emergersrsquo in the coming decades
Our ranking is based on an economyrsquos current level of development and the factors that will determine
whether it has the potential to catch up with more developed nations These fundamentals include current
income per capita rule of law democracy education levels and demographic change allowing us to
project forward GDP to 2050 We assume that policymakers will continue to make progress in addressing
economic flaws and that they avoid wars and remain open to global trade and capital Of course some of
our bold assumptions may not turn out to be accurate We highlight the following
The striking rise of the Philippines which is set to become the worldrsquos sixteenth-largest economy up 27
places from today
Peru could sustain average growth of 55 for four decades and jump 20 places to twenty-sixth Chile is
another star performer in Latin America
Massive demographic change in 2050 there will be almost as many people in Nigeria as in the United
States and Ethiopia will have twice as many people as projected in the UK or Germany The population of
many African countries will double Pakistan will have the sixth-largest population in the world Even if
some of these countries remain relatively poor on a per-capita basis they could see a dramatic increase in
the size of their economies thanks to population growth
By contrast the Japanese working population looks set to contract by 37 and the Russian one by 31
The eurozone faces similar problems with working population declines of 29 in Germany 24 in
Portugal 23 in Italy and 11 in Spain adding a whole new perspective to the sovereign debt crisis
From the Top 30 to the Top 100
Attention will increasingly turn to the lsquonew emergersrsquo as the world
economy undergoes a seismic shift
Demographics to play a crucial role helping parts of Africa finally
emerge from economic obscurity

2
Economics Global 11 January 2012
abc
It is not just about population Ukraine is set to jump 19 places to fortieth because of its education system
and rule of law even though its population is set to fall to 36m from 45m
We divide the Top 100 into three categories 1) fast growth ndash with expected average annual growth of
more than 5 2) growth ndash with expected annual growth of between 3 and 5 and 3) stable ndash those
countries expected to expand less than 3 a year
We identify 26 fast-growth countries They share a very low level of development but have made great
progress in improving fundamentals As they open themselves to the technology available elsewhere they
should enjoy many years of lsquocopy and pastersquo growth ahead Besides China India the Philippines and
Malaysia this category includes Bangladesh the central Asian countries of Uzbekistan Kazakhstan and
Turkmenistan Peru and Ecuador in Latin America and Egypt and Jordan in the Middle East
The growth category extends to 43 countries It includes 11 Latin American countries such as Brazil
Argentina Chile El Salvador Costa Rica and the Dominican Republic Turkey Romania and the Czech
Republic in central and eastern Europe as well as the war-ravaged Iraq and Yemen
Africa will finally start to emerge from economic obscurity Five of our fast-growth countries come from
Sub-Saharan Africa and three are in the growth category
Most of the economies in our lsquostablersquo group are in the developed world The West is not getting poorer
but high levels of income per capita and weak demographics will limit growth It is the small-population
ageing economies in Europe that are the big relative losers seeing the biggest moves down the table
Our Top 30 list changes slightly Our forecasts for the countries considered in the original document
have not changed but after expanding the pool of countries considered Peru the Philippines and
Pakistan leapfrog into the Top 30 Pakistan makes it into the top league less because of individual
prosperity than because of population size
This research strengthens the conclusions of the original report which found that 19 of the top 30
economies will be countries that are currently lsquoemergingrsquo Our update shows that it is not just the likes of
China and India that will be powering global growth over the next four decades Countries as varied as
Nigeria Peru and the Philippines will also be playing a significant part
1 Global growth will be powered by the emerging markets
0 0
1 0
2 0
3 0
4 0
1 97 0s 19 80s 1990 s 200 0s 20 10s 202 0s 2030s 2 040 s
0 0
1 0
2 0
3 0
4 0
De ve loped Markets Em erging m ark ets Globa l
C on trib utions to g lob al gro wth
Source HSBC estimates
3
Economics Global 11 January 2012
abc
Visual summary 2 Who will deliver the fastest growth en route to 2050 List order based on size of economy in 2050
ChinaIndia
PhilippinesEgypt
MalaysiaPeru
BangladeshAlgeriaUkraineVietnam
UzbekistanTanzania
KazakhstanEcuadorEthiopia
Sri LankaAzerbaijan
KenyaBoliviaJordanUgandaGhana
ParaguayTurkmenistan
HondurasSerbia
Fast growth
BrazilMexicoTurkeyRussia
IndonesiaArgentina
Saudi ArabiaThailand
IranColombiaPakistan
ChileVenezuela
NigeriaRomania
Czech RepublicHungaryKuwait
MoroccoLibya
New ZealandDominican Republic
SyriaTunisia
GuatemalaLebanon
Slovak RepublicOmanAngola
Costa RicaBelarus
IraqPanamaCroatia
El SalvadorCameroonBulgariaBahrain
LithuaniaBosnia and Herzegovina
LatviaYemenCyprus
Growth
United StatesJapan
GermanyUnited Kingdom
FranceCanada
ItalySouth Korea
SpainAustralia
NetherlandsPoland
SwitzerlandSouth Africa
AustriaSwedenBelgium
SingaporeGreeceIsraelIreland
United Arab EmiratesNorwayPortugalFinland
DenmarkCubaQatar
UruguayLuxembourg
Slovenia
Stable
Source HSBC estimates
4
Economics Global 11 January 2012
abc
3 The economic league table in 2050
______ Size of economy in_______ __________ Income per capita in ___________ ____Population _____ 2010
Bn Constant 2000 USD
2050 Bn Constant
2000 USD
Change in rank
2010 Constant
2000 USD
Rank 2050 Constant
2000 USD
Rank 2010
Mn
2050
Mn
1 China 3511 25334 2 2579 63 17759 54 1362 1426 2 United States 11548 22270 -1 36354 6 55134 8 318 404 3 India 960 8165 5 790 88 5060 86 1214 1614 4 Japan 5008 6429 -2 39435 3 63244 4 127 102 5 Germany 2058 3714 -1 25083 18 52683 10 82 71 6 United Kingdom 1711 3576 -1 27646 11 49412 14 62 72 7 Brazil 921 2960 2 4711 52 13547 61 195 219 8 Mexico 688 2810 5 6217 42 21793 47 111 129 9 France 1496 2750 -3 23881 20 40643 21 63 68 10 Canada 892 2287 0 26335 15 51485 12 34 44 11 Italy 1124 2194 -4 18703 23 38445 23 60 57 12 Turkey 385 2149 6 5088 49 22063 46 76 97 13 South Korea 798 2056 -2 16463 25 46657 17 49 44 14 Spain 711 1954 -2 15699 26 38111 24 45 51 15 Russia 412 1878 2 2934 58 16174 56 140 116 16 Philippines 112 1688 27 1215 83 10893 72 93 155 17 Indonesia 274 1502 4 1178 85 5215 85 233 288 18 Australia 565 1480 -4 26244 16 51523 11 22 29 19 Argentina 428 1477 -2 10517 33 29001 38 41 51 20 Egypt 160 1165 15 3002 57 8996 76 84 130 21 Malaysia 146 1160 17 5224 47 29247 37 28 40 22 Saudi Arabia 258 1128 1 9833 34 25845 43 26 44 23 Thailand 187 856 6 2744 61 11674 68 68 73 24 Netherlands 439 798 -9 26376 14 45839 18 17 17 25 Poland 250 786 -1 6563 39 24547 45 38 32 26 Peru 85 735 20 2913 59 18940 53 29 39 27 Iran 161 732 7 2138 72 7547 81 75 97 28 Colombia 142 725 12 3052 56 11530 69 46 63 29 Switzerland 294 711 -9 38739 4 83559 3 8 9 30 Pakistan 111 675 14 657 92 2455 91 174 275 31 Bangladesh 78 673 17 482 95 3461 89 149 194 32 Chile 103 592 12 6083 43 29513 36 17 20 33 Venezuela 158 558 2 5438 46 13268 63 29 42 34 Algeria 76 538 14 2190 70 11566 70 35 47 35 South Africa 187 529 -8 3710 54 9308 75 50 57 36 Austria 222 520 -11 26455 13 61124 6 8 9 37 Nigeria 78 515 9 506 94 1323 98 158 390 38 Sweden 295 507 -20 31778 8 47941 15 9 11 39 Belgium 265 481 -18 24758 19 41842 20 11 11 40 Ukraine 45 462 19 987 86 12818 65 45 36 41 Vietnam 59 451 11 674 91 4335 88 88 104 42 Singapore 165 441 -11 34110 7 84405 2 5 5 43 Greece 161 424 -11 14382 29 38756 22 11 11 44 Israel 168 402 -14 21806 22 37731 25 7 11 45 Ireland 147 386 -9 27965 10 61363 5 5 6 46 Romania 56 377 9 2596 62 20357 51 21 19 47 United Arab Emirates 118 360 -6 25607 17 29651 35 8 12 48 Norway 199 352 -22 40933 2 59234 7 5 6 49 Czech Republic 76 342 0 7225 38 32153 32 10 11 50 Portugal 123 336 -10 11588 31 35863 28 11 9
Source World Bank UN population projections and HSBC estimates Note China includes Hong Kong and Macao given full unification is planned for 2047 and 2049 Income per capita forecasts are not the cumulative sum of the forecasts for income per capita presented later in the document This is because the GDP created by the working population must be shared between the population as a whole not just the working population
5
Economics Global 11 January 2012
abc
3 The economic league table in 2050 (continued)
______ Size of economy in_______ __________ Income per capita in ___________ ____Population _____ 2010
Bn Constant 2000 USD
2050 Bn Constant
2000 USD
Change in rank
2010 Constant
2000 USD
Rank 2050 Constant
2000 USD
Rank 2010 Mn
2050 Mn
51 Uzbekistan 25 314 22 893 87 8859 77 27 35 52 Hungary 58 295 1 5833 44 31966 33 10 9 53 Tanzania 16 288 34 382 97 2085 92 45 138 54 Kazakhstan 38 287 7 2376 68 13520 62 16 21 55 Kuwait 61 280 -4 23072 21 54183 9 3 5 56 Morocco 58 279 -2 1781 75 7110 82 32 39 57 Finland 145 270 -19 27151 12 49643 13 5 5 58 Denmark 172 265 -29 31418 9 47743 16 5 6 59 Libya 49 230 -2 7692 37 26182 42 6 9 60 New Zealand 64 214 -10 14939 28 37705 26 4 6 61 Dominican Republic 37 212 1 3697 55 16406 55 10 13 62 Ecuador 24 206 14 1771 76 10546 73 14 20 63 Ethiopia 17 196 23 201 100 1352 97 83 145 64 Syria 28 181 2 1397 78 5470 84 20 33 65 Sri Lanka 25 175 7 1233 81 7558 80 21 23 66 Azerbaijan 20 168 14 2303 69 14482 59 9 12 67 Kenya 18 163 16 452 96 1683 95 41 97 68 Tunisia 29 160 -3 2805 60 12686 66 10 13 69 Guatemala 26 152 1 1858 73 4826 87 14 32 70 Lebanon 27 148 -2 6342 41 31659 34 4 5 71 Bolivia 12 145 25 1192 84 8652 78 10 17 72 Slovak Republic 44 145 -12 8042 36 27639 39 5 5 73 Oman 30 138 -10 10779 32 36832 27 3 4 74 Angola 24 134 1 1313 80 3170 90 19 42 75 Costa Rica 23 124 3 5043 50 20588 50 5 6 76 Belarus 25 122 -2 2556 65 15207 57 10 8 77 Cuba 49 121 -19 4370 53 12202 67 11 10 78 Iraq 23 117 -1 743 89 1410 96 32 83 79 Qatar 54 112 -23 38466 5 43027 19 2 3 80 Jordan 15 112 9 2497 67 11317 71 6 10 81 Uganda 12 111 14 366 98 1179 99 33 94 82 Panama 20 110 -1 5732 45 21423 48 4 5 83 Croatia 28 105 -16 6396 40 27091 41 4 4 84 El Salvador 16 104 4 2566 64 13729 60 6 8 85 Ghana 8 100 22 343 99 2035 94 24 49 86 Paraguay 9 99 17 1432 77 9587 74 6 10 87 Turkmenistan 9 97 15 1827 74 14659 58 5 7 88 Uruguay 30 93 -24 8942 35 25482 44 3 4 89 Honduras 10 82 11 1380 79 6337 83 8 13 90 Cameroon 14 79 1 694 90 2048 93 20 38 91 Serbia 9 75 13 1229 82 8565 79 10 9 92 Bulgaria 19 72 -10 2542 66 13154 64 7 5 93 Luxembourg 26 68 -24 52388 1 96592 1 1 1 94 Slovenia 26 66 -23 12577 30 32971 31 2 2 95 Bahrain 13 61 -3 16968 24 33910 29 1 2 96 Lithuania 17 59 -12 5154 48 20955 49 3 3 97 Bosnia amp Herzegovina 8 56 10 2162 71 18961 52 4 3 98 Latvia 11 52 0 4973 51 27143 40 2 2 99 Yemen 13 45 -8 565 93 731 100 24 62 100 Cyprus 12 45 -7 15510 27 33337 30 1 1
Source World Bank UN population projections and HSBC estimates Income per capita forecasts are not the cumulative sum of the forecasts for income per capita presented later in the document This is because the GDP created by the working population must be shared between the population as a whole not just the working population
6
Economics Global 11 January 2012
abc
What makes economies grow Clearly this is a question Western policymakers are
grappling with right now If we step away from the
cyclicality there are two ways economies can grow
either add more people to the production line via
growth in the working population or make each
individual more productive
Let us start by considering individual productivity
As in the original framework we lean heavily on the
empirical work of Harvardrsquos Professor Robert Barro
(full details of the model can be found in the
Appendix) We back-tested the model on our
extended sample of countries and are pleased with
the actual outcome for growth relative to the
projections in the period of 2000 to 2010 (Chart 4)
The first set of variables Professor Barro highlighted
as crucial to driving growth in individual
productivity are those that drive lsquohuman capitalrsquo ndash
health education and fertility The second set of
variables determine the likelihood of fixed capital
investment to equip workers with tools and
technology These are rule of law (which
encompasses patent and property rights)
government interference democracy and monetary
control (which is proxied by the inflation rate)
Good foundations
Our framework considers what stage of development each
economy is at todayhellip
hellip and whether they have the potential and the fundamental
characteristics necessary to catch up with the developed world
Current growth rates play no role in these projections
4 Modelrsquos back-test does a surprisingly good job given the vast array of countries considered
-10
-5
0
5
10
15
US
Chi
na UK
Italy
Braz
ilS
Kor
eaM
exic
oN
ethe
rland
sR
ussi
aSw
eden
Belg
ium
Saud
i Ara
bia
Hon
g Ko
ngN
orw
ayTh
aila
ndG
reec
eVe
nezu
ela
Egyp
tC
olom
bia
Mal
aysi
aPo
rtuga
lPh
ilippi
nes
Chi
leN
iger
iaAl
geria
New
Viet
nam
Mor
occo
Qat
arC
uba
Slov
akD
omin
ican
Uru
guay
Syria
Leba
non
Gua
tem
ala
Sri L
anka
Bela
rus
Ecua
dor
Cos
ta R
ica
Azer
baija
nBu
lgar
iaM
acao
Ethi
opia
El S
alva
dor
Trin
idad
and
Yem
enC
ypru
sBo
livia
Icel
and
Jam
aica
Para
guay
Moz
ambi
quG
hana
Bots
wan
a
Model Rate Actual rate
Source World Bank HSBC projections
7
Economics Global 11 January 2012
abc
Education
It is worth spending a moment discussing
education given its importance in the model
Whether individuals can adapt to the worldrsquos
given technology or even push the technology
frontier out depends on the level of education
5 Quality of education is most important but it is well correlated with time spent at school
300
400
500
600
5 6 7 8 9 10 11 12 13 14
300
400
500
600
Av erage y ears o f schooling
Qua
lity
of s
choo
ling
Source Barrolee dataset and PISA
Owing to data availability we focus on the
number of years of schooling This of course is
not a perfect metric since we would really want to
capture quality of education PISA (Programme
for International Student Assessment) is an
international study that aims to evaluate education
systems worldwide by testing the skills and
knowledge of 15-year-old students in certain
countries in reading maths and scientific literacy
This is plotted in Chart 5 alongside our measure of
education Quantity of schooling is a good but not
perfect proxy for quality of education For
example for nine and half years of education the
UK appears to do a much better job in gaining
results obtaining a PISA score of 500 against
Argentina which for a similar input scores just
395 For reference five of the top eight scoring
countries on this survey are in Asia
Democracy
Democracy is another variable worth discussing
given its controversy The success of democratic
systems is most likely explained by the freedom of
speech and creativity that leads to successful
entrepreneurs In addition they provide checks and
balances to ensure governments do not become
excessively powerful absorbing any improvement
in the countryrsquos prosperity for their own benefit
Democracy therefore is highly correlated with
our measure of rule of law (Chart 6)
6 Democracy does not always guarantee good rule of law
00
02
04
06
08
10
12
00 02 04 06 08 10
Democracy Index
Rul
e of
Law
Inde
x
M exico amp Brazil
China amp Saudi Arabia
Source Political Risk Services Freedom House Political Rights Index
But there are authoritarian regimes such as China
and Saudi Arabia that have delivered a good lsquorule of
lawrsquo In parts of Latin America democracy has done
little to improve rule of law Even in highly
democratic systems you can still see corruption
Professor Barrorsquos work actually showed that too
much democracy was not necessarily a good thing
for economic growth (of course it may be the best
model for social development) He found that at very
high levels of democracy income redistribution
becomes a dominant force which serves to restrain
entrepreneurial endeavour And democracy places a
disproportionate weight on winning current votes
potentially at the expense of future votes and
therefore can hinder the investment required for
long-term development
8
Economics Global 11 January 2012
abc
Many years of lsquocopy and pastersquo growth left
The most potent recipe for growth is a country
that scores highly on the fundamentals discussed
but currently has low income per capita These
economies should deliver the highest growth in
income per capita as they lsquocatch uprsquo with those
with similar fundamentals Economies with poor
governance and low education will remain stuck
in this low-income trap This has been the position
a number of African nations have found
themselves in for so long
As economies become wealthier and technology
more sophisticated they will gradually lose the
advantages of lsquostarting from behindrsquo The initial
years of development could be described as lsquocopy
and pastersquo growth as countries open themselves
up and adapt to the worldrsquos existing technologies
Of course various lsquoiron curtainsrsquo meant that many
economies did not open themselves up to either
the new technologies created in the Western
economies or the worldrsquos supply of capital until
recently
Once the lsquocopy and pastersquo growth is complete
countries will need to be sufficiently sophisticated
to operate at the lsquofrontierrsquo driving technological
change It is at this point that many economies
struggle and get stuck in what is often known as
the middle-income trap
But many of the countries we are considering are
still at such an extremely low level of
development that there are years of this lsquocopy and
pastersquo growth ahead
We think this is where many of the bears on
China are wrong One of the most commonly
cited reasons for concern about China is the high
rate of investment as a percentage of GDP Many
compare this rate of investment with the rates
seen during the expansion of Asian lsquotigersrsquo in the
1970s and claim that it is too rapid and that
Chinarsquos policymakers must be pouring money
into unproductive investment (Chart 7)
7 Comparing China today with Japan or Korea in the 1970s is unfairhellip
0
10
20
30
40
50
China today Japan 1970 South Korea 1970
of GDP Inv es tment
Source World Bank
8 hellip because China is at a much lower level of development today than they were then
0
20
40
60
80
0 5 10 15 20 25
0
20
40
60
80
US Japan China
Share of employ ment w ithin primary industry
Real GDP per capita chained 1990 USD000s
Japan in
1970
China today
Source World Bank
But the starting point of comparison is wrong
because Chinarsquos level of development today is so
much lower than that of the Asian tigers before
their rapid expansion (Chart 8) It is for this
reason we believe the strong rate of investment is
entirely justified ndash providing China with much-
needed basic infrastructure
9
Economics Global 11 January 2012
abc
Demographic dividends Using this model to establish how productive each
individual will be we must consider now how
many individuals there will be
They may not flash up on our Bloomberg screens
once a month but demographics are an extremely
important driver of growth There are two effects
First and most straightforward it is generally
easier to produce more stuff when you have more
people on the production line The second impact
is a little more subtle and relates to the ratio of
working population to total population As
Stephen King discusses in lsquoLosing controlrsquo (2010
Yale University Press) when you have many
lsquoproducersrsquo but not many lsquodependentsrsquo the burden
on producers perhaps because of tax payments to
support the elderly and young are small and
therefore the rewards for effort are great
Therefore demographic burdens can in turn feed
back to individual productivity
9 Japanrsquos demographic downturn will have played a key role in its economic malaise
-5
0
5
10
15
20
1955 1965 1975 1985 1995 2005
-1
0
1
2
3
4
GDP grow th (LHS)Working population grow th (RHS)
Yr YrJapan
Source World Bank
Japan shows the economic perils of a declining
working population only too well While many
put Japanrsquos lost decades down to deleveraging
following the build-up of debt in the 1980s it
seems likely that it had at least as much to do with
the dramatic decline in working population
growth over the past 50 years (Chart 9)
As the projections for working population stand
demographics alone could explain a large part of
what are likely to be huge differences in economic
performance in the coming years Contrast Japan
and Russia whose working populations will shrink
by more than 1 per annum for the next four
decades with Nigeria whose working population
will rise by 3 per annum
But as we have explained population growth is
not itself enough to guarantee growth You need
the other foundations to ensure jobs are created for
these new entrants to the labour market So our
projections for total GDP build up using our
earlier forecasts for income per capita based on
the economic infrastructure and the number of
lsquocapitasrsquo - the change in working population As
we will see little progress is made in countries
without the right lsquoeconomic infrastructurersquo even if
their populations are growing
10
Economics Global 11 January 2012
abc
The fine print A few words on the technicalities and caveats of
the framework before we get into the results
As in the original report we are working in
constant price constant 2000 USD exchange
rate terms Further appreciation of emerging
market currencies against the USD will only
extend the conclusions of the report
The source of the data on economic infrastructure
is contained in Table 10 To get to our base case
projections we consider two scenarios The first
assumes the lsquoeconomic infrastructurersquo is fixed at
that evident today But to constrain these
economies on the assumption they will not make
any further improvements would be unfair For
example there is a clear trend that education
standards across the emerging world are improving
We then consider a second scenario in which we
assume that over the next 40 years all economies
reach the lsquooptimalrsquo economic infrastructure This is
the highest possible level of achievement from any
of the countries in our sample
The results of these two scenarios are shown in the
Appendix Our base-case scenario sits between
these two options Essentially each country gets
halfway to eliminating its imperfections
Economic snakes and ladders
Asia is the stand-out region ndash with a notable showing by the
Philippines
LATAM fares well with Peru emerging into the spotlight
Other strong performers include Egypt Nigeria Turkey and
Ukraine
10 Data description
Variable Description Source
Average years of male schooling The average number of years spent in education by males in 2010 (for this extension for many countries the distinction between male and female was not available and we have therefore taken average education across gender) In addition in a very limited number of countries the data was not available and therefore our regional specialists used their judgment to determine an appropriate proxy
wwwbarroleecom
Life expectancy The life expectancy of total population in 2008 natural log taken World Bank Fertility The number of births per woman in 2008 natural log taken World Bank Rule of law An index between 0 and 1 which measures the attractiveness of the investment climate based
on the level of law enforcement contract sanctity and property rights Data for 2009 Political Risk Services International Country Risk Guide
Government consumption Percentage of GDP accounted for by government consumption in 2008 World Bank Democracy index Indicator of political rights measures the right of all adults to vote and compete for public office
and to have a decisive vote on public policies Measured between 0 and 1 (full democracy) Freedom House Political Rights Index
Inflation rate CPI inflation ( year) average 2004-07 World Bank
11
Economics Global 11 January 2012
abc
We are clearly assuming governments continue to
improve the underlying economic infrastructure
implementing reform increasing education and so
forth and remain friendly with their neighbours
Of course this may turn out to be a rather
Panglossian view of government behaviour The
two scenarios in the Appendix provide some
guidance as to the sensitivity of the projections to
this underlying assumption that governments
continue to lsquodo the right thingrsquo
In addition our model will not capture all the
variables that dictate an economyrsquos potential
There may be idiosyncratic factors that mean a
country should feature more highly or indeed
lower down our economic league table
The variable that is most often debated is a
countryrsquos endowment of natural resources Surely
a country with a rich array of natural resources
should outperform those without This may well
be the case but not always We have often seen
countries rich in natural resources suffer from
lsquoDutch diseasersquo This is a situation in which the
capital inflows to exploit the domestic commodity
industry put upward pressure on the domestic
exchange rate which in turn damages other
industrial areas In addition the presence of natural
resources can also lead to an increase in corruption
and so the benefits of the natural wealth do little
for the population as a whole Therefore
empirically it is not absolutely clear that those rich
in natural resources should get a natural boost so
this is one variable we do not include and leave
readers to assess whether in their opinion a
country should feature higher in the table
There are numerous other variables that fall in this
list of needing further consideration such as
extreme religious fundamentalism and relations
with the rest of the world (eg Iran)
We should also highlight some potential caveats
to the demographic projections we are using
These estimates made by the UN take into
account current fertility rates and policy on
retirement and migration
But these working-age projections are subject to a
considerable degree of uncertainty The most
tricky is disease which could raise the mortality
rate or by contrast medical breakthroughs which
could lower it Immigration flows could also send
these projections wildly off course decreasing
prospects for one part of the world while boosting
prospects elsewhere The changes we are
highlighting in this document could give rise to a
great migration which has all sorts of
implications for border frictions The history of
the US is a case in point In the 1950s and early
60s there were demographic concerns about the
US But the 1965 Immigration and Naturalisation
Act saw a huge new wave of migrants which
coupled with a higher fertility rate among
migrants gave rise to a fresh demographic boost
Government policy could also throw these
projections wildly off course if incentives via the
tax system manage successfully to lift or reduce
the fertility rate
Therefore we emphasise this exercise is a starting
point for considering the long-term outlook and
should not be taken as our explicit forecast Our
regional economists will be able to provide more
accurate near-term forecasts taking into account
factors the model is unable to capture and cyclical
considerations
12
Economics Global 11 January 2012
abc
Developed world Countries in the developed world might be
considered to be at the technology lsquofrontierrsquo With
income per capita already high these economies do
not get any lsquocatch uprsquo boost so rely on the other
variables in the model (education rule of law etc)
for technological progress to deliver further gains
in individual prosperity
That said there are still large variations across the
developed world with real income per capita in
Portugal at just over USD115k compared with
USD37k in the US Those with similar economic
infrastructure to the US but with lower income per
capita will therefore get a lsquocatch uprsquo boost This
explains why the model provides higher income
per capita forecasts for the likes of Spain and
Greece (Table 12) which may seem implausible
given their current difficulties
12 Model projections for income per capita
2010-20 2020-30 2030-40 2040-50
Developed world Australia 18 20 21 22 Austria 27 26 25 24 Belgium 12 15 19 21 Canada 19 21 22 23 Denmark 06 11 15 18 Finland 16 18 19 21 France 12 15 18 21 Germany 21 22 23 24 Greece 31 30 29 29 Ireland 19 20 20 21 Italy 16 24 25 27 Japan 13 16 19 20 Luxembourg 16 16 16 17 Netherlands 13 16 19 21 New Zealand 29 27 26 26 Norway 05 11 15 17 Portugal 32 32 32 32 Spain 24 31 30 29 Sweden 05 11 16 19 Switzerland 26 24 22 21 United Kingdom 14 16 18 20 United States 06 11 15 18 Developed world avg 17 20 21 22
Source HSBC estimates
11 The lsquoeconomic infrastructurersquo today
GDP per capita
Average years male schooling
Life expectancy
Fertility (average
children per person)
Rule of law Government consumption
Democracy index
Inflation rate
Developed world Real USD Years Years Children Index Ratio to GDP Index Annual rate Australia 26244 121 81 19 09 017 10 28 Austria 26445 95 80 14 10 018 10 20 Belgium 24758 105 80 18 08 023 10 21 Canada 26355 113 80 16 09 019 10 16 Denmark 31418 101 78 18 10 026 10 21 Finland 27151 100 79 18 10 022 10 22 France 23881 105 81 19 08 023 10 15 Germany 25083 118 80 13 08 018 10 17 Greece 14382 106 79 15 08 017 10 28 Ireland 27965 116 78 21 10 016 10 15 Italy 18703 95 81 14 07 020 10 20 Japan 39435 115 82 13 08 018 10 00 Luxembourg 52388 101 81 16 10 015 10 20 Netherlands 26376 110 80 17 10 025 10 18 New Zealand 14939 127 80 22 09 019 10 28 Norway 40933 122 80 19 10 020 10 22 Portugal 11588 80 79 14 08 020 10 15 Spain 15699 103 81 14 08 019 10 22 Sweden 31778 115 81 19 10 026 10 18 Switzerland 38739 99 82 14 08 011 10 09 United Kingdom 27646 96 79 19 09 021 10 26 United States 36364 122 78 21 08 016 10 21 Developed world average 27200 108 81 17 09 019 10 19
Source wwwbarroleecom World Bank Political Risk Services International Country Risk Guide Freedom House Political Rights Index
13
Economics Global 11 January 2012
abc
The major headwind to growth in much of the
developed world stems from demographics This
is less of a problem for Australasia North
America the UK and Ireland which are all likely
to see population growth in the coming decades
By contrast the demographics in much of Europe
are challenging putting their debt problems into
an even more worrying light With debt levels
rising and the number of taxpayers falling it
becomes even harder to get the arithmetic to add
up Ironically Germany is one of the few
countries in the Eurozone not experiencing
funding difficulties but is in the worst structural
situation so far as demographics are concerned
Trying to get the debt arithmetic to add up for
Europe is a straightforward task compared with
Japan Japanrsquos gross debt to GDP now stands at
more than 200 and the number of people paying
taxes in the coming four decades will fall by 40
Adding the outlook for income per capita to the
number of lsquocapitasrsquo we see that with one
exception the developed world is not able to offer
more than 3 growth The lowest forecasts are
for Japan which fails to achieve more than 1
growth throughout the forecast horizon By
contrast the highest performer is New Zealand
14 Model projections for total GDP
2010-20 2020-30 2030-40 2040-50
Developed world Australia 24 23 25 26 Austria 27 19 19 21 Belgium 10 12 17 21 Canada 23 21 26 25 Denmark 05 08 11 20 Finland 11 14 19 19 France 11 14 16 21 Germany 17 11 14 17 Greece 29 26 22 21 Ireland 28 28 22 19 Italy 14 19 15 21 Japan 04 09 05 08 Luxembourg 28 22 23 25 Netherlands 11 12 15 22 New Zealand 34 30 29 29 Norway 09 13 15 21 Portugal 30 26 23 22 Spain 28 29 23 22 Sweden 04 13 17 21 Switzerland 26 20 20 23 United Kingdom 16 17 19 22 United States 11 14 19 21 Developed world avg 18 18 19 21
Source HSBC estimates
13 Demographic change between now and 2050
-50 0 50 100 150 200 250
JapanGermany
PortugalItaly
HungaryGreeceAustriaSpain
FinlandNetherlands
DenmarkBelgiumFrance
Sw itzerlandSw eden
UKNorw ayCanada
New ZealandUS
AustraliaIreland
Lux embourg
change in w orking population betw een now and 2050
Source UN population projections
14
Economics Global 11 January 2012
abc
Asia Many parts of Asia have extremely high standards of
education and rule of law Singapore and South
Korea of course being clear examples which would
explain why these economies have already seen such
rapid increases in income per capita Other countries
in the region have made enormous progress in
improving their economic infrastructure but are still
reasonably poor and therefore have great potential to
catch up Chinarsquos income per capita is currently just
7 that of the US Adding up the annual projections
shown in Table 16 we project Chinarsquos income per
capita to grow by more than 800 between now and
2050 This might seem an astonishing number But
keep in mind this base effect Despite this rapid
growth in 2050 Chinarsquos income per capita is still
just 32 that of the US We are only capturing part
of Chinarsquos development story here and the likelihood
is that these numbers turn out to be too conservative
rather than too optimistic The same is true of the
Philippines which looks set for a multi-decade run
of strong growth
16 Model projections for income per capita
2010-20 2020-30 2030-40 2040-50
Asia Azerbaijan 61 54 48 44 Bangladesh 36 44 50 55 China 65 57 51 46 India 40 45 48 51 Indonesia 30 37 42 47 Kazakhstan 59 52 47 43 South Korea 37 34 31 30 Malaysia 54 46 41 36 Pakistan 15 25 35 44 Philippines 61 56 52 48 Singapore 36 32 27 23 Sri Lanka 52 52 50 49 Thailand 37 40 41 42 Turkmenistan 61 55 49 45 Uzbekistan 67 60 55 51 Vietnam 47 49 52 55 Asia average 48 46 45 44
Source HSBC estimates
But being lsquopoorrsquo is not enough to guarantee growth
in income per capita The projections for Pakistan
demonstrate this Because of low scores for
schooling life expectancy rule of law and
democracy Pakistan has little potential for income
per capita to grow near term despite a low starting
point But given we assume governments will make
progress on some of these flaws so growth will start
to pick up in countries such as Pakistan and
Bangladesh
15 The lsquoeconomic infrastructurersquo today
GDP per capita
Average years male schooling
Life expectancy
Fertility (average
children per person)
Rule of law Government consumption
Democracy index
Inflation rate
Asia Real USD Years Years Children Index Ratio to GDP Index Annual rate Azerbaijan 2303 104 70 23 06 010 02 129 Bangladesh 482 58 66 23 04 006 03 78 China 2579 98 73 18 08 014 00 33 India 790 67 63 27 07 010 08 85 Indonesia 1178 62 70 22 05 008 08 76 Kazakhstan 2376 104 66 25 07 011 02 117 South Korea 16463 118 79 12 08 015 08 33 Malaysia 5224 101 74 26 07 012 05 27 Pakistan 657 56 67 40 05 009 02 138 Philippines 1215 90 72 31 04 010 05 51 Singapore 34110 91 80 13 08 010 03 31 Sri Lanka 1233 84 74 23 05 015 05 139 Thailand 2744 75 68 18 04 012 02 23 Turkmenistan 1827 104 65 25 07 009 00 78 Uzbekistan 893 104 68 26 07 017 00 78 Vietnam 674 64 74 21 07 006 00 128 Asia average 4220 84 71 23 06 011 03 78
Source wwwbarroleecom World Bank Political Risk Services International Country Risk Guide Freedom House Political Rights Index
15
Economics Global 11 January 2012
abc
From a demographic standpoint Asia is also a
reasonably mixed bag ndash this is where the shine
slightly comes off the China story since its one-
child policy of yester years will start to see the
working population decline from around 2020
Singapore and South Korea while not enforced
have also seen a staggering decline in fertility
rates in the past couple of decades which will see
their working populations also decline Singapore
has been exploring the possibility of reversing this
trend through an aggressive immigration policy
By contrast other parts of Asia ndash India Pakistan
the Philippines Bangladesh and Malaysia ndash all
have rapidly growing populations In 2050 the
population of Pakistan at roughly 290m will be
just shy of four times the population of the UK
Adding the forecasts for working population to
those of income per capita we get to projections
for total GDP growth in Table 18 There are some
truly remarkable hot spots in Asia China
continues to grow at a rapid pace although the
pace is expected to slow beyond 2020 as the
demographic drag starts to hinder overall GDP
growth Nevertheless we still expect average
GDP growth of more than 5 per annum for the
next 40 years The star performer however is the
Philippines where the combination of strong
fundamentals and powerful demographics gives
rise to an average growth rate of 7 for the
coming 40 years Central Asia is also interesting
Kazakhstan Turkmenistan and Uzbekistan all
perform extremely well in the context of this
model on the back of strong growth in a very
well-educated population The absence of
democracy however prevents these economies
reaching their full potential
18 Model projections for total GDP
2010-20 2020-30 2030-40 2040-50
Asia Azerbaijan 70 57 50 41 Bangladesh 55 55 56 55 China 67 55 44 41 India 57 56 55 52 Indonesia 43 43 43 45 Kazakhstan 61 58 49 40 South Korea 37 23 18 17 Malaysia 71 57 47 38 Pakistan 40 45 49 50 Philippines 84 73 66 58 Singapore 37 21 20 21 Sri Lanka 54 53 49 43 Thailand 40 38 38 40 Turkmenistan 77 64 56 45 Uzbekistan 82 69 61 50 Vietnam 57 53 51 48 Asia average 58 51 47 43
Source HSBC estimates
17 Demographic change between now and 2050
-50 0 50 100 150 200 250
S KoreaSingapore
ChinaThailand
Sri LankaVietnam
KazakhstanAzerbaijanIndonesia
UzbekistanTurkmenistan
BangladeshIndia
Malay siaPhilippines
Pakistan
change in w orking population betw een now and 2050
Source UN population projections
16
Economics Global 11 January 2012
abc
Central and South America The potential of economies in Latin America has
been unleashed in recent decades as they have
managed to tame the inflation that plagued their
economies for much of the 1970s and 1980s
(Table 19) It is remarkable to think that between
1986 and 1994 Brazil suffered several years of
inflation of over 500 Such has been the
turnaround in its economic management that it is
now imposing taxes on foreign investors to
prevent capital inflows Of course we are
assuming that inflation is prevented from ever
creeping back into the system Maintaining small
governments and low levels of debt will surely
help prevent these economies from returning to
their old ways
The level of schooling is high although many of
these economies score less highly on the metric of
rule of law than parts of Asia Greater efforts have
been made recently particularly in Brazil
20 Model projections for income per capita
2010-20 2020-30 2030-40 2040-50
Central and South America Argentina 24 26 27 28 Bolivia 56 52 49 46 Brazil 22 27 31 35 Chile 52 45 40 37 Colombia 30 33 36 38 Costa Rica 37 37 36 36 Cuba 23 30 34 37 Dominican Republic 36 37 37 37 Ecuador 49 48 47 45 El Salvador 39 40 41 41 Guatemala 08 16 24 33 Honduras 28 33 38 42 Mexico 21 39 37 36 Panama 35 34 34 33 Paraguay 48 48 46 45 Peru 54 49 45 41 Uruguay 25 27 28 30 Venezuela 14 20 25 30 Central and South American average
33 36 36 37
Source HSBC estimates
For these reasons the forecasts for income per
capita are not quite as high in many parts of Latin
America as in Asia Of course as discussed
earlier we are not accounting for the regionrsquos rich
endowment of natural resources
19 The lsquoeconomic infrastructurersquo today
GDP per capita
Average years male schooling
Life expectancy
Fertility (average
children per person)
Rule of law Government consumption
Democracy index
Inflation rate
Central and South America Real USD Years Years Children Index Ratio to GDP Index Annual rate Argentina 10517 93 73 22 04 013 08 79 Bolivia 1192 99 66 35 04 014 07 87 Brazil 4711 76 72 19 03 020 08 47 Chile 6083 102 79 19 08 011 10 81 Colombia 3052 77 72 24 03 016 07 56 Costa Rica 5043 87 79 20 06 013 10 102 Cuba 4370 106 79 15 05 032 00 81 Dominican Republic 3697 74 73 26 04 007 08 60 Ecuador 1771 81 75 26 04 011 07 53 El Salvador 2566 80 71 23 03 009 08 41 Guatemala 1858 48 70 41 03 009 07 70 Honduras 1380 75 72 33 03 017 07 81 Mexico 6217 91 75 21 03 011 08 48 Panama 5732 96 76 25 05 011 10 51 Paraguay 1432 85 72 30 03 011 07 70 Peru 2913 90 73 26 06 009 08 35 Uruguay 8942 86 76 20 04 011 10 77 Venezuela 5438 70 73 25 02 012 05 262 Central and South American average
4228 86 74 25 04 014 07 81
Source wwwbarroleecom World Bank Political Risk Services International Country Risk Guide Freedom House Political Rights Index
17
Economics Global 11 January 2012
abc
The demographic outlook for much of Central
South America is very strong particularly in the
smaller countries in the region Of the larger
economies Colombia and Peru stand out for
extremely high working population growth Indeed
at present the populations of Spain and Colombia
are very similar but by 2050 the working
population in Colombia could be 25 larger
Adding the forecasts for income per capita to
those of working population we obtain forecasts
for total GDP (Table 22) The star performer in
the region is Peru where the combination of
strong fundamentals and strong population growth
deliver average growth of 55 for the next 40
years Chile also does very well although
demographics are not quite as favourable as those
in Peru Bolivia Ecuador and Paraguay are also
strong performers although this is partly a
reflection of their low starting point They still lag
much of the region in the economic foundations
used in the model
22 Model projections for total GDP
2010-20 2020-30 2030-40 2040-50
Central and South America Argentina 34 33 31 27 Bolivia 79 69 59 52 Brazil 33 29 29 28 Chile 59 46 40 34 Colombia 45 42 41 40 Costa Rica 51 43 41 36 Cuba 20 22 20 29 Dominican Republic 51 46 42 39 Ecuador 65 57 52 46 El Salvador 51 50 48 45 Guatemala 43 45 46 46 Honduras 56 54 53 50 Mexico 33 44 35 31 Panama 53 46 40 37 Paraguay 70 64 60 52 Peru 69 60 50 42 Uruguay 30 29 29 28 Venezuela 31 32 33 33 Central and South American average
49 45 41 39
Source HSBC estimates
21 Demographic change between now and 2050
-50 0 50 100 150 200 250
CubaBrazilChile
UruguayMex ico
ArgentinaCosta Rica
ColombiaEcuador
DominicanPeru
ElSalv adorPanama
VenezuelaBoliv ia
ParaguayHonduras
Guatemala
change in w orking population betw een now and 2050
Source UN population projections
18
Economics Global 11 January 2012
abc
Central and Eastern Europe Central and Eastern European economies score less
highly than many of the other emerging markets for
inflation control and size of government
But when projecting real income per capita this is
more than compensated for by the exceptional
level of education which for most economies in
the region rivals that of the developed world And
yet while education rates are similar the average
income per capita in the Central and Eastern
Europe block is just one fifth that of the
developed world
For this reason in the context of this model these
economies have great scope to catch up in income
per capita and across the region the forecasts for
income per capita growth are extremely high
(Table 24)
24 Model projections for income per capita
2010-20 2020-30 2030-40 2040-50
Central and Eastern Europe Belarus 59 53 48 45 Bosnia amp Herzegovina 71 63 56 51 Bulgaria 48 47 45 45 Croatia 44 42 39 38 Cyprus 30 29 28 28 Czech Republic 53 45 40 36 Hungary 53 51 44 40 Latvia 56 49 44 40 Lithuania 43 41 39 38 Poland 40 39 38 37 Romania 67 62 54 48 Russia 51 48 46 44 Serbia 68 62 57 53 Slovak Republic 42 39 37 35 Slovenia 30 30 30 30 Turkey 40 39 38 37 Ukraine 89 73 63 56 CEE average 52 48 44 41
Source HSBC estimates
23 The lsquoeconomic infrastructurersquo today
GDP per capita
Average years male schooling
Life expectancy
Fertility (average
children per person)
Rule of law Government consumption
Democracy index
Inflation rate
Central and Eastern Europe Real USD Years Years Children Index Ratio to GDP Index Annual rate Belarus 2556 113 71 14 07 019 00 121 Bosnia and Herzegovina 2162 100 75 12 08 022 05 29 Bulgaria 2542 99 73 15 04 017 10 78 Croatia 6396 90 76 15 08 019 08 38 Cyprus 15510 101 80 15 08 019 10 25 Czech Republic 7225 121 77 15 08 020 10 34 Hungary 5833 117 74 14 07 010 10 61 Latvia 4973 108 72 15 08 017 08 97 Lithuania 5154 109 72 15 07 019 10 70 Poland 6563 99 76 14 08 019 10 35 Romania 2596 104 75 14 07 013 08 61 Russia 2934 97 67 15 07 017 02 116 Serbia 1229 100 74 13 06 020 10 90 Slovak Republic 8042 112 75 13 07 017 10 30 Slovenia 12577 89 79 15 08 017 10 34 Turkey 5088 70 71 21 08 013 05 85 Ukraine 987 111 68 14 07 018 07 180 CEE average 7000 104 74 15 07 018 08 70
Source wwwbarroleecom World Bank Political Risk Services International Country Risk Guide Freedom House Political Rights Index
19
Economics Global 11 January 2012
abc
It is just as well individuals will prove so productive
across the region because demographics are a major
headwind (Chart 25) In vast swathes of the region
the workforce looks set to shrink dramatically This
is largely because of the extremely low level of
fertility As discussed previously these forecasts for
population growth are subject to considerable
uncertainty Indeed in Russia last year an initiative
was launched to try and increase the fertility rate
with the incentive of land provided to couples
producing a third child
As things stand these weak demographics take the
shine slightly off the extremely strong growth in
income per capita Nevertheless the forecasts for
total GDP are still very impressive (Table 26) The
Ukraine is the outperformer with average growth
across the forecast horizon of 6 Again we have to
remember this is coming from an extremely low
base But nevertheless we expect the size of the
Ukrainian economy in constant price constant
exchange rates to increase tenfold by 2050
Some of the smaller Eastern European countries ndash
Romania the Czech Republic and Serbia ndash all do
extremely well particularly in the coming decade
before demographics prove to be more of a drag
And as in the original report we continue to
believe Turkey has an extremely strong long-term
story The combination of strong fundamentals
and the one country in the region with good
demographics should see Turkey maintain a very
respectable pace of growth throughout the
forecast horizon
26 Model projections for total GDP
2010-20 2020-30 2030-40 2040-50
Central and Eastern Europe Belarus 52 43 39 30 Bosnia amp Herzegovina 67 52 44 35 Bulgaria 36 37 33 28 Croatia 38 34 33 28 Cyprus 37 32 33 29 Czech Republic 46 44 36 27 Hungary 47 47 39 32 Latvia 48 42 38 29 Lithuania 34 30 31 29 Poland 33 32 31 21 Romania 61 57 43 35 Russia 42 40 40 33 Serbia 65 59 51 44 Slovak Republic 37 33 30 22 Slovenia 25 24 24 21 Turkey 53 47 40 35 Ukraine 79 63 55 42 CEE average 47 42 38 31
Source HSBC estimates
25 Demographic change between now and 2050
-50 0 50 100 150 200 250
BulgariaBosnia and Herzegovina
BelarusUkrainePoland
RomaniaLithuania
RussiaLatvia
SlovakiaCroatia
SloveniaSerbia
Czech RepublicCyprusTurkey
change in working population between now and 2050
Source UN population projections
20
Economics Global 11 January 2012
abc
Middle East and North Africa Our framework is able to provide some explanation
for the problems currently rocking many parts of
MENA High population growth poor education and
job prospects coupled with a lack of democracy are a
concoction that may explain the social unrest seen
during 2011 In the context of our model these
economies deliver average rates of growth in income
per capita
Being highly endowed with oil has managed to
ensure that income per capita in many of these
nations is already very high This model will
therefore penalise certain countries since it cannot
explain the current level of income per capita with
the variables it considers So we need to take
forecasts for economies such as Qatar with some
pinch of salt These economies may continue to
grow at a rapid pace despite any weakness in the
fundamentals for which our model is accounting
But clearly this source of wealth and the ability to
spread it fairly across the population is a major
source of contention now and will continue to be in
the future
28 Model projections for income per capita
2010-20 2020-30 2030-40 2040-50
Middle East and North Africa Algeria 42 43 43 43 Bahrain 34 30 28 25 Egypt 28 40 42 43 Iran 35 35 35 35 Iraq -06 09 23 37 Israel -03 13 17 21 Jordan 37 37 38 38 Kuwait 33 30 27 24 Lebanon 46 42 39 36 Libya 33 27 28 29 Morocco 31 31 37 42 Oman 24 25 25 25 Qatar 07 10 12 14 Saudi Arabia 20 22 24 26 Syria 22 29 35 41 Tunisia 40 41 42 42 United Arab Emirates 25 23 23 22 Yemen -24 -08 10 30 MENA average 20 24 27 30
Source HSBC estimates
27 The lsquoeconomic infrastructurersquo today
GDP per capita
Average years male schooling
Life expectancy
Fertility (average
children per person)
Rule of law Government consumption
Democracy index
Inflation rate
Middle East and North Africa Real USD Years Years Children Index Ratio to GDP Index Annual rate Algeria 2190 77 72 24 05 011 02 46 Bahrain 16968 96 76 23 08 014 03 32 Egypt 3002 88 70 29 06 011 02 131 Iran 2138 81 71 18 07 013 02 188 Iraq 743 58 68 41 03 023 02 80 Israel 21806 113 81 29 07 025 10 28 Jordan 2497 92 73 35 07 023 03 65 Kuwait 23072 63 78 22 08 014 05 67 Lebanon 6342 92 72 18 07 015 03 12 Libya 7692 79 74 27 07 011 00 64 Morocco 1781 50 71 24 08 018 03 22 Oman 10779 92 76 30 08 019 02 73 Qatar 38466 75 76 24 08 022 02 80 Saudi Arabia 9833 103 73 31 08 022 00 64 Syria 1350 53 74 32 08 011 00 75 Tunisia 2805 73 74 21 08 014 00 40 United Arab Emirates 25607 95 78 19 07 011 02 64 Yemen 565 37 63 52 03 016 03 102 MENA average 11158 77 73 29 07 017 03 79
Source wwwbarroleecom World Bank Political Risk Services International Country Risk Guide Freedom House Political Rights Index
21
Economics Global 11 January 2012
abc
The Middle East is one region where significant
immigration flows make forecasting the size of the
workforce difficult We have seen in the past decade
borders open and close according to ebbs and flows
in demand Nevertheless indigenous population
growth is strong across much of the region But
again we highlight that population growth is only a
good thing for an economy if all the other
foundations are strong This will ensure that these
new workers find jobs If the other fundamentals are
not there then young unemployed individuals
become frustrated which can be a recipe for social
unrest rather than progress
Overall there are lots of caveats to bear in mind
with regards to how this model might not
accurately capture the outlook for parts of the
Middle East In particular we think this
framework is underestimating the potential of
Israel and Qatar
Nevertheless the model does conform to our high
expectations for long-term growth in Egypt and
Saudi Arabia despite some of the near-term
challenges Similarly the outlook looks extremely
robust for Bahrain Jordan and the United Arab
Emirates
30 Model projections for total GDP
2010-20 2020-30 2030-40 2040-50
MENA Algeria 56 54 49 41 Bahrain 57 42 30 27 Egypt 47 56 52 48 Iran 45 44 38 28 Iraq 34 37 42 52 Israel 11 25 25 27 Jordan 59 58 48 42 Kuwait 54 44 31 26 Lebanon 57 45 40 33 Libya 53 43 34 27 Morocco 42 39 40 39 Oman 48 41 37 30 Qatar 21 21 18 13 Saudi Arabia 45 39 35 32 Syria 43 53 48 46 Tunisia 49 46 43 36 United Arab Emirates 47 35 22 09 Yemen 14 25 37 48 MENA average 42 40 36 33
Source HSBC estimates
29 Demographic change between now and 2050
-50 0 50 100 150 200 250
TunisiaLebanon
IranUAE
MoroccoAlgeria
QatarBahrain
Liby aIsrael
Kuw aitEgy ptOman
JordanSaudi Arabia
Sy riaIraq
Yemen
c hange in w orking population betw een now and 2050
Source UN population projections
22
Economics Global 11 January 2012
abc
Sub-Saharan Africa Africa has sadly been the lost continent for many
decades and many parts of the region are still riddled
with corruption civil war and disease Indeed
comparing the averages today for Africa to those of
Asia is disheartening Life expectancy of just 58
versus 71 in Asia and schooling of just 64 years
compared with 84 in Asia are important drawbacks
In addition inflation and a total lack of democracy is
a major problem for some countries
Average real income per capita in Africa is just 7
that of the US with people in many countries living
on less than a dollar a day But again being lsquopoorrsquo
or at a low level of development is not enough to
guarantee growth and for certain countries in the
region our model does not predict that income per
capita will rise significantly in the decade ahead
Countries such as Angola and Uganda appear stuck
in the poverty trap But by assuming governments
will improve these economic flaws we show the
potential for change only time will tell whether
governments are able to deliver on this
32 Model projections for income per capita
2010-20 2020-30 2030-40 2040-50
Africa Angola -03 10 21 32 Cameroon 06 18 29 40 Ethiopia 20 32 43 53 Ghana 31 39 46 52 Kenya 15 26 36 45 Nigeria 09 21 32 42 South Africa 11 19 26 33 Tanzania 36 42 46 50 Uganda -01 13 27 41 Africa average 21 28 35 42
Source HSBC estimates
Nevertheless there are bright spots where already
improvements have been made and the countries
may be turning a corner The model predicts
strongest growth in income per capita for
Tanzania and Ghana although again we are
coming from such an extraordinarily low base
31 The lsquoeconomic infrastructurersquo today
GDP per capita
Average years male schooling
Life expectancy
Fertility (average
children per person)
Rule of law Government consumption
Democracy index
Inflation rate
Africa Angola 1313 73 47 58 05 018 02 128 Cameroon 694 61 51 46 03 010 02 31 Ethiopia 201 61 55 53 08 010 03 234 Ghana 343 78 57 40 04 012 10 155 Kenya 452 73 54 49 03 018 05 151 Nigeria 506 73 48 57 03 018 05 95 South Africa 3710 86 51 25 04 019 08 86 Tanzania 382 73 56 56 08 016 05 98 Uganda 366 54 53 63 06 013 03 104 Africa average 1643 64 58 42 05 014 04 92
Source wwwbarroleecom World Bank Political Risk Services International Country Risk Guide Freedom House Political Rights Index
23
Economics Global 11 January 2012
abc
But the demographic story is extremely strong in
Africa (Chart 33) Indeed half the increase in the
worldrsquos population over the next 40 years will be
in Africa
For those countries that have at least reasonable
prospects for individual prosperity this should
give rise to strong growth in total GDP (Table
34) Again we are coming from a low base
Nigeria deserves a special mention The rapid
population growth in Nigeria means that by 2050
its population will be almost as large as that of the
United States The potential of this country is huge
if the government does manage to deliver the
change that belies these projections
Tanzania is also worth highlighting Again rapid
growth in the population will see it reach almost
140m in 2050 ndash almost twice that of the projection
in either the UK or Germany Given that the
fundamentals are already looking in reasonably
good shape we could see an explosion in growth in
this economy Again we are coming from a low
base ndash income per capita at the moment in
Tanzania in real terms is just USD382 We project
this will rise to only USD2085 by 2050 but given
the growth in the population this would still equate
to a 1700 increase in the size of the economy
Ethiopia so often making the headlines for
poverty and famine appears to be making
progress Indeed last year Ethiopia was one of
the fastest growing economies in the world
delivering more than 10 GDP growth We
forecast strong growth to continue although again
even in 2050 we see income per capita at just 2
that of the US
34 Model projections for total GDP
2010-20 2020-30 2030-40 2040-50
Africa Angola 33 40 48 53 Cameroon 33 44 49 54 Ethiopia 55 63 67 70 Ghana 59 65 66 68 Kenya 46 58 60 63 Nigeria 38 48 52 56 South Africa 16 24 31 35 Tanzania 70 78 76 74 Uganda 43 56 63 68 Africa average 46 51 52 53
Source HSBC estimates
33 Demographic change between now and 2050
-50 0 50 100 150 200 250
SouthAfrica
Cameroon
Nigeria
Ghana
Keny a
Ethiopia
Angola
Tanzania
Uganda
c hange in w orking population betw een now and 2050
Source UN population projections
24
Economics Global 11 January 2012
abc
Putting it all together Considering all these economies we can separate
them into the following three groups (Table 35)
Fast growth ndash gt5 average growth to 2050
The fast-growth economies are those that are at a
low level of development but which have
sufficiently strong underlying fundamentals so that
they catch up with more developed economies with
similarly strong fundamentals
We have already discussed China and India which
sit firmly at the top of this group Elsewhere in Asia
the Philippines Malaysia Bangladesh and Vietnam
all look very strong
In Latin America Peru is the star performer in the
region given it starts from a lower level of
development than some of its counterparts in the
region coupled with strong demographics Many of
the smaller CEEMEA economies also sit here
particularly those with fantastic rates of education
and a good rule of law despite poor demographics
In the Middle East despite near-term uncertainty we
think Egypt has good long-term prospects
Growth ndash 3 lt growth lt5
The lsquogrowthrsquo group are also set to outperform many
of the developed world economies In Asia we
highlight Indonesia and Thailand within this group
and Pakistan owing to the sheer size of working
population Latin America dominates this group of
lsquogrowthrsquo countries Brazil Colombia and Mexico
look very strong and remain firmly in our group of
Top 30 economies in 2050
Stable ndash growth lt3
The stable group of countries offer more limited
growth prospects These largely include the high-
growth ageing economies in the developed world
of which Europe fares particularly badly As
discussed growth in Israel Qatar and UAE may be
underestimated in this model
Conclusions and risks
lsquoRapid growthrsquo is expected by those with a low starting point but
strong fundamentals ndash the Philippines Egypt Peru and Ukraine
lsquoGrowthrsquo economies have strong prospects but a higher starting
point Mexico Turkey Saudi Arabia and Nigeria stand out
A lsquostablersquo group largely the developed world has more limited
potential for growth
25
Economics Global 11 January 2012
abc
35 Which countries will deliver the fastest growth en route to 2050 List ordered based on size of economy in 2050
ChinaIndia
PhilippinesEgypt
MalaysiaPeru
BangladeshAlgeriaUkraineVietnam
UzbekistanTanzania
KazakhstanEcuadorEthiopia
Sri LankaAzerbaijan
KenyaBoliviaJordanUgandaGhana
ParaguayTurkmenistan
HondurasSerbia
Fast growth
BrazilMexicoTurkeyRussia
IndonesiaArgentina
Saudi ArabiaThailand
IranColombiaPakistan
ChileVenezuela
NigeriaRomania
Czech RepublicHungaryKuwait
MoroccoLibya
New ZealandDominican Republic
SyriaTunisia
GuatemalaLebanon
Slovak RepublicOmanAngola
Costa RicaBelarus
IraqPanamaCroatia
El SalvadorCameroonBulgariaBahrain
LithuaniaBosnia and Herzegovina
LatviaYemenCyprus
Growth
United StatesJapan
GermanyUnited Kingdom
FranceCanada
ItalySouth Korea
SpainAustralia
NetherlandsPoland
SwitzerlandSouth Africa
AustriaSwedenBelgium
SingaporeGreeceIsraelIreland
United Arab EmiratesNorwayPortugalFinland
DenmarkCubaQatar
UruguayLuxembourg
Slovenia
Stable
Source HSBC estimates
26
Economics Global 11 January 2012
abc
Rose-tinted spectacles We openly admit that behind these projections we
assume governments build on their recent progress
and remain solely focused on increasing the living
standards for their populations Of course this may
be an overly glossy way of viewing the world and
we conclude there are a number of reasons our
lsquoWorld in 2050rsquo could turn out a little different
We consider the main culprits below
Resource constraints
Our calculations have focused on the human
potential of the world economy paying no
attention to the physical constraints of the world
we live in those that are becoming more evident
by the day leading to upward pressure on many
commodity prices
In a follow-up report entitled Energy in 2050 (22
March 2011) we mapped our GDP forecasts into
energy forecasts This exercise certainly gave rise
to some fairly worrying numbers Chart 36 shows
the results for the top 3 economies we consider If
we were in a world of unlimited resources
consumption would explode as the emerging
consumers start to develop a taste for cars and
other energy-hungry domestic appliances Clearly
for our lsquoWorld in 2050rsquo to materialise we need to
change the way we use energy What is
comforting however is that even constraining
ourselves to the technology that we know exists
today it is possible to find a solution that
combines energy efficiency and a move towards
more renewable sources of energy But this does
require major government and industrial foresight
Creating the incentives for all players to change is
the biggest hurdle Rising energy prices are the
most obvious catalyst It seems more likely
change will occur to avoid the cost of high energy
prices rather than a change for the greater good or
even for the potential benefit of children 40 years
down the line
The energy constraint may be another reason why
the emerging world outperforms the cash-strapped
West Starting with a blank sheet of paper and
having governments with borrowing capacity to
deliver change may see these economies
overcome these constraints more quickly than the
cash-strapped West
But our lsquoEnergy in 2050rsquo report also highlighted
that climate change is a major concern Indeed it
is much easier to overcome the energy constraint
than it is to do so while meeting carbon emission
36 We need to use energy more efficiently to reach this potential
0 1000 2000 3000 4000 5000 6000 7000 8000
India
China
US
Today 2050 consumption if resources werent constrained
Total energy use (Million tonnes of oil equiv alent)
Source HSBC estimates
27
Economics Global 11 January 2012
abc
targets In that report we provide a map of
regions most vulnerable to climate change which
is another variable that should be taken into
account when considering an economyrsquos long-
term future
Omitted variables
We have already discussed that our model cannot
capture all the variables that will dictate an
economyrsquos potential We have used a one-size-
fits-all model to provide a very clear and
transparent framework for thinking about
development By starting to tinker with the
projections based on judgment you essentially
create a list based on opinion Instead we chose to
leave the reader to consider idiosyncratic factors
requiring further consideration that mean a
country should feature more highly or indeed
lower down our economic league table
Cyclical fluctuations
Our model is a structural model that should
determine the potential supply of the economy
There are cyclical factors that can cause economies
to deviate from this long-term path For example
it may be that the use of credit had taken the
developed world above its sustainable path and the
slow growth of the past few years is the
readjustment to the long-term sustainable path
Similarly many emerging economies in the past
few years have been growing stronger than our
projections and were encountering inflationary
pressures and thus required policy action to return
the pace of growth to something more sustainable
Border barriers and war
The biggest danger is that the open borders which
have delivered so much prosperity are closed It is
hard to see how such a wave of protectionism
could benefit an individual economy and certainly
not the system as a whole But politiciansrsquo
motivation tends to be focused on the next election
rather than long-term growth As such bad politics
is a key risk to these projections And of course
trade wars can be followed by real wars which
would obviously set this rather glossy outlook way
off track Civil wars are another potential risk in
certain countries
28
Economics Global 11 January 2012
abc
A major shake-up in world order This extension reinforces the findings from our
original 2050 report Plenty of places in the world
look set to deliver very strong rates of growth But
they are not in the developed world which faces
both structural and cyclical headwinds They are
in the emerging world You can see this in action
by viewing the video of which a snapshot is
available on the following page
In the original report we highlighted the
extraordinary prospects for the likes of China
India Malaysia Mexico Colombia and Turkey
These economies themselves are still at an early
stage of development and continue to offer
fantastic growth prospects But increasingly
attention will turn to the lsquonew emergersrsquo Countries
such as the Philippines Peru and Nigeria all
demonstrate some combination of favourable
demographics and strong fundamentals that should
see a significant rise in their economic size
And so there are likely to be some major changes
in the economic league table between now and
2050 with countries such as the Philippines
jumping as many as 27 places (Table 37) The
losers are the small population ageing economies
of Europe Such change may seem remarkable but
it is not abnormal Table 38 ranks the economies
by size today and shows how this rank has
changed in the past four decades China India and
South Korea have already shown excellent lsquoleap-
frog abilityrsquo The relative decline of countries in
Europe that we forecast is an ongoing extension
of a trend already in place
37 Major change may seem unthinkable but such large shifts are common in history
Order based on size of economy in 2010
(constant 2000 USD)
Rank change since 1970
1 United States 0 2 Japan 0 3 China 14 4 Germany -1 5 United Kingdom -1 6 France -1 7 Italy -1 8 India 7 9 Brazil 0 10 Canada -3 11 South Korea 12 12 Spain -4 13 Mexico -3 14 Australia -2 15 Netherlands -4 16 Argentina -3 17 Russia Not available 18 Turkey 2 19 Sweden -5 20 Switzerland Not available
Source World Bank HSBC
We conclude that the world has great potential to
grow in the coming decades but that growth will
not stem from the developed world The EM story
is only just beginning As the lsquonew emergersrsquo
come to the fore emerging economies offer great
potential to power the global economy to 2050
Econom
ics G
lobal 11 January 2012
29
ab
c
We have created a video that tracks the growth in GDP across the various countries through time The chart above shows the final frame of this video
The length of the bars indicates the cumulative percentage increase in GDP for each country relative to 2010 The colour of the bars shows the level of GDP So for example a
long red bar implies that a country has a large GDP and a high rate of GDP growth
Visit httpcachecantoscomflashhsba-r061GDP_growth_2050-WMVwmv to watch how the growth rates for the different countries change between 2010 and 2050
30
Economics Global 11 January 2012
abc
This page has been left blank intentionally
31
Economics Global 11 January 2012
abc
Appendix
32
Economics Global 11 January 2012
abc
Barrorsquos growth model A1 The model
Variable Coefficients
Log GDP -0018 Male schooling 0002 Log GDP schooling -0004 Log life expectancy 0044 Log fertility -0016 Government consumption ratio -0136 Rule of law index 0029 Democracy index 0090 Democracy index squared -0088 Inflation rate -0043
Source Barro with HSBC adjustment to schooling
We made two amendments to Barrorsquos original
model First we lowered slightly the convergence
rate in line with more recent literature (see OECD
2001)
Second it appeared that the original model was
overstating the impact of education In Barrorsquos
original model an extra year of schooling raises
GDP growth by 12ppt Those with very high
levels of education such as Germany were
forecast to grow much more quickly than they
achieved And countries such as India with very
low levels of education were barely forecast to
grow at all However recalibrating the model to
lower the impact of education produced
remarkably accurate forecasts for such a simple
model The main areas of failure are in Asia
where the region in the early part of the 2000-10
period was still recovering from the Asian crisis
In the following tables we show the details of the
two scenarios that we use to build up to our lsquobase
casersquo The first assumes that governments make
no progress in improving their economic
infrastructure The second assumes that
governments make complete progress bring their
economic infrastructure steadily up to those best
in class in each category such as level of
education Our base case sits between these two
scenarios Essentially each country gets halfway
to improving its imperfections
The model
Model projections for the universe under consideration
-10
-5
0
5
10
15
US
Chi
na UK
Italy
Braz
ilS
Kor
eaM
exic
oN
ethe
rland
sR
ussi
aSw
eden
Belg
ium
Saud
i Ara
bia
Hon
g Ko
ngN
orw
ayTh
aila
ndG
reec
eVe
nezu
ela
Egyp
tC
olom
bia
Mal
aysi
aPo
rtuga
lPh
ilippi
nes
Chi
leN
iger
iaAl
geria
New
Viet
nam
Mor
occo
Qat
arC
uba
Slov
akD
omin
ican
Uru
guay
Syria
Leba
non
Gua
tem
ala
Sri L
anka
Bela
rus
Ecua
dor
Cos
ta R
ica
Azer
baija
nBu
lgar
iaM
acao
Ethi
opia
El S
alva
dor
Trin
idad
and
Yem
enC
ypru
sBo
livia
Icel
and
Jam
aica
Para
guay
Moz
ambi
quG
hana
Bots
wan
a
Model Rate Actual rate
Source World Bank and HSBC estimates using Barrorsquos amended model
33
Economics Global 11 January 2012
abc
Scenario 1 Income per capita forecasts if governments make no progress in improving economic infrastructure
2010-20 2020-30 2030-40 2040-50
Algeria 42 38 34 30 Angola -03 -02 -02 -02 Argentina 25 20 16 13 Australia 19 15 13 11 Austria 27 22 18 15 Azerbaijan 61 49 39 31 Bahrain 34 28 23 19 Bangladesh 36 35 34 33 Belarus 59 45 35 27 Belgium 11 10 08 07 Bolivia 56 46 38 31 Bosnia and Herzegovina
71 58 48 39
Brazil 23 18 14 11 Bulgaria 48 39 32 26 Cameroon 06 06 05 05 Canada 19 16 14 12 Chile 52 42 34 27 China 66 52 43 35 Colombia 30 25 21 17 Costa Rica 37 32 27 23 Croatia 44 37 32 27 Cuba 25 20 16 12 Cyprus 30 24 19 16 Czech Republic 53 39 29 21 Denmark 06 05 04 04 Dominican Republic 36 32 29 27 Ecuador 49 44 38 34 Egypt 35 40 34 29 El Salvador 39 34 30 27 Ethiopia 20 19 18 17 Finland 15 13 11 09 France 12 10 08 07 Germany 21 18 15 13 Ghana 31 27 24 22 Greece 30 26 21 17 Guatemala 08 08 08 08 Honduras 28 25 23 20 Hungary 59 44 33 25 India 41 35 30 26 Indonesia 31 26 22 18 Iran 62 52 42 35 Iraq -05 -05 -05 -05 Ireland 16 17 14 12 Israel -01 10 09 08 Italy 21 18 14 12 Japan 12 11 10 09 Jordan 37 31 26 22 Kazakhstan 59 47 38 30 Kenya 15 14 13 12 Kuwait 34 32 30 29
Source HSBC estimates
Scenario 1 Income per capita forecasts if governments make no progress in improving economic infrastructure (cont)
2010-20 2020-30 2030-40 2040-50
Latvia 56 44 34 27 Lebanon 46 39 33 28 Libya 27 24 21 19 Lithuania 43 33 26 20 Luxembourg 16 13 10 08 Malaysia 54 44 36 29 Mexico 36 31 26 21 Morocco 25 25 25 25 Netherlands 12 11 10 08 New Zealand 29 21 15 10 Nigeria 09 08 07 07 Norway 04 06 07 06 Oman 24 21 17 15 Pakistan 15 15 15 14 Panama 35 29 24 20 Paraguay 48 42 36 32 Peru 54 46 39 33 Philippines 61 52 44 38 Poland 41 33 27 22 Portugal 32 29 25 22 Qatar 09 08 07 06 Romania 71 57 46 37 Russia 51 42 35 29 S Korea 39 29 24 19 Saudi Arabia 19 16 14 11 Serbia 68 56 45 37 Singapore 42 32 27 23 Slovak Republic 42 32 25 19 Slovenia 30 26 22 19 South Africa 11 09 07 05 Spain 29 25 20 17 Sri Lanka 52 46 40 35 Sweden 05 06 06 06 Switzerland 26 21 17 14 Syria 22 22 22 21 Tanzania 36 32 30 27 Thailand 38 32 27 23 Tunisia 40 36 33 30 Turkey 40 34 29 25 Turkmenistan 61 49 39 31 Uganda -01 -01 -01 -01 UK 13 11 09 07 Ukraine 87 68 52 41 United Arab Emirates 25 21 17 14 Uruguay 25 22 19 16 US 05 07 07 07 Uzbekistan 67 54 43 34 Venezuela 14 11 08 05 Vietnam 44 42 39 37 Yemen -24 -25 -26 -27
Source HSBC estimates
34
Economics Global 11 January 2012
abc
Scenario 2 Income per capita forecasts if governments make complete progress in improving economic infrastructure catching up with best in class
2010-20 2020-30 2030-40 2040-50
Algeria 42 50 56 60 Angola -03 24 48 69 Argentina 25 31 37 42 Australia 19 24 28 31 Austria 27 30 32 34 Azerbaijan 61 58 56 55 Bahrain 34 33 32 32 Bangladesh 36 56 72 85 Belarus 59 58 59 61 Belgium 11 21 29 35 Bolivia 56 58 59 61 Bosnia and Herzegovina
71 67 64 62
Brazil 23 35 47 57 Bulgaria 48 54 58 63 Cameroon 06 33 58 79 Canada 19 25 30 34 Chile 52 49 46 45 China 66 60 58 57 Colombia 30 41 50 58 Costa Rica 37 43 47 52 Croatia 44 46 48 50 Cuba 25 39 50 61 Cyprus 30 34 37 40 Czech Republic 53 49 46 46 Denmark 06 17 26 33 Dominican Republic 36 43 48 52 Ecuador 49 54 58 60 Egypt 35 38 48 56 El Salvador 39 47 54 59 Ethiopia 20 47 72 92 Finland 15 23 28 33 France 12 21 28 35 Germany 21 28 32 36 Ghana 31 52 70 84 Greece 30 35 38 41 Guatemala 08 28 48 65 Honduras 28 43 56 67 Hungary 59 53 50 49 India 41 54 66 74 Indonesia 31 48 62 74 Iran 62 61 59 59 Iraq -05 26 56 83 Ireland 16 24 27 30 Israel -01 14 25 34 Italy 21 29 35 40 Japan 12 21 27 32 Jordan 37 44 50 54 Kazakhstan 59 56 55 54 Kenya 15 41 63 82 Kuwait 34 32 30 28
Source HSBC estimates
Scenario 2 Income per capita forecasts if governments make complete progress in improving economic infrastructure catching up with best in class (cont)
2010-20 2020-30 2030-40 2040-50
Latvia 56 53 51 51 Lebanon 46 46 46 46 Libya 27 33 39 44 Lithuania 43 47 50 54 Luxembourg 16 19 22 25 Malaysia 54 49 46 43 Mexico 36 41 45 47 Morocco 25 42 56 68 Netherlands 12 22 29 35 New Zealand 29 32 34 36 Nigeria 09 36 60 80 Norway 04 16 23 28 Oman 24 29 34 38 Pakistan 15 39 61 79 Panama 35 40 43 47 Paraguay 48 54 58 61 Peru 54 53 52 52 Philippines 61 61 61 60 Poland 41 44 48 51 Portugal 32 37 41 45 Qatar 09 14 20 26 Romania 71 65 61 58 Russia 51 54 57 60 S Korea 39 37 39 40 Saudi Arabia 19 28 34 40 Serbia 68 68 68 69 Singapore 42 30 26 23 Slovak Republic 42 44 46 49 Slovenia 30 35 39 43 South Africa 11 30 46 60 Spain 29 34 37 40 Sri Lanka 52 59 63 66 Sweden 05 17 26 33 Switzerland 26 26 27 27 Syria 22 40 55 68 Tanzania 36 52 66 77 Thailand 38 47 55 62 Tunisia 40 48 54 59 Turkey 40 44 47 49 Turkmenistan 61 59 58 57 Uganda -01 30 60 87 UK 13 21 27 32 Ukraine 87 77 71 68 United Arab Emirates 25 27 29 30 Uruguay 25 33 40 46 US 05 17 24 29 Uzbekistan 67 66 66 66 Venezuela 14 29 42 53 Vietnam 44 59 71 79 Yemen -24 13 53 91
Source HSBC estimates
35
Economics Global 11 January 2012
abc
Notes
36
Economics Global 11 January 2012
abc
Notes
37
Economics Global 11 January 2012
abc
Notes
38
Economics Global 11 January 2012
abc
Disclosure appendix Analyst Certification The following analyst(s) economist(s) andor strategist(s) who is(are) primarily responsible for this report certifies(y) that the opinion(s) on the subject security(ies) or issuer(s) andor any other views or forecasts expressed herein accurately reflect their personal view(s) and that no part of their compensation was is or will be directly or indirectly related to the specific recommendation(s) or views contained in this research report Karen Ward Nick Robins and Zoe Knight
Important Disclosures This document has been prepared and is being distributed by the Research Department of HSBC and is intended solely for the clients of HSBC and is not for publication to other persons whether through the press or by other means
This document is for information purposes only and it should not be regarded as an offer to sell or as a solicitation of an offer to buy the securities or other investment products mentioned in it andor to participate in any trading strategy Advice in this document is general and should not be construed as personal advice given it has been prepared without taking account of the objectives financial situation or needs of any particular investor Accordingly investors should before acting on the advice consider the appropriateness of the advice having regard to their objectives financial situation and needs If necessary seek professional investment and tax advice
Certain investment products mentioned in this document may not be eligible for sale in some states or countries and they may not be suitable for all types of investors Investors should consult with their HSBC representative regarding the suitability of the investment products mentioned in this document and take into account their specific investment objectives financial situation or particular needs before making a commitment to purchase investment products
The value of and the income produced by the investment products mentioned in this document may fluctuate so that an investor may get back less than originally invested Certain high-volatility investments can be subject to sudden and large falls in value that could equal or exceed the amount invested Value and income from investment products may be adversely affected by exchange rates interest rates or other factors Past performance of a particular investment product is not indicative of future results
Analysts economists and strategists are paid in part by reference to the profitability of HSBC which includes investment banking revenues
For disclosures in respect of any company mentioned in this report please see the most recently published report on that company available at wwwhsbcnetcomresearch
HSBC Legal Entities are listed in the Disclaimer below
Additional disclosures 1 This report is dated as at 11 January 2012 2 All market data included in this report are dated as at close 05 January 2012 unless otherwise indicated in the report 3 HSBC has procedures in place to identify and manage any potential conflicts of interest that arise in connection with its
Research business HSBCs analysts and its other staff who are involved in the preparation and dissemination of Research operate and have a management reporting line independent of HSBCs Investment Banking business Information Barrier procedures are in place between the Investment Banking and Research businesses to ensure that any confidential andor price sensitive information is handled in an appropriate manner
39
Economics Global 11 January 2012
abc
Disclaimer Legal entities as at 04 March 2011 lsquoUAErsquo HSBC Bank Middle East Limited Dubai lsquoHKrsquo The Hongkong and Shanghai Banking Corporation Limited Hong Kong lsquoTWrsquo HSBC Securities (Taiwan) Corporation Limited lsquoCArsquo HSBC Securities (Canada) Inc Toronto HSBC Bank Paris Branch HSBC France lsquoDErsquo HSBC Trinkaus amp Burkhardt AG Duumlsseldorf 000 HSBC Bank (RR) Moscow lsquoINrsquo HSBC Securities and Capital Markets (India) Private Limited Mumbai lsquoJPrsquo HSBC Securities (Japan) Limited Tokyo lsquoEGrsquo HSBC Securities Egypt SAE Cairo lsquoCNrsquo HSBC Investment Bank Asia Limited Beijing Representative Office The Hongkong and Shanghai Banking Corporation Limited Singapore Branch The Hongkong and Shanghai Banking Corporation Limited Seoul Securities Branch The Hongkong and Shanghai Banking Corporation Limited Seoul Branch HSBC Securities (South Africa) (Pty) Ltd Johannesburg lsquoGRrsquo HSBC Securities SA Athens HSBC Bank plc London Madrid Milan Stockholm Tel Aviv lsquoUSrsquo HSBC Securities (USA) Inc New York HSBC Yatirim Menkul Degerler AS Istanbul HSBC Meacutexico SA Institucioacuten de Banca Muacuteltiple Grupo Financiero HSBC HSBC Bank Brasil SA ndash Banco Muacuteltiplo HSBC Bank Australia Limited HSBC Bank Argentina SA HSBC Saudi Arabia Limited The Hongkong and Shanghai Banking Corporation Limited New Zealand Branch
Issuer of report HSBC Bank plc 8 Canada Square London
E14 5HQ United Kingdom
Telephone +44 20 7991 8888 Fax +44 20 7992 4880
Website wwwresearchhsbccom
This document is issued and approved in the United Kingdom by HSBC Bank plc for the information of its Clients (as defined in the Rules of FSA) and those of its affiliates only If this research is received by a customer of an affiliate of HSBC its provision to the recipient is subject to the terms of business in place between the recipient and such affiliate In Australia this publication has been distributed by The Hongkong and Shanghai Banking Corporation Limited (ABN 65 117 925 970 AFSL 301737) for the general information of its ldquowholesalerdquo customers (as defined in the Corporations Act 2001) Where distributed to retail customers this research is distributed by HSBC Bank Australia Limited (AFSL No 232595) These respective entities make no representations that the products or services mentioned in this document are available to persons in Australia or are necessarily suitable for any particular person or appropriate in accordance with local law No consideration has been given to the particular investment objectives financial situation or particular needs of any recipient The document is distributed in Hong Kong by The Hongkong and Shanghai Banking Corporation Limited and in Japan by HSBC Securities (Japan) Limited Each of the companies listed above (the ldquoParticipating Companiesrdquo) is a member of the HSBC Group of Companies any member of which may trade for its own account as Principal may have underwritten an issue within the last 36 months or together with its Directors officers and employees may have a long or short position in securities or instruments or in any related instrument mentioned in the document Brokerage or fees may be earned by the Participating Companies or persons associated with them in respect of any business transacted by them in all or any of the securities or instruments referred to in this document In Korea this publication is distributed by either The Hongkong and Shanghai Banking Corporation Limited Seoul Securities Branch (HBAP SLS) or The Hongkong and Shanghai Banking Corporation Limited Seoul Branch (HBAP SEL) for the general information of professional investors specified in Article 9 of the Financial Investment Services and Capital Markets Act (ldquoFSCMArdquo) This publication is not a prospectus as defined in the FSCMA It may not be further distributed in whole or in part for any purpose Both HBAP SLS and HBAP SEL are regulated by the Financial Services Commission and the Financial Supervisory Service of Korea This publication is distributed in New Zealand by The Hongkong and Shanghai Banking Corporation Limited New Zealand Branch The information in this document is derived from sources the Participating Companies believe to be reliable but which have not been independently verified The Participating Companies make no guarantee of its accuracy and completeness and are not responsible for errors of transmission of factual or analytical data nor shall the Participating Companies be liable for damages arising out of any personrsquos reliance upon this information All charts and graphs are from publicly available sources or proprietary data The opinions in this document constitute the present judgement of the Participating Companies which is subject to change without notice This document is neither an offer to sell purchase or subscribe for any investment nor a solicitation of such an offer HSBC Securities (USA) Inc accepts responsibility for the content of this research report prepared by its non-US foreign affiliate All US persons receiving andor accessing this report and intending to effect transactions in any security discussed herein should do so with HSBC Securities (USA) Inc in the United States and not with its non-US foreign affiliate the issuer of this report In Singapore this publication is distributed by The Hongkong and Shanghai Banking Corporation Limited Singapore Branch for the general information of institutional investors or other persons specified in Sections 274 and 304 of the Securities and Futures Act (Chapter 289) (ldquoSFArdquo) and accredited investors and other persons in accordance with the conditions specified in Sections 275 and 305 of the SFA This publication is not a prospectus as defined in the SFA It may not be further distributed in whole or in part for any purpose The Hongkong and Shanghai Banking Corporation Limited Singapore Branch is regulated by the Monetary Authority of Singapore Recipients in Singapore should contact a Hongkong and Shanghai Banking Corporation Limited Singapore Branch representative in respect of any matters arising from or in connection with this report HSBC Meacutexico SA Institucioacuten de Banca Muacuteltiple Grupo Financiero HSBC is authorized and regulated by Secretariacutea de Hacienda y Creacutedito Puacuteblico and Comisioacuten Nacional Bancaria y de Valores (CNBV) HSBC Bank (Panama) SA is regulated by Superintendencia de Bancos de Panama Banco HSBC Honduras SA is regulated by Comisioacuten Nacional de Bancos y Seguros (CNBS) Banco HSBC Salvadorentildeo SA is regulated by Superintendencia del Sistema Financiero (SSF) HSBC Colombia SA is regulated by Superintendencia Financiera de Colombia Banco HSBC Costa Rica SA is supervised by Superintendencia General de Entidades Financieras (SUGEF) Banistmo Nicaragua SA is authorized and regulated by Superintendencia de Bancos y de Otras Instituciones Financieras (SIBOIF) The document is intended to be distributed in its entirety Unless governing law permits otherwise you must contact a HSBC Group member in your home jurisdiction if you wish to use HSBC Group services in effecting a transaction in any investment mentioned in this document HSBC Bank plc is registered in England No 14259 is authorised and regulated by the Financial Services Authority and is a member of the London Stock Exchange (070905) copy Copyright HSBC Bank plc 2012 ALL RIGHTS RESERVED No part of this publication may be reproduced stored in a retrieval system or transmitted on any form or by any means electronic mechanical photocopying recording or otherwise without the prior written permission of HSBC Bank plc MICA (P) 208042011 and MICA (P) 040042011
[317638]
40
abc
Global
Stephen King Global Head of Economics +44 20 7991 6700 stephenkinghsbcibcom
Karen Ward Senior Global Economist +44 20 7991 3692 karenwardhsbcibcom
Madhur Jha +44 20 7991 6755 madhurjhahsbcibcom
Europe amp United Kingdom
Janet Henry Chief European Economist +44 20 7991 6711 janethenryhsbcibcom
Simon Wells Chief UK Economist +44 20 7991 6718 simonwellshsbcibcom
Astrid Schilo +44 20 7991 6708 astridschilohsbcibcom
Germany Lothar Hessler +49 21 1910 2906 lotharhesslerhsbcde
France Mathilde Lemoine +33 1 4070 3266 mathildelemoinehsbcfr
North America
Kevin Logan Chief US Economist +1 212 525 3195 kevinrloganushsbccom
Ryan Wang +1 212 525 3181 ryanwangushsbccom
Asia Pacific
Qu Hongbin Managing Director Co-head Asian Economics Research and Chief Economist Greater China +852 2822 2025 hongbinquhsbccomhk
Frederic Neumann Managing Director Co-head Asian Economics Research +852 2822 4556 fredericneumannhsbccomhk
Leif Eskesen Chief Economist India amp ASEAN +65 6239 0840 leifeskesenhsbccomsg
Paul Bloxham Chief Economist Australia and New Zealand +61 2925 52635 paulbloxhamhsbccomau
Donna Kwok +852 2996 6621 donnahjkwokhsbccomhk
Trinh Nguyen +852 2822 6975 trinhdnguyenhsbccomhk
Ronald Man +852 2996 6743 ronaldmanhsbccomhk
Luke Hartigan +612 9255 2635 lukehartiganhsbccomau
Sun Junwei +86 10 5999 8234 junweisunhsbccomcn
Sophia Ma +86 10 5999 8232 xiaopingmahsbccomcn
Global Emerging Markets
Pablo Goldberg Head of Global EM Research +1 212 525 8729 pabloagoldberghsbccom
Bertrand Delgado EM Strategist +1 212 525 0745 bertrandjdelgadoushsbccom
Emerging Europe Middle East and Africa
Murat Ulgen Chief Economist +44 20 7991 6782 muratulgenhsbccom
Agata Urbanska +44 20 7992 2774 agataurbanskahsbcibcom
Alexander Morozov +7 495 783 8855 alexandermorozovhsbccom
Simon Williams +971 4 507 7614 simonwilliamshsbccom
Melis Metiner +90 212 376 4618 melismetinerhsbccomtr
Latin America
Andre Loes Chief Economist Latin America +55 11 3371 8184 andrealoeshsbccombr
Argentina Javier Finkman Chief Economist South America ex-Brazil +54 11 4344 8144 javierfinkmanhsbccomar
Ramiro D Blazquez Senior Economist +54 11 4348 5759 ramiroblazquezhsbccomar
Jorge Morgenstern Senior Economist +54 11 4130 9229 jorgemorgensternhsbccomar
Brazil Constantin Jancso Senior Economist +55 11 3371 8183 constantincjancsohsbccombr
Marcos Fernandes +55 11 6847 9787 marcosrfernandeshsbccombr
Mexico Sergio Martin Chief Economist +52 55 5721 2164 sergiomartinmhsbccommx
Claudia Navarrete Economist +52 55 5721 2422 claudianavarretehsbccommx
Central America Lorena Dominguez Economist +52 55 5721 2172 lorenadominguezhsbccommx
Global Economics Research Team
Karen WardSenior Global EconomistHSBC Bank plc+44 20 7991 3692karenwardhsbcibcom
Karen joined HSBC in 2006 as UK economist In 2010 she was appointed Senior Global Economist with responsibility for monitoringchallenges facing the global economy and their implications for financial markets Before joining HSBC in 2006 Karen worked at theBank of England where she provided supporting analysis for the Monetary Policy Committee She has an MSc Economics fromUniversity College London

3
Economics Global 11 January 2012
abc
Visual summary 2 Who will deliver the fastest growth en route to 2050 List order based on size of economy in 2050
ChinaIndia
PhilippinesEgypt
MalaysiaPeru
BangladeshAlgeriaUkraineVietnam
UzbekistanTanzania
KazakhstanEcuadorEthiopia
Sri LankaAzerbaijan
KenyaBoliviaJordanUgandaGhana
ParaguayTurkmenistan
HondurasSerbia
Fast growth
BrazilMexicoTurkeyRussia
IndonesiaArgentina
Saudi ArabiaThailand
IranColombiaPakistan
ChileVenezuela
NigeriaRomania
Czech RepublicHungaryKuwait
MoroccoLibya
New ZealandDominican Republic
SyriaTunisia
GuatemalaLebanon
Slovak RepublicOmanAngola
Costa RicaBelarus
IraqPanamaCroatia
El SalvadorCameroonBulgariaBahrain
LithuaniaBosnia and Herzegovina
LatviaYemenCyprus
Growth
United StatesJapan
GermanyUnited Kingdom
FranceCanada
ItalySouth Korea
SpainAustralia
NetherlandsPoland
SwitzerlandSouth Africa
AustriaSwedenBelgium
SingaporeGreeceIsraelIreland
United Arab EmiratesNorwayPortugalFinland
DenmarkCubaQatar
UruguayLuxembourg
Slovenia
Stable
ChinaIndia
PhilippinesEgypt
MalaysiaPeru
BangladeshAlgeriaUkraineVietnam
UzbekistanTanzania
KazakhstanEcuadorEthiopia
Sri LankaAzerbaijan
KenyaBoliviaJordanUgandaGhana
ParaguayTurkmenistan
HondurasSerbia
Fast growth
BrazilMexicoTurkeyRussia
IndonesiaArgentina
Saudi ArabiaThailand
IranColombiaPakistan
ChileVenezuela
NigeriaRomania
Czech RepublicHungaryKuwait
MoroccoLibya
New ZealandDominican Republic
SyriaTunisia
GuatemalaLebanon
Slovak RepublicOmanAngola
Costa RicaBelarus
IraqPanamaCroatia
El SalvadorCameroonBulgariaBahrain
LithuaniaBosnia and Herzegovina
LatviaYemenCyprus
Growth
United StatesJapan
GermanyUnited Kingdom
FranceCanada
ItalySouth Korea
SpainAustralia
NetherlandsPoland
SwitzerlandSouth Africa
AustriaSwedenBelgium
SingaporeGreeceIsraelIreland
United Arab EmiratesNorwayPortugalFinland
DenmarkCubaQatar
UruguayLuxembourg
Slovenia
Stable
Source HSBC estimates
4
Economics Global 11 January 2012
abc
3 The economic league table in 2050
______ Size of economy in_______ __________ Income per capita in ___________ ____Population _____ 2010
Bn Constant 2000 USD
2050 Bn Constant
2000 USD
Change in rank
2010 Constant
2000 USD
Rank 2050 Constant
2000 USD
Rank 2010
Mn
2050
Mn
1 China 3511 25334 2 2579 63 17759 54 1362 1426 2 United States 11548 22270 -1 36354 6 55134 8 318 404 3 India 960 8165 5 790 88 5060 86 1214 1614 4 Japan 5008 6429 -2 39435 3 63244 4 127 102 5 Germany 2058 3714 -1 25083 18 52683 10 82 71 6 United Kingdom 1711 3576 -1 27646 11 49412 14 62 72 7 Brazil 921 2960 2 4711 52 13547 61 195 219 8 Mexico 688 2810 5 6217 42 21793 47 111 129 9 France 1496 2750 -3 23881 20 40643 21 63 68 10 Canada 892 2287 0 26335 15 51485 12 34 44 11 Italy 1124 2194 -4 18703 23 38445 23 60 57 12 Turkey 385 2149 6 5088 49 22063 46 76 97 13 South Korea 798 2056 -2 16463 25 46657 17 49 44 14 Spain 711 1954 -2 15699 26 38111 24 45 51 15 Russia 412 1878 2 2934 58 16174 56 140 116 16 Philippines 112 1688 27 1215 83 10893 72 93 155 17 Indonesia 274 1502 4 1178 85 5215 85 233 288 18 Australia 565 1480 -4 26244 16 51523 11 22 29 19 Argentina 428 1477 -2 10517 33 29001 38 41 51 20 Egypt 160 1165 15 3002 57 8996 76 84 130 21 Malaysia 146 1160 17 5224 47 29247 37 28 40 22 Saudi Arabia 258 1128 1 9833 34 25845 43 26 44 23 Thailand 187 856 6 2744 61 11674 68 68 73 24 Netherlands 439 798 -9 26376 14 45839 18 17 17 25 Poland 250 786 -1 6563 39 24547 45 38 32 26 Peru 85 735 20 2913 59 18940 53 29 39 27 Iran 161 732 7 2138 72 7547 81 75 97 28 Colombia 142 725 12 3052 56 11530 69 46 63 29 Switzerland 294 711 -9 38739 4 83559 3 8 9 30 Pakistan 111 675 14 657 92 2455 91 174 275 31 Bangladesh 78 673 17 482 95 3461 89 149 194 32 Chile 103 592 12 6083 43 29513 36 17 20 33 Venezuela 158 558 2 5438 46 13268 63 29 42 34 Algeria 76 538 14 2190 70 11566 70 35 47 35 South Africa 187 529 -8 3710 54 9308 75 50 57 36 Austria 222 520 -11 26455 13 61124 6 8 9 37 Nigeria 78 515 9 506 94 1323 98 158 390 38 Sweden 295 507 -20 31778 8 47941 15 9 11 39 Belgium 265 481 -18 24758 19 41842 20 11 11 40 Ukraine 45 462 19 987 86 12818 65 45 36 41 Vietnam 59 451 11 674 91 4335 88 88 104 42 Singapore 165 441 -11 34110 7 84405 2 5 5 43 Greece 161 424 -11 14382 29 38756 22 11 11 44 Israel 168 402 -14 21806 22 37731 25 7 11 45 Ireland 147 386 -9 27965 10 61363 5 5 6 46 Romania 56 377 9 2596 62 20357 51 21 19 47 United Arab Emirates 118 360 -6 25607 17 29651 35 8 12 48 Norway 199 352 -22 40933 2 59234 7 5 6 49 Czech Republic 76 342 0 7225 38 32153 32 10 11 50 Portugal 123 336 -10 11588 31 35863 28 11 9
Source World Bank UN population projections and HSBC estimates Note China includes Hong Kong and Macao given full unification is planned for 2047 and 2049 Income per capita forecasts are not the cumulative sum of the forecasts for income per capita presented later in the document This is because the GDP created by the working population must be shared between the population as a whole not just the working population
5
Economics Global 11 January 2012
abc
3 The economic league table in 2050 (continued)
______ Size of economy in_______ __________ Income per capita in ___________ ____Population _____ 2010
Bn Constant 2000 USD
2050 Bn Constant
2000 USD
Change in rank
2010 Constant
2000 USD
Rank 2050 Constant
2000 USD
Rank 2010 Mn
2050 Mn
51 Uzbekistan 25 314 22 893 87 8859 77 27 35 52 Hungary 58 295 1 5833 44 31966 33 10 9 53 Tanzania 16 288 34 382 97 2085 92 45 138 54 Kazakhstan 38 287 7 2376 68 13520 62 16 21 55 Kuwait 61 280 -4 23072 21 54183 9 3 5 56 Morocco 58 279 -2 1781 75 7110 82 32 39 57 Finland 145 270 -19 27151 12 49643 13 5 5 58 Denmark 172 265 -29 31418 9 47743 16 5 6 59 Libya 49 230 -2 7692 37 26182 42 6 9 60 New Zealand 64 214 -10 14939 28 37705 26 4 6 61 Dominican Republic 37 212 1 3697 55 16406 55 10 13 62 Ecuador 24 206 14 1771 76 10546 73 14 20 63 Ethiopia 17 196 23 201 100 1352 97 83 145 64 Syria 28 181 2 1397 78 5470 84 20 33 65 Sri Lanka 25 175 7 1233 81 7558 80 21 23 66 Azerbaijan 20 168 14 2303 69 14482 59 9 12 67 Kenya 18 163 16 452 96 1683 95 41 97 68 Tunisia 29 160 -3 2805 60 12686 66 10 13 69 Guatemala 26 152 1 1858 73 4826 87 14 32 70 Lebanon 27 148 -2 6342 41 31659 34 4 5 71 Bolivia 12 145 25 1192 84 8652 78 10 17 72 Slovak Republic 44 145 -12 8042 36 27639 39 5 5 73 Oman 30 138 -10 10779 32 36832 27 3 4 74 Angola 24 134 1 1313 80 3170 90 19 42 75 Costa Rica 23 124 3 5043 50 20588 50 5 6 76 Belarus 25 122 -2 2556 65 15207 57 10 8 77 Cuba 49 121 -19 4370 53 12202 67 11 10 78 Iraq 23 117 -1 743 89 1410 96 32 83 79 Qatar 54 112 -23 38466 5 43027 19 2 3 80 Jordan 15 112 9 2497 67 11317 71 6 10 81 Uganda 12 111 14 366 98 1179 99 33 94 82 Panama 20 110 -1 5732 45 21423 48 4 5 83 Croatia 28 105 -16 6396 40 27091 41 4 4 84 El Salvador 16 104 4 2566 64 13729 60 6 8 85 Ghana 8 100 22 343 99 2035 94 24 49 86 Paraguay 9 99 17 1432 77 9587 74 6 10 87 Turkmenistan 9 97 15 1827 74 14659 58 5 7 88 Uruguay 30 93 -24 8942 35 25482 44 3 4 89 Honduras 10 82 11 1380 79 6337 83 8 13 90 Cameroon 14 79 1 694 90 2048 93 20 38 91 Serbia 9 75 13 1229 82 8565 79 10 9 92 Bulgaria 19 72 -10 2542 66 13154 64 7 5 93 Luxembourg 26 68 -24 52388 1 96592 1 1 1 94 Slovenia 26 66 -23 12577 30 32971 31 2 2 95 Bahrain 13 61 -3 16968 24 33910 29 1 2 96 Lithuania 17 59 -12 5154 48 20955 49 3 3 97 Bosnia amp Herzegovina 8 56 10 2162 71 18961 52 4 3 98 Latvia 11 52 0 4973 51 27143 40 2 2 99 Yemen 13 45 -8 565 93 731 100 24 62 100 Cyprus 12 45 -7 15510 27 33337 30 1 1
Source World Bank UN population projections and HSBC estimates Income per capita forecasts are not the cumulative sum of the forecasts for income per capita presented later in the document This is because the GDP created by the working population must be shared between the population as a whole not just the working population
6
Economics Global 11 January 2012
abc
What makes economies grow Clearly this is a question Western policymakers are
grappling with right now If we step away from the
cyclicality there are two ways economies can grow
either add more people to the production line via
growth in the working population or make each
individual more productive
Let us start by considering individual productivity
As in the original framework we lean heavily on the
empirical work of Harvardrsquos Professor Robert Barro
(full details of the model can be found in the
Appendix) We back-tested the model on our
extended sample of countries and are pleased with
the actual outcome for growth relative to the
projections in the period of 2000 to 2010 (Chart 4)
The first set of variables Professor Barro highlighted
as crucial to driving growth in individual
productivity are those that drive lsquohuman capitalrsquo ndash
health education and fertility The second set of
variables determine the likelihood of fixed capital
investment to equip workers with tools and
technology These are rule of law (which
encompasses patent and property rights)
government interference democracy and monetary
control (which is proxied by the inflation rate)
Good foundations
Our framework considers what stage of development each
economy is at todayhellip
hellip and whether they have the potential and the fundamental
characteristics necessary to catch up with the developed world
Current growth rates play no role in these projections
4 Modelrsquos back-test does a surprisingly good job given the vast array of countries considered
-10
-5
0
5
10
15
US
Chi
na UK
Italy
Braz
ilS
Kor
eaM
exic
oN
ethe
rland
sR
ussi
aSw
eden
Belg
ium
Saud
i Ara
bia
Hon
g Ko
ngN
orw
ayTh
aila
ndG
reec
eVe
nezu
ela
Egyp
tC
olom
bia
Mal
aysi
aPo
rtuga
lPh
ilippi
nes
Chi
leN
iger
iaAl
geria
New
Viet
nam
Mor
occo
Qat
arC
uba
Slov
akD
omin
ican
Uru
guay
Syria
Leba
non
Gua
tem
ala
Sri L
anka
Bela
rus
Ecua
dor
Cos
ta R
ica
Azer
baija
nBu
lgar
iaM
acao
Ethi
opia
El S
alva
dor
Trin
idad
and
Yem
enC
ypru
sBo
livia
Icel
and
Jam
aica
Para
guay
Moz
ambi
quG
hana
Bots
wan
a
Model Rate Actual rate
Source World Bank HSBC projections
7
Economics Global 11 January 2012
abc
Education
It is worth spending a moment discussing
education given its importance in the model
Whether individuals can adapt to the worldrsquos
given technology or even push the technology
frontier out depends on the level of education
5 Quality of education is most important but it is well correlated with time spent at school
300
400
500
600
5 6 7 8 9 10 11 12 13 14
300
400
500
600
Av erage y ears o f schooling
Qua
lity
of s
choo
ling
Source Barrolee dataset and PISA
Owing to data availability we focus on the
number of years of schooling This of course is
not a perfect metric since we would really want to
capture quality of education PISA (Programme
for International Student Assessment) is an
international study that aims to evaluate education
systems worldwide by testing the skills and
knowledge of 15-year-old students in certain
countries in reading maths and scientific literacy
This is plotted in Chart 5 alongside our measure of
education Quantity of schooling is a good but not
perfect proxy for quality of education For
example for nine and half years of education the
UK appears to do a much better job in gaining
results obtaining a PISA score of 500 against
Argentina which for a similar input scores just
395 For reference five of the top eight scoring
countries on this survey are in Asia
Democracy
Democracy is another variable worth discussing
given its controversy The success of democratic
systems is most likely explained by the freedom of
speech and creativity that leads to successful
entrepreneurs In addition they provide checks and
balances to ensure governments do not become
excessively powerful absorbing any improvement
in the countryrsquos prosperity for their own benefit
Democracy therefore is highly correlated with
our measure of rule of law (Chart 6)
6 Democracy does not always guarantee good rule of law
00
02
04
06
08
10
12
00 02 04 06 08 10
Democracy Index
Rul
e of
Law
Inde
x
M exico amp Brazil
China amp Saudi Arabia
Source Political Risk Services Freedom House Political Rights Index
But there are authoritarian regimes such as China
and Saudi Arabia that have delivered a good lsquorule of
lawrsquo In parts of Latin America democracy has done
little to improve rule of law Even in highly
democratic systems you can still see corruption
Professor Barrorsquos work actually showed that too
much democracy was not necessarily a good thing
for economic growth (of course it may be the best
model for social development) He found that at very
high levels of democracy income redistribution
becomes a dominant force which serves to restrain
entrepreneurial endeavour And democracy places a
disproportionate weight on winning current votes
potentially at the expense of future votes and
therefore can hinder the investment required for
long-term development
8
Economics Global 11 January 2012
abc
Many years of lsquocopy and pastersquo growth left
The most potent recipe for growth is a country
that scores highly on the fundamentals discussed
but currently has low income per capita These
economies should deliver the highest growth in
income per capita as they lsquocatch uprsquo with those
with similar fundamentals Economies with poor
governance and low education will remain stuck
in this low-income trap This has been the position
a number of African nations have found
themselves in for so long
As economies become wealthier and technology
more sophisticated they will gradually lose the
advantages of lsquostarting from behindrsquo The initial
years of development could be described as lsquocopy
and pastersquo growth as countries open themselves
up and adapt to the worldrsquos existing technologies
Of course various lsquoiron curtainsrsquo meant that many
economies did not open themselves up to either
the new technologies created in the Western
economies or the worldrsquos supply of capital until
recently
Once the lsquocopy and pastersquo growth is complete
countries will need to be sufficiently sophisticated
to operate at the lsquofrontierrsquo driving technological
change It is at this point that many economies
struggle and get stuck in what is often known as
the middle-income trap
But many of the countries we are considering are
still at such an extremely low level of
development that there are years of this lsquocopy and
pastersquo growth ahead
We think this is where many of the bears on
China are wrong One of the most commonly
cited reasons for concern about China is the high
rate of investment as a percentage of GDP Many
compare this rate of investment with the rates
seen during the expansion of Asian lsquotigersrsquo in the
1970s and claim that it is too rapid and that
Chinarsquos policymakers must be pouring money
into unproductive investment (Chart 7)
7 Comparing China today with Japan or Korea in the 1970s is unfairhellip
0
10
20
30
40
50
China today Japan 1970 South Korea 1970
of GDP Inv es tment
Source World Bank
8 hellip because China is at a much lower level of development today than they were then
0
20
40
60
80
0 5 10 15 20 25
0
20
40
60
80
US Japan China
Share of employ ment w ithin primary industry
Real GDP per capita chained 1990 USD000s
Japan in
1970
China today
Source World Bank
But the starting point of comparison is wrong
because Chinarsquos level of development today is so
much lower than that of the Asian tigers before
their rapid expansion (Chart 8) It is for this
reason we believe the strong rate of investment is
entirely justified ndash providing China with much-
needed basic infrastructure
9
Economics Global 11 January 2012
abc
Demographic dividends Using this model to establish how productive each
individual will be we must consider now how
many individuals there will be
They may not flash up on our Bloomberg screens
once a month but demographics are an extremely
important driver of growth There are two effects
First and most straightforward it is generally
easier to produce more stuff when you have more
people on the production line The second impact
is a little more subtle and relates to the ratio of
working population to total population As
Stephen King discusses in lsquoLosing controlrsquo (2010
Yale University Press) when you have many
lsquoproducersrsquo but not many lsquodependentsrsquo the burden
on producers perhaps because of tax payments to
support the elderly and young are small and
therefore the rewards for effort are great
Therefore demographic burdens can in turn feed
back to individual productivity
9 Japanrsquos demographic downturn will have played a key role in its economic malaise
-5
0
5
10
15
20
1955 1965 1975 1985 1995 2005
-1
0
1
2
3
4
GDP grow th (LHS)Working population grow th (RHS)
Yr YrJapan
Source World Bank
Japan shows the economic perils of a declining
working population only too well While many
put Japanrsquos lost decades down to deleveraging
following the build-up of debt in the 1980s it
seems likely that it had at least as much to do with
the dramatic decline in working population
growth over the past 50 years (Chart 9)
As the projections for working population stand
demographics alone could explain a large part of
what are likely to be huge differences in economic
performance in the coming years Contrast Japan
and Russia whose working populations will shrink
by more than 1 per annum for the next four
decades with Nigeria whose working population
will rise by 3 per annum
But as we have explained population growth is
not itself enough to guarantee growth You need
the other foundations to ensure jobs are created for
these new entrants to the labour market So our
projections for total GDP build up using our
earlier forecasts for income per capita based on
the economic infrastructure and the number of
lsquocapitasrsquo - the change in working population As
we will see little progress is made in countries
without the right lsquoeconomic infrastructurersquo even if
their populations are growing
10
Economics Global 11 January 2012
abc
The fine print A few words on the technicalities and caveats of
the framework before we get into the results
As in the original report we are working in
constant price constant 2000 USD exchange
rate terms Further appreciation of emerging
market currencies against the USD will only
extend the conclusions of the report
The source of the data on economic infrastructure
is contained in Table 10 To get to our base case
projections we consider two scenarios The first
assumes the lsquoeconomic infrastructurersquo is fixed at
that evident today But to constrain these
economies on the assumption they will not make
any further improvements would be unfair For
example there is a clear trend that education
standards across the emerging world are improving
We then consider a second scenario in which we
assume that over the next 40 years all economies
reach the lsquooptimalrsquo economic infrastructure This is
the highest possible level of achievement from any
of the countries in our sample
The results of these two scenarios are shown in the
Appendix Our base-case scenario sits between
these two options Essentially each country gets
halfway to eliminating its imperfections
Economic snakes and ladders
Asia is the stand-out region ndash with a notable showing by the
Philippines
LATAM fares well with Peru emerging into the spotlight
Other strong performers include Egypt Nigeria Turkey and
Ukraine
10 Data description
Variable Description Source
Average years of male schooling The average number of years spent in education by males in 2010 (for this extension for many countries the distinction between male and female was not available and we have therefore taken average education across gender) In addition in a very limited number of countries the data was not available and therefore our regional specialists used their judgment to determine an appropriate proxy
wwwbarroleecom
Life expectancy The life expectancy of total population in 2008 natural log taken World Bank Fertility The number of births per woman in 2008 natural log taken World Bank Rule of law An index between 0 and 1 which measures the attractiveness of the investment climate based
on the level of law enforcement contract sanctity and property rights Data for 2009 Political Risk Services International Country Risk Guide
Government consumption Percentage of GDP accounted for by government consumption in 2008 World Bank Democracy index Indicator of political rights measures the right of all adults to vote and compete for public office
and to have a decisive vote on public policies Measured between 0 and 1 (full democracy) Freedom House Political Rights Index
Inflation rate CPI inflation ( year) average 2004-07 World Bank
11
Economics Global 11 January 2012
abc
We are clearly assuming governments continue to
improve the underlying economic infrastructure
implementing reform increasing education and so
forth and remain friendly with their neighbours
Of course this may turn out to be a rather
Panglossian view of government behaviour The
two scenarios in the Appendix provide some
guidance as to the sensitivity of the projections to
this underlying assumption that governments
continue to lsquodo the right thingrsquo
In addition our model will not capture all the
variables that dictate an economyrsquos potential
There may be idiosyncratic factors that mean a
country should feature more highly or indeed
lower down our economic league table
The variable that is most often debated is a
countryrsquos endowment of natural resources Surely
a country with a rich array of natural resources
should outperform those without This may well
be the case but not always We have often seen
countries rich in natural resources suffer from
lsquoDutch diseasersquo This is a situation in which the
capital inflows to exploit the domestic commodity
industry put upward pressure on the domestic
exchange rate which in turn damages other
industrial areas In addition the presence of natural
resources can also lead to an increase in corruption
and so the benefits of the natural wealth do little
for the population as a whole Therefore
empirically it is not absolutely clear that those rich
in natural resources should get a natural boost so
this is one variable we do not include and leave
readers to assess whether in their opinion a
country should feature higher in the table
There are numerous other variables that fall in this
list of needing further consideration such as
extreme religious fundamentalism and relations
with the rest of the world (eg Iran)
We should also highlight some potential caveats
to the demographic projections we are using
These estimates made by the UN take into
account current fertility rates and policy on
retirement and migration
But these working-age projections are subject to a
considerable degree of uncertainty The most
tricky is disease which could raise the mortality
rate or by contrast medical breakthroughs which
could lower it Immigration flows could also send
these projections wildly off course decreasing
prospects for one part of the world while boosting
prospects elsewhere The changes we are
highlighting in this document could give rise to a
great migration which has all sorts of
implications for border frictions The history of
the US is a case in point In the 1950s and early
60s there were demographic concerns about the
US But the 1965 Immigration and Naturalisation
Act saw a huge new wave of migrants which
coupled with a higher fertility rate among
migrants gave rise to a fresh demographic boost
Government policy could also throw these
projections wildly off course if incentives via the
tax system manage successfully to lift or reduce
the fertility rate
Therefore we emphasise this exercise is a starting
point for considering the long-term outlook and
should not be taken as our explicit forecast Our
regional economists will be able to provide more
accurate near-term forecasts taking into account
factors the model is unable to capture and cyclical
considerations
12
Economics Global 11 January 2012
abc
Developed world Countries in the developed world might be
considered to be at the technology lsquofrontierrsquo With
income per capita already high these economies do
not get any lsquocatch uprsquo boost so rely on the other
variables in the model (education rule of law etc)
for technological progress to deliver further gains
in individual prosperity
That said there are still large variations across the
developed world with real income per capita in
Portugal at just over USD115k compared with
USD37k in the US Those with similar economic
infrastructure to the US but with lower income per
capita will therefore get a lsquocatch uprsquo boost This
explains why the model provides higher income
per capita forecasts for the likes of Spain and
Greece (Table 12) which may seem implausible
given their current difficulties
12 Model projections for income per capita
2010-20 2020-30 2030-40 2040-50
Developed world Australia 18 20 21 22 Austria 27 26 25 24 Belgium 12 15 19 21 Canada 19 21 22 23 Denmark 06 11 15 18 Finland 16 18 19 21 France 12 15 18 21 Germany 21 22 23 24 Greece 31 30 29 29 Ireland 19 20 20 21 Italy 16 24 25 27 Japan 13 16 19 20 Luxembourg 16 16 16 17 Netherlands 13 16 19 21 New Zealand 29 27 26 26 Norway 05 11 15 17 Portugal 32 32 32 32 Spain 24 31 30 29 Sweden 05 11 16 19 Switzerland 26 24 22 21 United Kingdom 14 16 18 20 United States 06 11 15 18 Developed world avg 17 20 21 22
Source HSBC estimates
11 The lsquoeconomic infrastructurersquo today
GDP per capita
Average years male schooling
Life expectancy
Fertility (average
children per person)
Rule of law Government consumption
Democracy index
Inflation rate
Developed world Real USD Years Years Children Index Ratio to GDP Index Annual rate Australia 26244 121 81 19 09 017 10 28 Austria 26445 95 80 14 10 018 10 20 Belgium 24758 105 80 18 08 023 10 21 Canada 26355 113 80 16 09 019 10 16 Denmark 31418 101 78 18 10 026 10 21 Finland 27151 100 79 18 10 022 10 22 France 23881 105 81 19 08 023 10 15 Germany 25083 118 80 13 08 018 10 17 Greece 14382 106 79 15 08 017 10 28 Ireland 27965 116 78 21 10 016 10 15 Italy 18703 95 81 14 07 020 10 20 Japan 39435 115 82 13 08 018 10 00 Luxembourg 52388 101 81 16 10 015 10 20 Netherlands 26376 110 80 17 10 025 10 18 New Zealand 14939 127 80 22 09 019 10 28 Norway 40933 122 80 19 10 020 10 22 Portugal 11588 80 79 14 08 020 10 15 Spain 15699 103 81 14 08 019 10 22 Sweden 31778 115 81 19 10 026 10 18 Switzerland 38739 99 82 14 08 011 10 09 United Kingdom 27646 96 79 19 09 021 10 26 United States 36364 122 78 21 08 016 10 21 Developed world average 27200 108 81 17 09 019 10 19
Source wwwbarroleecom World Bank Political Risk Services International Country Risk Guide Freedom House Political Rights Index
13
Economics Global 11 January 2012
abc
The major headwind to growth in much of the
developed world stems from demographics This
is less of a problem for Australasia North
America the UK and Ireland which are all likely
to see population growth in the coming decades
By contrast the demographics in much of Europe
are challenging putting their debt problems into
an even more worrying light With debt levels
rising and the number of taxpayers falling it
becomes even harder to get the arithmetic to add
up Ironically Germany is one of the few
countries in the Eurozone not experiencing
funding difficulties but is in the worst structural
situation so far as demographics are concerned
Trying to get the debt arithmetic to add up for
Europe is a straightforward task compared with
Japan Japanrsquos gross debt to GDP now stands at
more than 200 and the number of people paying
taxes in the coming four decades will fall by 40
Adding the outlook for income per capita to the
number of lsquocapitasrsquo we see that with one
exception the developed world is not able to offer
more than 3 growth The lowest forecasts are
for Japan which fails to achieve more than 1
growth throughout the forecast horizon By
contrast the highest performer is New Zealand
14 Model projections for total GDP
2010-20 2020-30 2030-40 2040-50
Developed world Australia 24 23 25 26 Austria 27 19 19 21 Belgium 10 12 17 21 Canada 23 21 26 25 Denmark 05 08 11 20 Finland 11 14 19 19 France 11 14 16 21 Germany 17 11 14 17 Greece 29 26 22 21 Ireland 28 28 22 19 Italy 14 19 15 21 Japan 04 09 05 08 Luxembourg 28 22 23 25 Netherlands 11 12 15 22 New Zealand 34 30 29 29 Norway 09 13 15 21 Portugal 30 26 23 22 Spain 28 29 23 22 Sweden 04 13 17 21 Switzerland 26 20 20 23 United Kingdom 16 17 19 22 United States 11 14 19 21 Developed world avg 18 18 19 21
Source HSBC estimates
13 Demographic change between now and 2050
-50 0 50 100 150 200 250
JapanGermany
PortugalItaly
HungaryGreeceAustriaSpain
FinlandNetherlands
DenmarkBelgiumFrance
Sw itzerlandSw eden
UKNorw ayCanada
New ZealandUS
AustraliaIreland
Lux embourg
change in w orking population betw een now and 2050
Source UN population projections
14
Economics Global 11 January 2012
abc
Asia Many parts of Asia have extremely high standards of
education and rule of law Singapore and South
Korea of course being clear examples which would
explain why these economies have already seen such
rapid increases in income per capita Other countries
in the region have made enormous progress in
improving their economic infrastructure but are still
reasonably poor and therefore have great potential to
catch up Chinarsquos income per capita is currently just
7 that of the US Adding up the annual projections
shown in Table 16 we project Chinarsquos income per
capita to grow by more than 800 between now and
2050 This might seem an astonishing number But
keep in mind this base effect Despite this rapid
growth in 2050 Chinarsquos income per capita is still
just 32 that of the US We are only capturing part
of Chinarsquos development story here and the likelihood
is that these numbers turn out to be too conservative
rather than too optimistic The same is true of the
Philippines which looks set for a multi-decade run
of strong growth
16 Model projections for income per capita
2010-20 2020-30 2030-40 2040-50
Asia Azerbaijan 61 54 48 44 Bangladesh 36 44 50 55 China 65 57 51 46 India 40 45 48 51 Indonesia 30 37 42 47 Kazakhstan 59 52 47 43 South Korea 37 34 31 30 Malaysia 54 46 41 36 Pakistan 15 25 35 44 Philippines 61 56 52 48 Singapore 36 32 27 23 Sri Lanka 52 52 50 49 Thailand 37 40 41 42 Turkmenistan 61 55 49 45 Uzbekistan 67 60 55 51 Vietnam 47 49 52 55 Asia average 48 46 45 44
Source HSBC estimates
But being lsquopoorrsquo is not enough to guarantee growth
in income per capita The projections for Pakistan
demonstrate this Because of low scores for
schooling life expectancy rule of law and
democracy Pakistan has little potential for income
per capita to grow near term despite a low starting
point But given we assume governments will make
progress on some of these flaws so growth will start
to pick up in countries such as Pakistan and
Bangladesh
15 The lsquoeconomic infrastructurersquo today
GDP per capita
Average years male schooling
Life expectancy
Fertility (average
children per person)
Rule of law Government consumption
Democracy index
Inflation rate
Asia Real USD Years Years Children Index Ratio to GDP Index Annual rate Azerbaijan 2303 104 70 23 06 010 02 129 Bangladesh 482 58 66 23 04 006 03 78 China 2579 98 73 18 08 014 00 33 India 790 67 63 27 07 010 08 85 Indonesia 1178 62 70 22 05 008 08 76 Kazakhstan 2376 104 66 25 07 011 02 117 South Korea 16463 118 79 12 08 015 08 33 Malaysia 5224 101 74 26 07 012 05 27 Pakistan 657 56 67 40 05 009 02 138 Philippines 1215 90 72 31 04 010 05 51 Singapore 34110 91 80 13 08 010 03 31 Sri Lanka 1233 84 74 23 05 015 05 139 Thailand 2744 75 68 18 04 012 02 23 Turkmenistan 1827 104 65 25 07 009 00 78 Uzbekistan 893 104 68 26 07 017 00 78 Vietnam 674 64 74 21 07 006 00 128 Asia average 4220 84 71 23 06 011 03 78
Source wwwbarroleecom World Bank Political Risk Services International Country Risk Guide Freedom House Political Rights Index
15
Economics Global 11 January 2012
abc
From a demographic standpoint Asia is also a
reasonably mixed bag ndash this is where the shine
slightly comes off the China story since its one-
child policy of yester years will start to see the
working population decline from around 2020
Singapore and South Korea while not enforced
have also seen a staggering decline in fertility
rates in the past couple of decades which will see
their working populations also decline Singapore
has been exploring the possibility of reversing this
trend through an aggressive immigration policy
By contrast other parts of Asia ndash India Pakistan
the Philippines Bangladesh and Malaysia ndash all
have rapidly growing populations In 2050 the
population of Pakistan at roughly 290m will be
just shy of four times the population of the UK
Adding the forecasts for working population to
those of income per capita we get to projections
for total GDP growth in Table 18 There are some
truly remarkable hot spots in Asia China
continues to grow at a rapid pace although the
pace is expected to slow beyond 2020 as the
demographic drag starts to hinder overall GDP
growth Nevertheless we still expect average
GDP growth of more than 5 per annum for the
next 40 years The star performer however is the
Philippines where the combination of strong
fundamentals and powerful demographics gives
rise to an average growth rate of 7 for the
coming 40 years Central Asia is also interesting
Kazakhstan Turkmenistan and Uzbekistan all
perform extremely well in the context of this
model on the back of strong growth in a very
well-educated population The absence of
democracy however prevents these economies
reaching their full potential
18 Model projections for total GDP
2010-20 2020-30 2030-40 2040-50
Asia Azerbaijan 70 57 50 41 Bangladesh 55 55 56 55 China 67 55 44 41 India 57 56 55 52 Indonesia 43 43 43 45 Kazakhstan 61 58 49 40 South Korea 37 23 18 17 Malaysia 71 57 47 38 Pakistan 40 45 49 50 Philippines 84 73 66 58 Singapore 37 21 20 21 Sri Lanka 54 53 49 43 Thailand 40 38 38 40 Turkmenistan 77 64 56 45 Uzbekistan 82 69 61 50 Vietnam 57 53 51 48 Asia average 58 51 47 43
Source HSBC estimates
17 Demographic change between now and 2050
-50 0 50 100 150 200 250
S KoreaSingapore
ChinaThailand
Sri LankaVietnam
KazakhstanAzerbaijanIndonesia
UzbekistanTurkmenistan
BangladeshIndia
Malay siaPhilippines
Pakistan
change in w orking population betw een now and 2050
Source UN population projections
16
Economics Global 11 January 2012
abc
Central and South America The potential of economies in Latin America has
been unleashed in recent decades as they have
managed to tame the inflation that plagued their
economies for much of the 1970s and 1980s
(Table 19) It is remarkable to think that between
1986 and 1994 Brazil suffered several years of
inflation of over 500 Such has been the
turnaround in its economic management that it is
now imposing taxes on foreign investors to
prevent capital inflows Of course we are
assuming that inflation is prevented from ever
creeping back into the system Maintaining small
governments and low levels of debt will surely
help prevent these economies from returning to
their old ways
The level of schooling is high although many of
these economies score less highly on the metric of
rule of law than parts of Asia Greater efforts have
been made recently particularly in Brazil
20 Model projections for income per capita
2010-20 2020-30 2030-40 2040-50
Central and South America Argentina 24 26 27 28 Bolivia 56 52 49 46 Brazil 22 27 31 35 Chile 52 45 40 37 Colombia 30 33 36 38 Costa Rica 37 37 36 36 Cuba 23 30 34 37 Dominican Republic 36 37 37 37 Ecuador 49 48 47 45 El Salvador 39 40 41 41 Guatemala 08 16 24 33 Honduras 28 33 38 42 Mexico 21 39 37 36 Panama 35 34 34 33 Paraguay 48 48 46 45 Peru 54 49 45 41 Uruguay 25 27 28 30 Venezuela 14 20 25 30 Central and South American average
33 36 36 37
Source HSBC estimates
For these reasons the forecasts for income per
capita are not quite as high in many parts of Latin
America as in Asia Of course as discussed
earlier we are not accounting for the regionrsquos rich
endowment of natural resources
19 The lsquoeconomic infrastructurersquo today
GDP per capita
Average years male schooling
Life expectancy
Fertility (average
children per person)
Rule of law Government consumption
Democracy index
Inflation rate
Central and South America Real USD Years Years Children Index Ratio to GDP Index Annual rate Argentina 10517 93 73 22 04 013 08 79 Bolivia 1192 99 66 35 04 014 07 87 Brazil 4711 76 72 19 03 020 08 47 Chile 6083 102 79 19 08 011 10 81 Colombia 3052 77 72 24 03 016 07 56 Costa Rica 5043 87 79 20 06 013 10 102 Cuba 4370 106 79 15 05 032 00 81 Dominican Republic 3697 74 73 26 04 007 08 60 Ecuador 1771 81 75 26 04 011 07 53 El Salvador 2566 80 71 23 03 009 08 41 Guatemala 1858 48 70 41 03 009 07 70 Honduras 1380 75 72 33 03 017 07 81 Mexico 6217 91 75 21 03 011 08 48 Panama 5732 96 76 25 05 011 10 51 Paraguay 1432 85 72 30 03 011 07 70 Peru 2913 90 73 26 06 009 08 35 Uruguay 8942 86 76 20 04 011 10 77 Venezuela 5438 70 73 25 02 012 05 262 Central and South American average
4228 86 74 25 04 014 07 81
Source wwwbarroleecom World Bank Political Risk Services International Country Risk Guide Freedom House Political Rights Index
17
Economics Global 11 January 2012
abc
The demographic outlook for much of Central
South America is very strong particularly in the
smaller countries in the region Of the larger
economies Colombia and Peru stand out for
extremely high working population growth Indeed
at present the populations of Spain and Colombia
are very similar but by 2050 the working
population in Colombia could be 25 larger
Adding the forecasts for income per capita to
those of working population we obtain forecasts
for total GDP (Table 22) The star performer in
the region is Peru where the combination of
strong fundamentals and strong population growth
deliver average growth of 55 for the next 40
years Chile also does very well although
demographics are not quite as favourable as those
in Peru Bolivia Ecuador and Paraguay are also
strong performers although this is partly a
reflection of their low starting point They still lag
much of the region in the economic foundations
used in the model
22 Model projections for total GDP
2010-20 2020-30 2030-40 2040-50
Central and South America Argentina 34 33 31 27 Bolivia 79 69 59 52 Brazil 33 29 29 28 Chile 59 46 40 34 Colombia 45 42 41 40 Costa Rica 51 43 41 36 Cuba 20 22 20 29 Dominican Republic 51 46 42 39 Ecuador 65 57 52 46 El Salvador 51 50 48 45 Guatemala 43 45 46 46 Honduras 56 54 53 50 Mexico 33 44 35 31 Panama 53 46 40 37 Paraguay 70 64 60 52 Peru 69 60 50 42 Uruguay 30 29 29 28 Venezuela 31 32 33 33 Central and South American average
49 45 41 39
Source HSBC estimates
21 Demographic change between now and 2050
-50 0 50 100 150 200 250
CubaBrazilChile
UruguayMex ico
ArgentinaCosta Rica
ColombiaEcuador
DominicanPeru
ElSalv adorPanama
VenezuelaBoliv ia
ParaguayHonduras
Guatemala
change in w orking population betw een now and 2050
Source UN population projections
18
Economics Global 11 January 2012
abc
Central and Eastern Europe Central and Eastern European economies score less
highly than many of the other emerging markets for
inflation control and size of government
But when projecting real income per capita this is
more than compensated for by the exceptional
level of education which for most economies in
the region rivals that of the developed world And
yet while education rates are similar the average
income per capita in the Central and Eastern
Europe block is just one fifth that of the
developed world
For this reason in the context of this model these
economies have great scope to catch up in income
per capita and across the region the forecasts for
income per capita growth are extremely high
(Table 24)
24 Model projections for income per capita
2010-20 2020-30 2030-40 2040-50
Central and Eastern Europe Belarus 59 53 48 45 Bosnia amp Herzegovina 71 63 56 51 Bulgaria 48 47 45 45 Croatia 44 42 39 38 Cyprus 30 29 28 28 Czech Republic 53 45 40 36 Hungary 53 51 44 40 Latvia 56 49 44 40 Lithuania 43 41 39 38 Poland 40 39 38 37 Romania 67 62 54 48 Russia 51 48 46 44 Serbia 68 62 57 53 Slovak Republic 42 39 37 35 Slovenia 30 30 30 30 Turkey 40 39 38 37 Ukraine 89 73 63 56 CEE average 52 48 44 41
Source HSBC estimates
23 The lsquoeconomic infrastructurersquo today
GDP per capita
Average years male schooling
Life expectancy
Fertility (average
children per person)
Rule of law Government consumption
Democracy index
Inflation rate
Central and Eastern Europe Real USD Years Years Children Index Ratio to GDP Index Annual rate Belarus 2556 113 71 14 07 019 00 121 Bosnia and Herzegovina 2162 100 75 12 08 022 05 29 Bulgaria 2542 99 73 15 04 017 10 78 Croatia 6396 90 76 15 08 019 08 38 Cyprus 15510 101 80 15 08 019 10 25 Czech Republic 7225 121 77 15 08 020 10 34 Hungary 5833 117 74 14 07 010 10 61 Latvia 4973 108 72 15 08 017 08 97 Lithuania 5154 109 72 15 07 019 10 70 Poland 6563 99 76 14 08 019 10 35 Romania 2596 104 75 14 07 013 08 61 Russia 2934 97 67 15 07 017 02 116 Serbia 1229 100 74 13 06 020 10 90 Slovak Republic 8042 112 75 13 07 017 10 30 Slovenia 12577 89 79 15 08 017 10 34 Turkey 5088 70 71 21 08 013 05 85 Ukraine 987 111 68 14 07 018 07 180 CEE average 7000 104 74 15 07 018 08 70
Source wwwbarroleecom World Bank Political Risk Services International Country Risk Guide Freedom House Political Rights Index
19
Economics Global 11 January 2012
abc
It is just as well individuals will prove so productive
across the region because demographics are a major
headwind (Chart 25) In vast swathes of the region
the workforce looks set to shrink dramatically This
is largely because of the extremely low level of
fertility As discussed previously these forecasts for
population growth are subject to considerable
uncertainty Indeed in Russia last year an initiative
was launched to try and increase the fertility rate
with the incentive of land provided to couples
producing a third child
As things stand these weak demographics take the
shine slightly off the extremely strong growth in
income per capita Nevertheless the forecasts for
total GDP are still very impressive (Table 26) The
Ukraine is the outperformer with average growth
across the forecast horizon of 6 Again we have to
remember this is coming from an extremely low
base But nevertheless we expect the size of the
Ukrainian economy in constant price constant
exchange rates to increase tenfold by 2050
Some of the smaller Eastern European countries ndash
Romania the Czech Republic and Serbia ndash all do
extremely well particularly in the coming decade
before demographics prove to be more of a drag
And as in the original report we continue to
believe Turkey has an extremely strong long-term
story The combination of strong fundamentals
and the one country in the region with good
demographics should see Turkey maintain a very
respectable pace of growth throughout the
forecast horizon
26 Model projections for total GDP
2010-20 2020-30 2030-40 2040-50
Central and Eastern Europe Belarus 52 43 39 30 Bosnia amp Herzegovina 67 52 44 35 Bulgaria 36 37 33 28 Croatia 38 34 33 28 Cyprus 37 32 33 29 Czech Republic 46 44 36 27 Hungary 47 47 39 32 Latvia 48 42 38 29 Lithuania 34 30 31 29 Poland 33 32 31 21 Romania 61 57 43 35 Russia 42 40 40 33 Serbia 65 59 51 44 Slovak Republic 37 33 30 22 Slovenia 25 24 24 21 Turkey 53 47 40 35 Ukraine 79 63 55 42 CEE average 47 42 38 31
Source HSBC estimates
25 Demographic change between now and 2050
-50 0 50 100 150 200 250
BulgariaBosnia and Herzegovina
BelarusUkrainePoland
RomaniaLithuania
RussiaLatvia
SlovakiaCroatia
SloveniaSerbia
Czech RepublicCyprusTurkey
change in working population between now and 2050
Source UN population projections
20
Economics Global 11 January 2012
abc
Middle East and North Africa Our framework is able to provide some explanation
for the problems currently rocking many parts of
MENA High population growth poor education and
job prospects coupled with a lack of democracy are a
concoction that may explain the social unrest seen
during 2011 In the context of our model these
economies deliver average rates of growth in income
per capita
Being highly endowed with oil has managed to
ensure that income per capita in many of these
nations is already very high This model will
therefore penalise certain countries since it cannot
explain the current level of income per capita with
the variables it considers So we need to take
forecasts for economies such as Qatar with some
pinch of salt These economies may continue to
grow at a rapid pace despite any weakness in the
fundamentals for which our model is accounting
But clearly this source of wealth and the ability to
spread it fairly across the population is a major
source of contention now and will continue to be in
the future
28 Model projections for income per capita
2010-20 2020-30 2030-40 2040-50
Middle East and North Africa Algeria 42 43 43 43 Bahrain 34 30 28 25 Egypt 28 40 42 43 Iran 35 35 35 35 Iraq -06 09 23 37 Israel -03 13 17 21 Jordan 37 37 38 38 Kuwait 33 30 27 24 Lebanon 46 42 39 36 Libya 33 27 28 29 Morocco 31 31 37 42 Oman 24 25 25 25 Qatar 07 10 12 14 Saudi Arabia 20 22 24 26 Syria 22 29 35 41 Tunisia 40 41 42 42 United Arab Emirates 25 23 23 22 Yemen -24 -08 10 30 MENA average 20 24 27 30
Source HSBC estimates
27 The lsquoeconomic infrastructurersquo today
GDP per capita
Average years male schooling
Life expectancy
Fertility (average
children per person)
Rule of law Government consumption
Democracy index
Inflation rate
Middle East and North Africa Real USD Years Years Children Index Ratio to GDP Index Annual rate Algeria 2190 77 72 24 05 011 02 46 Bahrain 16968 96 76 23 08 014 03 32 Egypt 3002 88 70 29 06 011 02 131 Iran 2138 81 71 18 07 013 02 188 Iraq 743 58 68 41 03 023 02 80 Israel 21806 113 81 29 07 025 10 28 Jordan 2497 92 73 35 07 023 03 65 Kuwait 23072 63 78 22 08 014 05 67 Lebanon 6342 92 72 18 07 015 03 12 Libya 7692 79 74 27 07 011 00 64 Morocco 1781 50 71 24 08 018 03 22 Oman 10779 92 76 30 08 019 02 73 Qatar 38466 75 76 24 08 022 02 80 Saudi Arabia 9833 103 73 31 08 022 00 64 Syria 1350 53 74 32 08 011 00 75 Tunisia 2805 73 74 21 08 014 00 40 United Arab Emirates 25607 95 78 19 07 011 02 64 Yemen 565 37 63 52 03 016 03 102 MENA average 11158 77 73 29 07 017 03 79
Source wwwbarroleecom World Bank Political Risk Services International Country Risk Guide Freedom House Political Rights Index
21
Economics Global 11 January 2012
abc
The Middle East is one region where significant
immigration flows make forecasting the size of the
workforce difficult We have seen in the past decade
borders open and close according to ebbs and flows
in demand Nevertheless indigenous population
growth is strong across much of the region But
again we highlight that population growth is only a
good thing for an economy if all the other
foundations are strong This will ensure that these
new workers find jobs If the other fundamentals are
not there then young unemployed individuals
become frustrated which can be a recipe for social
unrest rather than progress
Overall there are lots of caveats to bear in mind
with regards to how this model might not
accurately capture the outlook for parts of the
Middle East In particular we think this
framework is underestimating the potential of
Israel and Qatar
Nevertheless the model does conform to our high
expectations for long-term growth in Egypt and
Saudi Arabia despite some of the near-term
challenges Similarly the outlook looks extremely
robust for Bahrain Jordan and the United Arab
Emirates
30 Model projections for total GDP
2010-20 2020-30 2030-40 2040-50
MENA Algeria 56 54 49 41 Bahrain 57 42 30 27 Egypt 47 56 52 48 Iran 45 44 38 28 Iraq 34 37 42 52 Israel 11 25 25 27 Jordan 59 58 48 42 Kuwait 54 44 31 26 Lebanon 57 45 40 33 Libya 53 43 34 27 Morocco 42 39 40 39 Oman 48 41 37 30 Qatar 21 21 18 13 Saudi Arabia 45 39 35 32 Syria 43 53 48 46 Tunisia 49 46 43 36 United Arab Emirates 47 35 22 09 Yemen 14 25 37 48 MENA average 42 40 36 33
Source HSBC estimates
29 Demographic change between now and 2050
-50 0 50 100 150 200 250
TunisiaLebanon
IranUAE
MoroccoAlgeria
QatarBahrain
Liby aIsrael
Kuw aitEgy ptOman
JordanSaudi Arabia
Sy riaIraq
Yemen
c hange in w orking population betw een now and 2050
Source UN population projections
22
Economics Global 11 January 2012
abc
Sub-Saharan Africa Africa has sadly been the lost continent for many
decades and many parts of the region are still riddled
with corruption civil war and disease Indeed
comparing the averages today for Africa to those of
Asia is disheartening Life expectancy of just 58
versus 71 in Asia and schooling of just 64 years
compared with 84 in Asia are important drawbacks
In addition inflation and a total lack of democracy is
a major problem for some countries
Average real income per capita in Africa is just 7
that of the US with people in many countries living
on less than a dollar a day But again being lsquopoorrsquo
or at a low level of development is not enough to
guarantee growth and for certain countries in the
region our model does not predict that income per
capita will rise significantly in the decade ahead
Countries such as Angola and Uganda appear stuck
in the poverty trap But by assuming governments
will improve these economic flaws we show the
potential for change only time will tell whether
governments are able to deliver on this
32 Model projections for income per capita
2010-20 2020-30 2030-40 2040-50
Africa Angola -03 10 21 32 Cameroon 06 18 29 40 Ethiopia 20 32 43 53 Ghana 31 39 46 52 Kenya 15 26 36 45 Nigeria 09 21 32 42 South Africa 11 19 26 33 Tanzania 36 42 46 50 Uganda -01 13 27 41 Africa average 21 28 35 42
Source HSBC estimates
Nevertheless there are bright spots where already
improvements have been made and the countries
may be turning a corner The model predicts
strongest growth in income per capita for
Tanzania and Ghana although again we are
coming from such an extraordinarily low base
31 The lsquoeconomic infrastructurersquo today
GDP per capita
Average years male schooling
Life expectancy
Fertility (average
children per person)
Rule of law Government consumption
Democracy index
Inflation rate
Africa Angola 1313 73 47 58 05 018 02 128 Cameroon 694 61 51 46 03 010 02 31 Ethiopia 201 61 55 53 08 010 03 234 Ghana 343 78 57 40 04 012 10 155 Kenya 452 73 54 49 03 018 05 151 Nigeria 506 73 48 57 03 018 05 95 South Africa 3710 86 51 25 04 019 08 86 Tanzania 382 73 56 56 08 016 05 98 Uganda 366 54 53 63 06 013 03 104 Africa average 1643 64 58 42 05 014 04 92
Source wwwbarroleecom World Bank Political Risk Services International Country Risk Guide Freedom House Political Rights Index
23
Economics Global 11 January 2012
abc
But the demographic story is extremely strong in
Africa (Chart 33) Indeed half the increase in the
worldrsquos population over the next 40 years will be
in Africa
For those countries that have at least reasonable
prospects for individual prosperity this should
give rise to strong growth in total GDP (Table
34) Again we are coming from a low base
Nigeria deserves a special mention The rapid
population growth in Nigeria means that by 2050
its population will be almost as large as that of the
United States The potential of this country is huge
if the government does manage to deliver the
change that belies these projections
Tanzania is also worth highlighting Again rapid
growth in the population will see it reach almost
140m in 2050 ndash almost twice that of the projection
in either the UK or Germany Given that the
fundamentals are already looking in reasonably
good shape we could see an explosion in growth in
this economy Again we are coming from a low
base ndash income per capita at the moment in
Tanzania in real terms is just USD382 We project
this will rise to only USD2085 by 2050 but given
the growth in the population this would still equate
to a 1700 increase in the size of the economy
Ethiopia so often making the headlines for
poverty and famine appears to be making
progress Indeed last year Ethiopia was one of
the fastest growing economies in the world
delivering more than 10 GDP growth We
forecast strong growth to continue although again
even in 2050 we see income per capita at just 2
that of the US
34 Model projections for total GDP
2010-20 2020-30 2030-40 2040-50
Africa Angola 33 40 48 53 Cameroon 33 44 49 54 Ethiopia 55 63 67 70 Ghana 59 65 66 68 Kenya 46 58 60 63 Nigeria 38 48 52 56 South Africa 16 24 31 35 Tanzania 70 78 76 74 Uganda 43 56 63 68 Africa average 46 51 52 53
Source HSBC estimates
33 Demographic change between now and 2050
-50 0 50 100 150 200 250
SouthAfrica
Cameroon
Nigeria
Ghana
Keny a
Ethiopia
Angola
Tanzania
Uganda
c hange in w orking population betw een now and 2050
Source UN population projections
24
Economics Global 11 January 2012
abc
Putting it all together Considering all these economies we can separate
them into the following three groups (Table 35)
Fast growth ndash gt5 average growth to 2050
The fast-growth economies are those that are at a
low level of development but which have
sufficiently strong underlying fundamentals so that
they catch up with more developed economies with
similarly strong fundamentals
We have already discussed China and India which
sit firmly at the top of this group Elsewhere in Asia
the Philippines Malaysia Bangladesh and Vietnam
all look very strong
In Latin America Peru is the star performer in the
region given it starts from a lower level of
development than some of its counterparts in the
region coupled with strong demographics Many of
the smaller CEEMEA economies also sit here
particularly those with fantastic rates of education
and a good rule of law despite poor demographics
In the Middle East despite near-term uncertainty we
think Egypt has good long-term prospects
Growth ndash 3 lt growth lt5
The lsquogrowthrsquo group are also set to outperform many
of the developed world economies In Asia we
highlight Indonesia and Thailand within this group
and Pakistan owing to the sheer size of working
population Latin America dominates this group of
lsquogrowthrsquo countries Brazil Colombia and Mexico
look very strong and remain firmly in our group of
Top 30 economies in 2050
Stable ndash growth lt3
The stable group of countries offer more limited
growth prospects These largely include the high-
growth ageing economies in the developed world
of which Europe fares particularly badly As
discussed growth in Israel Qatar and UAE may be
underestimated in this model
Conclusions and risks
lsquoRapid growthrsquo is expected by those with a low starting point but
strong fundamentals ndash the Philippines Egypt Peru and Ukraine
lsquoGrowthrsquo economies have strong prospects but a higher starting
point Mexico Turkey Saudi Arabia and Nigeria stand out
A lsquostablersquo group largely the developed world has more limited
potential for growth
25
Economics Global 11 January 2012
abc
35 Which countries will deliver the fastest growth en route to 2050 List ordered based on size of economy in 2050
ChinaIndia
PhilippinesEgypt
MalaysiaPeru
BangladeshAlgeriaUkraineVietnam
UzbekistanTanzania
KazakhstanEcuadorEthiopia
Sri LankaAzerbaijan
KenyaBoliviaJordanUgandaGhana
ParaguayTurkmenistan
HondurasSerbia
Fast growth
BrazilMexicoTurkeyRussia
IndonesiaArgentina
Saudi ArabiaThailand
IranColombiaPakistan
ChileVenezuela
NigeriaRomania
Czech RepublicHungaryKuwait
MoroccoLibya
New ZealandDominican Republic
SyriaTunisia
GuatemalaLebanon
Slovak RepublicOmanAngola
Costa RicaBelarus
IraqPanamaCroatia
El SalvadorCameroonBulgariaBahrain
LithuaniaBosnia and Herzegovina
LatviaYemenCyprus
Growth
United StatesJapan
GermanyUnited Kingdom
FranceCanada
ItalySouth Korea
SpainAustralia
NetherlandsPoland
SwitzerlandSouth Africa
AustriaSwedenBelgium
SingaporeGreeceIsraelIreland
United Arab EmiratesNorwayPortugalFinland
DenmarkCubaQatar
UruguayLuxembourg
Slovenia
Stable
ChinaIndia
PhilippinesEgypt
MalaysiaPeru
BangladeshAlgeriaUkraineVietnam
UzbekistanTanzania
KazakhstanEcuadorEthiopia
Sri LankaAzerbaijan
KenyaBoliviaJordanUgandaGhana
ParaguayTurkmenistan
HondurasSerbia
Fast growth
BrazilMexicoTurkeyRussia
IndonesiaArgentina
Saudi ArabiaThailand
IranColombiaPakistan
ChileVenezuela
NigeriaRomania
Czech RepublicHungaryKuwait
MoroccoLibya
New ZealandDominican Republic
SyriaTunisia
GuatemalaLebanon
Slovak RepublicOmanAngola
Costa RicaBelarus
IraqPanamaCroatia
El SalvadorCameroonBulgariaBahrain
LithuaniaBosnia and Herzegovina
LatviaYemenCyprus
Growth
United StatesJapan
GermanyUnited Kingdom
FranceCanada
ItalySouth Korea
SpainAustralia
NetherlandsPoland
SwitzerlandSouth Africa
AustriaSwedenBelgium
SingaporeGreeceIsraelIreland
United Arab EmiratesNorwayPortugalFinland
DenmarkCubaQatar
UruguayLuxembourg
Slovenia
Stable
Source HSBC estimates
26
Economics Global 11 January 2012
abc
Rose-tinted spectacles We openly admit that behind these projections we
assume governments build on their recent progress
and remain solely focused on increasing the living
standards for their populations Of course this may
be an overly glossy way of viewing the world and
we conclude there are a number of reasons our
lsquoWorld in 2050rsquo could turn out a little different
We consider the main culprits below
Resource constraints
Our calculations have focused on the human
potential of the world economy paying no
attention to the physical constraints of the world
we live in those that are becoming more evident
by the day leading to upward pressure on many
commodity prices
In a follow-up report entitled Energy in 2050 (22
March 2011) we mapped our GDP forecasts into
energy forecasts This exercise certainly gave rise
to some fairly worrying numbers Chart 36 shows
the results for the top 3 economies we consider If
we were in a world of unlimited resources
consumption would explode as the emerging
consumers start to develop a taste for cars and
other energy-hungry domestic appliances Clearly
for our lsquoWorld in 2050rsquo to materialise we need to
change the way we use energy What is
comforting however is that even constraining
ourselves to the technology that we know exists
today it is possible to find a solution that
combines energy efficiency and a move towards
more renewable sources of energy But this does
require major government and industrial foresight
Creating the incentives for all players to change is
the biggest hurdle Rising energy prices are the
most obvious catalyst It seems more likely
change will occur to avoid the cost of high energy
prices rather than a change for the greater good or
even for the potential benefit of children 40 years
down the line
The energy constraint may be another reason why
the emerging world outperforms the cash-strapped
West Starting with a blank sheet of paper and
having governments with borrowing capacity to
deliver change may see these economies
overcome these constraints more quickly than the
cash-strapped West
But our lsquoEnergy in 2050rsquo report also highlighted
that climate change is a major concern Indeed it
is much easier to overcome the energy constraint
than it is to do so while meeting carbon emission
36 We need to use energy more efficiently to reach this potential
0 1000 2000 3000 4000 5000 6000 7000 8000
India
China
US
Today 2050 consumption if resources werent constrained
Total energy use (Million tonnes of oil equiv alent)
Source HSBC estimates
27
Economics Global 11 January 2012
abc
targets In that report we provide a map of
regions most vulnerable to climate change which
is another variable that should be taken into
account when considering an economyrsquos long-
term future
Omitted variables
We have already discussed that our model cannot
capture all the variables that will dictate an
economyrsquos potential We have used a one-size-
fits-all model to provide a very clear and
transparent framework for thinking about
development By starting to tinker with the
projections based on judgment you essentially
create a list based on opinion Instead we chose to
leave the reader to consider idiosyncratic factors
requiring further consideration that mean a
country should feature more highly or indeed
lower down our economic league table
Cyclical fluctuations
Our model is a structural model that should
determine the potential supply of the economy
There are cyclical factors that can cause economies
to deviate from this long-term path For example
it may be that the use of credit had taken the
developed world above its sustainable path and the
slow growth of the past few years is the
readjustment to the long-term sustainable path
Similarly many emerging economies in the past
few years have been growing stronger than our
projections and were encountering inflationary
pressures and thus required policy action to return
the pace of growth to something more sustainable
Border barriers and war
The biggest danger is that the open borders which
have delivered so much prosperity are closed It is
hard to see how such a wave of protectionism
could benefit an individual economy and certainly
not the system as a whole But politiciansrsquo
motivation tends to be focused on the next election
rather than long-term growth As such bad politics
is a key risk to these projections And of course
trade wars can be followed by real wars which
would obviously set this rather glossy outlook way
off track Civil wars are another potential risk in
certain countries
28
Economics Global 11 January 2012
abc
A major shake-up in world order This extension reinforces the findings from our
original 2050 report Plenty of places in the world
look set to deliver very strong rates of growth But
they are not in the developed world which faces
both structural and cyclical headwinds They are
in the emerging world You can see this in action
by viewing the video of which a snapshot is
available on the following page
In the original report we highlighted the
extraordinary prospects for the likes of China
India Malaysia Mexico Colombia and Turkey
These economies themselves are still at an early
stage of development and continue to offer
fantastic growth prospects But increasingly
attention will turn to the lsquonew emergersrsquo Countries
such as the Philippines Peru and Nigeria all
demonstrate some combination of favourable
demographics and strong fundamentals that should
see a significant rise in their economic size
And so there are likely to be some major changes
in the economic league table between now and
2050 with countries such as the Philippines
jumping as many as 27 places (Table 37) The
losers are the small population ageing economies
of Europe Such change may seem remarkable but
it is not abnormal Table 38 ranks the economies
by size today and shows how this rank has
changed in the past four decades China India and
South Korea have already shown excellent lsquoleap-
frog abilityrsquo The relative decline of countries in
Europe that we forecast is an ongoing extension
of a trend already in place
37 Major change may seem unthinkable but such large shifts are common in history
Order based on size of economy in 2010
(constant 2000 USD)
Rank change since 1970
1 United States 0 2 Japan 0 3 China 14 4 Germany -1 5 United Kingdom -1 6 France -1 7 Italy -1 8 India 7 9 Brazil 0 10 Canada -3 11 South Korea 12 12 Spain -4 13 Mexico -3 14 Australia -2 15 Netherlands -4 16 Argentina -3 17 Russia Not available 18 Turkey 2 19 Sweden -5 20 Switzerland Not available
Source World Bank HSBC
We conclude that the world has great potential to
grow in the coming decades but that growth will
not stem from the developed world The EM story
is only just beginning As the lsquonew emergersrsquo
come to the fore emerging economies offer great
potential to power the global economy to 2050
Econom
ics G
lobal 11 January 2012
29
ab
c
We have created a video that tracks the growth in GDP across the various countries through time The chart above shows the final frame of this video
The length of the bars indicates the cumulative percentage increase in GDP for each country relative to 2010 The colour of the bars shows the level of GDP So for example a
long red bar implies that a country has a large GDP and a high rate of GDP growth
Visit httpcachecantoscomflashhsba-r061GDP_growth_2050-WMVwmv to watch how the growth rates for the different countries change between 2010 and 2050
30
Economics Global 11 January 2012
abc
This page has been left blank intentionally
31
Economics Global 11 January 2012
abc
Appendix
32
Economics Global 11 January 2012
abc
Barrorsquos growth model A1 The model
Variable Coefficients
Log GDP -0018 Male schooling 0002 Log GDP schooling -0004 Log life expectancy 0044 Log fertility -0016 Government consumption ratio -0136 Rule of law index 0029 Democracy index 0090 Democracy index squared -0088 Inflation rate -0043
Source Barro with HSBC adjustment to schooling
We made two amendments to Barrorsquos original
model First we lowered slightly the convergence
rate in line with more recent literature (see OECD
2001)
Second it appeared that the original model was
overstating the impact of education In Barrorsquos
original model an extra year of schooling raises
GDP growth by 12ppt Those with very high
levels of education such as Germany were
forecast to grow much more quickly than they
achieved And countries such as India with very
low levels of education were barely forecast to
grow at all However recalibrating the model to
lower the impact of education produced
remarkably accurate forecasts for such a simple
model The main areas of failure are in Asia
where the region in the early part of the 2000-10
period was still recovering from the Asian crisis
In the following tables we show the details of the
two scenarios that we use to build up to our lsquobase
casersquo The first assumes that governments make
no progress in improving their economic
infrastructure The second assumes that
governments make complete progress bring their
economic infrastructure steadily up to those best
in class in each category such as level of
education Our base case sits between these two
scenarios Essentially each country gets halfway
to improving its imperfections
The model
Model projections for the universe under consideration
-10
-5
0
5
10
15
US
Chi
na UK
Italy
Braz
ilS
Kor
eaM
exic
oN
ethe
rland
sR
ussi
aSw
eden
Belg
ium
Saud
i Ara
bia
Hon
g Ko
ngN
orw
ayTh
aila
ndG
reec
eVe
nezu
ela
Egyp
tC
olom
bia
Mal
aysi
aPo
rtuga
lPh
ilippi
nes
Chi
leN
iger
iaAl
geria
New
Viet
nam
Mor
occo
Qat
arC
uba
Slov
akD
omin
ican
Uru
guay
Syria
Leba
non
Gua
tem
ala
Sri L
anka
Bela
rus
Ecua
dor
Cos
ta R
ica
Azer
baija
nBu
lgar
iaM
acao
Ethi
opia
El S
alva
dor
Trin
idad
and
Yem
enC
ypru
sBo
livia
Icel
and
Jam
aica
Para
guay
Moz
ambi
quG
hana
Bots
wan
a
Model Rate Actual rate
Source World Bank and HSBC estimates using Barrorsquos amended model
33
Economics Global 11 January 2012
abc
Scenario 1 Income per capita forecasts if governments make no progress in improving economic infrastructure
2010-20 2020-30 2030-40 2040-50
Algeria 42 38 34 30 Angola -03 -02 -02 -02 Argentina 25 20 16 13 Australia 19 15 13 11 Austria 27 22 18 15 Azerbaijan 61 49 39 31 Bahrain 34 28 23 19 Bangladesh 36 35 34 33 Belarus 59 45 35 27 Belgium 11 10 08 07 Bolivia 56 46 38 31 Bosnia and Herzegovina
71 58 48 39
Brazil 23 18 14 11 Bulgaria 48 39 32 26 Cameroon 06 06 05 05 Canada 19 16 14 12 Chile 52 42 34 27 China 66 52 43 35 Colombia 30 25 21 17 Costa Rica 37 32 27 23 Croatia 44 37 32 27 Cuba 25 20 16 12 Cyprus 30 24 19 16 Czech Republic 53 39 29 21 Denmark 06 05 04 04 Dominican Republic 36 32 29 27 Ecuador 49 44 38 34 Egypt 35 40 34 29 El Salvador 39 34 30 27 Ethiopia 20 19 18 17 Finland 15 13 11 09 France 12 10 08 07 Germany 21 18 15 13 Ghana 31 27 24 22 Greece 30 26 21 17 Guatemala 08 08 08 08 Honduras 28 25 23 20 Hungary 59 44 33 25 India 41 35 30 26 Indonesia 31 26 22 18 Iran 62 52 42 35 Iraq -05 -05 -05 -05 Ireland 16 17 14 12 Israel -01 10 09 08 Italy 21 18 14 12 Japan 12 11 10 09 Jordan 37 31 26 22 Kazakhstan 59 47 38 30 Kenya 15 14 13 12 Kuwait 34 32 30 29
Source HSBC estimates
Scenario 1 Income per capita forecasts if governments make no progress in improving economic infrastructure (cont)
2010-20 2020-30 2030-40 2040-50
Latvia 56 44 34 27 Lebanon 46 39 33 28 Libya 27 24 21 19 Lithuania 43 33 26 20 Luxembourg 16 13 10 08 Malaysia 54 44 36 29 Mexico 36 31 26 21 Morocco 25 25 25 25 Netherlands 12 11 10 08 New Zealand 29 21 15 10 Nigeria 09 08 07 07 Norway 04 06 07 06 Oman 24 21 17 15 Pakistan 15 15 15 14 Panama 35 29 24 20 Paraguay 48 42 36 32 Peru 54 46 39 33 Philippines 61 52 44 38 Poland 41 33 27 22 Portugal 32 29 25 22 Qatar 09 08 07 06 Romania 71 57 46 37 Russia 51 42 35 29 S Korea 39 29 24 19 Saudi Arabia 19 16 14 11 Serbia 68 56 45 37 Singapore 42 32 27 23 Slovak Republic 42 32 25 19 Slovenia 30 26 22 19 South Africa 11 09 07 05 Spain 29 25 20 17 Sri Lanka 52 46 40 35 Sweden 05 06 06 06 Switzerland 26 21 17 14 Syria 22 22 22 21 Tanzania 36 32 30 27 Thailand 38 32 27 23 Tunisia 40 36 33 30 Turkey 40 34 29 25 Turkmenistan 61 49 39 31 Uganda -01 -01 -01 -01 UK 13 11 09 07 Ukraine 87 68 52 41 United Arab Emirates 25 21 17 14 Uruguay 25 22 19 16 US 05 07 07 07 Uzbekistan 67 54 43 34 Venezuela 14 11 08 05 Vietnam 44 42 39 37 Yemen -24 -25 -26 -27
Source HSBC estimates
34
Economics Global 11 January 2012
abc
Scenario 2 Income per capita forecasts if governments make complete progress in improving economic infrastructure catching up with best in class
2010-20 2020-30 2030-40 2040-50
Algeria 42 50 56 60 Angola -03 24 48 69 Argentina 25 31 37 42 Australia 19 24 28 31 Austria 27 30 32 34 Azerbaijan 61 58 56 55 Bahrain 34 33 32 32 Bangladesh 36 56 72 85 Belarus 59 58 59 61 Belgium 11 21 29 35 Bolivia 56 58 59 61 Bosnia and Herzegovina
71 67 64 62
Brazil 23 35 47 57 Bulgaria 48 54 58 63 Cameroon 06 33 58 79 Canada 19 25 30 34 Chile 52 49 46 45 China 66 60 58 57 Colombia 30 41 50 58 Costa Rica 37 43 47 52 Croatia 44 46 48 50 Cuba 25 39 50 61 Cyprus 30 34 37 40 Czech Republic 53 49 46 46 Denmark 06 17 26 33 Dominican Republic 36 43 48 52 Ecuador 49 54 58 60 Egypt 35 38 48 56 El Salvador 39 47 54 59 Ethiopia 20 47 72 92 Finland 15 23 28 33 France 12 21 28 35 Germany 21 28 32 36 Ghana 31 52 70 84 Greece 30 35 38 41 Guatemala 08 28 48 65 Honduras 28 43 56 67 Hungary 59 53 50 49 India 41 54 66 74 Indonesia 31 48 62 74 Iran 62 61 59 59 Iraq -05 26 56 83 Ireland 16 24 27 30 Israel -01 14 25 34 Italy 21 29 35 40 Japan 12 21 27 32 Jordan 37 44 50 54 Kazakhstan 59 56 55 54 Kenya 15 41 63 82 Kuwait 34 32 30 28
Source HSBC estimates
Scenario 2 Income per capita forecasts if governments make complete progress in improving economic infrastructure catching up with best in class (cont)
2010-20 2020-30 2030-40 2040-50
Latvia 56 53 51 51 Lebanon 46 46 46 46 Libya 27 33 39 44 Lithuania 43 47 50 54 Luxembourg 16 19 22 25 Malaysia 54 49 46 43 Mexico 36 41 45 47 Morocco 25 42 56 68 Netherlands 12 22 29 35 New Zealand 29 32 34 36 Nigeria 09 36 60 80 Norway 04 16 23 28 Oman 24 29 34 38 Pakistan 15 39 61 79 Panama 35 40 43 47 Paraguay 48 54 58 61 Peru 54 53 52 52 Philippines 61 61 61 60 Poland 41 44 48 51 Portugal 32 37 41 45 Qatar 09 14 20 26 Romania 71 65 61 58 Russia 51 54 57 60 S Korea 39 37 39 40 Saudi Arabia 19 28 34 40 Serbia 68 68 68 69 Singapore 42 30 26 23 Slovak Republic 42 44 46 49 Slovenia 30 35 39 43 South Africa 11 30 46 60 Spain 29 34 37 40 Sri Lanka 52 59 63 66 Sweden 05 17 26 33 Switzerland 26 26 27 27 Syria 22 40 55 68 Tanzania 36 52 66 77 Thailand 38 47 55 62 Tunisia 40 48 54 59 Turkey 40 44 47 49 Turkmenistan 61 59 58 57 Uganda -01 30 60 87 UK 13 21 27 32 Ukraine 87 77 71 68 United Arab Emirates 25 27 29 30 Uruguay 25 33 40 46 US 05 17 24 29 Uzbekistan 67 66 66 66 Venezuela 14 29 42 53 Vietnam 44 59 71 79 Yemen -24 13 53 91
Source HSBC estimates
35
Economics Global 11 January 2012
abc
Notes
36
Economics Global 11 January 2012
abc
Notes
37
Economics Global 11 January 2012
abc
Notes
38
Economics Global 11 January 2012
abc
Disclosure appendix Analyst Certification The following analyst(s) economist(s) andor strategist(s) who is(are) primarily responsible for this report certifies(y) that the opinion(s) on the subject security(ies) or issuer(s) andor any other views or forecasts expressed herein accurately reflect their personal view(s) and that no part of their compensation was is or will be directly or indirectly related to the specific recommendation(s) or views contained in this research report Karen Ward Nick Robins and Zoe Knight
Important Disclosures This document has been prepared and is being distributed by the Research Department of HSBC and is intended solely for the clients of HSBC and is not for publication to other persons whether through the press or by other means
This document is for information purposes only and it should not be regarded as an offer to sell or as a solicitation of an offer to buy the securities or other investment products mentioned in it andor to participate in any trading strategy Advice in this document is general and should not be construed as personal advice given it has been prepared without taking account of the objectives financial situation or needs of any particular investor Accordingly investors should before acting on the advice consider the appropriateness of the advice having regard to their objectives financial situation and needs If necessary seek professional investment and tax advice
Certain investment products mentioned in this document may not be eligible for sale in some states or countries and they may not be suitable for all types of investors Investors should consult with their HSBC representative regarding the suitability of the investment products mentioned in this document and take into account their specific investment objectives financial situation or particular needs before making a commitment to purchase investment products
The value of and the income produced by the investment products mentioned in this document may fluctuate so that an investor may get back less than originally invested Certain high-volatility investments can be subject to sudden and large falls in value that could equal or exceed the amount invested Value and income from investment products may be adversely affected by exchange rates interest rates or other factors Past performance of a particular investment product is not indicative of future results
Analysts economists and strategists are paid in part by reference to the profitability of HSBC which includes investment banking revenues
For disclosures in respect of any company mentioned in this report please see the most recently published report on that company available at wwwhsbcnetcomresearch
HSBC Legal Entities are listed in the Disclaimer below
Additional disclosures 1 This report is dated as at 11 January 2012 2 All market data included in this report are dated as at close 05 January 2012 unless otherwise indicated in the report 3 HSBC has procedures in place to identify and manage any potential conflicts of interest that arise in connection with its
Research business HSBCs analysts and its other staff who are involved in the preparation and dissemination of Research operate and have a management reporting line independent of HSBCs Investment Banking business Information Barrier procedures are in place between the Investment Banking and Research businesses to ensure that any confidential andor price sensitive information is handled in an appropriate manner
39
Economics Global 11 January 2012
abc
Disclaimer Legal entities as at 04 March 2011 lsquoUAErsquo HSBC Bank Middle East Limited Dubai lsquoHKrsquo The Hongkong and Shanghai Banking Corporation Limited Hong Kong lsquoTWrsquo HSBC Securities (Taiwan) Corporation Limited lsquoCArsquo HSBC Securities (Canada) Inc Toronto HSBC Bank Paris Branch HSBC France lsquoDErsquo HSBC Trinkaus amp Burkhardt AG Duumlsseldorf 000 HSBC Bank (RR) Moscow lsquoINrsquo HSBC Securities and Capital Markets (India) Private Limited Mumbai lsquoJPrsquo HSBC Securities (Japan) Limited Tokyo lsquoEGrsquo HSBC Securities Egypt SAE Cairo lsquoCNrsquo HSBC Investment Bank Asia Limited Beijing Representative Office The Hongkong and Shanghai Banking Corporation Limited Singapore Branch The Hongkong and Shanghai Banking Corporation Limited Seoul Securities Branch The Hongkong and Shanghai Banking Corporation Limited Seoul Branch HSBC Securities (South Africa) (Pty) Ltd Johannesburg lsquoGRrsquo HSBC Securities SA Athens HSBC Bank plc London Madrid Milan Stockholm Tel Aviv lsquoUSrsquo HSBC Securities (USA) Inc New York HSBC Yatirim Menkul Degerler AS Istanbul HSBC Meacutexico SA Institucioacuten de Banca Muacuteltiple Grupo Financiero HSBC HSBC Bank Brasil SA ndash Banco Muacuteltiplo HSBC Bank Australia Limited HSBC Bank Argentina SA HSBC Saudi Arabia Limited The Hongkong and Shanghai Banking Corporation Limited New Zealand Branch
Issuer of report HSBC Bank plc 8 Canada Square London
E14 5HQ United Kingdom
Telephone +44 20 7991 8888 Fax +44 20 7992 4880
Website wwwresearchhsbccom
This document is issued and approved in the United Kingdom by HSBC Bank plc for the information of its Clients (as defined in the Rules of FSA) and those of its affiliates only If this research is received by a customer of an affiliate of HSBC its provision to the recipient is subject to the terms of business in place between the recipient and such affiliate In Australia this publication has been distributed by The Hongkong and Shanghai Banking Corporation Limited (ABN 65 117 925 970 AFSL 301737) for the general information of its ldquowholesalerdquo customers (as defined in the Corporations Act 2001) Where distributed to retail customers this research is distributed by HSBC Bank Australia Limited (AFSL No 232595) These respective entities make no representations that the products or services mentioned in this document are available to persons in Australia or are necessarily suitable for any particular person or appropriate in accordance with local law No consideration has been given to the particular investment objectives financial situation or particular needs of any recipient The document is distributed in Hong Kong by The Hongkong and Shanghai Banking Corporation Limited and in Japan by HSBC Securities (Japan) Limited Each of the companies listed above (the ldquoParticipating Companiesrdquo) is a member of the HSBC Group of Companies any member of which may trade for its own account as Principal may have underwritten an issue within the last 36 months or together with its Directors officers and employees may have a long or short position in securities or instruments or in any related instrument mentioned in the document Brokerage or fees may be earned by the Participating Companies or persons associated with them in respect of any business transacted by them in all or any of the securities or instruments referred to in this document In Korea this publication is distributed by either The Hongkong and Shanghai Banking Corporation Limited Seoul Securities Branch (HBAP SLS) or The Hongkong and Shanghai Banking Corporation Limited Seoul Branch (HBAP SEL) for the general information of professional investors specified in Article 9 of the Financial Investment Services and Capital Markets Act (ldquoFSCMArdquo) This publication is not a prospectus as defined in the FSCMA It may not be further distributed in whole or in part for any purpose Both HBAP SLS and HBAP SEL are regulated by the Financial Services Commission and the Financial Supervisory Service of Korea This publication is distributed in New Zealand by The Hongkong and Shanghai Banking Corporation Limited New Zealand Branch The information in this document is derived from sources the Participating Companies believe to be reliable but which have not been independently verified The Participating Companies make no guarantee of its accuracy and completeness and are not responsible for errors of transmission of factual or analytical data nor shall the Participating Companies be liable for damages arising out of any personrsquos reliance upon this information All charts and graphs are from publicly available sources or proprietary data The opinions in this document constitute the present judgement of the Participating Companies which is subject to change without notice This document is neither an offer to sell purchase or subscribe for any investment nor a solicitation of such an offer HSBC Securities (USA) Inc accepts responsibility for the content of this research report prepared by its non-US foreign affiliate All US persons receiving andor accessing this report and intending to effect transactions in any security discussed herein should do so with HSBC Securities (USA) Inc in the United States and not with its non-US foreign affiliate the issuer of this report In Singapore this publication is distributed by The Hongkong and Shanghai Banking Corporation Limited Singapore Branch for the general information of institutional investors or other persons specified in Sections 274 and 304 of the Securities and Futures Act (Chapter 289) (ldquoSFArdquo) and accredited investors and other persons in accordance with the conditions specified in Sections 275 and 305 of the SFA This publication is not a prospectus as defined in the SFA It may not be further distributed in whole or in part for any purpose The Hongkong and Shanghai Banking Corporation Limited Singapore Branch is regulated by the Monetary Authority of Singapore Recipients in Singapore should contact a Hongkong and Shanghai Banking Corporation Limited Singapore Branch representative in respect of any matters arising from or in connection with this report HSBC Meacutexico SA Institucioacuten de Banca Muacuteltiple Grupo Financiero HSBC is authorized and regulated by Secretariacutea de Hacienda y Creacutedito Puacuteblico and Comisioacuten Nacional Bancaria y de Valores (CNBV) HSBC Bank (Panama) SA is regulated by Superintendencia de Bancos de Panama Banco HSBC Honduras SA is regulated by Comisioacuten Nacional de Bancos y Seguros (CNBS) Banco HSBC Salvadorentildeo SA is regulated by Superintendencia del Sistema Financiero (SSF) HSBC Colombia SA is regulated by Superintendencia Financiera de Colombia Banco HSBC Costa Rica SA is supervised by Superintendencia General de Entidades Financieras (SUGEF) Banistmo Nicaragua SA is authorized and regulated by Superintendencia de Bancos y de Otras Instituciones Financieras (SIBOIF) The document is intended to be distributed in its entirety Unless governing law permits otherwise you must contact a HSBC Group member in your home jurisdiction if you wish to use HSBC Group services in effecting a transaction in any investment mentioned in this document HSBC Bank plc is registered in England No 14259 is authorised and regulated by the Financial Services Authority and is a member of the London Stock Exchange (070905) copy Copyright HSBC Bank plc 2012 ALL RIGHTS RESERVED No part of this publication may be reproduced stored in a retrieval system or transmitted on any form or by any means electronic mechanical photocopying recording or otherwise without the prior written permission of HSBC Bank plc MICA (P) 208042011 and MICA (P) 040042011
[317638]
40
abc
Global
Stephen King Global Head of Economics +44 20 7991 6700 stephenkinghsbcibcom
Karen Ward Senior Global Economist +44 20 7991 3692 karenwardhsbcibcom
Madhur Jha +44 20 7991 6755 madhurjhahsbcibcom
Europe amp United Kingdom
Janet Henry Chief European Economist +44 20 7991 6711 janethenryhsbcibcom
Simon Wells Chief UK Economist +44 20 7991 6718 simonwellshsbcibcom
Astrid Schilo +44 20 7991 6708 astridschilohsbcibcom
Germany Lothar Hessler +49 21 1910 2906 lotharhesslerhsbcde
France Mathilde Lemoine +33 1 4070 3266 mathildelemoinehsbcfr
North America
Kevin Logan Chief US Economist +1 212 525 3195 kevinrloganushsbccom
Ryan Wang +1 212 525 3181 ryanwangushsbccom
Asia Pacific
Qu Hongbin Managing Director Co-head Asian Economics Research and Chief Economist Greater China +852 2822 2025 hongbinquhsbccomhk
Frederic Neumann Managing Director Co-head Asian Economics Research +852 2822 4556 fredericneumannhsbccomhk
Leif Eskesen Chief Economist India amp ASEAN +65 6239 0840 leifeskesenhsbccomsg
Paul Bloxham Chief Economist Australia and New Zealand +61 2925 52635 paulbloxhamhsbccomau
Donna Kwok +852 2996 6621 donnahjkwokhsbccomhk
Trinh Nguyen +852 2822 6975 trinhdnguyenhsbccomhk
Ronald Man +852 2996 6743 ronaldmanhsbccomhk
Luke Hartigan +612 9255 2635 lukehartiganhsbccomau
Sun Junwei +86 10 5999 8234 junweisunhsbccomcn
Sophia Ma +86 10 5999 8232 xiaopingmahsbccomcn
Global Emerging Markets
Pablo Goldberg Head of Global EM Research +1 212 525 8729 pabloagoldberghsbccom
Bertrand Delgado EM Strategist +1 212 525 0745 bertrandjdelgadoushsbccom
Emerging Europe Middle East and Africa
Murat Ulgen Chief Economist +44 20 7991 6782 muratulgenhsbccom
Agata Urbanska +44 20 7992 2774 agataurbanskahsbcibcom
Alexander Morozov +7 495 783 8855 alexandermorozovhsbccom
Simon Williams +971 4 507 7614 simonwilliamshsbccom
Melis Metiner +90 212 376 4618 melismetinerhsbccomtr
Latin America
Andre Loes Chief Economist Latin America +55 11 3371 8184 andrealoeshsbccombr
Argentina Javier Finkman Chief Economist South America ex-Brazil +54 11 4344 8144 javierfinkmanhsbccomar
Ramiro D Blazquez Senior Economist +54 11 4348 5759 ramiroblazquezhsbccomar
Jorge Morgenstern Senior Economist +54 11 4130 9229 jorgemorgensternhsbccomar
Brazil Constantin Jancso Senior Economist +55 11 3371 8183 constantincjancsohsbccombr
Marcos Fernandes +55 11 6847 9787 marcosrfernandeshsbccombr
Mexico Sergio Martin Chief Economist +52 55 5721 2164 sergiomartinmhsbccommx
Claudia Navarrete Economist +52 55 5721 2422 claudianavarretehsbccommx
Central America Lorena Dominguez Economist +52 55 5721 2172 lorenadominguezhsbccommx
Global Economics Research Team
Karen WardSenior Global EconomistHSBC Bank plc+44 20 7991 3692karenwardhsbcibcom
Karen joined HSBC in 2006 as UK economist In 2010 she was appointed Senior Global Economist with responsibility for monitoringchallenges facing the global economy and their implications for financial markets Before joining HSBC in 2006 Karen worked at theBank of England where she provided supporting analysis for the Monetary Policy Committee She has an MSc Economics fromUniversity College London

4
Economics Global 11 January 2012
abc
3 The economic league table in 2050
______ Size of economy in_______ __________ Income per capita in ___________ ____Population _____ 2010
Bn Constant 2000 USD
2050 Bn Constant
2000 USD
Change in rank
2010 Constant
2000 USD
Rank 2050 Constant
2000 USD
Rank 2010
Mn
2050
Mn
1 China 3511 25334 2 2579 63 17759 54 1362 1426 2 United States 11548 22270 -1 36354 6 55134 8 318 404 3 India 960 8165 5 790 88 5060 86 1214 1614 4 Japan 5008 6429 -2 39435 3 63244 4 127 102 5 Germany 2058 3714 -1 25083 18 52683 10 82 71 6 United Kingdom 1711 3576 -1 27646 11 49412 14 62 72 7 Brazil 921 2960 2 4711 52 13547 61 195 219 8 Mexico 688 2810 5 6217 42 21793 47 111 129 9 France 1496 2750 -3 23881 20 40643 21 63 68 10 Canada 892 2287 0 26335 15 51485 12 34 44 11 Italy 1124 2194 -4 18703 23 38445 23 60 57 12 Turkey 385 2149 6 5088 49 22063 46 76 97 13 South Korea 798 2056 -2 16463 25 46657 17 49 44 14 Spain 711 1954 -2 15699 26 38111 24 45 51 15 Russia 412 1878 2 2934 58 16174 56 140 116 16 Philippines 112 1688 27 1215 83 10893 72 93 155 17 Indonesia 274 1502 4 1178 85 5215 85 233 288 18 Australia 565 1480 -4 26244 16 51523 11 22 29 19 Argentina 428 1477 -2 10517 33 29001 38 41 51 20 Egypt 160 1165 15 3002 57 8996 76 84 130 21 Malaysia 146 1160 17 5224 47 29247 37 28 40 22 Saudi Arabia 258 1128 1 9833 34 25845 43 26 44 23 Thailand 187 856 6 2744 61 11674 68 68 73 24 Netherlands 439 798 -9 26376 14 45839 18 17 17 25 Poland 250 786 -1 6563 39 24547 45 38 32 26 Peru 85 735 20 2913 59 18940 53 29 39 27 Iran 161 732 7 2138 72 7547 81 75 97 28 Colombia 142 725 12 3052 56 11530 69 46 63 29 Switzerland 294 711 -9 38739 4 83559 3 8 9 30 Pakistan 111 675 14 657 92 2455 91 174 275 31 Bangladesh 78 673 17 482 95 3461 89 149 194 32 Chile 103 592 12 6083 43 29513 36 17 20 33 Venezuela 158 558 2 5438 46 13268 63 29 42 34 Algeria 76 538 14 2190 70 11566 70 35 47 35 South Africa 187 529 -8 3710 54 9308 75 50 57 36 Austria 222 520 -11 26455 13 61124 6 8 9 37 Nigeria 78 515 9 506 94 1323 98 158 390 38 Sweden 295 507 -20 31778 8 47941 15 9 11 39 Belgium 265 481 -18 24758 19 41842 20 11 11 40 Ukraine 45 462 19 987 86 12818 65 45 36 41 Vietnam 59 451 11 674 91 4335 88 88 104 42 Singapore 165 441 -11 34110 7 84405 2 5 5 43 Greece 161 424 -11 14382 29 38756 22 11 11 44 Israel 168 402 -14 21806 22 37731 25 7 11 45 Ireland 147 386 -9 27965 10 61363 5 5 6 46 Romania 56 377 9 2596 62 20357 51 21 19 47 United Arab Emirates 118 360 -6 25607 17 29651 35 8 12 48 Norway 199 352 -22 40933 2 59234 7 5 6 49 Czech Republic 76 342 0 7225 38 32153 32 10 11 50 Portugal 123 336 -10 11588 31 35863 28 11 9
Source World Bank UN population projections and HSBC estimates Note China includes Hong Kong and Macao given full unification is planned for 2047 and 2049 Income per capita forecasts are not the cumulative sum of the forecasts for income per capita presented later in the document This is because the GDP created by the working population must be shared between the population as a whole not just the working population
5
Economics Global 11 January 2012
abc
3 The economic league table in 2050 (continued)
______ Size of economy in_______ __________ Income per capita in ___________ ____Population _____ 2010
Bn Constant 2000 USD
2050 Bn Constant
2000 USD
Change in rank
2010 Constant
2000 USD
Rank 2050 Constant
2000 USD
Rank 2010 Mn
2050 Mn
51 Uzbekistan 25 314 22 893 87 8859 77 27 35 52 Hungary 58 295 1 5833 44 31966 33 10 9 53 Tanzania 16 288 34 382 97 2085 92 45 138 54 Kazakhstan 38 287 7 2376 68 13520 62 16 21 55 Kuwait 61 280 -4 23072 21 54183 9 3 5 56 Morocco 58 279 -2 1781 75 7110 82 32 39 57 Finland 145 270 -19 27151 12 49643 13 5 5 58 Denmark 172 265 -29 31418 9 47743 16 5 6 59 Libya 49 230 -2 7692 37 26182 42 6 9 60 New Zealand 64 214 -10 14939 28 37705 26 4 6 61 Dominican Republic 37 212 1 3697 55 16406 55 10 13 62 Ecuador 24 206 14 1771 76 10546 73 14 20 63 Ethiopia 17 196 23 201 100 1352 97 83 145 64 Syria 28 181 2 1397 78 5470 84 20 33 65 Sri Lanka 25 175 7 1233 81 7558 80 21 23 66 Azerbaijan 20 168 14 2303 69 14482 59 9 12 67 Kenya 18 163 16 452 96 1683 95 41 97 68 Tunisia 29 160 -3 2805 60 12686 66 10 13 69 Guatemala 26 152 1 1858 73 4826 87 14 32 70 Lebanon 27 148 -2 6342 41 31659 34 4 5 71 Bolivia 12 145 25 1192 84 8652 78 10 17 72 Slovak Republic 44 145 -12 8042 36 27639 39 5 5 73 Oman 30 138 -10 10779 32 36832 27 3 4 74 Angola 24 134 1 1313 80 3170 90 19 42 75 Costa Rica 23 124 3 5043 50 20588 50 5 6 76 Belarus 25 122 -2 2556 65 15207 57 10 8 77 Cuba 49 121 -19 4370 53 12202 67 11 10 78 Iraq 23 117 -1 743 89 1410 96 32 83 79 Qatar 54 112 -23 38466 5 43027 19 2 3 80 Jordan 15 112 9 2497 67 11317 71 6 10 81 Uganda 12 111 14 366 98 1179 99 33 94 82 Panama 20 110 -1 5732 45 21423 48 4 5 83 Croatia 28 105 -16 6396 40 27091 41 4 4 84 El Salvador 16 104 4 2566 64 13729 60 6 8 85 Ghana 8 100 22 343 99 2035 94 24 49 86 Paraguay 9 99 17 1432 77 9587 74 6 10 87 Turkmenistan 9 97 15 1827 74 14659 58 5 7 88 Uruguay 30 93 -24 8942 35 25482 44 3 4 89 Honduras 10 82 11 1380 79 6337 83 8 13 90 Cameroon 14 79 1 694 90 2048 93 20 38 91 Serbia 9 75 13 1229 82 8565 79 10 9 92 Bulgaria 19 72 -10 2542 66 13154 64 7 5 93 Luxembourg 26 68 -24 52388 1 96592 1 1 1 94 Slovenia 26 66 -23 12577 30 32971 31 2 2 95 Bahrain 13 61 -3 16968 24 33910 29 1 2 96 Lithuania 17 59 -12 5154 48 20955 49 3 3 97 Bosnia amp Herzegovina 8 56 10 2162 71 18961 52 4 3 98 Latvia 11 52 0 4973 51 27143 40 2 2 99 Yemen 13 45 -8 565 93 731 100 24 62 100 Cyprus 12 45 -7 15510 27 33337 30 1 1
Source World Bank UN population projections and HSBC estimates Income per capita forecasts are not the cumulative sum of the forecasts for income per capita presented later in the document This is because the GDP created by the working population must be shared between the population as a whole not just the working population
6
Economics Global 11 January 2012
abc
What makes economies grow Clearly this is a question Western policymakers are
grappling with right now If we step away from the
cyclicality there are two ways economies can grow
either add more people to the production line via
growth in the working population or make each
individual more productive
Let us start by considering individual productivity
As in the original framework we lean heavily on the
empirical work of Harvardrsquos Professor Robert Barro
(full details of the model can be found in the
Appendix) We back-tested the model on our
extended sample of countries and are pleased with
the actual outcome for growth relative to the
projections in the period of 2000 to 2010 (Chart 4)
The first set of variables Professor Barro highlighted
as crucial to driving growth in individual
productivity are those that drive lsquohuman capitalrsquo ndash
health education and fertility The second set of
variables determine the likelihood of fixed capital
investment to equip workers with tools and
technology These are rule of law (which
encompasses patent and property rights)
government interference democracy and monetary
control (which is proxied by the inflation rate)
Good foundations
Our framework considers what stage of development each
economy is at todayhellip
hellip and whether they have the potential and the fundamental
characteristics necessary to catch up with the developed world
Current growth rates play no role in these projections
4 Modelrsquos back-test does a surprisingly good job given the vast array of countries considered
-10
-5
0
5
10
15
US
Chi
na UK
Italy
Braz
ilS
Kor
eaM
exic
oN
ethe
rland
sR
ussi
aSw
eden
Belg
ium
Saud
i Ara
bia
Hon
g Ko
ngN
orw
ayTh
aila
ndG
reec
eVe
nezu
ela
Egyp
tC
olom
bia
Mal
aysi
aPo
rtuga
lPh
ilippi
nes
Chi
leN
iger
iaAl
geria
New
Viet
nam
Mor
occo
Qat
arC
uba
Slov
akD
omin
ican
Uru
guay
Syria
Leba
non
Gua
tem
ala
Sri L
anka
Bela
rus
Ecua
dor
Cos
ta R
ica
Azer
baija
nBu
lgar
iaM
acao
Ethi
opia
El S
alva
dor
Trin
idad
and
Yem
enC
ypru
sBo
livia
Icel
and
Jam
aica
Para
guay
Moz
ambi
quG
hana
Bots
wan
a
Model Rate Actual rate
Source World Bank HSBC projections
7
Economics Global 11 January 2012
abc
Education
It is worth spending a moment discussing
education given its importance in the model
Whether individuals can adapt to the worldrsquos
given technology or even push the technology
frontier out depends on the level of education
5 Quality of education is most important but it is well correlated with time spent at school
300
400
500
600
5 6 7 8 9 10 11 12 13 14
300
400
500
600
Av erage y ears o f schooling
Qua
lity
of s
choo
ling
Source Barrolee dataset and PISA
Owing to data availability we focus on the
number of years of schooling This of course is
not a perfect metric since we would really want to
capture quality of education PISA (Programme
for International Student Assessment) is an
international study that aims to evaluate education
systems worldwide by testing the skills and
knowledge of 15-year-old students in certain
countries in reading maths and scientific literacy
This is plotted in Chart 5 alongside our measure of
education Quantity of schooling is a good but not
perfect proxy for quality of education For
example for nine and half years of education the
UK appears to do a much better job in gaining
results obtaining a PISA score of 500 against
Argentina which for a similar input scores just
395 For reference five of the top eight scoring
countries on this survey are in Asia
Democracy
Democracy is another variable worth discussing
given its controversy The success of democratic
systems is most likely explained by the freedom of
speech and creativity that leads to successful
entrepreneurs In addition they provide checks and
balances to ensure governments do not become
excessively powerful absorbing any improvement
in the countryrsquos prosperity for their own benefit
Democracy therefore is highly correlated with
our measure of rule of law (Chart 6)
6 Democracy does not always guarantee good rule of law
00
02
04
06
08
10
12
00 02 04 06 08 10
Democracy Index
Rul
e of
Law
Inde
x
M exico amp Brazil
China amp Saudi Arabia
Source Political Risk Services Freedom House Political Rights Index
But there are authoritarian regimes such as China
and Saudi Arabia that have delivered a good lsquorule of
lawrsquo In parts of Latin America democracy has done
little to improve rule of law Even in highly
democratic systems you can still see corruption
Professor Barrorsquos work actually showed that too
much democracy was not necessarily a good thing
for economic growth (of course it may be the best
model for social development) He found that at very
high levels of democracy income redistribution
becomes a dominant force which serves to restrain
entrepreneurial endeavour And democracy places a
disproportionate weight on winning current votes
potentially at the expense of future votes and
therefore can hinder the investment required for
long-term development
8
Economics Global 11 January 2012
abc
Many years of lsquocopy and pastersquo growth left
The most potent recipe for growth is a country
that scores highly on the fundamentals discussed
but currently has low income per capita These
economies should deliver the highest growth in
income per capita as they lsquocatch uprsquo with those
with similar fundamentals Economies with poor
governance and low education will remain stuck
in this low-income trap This has been the position
a number of African nations have found
themselves in for so long
As economies become wealthier and technology
more sophisticated they will gradually lose the
advantages of lsquostarting from behindrsquo The initial
years of development could be described as lsquocopy
and pastersquo growth as countries open themselves
up and adapt to the worldrsquos existing technologies
Of course various lsquoiron curtainsrsquo meant that many
economies did not open themselves up to either
the new technologies created in the Western
economies or the worldrsquos supply of capital until
recently
Once the lsquocopy and pastersquo growth is complete
countries will need to be sufficiently sophisticated
to operate at the lsquofrontierrsquo driving technological
change It is at this point that many economies
struggle and get stuck in what is often known as
the middle-income trap
But many of the countries we are considering are
still at such an extremely low level of
development that there are years of this lsquocopy and
pastersquo growth ahead
We think this is where many of the bears on
China are wrong One of the most commonly
cited reasons for concern about China is the high
rate of investment as a percentage of GDP Many
compare this rate of investment with the rates
seen during the expansion of Asian lsquotigersrsquo in the
1970s and claim that it is too rapid and that
Chinarsquos policymakers must be pouring money
into unproductive investment (Chart 7)
7 Comparing China today with Japan or Korea in the 1970s is unfairhellip
0
10
20
30
40
50
China today Japan 1970 South Korea 1970
of GDP Inv es tment
Source World Bank
8 hellip because China is at a much lower level of development today than they were then
0
20
40
60
80
0 5 10 15 20 25
0
20
40
60
80
US Japan China
Share of employ ment w ithin primary industry
Real GDP per capita chained 1990 USD000s
Japan in
1970
China today
Source World Bank
But the starting point of comparison is wrong
because Chinarsquos level of development today is so
much lower than that of the Asian tigers before
their rapid expansion (Chart 8) It is for this
reason we believe the strong rate of investment is
entirely justified ndash providing China with much-
needed basic infrastructure
9
Economics Global 11 January 2012
abc
Demographic dividends Using this model to establish how productive each
individual will be we must consider now how
many individuals there will be
They may not flash up on our Bloomberg screens
once a month but demographics are an extremely
important driver of growth There are two effects
First and most straightforward it is generally
easier to produce more stuff when you have more
people on the production line The second impact
is a little more subtle and relates to the ratio of
working population to total population As
Stephen King discusses in lsquoLosing controlrsquo (2010
Yale University Press) when you have many
lsquoproducersrsquo but not many lsquodependentsrsquo the burden
on producers perhaps because of tax payments to
support the elderly and young are small and
therefore the rewards for effort are great
Therefore demographic burdens can in turn feed
back to individual productivity
9 Japanrsquos demographic downturn will have played a key role in its economic malaise
-5
0
5
10
15
20
1955 1965 1975 1985 1995 2005
-1
0
1
2
3
4
GDP grow th (LHS)Working population grow th (RHS)
Yr YrJapan
Source World Bank
Japan shows the economic perils of a declining
working population only too well While many
put Japanrsquos lost decades down to deleveraging
following the build-up of debt in the 1980s it
seems likely that it had at least as much to do with
the dramatic decline in working population
growth over the past 50 years (Chart 9)
As the projections for working population stand
demographics alone could explain a large part of
what are likely to be huge differences in economic
performance in the coming years Contrast Japan
and Russia whose working populations will shrink
by more than 1 per annum for the next four
decades with Nigeria whose working population
will rise by 3 per annum
But as we have explained population growth is
not itself enough to guarantee growth You need
the other foundations to ensure jobs are created for
these new entrants to the labour market So our
projections for total GDP build up using our
earlier forecasts for income per capita based on
the economic infrastructure and the number of
lsquocapitasrsquo - the change in working population As
we will see little progress is made in countries
without the right lsquoeconomic infrastructurersquo even if
their populations are growing
10
Economics Global 11 January 2012
abc
The fine print A few words on the technicalities and caveats of
the framework before we get into the results
As in the original report we are working in
constant price constant 2000 USD exchange
rate terms Further appreciation of emerging
market currencies against the USD will only
extend the conclusions of the report
The source of the data on economic infrastructure
is contained in Table 10 To get to our base case
projections we consider two scenarios The first
assumes the lsquoeconomic infrastructurersquo is fixed at
that evident today But to constrain these
economies on the assumption they will not make
any further improvements would be unfair For
example there is a clear trend that education
standards across the emerging world are improving
We then consider a second scenario in which we
assume that over the next 40 years all economies
reach the lsquooptimalrsquo economic infrastructure This is
the highest possible level of achievement from any
of the countries in our sample
The results of these two scenarios are shown in the
Appendix Our base-case scenario sits between
these two options Essentially each country gets
halfway to eliminating its imperfections
Economic snakes and ladders
Asia is the stand-out region ndash with a notable showing by the
Philippines
LATAM fares well with Peru emerging into the spotlight
Other strong performers include Egypt Nigeria Turkey and
Ukraine
10 Data description
Variable Description Source
Average years of male schooling The average number of years spent in education by males in 2010 (for this extension for many countries the distinction between male and female was not available and we have therefore taken average education across gender) In addition in a very limited number of countries the data was not available and therefore our regional specialists used their judgment to determine an appropriate proxy
wwwbarroleecom
Life expectancy The life expectancy of total population in 2008 natural log taken World Bank Fertility The number of births per woman in 2008 natural log taken World Bank Rule of law An index between 0 and 1 which measures the attractiveness of the investment climate based
on the level of law enforcement contract sanctity and property rights Data for 2009 Political Risk Services International Country Risk Guide
Government consumption Percentage of GDP accounted for by government consumption in 2008 World Bank Democracy index Indicator of political rights measures the right of all adults to vote and compete for public office
and to have a decisive vote on public policies Measured between 0 and 1 (full democracy) Freedom House Political Rights Index
Inflation rate CPI inflation ( year) average 2004-07 World Bank
11
Economics Global 11 January 2012
abc
We are clearly assuming governments continue to
improve the underlying economic infrastructure
implementing reform increasing education and so
forth and remain friendly with their neighbours
Of course this may turn out to be a rather
Panglossian view of government behaviour The
two scenarios in the Appendix provide some
guidance as to the sensitivity of the projections to
this underlying assumption that governments
continue to lsquodo the right thingrsquo
In addition our model will not capture all the
variables that dictate an economyrsquos potential
There may be idiosyncratic factors that mean a
country should feature more highly or indeed
lower down our economic league table
The variable that is most often debated is a
countryrsquos endowment of natural resources Surely
a country with a rich array of natural resources
should outperform those without This may well
be the case but not always We have often seen
countries rich in natural resources suffer from
lsquoDutch diseasersquo This is a situation in which the
capital inflows to exploit the domestic commodity
industry put upward pressure on the domestic
exchange rate which in turn damages other
industrial areas In addition the presence of natural
resources can also lead to an increase in corruption
and so the benefits of the natural wealth do little
for the population as a whole Therefore
empirically it is not absolutely clear that those rich
in natural resources should get a natural boost so
this is one variable we do not include and leave
readers to assess whether in their opinion a
country should feature higher in the table
There are numerous other variables that fall in this
list of needing further consideration such as
extreme religious fundamentalism and relations
with the rest of the world (eg Iran)
We should also highlight some potential caveats
to the demographic projections we are using
These estimates made by the UN take into
account current fertility rates and policy on
retirement and migration
But these working-age projections are subject to a
considerable degree of uncertainty The most
tricky is disease which could raise the mortality
rate or by contrast medical breakthroughs which
could lower it Immigration flows could also send
these projections wildly off course decreasing
prospects for one part of the world while boosting
prospects elsewhere The changes we are
highlighting in this document could give rise to a
great migration which has all sorts of
implications for border frictions The history of
the US is a case in point In the 1950s and early
60s there were demographic concerns about the
US But the 1965 Immigration and Naturalisation
Act saw a huge new wave of migrants which
coupled with a higher fertility rate among
migrants gave rise to a fresh demographic boost
Government policy could also throw these
projections wildly off course if incentives via the
tax system manage successfully to lift or reduce
the fertility rate
Therefore we emphasise this exercise is a starting
point for considering the long-term outlook and
should not be taken as our explicit forecast Our
regional economists will be able to provide more
accurate near-term forecasts taking into account
factors the model is unable to capture and cyclical
considerations
12
Economics Global 11 January 2012
abc
Developed world Countries in the developed world might be
considered to be at the technology lsquofrontierrsquo With
income per capita already high these economies do
not get any lsquocatch uprsquo boost so rely on the other
variables in the model (education rule of law etc)
for technological progress to deliver further gains
in individual prosperity
That said there are still large variations across the
developed world with real income per capita in
Portugal at just over USD115k compared with
USD37k in the US Those with similar economic
infrastructure to the US but with lower income per
capita will therefore get a lsquocatch uprsquo boost This
explains why the model provides higher income
per capita forecasts for the likes of Spain and
Greece (Table 12) which may seem implausible
given their current difficulties
12 Model projections for income per capita
2010-20 2020-30 2030-40 2040-50
Developed world Australia 18 20 21 22 Austria 27 26 25 24 Belgium 12 15 19 21 Canada 19 21 22 23 Denmark 06 11 15 18 Finland 16 18 19 21 France 12 15 18 21 Germany 21 22 23 24 Greece 31 30 29 29 Ireland 19 20 20 21 Italy 16 24 25 27 Japan 13 16 19 20 Luxembourg 16 16 16 17 Netherlands 13 16 19 21 New Zealand 29 27 26 26 Norway 05 11 15 17 Portugal 32 32 32 32 Spain 24 31 30 29 Sweden 05 11 16 19 Switzerland 26 24 22 21 United Kingdom 14 16 18 20 United States 06 11 15 18 Developed world avg 17 20 21 22
Source HSBC estimates
11 The lsquoeconomic infrastructurersquo today
GDP per capita
Average years male schooling
Life expectancy
Fertility (average
children per person)
Rule of law Government consumption
Democracy index
Inflation rate
Developed world Real USD Years Years Children Index Ratio to GDP Index Annual rate Australia 26244 121 81 19 09 017 10 28 Austria 26445 95 80 14 10 018 10 20 Belgium 24758 105 80 18 08 023 10 21 Canada 26355 113 80 16 09 019 10 16 Denmark 31418 101 78 18 10 026 10 21 Finland 27151 100 79 18 10 022 10 22 France 23881 105 81 19 08 023 10 15 Germany 25083 118 80 13 08 018 10 17 Greece 14382 106 79 15 08 017 10 28 Ireland 27965 116 78 21 10 016 10 15 Italy 18703 95 81 14 07 020 10 20 Japan 39435 115 82 13 08 018 10 00 Luxembourg 52388 101 81 16 10 015 10 20 Netherlands 26376 110 80 17 10 025 10 18 New Zealand 14939 127 80 22 09 019 10 28 Norway 40933 122 80 19 10 020 10 22 Portugal 11588 80 79 14 08 020 10 15 Spain 15699 103 81 14 08 019 10 22 Sweden 31778 115 81 19 10 026 10 18 Switzerland 38739 99 82 14 08 011 10 09 United Kingdom 27646 96 79 19 09 021 10 26 United States 36364 122 78 21 08 016 10 21 Developed world average 27200 108 81 17 09 019 10 19
Source wwwbarroleecom World Bank Political Risk Services International Country Risk Guide Freedom House Political Rights Index
13
Economics Global 11 January 2012
abc
The major headwind to growth in much of the
developed world stems from demographics This
is less of a problem for Australasia North
America the UK and Ireland which are all likely
to see population growth in the coming decades
By contrast the demographics in much of Europe
are challenging putting their debt problems into
an even more worrying light With debt levels
rising and the number of taxpayers falling it
becomes even harder to get the arithmetic to add
up Ironically Germany is one of the few
countries in the Eurozone not experiencing
funding difficulties but is in the worst structural
situation so far as demographics are concerned
Trying to get the debt arithmetic to add up for
Europe is a straightforward task compared with
Japan Japanrsquos gross debt to GDP now stands at
more than 200 and the number of people paying
taxes in the coming four decades will fall by 40
Adding the outlook for income per capita to the
number of lsquocapitasrsquo we see that with one
exception the developed world is not able to offer
more than 3 growth The lowest forecasts are
for Japan which fails to achieve more than 1
growth throughout the forecast horizon By
contrast the highest performer is New Zealand
14 Model projections for total GDP
2010-20 2020-30 2030-40 2040-50
Developed world Australia 24 23 25 26 Austria 27 19 19 21 Belgium 10 12 17 21 Canada 23 21 26 25 Denmark 05 08 11 20 Finland 11 14 19 19 France 11 14 16 21 Germany 17 11 14 17 Greece 29 26 22 21 Ireland 28 28 22 19 Italy 14 19 15 21 Japan 04 09 05 08 Luxembourg 28 22 23 25 Netherlands 11 12 15 22 New Zealand 34 30 29 29 Norway 09 13 15 21 Portugal 30 26 23 22 Spain 28 29 23 22 Sweden 04 13 17 21 Switzerland 26 20 20 23 United Kingdom 16 17 19 22 United States 11 14 19 21 Developed world avg 18 18 19 21
Source HSBC estimates
13 Demographic change between now and 2050
-50 0 50 100 150 200 250
JapanGermany
PortugalItaly
HungaryGreeceAustriaSpain
FinlandNetherlands
DenmarkBelgiumFrance
Sw itzerlandSw eden
UKNorw ayCanada
New ZealandUS
AustraliaIreland
Lux embourg
change in w orking population betw een now and 2050
Source UN population projections
14
Economics Global 11 January 2012
abc
Asia Many parts of Asia have extremely high standards of
education and rule of law Singapore and South
Korea of course being clear examples which would
explain why these economies have already seen such
rapid increases in income per capita Other countries
in the region have made enormous progress in
improving their economic infrastructure but are still
reasonably poor and therefore have great potential to
catch up Chinarsquos income per capita is currently just
7 that of the US Adding up the annual projections
shown in Table 16 we project Chinarsquos income per
capita to grow by more than 800 between now and
2050 This might seem an astonishing number But
keep in mind this base effect Despite this rapid
growth in 2050 Chinarsquos income per capita is still
just 32 that of the US We are only capturing part
of Chinarsquos development story here and the likelihood
is that these numbers turn out to be too conservative
rather than too optimistic The same is true of the
Philippines which looks set for a multi-decade run
of strong growth
16 Model projections for income per capita
2010-20 2020-30 2030-40 2040-50
Asia Azerbaijan 61 54 48 44 Bangladesh 36 44 50 55 China 65 57 51 46 India 40 45 48 51 Indonesia 30 37 42 47 Kazakhstan 59 52 47 43 South Korea 37 34 31 30 Malaysia 54 46 41 36 Pakistan 15 25 35 44 Philippines 61 56 52 48 Singapore 36 32 27 23 Sri Lanka 52 52 50 49 Thailand 37 40 41 42 Turkmenistan 61 55 49 45 Uzbekistan 67 60 55 51 Vietnam 47 49 52 55 Asia average 48 46 45 44
Source HSBC estimates
But being lsquopoorrsquo is not enough to guarantee growth
in income per capita The projections for Pakistan
demonstrate this Because of low scores for
schooling life expectancy rule of law and
democracy Pakistan has little potential for income
per capita to grow near term despite a low starting
point But given we assume governments will make
progress on some of these flaws so growth will start
to pick up in countries such as Pakistan and
Bangladesh
15 The lsquoeconomic infrastructurersquo today
GDP per capita
Average years male schooling
Life expectancy
Fertility (average
children per person)
Rule of law Government consumption
Democracy index
Inflation rate
Asia Real USD Years Years Children Index Ratio to GDP Index Annual rate Azerbaijan 2303 104 70 23 06 010 02 129 Bangladesh 482 58 66 23 04 006 03 78 China 2579 98 73 18 08 014 00 33 India 790 67 63 27 07 010 08 85 Indonesia 1178 62 70 22 05 008 08 76 Kazakhstan 2376 104 66 25 07 011 02 117 South Korea 16463 118 79 12 08 015 08 33 Malaysia 5224 101 74 26 07 012 05 27 Pakistan 657 56 67 40 05 009 02 138 Philippines 1215 90 72 31 04 010 05 51 Singapore 34110 91 80 13 08 010 03 31 Sri Lanka 1233 84 74 23 05 015 05 139 Thailand 2744 75 68 18 04 012 02 23 Turkmenistan 1827 104 65 25 07 009 00 78 Uzbekistan 893 104 68 26 07 017 00 78 Vietnam 674 64 74 21 07 006 00 128 Asia average 4220 84 71 23 06 011 03 78
Source wwwbarroleecom World Bank Political Risk Services International Country Risk Guide Freedom House Political Rights Index
15
Economics Global 11 January 2012
abc
From a demographic standpoint Asia is also a
reasonably mixed bag ndash this is where the shine
slightly comes off the China story since its one-
child policy of yester years will start to see the
working population decline from around 2020
Singapore and South Korea while not enforced
have also seen a staggering decline in fertility
rates in the past couple of decades which will see
their working populations also decline Singapore
has been exploring the possibility of reversing this
trend through an aggressive immigration policy
By contrast other parts of Asia ndash India Pakistan
the Philippines Bangladesh and Malaysia ndash all
have rapidly growing populations In 2050 the
population of Pakistan at roughly 290m will be
just shy of four times the population of the UK
Adding the forecasts for working population to
those of income per capita we get to projections
for total GDP growth in Table 18 There are some
truly remarkable hot spots in Asia China
continues to grow at a rapid pace although the
pace is expected to slow beyond 2020 as the
demographic drag starts to hinder overall GDP
growth Nevertheless we still expect average
GDP growth of more than 5 per annum for the
next 40 years The star performer however is the
Philippines where the combination of strong
fundamentals and powerful demographics gives
rise to an average growth rate of 7 for the
coming 40 years Central Asia is also interesting
Kazakhstan Turkmenistan and Uzbekistan all
perform extremely well in the context of this
model on the back of strong growth in a very
well-educated population The absence of
democracy however prevents these economies
reaching their full potential
18 Model projections for total GDP
2010-20 2020-30 2030-40 2040-50
Asia Azerbaijan 70 57 50 41 Bangladesh 55 55 56 55 China 67 55 44 41 India 57 56 55 52 Indonesia 43 43 43 45 Kazakhstan 61 58 49 40 South Korea 37 23 18 17 Malaysia 71 57 47 38 Pakistan 40 45 49 50 Philippines 84 73 66 58 Singapore 37 21 20 21 Sri Lanka 54 53 49 43 Thailand 40 38 38 40 Turkmenistan 77 64 56 45 Uzbekistan 82 69 61 50 Vietnam 57 53 51 48 Asia average 58 51 47 43
Source HSBC estimates
17 Demographic change between now and 2050
-50 0 50 100 150 200 250
S KoreaSingapore
ChinaThailand
Sri LankaVietnam
KazakhstanAzerbaijanIndonesia
UzbekistanTurkmenistan
BangladeshIndia
Malay siaPhilippines
Pakistan
change in w orking population betw een now and 2050
Source UN population projections
16
Economics Global 11 January 2012
abc
Central and South America The potential of economies in Latin America has
been unleashed in recent decades as they have
managed to tame the inflation that plagued their
economies for much of the 1970s and 1980s
(Table 19) It is remarkable to think that between
1986 and 1994 Brazil suffered several years of
inflation of over 500 Such has been the
turnaround in its economic management that it is
now imposing taxes on foreign investors to
prevent capital inflows Of course we are
assuming that inflation is prevented from ever
creeping back into the system Maintaining small
governments and low levels of debt will surely
help prevent these economies from returning to
their old ways
The level of schooling is high although many of
these economies score less highly on the metric of
rule of law than parts of Asia Greater efforts have
been made recently particularly in Brazil
20 Model projections for income per capita
2010-20 2020-30 2030-40 2040-50
Central and South America Argentina 24 26 27 28 Bolivia 56 52 49 46 Brazil 22 27 31 35 Chile 52 45 40 37 Colombia 30 33 36 38 Costa Rica 37 37 36 36 Cuba 23 30 34 37 Dominican Republic 36 37 37 37 Ecuador 49 48 47 45 El Salvador 39 40 41 41 Guatemala 08 16 24 33 Honduras 28 33 38 42 Mexico 21 39 37 36 Panama 35 34 34 33 Paraguay 48 48 46 45 Peru 54 49 45 41 Uruguay 25 27 28 30 Venezuela 14 20 25 30 Central and South American average
33 36 36 37
Source HSBC estimates
For these reasons the forecasts for income per
capita are not quite as high in many parts of Latin
America as in Asia Of course as discussed
earlier we are not accounting for the regionrsquos rich
endowment of natural resources
19 The lsquoeconomic infrastructurersquo today
GDP per capita
Average years male schooling
Life expectancy
Fertility (average
children per person)
Rule of law Government consumption
Democracy index
Inflation rate
Central and South America Real USD Years Years Children Index Ratio to GDP Index Annual rate Argentina 10517 93 73 22 04 013 08 79 Bolivia 1192 99 66 35 04 014 07 87 Brazil 4711 76 72 19 03 020 08 47 Chile 6083 102 79 19 08 011 10 81 Colombia 3052 77 72 24 03 016 07 56 Costa Rica 5043 87 79 20 06 013 10 102 Cuba 4370 106 79 15 05 032 00 81 Dominican Republic 3697 74 73 26 04 007 08 60 Ecuador 1771 81 75 26 04 011 07 53 El Salvador 2566 80 71 23 03 009 08 41 Guatemala 1858 48 70 41 03 009 07 70 Honduras 1380 75 72 33 03 017 07 81 Mexico 6217 91 75 21 03 011 08 48 Panama 5732 96 76 25 05 011 10 51 Paraguay 1432 85 72 30 03 011 07 70 Peru 2913 90 73 26 06 009 08 35 Uruguay 8942 86 76 20 04 011 10 77 Venezuela 5438 70 73 25 02 012 05 262 Central and South American average
4228 86 74 25 04 014 07 81
Source wwwbarroleecom World Bank Political Risk Services International Country Risk Guide Freedom House Political Rights Index
17
Economics Global 11 January 2012
abc
The demographic outlook for much of Central
South America is very strong particularly in the
smaller countries in the region Of the larger
economies Colombia and Peru stand out for
extremely high working population growth Indeed
at present the populations of Spain and Colombia
are very similar but by 2050 the working
population in Colombia could be 25 larger
Adding the forecasts for income per capita to
those of working population we obtain forecasts
for total GDP (Table 22) The star performer in
the region is Peru where the combination of
strong fundamentals and strong population growth
deliver average growth of 55 for the next 40
years Chile also does very well although
demographics are not quite as favourable as those
in Peru Bolivia Ecuador and Paraguay are also
strong performers although this is partly a
reflection of their low starting point They still lag
much of the region in the economic foundations
used in the model
22 Model projections for total GDP
2010-20 2020-30 2030-40 2040-50
Central and South America Argentina 34 33 31 27 Bolivia 79 69 59 52 Brazil 33 29 29 28 Chile 59 46 40 34 Colombia 45 42 41 40 Costa Rica 51 43 41 36 Cuba 20 22 20 29 Dominican Republic 51 46 42 39 Ecuador 65 57 52 46 El Salvador 51 50 48 45 Guatemala 43 45 46 46 Honduras 56 54 53 50 Mexico 33 44 35 31 Panama 53 46 40 37 Paraguay 70 64 60 52 Peru 69 60 50 42 Uruguay 30 29 29 28 Venezuela 31 32 33 33 Central and South American average
49 45 41 39
Source HSBC estimates
21 Demographic change between now and 2050
-50 0 50 100 150 200 250
CubaBrazilChile
UruguayMex ico
ArgentinaCosta Rica
ColombiaEcuador
DominicanPeru
ElSalv adorPanama
VenezuelaBoliv ia
ParaguayHonduras
Guatemala
change in w orking population betw een now and 2050
Source UN population projections
18
Economics Global 11 January 2012
abc
Central and Eastern Europe Central and Eastern European economies score less
highly than many of the other emerging markets for
inflation control and size of government
But when projecting real income per capita this is
more than compensated for by the exceptional
level of education which for most economies in
the region rivals that of the developed world And
yet while education rates are similar the average
income per capita in the Central and Eastern
Europe block is just one fifth that of the
developed world
For this reason in the context of this model these
economies have great scope to catch up in income
per capita and across the region the forecasts for
income per capita growth are extremely high
(Table 24)
24 Model projections for income per capita
2010-20 2020-30 2030-40 2040-50
Central and Eastern Europe Belarus 59 53 48 45 Bosnia amp Herzegovina 71 63 56 51 Bulgaria 48 47 45 45 Croatia 44 42 39 38 Cyprus 30 29 28 28 Czech Republic 53 45 40 36 Hungary 53 51 44 40 Latvia 56 49 44 40 Lithuania 43 41 39 38 Poland 40 39 38 37 Romania 67 62 54 48 Russia 51 48 46 44 Serbia 68 62 57 53 Slovak Republic 42 39 37 35 Slovenia 30 30 30 30 Turkey 40 39 38 37 Ukraine 89 73 63 56 CEE average 52 48 44 41
Source HSBC estimates
23 The lsquoeconomic infrastructurersquo today
GDP per capita
Average years male schooling
Life expectancy
Fertility (average
children per person)
Rule of law Government consumption
Democracy index
Inflation rate
Central and Eastern Europe Real USD Years Years Children Index Ratio to GDP Index Annual rate Belarus 2556 113 71 14 07 019 00 121 Bosnia and Herzegovina 2162 100 75 12 08 022 05 29 Bulgaria 2542 99 73 15 04 017 10 78 Croatia 6396 90 76 15 08 019 08 38 Cyprus 15510 101 80 15 08 019 10 25 Czech Republic 7225 121 77 15 08 020 10 34 Hungary 5833 117 74 14 07 010 10 61 Latvia 4973 108 72 15 08 017 08 97 Lithuania 5154 109 72 15 07 019 10 70 Poland 6563 99 76 14 08 019 10 35 Romania 2596 104 75 14 07 013 08 61 Russia 2934 97 67 15 07 017 02 116 Serbia 1229 100 74 13 06 020 10 90 Slovak Republic 8042 112 75 13 07 017 10 30 Slovenia 12577 89 79 15 08 017 10 34 Turkey 5088 70 71 21 08 013 05 85 Ukraine 987 111 68 14 07 018 07 180 CEE average 7000 104 74 15 07 018 08 70
Source wwwbarroleecom World Bank Political Risk Services International Country Risk Guide Freedom House Political Rights Index
19
Economics Global 11 January 2012
abc
It is just as well individuals will prove so productive
across the region because demographics are a major
headwind (Chart 25) In vast swathes of the region
the workforce looks set to shrink dramatically This
is largely because of the extremely low level of
fertility As discussed previously these forecasts for
population growth are subject to considerable
uncertainty Indeed in Russia last year an initiative
was launched to try and increase the fertility rate
with the incentive of land provided to couples
producing a third child
As things stand these weak demographics take the
shine slightly off the extremely strong growth in
income per capita Nevertheless the forecasts for
total GDP are still very impressive (Table 26) The
Ukraine is the outperformer with average growth
across the forecast horizon of 6 Again we have to
remember this is coming from an extremely low
base But nevertheless we expect the size of the
Ukrainian economy in constant price constant
exchange rates to increase tenfold by 2050
Some of the smaller Eastern European countries ndash
Romania the Czech Republic and Serbia ndash all do
extremely well particularly in the coming decade
before demographics prove to be more of a drag
And as in the original report we continue to
believe Turkey has an extremely strong long-term
story The combination of strong fundamentals
and the one country in the region with good
demographics should see Turkey maintain a very
respectable pace of growth throughout the
forecast horizon
26 Model projections for total GDP
2010-20 2020-30 2030-40 2040-50
Central and Eastern Europe Belarus 52 43 39 30 Bosnia amp Herzegovina 67 52 44 35 Bulgaria 36 37 33 28 Croatia 38 34 33 28 Cyprus 37 32 33 29 Czech Republic 46 44 36 27 Hungary 47 47 39 32 Latvia 48 42 38 29 Lithuania 34 30 31 29 Poland 33 32 31 21 Romania 61 57 43 35 Russia 42 40 40 33 Serbia 65 59 51 44 Slovak Republic 37 33 30 22 Slovenia 25 24 24 21 Turkey 53 47 40 35 Ukraine 79 63 55 42 CEE average 47 42 38 31
Source HSBC estimates
25 Demographic change between now and 2050
-50 0 50 100 150 200 250
BulgariaBosnia and Herzegovina
BelarusUkrainePoland
RomaniaLithuania
RussiaLatvia
SlovakiaCroatia
SloveniaSerbia
Czech RepublicCyprusTurkey
change in working population between now and 2050
Source UN population projections
20
Economics Global 11 January 2012
abc
Middle East and North Africa Our framework is able to provide some explanation
for the problems currently rocking many parts of
MENA High population growth poor education and
job prospects coupled with a lack of democracy are a
concoction that may explain the social unrest seen
during 2011 In the context of our model these
economies deliver average rates of growth in income
per capita
Being highly endowed with oil has managed to
ensure that income per capita in many of these
nations is already very high This model will
therefore penalise certain countries since it cannot
explain the current level of income per capita with
the variables it considers So we need to take
forecasts for economies such as Qatar with some
pinch of salt These economies may continue to
grow at a rapid pace despite any weakness in the
fundamentals for which our model is accounting
But clearly this source of wealth and the ability to
spread it fairly across the population is a major
source of contention now and will continue to be in
the future
28 Model projections for income per capita
2010-20 2020-30 2030-40 2040-50
Middle East and North Africa Algeria 42 43 43 43 Bahrain 34 30 28 25 Egypt 28 40 42 43 Iran 35 35 35 35 Iraq -06 09 23 37 Israel -03 13 17 21 Jordan 37 37 38 38 Kuwait 33 30 27 24 Lebanon 46 42 39 36 Libya 33 27 28 29 Morocco 31 31 37 42 Oman 24 25 25 25 Qatar 07 10 12 14 Saudi Arabia 20 22 24 26 Syria 22 29 35 41 Tunisia 40 41 42 42 United Arab Emirates 25 23 23 22 Yemen -24 -08 10 30 MENA average 20 24 27 30
Source HSBC estimates
27 The lsquoeconomic infrastructurersquo today
GDP per capita
Average years male schooling
Life expectancy
Fertility (average
children per person)
Rule of law Government consumption
Democracy index
Inflation rate
Middle East and North Africa Real USD Years Years Children Index Ratio to GDP Index Annual rate Algeria 2190 77 72 24 05 011 02 46 Bahrain 16968 96 76 23 08 014 03 32 Egypt 3002 88 70 29 06 011 02 131 Iran 2138 81 71 18 07 013 02 188 Iraq 743 58 68 41 03 023 02 80 Israel 21806 113 81 29 07 025 10 28 Jordan 2497 92 73 35 07 023 03 65 Kuwait 23072 63 78 22 08 014 05 67 Lebanon 6342 92 72 18 07 015 03 12 Libya 7692 79 74 27 07 011 00 64 Morocco 1781 50 71 24 08 018 03 22 Oman 10779 92 76 30 08 019 02 73 Qatar 38466 75 76 24 08 022 02 80 Saudi Arabia 9833 103 73 31 08 022 00 64 Syria 1350 53 74 32 08 011 00 75 Tunisia 2805 73 74 21 08 014 00 40 United Arab Emirates 25607 95 78 19 07 011 02 64 Yemen 565 37 63 52 03 016 03 102 MENA average 11158 77 73 29 07 017 03 79
Source wwwbarroleecom World Bank Political Risk Services International Country Risk Guide Freedom House Political Rights Index
21
Economics Global 11 January 2012
abc
The Middle East is one region where significant
immigration flows make forecasting the size of the
workforce difficult We have seen in the past decade
borders open and close according to ebbs and flows
in demand Nevertheless indigenous population
growth is strong across much of the region But
again we highlight that population growth is only a
good thing for an economy if all the other
foundations are strong This will ensure that these
new workers find jobs If the other fundamentals are
not there then young unemployed individuals
become frustrated which can be a recipe for social
unrest rather than progress
Overall there are lots of caveats to bear in mind
with regards to how this model might not
accurately capture the outlook for parts of the
Middle East In particular we think this
framework is underestimating the potential of
Israel and Qatar
Nevertheless the model does conform to our high
expectations for long-term growth in Egypt and
Saudi Arabia despite some of the near-term
challenges Similarly the outlook looks extremely
robust for Bahrain Jordan and the United Arab
Emirates
30 Model projections for total GDP
2010-20 2020-30 2030-40 2040-50
MENA Algeria 56 54 49 41 Bahrain 57 42 30 27 Egypt 47 56 52 48 Iran 45 44 38 28 Iraq 34 37 42 52 Israel 11 25 25 27 Jordan 59 58 48 42 Kuwait 54 44 31 26 Lebanon 57 45 40 33 Libya 53 43 34 27 Morocco 42 39 40 39 Oman 48 41 37 30 Qatar 21 21 18 13 Saudi Arabia 45 39 35 32 Syria 43 53 48 46 Tunisia 49 46 43 36 United Arab Emirates 47 35 22 09 Yemen 14 25 37 48 MENA average 42 40 36 33
Source HSBC estimates
29 Demographic change between now and 2050
-50 0 50 100 150 200 250
TunisiaLebanon
IranUAE
MoroccoAlgeria
QatarBahrain
Liby aIsrael
Kuw aitEgy ptOman
JordanSaudi Arabia
Sy riaIraq
Yemen
c hange in w orking population betw een now and 2050
Source UN population projections
22
Economics Global 11 January 2012
abc
Sub-Saharan Africa Africa has sadly been the lost continent for many
decades and many parts of the region are still riddled
with corruption civil war and disease Indeed
comparing the averages today for Africa to those of
Asia is disheartening Life expectancy of just 58
versus 71 in Asia and schooling of just 64 years
compared with 84 in Asia are important drawbacks
In addition inflation and a total lack of democracy is
a major problem for some countries
Average real income per capita in Africa is just 7
that of the US with people in many countries living
on less than a dollar a day But again being lsquopoorrsquo
or at a low level of development is not enough to
guarantee growth and for certain countries in the
region our model does not predict that income per
capita will rise significantly in the decade ahead
Countries such as Angola and Uganda appear stuck
in the poverty trap But by assuming governments
will improve these economic flaws we show the
potential for change only time will tell whether
governments are able to deliver on this
32 Model projections for income per capita
2010-20 2020-30 2030-40 2040-50
Africa Angola -03 10 21 32 Cameroon 06 18 29 40 Ethiopia 20 32 43 53 Ghana 31 39 46 52 Kenya 15 26 36 45 Nigeria 09 21 32 42 South Africa 11 19 26 33 Tanzania 36 42 46 50 Uganda -01 13 27 41 Africa average 21 28 35 42
Source HSBC estimates
Nevertheless there are bright spots where already
improvements have been made and the countries
may be turning a corner The model predicts
strongest growth in income per capita for
Tanzania and Ghana although again we are
coming from such an extraordinarily low base
31 The lsquoeconomic infrastructurersquo today
GDP per capita
Average years male schooling
Life expectancy
Fertility (average
children per person)
Rule of law Government consumption
Democracy index
Inflation rate
Africa Angola 1313 73 47 58 05 018 02 128 Cameroon 694 61 51 46 03 010 02 31 Ethiopia 201 61 55 53 08 010 03 234 Ghana 343 78 57 40 04 012 10 155 Kenya 452 73 54 49 03 018 05 151 Nigeria 506 73 48 57 03 018 05 95 South Africa 3710 86 51 25 04 019 08 86 Tanzania 382 73 56 56 08 016 05 98 Uganda 366 54 53 63 06 013 03 104 Africa average 1643 64 58 42 05 014 04 92
Source wwwbarroleecom World Bank Political Risk Services International Country Risk Guide Freedom House Political Rights Index
23
Economics Global 11 January 2012
abc
But the demographic story is extremely strong in
Africa (Chart 33) Indeed half the increase in the
worldrsquos population over the next 40 years will be
in Africa
For those countries that have at least reasonable
prospects for individual prosperity this should
give rise to strong growth in total GDP (Table
34) Again we are coming from a low base
Nigeria deserves a special mention The rapid
population growth in Nigeria means that by 2050
its population will be almost as large as that of the
United States The potential of this country is huge
if the government does manage to deliver the
change that belies these projections
Tanzania is also worth highlighting Again rapid
growth in the population will see it reach almost
140m in 2050 ndash almost twice that of the projection
in either the UK or Germany Given that the
fundamentals are already looking in reasonably
good shape we could see an explosion in growth in
this economy Again we are coming from a low
base ndash income per capita at the moment in
Tanzania in real terms is just USD382 We project
this will rise to only USD2085 by 2050 but given
the growth in the population this would still equate
to a 1700 increase in the size of the economy
Ethiopia so often making the headlines for
poverty and famine appears to be making
progress Indeed last year Ethiopia was one of
the fastest growing economies in the world
delivering more than 10 GDP growth We
forecast strong growth to continue although again
even in 2050 we see income per capita at just 2
that of the US
34 Model projections for total GDP
2010-20 2020-30 2030-40 2040-50
Africa Angola 33 40 48 53 Cameroon 33 44 49 54 Ethiopia 55 63 67 70 Ghana 59 65 66 68 Kenya 46 58 60 63 Nigeria 38 48 52 56 South Africa 16 24 31 35 Tanzania 70 78 76 74 Uganda 43 56 63 68 Africa average 46 51 52 53
Source HSBC estimates
33 Demographic change between now and 2050
-50 0 50 100 150 200 250
SouthAfrica
Cameroon
Nigeria
Ghana
Keny a
Ethiopia
Angola
Tanzania
Uganda
c hange in w orking population betw een now and 2050
Source UN population projections
24
Economics Global 11 January 2012
abc
Putting it all together Considering all these economies we can separate
them into the following three groups (Table 35)
Fast growth ndash gt5 average growth to 2050
The fast-growth economies are those that are at a
low level of development but which have
sufficiently strong underlying fundamentals so that
they catch up with more developed economies with
similarly strong fundamentals
We have already discussed China and India which
sit firmly at the top of this group Elsewhere in Asia
the Philippines Malaysia Bangladesh and Vietnam
all look very strong
In Latin America Peru is the star performer in the
region given it starts from a lower level of
development than some of its counterparts in the
region coupled with strong demographics Many of
the smaller CEEMEA economies also sit here
particularly those with fantastic rates of education
and a good rule of law despite poor demographics
In the Middle East despite near-term uncertainty we
think Egypt has good long-term prospects
Growth ndash 3 lt growth lt5
The lsquogrowthrsquo group are also set to outperform many
of the developed world economies In Asia we
highlight Indonesia and Thailand within this group
and Pakistan owing to the sheer size of working
population Latin America dominates this group of
lsquogrowthrsquo countries Brazil Colombia and Mexico
look very strong and remain firmly in our group of
Top 30 economies in 2050
Stable ndash growth lt3
The stable group of countries offer more limited
growth prospects These largely include the high-
growth ageing economies in the developed world
of which Europe fares particularly badly As
discussed growth in Israel Qatar and UAE may be
underestimated in this model
Conclusions and risks
lsquoRapid growthrsquo is expected by those with a low starting point but
strong fundamentals ndash the Philippines Egypt Peru and Ukraine
lsquoGrowthrsquo economies have strong prospects but a higher starting
point Mexico Turkey Saudi Arabia and Nigeria stand out
A lsquostablersquo group largely the developed world has more limited
potential for growth
25
Economics Global 11 January 2012
abc
35 Which countries will deliver the fastest growth en route to 2050 List ordered based on size of economy in 2050
ChinaIndia
PhilippinesEgypt
MalaysiaPeru
BangladeshAlgeriaUkraineVietnam
UzbekistanTanzania
KazakhstanEcuadorEthiopia
Sri LankaAzerbaijan
KenyaBoliviaJordanUgandaGhana
ParaguayTurkmenistan
HondurasSerbia
Fast growth
BrazilMexicoTurkeyRussia
IndonesiaArgentina
Saudi ArabiaThailand
IranColombiaPakistan
ChileVenezuela
NigeriaRomania
Czech RepublicHungaryKuwait
MoroccoLibya
New ZealandDominican Republic
SyriaTunisia
GuatemalaLebanon
Slovak RepublicOmanAngola
Costa RicaBelarus
IraqPanamaCroatia
El SalvadorCameroonBulgariaBahrain
LithuaniaBosnia and Herzegovina
LatviaYemenCyprus
Growth
United StatesJapan
GermanyUnited Kingdom
FranceCanada
ItalySouth Korea
SpainAustralia
NetherlandsPoland
SwitzerlandSouth Africa
AustriaSwedenBelgium
SingaporeGreeceIsraelIreland
United Arab EmiratesNorwayPortugalFinland
DenmarkCubaQatar
UruguayLuxembourg
Slovenia
Stable
ChinaIndia
PhilippinesEgypt
MalaysiaPeru
BangladeshAlgeriaUkraineVietnam
UzbekistanTanzania
KazakhstanEcuadorEthiopia
Sri LankaAzerbaijan
KenyaBoliviaJordanUgandaGhana
ParaguayTurkmenistan
HondurasSerbia
Fast growth
BrazilMexicoTurkeyRussia
IndonesiaArgentina
Saudi ArabiaThailand
IranColombiaPakistan
ChileVenezuela
NigeriaRomania
Czech RepublicHungaryKuwait
MoroccoLibya
New ZealandDominican Republic
SyriaTunisia
GuatemalaLebanon
Slovak RepublicOmanAngola
Costa RicaBelarus
IraqPanamaCroatia
El SalvadorCameroonBulgariaBahrain
LithuaniaBosnia and Herzegovina
LatviaYemenCyprus
Growth
United StatesJapan
GermanyUnited Kingdom
FranceCanada
ItalySouth Korea
SpainAustralia
NetherlandsPoland
SwitzerlandSouth Africa
AustriaSwedenBelgium
SingaporeGreeceIsraelIreland
United Arab EmiratesNorwayPortugalFinland
DenmarkCubaQatar
UruguayLuxembourg
Slovenia
Stable
Source HSBC estimates
26
Economics Global 11 January 2012
abc
Rose-tinted spectacles We openly admit that behind these projections we
assume governments build on their recent progress
and remain solely focused on increasing the living
standards for their populations Of course this may
be an overly glossy way of viewing the world and
we conclude there are a number of reasons our
lsquoWorld in 2050rsquo could turn out a little different
We consider the main culprits below
Resource constraints
Our calculations have focused on the human
potential of the world economy paying no
attention to the physical constraints of the world
we live in those that are becoming more evident
by the day leading to upward pressure on many
commodity prices
In a follow-up report entitled Energy in 2050 (22
March 2011) we mapped our GDP forecasts into
energy forecasts This exercise certainly gave rise
to some fairly worrying numbers Chart 36 shows
the results for the top 3 economies we consider If
we were in a world of unlimited resources
consumption would explode as the emerging
consumers start to develop a taste for cars and
other energy-hungry domestic appliances Clearly
for our lsquoWorld in 2050rsquo to materialise we need to
change the way we use energy What is
comforting however is that even constraining
ourselves to the technology that we know exists
today it is possible to find a solution that
combines energy efficiency and a move towards
more renewable sources of energy But this does
require major government and industrial foresight
Creating the incentives for all players to change is
the biggest hurdle Rising energy prices are the
most obvious catalyst It seems more likely
change will occur to avoid the cost of high energy
prices rather than a change for the greater good or
even for the potential benefit of children 40 years
down the line
The energy constraint may be another reason why
the emerging world outperforms the cash-strapped
West Starting with a blank sheet of paper and
having governments with borrowing capacity to
deliver change may see these economies
overcome these constraints more quickly than the
cash-strapped West
But our lsquoEnergy in 2050rsquo report also highlighted
that climate change is a major concern Indeed it
is much easier to overcome the energy constraint
than it is to do so while meeting carbon emission
36 We need to use energy more efficiently to reach this potential
0 1000 2000 3000 4000 5000 6000 7000 8000
India
China
US
Today 2050 consumption if resources werent constrained
Total energy use (Million tonnes of oil equiv alent)
Source HSBC estimates
27
Economics Global 11 January 2012
abc
targets In that report we provide a map of
regions most vulnerable to climate change which
is another variable that should be taken into
account when considering an economyrsquos long-
term future
Omitted variables
We have already discussed that our model cannot
capture all the variables that will dictate an
economyrsquos potential We have used a one-size-
fits-all model to provide a very clear and
transparent framework for thinking about
development By starting to tinker with the
projections based on judgment you essentially
create a list based on opinion Instead we chose to
leave the reader to consider idiosyncratic factors
requiring further consideration that mean a
country should feature more highly or indeed
lower down our economic league table
Cyclical fluctuations
Our model is a structural model that should
determine the potential supply of the economy
There are cyclical factors that can cause economies
to deviate from this long-term path For example
it may be that the use of credit had taken the
developed world above its sustainable path and the
slow growth of the past few years is the
readjustment to the long-term sustainable path
Similarly many emerging economies in the past
few years have been growing stronger than our
projections and were encountering inflationary
pressures and thus required policy action to return
the pace of growth to something more sustainable
Border barriers and war
The biggest danger is that the open borders which
have delivered so much prosperity are closed It is
hard to see how such a wave of protectionism
could benefit an individual economy and certainly
not the system as a whole But politiciansrsquo
motivation tends to be focused on the next election
rather than long-term growth As such bad politics
is a key risk to these projections And of course
trade wars can be followed by real wars which
would obviously set this rather glossy outlook way
off track Civil wars are another potential risk in
certain countries
28
Economics Global 11 January 2012
abc
A major shake-up in world order This extension reinforces the findings from our
original 2050 report Plenty of places in the world
look set to deliver very strong rates of growth But
they are not in the developed world which faces
both structural and cyclical headwinds They are
in the emerging world You can see this in action
by viewing the video of which a snapshot is
available on the following page
In the original report we highlighted the
extraordinary prospects for the likes of China
India Malaysia Mexico Colombia and Turkey
These economies themselves are still at an early
stage of development and continue to offer
fantastic growth prospects But increasingly
attention will turn to the lsquonew emergersrsquo Countries
such as the Philippines Peru and Nigeria all
demonstrate some combination of favourable
demographics and strong fundamentals that should
see a significant rise in their economic size
And so there are likely to be some major changes
in the economic league table between now and
2050 with countries such as the Philippines
jumping as many as 27 places (Table 37) The
losers are the small population ageing economies
of Europe Such change may seem remarkable but
it is not abnormal Table 38 ranks the economies
by size today and shows how this rank has
changed in the past four decades China India and
South Korea have already shown excellent lsquoleap-
frog abilityrsquo The relative decline of countries in
Europe that we forecast is an ongoing extension
of a trend already in place
37 Major change may seem unthinkable but such large shifts are common in history
Order based on size of economy in 2010
(constant 2000 USD)
Rank change since 1970
1 United States 0 2 Japan 0 3 China 14 4 Germany -1 5 United Kingdom -1 6 France -1 7 Italy -1 8 India 7 9 Brazil 0 10 Canada -3 11 South Korea 12 12 Spain -4 13 Mexico -3 14 Australia -2 15 Netherlands -4 16 Argentina -3 17 Russia Not available 18 Turkey 2 19 Sweden -5 20 Switzerland Not available
Source World Bank HSBC
We conclude that the world has great potential to
grow in the coming decades but that growth will
not stem from the developed world The EM story
is only just beginning As the lsquonew emergersrsquo
come to the fore emerging economies offer great
potential to power the global economy to 2050
Econom
ics G
lobal 11 January 2012
29
ab
c
We have created a video that tracks the growth in GDP across the various countries through time The chart above shows the final frame of this video
The length of the bars indicates the cumulative percentage increase in GDP for each country relative to 2010 The colour of the bars shows the level of GDP So for example a
long red bar implies that a country has a large GDP and a high rate of GDP growth
Visit httpcachecantoscomflashhsba-r061GDP_growth_2050-WMVwmv to watch how the growth rates for the different countries change between 2010 and 2050
30
Economics Global 11 January 2012
abc
This page has been left blank intentionally
31
Economics Global 11 January 2012
abc
Appendix
32
Economics Global 11 January 2012
abc
Barrorsquos growth model A1 The model
Variable Coefficients
Log GDP -0018 Male schooling 0002 Log GDP schooling -0004 Log life expectancy 0044 Log fertility -0016 Government consumption ratio -0136 Rule of law index 0029 Democracy index 0090 Democracy index squared -0088 Inflation rate -0043
Source Barro with HSBC adjustment to schooling
We made two amendments to Barrorsquos original
model First we lowered slightly the convergence
rate in line with more recent literature (see OECD
2001)
Second it appeared that the original model was
overstating the impact of education In Barrorsquos
original model an extra year of schooling raises
GDP growth by 12ppt Those with very high
levels of education such as Germany were
forecast to grow much more quickly than they
achieved And countries such as India with very
low levels of education were barely forecast to
grow at all However recalibrating the model to
lower the impact of education produced
remarkably accurate forecasts for such a simple
model The main areas of failure are in Asia
where the region in the early part of the 2000-10
period was still recovering from the Asian crisis
In the following tables we show the details of the
two scenarios that we use to build up to our lsquobase
casersquo The first assumes that governments make
no progress in improving their economic
infrastructure The second assumes that
governments make complete progress bring their
economic infrastructure steadily up to those best
in class in each category such as level of
education Our base case sits between these two
scenarios Essentially each country gets halfway
to improving its imperfections
The model
Model projections for the universe under consideration
-10
-5
0
5
10
15
US
Chi
na UK
Italy
Braz
ilS
Kor
eaM
exic
oN
ethe
rland
sR
ussi
aSw
eden
Belg
ium
Saud
i Ara
bia
Hon
g Ko
ngN
orw
ayTh
aila
ndG
reec
eVe
nezu
ela
Egyp
tC
olom
bia
Mal
aysi
aPo
rtuga
lPh
ilippi
nes
Chi
leN
iger
iaAl
geria
New
Viet
nam
Mor
occo
Qat
arC
uba
Slov
akD
omin
ican
Uru
guay
Syria
Leba
non
Gua
tem
ala
Sri L
anka
Bela
rus
Ecua
dor
Cos
ta R
ica
Azer
baija
nBu
lgar
iaM
acao
Ethi
opia
El S
alva
dor
Trin
idad
and
Yem
enC
ypru
sBo
livia
Icel
and
Jam
aica
Para
guay
Moz
ambi
quG
hana
Bots
wan
a
Model Rate Actual rate
Source World Bank and HSBC estimates using Barrorsquos amended model
33
Economics Global 11 January 2012
abc
Scenario 1 Income per capita forecasts if governments make no progress in improving economic infrastructure
2010-20 2020-30 2030-40 2040-50
Algeria 42 38 34 30 Angola -03 -02 -02 -02 Argentina 25 20 16 13 Australia 19 15 13 11 Austria 27 22 18 15 Azerbaijan 61 49 39 31 Bahrain 34 28 23 19 Bangladesh 36 35 34 33 Belarus 59 45 35 27 Belgium 11 10 08 07 Bolivia 56 46 38 31 Bosnia and Herzegovina
71 58 48 39
Brazil 23 18 14 11 Bulgaria 48 39 32 26 Cameroon 06 06 05 05 Canada 19 16 14 12 Chile 52 42 34 27 China 66 52 43 35 Colombia 30 25 21 17 Costa Rica 37 32 27 23 Croatia 44 37 32 27 Cuba 25 20 16 12 Cyprus 30 24 19 16 Czech Republic 53 39 29 21 Denmark 06 05 04 04 Dominican Republic 36 32 29 27 Ecuador 49 44 38 34 Egypt 35 40 34 29 El Salvador 39 34 30 27 Ethiopia 20 19 18 17 Finland 15 13 11 09 France 12 10 08 07 Germany 21 18 15 13 Ghana 31 27 24 22 Greece 30 26 21 17 Guatemala 08 08 08 08 Honduras 28 25 23 20 Hungary 59 44 33 25 India 41 35 30 26 Indonesia 31 26 22 18 Iran 62 52 42 35 Iraq -05 -05 -05 -05 Ireland 16 17 14 12 Israel -01 10 09 08 Italy 21 18 14 12 Japan 12 11 10 09 Jordan 37 31 26 22 Kazakhstan 59 47 38 30 Kenya 15 14 13 12 Kuwait 34 32 30 29
Source HSBC estimates
Scenario 1 Income per capita forecasts if governments make no progress in improving economic infrastructure (cont)
2010-20 2020-30 2030-40 2040-50
Latvia 56 44 34 27 Lebanon 46 39 33 28 Libya 27 24 21 19 Lithuania 43 33 26 20 Luxembourg 16 13 10 08 Malaysia 54 44 36 29 Mexico 36 31 26 21 Morocco 25 25 25 25 Netherlands 12 11 10 08 New Zealand 29 21 15 10 Nigeria 09 08 07 07 Norway 04 06 07 06 Oman 24 21 17 15 Pakistan 15 15 15 14 Panama 35 29 24 20 Paraguay 48 42 36 32 Peru 54 46 39 33 Philippines 61 52 44 38 Poland 41 33 27 22 Portugal 32 29 25 22 Qatar 09 08 07 06 Romania 71 57 46 37 Russia 51 42 35 29 S Korea 39 29 24 19 Saudi Arabia 19 16 14 11 Serbia 68 56 45 37 Singapore 42 32 27 23 Slovak Republic 42 32 25 19 Slovenia 30 26 22 19 South Africa 11 09 07 05 Spain 29 25 20 17 Sri Lanka 52 46 40 35 Sweden 05 06 06 06 Switzerland 26 21 17 14 Syria 22 22 22 21 Tanzania 36 32 30 27 Thailand 38 32 27 23 Tunisia 40 36 33 30 Turkey 40 34 29 25 Turkmenistan 61 49 39 31 Uganda -01 -01 -01 -01 UK 13 11 09 07 Ukraine 87 68 52 41 United Arab Emirates 25 21 17 14 Uruguay 25 22 19 16 US 05 07 07 07 Uzbekistan 67 54 43 34 Venezuela 14 11 08 05 Vietnam 44 42 39 37 Yemen -24 -25 -26 -27
Source HSBC estimates
34
Economics Global 11 January 2012
abc
Scenario 2 Income per capita forecasts if governments make complete progress in improving economic infrastructure catching up with best in class
2010-20 2020-30 2030-40 2040-50
Algeria 42 50 56 60 Angola -03 24 48 69 Argentina 25 31 37 42 Australia 19 24 28 31 Austria 27 30 32 34 Azerbaijan 61 58 56 55 Bahrain 34 33 32 32 Bangladesh 36 56 72 85 Belarus 59 58 59 61 Belgium 11 21 29 35 Bolivia 56 58 59 61 Bosnia and Herzegovina
71 67 64 62
Brazil 23 35 47 57 Bulgaria 48 54 58 63 Cameroon 06 33 58 79 Canada 19 25 30 34 Chile 52 49 46 45 China 66 60 58 57 Colombia 30 41 50 58 Costa Rica 37 43 47 52 Croatia 44 46 48 50 Cuba 25 39 50 61 Cyprus 30 34 37 40 Czech Republic 53 49 46 46 Denmark 06 17 26 33 Dominican Republic 36 43 48 52 Ecuador 49 54 58 60 Egypt 35 38 48 56 El Salvador 39 47 54 59 Ethiopia 20 47 72 92 Finland 15 23 28 33 France 12 21 28 35 Germany 21 28 32 36 Ghana 31 52 70 84 Greece 30 35 38 41 Guatemala 08 28 48 65 Honduras 28 43 56 67 Hungary 59 53 50 49 India 41 54 66 74 Indonesia 31 48 62 74 Iran 62 61 59 59 Iraq -05 26 56 83 Ireland 16 24 27 30 Israel -01 14 25 34 Italy 21 29 35 40 Japan 12 21 27 32 Jordan 37 44 50 54 Kazakhstan 59 56 55 54 Kenya 15 41 63 82 Kuwait 34 32 30 28
Source HSBC estimates
Scenario 2 Income per capita forecasts if governments make complete progress in improving economic infrastructure catching up with best in class (cont)
2010-20 2020-30 2030-40 2040-50
Latvia 56 53 51 51 Lebanon 46 46 46 46 Libya 27 33 39 44 Lithuania 43 47 50 54 Luxembourg 16 19 22 25 Malaysia 54 49 46 43 Mexico 36 41 45 47 Morocco 25 42 56 68 Netherlands 12 22 29 35 New Zealand 29 32 34 36 Nigeria 09 36 60 80 Norway 04 16 23 28 Oman 24 29 34 38 Pakistan 15 39 61 79 Panama 35 40 43 47 Paraguay 48 54 58 61 Peru 54 53 52 52 Philippines 61 61 61 60 Poland 41 44 48 51 Portugal 32 37 41 45 Qatar 09 14 20 26 Romania 71 65 61 58 Russia 51 54 57 60 S Korea 39 37 39 40 Saudi Arabia 19 28 34 40 Serbia 68 68 68 69 Singapore 42 30 26 23 Slovak Republic 42 44 46 49 Slovenia 30 35 39 43 South Africa 11 30 46 60 Spain 29 34 37 40 Sri Lanka 52 59 63 66 Sweden 05 17 26 33 Switzerland 26 26 27 27 Syria 22 40 55 68 Tanzania 36 52 66 77 Thailand 38 47 55 62 Tunisia 40 48 54 59 Turkey 40 44 47 49 Turkmenistan 61 59 58 57 Uganda -01 30 60 87 UK 13 21 27 32 Ukraine 87 77 71 68 United Arab Emirates 25 27 29 30 Uruguay 25 33 40 46 US 05 17 24 29 Uzbekistan 67 66 66 66 Venezuela 14 29 42 53 Vietnam 44 59 71 79 Yemen -24 13 53 91
Source HSBC estimates
35
Economics Global 11 January 2012
abc
Notes
36
Economics Global 11 January 2012
abc
Notes
37
Economics Global 11 January 2012
abc
Notes
38
Economics Global 11 January 2012
abc
Disclosure appendix Analyst Certification The following analyst(s) economist(s) andor strategist(s) who is(are) primarily responsible for this report certifies(y) that the opinion(s) on the subject security(ies) or issuer(s) andor any other views or forecasts expressed herein accurately reflect their personal view(s) and that no part of their compensation was is or will be directly or indirectly related to the specific recommendation(s) or views contained in this research report Karen Ward Nick Robins and Zoe Knight
Important Disclosures This document has been prepared and is being distributed by the Research Department of HSBC and is intended solely for the clients of HSBC and is not for publication to other persons whether through the press or by other means
This document is for information purposes only and it should not be regarded as an offer to sell or as a solicitation of an offer to buy the securities or other investment products mentioned in it andor to participate in any trading strategy Advice in this document is general and should not be construed as personal advice given it has been prepared without taking account of the objectives financial situation or needs of any particular investor Accordingly investors should before acting on the advice consider the appropriateness of the advice having regard to their objectives financial situation and needs If necessary seek professional investment and tax advice
Certain investment products mentioned in this document may not be eligible for sale in some states or countries and they may not be suitable for all types of investors Investors should consult with their HSBC representative regarding the suitability of the investment products mentioned in this document and take into account their specific investment objectives financial situation or particular needs before making a commitment to purchase investment products
The value of and the income produced by the investment products mentioned in this document may fluctuate so that an investor may get back less than originally invested Certain high-volatility investments can be subject to sudden and large falls in value that could equal or exceed the amount invested Value and income from investment products may be adversely affected by exchange rates interest rates or other factors Past performance of a particular investment product is not indicative of future results
Analysts economists and strategists are paid in part by reference to the profitability of HSBC which includes investment banking revenues
For disclosures in respect of any company mentioned in this report please see the most recently published report on that company available at wwwhsbcnetcomresearch
HSBC Legal Entities are listed in the Disclaimer below
Additional disclosures 1 This report is dated as at 11 January 2012 2 All market data included in this report are dated as at close 05 January 2012 unless otherwise indicated in the report 3 HSBC has procedures in place to identify and manage any potential conflicts of interest that arise in connection with its
Research business HSBCs analysts and its other staff who are involved in the preparation and dissemination of Research operate and have a management reporting line independent of HSBCs Investment Banking business Information Barrier procedures are in place between the Investment Banking and Research businesses to ensure that any confidential andor price sensitive information is handled in an appropriate manner
39
Economics Global 11 January 2012
abc
Disclaimer Legal entities as at 04 March 2011 lsquoUAErsquo HSBC Bank Middle East Limited Dubai lsquoHKrsquo The Hongkong and Shanghai Banking Corporation Limited Hong Kong lsquoTWrsquo HSBC Securities (Taiwan) Corporation Limited lsquoCArsquo HSBC Securities (Canada) Inc Toronto HSBC Bank Paris Branch HSBC France lsquoDErsquo HSBC Trinkaus amp Burkhardt AG Duumlsseldorf 000 HSBC Bank (RR) Moscow lsquoINrsquo HSBC Securities and Capital Markets (India) Private Limited Mumbai lsquoJPrsquo HSBC Securities (Japan) Limited Tokyo lsquoEGrsquo HSBC Securities Egypt SAE Cairo lsquoCNrsquo HSBC Investment Bank Asia Limited Beijing Representative Office The Hongkong and Shanghai Banking Corporation Limited Singapore Branch The Hongkong and Shanghai Banking Corporation Limited Seoul Securities Branch The Hongkong and Shanghai Banking Corporation Limited Seoul Branch HSBC Securities (South Africa) (Pty) Ltd Johannesburg lsquoGRrsquo HSBC Securities SA Athens HSBC Bank plc London Madrid Milan Stockholm Tel Aviv lsquoUSrsquo HSBC Securities (USA) Inc New York HSBC Yatirim Menkul Degerler AS Istanbul HSBC Meacutexico SA Institucioacuten de Banca Muacuteltiple Grupo Financiero HSBC HSBC Bank Brasil SA ndash Banco Muacuteltiplo HSBC Bank Australia Limited HSBC Bank Argentina SA HSBC Saudi Arabia Limited The Hongkong and Shanghai Banking Corporation Limited New Zealand Branch
Issuer of report HSBC Bank plc 8 Canada Square London
E14 5HQ United Kingdom
Telephone +44 20 7991 8888 Fax +44 20 7992 4880
Website wwwresearchhsbccom
This document is issued and approved in the United Kingdom by HSBC Bank plc for the information of its Clients (as defined in the Rules of FSA) and those of its affiliates only If this research is received by a customer of an affiliate of HSBC its provision to the recipient is subject to the terms of business in place between the recipient and such affiliate In Australia this publication has been distributed by The Hongkong and Shanghai Banking Corporation Limited (ABN 65 117 925 970 AFSL 301737) for the general information of its ldquowholesalerdquo customers (as defined in the Corporations Act 2001) Where distributed to retail customers this research is distributed by HSBC Bank Australia Limited (AFSL No 232595) These respective entities make no representations that the products or services mentioned in this document are available to persons in Australia or are necessarily suitable for any particular person or appropriate in accordance with local law No consideration has been given to the particular investment objectives financial situation or particular needs of any recipient The document is distributed in Hong Kong by The Hongkong and Shanghai Banking Corporation Limited and in Japan by HSBC Securities (Japan) Limited Each of the companies listed above (the ldquoParticipating Companiesrdquo) is a member of the HSBC Group of Companies any member of which may trade for its own account as Principal may have underwritten an issue within the last 36 months or together with its Directors officers and employees may have a long or short position in securities or instruments or in any related instrument mentioned in the document Brokerage or fees may be earned by the Participating Companies or persons associated with them in respect of any business transacted by them in all or any of the securities or instruments referred to in this document In Korea this publication is distributed by either The Hongkong and Shanghai Banking Corporation Limited Seoul Securities Branch (HBAP SLS) or The Hongkong and Shanghai Banking Corporation Limited Seoul Branch (HBAP SEL) for the general information of professional investors specified in Article 9 of the Financial Investment Services and Capital Markets Act (ldquoFSCMArdquo) This publication is not a prospectus as defined in the FSCMA It may not be further distributed in whole or in part for any purpose Both HBAP SLS and HBAP SEL are regulated by the Financial Services Commission and the Financial Supervisory Service of Korea This publication is distributed in New Zealand by The Hongkong and Shanghai Banking Corporation Limited New Zealand Branch The information in this document is derived from sources the Participating Companies believe to be reliable but which have not been independently verified The Participating Companies make no guarantee of its accuracy and completeness and are not responsible for errors of transmission of factual or analytical data nor shall the Participating Companies be liable for damages arising out of any personrsquos reliance upon this information All charts and graphs are from publicly available sources or proprietary data The opinions in this document constitute the present judgement of the Participating Companies which is subject to change without notice This document is neither an offer to sell purchase or subscribe for any investment nor a solicitation of such an offer HSBC Securities (USA) Inc accepts responsibility for the content of this research report prepared by its non-US foreign affiliate All US persons receiving andor accessing this report and intending to effect transactions in any security discussed herein should do so with HSBC Securities (USA) Inc in the United States and not with its non-US foreign affiliate the issuer of this report In Singapore this publication is distributed by The Hongkong and Shanghai Banking Corporation Limited Singapore Branch for the general information of institutional investors or other persons specified in Sections 274 and 304 of the Securities and Futures Act (Chapter 289) (ldquoSFArdquo) and accredited investors and other persons in accordance with the conditions specified in Sections 275 and 305 of the SFA This publication is not a prospectus as defined in the SFA It may not be further distributed in whole or in part for any purpose The Hongkong and Shanghai Banking Corporation Limited Singapore Branch is regulated by the Monetary Authority of Singapore Recipients in Singapore should contact a Hongkong and Shanghai Banking Corporation Limited Singapore Branch representative in respect of any matters arising from or in connection with this report HSBC Meacutexico SA Institucioacuten de Banca Muacuteltiple Grupo Financiero HSBC is authorized and regulated by Secretariacutea de Hacienda y Creacutedito Puacuteblico and Comisioacuten Nacional Bancaria y de Valores (CNBV) HSBC Bank (Panama) SA is regulated by Superintendencia de Bancos de Panama Banco HSBC Honduras SA is regulated by Comisioacuten Nacional de Bancos y Seguros (CNBS) Banco HSBC Salvadorentildeo SA is regulated by Superintendencia del Sistema Financiero (SSF) HSBC Colombia SA is regulated by Superintendencia Financiera de Colombia Banco HSBC Costa Rica SA is supervised by Superintendencia General de Entidades Financieras (SUGEF) Banistmo Nicaragua SA is authorized and regulated by Superintendencia de Bancos y de Otras Instituciones Financieras (SIBOIF) The document is intended to be distributed in its entirety Unless governing law permits otherwise you must contact a HSBC Group member in your home jurisdiction if you wish to use HSBC Group services in effecting a transaction in any investment mentioned in this document HSBC Bank plc is registered in England No 14259 is authorised and regulated by the Financial Services Authority and is a member of the London Stock Exchange (070905) copy Copyright HSBC Bank plc 2012 ALL RIGHTS RESERVED No part of this publication may be reproduced stored in a retrieval system or transmitted on any form or by any means electronic mechanical photocopying recording or otherwise without the prior written permission of HSBC Bank plc MICA (P) 208042011 and MICA (P) 040042011
[317638]
40
abc
Global
Stephen King Global Head of Economics +44 20 7991 6700 stephenkinghsbcibcom
Karen Ward Senior Global Economist +44 20 7991 3692 karenwardhsbcibcom
Madhur Jha +44 20 7991 6755 madhurjhahsbcibcom
Europe amp United Kingdom
Janet Henry Chief European Economist +44 20 7991 6711 janethenryhsbcibcom
Simon Wells Chief UK Economist +44 20 7991 6718 simonwellshsbcibcom
Astrid Schilo +44 20 7991 6708 astridschilohsbcibcom
Germany Lothar Hessler +49 21 1910 2906 lotharhesslerhsbcde
France Mathilde Lemoine +33 1 4070 3266 mathildelemoinehsbcfr
North America
Kevin Logan Chief US Economist +1 212 525 3195 kevinrloganushsbccom
Ryan Wang +1 212 525 3181 ryanwangushsbccom
Asia Pacific
Qu Hongbin Managing Director Co-head Asian Economics Research and Chief Economist Greater China +852 2822 2025 hongbinquhsbccomhk
Frederic Neumann Managing Director Co-head Asian Economics Research +852 2822 4556 fredericneumannhsbccomhk
Leif Eskesen Chief Economist India amp ASEAN +65 6239 0840 leifeskesenhsbccomsg
Paul Bloxham Chief Economist Australia and New Zealand +61 2925 52635 paulbloxhamhsbccomau
Donna Kwok +852 2996 6621 donnahjkwokhsbccomhk
Trinh Nguyen +852 2822 6975 trinhdnguyenhsbccomhk
Ronald Man +852 2996 6743 ronaldmanhsbccomhk
Luke Hartigan +612 9255 2635 lukehartiganhsbccomau
Sun Junwei +86 10 5999 8234 junweisunhsbccomcn
Sophia Ma +86 10 5999 8232 xiaopingmahsbccomcn
Global Emerging Markets
Pablo Goldberg Head of Global EM Research +1 212 525 8729 pabloagoldberghsbccom
Bertrand Delgado EM Strategist +1 212 525 0745 bertrandjdelgadoushsbccom
Emerging Europe Middle East and Africa
Murat Ulgen Chief Economist +44 20 7991 6782 muratulgenhsbccom
Agata Urbanska +44 20 7992 2774 agataurbanskahsbcibcom
Alexander Morozov +7 495 783 8855 alexandermorozovhsbccom
Simon Williams +971 4 507 7614 simonwilliamshsbccom
Melis Metiner +90 212 376 4618 melismetinerhsbccomtr
Latin America
Andre Loes Chief Economist Latin America +55 11 3371 8184 andrealoeshsbccombr
Argentina Javier Finkman Chief Economist South America ex-Brazil +54 11 4344 8144 javierfinkmanhsbccomar
Ramiro D Blazquez Senior Economist +54 11 4348 5759 ramiroblazquezhsbccomar
Jorge Morgenstern Senior Economist +54 11 4130 9229 jorgemorgensternhsbccomar
Brazil Constantin Jancso Senior Economist +55 11 3371 8183 constantincjancsohsbccombr
Marcos Fernandes +55 11 6847 9787 marcosrfernandeshsbccombr
Mexico Sergio Martin Chief Economist +52 55 5721 2164 sergiomartinmhsbccommx
Claudia Navarrete Economist +52 55 5721 2422 claudianavarretehsbccommx
Central America Lorena Dominguez Economist +52 55 5721 2172 lorenadominguezhsbccommx
Global Economics Research Team
Karen WardSenior Global EconomistHSBC Bank plc+44 20 7991 3692karenwardhsbcibcom
Karen joined HSBC in 2006 as UK economist In 2010 she was appointed Senior Global Economist with responsibility for monitoringchallenges facing the global economy and their implications for financial markets Before joining HSBC in 2006 Karen worked at theBank of England where she provided supporting analysis for the Monetary Policy Committee She has an MSc Economics fromUniversity College London

5
Economics Global 11 January 2012
abc
3 The economic league table in 2050 (continued)
______ Size of economy in_______ __________ Income per capita in ___________ ____Population _____ 2010
Bn Constant 2000 USD
2050 Bn Constant
2000 USD
Change in rank
2010 Constant
2000 USD
Rank 2050 Constant
2000 USD
Rank 2010 Mn
2050 Mn
51 Uzbekistan 25 314 22 893 87 8859 77 27 35 52 Hungary 58 295 1 5833 44 31966 33 10 9 53 Tanzania 16 288 34 382 97 2085 92 45 138 54 Kazakhstan 38 287 7 2376 68 13520 62 16 21 55 Kuwait 61 280 -4 23072 21 54183 9 3 5 56 Morocco 58 279 -2 1781 75 7110 82 32 39 57 Finland 145 270 -19 27151 12 49643 13 5 5 58 Denmark 172 265 -29 31418 9 47743 16 5 6 59 Libya 49 230 -2 7692 37 26182 42 6 9 60 New Zealand 64 214 -10 14939 28 37705 26 4 6 61 Dominican Republic 37 212 1 3697 55 16406 55 10 13 62 Ecuador 24 206 14 1771 76 10546 73 14 20 63 Ethiopia 17 196 23 201 100 1352 97 83 145 64 Syria 28 181 2 1397 78 5470 84 20 33 65 Sri Lanka 25 175 7 1233 81 7558 80 21 23 66 Azerbaijan 20 168 14 2303 69 14482 59 9 12 67 Kenya 18 163 16 452 96 1683 95 41 97 68 Tunisia 29 160 -3 2805 60 12686 66 10 13 69 Guatemala 26 152 1 1858 73 4826 87 14 32 70 Lebanon 27 148 -2 6342 41 31659 34 4 5 71 Bolivia 12 145 25 1192 84 8652 78 10 17 72 Slovak Republic 44 145 -12 8042 36 27639 39 5 5 73 Oman 30 138 -10 10779 32 36832 27 3 4 74 Angola 24 134 1 1313 80 3170 90 19 42 75 Costa Rica 23 124 3 5043 50 20588 50 5 6 76 Belarus 25 122 -2 2556 65 15207 57 10 8 77 Cuba 49 121 -19 4370 53 12202 67 11 10 78 Iraq 23 117 -1 743 89 1410 96 32 83 79 Qatar 54 112 -23 38466 5 43027 19 2 3 80 Jordan 15 112 9 2497 67 11317 71 6 10 81 Uganda 12 111 14 366 98 1179 99 33 94 82 Panama 20 110 -1 5732 45 21423 48 4 5 83 Croatia 28 105 -16 6396 40 27091 41 4 4 84 El Salvador 16 104 4 2566 64 13729 60 6 8 85 Ghana 8 100 22 343 99 2035 94 24 49 86 Paraguay 9 99 17 1432 77 9587 74 6 10 87 Turkmenistan 9 97 15 1827 74 14659 58 5 7 88 Uruguay 30 93 -24 8942 35 25482 44 3 4 89 Honduras 10 82 11 1380 79 6337 83 8 13 90 Cameroon 14 79 1 694 90 2048 93 20 38 91 Serbia 9 75 13 1229 82 8565 79 10 9 92 Bulgaria 19 72 -10 2542 66 13154 64 7 5 93 Luxembourg 26 68 -24 52388 1 96592 1 1 1 94 Slovenia 26 66 -23 12577 30 32971 31 2 2 95 Bahrain 13 61 -3 16968 24 33910 29 1 2 96 Lithuania 17 59 -12 5154 48 20955 49 3 3 97 Bosnia amp Herzegovina 8 56 10 2162 71 18961 52 4 3 98 Latvia 11 52 0 4973 51 27143 40 2 2 99 Yemen 13 45 -8 565 93 731 100 24 62 100 Cyprus 12 45 -7 15510 27 33337 30 1 1
Source World Bank UN population projections and HSBC estimates Income per capita forecasts are not the cumulative sum of the forecasts for income per capita presented later in the document This is because the GDP created by the working population must be shared between the population as a whole not just the working population
6
Economics Global 11 January 2012
abc
What makes economies grow Clearly this is a question Western policymakers are
grappling with right now If we step away from the
cyclicality there are two ways economies can grow
either add more people to the production line via
growth in the working population or make each
individual more productive
Let us start by considering individual productivity
As in the original framework we lean heavily on the
empirical work of Harvardrsquos Professor Robert Barro
(full details of the model can be found in the
Appendix) We back-tested the model on our
extended sample of countries and are pleased with
the actual outcome for growth relative to the
projections in the period of 2000 to 2010 (Chart 4)
The first set of variables Professor Barro highlighted
as crucial to driving growth in individual
productivity are those that drive lsquohuman capitalrsquo ndash
health education and fertility The second set of
variables determine the likelihood of fixed capital
investment to equip workers with tools and
technology These are rule of law (which
encompasses patent and property rights)
government interference democracy and monetary
control (which is proxied by the inflation rate)
Good foundations
Our framework considers what stage of development each
economy is at todayhellip
hellip and whether they have the potential and the fundamental
characteristics necessary to catch up with the developed world
Current growth rates play no role in these projections
4 Modelrsquos back-test does a surprisingly good job given the vast array of countries considered
-10
-5
0
5
10
15
US
Chi
na UK
Italy
Braz
ilS
Kor
eaM
exic
oN
ethe
rland
sR
ussi
aSw
eden
Belg
ium
Saud
i Ara
bia
Hon
g Ko
ngN
orw
ayTh
aila
ndG
reec
eVe
nezu
ela
Egyp
tC
olom
bia
Mal
aysi
aPo
rtuga
lPh
ilippi
nes
Chi
leN
iger
iaAl
geria
New
Viet
nam
Mor
occo
Qat
arC
uba
Slov
akD
omin
ican
Uru
guay
Syria
Leba
non
Gua
tem
ala
Sri L
anka
Bela
rus
Ecua
dor
Cos
ta R
ica
Azer
baija
nBu
lgar
iaM
acao
Ethi
opia
El S
alva
dor
Trin
idad
and
Yem
enC
ypru
sBo
livia
Icel
and
Jam
aica
Para
guay
Moz
ambi
quG
hana
Bots
wan
a
Model Rate Actual rate
Source World Bank HSBC projections
7
Economics Global 11 January 2012
abc
Education
It is worth spending a moment discussing
education given its importance in the model
Whether individuals can adapt to the worldrsquos
given technology or even push the technology
frontier out depends on the level of education
5 Quality of education is most important but it is well correlated with time spent at school
300
400
500
600
5 6 7 8 9 10 11 12 13 14
300
400
500
600
Av erage y ears o f schooling
Qua
lity
of s
choo
ling
Source Barrolee dataset and PISA
Owing to data availability we focus on the
number of years of schooling This of course is
not a perfect metric since we would really want to
capture quality of education PISA (Programme
for International Student Assessment) is an
international study that aims to evaluate education
systems worldwide by testing the skills and
knowledge of 15-year-old students in certain
countries in reading maths and scientific literacy
This is plotted in Chart 5 alongside our measure of
education Quantity of schooling is a good but not
perfect proxy for quality of education For
example for nine and half years of education the
UK appears to do a much better job in gaining
results obtaining a PISA score of 500 against
Argentina which for a similar input scores just
395 For reference five of the top eight scoring
countries on this survey are in Asia
Democracy
Democracy is another variable worth discussing
given its controversy The success of democratic
systems is most likely explained by the freedom of
speech and creativity that leads to successful
entrepreneurs In addition they provide checks and
balances to ensure governments do not become
excessively powerful absorbing any improvement
in the countryrsquos prosperity for their own benefit
Democracy therefore is highly correlated with
our measure of rule of law (Chart 6)
6 Democracy does not always guarantee good rule of law
00
02
04
06
08
10
12
00 02 04 06 08 10
Democracy Index
Rul
e of
Law
Inde
x
M exico amp Brazil
China amp Saudi Arabia
Source Political Risk Services Freedom House Political Rights Index
But there are authoritarian regimes such as China
and Saudi Arabia that have delivered a good lsquorule of
lawrsquo In parts of Latin America democracy has done
little to improve rule of law Even in highly
democratic systems you can still see corruption
Professor Barrorsquos work actually showed that too
much democracy was not necessarily a good thing
for economic growth (of course it may be the best
model for social development) He found that at very
high levels of democracy income redistribution
becomes a dominant force which serves to restrain
entrepreneurial endeavour And democracy places a
disproportionate weight on winning current votes
potentially at the expense of future votes and
therefore can hinder the investment required for
long-term development
8
Economics Global 11 January 2012
abc
Many years of lsquocopy and pastersquo growth left
The most potent recipe for growth is a country
that scores highly on the fundamentals discussed
but currently has low income per capita These
economies should deliver the highest growth in
income per capita as they lsquocatch uprsquo with those
with similar fundamentals Economies with poor
governance and low education will remain stuck
in this low-income trap This has been the position
a number of African nations have found
themselves in for so long
As economies become wealthier and technology
more sophisticated they will gradually lose the
advantages of lsquostarting from behindrsquo The initial
years of development could be described as lsquocopy
and pastersquo growth as countries open themselves
up and adapt to the worldrsquos existing technologies
Of course various lsquoiron curtainsrsquo meant that many
economies did not open themselves up to either
the new technologies created in the Western
economies or the worldrsquos supply of capital until
recently
Once the lsquocopy and pastersquo growth is complete
countries will need to be sufficiently sophisticated
to operate at the lsquofrontierrsquo driving technological
change It is at this point that many economies
struggle and get stuck in what is often known as
the middle-income trap
But many of the countries we are considering are
still at such an extremely low level of
development that there are years of this lsquocopy and
pastersquo growth ahead
We think this is where many of the bears on
China are wrong One of the most commonly
cited reasons for concern about China is the high
rate of investment as a percentage of GDP Many
compare this rate of investment with the rates
seen during the expansion of Asian lsquotigersrsquo in the
1970s and claim that it is too rapid and that
Chinarsquos policymakers must be pouring money
into unproductive investment (Chart 7)
7 Comparing China today with Japan or Korea in the 1970s is unfairhellip
0
10
20
30
40
50
China today Japan 1970 South Korea 1970
of GDP Inv es tment
Source World Bank
8 hellip because China is at a much lower level of development today than they were then
0
20
40
60
80
0 5 10 15 20 25
0
20
40
60
80
US Japan China
Share of employ ment w ithin primary industry
Real GDP per capita chained 1990 USD000s
Japan in
1970
China today
Source World Bank
But the starting point of comparison is wrong
because Chinarsquos level of development today is so
much lower than that of the Asian tigers before
their rapid expansion (Chart 8) It is for this
reason we believe the strong rate of investment is
entirely justified ndash providing China with much-
needed basic infrastructure
9
Economics Global 11 January 2012
abc
Demographic dividends Using this model to establish how productive each
individual will be we must consider now how
many individuals there will be
They may not flash up on our Bloomberg screens
once a month but demographics are an extremely
important driver of growth There are two effects
First and most straightforward it is generally
easier to produce more stuff when you have more
people on the production line The second impact
is a little more subtle and relates to the ratio of
working population to total population As
Stephen King discusses in lsquoLosing controlrsquo (2010
Yale University Press) when you have many
lsquoproducersrsquo but not many lsquodependentsrsquo the burden
on producers perhaps because of tax payments to
support the elderly and young are small and
therefore the rewards for effort are great
Therefore demographic burdens can in turn feed
back to individual productivity
9 Japanrsquos demographic downturn will have played a key role in its economic malaise
-5
0
5
10
15
20
1955 1965 1975 1985 1995 2005
-1
0
1
2
3
4
GDP grow th (LHS)Working population grow th (RHS)
Yr YrJapan
Source World Bank
Japan shows the economic perils of a declining
working population only too well While many
put Japanrsquos lost decades down to deleveraging
following the build-up of debt in the 1980s it
seems likely that it had at least as much to do with
the dramatic decline in working population
growth over the past 50 years (Chart 9)
As the projections for working population stand
demographics alone could explain a large part of
what are likely to be huge differences in economic
performance in the coming years Contrast Japan
and Russia whose working populations will shrink
by more than 1 per annum for the next four
decades with Nigeria whose working population
will rise by 3 per annum
But as we have explained population growth is
not itself enough to guarantee growth You need
the other foundations to ensure jobs are created for
these new entrants to the labour market So our
projections for total GDP build up using our
earlier forecasts for income per capita based on
the economic infrastructure and the number of
lsquocapitasrsquo - the change in working population As
we will see little progress is made in countries
without the right lsquoeconomic infrastructurersquo even if
their populations are growing
10
Economics Global 11 January 2012
abc
The fine print A few words on the technicalities and caveats of
the framework before we get into the results
As in the original report we are working in
constant price constant 2000 USD exchange
rate terms Further appreciation of emerging
market currencies against the USD will only
extend the conclusions of the report
The source of the data on economic infrastructure
is contained in Table 10 To get to our base case
projections we consider two scenarios The first
assumes the lsquoeconomic infrastructurersquo is fixed at
that evident today But to constrain these
economies on the assumption they will not make
any further improvements would be unfair For
example there is a clear trend that education
standards across the emerging world are improving
We then consider a second scenario in which we
assume that over the next 40 years all economies
reach the lsquooptimalrsquo economic infrastructure This is
the highest possible level of achievement from any
of the countries in our sample
The results of these two scenarios are shown in the
Appendix Our base-case scenario sits between
these two options Essentially each country gets
halfway to eliminating its imperfections
Economic snakes and ladders
Asia is the stand-out region ndash with a notable showing by the
Philippines
LATAM fares well with Peru emerging into the spotlight
Other strong performers include Egypt Nigeria Turkey and
Ukraine
10 Data description
Variable Description Source
Average years of male schooling The average number of years spent in education by males in 2010 (for this extension for many countries the distinction between male and female was not available and we have therefore taken average education across gender) In addition in a very limited number of countries the data was not available and therefore our regional specialists used their judgment to determine an appropriate proxy
wwwbarroleecom
Life expectancy The life expectancy of total population in 2008 natural log taken World Bank Fertility The number of births per woman in 2008 natural log taken World Bank Rule of law An index between 0 and 1 which measures the attractiveness of the investment climate based
on the level of law enforcement contract sanctity and property rights Data for 2009 Political Risk Services International Country Risk Guide
Government consumption Percentage of GDP accounted for by government consumption in 2008 World Bank Democracy index Indicator of political rights measures the right of all adults to vote and compete for public office
and to have a decisive vote on public policies Measured between 0 and 1 (full democracy) Freedom House Political Rights Index
Inflation rate CPI inflation ( year) average 2004-07 World Bank
11
Economics Global 11 January 2012
abc
We are clearly assuming governments continue to
improve the underlying economic infrastructure
implementing reform increasing education and so
forth and remain friendly with their neighbours
Of course this may turn out to be a rather
Panglossian view of government behaviour The
two scenarios in the Appendix provide some
guidance as to the sensitivity of the projections to
this underlying assumption that governments
continue to lsquodo the right thingrsquo
In addition our model will not capture all the
variables that dictate an economyrsquos potential
There may be idiosyncratic factors that mean a
country should feature more highly or indeed
lower down our economic league table
The variable that is most often debated is a
countryrsquos endowment of natural resources Surely
a country with a rich array of natural resources
should outperform those without This may well
be the case but not always We have often seen
countries rich in natural resources suffer from
lsquoDutch diseasersquo This is a situation in which the
capital inflows to exploit the domestic commodity
industry put upward pressure on the domestic
exchange rate which in turn damages other
industrial areas In addition the presence of natural
resources can also lead to an increase in corruption
and so the benefits of the natural wealth do little
for the population as a whole Therefore
empirically it is not absolutely clear that those rich
in natural resources should get a natural boost so
this is one variable we do not include and leave
readers to assess whether in their opinion a
country should feature higher in the table
There are numerous other variables that fall in this
list of needing further consideration such as
extreme religious fundamentalism and relations
with the rest of the world (eg Iran)
We should also highlight some potential caveats
to the demographic projections we are using
These estimates made by the UN take into
account current fertility rates and policy on
retirement and migration
But these working-age projections are subject to a
considerable degree of uncertainty The most
tricky is disease which could raise the mortality
rate or by contrast medical breakthroughs which
could lower it Immigration flows could also send
these projections wildly off course decreasing
prospects for one part of the world while boosting
prospects elsewhere The changes we are
highlighting in this document could give rise to a
great migration which has all sorts of
implications for border frictions The history of
the US is a case in point In the 1950s and early
60s there were demographic concerns about the
US But the 1965 Immigration and Naturalisation
Act saw a huge new wave of migrants which
coupled with a higher fertility rate among
migrants gave rise to a fresh demographic boost
Government policy could also throw these
projections wildly off course if incentives via the
tax system manage successfully to lift or reduce
the fertility rate
Therefore we emphasise this exercise is a starting
point for considering the long-term outlook and
should not be taken as our explicit forecast Our
regional economists will be able to provide more
accurate near-term forecasts taking into account
factors the model is unable to capture and cyclical
considerations
12
Economics Global 11 January 2012
abc
Developed world Countries in the developed world might be
considered to be at the technology lsquofrontierrsquo With
income per capita already high these economies do
not get any lsquocatch uprsquo boost so rely on the other
variables in the model (education rule of law etc)
for technological progress to deliver further gains
in individual prosperity
That said there are still large variations across the
developed world with real income per capita in
Portugal at just over USD115k compared with
USD37k in the US Those with similar economic
infrastructure to the US but with lower income per
capita will therefore get a lsquocatch uprsquo boost This
explains why the model provides higher income
per capita forecasts for the likes of Spain and
Greece (Table 12) which may seem implausible
given their current difficulties
12 Model projections for income per capita
2010-20 2020-30 2030-40 2040-50
Developed world Australia 18 20 21 22 Austria 27 26 25 24 Belgium 12 15 19 21 Canada 19 21 22 23 Denmark 06 11 15 18 Finland 16 18 19 21 France 12 15 18 21 Germany 21 22 23 24 Greece 31 30 29 29 Ireland 19 20 20 21 Italy 16 24 25 27 Japan 13 16 19 20 Luxembourg 16 16 16 17 Netherlands 13 16 19 21 New Zealand 29 27 26 26 Norway 05 11 15 17 Portugal 32 32 32 32 Spain 24 31 30 29 Sweden 05 11 16 19 Switzerland 26 24 22 21 United Kingdom 14 16 18 20 United States 06 11 15 18 Developed world avg 17 20 21 22
Source HSBC estimates
11 The lsquoeconomic infrastructurersquo today
GDP per capita
Average years male schooling
Life expectancy
Fertility (average
children per person)
Rule of law Government consumption
Democracy index
Inflation rate
Developed world Real USD Years Years Children Index Ratio to GDP Index Annual rate Australia 26244 121 81 19 09 017 10 28 Austria 26445 95 80 14 10 018 10 20 Belgium 24758 105 80 18 08 023 10 21 Canada 26355 113 80 16 09 019 10 16 Denmark 31418 101 78 18 10 026 10 21 Finland 27151 100 79 18 10 022 10 22 France 23881 105 81 19 08 023 10 15 Germany 25083 118 80 13 08 018 10 17 Greece 14382 106 79 15 08 017 10 28 Ireland 27965 116 78 21 10 016 10 15 Italy 18703 95 81 14 07 020 10 20 Japan 39435 115 82 13 08 018 10 00 Luxembourg 52388 101 81 16 10 015 10 20 Netherlands 26376 110 80 17 10 025 10 18 New Zealand 14939 127 80 22 09 019 10 28 Norway 40933 122 80 19 10 020 10 22 Portugal 11588 80 79 14 08 020 10 15 Spain 15699 103 81 14 08 019 10 22 Sweden 31778 115 81 19 10 026 10 18 Switzerland 38739 99 82 14 08 011 10 09 United Kingdom 27646 96 79 19 09 021 10 26 United States 36364 122 78 21 08 016 10 21 Developed world average 27200 108 81 17 09 019 10 19
Source wwwbarroleecom World Bank Political Risk Services International Country Risk Guide Freedom House Political Rights Index
13
Economics Global 11 January 2012
abc
The major headwind to growth in much of the
developed world stems from demographics This
is less of a problem for Australasia North
America the UK and Ireland which are all likely
to see population growth in the coming decades
By contrast the demographics in much of Europe
are challenging putting their debt problems into
an even more worrying light With debt levels
rising and the number of taxpayers falling it
becomes even harder to get the arithmetic to add
up Ironically Germany is one of the few
countries in the Eurozone not experiencing
funding difficulties but is in the worst structural
situation so far as demographics are concerned
Trying to get the debt arithmetic to add up for
Europe is a straightforward task compared with
Japan Japanrsquos gross debt to GDP now stands at
more than 200 and the number of people paying
taxes in the coming four decades will fall by 40
Adding the outlook for income per capita to the
number of lsquocapitasrsquo we see that with one
exception the developed world is not able to offer
more than 3 growth The lowest forecasts are
for Japan which fails to achieve more than 1
growth throughout the forecast horizon By
contrast the highest performer is New Zealand
14 Model projections for total GDP
2010-20 2020-30 2030-40 2040-50
Developed world Australia 24 23 25 26 Austria 27 19 19 21 Belgium 10 12 17 21 Canada 23 21 26 25 Denmark 05 08 11 20 Finland 11 14 19 19 France 11 14 16 21 Germany 17 11 14 17 Greece 29 26 22 21 Ireland 28 28 22 19 Italy 14 19 15 21 Japan 04 09 05 08 Luxembourg 28 22 23 25 Netherlands 11 12 15 22 New Zealand 34 30 29 29 Norway 09 13 15 21 Portugal 30 26 23 22 Spain 28 29 23 22 Sweden 04 13 17 21 Switzerland 26 20 20 23 United Kingdom 16 17 19 22 United States 11 14 19 21 Developed world avg 18 18 19 21
Source HSBC estimates
13 Demographic change between now and 2050
-50 0 50 100 150 200 250
JapanGermany
PortugalItaly
HungaryGreeceAustriaSpain
FinlandNetherlands
DenmarkBelgiumFrance
Sw itzerlandSw eden
UKNorw ayCanada
New ZealandUS
AustraliaIreland
Lux embourg
change in w orking population betw een now and 2050
Source UN population projections
14
Economics Global 11 January 2012
abc
Asia Many parts of Asia have extremely high standards of
education and rule of law Singapore and South
Korea of course being clear examples which would
explain why these economies have already seen such
rapid increases in income per capita Other countries
in the region have made enormous progress in
improving their economic infrastructure but are still
reasonably poor and therefore have great potential to
catch up Chinarsquos income per capita is currently just
7 that of the US Adding up the annual projections
shown in Table 16 we project Chinarsquos income per
capita to grow by more than 800 between now and
2050 This might seem an astonishing number But
keep in mind this base effect Despite this rapid
growth in 2050 Chinarsquos income per capita is still
just 32 that of the US We are only capturing part
of Chinarsquos development story here and the likelihood
is that these numbers turn out to be too conservative
rather than too optimistic The same is true of the
Philippines which looks set for a multi-decade run
of strong growth
16 Model projections for income per capita
2010-20 2020-30 2030-40 2040-50
Asia Azerbaijan 61 54 48 44 Bangladesh 36 44 50 55 China 65 57 51 46 India 40 45 48 51 Indonesia 30 37 42 47 Kazakhstan 59 52 47 43 South Korea 37 34 31 30 Malaysia 54 46 41 36 Pakistan 15 25 35 44 Philippines 61 56 52 48 Singapore 36 32 27 23 Sri Lanka 52 52 50 49 Thailand 37 40 41 42 Turkmenistan 61 55 49 45 Uzbekistan 67 60 55 51 Vietnam 47 49 52 55 Asia average 48 46 45 44
Source HSBC estimates
But being lsquopoorrsquo is not enough to guarantee growth
in income per capita The projections for Pakistan
demonstrate this Because of low scores for
schooling life expectancy rule of law and
democracy Pakistan has little potential for income
per capita to grow near term despite a low starting
point But given we assume governments will make
progress on some of these flaws so growth will start
to pick up in countries such as Pakistan and
Bangladesh
15 The lsquoeconomic infrastructurersquo today
GDP per capita
Average years male schooling
Life expectancy
Fertility (average
children per person)
Rule of law Government consumption
Democracy index
Inflation rate
Asia Real USD Years Years Children Index Ratio to GDP Index Annual rate Azerbaijan 2303 104 70 23 06 010 02 129 Bangladesh 482 58 66 23 04 006 03 78 China 2579 98 73 18 08 014 00 33 India 790 67 63 27 07 010 08 85 Indonesia 1178 62 70 22 05 008 08 76 Kazakhstan 2376 104 66 25 07 011 02 117 South Korea 16463 118 79 12 08 015 08 33 Malaysia 5224 101 74 26 07 012 05 27 Pakistan 657 56 67 40 05 009 02 138 Philippines 1215 90 72 31 04 010 05 51 Singapore 34110 91 80 13 08 010 03 31 Sri Lanka 1233 84 74 23 05 015 05 139 Thailand 2744 75 68 18 04 012 02 23 Turkmenistan 1827 104 65 25 07 009 00 78 Uzbekistan 893 104 68 26 07 017 00 78 Vietnam 674 64 74 21 07 006 00 128 Asia average 4220 84 71 23 06 011 03 78
Source wwwbarroleecom World Bank Political Risk Services International Country Risk Guide Freedom House Political Rights Index
15
Economics Global 11 January 2012
abc
From a demographic standpoint Asia is also a
reasonably mixed bag ndash this is where the shine
slightly comes off the China story since its one-
child policy of yester years will start to see the
working population decline from around 2020
Singapore and South Korea while not enforced
have also seen a staggering decline in fertility
rates in the past couple of decades which will see
their working populations also decline Singapore
has been exploring the possibility of reversing this
trend through an aggressive immigration policy
By contrast other parts of Asia ndash India Pakistan
the Philippines Bangladesh and Malaysia ndash all
have rapidly growing populations In 2050 the
population of Pakistan at roughly 290m will be
just shy of four times the population of the UK
Adding the forecasts for working population to
those of income per capita we get to projections
for total GDP growth in Table 18 There are some
truly remarkable hot spots in Asia China
continues to grow at a rapid pace although the
pace is expected to slow beyond 2020 as the
demographic drag starts to hinder overall GDP
growth Nevertheless we still expect average
GDP growth of more than 5 per annum for the
next 40 years The star performer however is the
Philippines where the combination of strong
fundamentals and powerful demographics gives
rise to an average growth rate of 7 for the
coming 40 years Central Asia is also interesting
Kazakhstan Turkmenistan and Uzbekistan all
perform extremely well in the context of this
model on the back of strong growth in a very
well-educated population The absence of
democracy however prevents these economies
reaching their full potential
18 Model projections for total GDP
2010-20 2020-30 2030-40 2040-50
Asia Azerbaijan 70 57 50 41 Bangladesh 55 55 56 55 China 67 55 44 41 India 57 56 55 52 Indonesia 43 43 43 45 Kazakhstan 61 58 49 40 South Korea 37 23 18 17 Malaysia 71 57 47 38 Pakistan 40 45 49 50 Philippines 84 73 66 58 Singapore 37 21 20 21 Sri Lanka 54 53 49 43 Thailand 40 38 38 40 Turkmenistan 77 64 56 45 Uzbekistan 82 69 61 50 Vietnam 57 53 51 48 Asia average 58 51 47 43
Source HSBC estimates
17 Demographic change between now and 2050
-50 0 50 100 150 200 250
S KoreaSingapore
ChinaThailand
Sri LankaVietnam
KazakhstanAzerbaijanIndonesia
UzbekistanTurkmenistan
BangladeshIndia
Malay siaPhilippines
Pakistan
change in w orking population betw een now and 2050
Source UN population projections
16
Economics Global 11 January 2012
abc
Central and South America The potential of economies in Latin America has
been unleashed in recent decades as they have
managed to tame the inflation that plagued their
economies for much of the 1970s and 1980s
(Table 19) It is remarkable to think that between
1986 and 1994 Brazil suffered several years of
inflation of over 500 Such has been the
turnaround in its economic management that it is
now imposing taxes on foreign investors to
prevent capital inflows Of course we are
assuming that inflation is prevented from ever
creeping back into the system Maintaining small
governments and low levels of debt will surely
help prevent these economies from returning to
their old ways
The level of schooling is high although many of
these economies score less highly on the metric of
rule of law than parts of Asia Greater efforts have
been made recently particularly in Brazil
20 Model projections for income per capita
2010-20 2020-30 2030-40 2040-50
Central and South America Argentina 24 26 27 28 Bolivia 56 52 49 46 Brazil 22 27 31 35 Chile 52 45 40 37 Colombia 30 33 36 38 Costa Rica 37 37 36 36 Cuba 23 30 34 37 Dominican Republic 36 37 37 37 Ecuador 49 48 47 45 El Salvador 39 40 41 41 Guatemala 08 16 24 33 Honduras 28 33 38 42 Mexico 21 39 37 36 Panama 35 34 34 33 Paraguay 48 48 46 45 Peru 54 49 45 41 Uruguay 25 27 28 30 Venezuela 14 20 25 30 Central and South American average
33 36 36 37
Source HSBC estimates
For these reasons the forecasts for income per
capita are not quite as high in many parts of Latin
America as in Asia Of course as discussed
earlier we are not accounting for the regionrsquos rich
endowment of natural resources
19 The lsquoeconomic infrastructurersquo today
GDP per capita
Average years male schooling
Life expectancy
Fertility (average
children per person)
Rule of law Government consumption
Democracy index
Inflation rate
Central and South America Real USD Years Years Children Index Ratio to GDP Index Annual rate Argentina 10517 93 73 22 04 013 08 79 Bolivia 1192 99 66 35 04 014 07 87 Brazil 4711 76 72 19 03 020 08 47 Chile 6083 102 79 19 08 011 10 81 Colombia 3052 77 72 24 03 016 07 56 Costa Rica 5043 87 79 20 06 013 10 102 Cuba 4370 106 79 15 05 032 00 81 Dominican Republic 3697 74 73 26 04 007 08 60 Ecuador 1771 81 75 26 04 011 07 53 El Salvador 2566 80 71 23 03 009 08 41 Guatemala 1858 48 70 41 03 009 07 70 Honduras 1380 75 72 33 03 017 07 81 Mexico 6217 91 75 21 03 011 08 48 Panama 5732 96 76 25 05 011 10 51 Paraguay 1432 85 72 30 03 011 07 70 Peru 2913 90 73 26 06 009 08 35 Uruguay 8942 86 76 20 04 011 10 77 Venezuela 5438 70 73 25 02 012 05 262 Central and South American average
4228 86 74 25 04 014 07 81
Source wwwbarroleecom World Bank Political Risk Services International Country Risk Guide Freedom House Political Rights Index
17
Economics Global 11 January 2012
abc
The demographic outlook for much of Central
South America is very strong particularly in the
smaller countries in the region Of the larger
economies Colombia and Peru stand out for
extremely high working population growth Indeed
at present the populations of Spain and Colombia
are very similar but by 2050 the working
population in Colombia could be 25 larger
Adding the forecasts for income per capita to
those of working population we obtain forecasts
for total GDP (Table 22) The star performer in
the region is Peru where the combination of
strong fundamentals and strong population growth
deliver average growth of 55 for the next 40
years Chile also does very well although
demographics are not quite as favourable as those
in Peru Bolivia Ecuador and Paraguay are also
strong performers although this is partly a
reflection of their low starting point They still lag
much of the region in the economic foundations
used in the model
22 Model projections for total GDP
2010-20 2020-30 2030-40 2040-50
Central and South America Argentina 34 33 31 27 Bolivia 79 69 59 52 Brazil 33 29 29 28 Chile 59 46 40 34 Colombia 45 42 41 40 Costa Rica 51 43 41 36 Cuba 20 22 20 29 Dominican Republic 51 46 42 39 Ecuador 65 57 52 46 El Salvador 51 50 48 45 Guatemala 43 45 46 46 Honduras 56 54 53 50 Mexico 33 44 35 31 Panama 53 46 40 37 Paraguay 70 64 60 52 Peru 69 60 50 42 Uruguay 30 29 29 28 Venezuela 31 32 33 33 Central and South American average
49 45 41 39
Source HSBC estimates
21 Demographic change between now and 2050
-50 0 50 100 150 200 250
CubaBrazilChile
UruguayMex ico
ArgentinaCosta Rica
ColombiaEcuador
DominicanPeru
ElSalv adorPanama
VenezuelaBoliv ia
ParaguayHonduras
Guatemala
change in w orking population betw een now and 2050
Source UN population projections
18
Economics Global 11 January 2012
abc
Central and Eastern Europe Central and Eastern European economies score less
highly than many of the other emerging markets for
inflation control and size of government
But when projecting real income per capita this is
more than compensated for by the exceptional
level of education which for most economies in
the region rivals that of the developed world And
yet while education rates are similar the average
income per capita in the Central and Eastern
Europe block is just one fifth that of the
developed world
For this reason in the context of this model these
economies have great scope to catch up in income
per capita and across the region the forecasts for
income per capita growth are extremely high
(Table 24)
24 Model projections for income per capita
2010-20 2020-30 2030-40 2040-50
Central and Eastern Europe Belarus 59 53 48 45 Bosnia amp Herzegovina 71 63 56 51 Bulgaria 48 47 45 45 Croatia 44 42 39 38 Cyprus 30 29 28 28 Czech Republic 53 45 40 36 Hungary 53 51 44 40 Latvia 56 49 44 40 Lithuania 43 41 39 38 Poland 40 39 38 37 Romania 67 62 54 48 Russia 51 48 46 44 Serbia 68 62 57 53 Slovak Republic 42 39 37 35 Slovenia 30 30 30 30 Turkey 40 39 38 37 Ukraine 89 73 63 56 CEE average 52 48 44 41
Source HSBC estimates
23 The lsquoeconomic infrastructurersquo today
GDP per capita
Average years male schooling
Life expectancy
Fertility (average
children per person)
Rule of law Government consumption
Democracy index
Inflation rate
Central and Eastern Europe Real USD Years Years Children Index Ratio to GDP Index Annual rate Belarus 2556 113 71 14 07 019 00 121 Bosnia and Herzegovina 2162 100 75 12 08 022 05 29 Bulgaria 2542 99 73 15 04 017 10 78 Croatia 6396 90 76 15 08 019 08 38 Cyprus 15510 101 80 15 08 019 10 25 Czech Republic 7225 121 77 15 08 020 10 34 Hungary 5833 117 74 14 07 010 10 61 Latvia 4973 108 72 15 08 017 08 97 Lithuania 5154 109 72 15 07 019 10 70 Poland 6563 99 76 14 08 019 10 35 Romania 2596 104 75 14 07 013 08 61 Russia 2934 97 67 15 07 017 02 116 Serbia 1229 100 74 13 06 020 10 90 Slovak Republic 8042 112 75 13 07 017 10 30 Slovenia 12577 89 79 15 08 017 10 34 Turkey 5088 70 71 21 08 013 05 85 Ukraine 987 111 68 14 07 018 07 180 CEE average 7000 104 74 15 07 018 08 70
Source wwwbarroleecom World Bank Political Risk Services International Country Risk Guide Freedom House Political Rights Index
19
Economics Global 11 January 2012
abc
It is just as well individuals will prove so productive
across the region because demographics are a major
headwind (Chart 25) In vast swathes of the region
the workforce looks set to shrink dramatically This
is largely because of the extremely low level of
fertility As discussed previously these forecasts for
population growth are subject to considerable
uncertainty Indeed in Russia last year an initiative
was launched to try and increase the fertility rate
with the incentive of land provided to couples
producing a third child
As things stand these weak demographics take the
shine slightly off the extremely strong growth in
income per capita Nevertheless the forecasts for
total GDP are still very impressive (Table 26) The
Ukraine is the outperformer with average growth
across the forecast horizon of 6 Again we have to
remember this is coming from an extremely low
base But nevertheless we expect the size of the
Ukrainian economy in constant price constant
exchange rates to increase tenfold by 2050
Some of the smaller Eastern European countries ndash
Romania the Czech Republic and Serbia ndash all do
extremely well particularly in the coming decade
before demographics prove to be more of a drag
And as in the original report we continue to
believe Turkey has an extremely strong long-term
story The combination of strong fundamentals
and the one country in the region with good
demographics should see Turkey maintain a very
respectable pace of growth throughout the
forecast horizon
26 Model projections for total GDP
2010-20 2020-30 2030-40 2040-50
Central and Eastern Europe Belarus 52 43 39 30 Bosnia amp Herzegovina 67 52 44 35 Bulgaria 36 37 33 28 Croatia 38 34 33 28 Cyprus 37 32 33 29 Czech Republic 46 44 36 27 Hungary 47 47 39 32 Latvia 48 42 38 29 Lithuania 34 30 31 29 Poland 33 32 31 21 Romania 61 57 43 35 Russia 42 40 40 33 Serbia 65 59 51 44 Slovak Republic 37 33 30 22 Slovenia 25 24 24 21 Turkey 53 47 40 35 Ukraine 79 63 55 42 CEE average 47 42 38 31
Source HSBC estimates
25 Demographic change between now and 2050
-50 0 50 100 150 200 250
BulgariaBosnia and Herzegovina
BelarusUkrainePoland
RomaniaLithuania
RussiaLatvia
SlovakiaCroatia
SloveniaSerbia
Czech RepublicCyprusTurkey
change in working population between now and 2050
Source UN population projections
20
Economics Global 11 January 2012
abc
Middle East and North Africa Our framework is able to provide some explanation
for the problems currently rocking many parts of
MENA High population growth poor education and
job prospects coupled with a lack of democracy are a
concoction that may explain the social unrest seen
during 2011 In the context of our model these
economies deliver average rates of growth in income
per capita
Being highly endowed with oil has managed to
ensure that income per capita in many of these
nations is already very high This model will
therefore penalise certain countries since it cannot
explain the current level of income per capita with
the variables it considers So we need to take
forecasts for economies such as Qatar with some
pinch of salt These economies may continue to
grow at a rapid pace despite any weakness in the
fundamentals for which our model is accounting
But clearly this source of wealth and the ability to
spread it fairly across the population is a major
source of contention now and will continue to be in
the future
28 Model projections for income per capita
2010-20 2020-30 2030-40 2040-50
Middle East and North Africa Algeria 42 43 43 43 Bahrain 34 30 28 25 Egypt 28 40 42 43 Iran 35 35 35 35 Iraq -06 09 23 37 Israel -03 13 17 21 Jordan 37 37 38 38 Kuwait 33 30 27 24 Lebanon 46 42 39 36 Libya 33 27 28 29 Morocco 31 31 37 42 Oman 24 25 25 25 Qatar 07 10 12 14 Saudi Arabia 20 22 24 26 Syria 22 29 35 41 Tunisia 40 41 42 42 United Arab Emirates 25 23 23 22 Yemen -24 -08 10 30 MENA average 20 24 27 30
Source HSBC estimates
27 The lsquoeconomic infrastructurersquo today
GDP per capita
Average years male schooling
Life expectancy
Fertility (average
children per person)
Rule of law Government consumption
Democracy index
Inflation rate
Middle East and North Africa Real USD Years Years Children Index Ratio to GDP Index Annual rate Algeria 2190 77 72 24 05 011 02 46 Bahrain 16968 96 76 23 08 014 03 32 Egypt 3002 88 70 29 06 011 02 131 Iran 2138 81 71 18 07 013 02 188 Iraq 743 58 68 41 03 023 02 80 Israel 21806 113 81 29 07 025 10 28 Jordan 2497 92 73 35 07 023 03 65 Kuwait 23072 63 78 22 08 014 05 67 Lebanon 6342 92 72 18 07 015 03 12 Libya 7692 79 74 27 07 011 00 64 Morocco 1781 50 71 24 08 018 03 22 Oman 10779 92 76 30 08 019 02 73 Qatar 38466 75 76 24 08 022 02 80 Saudi Arabia 9833 103 73 31 08 022 00 64 Syria 1350 53 74 32 08 011 00 75 Tunisia 2805 73 74 21 08 014 00 40 United Arab Emirates 25607 95 78 19 07 011 02 64 Yemen 565 37 63 52 03 016 03 102 MENA average 11158 77 73 29 07 017 03 79
Source wwwbarroleecom World Bank Political Risk Services International Country Risk Guide Freedom House Political Rights Index
21
Economics Global 11 January 2012
abc
The Middle East is one region where significant
immigration flows make forecasting the size of the
workforce difficult We have seen in the past decade
borders open and close according to ebbs and flows
in demand Nevertheless indigenous population
growth is strong across much of the region But
again we highlight that population growth is only a
good thing for an economy if all the other
foundations are strong This will ensure that these
new workers find jobs If the other fundamentals are
not there then young unemployed individuals
become frustrated which can be a recipe for social
unrest rather than progress
Overall there are lots of caveats to bear in mind
with regards to how this model might not
accurately capture the outlook for parts of the
Middle East In particular we think this
framework is underestimating the potential of
Israel and Qatar
Nevertheless the model does conform to our high
expectations for long-term growth in Egypt and
Saudi Arabia despite some of the near-term
challenges Similarly the outlook looks extremely
robust for Bahrain Jordan and the United Arab
Emirates
30 Model projections for total GDP
2010-20 2020-30 2030-40 2040-50
MENA Algeria 56 54 49 41 Bahrain 57 42 30 27 Egypt 47 56 52 48 Iran 45 44 38 28 Iraq 34 37 42 52 Israel 11 25 25 27 Jordan 59 58 48 42 Kuwait 54 44 31 26 Lebanon 57 45 40 33 Libya 53 43 34 27 Morocco 42 39 40 39 Oman 48 41 37 30 Qatar 21 21 18 13 Saudi Arabia 45 39 35 32 Syria 43 53 48 46 Tunisia 49 46 43 36 United Arab Emirates 47 35 22 09 Yemen 14 25 37 48 MENA average 42 40 36 33
Source HSBC estimates
29 Demographic change between now and 2050
-50 0 50 100 150 200 250
TunisiaLebanon
IranUAE
MoroccoAlgeria
QatarBahrain
Liby aIsrael
Kuw aitEgy ptOman
JordanSaudi Arabia
Sy riaIraq
Yemen
c hange in w orking population betw een now and 2050
Source UN population projections
22
Economics Global 11 January 2012
abc
Sub-Saharan Africa Africa has sadly been the lost continent for many
decades and many parts of the region are still riddled
with corruption civil war and disease Indeed
comparing the averages today for Africa to those of
Asia is disheartening Life expectancy of just 58
versus 71 in Asia and schooling of just 64 years
compared with 84 in Asia are important drawbacks
In addition inflation and a total lack of democracy is
a major problem for some countries
Average real income per capita in Africa is just 7
that of the US with people in many countries living
on less than a dollar a day But again being lsquopoorrsquo
or at a low level of development is not enough to
guarantee growth and for certain countries in the
region our model does not predict that income per
capita will rise significantly in the decade ahead
Countries such as Angola and Uganda appear stuck
in the poverty trap But by assuming governments
will improve these economic flaws we show the
potential for change only time will tell whether
governments are able to deliver on this
32 Model projections for income per capita
2010-20 2020-30 2030-40 2040-50
Africa Angola -03 10 21 32 Cameroon 06 18 29 40 Ethiopia 20 32 43 53 Ghana 31 39 46 52 Kenya 15 26 36 45 Nigeria 09 21 32 42 South Africa 11 19 26 33 Tanzania 36 42 46 50 Uganda -01 13 27 41 Africa average 21 28 35 42
Source HSBC estimates
Nevertheless there are bright spots where already
improvements have been made and the countries
may be turning a corner The model predicts
strongest growth in income per capita for
Tanzania and Ghana although again we are
coming from such an extraordinarily low base
31 The lsquoeconomic infrastructurersquo today
GDP per capita
Average years male schooling
Life expectancy
Fertility (average
children per person)
Rule of law Government consumption
Democracy index
Inflation rate
Africa Angola 1313 73 47 58 05 018 02 128 Cameroon 694 61 51 46 03 010 02 31 Ethiopia 201 61 55 53 08 010 03 234 Ghana 343 78 57 40 04 012 10 155 Kenya 452 73 54 49 03 018 05 151 Nigeria 506 73 48 57 03 018 05 95 South Africa 3710 86 51 25 04 019 08 86 Tanzania 382 73 56 56 08 016 05 98 Uganda 366 54 53 63 06 013 03 104 Africa average 1643 64 58 42 05 014 04 92
Source wwwbarroleecom World Bank Political Risk Services International Country Risk Guide Freedom House Political Rights Index
23
Economics Global 11 January 2012
abc
But the demographic story is extremely strong in
Africa (Chart 33) Indeed half the increase in the
worldrsquos population over the next 40 years will be
in Africa
For those countries that have at least reasonable
prospects for individual prosperity this should
give rise to strong growth in total GDP (Table
34) Again we are coming from a low base
Nigeria deserves a special mention The rapid
population growth in Nigeria means that by 2050
its population will be almost as large as that of the
United States The potential of this country is huge
if the government does manage to deliver the
change that belies these projections
Tanzania is also worth highlighting Again rapid
growth in the population will see it reach almost
140m in 2050 ndash almost twice that of the projection
in either the UK or Germany Given that the
fundamentals are already looking in reasonably
good shape we could see an explosion in growth in
this economy Again we are coming from a low
base ndash income per capita at the moment in
Tanzania in real terms is just USD382 We project
this will rise to only USD2085 by 2050 but given
the growth in the population this would still equate
to a 1700 increase in the size of the economy
Ethiopia so often making the headlines for
poverty and famine appears to be making
progress Indeed last year Ethiopia was one of
the fastest growing economies in the world
delivering more than 10 GDP growth We
forecast strong growth to continue although again
even in 2050 we see income per capita at just 2
that of the US
34 Model projections for total GDP
2010-20 2020-30 2030-40 2040-50
Africa Angola 33 40 48 53 Cameroon 33 44 49 54 Ethiopia 55 63 67 70 Ghana 59 65 66 68 Kenya 46 58 60 63 Nigeria 38 48 52 56 South Africa 16 24 31 35 Tanzania 70 78 76 74 Uganda 43 56 63 68 Africa average 46 51 52 53
Source HSBC estimates
33 Demographic change between now and 2050
-50 0 50 100 150 200 250
SouthAfrica
Cameroon
Nigeria
Ghana
Keny a
Ethiopia
Angola
Tanzania
Uganda
c hange in w orking population betw een now and 2050
Source UN population projections
24
Economics Global 11 January 2012
abc
Putting it all together Considering all these economies we can separate
them into the following three groups (Table 35)
Fast growth ndash gt5 average growth to 2050
The fast-growth economies are those that are at a
low level of development but which have
sufficiently strong underlying fundamentals so that
they catch up with more developed economies with
similarly strong fundamentals
We have already discussed China and India which
sit firmly at the top of this group Elsewhere in Asia
the Philippines Malaysia Bangladesh and Vietnam
all look very strong
In Latin America Peru is the star performer in the
region given it starts from a lower level of
development than some of its counterparts in the
region coupled with strong demographics Many of
the smaller CEEMEA economies also sit here
particularly those with fantastic rates of education
and a good rule of law despite poor demographics
In the Middle East despite near-term uncertainty we
think Egypt has good long-term prospects
Growth ndash 3 lt growth lt5
The lsquogrowthrsquo group are also set to outperform many
of the developed world economies In Asia we
highlight Indonesia and Thailand within this group
and Pakistan owing to the sheer size of working
population Latin America dominates this group of
lsquogrowthrsquo countries Brazil Colombia and Mexico
look very strong and remain firmly in our group of
Top 30 economies in 2050
Stable ndash growth lt3
The stable group of countries offer more limited
growth prospects These largely include the high-
growth ageing economies in the developed world
of which Europe fares particularly badly As
discussed growth in Israel Qatar and UAE may be
underestimated in this model
Conclusions and risks
lsquoRapid growthrsquo is expected by those with a low starting point but
strong fundamentals ndash the Philippines Egypt Peru and Ukraine
lsquoGrowthrsquo economies have strong prospects but a higher starting
point Mexico Turkey Saudi Arabia and Nigeria stand out
A lsquostablersquo group largely the developed world has more limited
potential for growth
25
Economics Global 11 January 2012
abc
35 Which countries will deliver the fastest growth en route to 2050 List ordered based on size of economy in 2050
ChinaIndia
PhilippinesEgypt
MalaysiaPeru
BangladeshAlgeriaUkraineVietnam
UzbekistanTanzania
KazakhstanEcuadorEthiopia
Sri LankaAzerbaijan
KenyaBoliviaJordanUgandaGhana
ParaguayTurkmenistan
HondurasSerbia
Fast growth
BrazilMexicoTurkeyRussia
IndonesiaArgentina
Saudi ArabiaThailand
IranColombiaPakistan
ChileVenezuela
NigeriaRomania
Czech RepublicHungaryKuwait
MoroccoLibya
New ZealandDominican Republic
SyriaTunisia
GuatemalaLebanon
Slovak RepublicOmanAngola
Costa RicaBelarus
IraqPanamaCroatia
El SalvadorCameroonBulgariaBahrain
LithuaniaBosnia and Herzegovina
LatviaYemenCyprus
Growth
United StatesJapan
GermanyUnited Kingdom
FranceCanada
ItalySouth Korea
SpainAustralia
NetherlandsPoland
SwitzerlandSouth Africa
AustriaSwedenBelgium
SingaporeGreeceIsraelIreland
United Arab EmiratesNorwayPortugalFinland
DenmarkCubaQatar
UruguayLuxembourg
Slovenia
Stable
ChinaIndia
PhilippinesEgypt
MalaysiaPeru
BangladeshAlgeriaUkraineVietnam
UzbekistanTanzania
KazakhstanEcuadorEthiopia
Sri LankaAzerbaijan
KenyaBoliviaJordanUgandaGhana
ParaguayTurkmenistan
HondurasSerbia
Fast growth
BrazilMexicoTurkeyRussia
IndonesiaArgentina
Saudi ArabiaThailand
IranColombiaPakistan
ChileVenezuela
NigeriaRomania
Czech RepublicHungaryKuwait
MoroccoLibya
New ZealandDominican Republic
SyriaTunisia
GuatemalaLebanon
Slovak RepublicOmanAngola
Costa RicaBelarus
IraqPanamaCroatia
El SalvadorCameroonBulgariaBahrain
LithuaniaBosnia and Herzegovina
LatviaYemenCyprus
Growth
United StatesJapan
GermanyUnited Kingdom
FranceCanada
ItalySouth Korea
SpainAustralia
NetherlandsPoland
SwitzerlandSouth Africa
AustriaSwedenBelgium
SingaporeGreeceIsraelIreland
United Arab EmiratesNorwayPortugalFinland
DenmarkCubaQatar
UruguayLuxembourg
Slovenia
Stable
Source HSBC estimates
26
Economics Global 11 January 2012
abc
Rose-tinted spectacles We openly admit that behind these projections we
assume governments build on their recent progress
and remain solely focused on increasing the living
standards for their populations Of course this may
be an overly glossy way of viewing the world and
we conclude there are a number of reasons our
lsquoWorld in 2050rsquo could turn out a little different
We consider the main culprits below
Resource constraints
Our calculations have focused on the human
potential of the world economy paying no
attention to the physical constraints of the world
we live in those that are becoming more evident
by the day leading to upward pressure on many
commodity prices
In a follow-up report entitled Energy in 2050 (22
March 2011) we mapped our GDP forecasts into
energy forecasts This exercise certainly gave rise
to some fairly worrying numbers Chart 36 shows
the results for the top 3 economies we consider If
we were in a world of unlimited resources
consumption would explode as the emerging
consumers start to develop a taste for cars and
other energy-hungry domestic appliances Clearly
for our lsquoWorld in 2050rsquo to materialise we need to
change the way we use energy What is
comforting however is that even constraining
ourselves to the technology that we know exists
today it is possible to find a solution that
combines energy efficiency and a move towards
more renewable sources of energy But this does
require major government and industrial foresight
Creating the incentives for all players to change is
the biggest hurdle Rising energy prices are the
most obvious catalyst It seems more likely
change will occur to avoid the cost of high energy
prices rather than a change for the greater good or
even for the potential benefit of children 40 years
down the line
The energy constraint may be another reason why
the emerging world outperforms the cash-strapped
West Starting with a blank sheet of paper and
having governments with borrowing capacity to
deliver change may see these economies
overcome these constraints more quickly than the
cash-strapped West
But our lsquoEnergy in 2050rsquo report also highlighted
that climate change is a major concern Indeed it
is much easier to overcome the energy constraint
than it is to do so while meeting carbon emission
36 We need to use energy more efficiently to reach this potential
0 1000 2000 3000 4000 5000 6000 7000 8000
India
China
US
Today 2050 consumption if resources werent constrained
Total energy use (Million tonnes of oil equiv alent)
Source HSBC estimates
27
Economics Global 11 January 2012
abc
targets In that report we provide a map of
regions most vulnerable to climate change which
is another variable that should be taken into
account when considering an economyrsquos long-
term future
Omitted variables
We have already discussed that our model cannot
capture all the variables that will dictate an
economyrsquos potential We have used a one-size-
fits-all model to provide a very clear and
transparent framework for thinking about
development By starting to tinker with the
projections based on judgment you essentially
create a list based on opinion Instead we chose to
leave the reader to consider idiosyncratic factors
requiring further consideration that mean a
country should feature more highly or indeed
lower down our economic league table
Cyclical fluctuations
Our model is a structural model that should
determine the potential supply of the economy
There are cyclical factors that can cause economies
to deviate from this long-term path For example
it may be that the use of credit had taken the
developed world above its sustainable path and the
slow growth of the past few years is the
readjustment to the long-term sustainable path
Similarly many emerging economies in the past
few years have been growing stronger than our
projections and were encountering inflationary
pressures and thus required policy action to return
the pace of growth to something more sustainable
Border barriers and war
The biggest danger is that the open borders which
have delivered so much prosperity are closed It is
hard to see how such a wave of protectionism
could benefit an individual economy and certainly
not the system as a whole But politiciansrsquo
motivation tends to be focused on the next election
rather than long-term growth As such bad politics
is a key risk to these projections And of course
trade wars can be followed by real wars which
would obviously set this rather glossy outlook way
off track Civil wars are another potential risk in
certain countries
28
Economics Global 11 January 2012
abc
A major shake-up in world order This extension reinforces the findings from our
original 2050 report Plenty of places in the world
look set to deliver very strong rates of growth But
they are not in the developed world which faces
both structural and cyclical headwinds They are
in the emerging world You can see this in action
by viewing the video of which a snapshot is
available on the following page
In the original report we highlighted the
extraordinary prospects for the likes of China
India Malaysia Mexico Colombia and Turkey
These economies themselves are still at an early
stage of development and continue to offer
fantastic growth prospects But increasingly
attention will turn to the lsquonew emergersrsquo Countries
such as the Philippines Peru and Nigeria all
demonstrate some combination of favourable
demographics and strong fundamentals that should
see a significant rise in their economic size
And so there are likely to be some major changes
in the economic league table between now and
2050 with countries such as the Philippines
jumping as many as 27 places (Table 37) The
losers are the small population ageing economies
of Europe Such change may seem remarkable but
it is not abnormal Table 38 ranks the economies
by size today and shows how this rank has
changed in the past four decades China India and
South Korea have already shown excellent lsquoleap-
frog abilityrsquo The relative decline of countries in
Europe that we forecast is an ongoing extension
of a trend already in place
37 Major change may seem unthinkable but such large shifts are common in history
Order based on size of economy in 2010
(constant 2000 USD)
Rank change since 1970
1 United States 0 2 Japan 0 3 China 14 4 Germany -1 5 United Kingdom -1 6 France -1 7 Italy -1 8 India 7 9 Brazil 0 10 Canada -3 11 South Korea 12 12 Spain -4 13 Mexico -3 14 Australia -2 15 Netherlands -4 16 Argentina -3 17 Russia Not available 18 Turkey 2 19 Sweden -5 20 Switzerland Not available
Source World Bank HSBC
We conclude that the world has great potential to
grow in the coming decades but that growth will
not stem from the developed world The EM story
is only just beginning As the lsquonew emergersrsquo
come to the fore emerging economies offer great
potential to power the global economy to 2050
Econom
ics G
lobal 11 January 2012
29
ab
c
We have created a video that tracks the growth in GDP across the various countries through time The chart above shows the final frame of this video
The length of the bars indicates the cumulative percentage increase in GDP for each country relative to 2010 The colour of the bars shows the level of GDP So for example a
long red bar implies that a country has a large GDP and a high rate of GDP growth
Visit httpcachecantoscomflashhsba-r061GDP_growth_2050-WMVwmv to watch how the growth rates for the different countries change between 2010 and 2050
30
Economics Global 11 January 2012
abc
This page has been left blank intentionally
31
Economics Global 11 January 2012
abc
Appendix
32
Economics Global 11 January 2012
abc
Barrorsquos growth model A1 The model
Variable Coefficients
Log GDP -0018 Male schooling 0002 Log GDP schooling -0004 Log life expectancy 0044 Log fertility -0016 Government consumption ratio -0136 Rule of law index 0029 Democracy index 0090 Democracy index squared -0088 Inflation rate -0043
Source Barro with HSBC adjustment to schooling
We made two amendments to Barrorsquos original
model First we lowered slightly the convergence
rate in line with more recent literature (see OECD
2001)
Second it appeared that the original model was
overstating the impact of education In Barrorsquos
original model an extra year of schooling raises
GDP growth by 12ppt Those with very high
levels of education such as Germany were
forecast to grow much more quickly than they
achieved And countries such as India with very
low levels of education were barely forecast to
grow at all However recalibrating the model to
lower the impact of education produced
remarkably accurate forecasts for such a simple
model The main areas of failure are in Asia
where the region in the early part of the 2000-10
period was still recovering from the Asian crisis
In the following tables we show the details of the
two scenarios that we use to build up to our lsquobase
casersquo The first assumes that governments make
no progress in improving their economic
infrastructure The second assumes that
governments make complete progress bring their
economic infrastructure steadily up to those best
in class in each category such as level of
education Our base case sits between these two
scenarios Essentially each country gets halfway
to improving its imperfections
The model
Model projections for the universe under consideration
-10
-5
0
5
10
15
US
Chi
na UK
Italy
Braz
ilS
Kor
eaM
exic
oN
ethe
rland
sR
ussi
aSw
eden
Belg
ium
Saud
i Ara
bia
Hon
g Ko
ngN
orw
ayTh
aila
ndG
reec
eVe
nezu
ela
Egyp
tC
olom
bia
Mal
aysi
aPo
rtuga
lPh
ilippi
nes
Chi
leN
iger
iaAl
geria
New
Viet
nam
Mor
occo
Qat
arC
uba
Slov
akD
omin
ican
Uru
guay
Syria
Leba
non
Gua
tem
ala
Sri L
anka
Bela
rus
Ecua
dor
Cos
ta R
ica
Azer
baija
nBu
lgar
iaM
acao
Ethi
opia
El S
alva
dor
Trin
idad
and
Yem
enC
ypru
sBo
livia
Icel
and
Jam
aica
Para
guay
Moz
ambi
quG
hana
Bots
wan
a
Model Rate Actual rate
Source World Bank and HSBC estimates using Barrorsquos amended model
33
Economics Global 11 January 2012
abc
Scenario 1 Income per capita forecasts if governments make no progress in improving economic infrastructure
2010-20 2020-30 2030-40 2040-50
Algeria 42 38 34 30 Angola -03 -02 -02 -02 Argentina 25 20 16 13 Australia 19 15 13 11 Austria 27 22 18 15 Azerbaijan 61 49 39 31 Bahrain 34 28 23 19 Bangladesh 36 35 34 33 Belarus 59 45 35 27 Belgium 11 10 08 07 Bolivia 56 46 38 31 Bosnia and Herzegovina
71 58 48 39
Brazil 23 18 14 11 Bulgaria 48 39 32 26 Cameroon 06 06 05 05 Canada 19 16 14 12 Chile 52 42 34 27 China 66 52 43 35 Colombia 30 25 21 17 Costa Rica 37 32 27 23 Croatia 44 37 32 27 Cuba 25 20 16 12 Cyprus 30 24 19 16 Czech Republic 53 39 29 21 Denmark 06 05 04 04 Dominican Republic 36 32 29 27 Ecuador 49 44 38 34 Egypt 35 40 34 29 El Salvador 39 34 30 27 Ethiopia 20 19 18 17 Finland 15 13 11 09 France 12 10 08 07 Germany 21 18 15 13 Ghana 31 27 24 22 Greece 30 26 21 17 Guatemala 08 08 08 08 Honduras 28 25 23 20 Hungary 59 44 33 25 India 41 35 30 26 Indonesia 31 26 22 18 Iran 62 52 42 35 Iraq -05 -05 -05 -05 Ireland 16 17 14 12 Israel -01 10 09 08 Italy 21 18 14 12 Japan 12 11 10 09 Jordan 37 31 26 22 Kazakhstan 59 47 38 30 Kenya 15 14 13 12 Kuwait 34 32 30 29
Source HSBC estimates
Scenario 1 Income per capita forecasts if governments make no progress in improving economic infrastructure (cont)
2010-20 2020-30 2030-40 2040-50
Latvia 56 44 34 27 Lebanon 46 39 33 28 Libya 27 24 21 19 Lithuania 43 33 26 20 Luxembourg 16 13 10 08 Malaysia 54 44 36 29 Mexico 36 31 26 21 Morocco 25 25 25 25 Netherlands 12 11 10 08 New Zealand 29 21 15 10 Nigeria 09 08 07 07 Norway 04 06 07 06 Oman 24 21 17 15 Pakistan 15 15 15 14 Panama 35 29 24 20 Paraguay 48 42 36 32 Peru 54 46 39 33 Philippines 61 52 44 38 Poland 41 33 27 22 Portugal 32 29 25 22 Qatar 09 08 07 06 Romania 71 57 46 37 Russia 51 42 35 29 S Korea 39 29 24 19 Saudi Arabia 19 16 14 11 Serbia 68 56 45 37 Singapore 42 32 27 23 Slovak Republic 42 32 25 19 Slovenia 30 26 22 19 South Africa 11 09 07 05 Spain 29 25 20 17 Sri Lanka 52 46 40 35 Sweden 05 06 06 06 Switzerland 26 21 17 14 Syria 22 22 22 21 Tanzania 36 32 30 27 Thailand 38 32 27 23 Tunisia 40 36 33 30 Turkey 40 34 29 25 Turkmenistan 61 49 39 31 Uganda -01 -01 -01 -01 UK 13 11 09 07 Ukraine 87 68 52 41 United Arab Emirates 25 21 17 14 Uruguay 25 22 19 16 US 05 07 07 07 Uzbekistan 67 54 43 34 Venezuela 14 11 08 05 Vietnam 44 42 39 37 Yemen -24 -25 -26 -27
Source HSBC estimates
34
Economics Global 11 January 2012
abc
Scenario 2 Income per capita forecasts if governments make complete progress in improving economic infrastructure catching up with best in class
2010-20 2020-30 2030-40 2040-50
Algeria 42 50 56 60 Angola -03 24 48 69 Argentina 25 31 37 42 Australia 19 24 28 31 Austria 27 30 32 34 Azerbaijan 61 58 56 55 Bahrain 34 33 32 32 Bangladesh 36 56 72 85 Belarus 59 58 59 61 Belgium 11 21 29 35 Bolivia 56 58 59 61 Bosnia and Herzegovina
71 67 64 62
Brazil 23 35 47 57 Bulgaria 48 54 58 63 Cameroon 06 33 58 79 Canada 19 25 30 34 Chile 52 49 46 45 China 66 60 58 57 Colombia 30 41 50 58 Costa Rica 37 43 47 52 Croatia 44 46 48 50 Cuba 25 39 50 61 Cyprus 30 34 37 40 Czech Republic 53 49 46 46 Denmark 06 17 26 33 Dominican Republic 36 43 48 52 Ecuador 49 54 58 60 Egypt 35 38 48 56 El Salvador 39 47 54 59 Ethiopia 20 47 72 92 Finland 15 23 28 33 France 12 21 28 35 Germany 21 28 32 36 Ghana 31 52 70 84 Greece 30 35 38 41 Guatemala 08 28 48 65 Honduras 28 43 56 67 Hungary 59 53 50 49 India 41 54 66 74 Indonesia 31 48 62 74 Iran 62 61 59 59 Iraq -05 26 56 83 Ireland 16 24 27 30 Israel -01 14 25 34 Italy 21 29 35 40 Japan 12 21 27 32 Jordan 37 44 50 54 Kazakhstan 59 56 55 54 Kenya 15 41 63 82 Kuwait 34 32 30 28
Source HSBC estimates
Scenario 2 Income per capita forecasts if governments make complete progress in improving economic infrastructure catching up with best in class (cont)
2010-20 2020-30 2030-40 2040-50
Latvia 56 53 51 51 Lebanon 46 46 46 46 Libya 27 33 39 44 Lithuania 43 47 50 54 Luxembourg 16 19 22 25 Malaysia 54 49 46 43 Mexico 36 41 45 47 Morocco 25 42 56 68 Netherlands 12 22 29 35 New Zealand 29 32 34 36 Nigeria 09 36 60 80 Norway 04 16 23 28 Oman 24 29 34 38 Pakistan 15 39 61 79 Panama 35 40 43 47 Paraguay 48 54 58 61 Peru 54 53 52 52 Philippines 61 61 61 60 Poland 41 44 48 51 Portugal 32 37 41 45 Qatar 09 14 20 26 Romania 71 65 61 58 Russia 51 54 57 60 S Korea 39 37 39 40 Saudi Arabia 19 28 34 40 Serbia 68 68 68 69 Singapore 42 30 26 23 Slovak Republic 42 44 46 49 Slovenia 30 35 39 43 South Africa 11 30 46 60 Spain 29 34 37 40 Sri Lanka 52 59 63 66 Sweden 05 17 26 33 Switzerland 26 26 27 27 Syria 22 40 55 68 Tanzania 36 52 66 77 Thailand 38 47 55 62 Tunisia 40 48 54 59 Turkey 40 44 47 49 Turkmenistan 61 59 58 57 Uganda -01 30 60 87 UK 13 21 27 32 Ukraine 87 77 71 68 United Arab Emirates 25 27 29 30 Uruguay 25 33 40 46 US 05 17 24 29 Uzbekistan 67 66 66 66 Venezuela 14 29 42 53 Vietnam 44 59 71 79 Yemen -24 13 53 91
Source HSBC estimates
35
Economics Global 11 January 2012
abc
Notes
36
Economics Global 11 January 2012
abc
Notes
37
Economics Global 11 January 2012
abc
Notes
38
Economics Global 11 January 2012
abc
Disclosure appendix Analyst Certification The following analyst(s) economist(s) andor strategist(s) who is(are) primarily responsible for this report certifies(y) that the opinion(s) on the subject security(ies) or issuer(s) andor any other views or forecasts expressed herein accurately reflect their personal view(s) and that no part of their compensation was is or will be directly or indirectly related to the specific recommendation(s) or views contained in this research report Karen Ward Nick Robins and Zoe Knight
Important Disclosures This document has been prepared and is being distributed by the Research Department of HSBC and is intended solely for the clients of HSBC and is not for publication to other persons whether through the press or by other means
This document is for information purposes only and it should not be regarded as an offer to sell or as a solicitation of an offer to buy the securities or other investment products mentioned in it andor to participate in any trading strategy Advice in this document is general and should not be construed as personal advice given it has been prepared without taking account of the objectives financial situation or needs of any particular investor Accordingly investors should before acting on the advice consider the appropriateness of the advice having regard to their objectives financial situation and needs If necessary seek professional investment and tax advice
Certain investment products mentioned in this document may not be eligible for sale in some states or countries and they may not be suitable for all types of investors Investors should consult with their HSBC representative regarding the suitability of the investment products mentioned in this document and take into account their specific investment objectives financial situation or particular needs before making a commitment to purchase investment products
The value of and the income produced by the investment products mentioned in this document may fluctuate so that an investor may get back less than originally invested Certain high-volatility investments can be subject to sudden and large falls in value that could equal or exceed the amount invested Value and income from investment products may be adversely affected by exchange rates interest rates or other factors Past performance of a particular investment product is not indicative of future results
Analysts economists and strategists are paid in part by reference to the profitability of HSBC which includes investment banking revenues
For disclosures in respect of any company mentioned in this report please see the most recently published report on that company available at wwwhsbcnetcomresearch
HSBC Legal Entities are listed in the Disclaimer below
Additional disclosures 1 This report is dated as at 11 January 2012 2 All market data included in this report are dated as at close 05 January 2012 unless otherwise indicated in the report 3 HSBC has procedures in place to identify and manage any potential conflicts of interest that arise in connection with its
Research business HSBCs analysts and its other staff who are involved in the preparation and dissemination of Research operate and have a management reporting line independent of HSBCs Investment Banking business Information Barrier procedures are in place between the Investment Banking and Research businesses to ensure that any confidential andor price sensitive information is handled in an appropriate manner
39
Economics Global 11 January 2012
abc
Disclaimer Legal entities as at 04 March 2011 lsquoUAErsquo HSBC Bank Middle East Limited Dubai lsquoHKrsquo The Hongkong and Shanghai Banking Corporation Limited Hong Kong lsquoTWrsquo HSBC Securities (Taiwan) Corporation Limited lsquoCArsquo HSBC Securities (Canada) Inc Toronto HSBC Bank Paris Branch HSBC France lsquoDErsquo HSBC Trinkaus amp Burkhardt AG Duumlsseldorf 000 HSBC Bank (RR) Moscow lsquoINrsquo HSBC Securities and Capital Markets (India) Private Limited Mumbai lsquoJPrsquo HSBC Securities (Japan) Limited Tokyo lsquoEGrsquo HSBC Securities Egypt SAE Cairo lsquoCNrsquo HSBC Investment Bank Asia Limited Beijing Representative Office The Hongkong and Shanghai Banking Corporation Limited Singapore Branch The Hongkong and Shanghai Banking Corporation Limited Seoul Securities Branch The Hongkong and Shanghai Banking Corporation Limited Seoul Branch HSBC Securities (South Africa) (Pty) Ltd Johannesburg lsquoGRrsquo HSBC Securities SA Athens HSBC Bank plc London Madrid Milan Stockholm Tel Aviv lsquoUSrsquo HSBC Securities (USA) Inc New York HSBC Yatirim Menkul Degerler AS Istanbul HSBC Meacutexico SA Institucioacuten de Banca Muacuteltiple Grupo Financiero HSBC HSBC Bank Brasil SA ndash Banco Muacuteltiplo HSBC Bank Australia Limited HSBC Bank Argentina SA HSBC Saudi Arabia Limited The Hongkong and Shanghai Banking Corporation Limited New Zealand Branch
Issuer of report HSBC Bank plc 8 Canada Square London
E14 5HQ United Kingdom
Telephone +44 20 7991 8888 Fax +44 20 7992 4880
Website wwwresearchhsbccom
This document is issued and approved in the United Kingdom by HSBC Bank plc for the information of its Clients (as defined in the Rules of FSA) and those of its affiliates only If this research is received by a customer of an affiliate of HSBC its provision to the recipient is subject to the terms of business in place between the recipient and such affiliate In Australia this publication has been distributed by The Hongkong and Shanghai Banking Corporation Limited (ABN 65 117 925 970 AFSL 301737) for the general information of its ldquowholesalerdquo customers (as defined in the Corporations Act 2001) Where distributed to retail customers this research is distributed by HSBC Bank Australia Limited (AFSL No 232595) These respective entities make no representations that the products or services mentioned in this document are available to persons in Australia or are necessarily suitable for any particular person or appropriate in accordance with local law No consideration has been given to the particular investment objectives financial situation or particular needs of any recipient The document is distributed in Hong Kong by The Hongkong and Shanghai Banking Corporation Limited and in Japan by HSBC Securities (Japan) Limited Each of the companies listed above (the ldquoParticipating Companiesrdquo) is a member of the HSBC Group of Companies any member of which may trade for its own account as Principal may have underwritten an issue within the last 36 months or together with its Directors officers and employees may have a long or short position in securities or instruments or in any related instrument mentioned in the document Brokerage or fees may be earned by the Participating Companies or persons associated with them in respect of any business transacted by them in all or any of the securities or instruments referred to in this document In Korea this publication is distributed by either The Hongkong and Shanghai Banking Corporation Limited Seoul Securities Branch (HBAP SLS) or The Hongkong and Shanghai Banking Corporation Limited Seoul Branch (HBAP SEL) for the general information of professional investors specified in Article 9 of the Financial Investment Services and Capital Markets Act (ldquoFSCMArdquo) This publication is not a prospectus as defined in the FSCMA It may not be further distributed in whole or in part for any purpose Both HBAP SLS and HBAP SEL are regulated by the Financial Services Commission and the Financial Supervisory Service of Korea This publication is distributed in New Zealand by The Hongkong and Shanghai Banking Corporation Limited New Zealand Branch The information in this document is derived from sources the Participating Companies believe to be reliable but which have not been independently verified The Participating Companies make no guarantee of its accuracy and completeness and are not responsible for errors of transmission of factual or analytical data nor shall the Participating Companies be liable for damages arising out of any personrsquos reliance upon this information All charts and graphs are from publicly available sources or proprietary data The opinions in this document constitute the present judgement of the Participating Companies which is subject to change without notice This document is neither an offer to sell purchase or subscribe for any investment nor a solicitation of such an offer HSBC Securities (USA) Inc accepts responsibility for the content of this research report prepared by its non-US foreign affiliate All US persons receiving andor accessing this report and intending to effect transactions in any security discussed herein should do so with HSBC Securities (USA) Inc in the United States and not with its non-US foreign affiliate the issuer of this report In Singapore this publication is distributed by The Hongkong and Shanghai Banking Corporation Limited Singapore Branch for the general information of institutional investors or other persons specified in Sections 274 and 304 of the Securities and Futures Act (Chapter 289) (ldquoSFArdquo) and accredited investors and other persons in accordance with the conditions specified in Sections 275 and 305 of the SFA This publication is not a prospectus as defined in the SFA It may not be further distributed in whole or in part for any purpose The Hongkong and Shanghai Banking Corporation Limited Singapore Branch is regulated by the Monetary Authority of Singapore Recipients in Singapore should contact a Hongkong and Shanghai Banking Corporation Limited Singapore Branch representative in respect of any matters arising from or in connection with this report HSBC Meacutexico SA Institucioacuten de Banca Muacuteltiple Grupo Financiero HSBC is authorized and regulated by Secretariacutea de Hacienda y Creacutedito Puacuteblico and Comisioacuten Nacional Bancaria y de Valores (CNBV) HSBC Bank (Panama) SA is regulated by Superintendencia de Bancos de Panama Banco HSBC Honduras SA is regulated by Comisioacuten Nacional de Bancos y Seguros (CNBS) Banco HSBC Salvadorentildeo SA is regulated by Superintendencia del Sistema Financiero (SSF) HSBC Colombia SA is regulated by Superintendencia Financiera de Colombia Banco HSBC Costa Rica SA is supervised by Superintendencia General de Entidades Financieras (SUGEF) Banistmo Nicaragua SA is authorized and regulated by Superintendencia de Bancos y de Otras Instituciones Financieras (SIBOIF) The document is intended to be distributed in its entirety Unless governing law permits otherwise you must contact a HSBC Group member in your home jurisdiction if you wish to use HSBC Group services in effecting a transaction in any investment mentioned in this document HSBC Bank plc is registered in England No 14259 is authorised and regulated by the Financial Services Authority and is a member of the London Stock Exchange (070905) copy Copyright HSBC Bank plc 2012 ALL RIGHTS RESERVED No part of this publication may be reproduced stored in a retrieval system or transmitted on any form or by any means electronic mechanical photocopying recording or otherwise without the prior written permission of HSBC Bank plc MICA (P) 208042011 and MICA (P) 040042011
[317638]
40
abc
Global
Stephen King Global Head of Economics +44 20 7991 6700 stephenkinghsbcibcom
Karen Ward Senior Global Economist +44 20 7991 3692 karenwardhsbcibcom
Madhur Jha +44 20 7991 6755 madhurjhahsbcibcom
Europe amp United Kingdom
Janet Henry Chief European Economist +44 20 7991 6711 janethenryhsbcibcom
Simon Wells Chief UK Economist +44 20 7991 6718 simonwellshsbcibcom
Astrid Schilo +44 20 7991 6708 astridschilohsbcibcom
Germany Lothar Hessler +49 21 1910 2906 lotharhesslerhsbcde
France Mathilde Lemoine +33 1 4070 3266 mathildelemoinehsbcfr
North America
Kevin Logan Chief US Economist +1 212 525 3195 kevinrloganushsbccom
Ryan Wang +1 212 525 3181 ryanwangushsbccom
Asia Pacific
Qu Hongbin Managing Director Co-head Asian Economics Research and Chief Economist Greater China +852 2822 2025 hongbinquhsbccomhk
Frederic Neumann Managing Director Co-head Asian Economics Research +852 2822 4556 fredericneumannhsbccomhk
Leif Eskesen Chief Economist India amp ASEAN +65 6239 0840 leifeskesenhsbccomsg
Paul Bloxham Chief Economist Australia and New Zealand +61 2925 52635 paulbloxhamhsbccomau
Donna Kwok +852 2996 6621 donnahjkwokhsbccomhk
Trinh Nguyen +852 2822 6975 trinhdnguyenhsbccomhk
Ronald Man +852 2996 6743 ronaldmanhsbccomhk
Luke Hartigan +612 9255 2635 lukehartiganhsbccomau
Sun Junwei +86 10 5999 8234 junweisunhsbccomcn
Sophia Ma +86 10 5999 8232 xiaopingmahsbccomcn
Global Emerging Markets
Pablo Goldberg Head of Global EM Research +1 212 525 8729 pabloagoldberghsbccom
Bertrand Delgado EM Strategist +1 212 525 0745 bertrandjdelgadoushsbccom
Emerging Europe Middle East and Africa
Murat Ulgen Chief Economist +44 20 7991 6782 muratulgenhsbccom
Agata Urbanska +44 20 7992 2774 agataurbanskahsbcibcom
Alexander Morozov +7 495 783 8855 alexandermorozovhsbccom
Simon Williams +971 4 507 7614 simonwilliamshsbccom
Melis Metiner +90 212 376 4618 melismetinerhsbccomtr
Latin America
Andre Loes Chief Economist Latin America +55 11 3371 8184 andrealoeshsbccombr
Argentina Javier Finkman Chief Economist South America ex-Brazil +54 11 4344 8144 javierfinkmanhsbccomar
Ramiro D Blazquez Senior Economist +54 11 4348 5759 ramiroblazquezhsbccomar
Jorge Morgenstern Senior Economist +54 11 4130 9229 jorgemorgensternhsbccomar
Brazil Constantin Jancso Senior Economist +55 11 3371 8183 constantincjancsohsbccombr
Marcos Fernandes +55 11 6847 9787 marcosrfernandeshsbccombr
Mexico Sergio Martin Chief Economist +52 55 5721 2164 sergiomartinmhsbccommx
Claudia Navarrete Economist +52 55 5721 2422 claudianavarretehsbccommx
Central America Lorena Dominguez Economist +52 55 5721 2172 lorenadominguezhsbccommx
Global Economics Research Team
Karen WardSenior Global EconomistHSBC Bank plc+44 20 7991 3692karenwardhsbcibcom
Karen joined HSBC in 2006 as UK economist In 2010 she was appointed Senior Global Economist with responsibility for monitoringchallenges facing the global economy and their implications for financial markets Before joining HSBC in 2006 Karen worked at theBank of England where she provided supporting analysis for the Monetary Policy Committee She has an MSc Economics fromUniversity College London
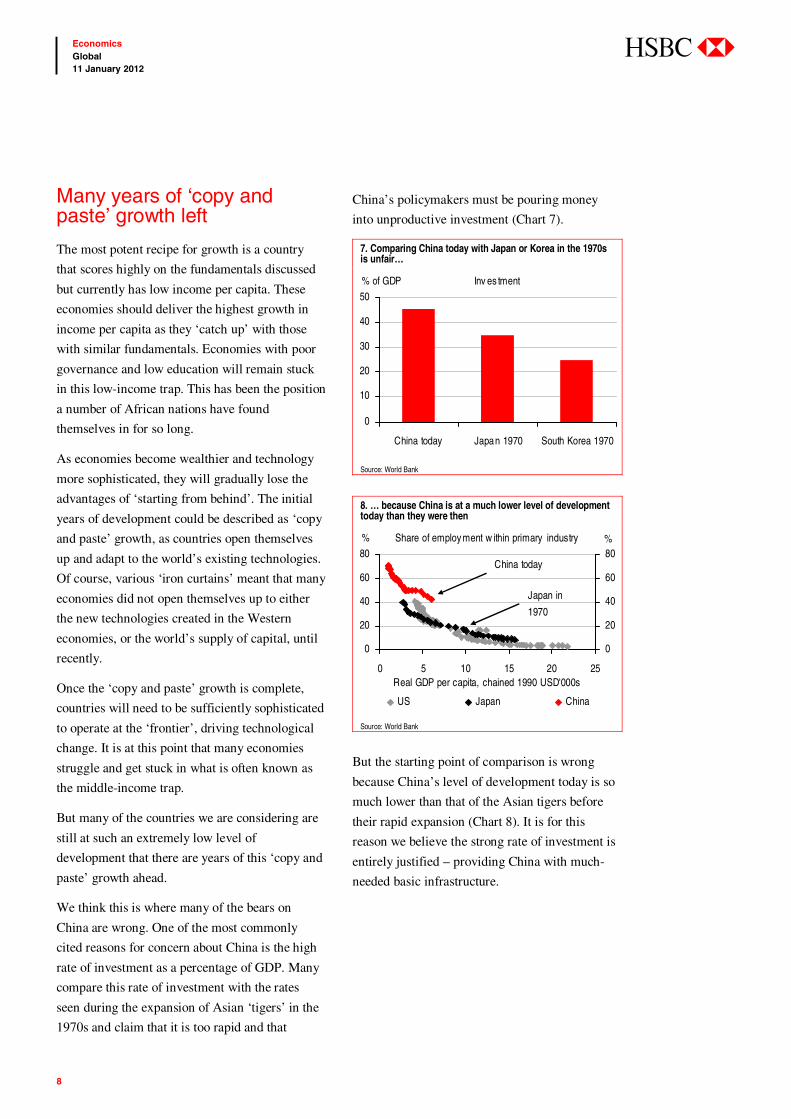

10
Economics Global 11 January 2012
abc
The fine print A few words on the technicalities and caveats of
the framework before we get into the results
As in the original report we are working in
constant price constant 2000 USD exchange
rate terms Further appreciation of emerging
market currencies against the USD will only
extend the conclusions of the report
The source of the data on economic infrastructure
is contained in Table 10 To get to our base case
projections we consider two scenarios The first
assumes the lsquoeconomic infrastructurersquo is fixed at
that evident today But to constrain these
economies on the assumption they will not make
any further improvements would be unfair For
example there is a clear trend that education
standards across the emerging world are improving
We then consider a second scenario in which we
assume that over the next 40 years all economies
reach the lsquooptimalrsquo economic infrastructure This is
the highest possible level of achievement from any
of the countries in our sample
The results of these two scenarios are shown in the
Appendix Our base-case scenario sits between
these two options Essentially each country gets
halfway to eliminating its imperfections
Economic snakes and ladders
Asia is the stand-out region ndash with a notable showing by the
Philippines
LATAM fares well with Peru emerging into the spotlight
Other strong performers include Egypt Nigeria Turkey and
Ukraine
10 Data description
Variable Description Source
Average years of male schooling The average number of years spent in education by males in 2010 (for this extension for many countries the distinction between male and female was not available and we have therefore taken average education across gender) In addition in a very limited number of countries the data was not available and therefore our regional specialists used their judgment to determine an appropriate proxy
wwwbarroleecom
Life expectancy The life expectancy of total population in 2008 natural log taken World Bank Fertility The number of births per woman in 2008 natural log taken World Bank Rule of law An index between 0 and 1 which measures the attractiveness of the investment climate based
on the level of law enforcement contract sanctity and property rights Data for 2009 Political Risk Services International Country Risk Guide
Government consumption Percentage of GDP accounted for by government consumption in 2008 World Bank Democracy index Indicator of political rights measures the right of all adults to vote and compete for public office
and to have a decisive vote on public policies Measured between 0 and 1 (full democracy) Freedom House Political Rights Index
Inflation rate CPI inflation ( year) average 2004-07 World Bank
11
Economics Global 11 January 2012
abc
We are clearly assuming governments continue to
improve the underlying economic infrastructure
implementing reform increasing education and so
forth and remain friendly with their neighbours
Of course this may turn out to be a rather
Panglossian view of government behaviour The
two scenarios in the Appendix provide some
guidance as to the sensitivity of the projections to
this underlying assumption that governments
continue to lsquodo the right thingrsquo
In addition our model will not capture all the
variables that dictate an economyrsquos potential
There may be idiosyncratic factors that mean a
country should feature more highly or indeed
lower down our economic league table
The variable that is most often debated is a
countryrsquos endowment of natural resources Surely
a country with a rich array of natural resources
should outperform those without This may well
be the case but not always We have often seen
countries rich in natural resources suffer from
lsquoDutch diseasersquo This is a situation in which the
capital inflows to exploit the domestic commodity
industry put upward pressure on the domestic
exchange rate which in turn damages other
industrial areas In addition the presence of natural
resources can also lead to an increase in corruption
and so the benefits of the natural wealth do little
for the population as a whole Therefore
empirically it is not absolutely clear that those rich
in natural resources should get a natural boost so
this is one variable we do not include and leave
readers to assess whether in their opinion a
country should feature higher in the table
There are numerous other variables that fall in this
list of needing further consideration such as
extreme religious fundamentalism and relations
with the rest of the world (eg Iran)
We should also highlight some potential caveats
to the demographic projections we are using
These estimates made by the UN take into
account current fertility rates and policy on
retirement and migration
But these working-age projections are subject to a
considerable degree of uncertainty The most
tricky is disease which could raise the mortality
rate or by contrast medical breakthroughs which
could lower it Immigration flows could also send
these projections wildly off course decreasing
prospects for one part of the world while boosting
prospects elsewhere The changes we are
highlighting in this document could give rise to a
great migration which has all sorts of
implications for border frictions The history of
the US is a case in point In the 1950s and early
60s there were demographic concerns about the
US But the 1965 Immigration and Naturalisation
Act saw a huge new wave of migrants which
coupled with a higher fertility rate among
migrants gave rise to a fresh demographic boost
Government policy could also throw these
projections wildly off course if incentives via the
tax system manage successfully to lift or reduce
the fertility rate
Therefore we emphasise this exercise is a starting
point for considering the long-term outlook and
should not be taken as our explicit forecast Our
regional economists will be able to provide more
accurate near-term forecasts taking into account
factors the model is unable to capture and cyclical
considerations
12
Economics Global 11 January 2012
abc
Developed world Countries in the developed world might be
considered to be at the technology lsquofrontierrsquo With
income per capita already high these economies do
not get any lsquocatch uprsquo boost so rely on the other
variables in the model (education rule of law etc)
for technological progress to deliver further gains
in individual prosperity
That said there are still large variations across the
developed world with real income per capita in
Portugal at just over USD115k compared with
USD37k in the US Those with similar economic
infrastructure to the US but with lower income per
capita will therefore get a lsquocatch uprsquo boost This
explains why the model provides higher income
per capita forecasts for the likes of Spain and
Greece (Table 12) which may seem implausible
given their current difficulties
12 Model projections for income per capita
2010-20 2020-30 2030-40 2040-50
Developed world Australia 18 20 21 22 Austria 27 26 25 24 Belgium 12 15 19 21 Canada 19 21 22 23 Denmark 06 11 15 18 Finland 16 18 19 21 France 12 15 18 21 Germany 21 22 23 24 Greece 31 30 29 29 Ireland 19 20 20 21 Italy 16 24 25 27 Japan 13 16 19 20 Luxembourg 16 16 16 17 Netherlands 13 16 19 21 New Zealand 29 27 26 26 Norway 05 11 15 17 Portugal 32 32 32 32 Spain 24 31 30 29 Sweden 05 11 16 19 Switzerland 26 24 22 21 United Kingdom 14 16 18 20 United States 06 11 15 18 Developed world avg 17 20 21 22
Source HSBC estimates
11 The lsquoeconomic infrastructurersquo today
GDP per capita
Average years male schooling
Life expectancy
Fertility (average
children per person)
Rule of law Government consumption
Democracy index
Inflation rate
Developed world Real USD Years Years Children Index Ratio to GDP Index Annual rate Australia 26244 121 81 19 09 017 10 28 Austria 26445 95 80 14 10 018 10 20 Belgium 24758 105 80 18 08 023 10 21 Canada 26355 113 80 16 09 019 10 16 Denmark 31418 101 78 18 10 026 10 21 Finland 27151 100 79 18 10 022 10 22 France 23881 105 81 19 08 023 10 15 Germany 25083 118 80 13 08 018 10 17 Greece 14382 106 79 15 08 017 10 28 Ireland 27965 116 78 21 10 016 10 15 Italy 18703 95 81 14 07 020 10 20 Japan 39435 115 82 13 08 018 10 00 Luxembourg 52388 101 81 16 10 015 10 20 Netherlands 26376 110 80 17 10 025 10 18 New Zealand 14939 127 80 22 09 019 10 28 Norway 40933 122 80 19 10 020 10 22 Portugal 11588 80 79 14 08 020 10 15 Spain 15699 103 81 14 08 019 10 22 Sweden 31778 115 81 19 10 026 10 18 Switzerland 38739 99 82 14 08 011 10 09 United Kingdom 27646 96 79 19 09 021 10 26 United States 36364 122 78 21 08 016 10 21 Developed world average 27200 108 81 17 09 019 10 19
Source wwwbarroleecom World Bank Political Risk Services International Country Risk Guide Freedom House Political Rights Index
13
Economics Global 11 January 2012
abc
The major headwind to growth in much of the
developed world stems from demographics This
is less of a problem for Australasia North
America the UK and Ireland which are all likely
to see population growth in the coming decades
By contrast the demographics in much of Europe
are challenging putting their debt problems into
an even more worrying light With debt levels
rising and the number of taxpayers falling it
becomes even harder to get the arithmetic to add
up Ironically Germany is one of the few
countries in the Eurozone not experiencing
funding difficulties but is in the worst structural
situation so far as demographics are concerned
Trying to get the debt arithmetic to add up for
Europe is a straightforward task compared with
Japan Japanrsquos gross debt to GDP now stands at
more than 200 and the number of people paying
taxes in the coming four decades will fall by 40
Adding the outlook for income per capita to the
number of lsquocapitasrsquo we see that with one
exception the developed world is not able to offer
more than 3 growth The lowest forecasts are
for Japan which fails to achieve more than 1
growth throughout the forecast horizon By
contrast the highest performer is New Zealand
14 Model projections for total GDP
2010-20 2020-30 2030-40 2040-50
Developed world Australia 24 23 25 26 Austria 27 19 19 21 Belgium 10 12 17 21 Canada 23 21 26 25 Denmark 05 08 11 20 Finland 11 14 19 19 France 11 14 16 21 Germany 17 11 14 17 Greece 29 26 22 21 Ireland 28 28 22 19 Italy 14 19 15 21 Japan 04 09 05 08 Luxembourg 28 22 23 25 Netherlands 11 12 15 22 New Zealand 34 30 29 29 Norway 09 13 15 21 Portugal 30 26 23 22 Spain 28 29 23 22 Sweden 04 13 17 21 Switzerland 26 20 20 23 United Kingdom 16 17 19 22 United States 11 14 19 21 Developed world avg 18 18 19 21
Source HSBC estimates
13 Demographic change between now and 2050
-50 0 50 100 150 200 250
JapanGermany
PortugalItaly
HungaryGreeceAustriaSpain
FinlandNetherlands
DenmarkBelgiumFrance
Sw itzerlandSw eden
UKNorw ayCanada
New ZealandUS
AustraliaIreland
Lux embourg
change in w orking population betw een now and 2050
Source UN population projections
14
Economics Global 11 January 2012
abc
Asia Many parts of Asia have extremely high standards of
education and rule of law Singapore and South
Korea of course being clear examples which would
explain why these economies have already seen such
rapid increases in income per capita Other countries
in the region have made enormous progress in
improving their economic infrastructure but are still
reasonably poor and therefore have great potential to
catch up Chinarsquos income per capita is currently just
7 that of the US Adding up the annual projections
shown in Table 16 we project Chinarsquos income per
capita to grow by more than 800 between now and
2050 This might seem an astonishing number But
keep in mind this base effect Despite this rapid
growth in 2050 Chinarsquos income per capita is still
just 32 that of the US We are only capturing part
of Chinarsquos development story here and the likelihood
is that these numbers turn out to be too conservative
rather than too optimistic The same is true of the
Philippines which looks set for a multi-decade run
of strong growth
16 Model projections for income per capita
2010-20 2020-30 2030-40 2040-50
Asia Azerbaijan 61 54 48 44 Bangladesh 36 44 50 55 China 65 57 51 46 India 40 45 48 51 Indonesia 30 37 42 47 Kazakhstan 59 52 47 43 South Korea 37 34 31 30 Malaysia 54 46 41 36 Pakistan 15 25 35 44 Philippines 61 56 52 48 Singapore 36 32 27 23 Sri Lanka 52 52 50 49 Thailand 37 40 41 42 Turkmenistan 61 55 49 45 Uzbekistan 67 60 55 51 Vietnam 47 49 52 55 Asia average 48 46 45 44
Source HSBC estimates
But being lsquopoorrsquo is not enough to guarantee growth
in income per capita The projections for Pakistan
demonstrate this Because of low scores for
schooling life expectancy rule of law and
democracy Pakistan has little potential for income
per capita to grow near term despite a low starting
point But given we assume governments will make
progress on some of these flaws so growth will start
to pick up in countries such as Pakistan and
Bangladesh
15 The lsquoeconomic infrastructurersquo today
GDP per capita
Average years male schooling
Life expectancy
Fertility (average
children per person)
Rule of law Government consumption
Democracy index
Inflation rate
Asia Real USD Years Years Children Index Ratio to GDP Index Annual rate Azerbaijan 2303 104 70 23 06 010 02 129 Bangladesh 482 58 66 23 04 006 03 78 China 2579 98 73 18 08 014 00 33 India 790 67 63 27 07 010 08 85 Indonesia 1178 62 70 22 05 008 08 76 Kazakhstan 2376 104 66 25 07 011 02 117 South Korea 16463 118 79 12 08 015 08 33 Malaysia 5224 101 74 26 07 012 05 27 Pakistan 657 56 67 40 05 009 02 138 Philippines 1215 90 72 31 04 010 05 51 Singapore 34110 91 80 13 08 010 03 31 Sri Lanka 1233 84 74 23 05 015 05 139 Thailand 2744 75 68 18 04 012 02 23 Turkmenistan 1827 104 65 25 07 009 00 78 Uzbekistan 893 104 68 26 07 017 00 78 Vietnam 674 64 74 21 07 006 00 128 Asia average 4220 84 71 23 06 011 03 78
Source wwwbarroleecom World Bank Political Risk Services International Country Risk Guide Freedom House Political Rights Index
15
Economics Global 11 January 2012
abc
From a demographic standpoint Asia is also a
reasonably mixed bag ndash this is where the shine
slightly comes off the China story since its one-
child policy of yester years will start to see the
working population decline from around 2020
Singapore and South Korea while not enforced
have also seen a staggering decline in fertility
rates in the past couple of decades which will see
their working populations also decline Singapore
has been exploring the possibility of reversing this
trend through an aggressive immigration policy
By contrast other parts of Asia ndash India Pakistan
the Philippines Bangladesh and Malaysia ndash all
have rapidly growing populations In 2050 the
population of Pakistan at roughly 290m will be
just shy of four times the population of the UK
Adding the forecasts for working population to
those of income per capita we get to projections
for total GDP growth in Table 18 There are some
truly remarkable hot spots in Asia China
continues to grow at a rapid pace although the
pace is expected to slow beyond 2020 as the
demographic drag starts to hinder overall GDP
growth Nevertheless we still expect average
GDP growth of more than 5 per annum for the
next 40 years The star performer however is the
Philippines where the combination of strong
fundamentals and powerful demographics gives
rise to an average growth rate of 7 for the
coming 40 years Central Asia is also interesting
Kazakhstan Turkmenistan and Uzbekistan all
perform extremely well in the context of this
model on the back of strong growth in a very
well-educated population The absence of
democracy however prevents these economies
reaching their full potential
18 Model projections for total GDP
2010-20 2020-30 2030-40 2040-50
Asia Azerbaijan 70 57 50 41 Bangladesh 55 55 56 55 China 67 55 44 41 India 57 56 55 52 Indonesia 43 43 43 45 Kazakhstan 61 58 49 40 South Korea 37 23 18 17 Malaysia 71 57 47 38 Pakistan 40 45 49 50 Philippines 84 73 66 58 Singapore 37 21 20 21 Sri Lanka 54 53 49 43 Thailand 40 38 38 40 Turkmenistan 77 64 56 45 Uzbekistan 82 69 61 50 Vietnam 57 53 51 48 Asia average 58 51 47 43
Source HSBC estimates
17 Demographic change between now and 2050
-50 0 50 100 150 200 250
S KoreaSingapore
ChinaThailand
Sri LankaVietnam
KazakhstanAzerbaijanIndonesia
UzbekistanTurkmenistan
BangladeshIndia
Malay siaPhilippines
Pakistan
change in w orking population betw een now and 2050
Source UN population projections
16
Economics Global 11 January 2012
abc
Central and South America The potential of economies in Latin America has
been unleashed in recent decades as they have
managed to tame the inflation that plagued their
economies for much of the 1970s and 1980s
(Table 19) It is remarkable to think that between
1986 and 1994 Brazil suffered several years of
inflation of over 500 Such has been the
turnaround in its economic management that it is
now imposing taxes on foreign investors to
prevent capital inflows Of course we are
assuming that inflation is prevented from ever
creeping back into the system Maintaining small
governments and low levels of debt will surely
help prevent these economies from returning to
their old ways
The level of schooling is high although many of
these economies score less highly on the metric of
rule of law than parts of Asia Greater efforts have
been made recently particularly in Brazil
20 Model projections for income per capita
2010-20 2020-30 2030-40 2040-50
Central and South America Argentina 24 26 27 28 Bolivia 56 52 49 46 Brazil 22 27 31 35 Chile 52 45 40 37 Colombia 30 33 36 38 Costa Rica 37 37 36 36 Cuba 23 30 34 37 Dominican Republic 36 37 37 37 Ecuador 49 48 47 45 El Salvador 39 40 41 41 Guatemala 08 16 24 33 Honduras 28 33 38 42 Mexico 21 39 37 36 Panama 35 34 34 33 Paraguay 48 48 46 45 Peru 54 49 45 41 Uruguay 25 27 28 30 Venezuela 14 20 25 30 Central and South American average
33 36 36 37
Source HSBC estimates
For these reasons the forecasts for income per
capita are not quite as high in many parts of Latin
America as in Asia Of course as discussed
earlier we are not accounting for the regionrsquos rich
endowment of natural resources
19 The lsquoeconomic infrastructurersquo today
GDP per capita
Average years male schooling
Life expectancy
Fertility (average
children per person)
Rule of law Government consumption
Democracy index
Inflation rate
Central and South America Real USD Years Years Children Index Ratio to GDP Index Annual rate Argentina 10517 93 73 22 04 013 08 79 Bolivia 1192 99 66 35 04 014 07 87 Brazil 4711 76 72 19 03 020 08 47 Chile 6083 102 79 19 08 011 10 81 Colombia 3052 77 72 24 03 016 07 56 Costa Rica 5043 87 79 20 06 013 10 102 Cuba 4370 106 79 15 05 032 00 81 Dominican Republic 3697 74 73 26 04 007 08 60 Ecuador 1771 81 75 26 04 011 07 53 El Salvador 2566 80 71 23 03 009 08 41 Guatemala 1858 48 70 41 03 009 07 70 Honduras 1380 75 72 33 03 017 07 81 Mexico 6217 91 75 21 03 011 08 48 Panama 5732 96 76 25 05 011 10 51 Paraguay 1432 85 72 30 03 011 07 70 Peru 2913 90 73 26 06 009 08 35 Uruguay 8942 86 76 20 04 011 10 77 Venezuela 5438 70 73 25 02 012 05 262 Central and South American average
4228 86 74 25 04 014 07 81
Source wwwbarroleecom World Bank Political Risk Services International Country Risk Guide Freedom House Political Rights Index
17
Economics Global 11 January 2012
abc
The demographic outlook for much of Central
South America is very strong particularly in the
smaller countries in the region Of the larger
economies Colombia and Peru stand out for
extremely high working population growth Indeed
at present the populations of Spain and Colombia
are very similar but by 2050 the working
population in Colombia could be 25 larger
Adding the forecasts for income per capita to
those of working population we obtain forecasts
for total GDP (Table 22) The star performer in
the region is Peru where the combination of
strong fundamentals and strong population growth
deliver average growth of 55 for the next 40
years Chile also does very well although
demographics are not quite as favourable as those
in Peru Bolivia Ecuador and Paraguay are also
strong performers although this is partly a
reflection of their low starting point They still lag
much of the region in the economic foundations
used in the model
22 Model projections for total GDP
2010-20 2020-30 2030-40 2040-50
Central and South America Argentina 34 33 31 27 Bolivia 79 69 59 52 Brazil 33 29 29 28 Chile 59 46 40 34 Colombia 45 42 41 40 Costa Rica 51 43 41 36 Cuba 20 22 20 29 Dominican Republic 51 46 42 39 Ecuador 65 57 52 46 El Salvador 51 50 48 45 Guatemala 43 45 46 46 Honduras 56 54 53 50 Mexico 33 44 35 31 Panama 53 46 40 37 Paraguay 70 64 60 52 Peru 69 60 50 42 Uruguay 30 29 29 28 Venezuela 31 32 33 33 Central and South American average
49 45 41 39
Source HSBC estimates
21 Demographic change between now and 2050
-50 0 50 100 150 200 250
CubaBrazilChile
UruguayMex ico
ArgentinaCosta Rica
ColombiaEcuador
DominicanPeru
ElSalv adorPanama
VenezuelaBoliv ia
ParaguayHonduras
Guatemala
change in w orking population betw een now and 2050
Source UN population projections
18
Economics Global 11 January 2012
abc
Central and Eastern Europe Central and Eastern European economies score less
highly than many of the other emerging markets for
inflation control and size of government
But when projecting real income per capita this is
more than compensated for by the exceptional
level of education which for most economies in
the region rivals that of the developed world And
yet while education rates are similar the average
income per capita in the Central and Eastern
Europe block is just one fifth that of the
developed world
For this reason in the context of this model these
economies have great scope to catch up in income
per capita and across the region the forecasts for
income per capita growth are extremely high
(Table 24)
24 Model projections for income per capita
2010-20 2020-30 2030-40 2040-50
Central and Eastern Europe Belarus 59 53 48 45 Bosnia amp Herzegovina 71 63 56 51 Bulgaria 48 47 45 45 Croatia 44 42 39 38 Cyprus 30 29 28 28 Czech Republic 53 45 40 36 Hungary 53 51 44 40 Latvia 56 49 44 40 Lithuania 43 41 39 38 Poland 40 39 38 37 Romania 67 62 54 48 Russia 51 48 46 44 Serbia 68 62 57 53 Slovak Republic 42 39 37 35 Slovenia 30 30 30 30 Turkey 40 39 38 37 Ukraine 89 73 63 56 CEE average 52 48 44 41
Source HSBC estimates
23 The lsquoeconomic infrastructurersquo today
GDP per capita
Average years male schooling
Life expectancy
Fertility (average
children per person)
Rule of law Government consumption
Democracy index
Inflation rate
Central and Eastern Europe Real USD Years Years Children Index Ratio to GDP Index Annual rate Belarus 2556 113 71 14 07 019 00 121 Bosnia and Herzegovina 2162 100 75 12 08 022 05 29 Bulgaria 2542 99 73 15 04 017 10 78 Croatia 6396 90 76 15 08 019 08 38 Cyprus 15510 101 80 15 08 019 10 25 Czech Republic 7225 121 77 15 08 020 10 34 Hungary 5833 117 74 14 07 010 10 61 Latvia 4973 108 72 15 08 017 08 97 Lithuania 5154 109 72 15 07 019 10 70 Poland 6563 99 76 14 08 019 10 35 Romania 2596 104 75 14 07 013 08 61 Russia 2934 97 67 15 07 017 02 116 Serbia 1229 100 74 13 06 020 10 90 Slovak Republic 8042 112 75 13 07 017 10 30 Slovenia 12577 89 79 15 08 017 10 34 Turkey 5088 70 71 21 08 013 05 85 Ukraine 987 111 68 14 07 018 07 180 CEE average 7000 104 74 15 07 018 08 70
Source wwwbarroleecom World Bank Political Risk Services International Country Risk Guide Freedom House Political Rights Index
19
Economics Global 11 January 2012
abc
It is just as well individuals will prove so productive
across the region because demographics are a major
headwind (Chart 25) In vast swathes of the region
the workforce looks set to shrink dramatically This
is largely because of the extremely low level of
fertility As discussed previously these forecasts for
population growth are subject to considerable
uncertainty Indeed in Russia last year an initiative
was launched to try and increase the fertility rate
with the incentive of land provided to couples
producing a third child
As things stand these weak demographics take the
shine slightly off the extremely strong growth in
income per capita Nevertheless the forecasts for
total GDP are still very impressive (Table 26) The
Ukraine is the outperformer with average growth
across the forecast horizon of 6 Again we have to
remember this is coming from an extremely low
base But nevertheless we expect the size of the
Ukrainian economy in constant price constant
exchange rates to increase tenfold by 2050
Some of the smaller Eastern European countries ndash
Romania the Czech Republic and Serbia ndash all do
extremely well particularly in the coming decade
before demographics prove to be more of a drag
And as in the original report we continue to
believe Turkey has an extremely strong long-term
story The combination of strong fundamentals
and the one country in the region with good
demographics should see Turkey maintain a very
respectable pace of growth throughout the
forecast horizon
26 Model projections for total GDP
2010-20 2020-30 2030-40 2040-50
Central and Eastern Europe Belarus 52 43 39 30 Bosnia amp Herzegovina 67 52 44 35 Bulgaria 36 37 33 28 Croatia 38 34 33 28 Cyprus 37 32 33 29 Czech Republic 46 44 36 27 Hungary 47 47 39 32 Latvia 48 42 38 29 Lithuania 34 30 31 29 Poland 33 32 31 21 Romania 61 57 43 35 Russia 42 40 40 33 Serbia 65 59 51 44 Slovak Republic 37 33 30 22 Slovenia 25 24 24 21 Turkey 53 47 40 35 Ukraine 79 63 55 42 CEE average 47 42 38 31
Source HSBC estimates
25 Demographic change between now and 2050
-50 0 50 100 150 200 250
BulgariaBosnia and Herzegovina
BelarusUkrainePoland
RomaniaLithuania
RussiaLatvia
SlovakiaCroatia
SloveniaSerbia
Czech RepublicCyprusTurkey
change in working population between now and 2050
Source UN population projections
20
Economics Global 11 January 2012
abc
Middle East and North Africa Our framework is able to provide some explanation
for the problems currently rocking many parts of
MENA High population growth poor education and
job prospects coupled with a lack of democracy are a
concoction that may explain the social unrest seen
during 2011 In the context of our model these
economies deliver average rates of growth in income
per capita
Being highly endowed with oil has managed to
ensure that income per capita in many of these
nations is already very high This model will
therefore penalise certain countries since it cannot
explain the current level of income per capita with
the variables it considers So we need to take
forecasts for economies such as Qatar with some
pinch of salt These economies may continue to
grow at a rapid pace despite any weakness in the
fundamentals for which our model is accounting
But clearly this source of wealth and the ability to
spread it fairly across the population is a major
source of contention now and will continue to be in
the future
28 Model projections for income per capita
2010-20 2020-30 2030-40 2040-50
Middle East and North Africa Algeria 42 43 43 43 Bahrain 34 30 28 25 Egypt 28 40 42 43 Iran 35 35 35 35 Iraq -06 09 23 37 Israel -03 13 17 21 Jordan 37 37 38 38 Kuwait 33 30 27 24 Lebanon 46 42 39 36 Libya 33 27 28 29 Morocco 31 31 37 42 Oman 24 25 25 25 Qatar 07 10 12 14 Saudi Arabia 20 22 24 26 Syria 22 29 35 41 Tunisia 40 41 42 42 United Arab Emirates 25 23 23 22 Yemen -24 -08 10 30 MENA average 20 24 27 30
Source HSBC estimates
27 The lsquoeconomic infrastructurersquo today
GDP per capita
Average years male schooling
Life expectancy
Fertility (average
children per person)
Rule of law Government consumption
Democracy index
Inflation rate
Middle East and North Africa Real USD Years Years Children Index Ratio to GDP Index Annual rate Algeria 2190 77 72 24 05 011 02 46 Bahrain 16968 96 76 23 08 014 03 32 Egypt 3002 88 70 29 06 011 02 131 Iran 2138 81 71 18 07 013 02 188 Iraq 743 58 68 41 03 023 02 80 Israel 21806 113 81 29 07 025 10 28 Jordan 2497 92 73 35 07 023 03 65 Kuwait 23072 63 78 22 08 014 05 67 Lebanon 6342 92 72 18 07 015 03 12 Libya 7692 79 74 27 07 011 00 64 Morocco 1781 50 71 24 08 018 03 22 Oman 10779 92 76 30 08 019 02 73 Qatar 38466 75 76 24 08 022 02 80 Saudi Arabia 9833 103 73 31 08 022 00 64 Syria 1350 53 74 32 08 011 00 75 Tunisia 2805 73 74 21 08 014 00 40 United Arab Emirates 25607 95 78 19 07 011 02 64 Yemen 565 37 63 52 03 016 03 102 MENA average 11158 77 73 29 07 017 03 79
Source wwwbarroleecom World Bank Political Risk Services International Country Risk Guide Freedom House Political Rights Index
21
Economics Global 11 January 2012
abc
The Middle East is one region where significant
immigration flows make forecasting the size of the
workforce difficult We have seen in the past decade
borders open and close according to ebbs and flows
in demand Nevertheless indigenous population
growth is strong across much of the region But
again we highlight that population growth is only a
good thing for an economy if all the other
foundations are strong This will ensure that these
new workers find jobs If the other fundamentals are
not there then young unemployed individuals
become frustrated which can be a recipe for social
unrest rather than progress
Overall there are lots of caveats to bear in mind
with regards to how this model might not
accurately capture the outlook for parts of the
Middle East In particular we think this
framework is underestimating the potential of
Israel and Qatar
Nevertheless the model does conform to our high
expectations for long-term growth in Egypt and
Saudi Arabia despite some of the near-term
challenges Similarly the outlook looks extremely
robust for Bahrain Jordan and the United Arab
Emirates
30 Model projections for total GDP
2010-20 2020-30 2030-40 2040-50
MENA Algeria 56 54 49 41 Bahrain 57 42 30 27 Egypt 47 56 52 48 Iran 45 44 38 28 Iraq 34 37 42 52 Israel 11 25 25 27 Jordan 59 58 48 42 Kuwait 54 44 31 26 Lebanon 57 45 40 33 Libya 53 43 34 27 Morocco 42 39 40 39 Oman 48 41 37 30 Qatar 21 21 18 13 Saudi Arabia 45 39 35 32 Syria 43 53 48 46 Tunisia 49 46 43 36 United Arab Emirates 47 35 22 09 Yemen 14 25 37 48 MENA average 42 40 36 33
Source HSBC estimates
29 Demographic change between now and 2050
-50 0 50 100 150 200 250
TunisiaLebanon
IranUAE
MoroccoAlgeria
QatarBahrain
Liby aIsrael
Kuw aitEgy ptOman
JordanSaudi Arabia
Sy riaIraq
Yemen
c hange in w orking population betw een now and 2050
Source UN population projections
22
Economics Global 11 January 2012
abc
Sub-Saharan Africa Africa has sadly been the lost continent for many
decades and many parts of the region are still riddled
with corruption civil war and disease Indeed
comparing the averages today for Africa to those of
Asia is disheartening Life expectancy of just 58
versus 71 in Asia and schooling of just 64 years
compared with 84 in Asia are important drawbacks
In addition inflation and a total lack of democracy is
a major problem for some countries
Average real income per capita in Africa is just 7
that of the US with people in many countries living
on less than a dollar a day But again being lsquopoorrsquo
or at a low level of development is not enough to
guarantee growth and for certain countries in the
region our model does not predict that income per
capita will rise significantly in the decade ahead
Countries such as Angola and Uganda appear stuck
in the poverty trap But by assuming governments
will improve these economic flaws we show the
potential for change only time will tell whether
governments are able to deliver on this
32 Model projections for income per capita
2010-20 2020-30 2030-40 2040-50
Africa Angola -03 10 21 32 Cameroon 06 18 29 40 Ethiopia 20 32 43 53 Ghana 31 39 46 52 Kenya 15 26 36 45 Nigeria 09 21 32 42 South Africa 11 19 26 33 Tanzania 36 42 46 50 Uganda -01 13 27 41 Africa average 21 28 35 42
Source HSBC estimates
Nevertheless there are bright spots where already
improvements have been made and the countries
may be turning a corner The model predicts
strongest growth in income per capita for
Tanzania and Ghana although again we are
coming from such an extraordinarily low base
31 The lsquoeconomic infrastructurersquo today
GDP per capita
Average years male schooling
Life expectancy
Fertility (average
children per person)
Rule of law Government consumption
Democracy index
Inflation rate
Africa Angola 1313 73 47 58 05 018 02 128 Cameroon 694 61 51 46 03 010 02 31 Ethiopia 201 61 55 53 08 010 03 234 Ghana 343 78 57 40 04 012 10 155 Kenya 452 73 54 49 03 018 05 151 Nigeria 506 73 48 57 03 018 05 95 South Africa 3710 86 51 25 04 019 08 86 Tanzania 382 73 56 56 08 016 05 98 Uganda 366 54 53 63 06 013 03 104 Africa average 1643 64 58 42 05 014 04 92
Source wwwbarroleecom World Bank Political Risk Services International Country Risk Guide Freedom House Political Rights Index
23
Economics Global 11 January 2012
abc
But the demographic story is extremely strong in
Africa (Chart 33) Indeed half the increase in the
worldrsquos population over the next 40 years will be
in Africa
For those countries that have at least reasonable
prospects for individual prosperity this should
give rise to strong growth in total GDP (Table
34) Again we are coming from a low base
Nigeria deserves a special mention The rapid
population growth in Nigeria means that by 2050
its population will be almost as large as that of the
United States The potential of this country is huge
if the government does manage to deliver the
change that belies these projections
Tanzania is also worth highlighting Again rapid
growth in the population will see it reach almost
140m in 2050 ndash almost twice that of the projection
in either the UK or Germany Given that the
fundamentals are already looking in reasonably
good shape we could see an explosion in growth in
this economy Again we are coming from a low
base ndash income per capita at the moment in
Tanzania in real terms is just USD382 We project
this will rise to only USD2085 by 2050 but given
the growth in the population this would still equate
to a 1700 increase in the size of the economy
Ethiopia so often making the headlines for
poverty and famine appears to be making
progress Indeed last year Ethiopia was one of
the fastest growing economies in the world
delivering more than 10 GDP growth We
forecast strong growth to continue although again
even in 2050 we see income per capita at just 2
that of the US
34 Model projections for total GDP
2010-20 2020-30 2030-40 2040-50
Africa Angola 33 40 48 53 Cameroon 33 44 49 54 Ethiopia 55 63 67 70 Ghana 59 65 66 68 Kenya 46 58 60 63 Nigeria 38 48 52 56 South Africa 16 24 31 35 Tanzania 70 78 76 74 Uganda 43 56 63 68 Africa average 46 51 52 53
Source HSBC estimates
33 Demographic change between now and 2050
-50 0 50 100 150 200 250
SouthAfrica
Cameroon
Nigeria
Ghana
Keny a
Ethiopia
Angola
Tanzania
Uganda
c hange in w orking population betw een now and 2050
Source UN population projections
24
Economics Global 11 January 2012
abc
Putting it all together Considering all these economies we can separate
them into the following three groups (Table 35)
Fast growth ndash gt5 average growth to 2050
The fast-growth economies are those that are at a
low level of development but which have
sufficiently strong underlying fundamentals so that
they catch up with more developed economies with
similarly strong fundamentals
We have already discussed China and India which
sit firmly at the top of this group Elsewhere in Asia
the Philippines Malaysia Bangladesh and Vietnam
all look very strong
In Latin America Peru is the star performer in the
region given it starts from a lower level of
development than some of its counterparts in the
region coupled with strong demographics Many of
the smaller CEEMEA economies also sit here
particularly those with fantastic rates of education
and a good rule of law despite poor demographics
In the Middle East despite near-term uncertainty we
think Egypt has good long-term prospects
Growth ndash 3 lt growth lt5
The lsquogrowthrsquo group are also set to outperform many
of the developed world economies In Asia we
highlight Indonesia and Thailand within this group
and Pakistan owing to the sheer size of working
population Latin America dominates this group of
lsquogrowthrsquo countries Brazil Colombia and Mexico
look very strong and remain firmly in our group of
Top 30 economies in 2050
Stable ndash growth lt3
The stable group of countries offer more limited
growth prospects These largely include the high-
growth ageing economies in the developed world
of which Europe fares particularly badly As
discussed growth in Israel Qatar and UAE may be
underestimated in this model
Conclusions and risks
lsquoRapid growthrsquo is expected by those with a low starting point but
strong fundamentals ndash the Philippines Egypt Peru and Ukraine
lsquoGrowthrsquo economies have strong prospects but a higher starting
point Mexico Turkey Saudi Arabia and Nigeria stand out
A lsquostablersquo group largely the developed world has more limited
potential for growth
25
Economics Global 11 January 2012
abc
35 Which countries will deliver the fastest growth en route to 2050 List ordered based on size of economy in 2050
ChinaIndia
PhilippinesEgypt
MalaysiaPeru
BangladeshAlgeriaUkraineVietnam
UzbekistanTanzania
KazakhstanEcuadorEthiopia
Sri LankaAzerbaijan
KenyaBoliviaJordanUgandaGhana
ParaguayTurkmenistan
HondurasSerbia
Fast growth
BrazilMexicoTurkeyRussia
IndonesiaArgentina
Saudi ArabiaThailand
IranColombiaPakistan
ChileVenezuela
NigeriaRomania
Czech RepublicHungaryKuwait
MoroccoLibya
New ZealandDominican Republic
SyriaTunisia
GuatemalaLebanon
Slovak RepublicOmanAngola
Costa RicaBelarus
IraqPanamaCroatia
El SalvadorCameroonBulgariaBahrain
LithuaniaBosnia and Herzegovina
LatviaYemenCyprus
Growth
United StatesJapan
GermanyUnited Kingdom
FranceCanada
ItalySouth Korea
SpainAustralia
NetherlandsPoland
SwitzerlandSouth Africa
AustriaSwedenBelgium
SingaporeGreeceIsraelIreland
United Arab EmiratesNorwayPortugalFinland
DenmarkCubaQatar
UruguayLuxembourg
Slovenia
Stable
ChinaIndia
PhilippinesEgypt
MalaysiaPeru
BangladeshAlgeriaUkraineVietnam
UzbekistanTanzania
KazakhstanEcuadorEthiopia
Sri LankaAzerbaijan
KenyaBoliviaJordanUgandaGhana
ParaguayTurkmenistan
HondurasSerbia
Fast growth
BrazilMexicoTurkeyRussia
IndonesiaArgentina
Saudi ArabiaThailand
IranColombiaPakistan
ChileVenezuela
NigeriaRomania
Czech RepublicHungaryKuwait
MoroccoLibya
New ZealandDominican Republic
SyriaTunisia
GuatemalaLebanon
Slovak RepublicOmanAngola
Costa RicaBelarus
IraqPanamaCroatia
El SalvadorCameroonBulgariaBahrain
LithuaniaBosnia and Herzegovina
LatviaYemenCyprus
Growth
United StatesJapan
GermanyUnited Kingdom
FranceCanada
ItalySouth Korea
SpainAustralia
NetherlandsPoland
SwitzerlandSouth Africa
AustriaSwedenBelgium
SingaporeGreeceIsraelIreland
United Arab EmiratesNorwayPortugalFinland
DenmarkCubaQatar
UruguayLuxembourg
Slovenia
Stable
Source HSBC estimates
26
Economics Global 11 January 2012
abc
Rose-tinted spectacles We openly admit that behind these projections we
assume governments build on their recent progress
and remain solely focused on increasing the living
standards for their populations Of course this may
be an overly glossy way of viewing the world and
we conclude there are a number of reasons our
lsquoWorld in 2050rsquo could turn out a little different
We consider the main culprits below
Resource constraints
Our calculations have focused on the human
potential of the world economy paying no
attention to the physical constraints of the world
we live in those that are becoming more evident
by the day leading to upward pressure on many
commodity prices
In a follow-up report entitled Energy in 2050 (22
March 2011) we mapped our GDP forecasts into
energy forecasts This exercise certainly gave rise
to some fairly worrying numbers Chart 36 shows
the results for the top 3 economies we consider If
we were in a world of unlimited resources
consumption would explode as the emerging
consumers start to develop a taste for cars and
other energy-hungry domestic appliances Clearly
for our lsquoWorld in 2050rsquo to materialise we need to
change the way we use energy What is
comforting however is that even constraining
ourselves to the technology that we know exists
today it is possible to find a solution that
combines energy efficiency and a move towards
more renewable sources of energy But this does
require major government and industrial foresight
Creating the incentives for all players to change is
the biggest hurdle Rising energy prices are the
most obvious catalyst It seems more likely
change will occur to avoid the cost of high energy
prices rather than a change for the greater good or
even for the potential benefit of children 40 years
down the line
The energy constraint may be another reason why
the emerging world outperforms the cash-strapped
West Starting with a blank sheet of paper and
having governments with borrowing capacity to
deliver change may see these economies
overcome these constraints more quickly than the
cash-strapped West
But our lsquoEnergy in 2050rsquo report also highlighted
that climate change is a major concern Indeed it
is much easier to overcome the energy constraint
than it is to do so while meeting carbon emission
36 We need to use energy more efficiently to reach this potential
0 1000 2000 3000 4000 5000 6000 7000 8000
India
China
US
Today 2050 consumption if resources werent constrained
Total energy use (Million tonnes of oil equiv alent)
Source HSBC estimates
27
Economics Global 11 January 2012
abc
targets In that report we provide a map of
regions most vulnerable to climate change which
is another variable that should be taken into
account when considering an economyrsquos long-
term future
Omitted variables
We have already discussed that our model cannot
capture all the variables that will dictate an
economyrsquos potential We have used a one-size-
fits-all model to provide a very clear and
transparent framework for thinking about
development By starting to tinker with the
projections based on judgment you essentially
create a list based on opinion Instead we chose to
leave the reader to consider idiosyncratic factors
requiring further consideration that mean a
country should feature more highly or indeed
lower down our economic league table
Cyclical fluctuations
Our model is a structural model that should
determine the potential supply of the economy
There are cyclical factors that can cause economies
to deviate from this long-term path For example
it may be that the use of credit had taken the
developed world above its sustainable path and the
slow growth of the past few years is the
readjustment to the long-term sustainable path
Similarly many emerging economies in the past
few years have been growing stronger than our
projections and were encountering inflationary
pressures and thus required policy action to return
the pace of growth to something more sustainable
Border barriers and war
The biggest danger is that the open borders which
have delivered so much prosperity are closed It is
hard to see how such a wave of protectionism
could benefit an individual economy and certainly
not the system as a whole But politiciansrsquo
motivation tends to be focused on the next election
rather than long-term growth As such bad politics
is a key risk to these projections And of course
trade wars can be followed by real wars which
would obviously set this rather glossy outlook way
off track Civil wars are another potential risk in
certain countries
28
Economics Global 11 January 2012
abc
A major shake-up in world order This extension reinforces the findings from our
original 2050 report Plenty of places in the world
look set to deliver very strong rates of growth But
they are not in the developed world which faces
both structural and cyclical headwinds They are
in the emerging world You can see this in action
by viewing the video of which a snapshot is
available on the following page
In the original report we highlighted the
extraordinary prospects for the likes of China
India Malaysia Mexico Colombia and Turkey
These economies themselves are still at an early
stage of development and continue to offer
fantastic growth prospects But increasingly
attention will turn to the lsquonew emergersrsquo Countries
such as the Philippines Peru and Nigeria all
demonstrate some combination of favourable
demographics and strong fundamentals that should
see a significant rise in their economic size
And so there are likely to be some major changes
in the economic league table between now and
2050 with countries such as the Philippines
jumping as many as 27 places (Table 37) The
losers are the small population ageing economies
of Europe Such change may seem remarkable but
it is not abnormal Table 38 ranks the economies
by size today and shows how this rank has
changed in the past four decades China India and
South Korea have already shown excellent lsquoleap-
frog abilityrsquo The relative decline of countries in
Europe that we forecast is an ongoing extension
of a trend already in place
37 Major change may seem unthinkable but such large shifts are common in history
Order based on size of economy in 2010
(constant 2000 USD)
Rank change since 1970
1 United States 0 2 Japan 0 3 China 14 4 Germany -1 5 United Kingdom -1 6 France -1 7 Italy -1 8 India 7 9 Brazil 0 10 Canada -3 11 South Korea 12 12 Spain -4 13 Mexico -3 14 Australia -2 15 Netherlands -4 16 Argentina -3 17 Russia Not available 18 Turkey 2 19 Sweden -5 20 Switzerland Not available
Source World Bank HSBC
We conclude that the world has great potential to
grow in the coming decades but that growth will
not stem from the developed world The EM story
is only just beginning As the lsquonew emergersrsquo
come to the fore emerging economies offer great
potential to power the global economy to 2050
Econom
ics G
lobal 11 January 2012
29
ab
c
We have created a video that tracks the growth in GDP across the various countries through time The chart above shows the final frame of this video
The length of the bars indicates the cumulative percentage increase in GDP for each country relative to 2010 The colour of the bars shows the level of GDP So for example a
long red bar implies that a country has a large GDP and a high rate of GDP growth
Visit httpcachecantoscomflashhsba-r061GDP_growth_2050-WMVwmv to watch how the growth rates for the different countries change between 2010 and 2050
30
Economics Global 11 January 2012
abc
This page has been left blank intentionally
31
Economics Global 11 January 2012
abc
Appendix
32
Economics Global 11 January 2012
abc
Barrorsquos growth model A1 The model
Variable Coefficients
Log GDP -0018 Male schooling 0002 Log GDP schooling -0004 Log life expectancy 0044 Log fertility -0016 Government consumption ratio -0136 Rule of law index 0029 Democracy index 0090 Democracy index squared -0088 Inflation rate -0043
Source Barro with HSBC adjustment to schooling
We made two amendments to Barrorsquos original
model First we lowered slightly the convergence
rate in line with more recent literature (see OECD
2001)
Second it appeared that the original model was
overstating the impact of education In Barrorsquos
original model an extra year of schooling raises
GDP growth by 12ppt Those with very high
levels of education such as Germany were
forecast to grow much more quickly than they
achieved And countries such as India with very
low levels of education were barely forecast to
grow at all However recalibrating the model to
lower the impact of education produced
remarkably accurate forecasts for such a simple
model The main areas of failure are in Asia
where the region in the early part of the 2000-10
period was still recovering from the Asian crisis
In the following tables we show the details of the
two scenarios that we use to build up to our lsquobase
casersquo The first assumes that governments make
no progress in improving their economic
infrastructure The second assumes that
governments make complete progress bring their
economic infrastructure steadily up to those best
in class in each category such as level of
education Our base case sits between these two
scenarios Essentially each country gets halfway
to improving its imperfections
The model
Model projections for the universe under consideration
-10
-5
0
5
10
15
US
Chi
na UK
Italy
Braz
ilS
Kor
eaM
exic
oN
ethe
rland
sR
ussi
aSw
eden
Belg
ium
Saud
i Ara
bia
Hon
g Ko
ngN
orw
ayTh
aila
ndG
reec
eVe
nezu
ela
Egyp
tC
olom
bia
Mal
aysi
aPo
rtuga
lPh
ilippi
nes
Chi
leN
iger
iaAl
geria
New
Viet
nam
Mor
occo
Qat
arC
uba
Slov
akD
omin
ican
Uru
guay
Syria
Leba
non
Gua
tem
ala
Sri L
anka
Bela
rus
Ecua
dor
Cos
ta R
ica
Azer
baija
nBu
lgar
iaM
acao
Ethi
opia
El S
alva
dor
Trin
idad
and
Yem
enC
ypru
sBo
livia
Icel
and
Jam
aica
Para
guay
Moz
ambi
quG
hana
Bots
wan
a
Model Rate Actual rate
Source World Bank and HSBC estimates using Barrorsquos amended model
33
Economics Global 11 January 2012
abc
Scenario 1 Income per capita forecasts if governments make no progress in improving economic infrastructure
2010-20 2020-30 2030-40 2040-50
Algeria 42 38 34 30 Angola -03 -02 -02 -02 Argentina 25 20 16 13 Australia 19 15 13 11 Austria 27 22 18 15 Azerbaijan 61 49 39 31 Bahrain 34 28 23 19 Bangladesh 36 35 34 33 Belarus 59 45 35 27 Belgium 11 10 08 07 Bolivia 56 46 38 31 Bosnia and Herzegovina
71 58 48 39
Brazil 23 18 14 11 Bulgaria 48 39 32 26 Cameroon 06 06 05 05 Canada 19 16 14 12 Chile 52 42 34 27 China 66 52 43 35 Colombia 30 25 21 17 Costa Rica 37 32 27 23 Croatia 44 37 32 27 Cuba 25 20 16 12 Cyprus 30 24 19 16 Czech Republic 53 39 29 21 Denmark 06 05 04 04 Dominican Republic 36 32 29 27 Ecuador 49 44 38 34 Egypt 35 40 34 29 El Salvador 39 34 30 27 Ethiopia 20 19 18 17 Finland 15 13 11 09 France 12 10 08 07 Germany 21 18 15 13 Ghana 31 27 24 22 Greece 30 26 21 17 Guatemala 08 08 08 08 Honduras 28 25 23 20 Hungary 59 44 33 25 India 41 35 30 26 Indonesia 31 26 22 18 Iran 62 52 42 35 Iraq -05 -05 -05 -05 Ireland 16 17 14 12 Israel -01 10 09 08 Italy 21 18 14 12 Japan 12 11 10 09 Jordan 37 31 26 22 Kazakhstan 59 47 38 30 Kenya 15 14 13 12 Kuwait 34 32 30 29
Source HSBC estimates
Scenario 1 Income per capita forecasts if governments make no progress in improving economic infrastructure (cont)
2010-20 2020-30 2030-40 2040-50
Latvia 56 44 34 27 Lebanon 46 39 33 28 Libya 27 24 21 19 Lithuania 43 33 26 20 Luxembourg 16 13 10 08 Malaysia 54 44 36 29 Mexico 36 31 26 21 Morocco 25 25 25 25 Netherlands 12 11 10 08 New Zealand 29 21 15 10 Nigeria 09 08 07 07 Norway 04 06 07 06 Oman 24 21 17 15 Pakistan 15 15 15 14 Panama 35 29 24 20 Paraguay 48 42 36 32 Peru 54 46 39 33 Philippines 61 52 44 38 Poland 41 33 27 22 Portugal 32 29 25 22 Qatar 09 08 07 06 Romania 71 57 46 37 Russia 51 42 35 29 S Korea 39 29 24 19 Saudi Arabia 19 16 14 11 Serbia 68 56 45 37 Singapore 42 32 27 23 Slovak Republic 42 32 25 19 Slovenia 30 26 22 19 South Africa 11 09 07 05 Spain 29 25 20 17 Sri Lanka 52 46 40 35 Sweden 05 06 06 06 Switzerland 26 21 17 14 Syria 22 22 22 21 Tanzania 36 32 30 27 Thailand 38 32 27 23 Tunisia 40 36 33 30 Turkey 40 34 29 25 Turkmenistan 61 49 39 31 Uganda -01 -01 -01 -01 UK 13 11 09 07 Ukraine 87 68 52 41 United Arab Emirates 25 21 17 14 Uruguay 25 22 19 16 US 05 07 07 07 Uzbekistan 67 54 43 34 Venezuela 14 11 08 05 Vietnam 44 42 39 37 Yemen -24 -25 -26 -27
Source HSBC estimates
34
Economics Global 11 January 2012
abc
Scenario 2 Income per capita forecasts if governments make complete progress in improving economic infrastructure catching up with best in class
2010-20 2020-30 2030-40 2040-50
Algeria 42 50 56 60 Angola -03 24 48 69 Argentina 25 31 37 42 Australia 19 24 28 31 Austria 27 30 32 34 Azerbaijan 61 58 56 55 Bahrain 34 33 32 32 Bangladesh 36 56 72 85 Belarus 59 58 59 61 Belgium 11 21 29 35 Bolivia 56 58 59 61 Bosnia and Herzegovina
71 67 64 62
Brazil 23 35 47 57 Bulgaria 48 54 58 63 Cameroon 06 33 58 79 Canada 19 25 30 34 Chile 52 49 46 45 China 66 60 58 57 Colombia 30 41 50 58 Costa Rica 37 43 47 52 Croatia 44 46 48 50 Cuba 25 39 50 61 Cyprus 30 34 37 40 Czech Republic 53 49 46 46 Denmark 06 17 26 33 Dominican Republic 36 43 48 52 Ecuador 49 54 58 60 Egypt 35 38 48 56 El Salvador 39 47 54 59 Ethiopia 20 47 72 92 Finland 15 23 28 33 France 12 21 28 35 Germany 21 28 32 36 Ghana 31 52 70 84 Greece 30 35 38 41 Guatemala 08 28 48 65 Honduras 28 43 56 67 Hungary 59 53 50 49 India 41 54 66 74 Indonesia 31 48 62 74 Iran 62 61 59 59 Iraq -05 26 56 83 Ireland 16 24 27 30 Israel -01 14 25 34 Italy 21 29 35 40 Japan 12 21 27 32 Jordan 37 44 50 54 Kazakhstan 59 56 55 54 Kenya 15 41 63 82 Kuwait 34 32 30 28
Source HSBC estimates
Scenario 2 Income per capita forecasts if governments make complete progress in improving economic infrastructure catching up with best in class (cont)
2010-20 2020-30 2030-40 2040-50
Latvia 56 53 51 51 Lebanon 46 46 46 46 Libya 27 33 39 44 Lithuania 43 47 50 54 Luxembourg 16 19 22 25 Malaysia 54 49 46 43 Mexico 36 41 45 47 Morocco 25 42 56 68 Netherlands 12 22 29 35 New Zealand 29 32 34 36 Nigeria 09 36 60 80 Norway 04 16 23 28 Oman 24 29 34 38 Pakistan 15 39 61 79 Panama 35 40 43 47 Paraguay 48 54 58 61 Peru 54 53 52 52 Philippines 61 61 61 60 Poland 41 44 48 51 Portugal 32 37 41 45 Qatar 09 14 20 26 Romania 71 65 61 58 Russia 51 54 57 60 S Korea 39 37 39 40 Saudi Arabia 19 28 34 40 Serbia 68 68 68 69 Singapore 42 30 26 23 Slovak Republic 42 44 46 49 Slovenia 30 35 39 43 South Africa 11 30 46 60 Spain 29 34 37 40 Sri Lanka 52 59 63 66 Sweden 05 17 26 33 Switzerland 26 26 27 27 Syria 22 40 55 68 Tanzania 36 52 66 77 Thailand 38 47 55 62 Tunisia 40 48 54 59 Turkey 40 44 47 49 Turkmenistan 61 59 58 57 Uganda -01 30 60 87 UK 13 21 27 32 Ukraine 87 77 71 68 United Arab Emirates 25 27 29 30 Uruguay 25 33 40 46 US 05 17 24 29 Uzbekistan 67 66 66 66 Venezuela 14 29 42 53 Vietnam 44 59 71 79 Yemen -24 13 53 91
Source HSBC estimates
35
Economics Global 11 January 2012
abc
Notes
36
Economics Global 11 January 2012
abc
Notes
37
Economics Global 11 January 2012
abc
Notes
38
Economics Global 11 January 2012
abc
Disclosure appendix Analyst Certification The following analyst(s) economist(s) andor strategist(s) who is(are) primarily responsible for this report certifies(y) that the opinion(s) on the subject security(ies) or issuer(s) andor any other views or forecasts expressed herein accurately reflect their personal view(s) and that no part of their compensation was is or will be directly or indirectly related to the specific recommendation(s) or views contained in this research report Karen Ward Nick Robins and Zoe Knight
Important Disclosures This document has been prepared and is being distributed by the Research Department of HSBC and is intended solely for the clients of HSBC and is not for publication to other persons whether through the press or by other means
This document is for information purposes only and it should not be regarded as an offer to sell or as a solicitation of an offer to buy the securities or other investment products mentioned in it andor to participate in any trading strategy Advice in this document is general and should not be construed as personal advice given it has been prepared without taking account of the objectives financial situation or needs of any particular investor Accordingly investors should before acting on the advice consider the appropriateness of the advice having regard to their objectives financial situation and needs If necessary seek professional investment and tax advice
Certain investment products mentioned in this document may not be eligible for sale in some states or countries and they may not be suitable for all types of investors Investors should consult with their HSBC representative regarding the suitability of the investment products mentioned in this document and take into account their specific investment objectives financial situation or particular needs before making a commitment to purchase investment products
The value of and the income produced by the investment products mentioned in this document may fluctuate so that an investor may get back less than originally invested Certain high-volatility investments can be subject to sudden and large falls in value that could equal or exceed the amount invested Value and income from investment products may be adversely affected by exchange rates interest rates or other factors Past performance of a particular investment product is not indicative of future results
Analysts economists and strategists are paid in part by reference to the profitability of HSBC which includes investment banking revenues
For disclosures in respect of any company mentioned in this report please see the most recently published report on that company available at wwwhsbcnetcomresearch
HSBC Legal Entities are listed in the Disclaimer below
Additional disclosures 1 This report is dated as at 11 January 2012 2 All market data included in this report are dated as at close 05 January 2012 unless otherwise indicated in the report 3 HSBC has procedures in place to identify and manage any potential conflicts of interest that arise in connection with its
Research business HSBCs analysts and its other staff who are involved in the preparation and dissemination of Research operate and have a management reporting line independent of HSBCs Investment Banking business Information Barrier procedures are in place between the Investment Banking and Research businesses to ensure that any confidential andor price sensitive information is handled in an appropriate manner
39
Economics Global 11 January 2012
abc
Disclaimer Legal entities as at 04 March 2011 lsquoUAErsquo HSBC Bank Middle East Limited Dubai lsquoHKrsquo The Hongkong and Shanghai Banking Corporation Limited Hong Kong lsquoTWrsquo HSBC Securities (Taiwan) Corporation Limited lsquoCArsquo HSBC Securities (Canada) Inc Toronto HSBC Bank Paris Branch HSBC France lsquoDErsquo HSBC Trinkaus amp Burkhardt AG Duumlsseldorf 000 HSBC Bank (RR) Moscow lsquoINrsquo HSBC Securities and Capital Markets (India) Private Limited Mumbai lsquoJPrsquo HSBC Securities (Japan) Limited Tokyo lsquoEGrsquo HSBC Securities Egypt SAE Cairo lsquoCNrsquo HSBC Investment Bank Asia Limited Beijing Representative Office The Hongkong and Shanghai Banking Corporation Limited Singapore Branch The Hongkong and Shanghai Banking Corporation Limited Seoul Securities Branch The Hongkong and Shanghai Banking Corporation Limited Seoul Branch HSBC Securities (South Africa) (Pty) Ltd Johannesburg lsquoGRrsquo HSBC Securities SA Athens HSBC Bank plc London Madrid Milan Stockholm Tel Aviv lsquoUSrsquo HSBC Securities (USA) Inc New York HSBC Yatirim Menkul Degerler AS Istanbul HSBC Meacutexico SA Institucioacuten de Banca Muacuteltiple Grupo Financiero HSBC HSBC Bank Brasil SA ndash Banco Muacuteltiplo HSBC Bank Australia Limited HSBC Bank Argentina SA HSBC Saudi Arabia Limited The Hongkong and Shanghai Banking Corporation Limited New Zealand Branch
Issuer of report HSBC Bank plc 8 Canada Square London
E14 5HQ United Kingdom
Telephone +44 20 7991 8888 Fax +44 20 7992 4880
Website wwwresearchhsbccom
This document is issued and approved in the United Kingdom by HSBC Bank plc for the information of its Clients (as defined in the Rules of FSA) and those of its affiliates only If this research is received by a customer of an affiliate of HSBC its provision to the recipient is subject to the terms of business in place between the recipient and such affiliate In Australia this publication has been distributed by The Hongkong and Shanghai Banking Corporation Limited (ABN 65 117 925 970 AFSL 301737) for the general information of its ldquowholesalerdquo customers (as defined in the Corporations Act 2001) Where distributed to retail customers this research is distributed by HSBC Bank Australia Limited (AFSL No 232595) These respective entities make no representations that the products or services mentioned in this document are available to persons in Australia or are necessarily suitable for any particular person or appropriate in accordance with local law No consideration has been given to the particular investment objectives financial situation or particular needs of any recipient The document is distributed in Hong Kong by The Hongkong and Shanghai Banking Corporation Limited and in Japan by HSBC Securities (Japan) Limited Each of the companies listed above (the ldquoParticipating Companiesrdquo) is a member of the HSBC Group of Companies any member of which may trade for its own account as Principal may have underwritten an issue within the last 36 months or together with its Directors officers and employees may have a long or short position in securities or instruments or in any related instrument mentioned in the document Brokerage or fees may be earned by the Participating Companies or persons associated with them in respect of any business transacted by them in all or any of the securities or instruments referred to in this document In Korea this publication is distributed by either The Hongkong and Shanghai Banking Corporation Limited Seoul Securities Branch (HBAP SLS) or The Hongkong and Shanghai Banking Corporation Limited Seoul Branch (HBAP SEL) for the general information of professional investors specified in Article 9 of the Financial Investment Services and Capital Markets Act (ldquoFSCMArdquo) This publication is not a prospectus as defined in the FSCMA It may not be further distributed in whole or in part for any purpose Both HBAP SLS and HBAP SEL are regulated by the Financial Services Commission and the Financial Supervisory Service of Korea This publication is distributed in New Zealand by The Hongkong and Shanghai Banking Corporation Limited New Zealand Branch The information in this document is derived from sources the Participating Companies believe to be reliable but which have not been independently verified The Participating Companies make no guarantee of its accuracy and completeness and are not responsible for errors of transmission of factual or analytical data nor shall the Participating Companies be liable for damages arising out of any personrsquos reliance upon this information All charts and graphs are from publicly available sources or proprietary data The opinions in this document constitute the present judgement of the Participating Companies which is subject to change without notice This document is neither an offer to sell purchase or subscribe for any investment nor a solicitation of such an offer HSBC Securities (USA) Inc accepts responsibility for the content of this research report prepared by its non-US foreign affiliate All US persons receiving andor accessing this report and intending to effect transactions in any security discussed herein should do so with HSBC Securities (USA) Inc in the United States and not with its non-US foreign affiliate the issuer of this report In Singapore this publication is distributed by The Hongkong and Shanghai Banking Corporation Limited Singapore Branch for the general information of institutional investors or other persons specified in Sections 274 and 304 of the Securities and Futures Act (Chapter 289) (ldquoSFArdquo) and accredited investors and other persons in accordance with the conditions specified in Sections 275 and 305 of the SFA This publication is not a prospectus as defined in the SFA It may not be further distributed in whole or in part for any purpose The Hongkong and Shanghai Banking Corporation Limited Singapore Branch is regulated by the Monetary Authority of Singapore Recipients in Singapore should contact a Hongkong and Shanghai Banking Corporation Limited Singapore Branch representative in respect of any matters arising from or in connection with this report HSBC Meacutexico SA Institucioacuten de Banca Muacuteltiple Grupo Financiero HSBC is authorized and regulated by Secretariacutea de Hacienda y Creacutedito Puacuteblico and Comisioacuten Nacional Bancaria y de Valores (CNBV) HSBC Bank (Panama) SA is regulated by Superintendencia de Bancos de Panama Banco HSBC Honduras SA is regulated by Comisioacuten Nacional de Bancos y Seguros (CNBS) Banco HSBC Salvadorentildeo SA is regulated by Superintendencia del Sistema Financiero (SSF) HSBC Colombia SA is regulated by Superintendencia Financiera de Colombia Banco HSBC Costa Rica SA is supervised by Superintendencia General de Entidades Financieras (SUGEF) Banistmo Nicaragua SA is authorized and regulated by Superintendencia de Bancos y de Otras Instituciones Financieras (SIBOIF) The document is intended to be distributed in its entirety Unless governing law permits otherwise you must contact a HSBC Group member in your home jurisdiction if you wish to use HSBC Group services in effecting a transaction in any investment mentioned in this document HSBC Bank plc is registered in England No 14259 is authorised and regulated by the Financial Services Authority and is a member of the London Stock Exchange (070905) copy Copyright HSBC Bank plc 2012 ALL RIGHTS RESERVED No part of this publication may be reproduced stored in a retrieval system or transmitted on any form or by any means electronic mechanical photocopying recording or otherwise without the prior written permission of HSBC Bank plc MICA (P) 208042011 and MICA (P) 040042011
[317638]
40
abc
Global
Stephen King Global Head of Economics +44 20 7991 6700 stephenkinghsbcibcom
Karen Ward Senior Global Economist +44 20 7991 3692 karenwardhsbcibcom
Madhur Jha +44 20 7991 6755 madhurjhahsbcibcom
Europe amp United Kingdom
Janet Henry Chief European Economist +44 20 7991 6711 janethenryhsbcibcom
Simon Wells Chief UK Economist +44 20 7991 6718 simonwellshsbcibcom
Astrid Schilo +44 20 7991 6708 astridschilohsbcibcom
Germany Lothar Hessler +49 21 1910 2906 lotharhesslerhsbcde
France Mathilde Lemoine +33 1 4070 3266 mathildelemoinehsbcfr
North America
Kevin Logan Chief US Economist +1 212 525 3195 kevinrloganushsbccom
Ryan Wang +1 212 525 3181 ryanwangushsbccom
Asia Pacific
Qu Hongbin Managing Director Co-head Asian Economics Research and Chief Economist Greater China +852 2822 2025 hongbinquhsbccomhk
Frederic Neumann Managing Director Co-head Asian Economics Research +852 2822 4556 fredericneumannhsbccomhk
Leif Eskesen Chief Economist India amp ASEAN +65 6239 0840 leifeskesenhsbccomsg
Paul Bloxham Chief Economist Australia and New Zealand +61 2925 52635 paulbloxhamhsbccomau
Donna Kwok +852 2996 6621 donnahjkwokhsbccomhk
Trinh Nguyen +852 2822 6975 trinhdnguyenhsbccomhk
Ronald Man +852 2996 6743 ronaldmanhsbccomhk
Luke Hartigan +612 9255 2635 lukehartiganhsbccomau
Sun Junwei +86 10 5999 8234 junweisunhsbccomcn
Sophia Ma +86 10 5999 8232 xiaopingmahsbccomcn
Global Emerging Markets
Pablo Goldberg Head of Global EM Research +1 212 525 8729 pabloagoldberghsbccom
Bertrand Delgado EM Strategist +1 212 525 0745 bertrandjdelgadoushsbccom
Emerging Europe Middle East and Africa
Murat Ulgen Chief Economist +44 20 7991 6782 muratulgenhsbccom
Agata Urbanska +44 20 7992 2774 agataurbanskahsbcibcom
Alexander Morozov +7 495 783 8855 alexandermorozovhsbccom
Simon Williams +971 4 507 7614 simonwilliamshsbccom
Melis Metiner +90 212 376 4618 melismetinerhsbccomtr
Latin America
Andre Loes Chief Economist Latin America +55 11 3371 8184 andrealoeshsbccombr
Argentina Javier Finkman Chief Economist South America ex-Brazil +54 11 4344 8144 javierfinkmanhsbccomar
Ramiro D Blazquez Senior Economist +54 11 4348 5759 ramiroblazquezhsbccomar
Jorge Morgenstern Senior Economist +54 11 4130 9229 jorgemorgensternhsbccomar
Brazil Constantin Jancso Senior Economist +55 11 3371 8183 constantincjancsohsbccombr
Marcos Fernandes +55 11 6847 9787 marcosrfernandeshsbccombr
Mexico Sergio Martin Chief Economist +52 55 5721 2164 sergiomartinmhsbccommx
Claudia Navarrete Economist +52 55 5721 2422 claudianavarretehsbccommx
Central America Lorena Dominguez Economist +52 55 5721 2172 lorenadominguezhsbccommx
Global Economics Research Team
Karen WardSenior Global EconomistHSBC Bank plc+44 20 7991 3692karenwardhsbcibcom
Karen joined HSBC in 2006 as UK economist In 2010 she was appointed Senior Global Economist with responsibility for monitoringchallenges facing the global economy and their implications for financial markets Before joining HSBC in 2006 Karen worked at theBank of England where she provided supporting analysis for the Monetary Policy Committee She has an MSc Economics fromUniversity College London
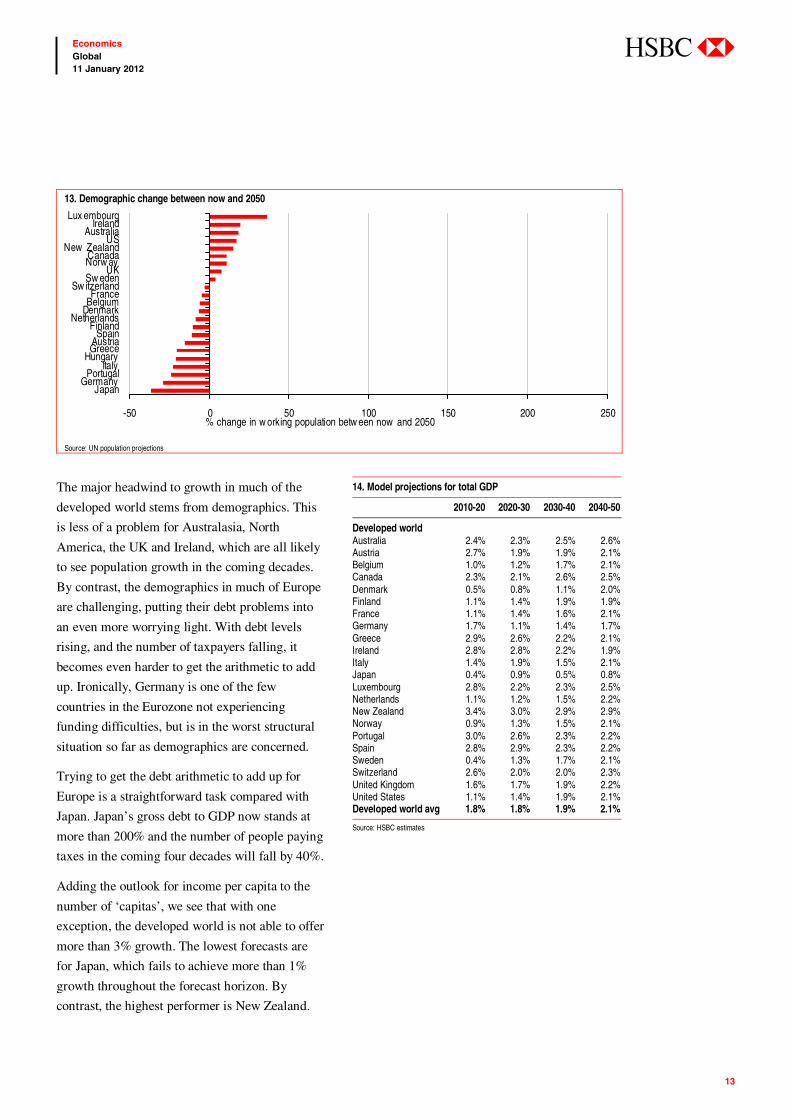

15
Economics Global 11 January 2012
abc
From a demographic standpoint Asia is also a
reasonably mixed bag ndash this is where the shine
slightly comes off the China story since its one-
child policy of yester years will start to see the
working population decline from around 2020
Singapore and South Korea while not enforced
have also seen a staggering decline in fertility
rates in the past couple of decades which will see
their working populations also decline Singapore
has been exploring the possibility of reversing this
trend through an aggressive immigration policy
By contrast other parts of Asia ndash India Pakistan
the Philippines Bangladesh and Malaysia ndash all
have rapidly growing populations In 2050 the
population of Pakistan at roughly 290m will be
just shy of four times the population of the UK
Adding the forecasts for working population to
those of income per capita we get to projections
for total GDP growth in Table 18 There are some
truly remarkable hot spots in Asia China
continues to grow at a rapid pace although the
pace is expected to slow beyond 2020 as the
demographic drag starts to hinder overall GDP
growth Nevertheless we still expect average
GDP growth of more than 5 per annum for the
next 40 years The star performer however is the
Philippines where the combination of strong
fundamentals and powerful demographics gives
rise to an average growth rate of 7 for the
coming 40 years Central Asia is also interesting
Kazakhstan Turkmenistan and Uzbekistan all
perform extremely well in the context of this
model on the back of strong growth in a very
well-educated population The absence of
democracy however prevents these economies
reaching their full potential
18 Model projections for total GDP
2010-20 2020-30 2030-40 2040-50
Asia Azerbaijan 70 57 50 41 Bangladesh 55 55 56 55 China 67 55 44 41 India 57 56 55 52 Indonesia 43 43 43 45 Kazakhstan 61 58 49 40 South Korea 37 23 18 17 Malaysia 71 57 47 38 Pakistan 40 45 49 50 Philippines 84 73 66 58 Singapore 37 21 20 21 Sri Lanka 54 53 49 43 Thailand 40 38 38 40 Turkmenistan 77 64 56 45 Uzbekistan 82 69 61 50 Vietnam 57 53 51 48 Asia average 58 51 47 43
Source HSBC estimates
17 Demographic change between now and 2050
-50 0 50 100 150 200 250
S KoreaSingapore
ChinaThailand
Sri LankaVietnam
KazakhstanAzerbaijanIndonesia
UzbekistanTurkmenistan
BangladeshIndia
Malay siaPhilippines
Pakistan
change in w orking population betw een now and 2050
Source UN population projections
16
Economics Global 11 January 2012
abc
Central and South America The potential of economies in Latin America has
been unleashed in recent decades as they have
managed to tame the inflation that plagued their
economies for much of the 1970s and 1980s
(Table 19) It is remarkable to think that between
1986 and 1994 Brazil suffered several years of
inflation of over 500 Such has been the
turnaround in its economic management that it is
now imposing taxes on foreign investors to
prevent capital inflows Of course we are
assuming that inflation is prevented from ever
creeping back into the system Maintaining small
governments and low levels of debt will surely
help prevent these economies from returning to
their old ways
The level of schooling is high although many of
these economies score less highly on the metric of
rule of law than parts of Asia Greater efforts have
been made recently particularly in Brazil
20 Model projections for income per capita
2010-20 2020-30 2030-40 2040-50
Central and South America Argentina 24 26 27 28 Bolivia 56 52 49 46 Brazil 22 27 31 35 Chile 52 45 40 37 Colombia 30 33 36 38 Costa Rica 37 37 36 36 Cuba 23 30 34 37 Dominican Republic 36 37 37 37 Ecuador 49 48 47 45 El Salvador 39 40 41 41 Guatemala 08 16 24 33 Honduras 28 33 38 42 Mexico 21 39 37 36 Panama 35 34 34 33 Paraguay 48 48 46 45 Peru 54 49 45 41 Uruguay 25 27 28 30 Venezuela 14 20 25 30 Central and South American average
33 36 36 37
Source HSBC estimates
For these reasons the forecasts for income per
capita are not quite as high in many parts of Latin
America as in Asia Of course as discussed
earlier we are not accounting for the regionrsquos rich
endowment of natural resources
19 The lsquoeconomic infrastructurersquo today
GDP per capita
Average years male schooling
Life expectancy
Fertility (average
children per person)
Rule of law Government consumption
Democracy index
Inflation rate
Central and South America Real USD Years Years Children Index Ratio to GDP Index Annual rate Argentina 10517 93 73 22 04 013 08 79 Bolivia 1192 99 66 35 04 014 07 87 Brazil 4711 76 72 19 03 020 08 47 Chile 6083 102 79 19 08 011 10 81 Colombia 3052 77 72 24 03 016 07 56 Costa Rica 5043 87 79 20 06 013 10 102 Cuba 4370 106 79 15 05 032 00 81 Dominican Republic 3697 74 73 26 04 007 08 60 Ecuador 1771 81 75 26 04 011 07 53 El Salvador 2566 80 71 23 03 009 08 41 Guatemala 1858 48 70 41 03 009 07 70 Honduras 1380 75 72 33 03 017 07 81 Mexico 6217 91 75 21 03 011 08 48 Panama 5732 96 76 25 05 011 10 51 Paraguay 1432 85 72 30 03 011 07 70 Peru 2913 90 73 26 06 009 08 35 Uruguay 8942 86 76 20 04 011 10 77 Venezuela 5438 70 73 25 02 012 05 262 Central and South American average
4228 86 74 25 04 014 07 81
Source wwwbarroleecom World Bank Political Risk Services International Country Risk Guide Freedom House Political Rights Index
17
Economics Global 11 January 2012
abc
The demographic outlook for much of Central
South America is very strong particularly in the
smaller countries in the region Of the larger
economies Colombia and Peru stand out for
extremely high working population growth Indeed
at present the populations of Spain and Colombia
are very similar but by 2050 the working
population in Colombia could be 25 larger
Adding the forecasts for income per capita to
those of working population we obtain forecasts
for total GDP (Table 22) The star performer in
the region is Peru where the combination of
strong fundamentals and strong population growth
deliver average growth of 55 for the next 40
years Chile also does very well although
demographics are not quite as favourable as those
in Peru Bolivia Ecuador and Paraguay are also
strong performers although this is partly a
reflection of their low starting point They still lag
much of the region in the economic foundations
used in the model
22 Model projections for total GDP
2010-20 2020-30 2030-40 2040-50
Central and South America Argentina 34 33 31 27 Bolivia 79 69 59 52 Brazil 33 29 29 28 Chile 59 46 40 34 Colombia 45 42 41 40 Costa Rica 51 43 41 36 Cuba 20 22 20 29 Dominican Republic 51 46 42 39 Ecuador 65 57 52 46 El Salvador 51 50 48 45 Guatemala 43 45 46 46 Honduras 56 54 53 50 Mexico 33 44 35 31 Panama 53 46 40 37 Paraguay 70 64 60 52 Peru 69 60 50 42 Uruguay 30 29 29 28 Venezuela 31 32 33 33 Central and South American average
49 45 41 39
Source HSBC estimates
21 Demographic change between now and 2050
-50 0 50 100 150 200 250
CubaBrazilChile
UruguayMex ico
ArgentinaCosta Rica
ColombiaEcuador
DominicanPeru
ElSalv adorPanama
VenezuelaBoliv ia
ParaguayHonduras
Guatemala
change in w orking population betw een now and 2050
Source UN population projections
18
Economics Global 11 January 2012
abc
Central and Eastern Europe Central and Eastern European economies score less
highly than many of the other emerging markets for
inflation control and size of government
But when projecting real income per capita this is
more than compensated for by the exceptional
level of education which for most economies in
the region rivals that of the developed world And
yet while education rates are similar the average
income per capita in the Central and Eastern
Europe block is just one fifth that of the
developed world
For this reason in the context of this model these
economies have great scope to catch up in income
per capita and across the region the forecasts for
income per capita growth are extremely high
(Table 24)
24 Model projections for income per capita
2010-20 2020-30 2030-40 2040-50
Central and Eastern Europe Belarus 59 53 48 45 Bosnia amp Herzegovina 71 63 56 51 Bulgaria 48 47 45 45 Croatia 44 42 39 38 Cyprus 30 29 28 28 Czech Republic 53 45 40 36 Hungary 53 51 44 40 Latvia 56 49 44 40 Lithuania 43 41 39 38 Poland 40 39 38 37 Romania 67 62 54 48 Russia 51 48 46 44 Serbia 68 62 57 53 Slovak Republic 42 39 37 35 Slovenia 30 30 30 30 Turkey 40 39 38 37 Ukraine 89 73 63 56 CEE average 52 48 44 41
Source HSBC estimates
23 The lsquoeconomic infrastructurersquo today
GDP per capita
Average years male schooling
Life expectancy
Fertility (average
children per person)
Rule of law Government consumption
Democracy index
Inflation rate
Central and Eastern Europe Real USD Years Years Children Index Ratio to GDP Index Annual rate Belarus 2556 113 71 14 07 019 00 121 Bosnia and Herzegovina 2162 100 75 12 08 022 05 29 Bulgaria 2542 99 73 15 04 017 10 78 Croatia 6396 90 76 15 08 019 08 38 Cyprus 15510 101 80 15 08 019 10 25 Czech Republic 7225 121 77 15 08 020 10 34 Hungary 5833 117 74 14 07 010 10 61 Latvia 4973 108 72 15 08 017 08 97 Lithuania 5154 109 72 15 07 019 10 70 Poland 6563 99 76 14 08 019 10 35 Romania 2596 104 75 14 07 013 08 61 Russia 2934 97 67 15 07 017 02 116 Serbia 1229 100 74 13 06 020 10 90 Slovak Republic 8042 112 75 13 07 017 10 30 Slovenia 12577 89 79 15 08 017 10 34 Turkey 5088 70 71 21 08 013 05 85 Ukraine 987 111 68 14 07 018 07 180 CEE average 7000 104 74 15 07 018 08 70
Source wwwbarroleecom World Bank Political Risk Services International Country Risk Guide Freedom House Political Rights Index
19
Economics Global 11 January 2012
abc
It is just as well individuals will prove so productive
across the region because demographics are a major
headwind (Chart 25) In vast swathes of the region
the workforce looks set to shrink dramatically This
is largely because of the extremely low level of
fertility As discussed previously these forecasts for
population growth are subject to considerable
uncertainty Indeed in Russia last year an initiative
was launched to try and increase the fertility rate
with the incentive of land provided to couples
producing a third child
As things stand these weak demographics take the
shine slightly off the extremely strong growth in
income per capita Nevertheless the forecasts for
total GDP are still very impressive (Table 26) The
Ukraine is the outperformer with average growth
across the forecast horizon of 6 Again we have to
remember this is coming from an extremely low
base But nevertheless we expect the size of the
Ukrainian economy in constant price constant
exchange rates to increase tenfold by 2050
Some of the smaller Eastern European countries ndash
Romania the Czech Republic and Serbia ndash all do
extremely well particularly in the coming decade
before demographics prove to be more of a drag
And as in the original report we continue to
believe Turkey has an extremely strong long-term
story The combination of strong fundamentals
and the one country in the region with good
demographics should see Turkey maintain a very
respectable pace of growth throughout the
forecast horizon
26 Model projections for total GDP
2010-20 2020-30 2030-40 2040-50
Central and Eastern Europe Belarus 52 43 39 30 Bosnia amp Herzegovina 67 52 44 35 Bulgaria 36 37 33 28 Croatia 38 34 33 28 Cyprus 37 32 33 29 Czech Republic 46 44 36 27 Hungary 47 47 39 32 Latvia 48 42 38 29 Lithuania 34 30 31 29 Poland 33 32 31 21 Romania 61 57 43 35 Russia 42 40 40 33 Serbia 65 59 51 44 Slovak Republic 37 33 30 22 Slovenia 25 24 24 21 Turkey 53 47 40 35 Ukraine 79 63 55 42 CEE average 47 42 38 31
Source HSBC estimates
25 Demographic change between now and 2050
-50 0 50 100 150 200 250
BulgariaBosnia and Herzegovina
BelarusUkrainePoland
RomaniaLithuania
RussiaLatvia
SlovakiaCroatia
SloveniaSerbia
Czech RepublicCyprusTurkey
change in working population between now and 2050
Source UN population projections
20
Economics Global 11 January 2012
abc
Middle East and North Africa Our framework is able to provide some explanation
for the problems currently rocking many parts of
MENA High population growth poor education and
job prospects coupled with a lack of democracy are a
concoction that may explain the social unrest seen
during 2011 In the context of our model these
economies deliver average rates of growth in income
per capita
Being highly endowed with oil has managed to
ensure that income per capita in many of these
nations is already very high This model will
therefore penalise certain countries since it cannot
explain the current level of income per capita with
the variables it considers So we need to take
forecasts for economies such as Qatar with some
pinch of salt These economies may continue to
grow at a rapid pace despite any weakness in the
fundamentals for which our model is accounting
But clearly this source of wealth and the ability to
spread it fairly across the population is a major
source of contention now and will continue to be in
the future
28 Model projections for income per capita
2010-20 2020-30 2030-40 2040-50
Middle East and North Africa Algeria 42 43 43 43 Bahrain 34 30 28 25 Egypt 28 40 42 43 Iran 35 35 35 35 Iraq -06 09 23 37 Israel -03 13 17 21 Jordan 37 37 38 38 Kuwait 33 30 27 24 Lebanon 46 42 39 36 Libya 33 27 28 29 Morocco 31 31 37 42 Oman 24 25 25 25 Qatar 07 10 12 14 Saudi Arabia 20 22 24 26 Syria 22 29 35 41 Tunisia 40 41 42 42 United Arab Emirates 25 23 23 22 Yemen -24 -08 10 30 MENA average 20 24 27 30
Source HSBC estimates
27 The lsquoeconomic infrastructurersquo today
GDP per capita
Average years male schooling
Life expectancy
Fertility (average
children per person)
Rule of law Government consumption
Democracy index
Inflation rate
Middle East and North Africa Real USD Years Years Children Index Ratio to GDP Index Annual rate Algeria 2190 77 72 24 05 011 02 46 Bahrain 16968 96 76 23 08 014 03 32 Egypt 3002 88 70 29 06 011 02 131 Iran 2138 81 71 18 07 013 02 188 Iraq 743 58 68 41 03 023 02 80 Israel 21806 113 81 29 07 025 10 28 Jordan 2497 92 73 35 07 023 03 65 Kuwait 23072 63 78 22 08 014 05 67 Lebanon 6342 92 72 18 07 015 03 12 Libya 7692 79 74 27 07 011 00 64 Morocco 1781 50 71 24 08 018 03 22 Oman 10779 92 76 30 08 019 02 73 Qatar 38466 75 76 24 08 022 02 80 Saudi Arabia 9833 103 73 31 08 022 00 64 Syria 1350 53 74 32 08 011 00 75 Tunisia 2805 73 74 21 08 014 00 40 United Arab Emirates 25607 95 78 19 07 011 02 64 Yemen 565 37 63 52 03 016 03 102 MENA average 11158 77 73 29 07 017 03 79
Source wwwbarroleecom World Bank Political Risk Services International Country Risk Guide Freedom House Political Rights Index
21
Economics Global 11 January 2012
abc
The Middle East is one region where significant
immigration flows make forecasting the size of the
workforce difficult We have seen in the past decade
borders open and close according to ebbs and flows
in demand Nevertheless indigenous population
growth is strong across much of the region But
again we highlight that population growth is only a
good thing for an economy if all the other
foundations are strong This will ensure that these
new workers find jobs If the other fundamentals are
not there then young unemployed individuals
become frustrated which can be a recipe for social
unrest rather than progress
Overall there are lots of caveats to bear in mind
with regards to how this model might not
accurately capture the outlook for parts of the
Middle East In particular we think this
framework is underestimating the potential of
Israel and Qatar
Nevertheless the model does conform to our high
expectations for long-term growth in Egypt and
Saudi Arabia despite some of the near-term
challenges Similarly the outlook looks extremely
robust for Bahrain Jordan and the United Arab
Emirates
30 Model projections for total GDP
2010-20 2020-30 2030-40 2040-50
MENA Algeria 56 54 49 41 Bahrain 57 42 30 27 Egypt 47 56 52 48 Iran 45 44 38 28 Iraq 34 37 42 52 Israel 11 25 25 27 Jordan 59 58 48 42 Kuwait 54 44 31 26 Lebanon 57 45 40 33 Libya 53 43 34 27 Morocco 42 39 40 39 Oman 48 41 37 30 Qatar 21 21 18 13 Saudi Arabia 45 39 35 32 Syria 43 53 48 46 Tunisia 49 46 43 36 United Arab Emirates 47 35 22 09 Yemen 14 25 37 48 MENA average 42 40 36 33
Source HSBC estimates
29 Demographic change between now and 2050
-50 0 50 100 150 200 250
TunisiaLebanon
IranUAE
MoroccoAlgeria
QatarBahrain
Liby aIsrael
Kuw aitEgy ptOman
JordanSaudi Arabia
Sy riaIraq
Yemen
c hange in w orking population betw een now and 2050
Source UN population projections
22
Economics Global 11 January 2012
abc
Sub-Saharan Africa Africa has sadly been the lost continent for many
decades and many parts of the region are still riddled
with corruption civil war and disease Indeed
comparing the averages today for Africa to those of
Asia is disheartening Life expectancy of just 58
versus 71 in Asia and schooling of just 64 years
compared with 84 in Asia are important drawbacks
In addition inflation and a total lack of democracy is
a major problem for some countries
Average real income per capita in Africa is just 7
that of the US with people in many countries living
on less than a dollar a day But again being lsquopoorrsquo
or at a low level of development is not enough to
guarantee growth and for certain countries in the
region our model does not predict that income per
capita will rise significantly in the decade ahead
Countries such as Angola and Uganda appear stuck
in the poverty trap But by assuming governments
will improve these economic flaws we show the
potential for change only time will tell whether
governments are able to deliver on this
32 Model projections for income per capita
2010-20 2020-30 2030-40 2040-50
Africa Angola -03 10 21 32 Cameroon 06 18 29 40 Ethiopia 20 32 43 53 Ghana 31 39 46 52 Kenya 15 26 36 45 Nigeria 09 21 32 42 South Africa 11 19 26 33 Tanzania 36 42 46 50 Uganda -01 13 27 41 Africa average 21 28 35 42
Source HSBC estimates
Nevertheless there are bright spots where already
improvements have been made and the countries
may be turning a corner The model predicts
strongest growth in income per capita for
Tanzania and Ghana although again we are
coming from such an extraordinarily low base
31 The lsquoeconomic infrastructurersquo today
GDP per capita
Average years male schooling
Life expectancy
Fertility (average
children per person)
Rule of law Government consumption
Democracy index
Inflation rate
Africa Angola 1313 73 47 58 05 018 02 128 Cameroon 694 61 51 46 03 010 02 31 Ethiopia 201 61 55 53 08 010 03 234 Ghana 343 78 57 40 04 012 10 155 Kenya 452 73 54 49 03 018 05 151 Nigeria 506 73 48 57 03 018 05 95 South Africa 3710 86 51 25 04 019 08 86 Tanzania 382 73 56 56 08 016 05 98 Uganda 366 54 53 63 06 013 03 104 Africa average 1643 64 58 42 05 014 04 92
Source wwwbarroleecom World Bank Political Risk Services International Country Risk Guide Freedom House Political Rights Index
23
Economics Global 11 January 2012
abc
But the demographic story is extremely strong in
Africa (Chart 33) Indeed half the increase in the
worldrsquos population over the next 40 years will be
in Africa
For those countries that have at least reasonable
prospects for individual prosperity this should
give rise to strong growth in total GDP (Table
34) Again we are coming from a low base
Nigeria deserves a special mention The rapid
population growth in Nigeria means that by 2050
its population will be almost as large as that of the
United States The potential of this country is huge
if the government does manage to deliver the
change that belies these projections
Tanzania is also worth highlighting Again rapid
growth in the population will see it reach almost
140m in 2050 ndash almost twice that of the projection
in either the UK or Germany Given that the
fundamentals are already looking in reasonably
good shape we could see an explosion in growth in
this economy Again we are coming from a low
base ndash income per capita at the moment in
Tanzania in real terms is just USD382 We project
this will rise to only USD2085 by 2050 but given
the growth in the population this would still equate
to a 1700 increase in the size of the economy
Ethiopia so often making the headlines for
poverty and famine appears to be making
progress Indeed last year Ethiopia was one of
the fastest growing economies in the world
delivering more than 10 GDP growth We
forecast strong growth to continue although again
even in 2050 we see income per capita at just 2
that of the US
34 Model projections for total GDP
2010-20 2020-30 2030-40 2040-50
Africa Angola 33 40 48 53 Cameroon 33 44 49 54 Ethiopia 55 63 67 70 Ghana 59 65 66 68 Kenya 46 58 60 63 Nigeria 38 48 52 56 South Africa 16 24 31 35 Tanzania 70 78 76 74 Uganda 43 56 63 68 Africa average 46 51 52 53
Source HSBC estimates
33 Demographic change between now and 2050
-50 0 50 100 150 200 250
SouthAfrica
Cameroon
Nigeria
Ghana
Keny a
Ethiopia
Angola
Tanzania
Uganda
c hange in w orking population betw een now and 2050
Source UN population projections
24
Economics Global 11 January 2012
abc
Putting it all together Considering all these economies we can separate
them into the following three groups (Table 35)
Fast growth ndash gt5 average growth to 2050
The fast-growth economies are those that are at a
low level of development but which have
sufficiently strong underlying fundamentals so that
they catch up with more developed economies with
similarly strong fundamentals
We have already discussed China and India which
sit firmly at the top of this group Elsewhere in Asia
the Philippines Malaysia Bangladesh and Vietnam
all look very strong
In Latin America Peru is the star performer in the
region given it starts from a lower level of
development than some of its counterparts in the
region coupled with strong demographics Many of
the smaller CEEMEA economies also sit here
particularly those with fantastic rates of education
and a good rule of law despite poor demographics
In the Middle East despite near-term uncertainty we
think Egypt has good long-term prospects
Growth ndash 3 lt growth lt5
The lsquogrowthrsquo group are also set to outperform many
of the developed world economies In Asia we
highlight Indonesia and Thailand within this group
and Pakistan owing to the sheer size of working
population Latin America dominates this group of
lsquogrowthrsquo countries Brazil Colombia and Mexico
look very strong and remain firmly in our group of
Top 30 economies in 2050
Stable ndash growth lt3
The stable group of countries offer more limited
growth prospects These largely include the high-
growth ageing economies in the developed world
of which Europe fares particularly badly As
discussed growth in Israel Qatar and UAE may be
underestimated in this model
Conclusions and risks
lsquoRapid growthrsquo is expected by those with a low starting point but
strong fundamentals ndash the Philippines Egypt Peru and Ukraine
lsquoGrowthrsquo economies have strong prospects but a higher starting
point Mexico Turkey Saudi Arabia and Nigeria stand out
A lsquostablersquo group largely the developed world has more limited
potential for growth
25
Economics Global 11 January 2012
abc
35 Which countries will deliver the fastest growth en route to 2050 List ordered based on size of economy in 2050
ChinaIndia
PhilippinesEgypt
MalaysiaPeru
BangladeshAlgeriaUkraineVietnam
UzbekistanTanzania
KazakhstanEcuadorEthiopia
Sri LankaAzerbaijan
KenyaBoliviaJordanUgandaGhana
ParaguayTurkmenistan
HondurasSerbia
Fast growth
BrazilMexicoTurkeyRussia
IndonesiaArgentina
Saudi ArabiaThailand
IranColombiaPakistan
ChileVenezuela
NigeriaRomania
Czech RepublicHungaryKuwait
MoroccoLibya
New ZealandDominican Republic
SyriaTunisia
GuatemalaLebanon
Slovak RepublicOmanAngola
Costa RicaBelarus
IraqPanamaCroatia
El SalvadorCameroonBulgariaBahrain
LithuaniaBosnia and Herzegovina
LatviaYemenCyprus
Growth
United StatesJapan
GermanyUnited Kingdom
FranceCanada
ItalySouth Korea
SpainAustralia
NetherlandsPoland
SwitzerlandSouth Africa
AustriaSwedenBelgium
SingaporeGreeceIsraelIreland
United Arab EmiratesNorwayPortugalFinland
DenmarkCubaQatar
UruguayLuxembourg
Slovenia
Stable
ChinaIndia
PhilippinesEgypt
MalaysiaPeru
BangladeshAlgeriaUkraineVietnam
UzbekistanTanzania
KazakhstanEcuadorEthiopia
Sri LankaAzerbaijan
KenyaBoliviaJordanUgandaGhana
ParaguayTurkmenistan
HondurasSerbia
Fast growth
BrazilMexicoTurkeyRussia
IndonesiaArgentina
Saudi ArabiaThailand
IranColombiaPakistan
ChileVenezuela
NigeriaRomania
Czech RepublicHungaryKuwait
MoroccoLibya
New ZealandDominican Republic
SyriaTunisia
GuatemalaLebanon
Slovak RepublicOmanAngola
Costa RicaBelarus
IraqPanamaCroatia
El SalvadorCameroonBulgariaBahrain
LithuaniaBosnia and Herzegovina
LatviaYemenCyprus
Growth
United StatesJapan
GermanyUnited Kingdom
FranceCanada
ItalySouth Korea
SpainAustralia
NetherlandsPoland
SwitzerlandSouth Africa
AustriaSwedenBelgium
SingaporeGreeceIsraelIreland
United Arab EmiratesNorwayPortugalFinland
DenmarkCubaQatar
UruguayLuxembourg
Slovenia
Stable
Source HSBC estimates
26
Economics Global 11 January 2012
abc
Rose-tinted spectacles We openly admit that behind these projections we
assume governments build on their recent progress
and remain solely focused on increasing the living
standards for their populations Of course this may
be an overly glossy way of viewing the world and
we conclude there are a number of reasons our
lsquoWorld in 2050rsquo could turn out a little different
We consider the main culprits below
Resource constraints
Our calculations have focused on the human
potential of the world economy paying no
attention to the physical constraints of the world
we live in those that are becoming more evident
by the day leading to upward pressure on many
commodity prices
In a follow-up report entitled Energy in 2050 (22
March 2011) we mapped our GDP forecasts into
energy forecasts This exercise certainly gave rise
to some fairly worrying numbers Chart 36 shows
the results for the top 3 economies we consider If
we were in a world of unlimited resources
consumption would explode as the emerging
consumers start to develop a taste for cars and
other energy-hungry domestic appliances Clearly
for our lsquoWorld in 2050rsquo to materialise we need to
change the way we use energy What is
comforting however is that even constraining
ourselves to the technology that we know exists
today it is possible to find a solution that
combines energy efficiency and a move towards
more renewable sources of energy But this does
require major government and industrial foresight
Creating the incentives for all players to change is
the biggest hurdle Rising energy prices are the
most obvious catalyst It seems more likely
change will occur to avoid the cost of high energy
prices rather than a change for the greater good or
even for the potential benefit of children 40 years
down the line
The energy constraint may be another reason why
the emerging world outperforms the cash-strapped
West Starting with a blank sheet of paper and
having governments with borrowing capacity to
deliver change may see these economies
overcome these constraints more quickly than the
cash-strapped West
But our lsquoEnergy in 2050rsquo report also highlighted
that climate change is a major concern Indeed it
is much easier to overcome the energy constraint
than it is to do so while meeting carbon emission
36 We need to use energy more efficiently to reach this potential
0 1000 2000 3000 4000 5000 6000 7000 8000
India
China
US
Today 2050 consumption if resources werent constrained
Total energy use (Million tonnes of oil equiv alent)
Source HSBC estimates
27
Economics Global 11 January 2012
abc
targets In that report we provide a map of
regions most vulnerable to climate change which
is another variable that should be taken into
account when considering an economyrsquos long-
term future
Omitted variables
We have already discussed that our model cannot
capture all the variables that will dictate an
economyrsquos potential We have used a one-size-
fits-all model to provide a very clear and
transparent framework for thinking about
development By starting to tinker with the
projections based on judgment you essentially
create a list based on opinion Instead we chose to
leave the reader to consider idiosyncratic factors
requiring further consideration that mean a
country should feature more highly or indeed
lower down our economic league table
Cyclical fluctuations
Our model is a structural model that should
determine the potential supply of the economy
There are cyclical factors that can cause economies
to deviate from this long-term path For example
it may be that the use of credit had taken the
developed world above its sustainable path and the
slow growth of the past few years is the
readjustment to the long-term sustainable path
Similarly many emerging economies in the past
few years have been growing stronger than our
projections and were encountering inflationary
pressures and thus required policy action to return
the pace of growth to something more sustainable
Border barriers and war
The biggest danger is that the open borders which
have delivered so much prosperity are closed It is
hard to see how such a wave of protectionism
could benefit an individual economy and certainly
not the system as a whole But politiciansrsquo
motivation tends to be focused on the next election
rather than long-term growth As such bad politics
is a key risk to these projections And of course
trade wars can be followed by real wars which
would obviously set this rather glossy outlook way
off track Civil wars are another potential risk in
certain countries
28
Economics Global 11 January 2012
abc
A major shake-up in world order This extension reinforces the findings from our
original 2050 report Plenty of places in the world
look set to deliver very strong rates of growth But
they are not in the developed world which faces
both structural and cyclical headwinds They are
in the emerging world You can see this in action
by viewing the video of which a snapshot is
available on the following page
In the original report we highlighted the
extraordinary prospects for the likes of China
India Malaysia Mexico Colombia and Turkey
These economies themselves are still at an early
stage of development and continue to offer
fantastic growth prospects But increasingly
attention will turn to the lsquonew emergersrsquo Countries
such as the Philippines Peru and Nigeria all
demonstrate some combination of favourable
demographics and strong fundamentals that should
see a significant rise in their economic size
And so there are likely to be some major changes
in the economic league table between now and
2050 with countries such as the Philippines
jumping as many as 27 places (Table 37) The
losers are the small population ageing economies
of Europe Such change may seem remarkable but
it is not abnormal Table 38 ranks the economies
by size today and shows how this rank has
changed in the past four decades China India and
South Korea have already shown excellent lsquoleap-
frog abilityrsquo The relative decline of countries in
Europe that we forecast is an ongoing extension
of a trend already in place
37 Major change may seem unthinkable but such large shifts are common in history
Order based on size of economy in 2010
(constant 2000 USD)
Rank change since 1970
1 United States 0 2 Japan 0 3 China 14 4 Germany -1 5 United Kingdom -1 6 France -1 7 Italy -1 8 India 7 9 Brazil 0 10 Canada -3 11 South Korea 12 12 Spain -4 13 Mexico -3 14 Australia -2 15 Netherlands -4 16 Argentina -3 17 Russia Not available 18 Turkey 2 19 Sweden -5 20 Switzerland Not available
Source World Bank HSBC
We conclude that the world has great potential to
grow in the coming decades but that growth will
not stem from the developed world The EM story
is only just beginning As the lsquonew emergersrsquo
come to the fore emerging economies offer great
potential to power the global economy to 2050
Econom
ics G
lobal 11 January 2012
29
ab
c
We have created a video that tracks the growth in GDP across the various countries through time The chart above shows the final frame of this video
The length of the bars indicates the cumulative percentage increase in GDP for each country relative to 2010 The colour of the bars shows the level of GDP So for example a
long red bar implies that a country has a large GDP and a high rate of GDP growth
Visit httpcachecantoscomflashhsba-r061GDP_growth_2050-WMVwmv to watch how the growth rates for the different countries change between 2010 and 2050
30
Economics Global 11 January 2012
abc
This page has been left blank intentionally
31
Economics Global 11 January 2012
abc
Appendix
32
Economics Global 11 January 2012
abc
Barrorsquos growth model A1 The model
Variable Coefficients
Log GDP -0018 Male schooling 0002 Log GDP schooling -0004 Log life expectancy 0044 Log fertility -0016 Government consumption ratio -0136 Rule of law index 0029 Democracy index 0090 Democracy index squared -0088 Inflation rate -0043
Source Barro with HSBC adjustment to schooling
We made two amendments to Barrorsquos original
model First we lowered slightly the convergence
rate in line with more recent literature (see OECD
2001)
Second it appeared that the original model was
overstating the impact of education In Barrorsquos
original model an extra year of schooling raises
GDP growth by 12ppt Those with very high
levels of education such as Germany were
forecast to grow much more quickly than they
achieved And countries such as India with very
low levels of education were barely forecast to
grow at all However recalibrating the model to
lower the impact of education produced
remarkably accurate forecasts for such a simple
model The main areas of failure are in Asia
where the region in the early part of the 2000-10
period was still recovering from the Asian crisis
In the following tables we show the details of the
two scenarios that we use to build up to our lsquobase
casersquo The first assumes that governments make
no progress in improving their economic
infrastructure The second assumes that
governments make complete progress bring their
economic infrastructure steadily up to those best
in class in each category such as level of
education Our base case sits between these two
scenarios Essentially each country gets halfway
to improving its imperfections
The model
Model projections for the universe under consideration
-10
-5
0
5
10
15
US
Chi
na UK
Italy
Braz
ilS
Kor
eaM
exic
oN
ethe
rland
sR
ussi
aSw
eden
Belg
ium
Saud
i Ara
bia
Hon
g Ko
ngN
orw
ayTh
aila
ndG
reec
eVe
nezu
ela
Egyp
tC
olom
bia
Mal
aysi
aPo
rtuga
lPh
ilippi
nes
Chi
leN
iger
iaAl
geria
New
Viet
nam
Mor
occo
Qat
arC
uba
Slov
akD
omin
ican
Uru
guay
Syria
Leba
non
Gua
tem
ala
Sri L
anka
Bela
rus
Ecua
dor
Cos
ta R
ica
Azer
baija
nBu
lgar
iaM
acao
Ethi
opia
El S
alva
dor
Trin
idad
and
Yem
enC
ypru
sBo
livia
Icel
and
Jam
aica
Para
guay
Moz
ambi
quG
hana
Bots
wan
a
Model Rate Actual rate
Source World Bank and HSBC estimates using Barrorsquos amended model
33
Economics Global 11 January 2012
abc
Scenario 1 Income per capita forecasts if governments make no progress in improving economic infrastructure
2010-20 2020-30 2030-40 2040-50
Algeria 42 38 34 30 Angola -03 -02 -02 -02 Argentina 25 20 16 13 Australia 19 15 13 11 Austria 27 22 18 15 Azerbaijan 61 49 39 31 Bahrain 34 28 23 19 Bangladesh 36 35 34 33 Belarus 59 45 35 27 Belgium 11 10 08 07 Bolivia 56 46 38 31 Bosnia and Herzegovina
71 58 48 39
Brazil 23 18 14 11 Bulgaria 48 39 32 26 Cameroon 06 06 05 05 Canada 19 16 14 12 Chile 52 42 34 27 China 66 52 43 35 Colombia 30 25 21 17 Costa Rica 37 32 27 23 Croatia 44 37 32 27 Cuba 25 20 16 12 Cyprus 30 24 19 16 Czech Republic 53 39 29 21 Denmark 06 05 04 04 Dominican Republic 36 32 29 27 Ecuador 49 44 38 34 Egypt 35 40 34 29 El Salvador 39 34 30 27 Ethiopia 20 19 18 17 Finland 15 13 11 09 France 12 10 08 07 Germany 21 18 15 13 Ghana 31 27 24 22 Greece 30 26 21 17 Guatemala 08 08 08 08 Honduras 28 25 23 20 Hungary 59 44 33 25 India 41 35 30 26 Indonesia 31 26 22 18 Iran 62 52 42 35 Iraq -05 -05 -05 -05 Ireland 16 17 14 12 Israel -01 10 09 08 Italy 21 18 14 12 Japan 12 11 10 09 Jordan 37 31 26 22 Kazakhstan 59 47 38 30 Kenya 15 14 13 12 Kuwait 34 32 30 29
Source HSBC estimates
Scenario 1 Income per capita forecasts if governments make no progress in improving economic infrastructure (cont)
2010-20 2020-30 2030-40 2040-50
Latvia 56 44 34 27 Lebanon 46 39 33 28 Libya 27 24 21 19 Lithuania 43 33 26 20 Luxembourg 16 13 10 08 Malaysia 54 44 36 29 Mexico 36 31 26 21 Morocco 25 25 25 25 Netherlands 12 11 10 08 New Zealand 29 21 15 10 Nigeria 09 08 07 07 Norway 04 06 07 06 Oman 24 21 17 15 Pakistan 15 15 15 14 Panama 35 29 24 20 Paraguay 48 42 36 32 Peru 54 46 39 33 Philippines 61 52 44 38 Poland 41 33 27 22 Portugal 32 29 25 22 Qatar 09 08 07 06 Romania 71 57 46 37 Russia 51 42 35 29 S Korea 39 29 24 19 Saudi Arabia 19 16 14 11 Serbia 68 56 45 37 Singapore 42 32 27 23 Slovak Republic 42 32 25 19 Slovenia 30 26 22 19 South Africa 11 09 07 05 Spain 29 25 20 17 Sri Lanka 52 46 40 35 Sweden 05 06 06 06 Switzerland 26 21 17 14 Syria 22 22 22 21 Tanzania 36 32 30 27 Thailand 38 32 27 23 Tunisia 40 36 33 30 Turkey 40 34 29 25 Turkmenistan 61 49 39 31 Uganda -01 -01 -01 -01 UK 13 11 09 07 Ukraine 87 68 52 41 United Arab Emirates 25 21 17 14 Uruguay 25 22 19 16 US 05 07 07 07 Uzbekistan 67 54 43 34 Venezuela 14 11 08 05 Vietnam 44 42 39 37 Yemen -24 -25 -26 -27
Source HSBC estimates
34
Economics Global 11 January 2012
abc
Scenario 2 Income per capita forecasts if governments make complete progress in improving economic infrastructure catching up with best in class
2010-20 2020-30 2030-40 2040-50
Algeria 42 50 56 60 Angola -03 24 48 69 Argentina 25 31 37 42 Australia 19 24 28 31 Austria 27 30 32 34 Azerbaijan 61 58 56 55 Bahrain 34 33 32 32 Bangladesh 36 56 72 85 Belarus 59 58 59 61 Belgium 11 21 29 35 Bolivia 56 58 59 61 Bosnia and Herzegovina
71 67 64 62
Brazil 23 35 47 57 Bulgaria 48 54 58 63 Cameroon 06 33 58 79 Canada 19 25 30 34 Chile 52 49 46 45 China 66 60 58 57 Colombia 30 41 50 58 Costa Rica 37 43 47 52 Croatia 44 46 48 50 Cuba 25 39 50 61 Cyprus 30 34 37 40 Czech Republic 53 49 46 46 Denmark 06 17 26 33 Dominican Republic 36 43 48 52 Ecuador 49 54 58 60 Egypt 35 38 48 56 El Salvador 39 47 54 59 Ethiopia 20 47 72 92 Finland 15 23 28 33 France 12 21 28 35 Germany 21 28 32 36 Ghana 31 52 70 84 Greece 30 35 38 41 Guatemala 08 28 48 65 Honduras 28 43 56 67 Hungary 59 53 50 49 India 41 54 66 74 Indonesia 31 48 62 74 Iran 62 61 59 59 Iraq -05 26 56 83 Ireland 16 24 27 30 Israel -01 14 25 34 Italy 21 29 35 40 Japan 12 21 27 32 Jordan 37 44 50 54 Kazakhstan 59 56 55 54 Kenya 15 41 63 82 Kuwait 34 32 30 28
Source HSBC estimates
Scenario 2 Income per capita forecasts if governments make complete progress in improving economic infrastructure catching up with best in class (cont)
2010-20 2020-30 2030-40 2040-50
Latvia 56 53 51 51 Lebanon 46 46 46 46 Libya 27 33 39 44 Lithuania 43 47 50 54 Luxembourg 16 19 22 25 Malaysia 54 49 46 43 Mexico 36 41 45 47 Morocco 25 42 56 68 Netherlands 12 22 29 35 New Zealand 29 32 34 36 Nigeria 09 36 60 80 Norway 04 16 23 28 Oman 24 29 34 38 Pakistan 15 39 61 79 Panama 35 40 43 47 Paraguay 48 54 58 61 Peru 54 53 52 52 Philippines 61 61 61 60 Poland 41 44 48 51 Portugal 32 37 41 45 Qatar 09 14 20 26 Romania 71 65 61 58 Russia 51 54 57 60 S Korea 39 37 39 40 Saudi Arabia 19 28 34 40 Serbia 68 68 68 69 Singapore 42 30 26 23 Slovak Republic 42 44 46 49 Slovenia 30 35 39 43 South Africa 11 30 46 60 Spain 29 34 37 40 Sri Lanka 52 59 63 66 Sweden 05 17 26 33 Switzerland 26 26 27 27 Syria 22 40 55 68 Tanzania 36 52 66 77 Thailand 38 47 55 62 Tunisia 40 48 54 59 Turkey 40 44 47 49 Turkmenistan 61 59 58 57 Uganda -01 30 60 87 UK 13 21 27 32 Ukraine 87 77 71 68 United Arab Emirates 25 27 29 30 Uruguay 25 33 40 46 US 05 17 24 29 Uzbekistan 67 66 66 66 Venezuela 14 29 42 53 Vietnam 44 59 71 79 Yemen -24 13 53 91
Source HSBC estimates
35
Economics Global 11 January 2012
abc
Notes
36
Economics Global 11 January 2012
abc
Notes
37
Economics Global 11 January 2012
abc
Notes
38
Economics Global 11 January 2012
abc
Disclosure appendix Analyst Certification The following analyst(s) economist(s) andor strategist(s) who is(are) primarily responsible for this report certifies(y) that the opinion(s) on the subject security(ies) or issuer(s) andor any other views or forecasts expressed herein accurately reflect their personal view(s) and that no part of their compensation was is or will be directly or indirectly related to the specific recommendation(s) or views contained in this research report Karen Ward Nick Robins and Zoe Knight
Important Disclosures This document has been prepared and is being distributed by the Research Department of HSBC and is intended solely for the clients of HSBC and is not for publication to other persons whether through the press or by other means
This document is for information purposes only and it should not be regarded as an offer to sell or as a solicitation of an offer to buy the securities or other investment products mentioned in it andor to participate in any trading strategy Advice in this document is general and should not be construed as personal advice given it has been prepared without taking account of the objectives financial situation or needs of any particular investor Accordingly investors should before acting on the advice consider the appropriateness of the advice having regard to their objectives financial situation and needs If necessary seek professional investment and tax advice
Certain investment products mentioned in this document may not be eligible for sale in some states or countries and they may not be suitable for all types of investors Investors should consult with their HSBC representative regarding the suitability of the investment products mentioned in this document and take into account their specific investment objectives financial situation or particular needs before making a commitment to purchase investment products
The value of and the income produced by the investment products mentioned in this document may fluctuate so that an investor may get back less than originally invested Certain high-volatility investments can be subject to sudden and large falls in value that could equal or exceed the amount invested Value and income from investment products may be adversely affected by exchange rates interest rates or other factors Past performance of a particular investment product is not indicative of future results
Analysts economists and strategists are paid in part by reference to the profitability of HSBC which includes investment banking revenues
For disclosures in respect of any company mentioned in this report please see the most recently published report on that company available at wwwhsbcnetcomresearch
HSBC Legal Entities are listed in the Disclaimer below
Additional disclosures 1 This report is dated as at 11 January 2012 2 All market data included in this report are dated as at close 05 January 2012 unless otherwise indicated in the report 3 HSBC has procedures in place to identify and manage any potential conflicts of interest that arise in connection with its
Research business HSBCs analysts and its other staff who are involved in the preparation and dissemination of Research operate and have a management reporting line independent of HSBCs Investment Banking business Information Barrier procedures are in place between the Investment Banking and Research businesses to ensure that any confidential andor price sensitive information is handled in an appropriate manner
39
Economics Global 11 January 2012
abc
Disclaimer Legal entities as at 04 March 2011 lsquoUAErsquo HSBC Bank Middle East Limited Dubai lsquoHKrsquo The Hongkong and Shanghai Banking Corporation Limited Hong Kong lsquoTWrsquo HSBC Securities (Taiwan) Corporation Limited lsquoCArsquo HSBC Securities (Canada) Inc Toronto HSBC Bank Paris Branch HSBC France lsquoDErsquo HSBC Trinkaus amp Burkhardt AG Duumlsseldorf 000 HSBC Bank (RR) Moscow lsquoINrsquo HSBC Securities and Capital Markets (India) Private Limited Mumbai lsquoJPrsquo HSBC Securities (Japan) Limited Tokyo lsquoEGrsquo HSBC Securities Egypt SAE Cairo lsquoCNrsquo HSBC Investment Bank Asia Limited Beijing Representative Office The Hongkong and Shanghai Banking Corporation Limited Singapore Branch The Hongkong and Shanghai Banking Corporation Limited Seoul Securities Branch The Hongkong and Shanghai Banking Corporation Limited Seoul Branch HSBC Securities (South Africa) (Pty) Ltd Johannesburg lsquoGRrsquo HSBC Securities SA Athens HSBC Bank plc London Madrid Milan Stockholm Tel Aviv lsquoUSrsquo HSBC Securities (USA) Inc New York HSBC Yatirim Menkul Degerler AS Istanbul HSBC Meacutexico SA Institucioacuten de Banca Muacuteltiple Grupo Financiero HSBC HSBC Bank Brasil SA ndash Banco Muacuteltiplo HSBC Bank Australia Limited HSBC Bank Argentina SA HSBC Saudi Arabia Limited The Hongkong and Shanghai Banking Corporation Limited New Zealand Branch
Issuer of report HSBC Bank plc 8 Canada Square London
E14 5HQ United Kingdom
Telephone +44 20 7991 8888 Fax +44 20 7992 4880
Website wwwresearchhsbccom
This document is issued and approved in the United Kingdom by HSBC Bank plc for the information of its Clients (as defined in the Rules of FSA) and those of its affiliates only If this research is received by a customer of an affiliate of HSBC its provision to the recipient is subject to the terms of business in place between the recipient and such affiliate In Australia this publication has been distributed by The Hongkong and Shanghai Banking Corporation Limited (ABN 65 117 925 970 AFSL 301737) for the general information of its ldquowholesalerdquo customers (as defined in the Corporations Act 2001) Where distributed to retail customers this research is distributed by HSBC Bank Australia Limited (AFSL No 232595) These respective entities make no representations that the products or services mentioned in this document are available to persons in Australia or are necessarily suitable for any particular person or appropriate in accordance with local law No consideration has been given to the particular investment objectives financial situation or particular needs of any recipient The document is distributed in Hong Kong by The Hongkong and Shanghai Banking Corporation Limited and in Japan by HSBC Securities (Japan) Limited Each of the companies listed above (the ldquoParticipating Companiesrdquo) is a member of the HSBC Group of Companies any member of which may trade for its own account as Principal may have underwritten an issue within the last 36 months or together with its Directors officers and employees may have a long or short position in securities or instruments or in any related instrument mentioned in the document Brokerage or fees may be earned by the Participating Companies or persons associated with them in respect of any business transacted by them in all or any of the securities or instruments referred to in this document In Korea this publication is distributed by either The Hongkong and Shanghai Banking Corporation Limited Seoul Securities Branch (HBAP SLS) or The Hongkong and Shanghai Banking Corporation Limited Seoul Branch (HBAP SEL) for the general information of professional investors specified in Article 9 of the Financial Investment Services and Capital Markets Act (ldquoFSCMArdquo) This publication is not a prospectus as defined in the FSCMA It may not be further distributed in whole or in part for any purpose Both HBAP SLS and HBAP SEL are regulated by the Financial Services Commission and the Financial Supervisory Service of Korea This publication is distributed in New Zealand by The Hongkong and Shanghai Banking Corporation Limited New Zealand Branch The information in this document is derived from sources the Participating Companies believe to be reliable but which have not been independently verified The Participating Companies make no guarantee of its accuracy and completeness and are not responsible for errors of transmission of factual or analytical data nor shall the Participating Companies be liable for damages arising out of any personrsquos reliance upon this information All charts and graphs are from publicly available sources or proprietary data The opinions in this document constitute the present judgement of the Participating Companies which is subject to change without notice This document is neither an offer to sell purchase or subscribe for any investment nor a solicitation of such an offer HSBC Securities (USA) Inc accepts responsibility for the content of this research report prepared by its non-US foreign affiliate All US persons receiving andor accessing this report and intending to effect transactions in any security discussed herein should do so with HSBC Securities (USA) Inc in the United States and not with its non-US foreign affiliate the issuer of this report In Singapore this publication is distributed by The Hongkong and Shanghai Banking Corporation Limited Singapore Branch for the general information of institutional investors or other persons specified in Sections 274 and 304 of the Securities and Futures Act (Chapter 289) (ldquoSFArdquo) and accredited investors and other persons in accordance with the conditions specified in Sections 275 and 305 of the SFA This publication is not a prospectus as defined in the SFA It may not be further distributed in whole or in part for any purpose The Hongkong and Shanghai Banking Corporation Limited Singapore Branch is regulated by the Monetary Authority of Singapore Recipients in Singapore should contact a Hongkong and Shanghai Banking Corporation Limited Singapore Branch representative in respect of any matters arising from or in connection with this report HSBC Meacutexico SA Institucioacuten de Banca Muacuteltiple Grupo Financiero HSBC is authorized and regulated by Secretariacutea de Hacienda y Creacutedito Puacuteblico and Comisioacuten Nacional Bancaria y de Valores (CNBV) HSBC Bank (Panama) SA is regulated by Superintendencia de Bancos de Panama Banco HSBC Honduras SA is regulated by Comisioacuten Nacional de Bancos y Seguros (CNBS) Banco HSBC Salvadorentildeo SA is regulated by Superintendencia del Sistema Financiero (SSF) HSBC Colombia SA is regulated by Superintendencia Financiera de Colombia Banco HSBC Costa Rica SA is supervised by Superintendencia General de Entidades Financieras (SUGEF) Banistmo Nicaragua SA is authorized and regulated by Superintendencia de Bancos y de Otras Instituciones Financieras (SIBOIF) The document is intended to be distributed in its entirety Unless governing law permits otherwise you must contact a HSBC Group member in your home jurisdiction if you wish to use HSBC Group services in effecting a transaction in any investment mentioned in this document HSBC Bank plc is registered in England No 14259 is authorised and regulated by the Financial Services Authority and is a member of the London Stock Exchange (070905) copy Copyright HSBC Bank plc 2012 ALL RIGHTS RESERVED No part of this publication may be reproduced stored in a retrieval system or transmitted on any form or by any means electronic mechanical photocopying recording or otherwise without the prior written permission of HSBC Bank plc MICA (P) 208042011 and MICA (P) 040042011
[317638]
40
abc
Global
Stephen King Global Head of Economics +44 20 7991 6700 stephenkinghsbcibcom
Karen Ward Senior Global Economist +44 20 7991 3692 karenwardhsbcibcom
Madhur Jha +44 20 7991 6755 madhurjhahsbcibcom
Europe amp United Kingdom
Janet Henry Chief European Economist +44 20 7991 6711 janethenryhsbcibcom
Simon Wells Chief UK Economist +44 20 7991 6718 simonwellshsbcibcom
Astrid Schilo +44 20 7991 6708 astridschilohsbcibcom
Germany Lothar Hessler +49 21 1910 2906 lotharhesslerhsbcde
France Mathilde Lemoine +33 1 4070 3266 mathildelemoinehsbcfr
North America
Kevin Logan Chief US Economist +1 212 525 3195 kevinrloganushsbccom
Ryan Wang +1 212 525 3181 ryanwangushsbccom
Asia Pacific
Qu Hongbin Managing Director Co-head Asian Economics Research and Chief Economist Greater China +852 2822 2025 hongbinquhsbccomhk
Frederic Neumann Managing Director Co-head Asian Economics Research +852 2822 4556 fredericneumannhsbccomhk
Leif Eskesen Chief Economist India amp ASEAN +65 6239 0840 leifeskesenhsbccomsg
Paul Bloxham Chief Economist Australia and New Zealand +61 2925 52635 paulbloxhamhsbccomau
Donna Kwok +852 2996 6621 donnahjkwokhsbccomhk
Trinh Nguyen +852 2822 6975 trinhdnguyenhsbccomhk
Ronald Man +852 2996 6743 ronaldmanhsbccomhk
Luke Hartigan +612 9255 2635 lukehartiganhsbccomau
Sun Junwei +86 10 5999 8234 junweisunhsbccomcn
Sophia Ma +86 10 5999 8232 xiaopingmahsbccomcn
Global Emerging Markets
Pablo Goldberg Head of Global EM Research +1 212 525 8729 pabloagoldberghsbccom
Bertrand Delgado EM Strategist +1 212 525 0745 bertrandjdelgadoushsbccom
Emerging Europe Middle East and Africa
Murat Ulgen Chief Economist +44 20 7991 6782 muratulgenhsbccom
Agata Urbanska +44 20 7992 2774 agataurbanskahsbcibcom
Alexander Morozov +7 495 783 8855 alexandermorozovhsbccom
Simon Williams +971 4 507 7614 simonwilliamshsbccom
Melis Metiner +90 212 376 4618 melismetinerhsbccomtr
Latin America
Andre Loes Chief Economist Latin America +55 11 3371 8184 andrealoeshsbccombr
Argentina Javier Finkman Chief Economist South America ex-Brazil +54 11 4344 8144 javierfinkmanhsbccomar
Ramiro D Blazquez Senior Economist +54 11 4348 5759 ramiroblazquezhsbccomar
Jorge Morgenstern Senior Economist +54 11 4130 9229 jorgemorgensternhsbccomar
Brazil Constantin Jancso Senior Economist +55 11 3371 8183 constantincjancsohsbccombr
Marcos Fernandes +55 11 6847 9787 marcosrfernandeshsbccombr
Mexico Sergio Martin Chief Economist +52 55 5721 2164 sergiomartinmhsbccommx
Claudia Navarrete Economist +52 55 5721 2422 claudianavarretehsbccommx
Central America Lorena Dominguez Economist +52 55 5721 2172 lorenadominguezhsbccommx
Global Economics Research Team
Karen WardSenior Global EconomistHSBC Bank plc+44 20 7991 3692karenwardhsbcibcom
Karen joined HSBC in 2006 as UK economist In 2010 she was appointed Senior Global Economist with responsibility for monitoringchallenges facing the global economy and their implications for financial markets Before joining HSBC in 2006 Karen worked at theBank of England where she provided supporting analysis for the Monetary Policy Committee She has an MSc Economics fromUniversity College London