Embed Size (px)
Citation preview

THE WORLD IS MULTI-ASSET
1

2-DAY WORKSHOP ON ALTERNATIVE INVESTMENTS
JO MURPHY
MANAGING DIRECTOR, HEAD OF ASIA PACIFIC
FRIDAY, 9TH FEBRUARY, 2018
REBALANCE YOUR EDUCATION PORTFOLIO
Western India Regional Council of
The Institute of Chartered Accountants Of India

CONTENT
Professional Development
A Dive into the Global Hedge Fund Industry
Why Alternative Investments? …. Investor Appetite
Asia Pacific Investors …. Who are they?
What’s next?
Due Diligence

THE WORLD IS MULTI-ASSET
4
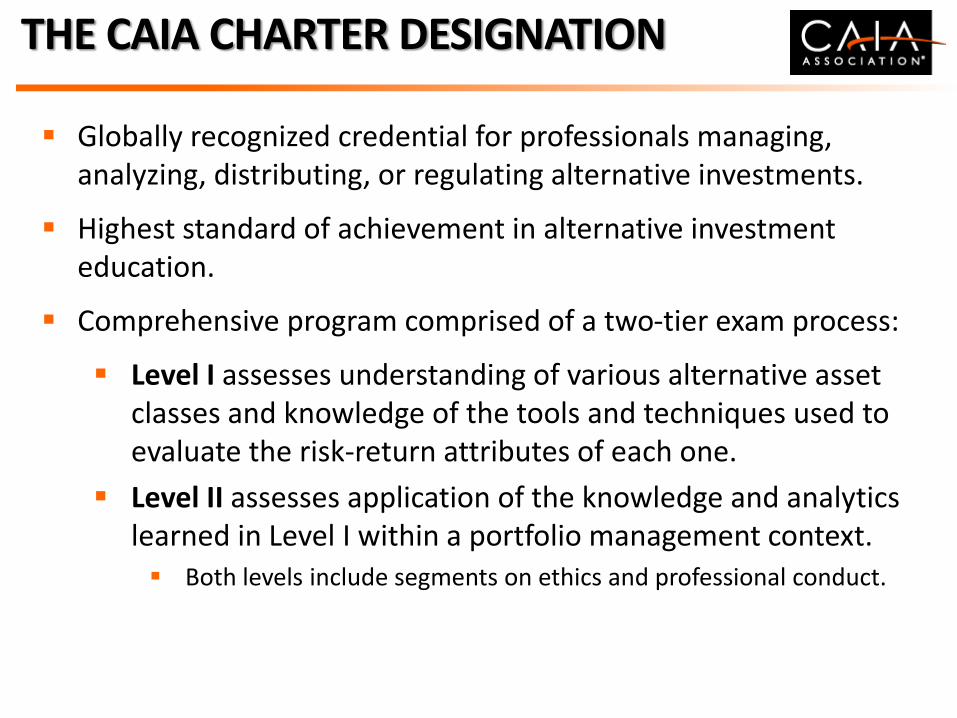
THE CAIA CHARTER DESIGNATION
Globally recognized credential for professionals managing, analyzing, distributing, or regulating alternative investments.
Highest standard of achievement in alternative investment education.
Comprehensive program comprised of a two-tier exam process:
Level I assesses understanding of various alternative asset classes and knowledge of the tools and techniques used to evaluate the risk-return attributes of each one.
Level II assesses application of the knowledge and analytics learned in Level I within a portfolio management context. Both levels include segments on ethics and professional conduct.

GLOBAL PRESENCE

Membership Growth
*2017 Data through May 2017
561
3,265
5,700
9,000
0
2,000
4,000
6,000
8,000
10,000
2004 2005 2006 2007 2008 2009 2010 2011 2012 2013 2014 2015 2016 2017*
CAIA Charter

Level I Curriculum – Third Edition
Core Concepts
Professional Standards & Ethics
Introduction to Alternative
Investments
Real Assets
Hedge Funds
Private Equity
Structured Products
Risk & Portfolio Management

Level I Curriculum Changes
New or Updated Topic Areas Liquid alternatives
New introduction chapter devoted to financial economics
Structured products expansion (equity, commodity, and fixed income
products)
Real asset expansion
Enhanced Applications on caia.org
Highlight and demonstrate numerical examples
Additional Review Questions
Review questions at the end of each chapter (Answers can be found in
the CAIA Level I Workbook)

CAIA TOPIC EVOLUTION: 2008 - 2017
As the Alternative Investment Universe expanded in both AUM and products, the curriculum evolved in tandem
Source: CAIA
0%
5%
10%
15%
20%
25%
30%
2008 2011 2014 2017

Hedge Funds Are Becoming A Smaller Topic Within The CAIA Curriculum
23%
26%
17%
Source: CAIA
Hedge Fund Topic Weight in 2008
Hedge Fund & Managed Futures in 2014
Hedge Fund & Managed Futures in 2017
Alternatives Are More Than Hedge Funds

Level II Curriculum – Third Edition
Advanced Core Concepts
Professional Standards & Ethics
Venture Capital & Private Equity
Hedge Funds & Managed Futures
Real Estate/Real Assets
Commodities
Structured Products
Manager Selection, Due Diligence &
Regulation
Research Issues & Current Topics
Risk & Risk Management
Asset Allocation & Portfolio Management

Level II Curriculum Recent Changes
The 3rd Edition of the CAIA Level II textbook provides comprehensive data models, due diligence processes, analysis, and strategies to keep you current
and relevant in the field of alternative investments.
New or Updated Topic Areas
Enhanced coverage of:
• Family offices and sovereign wealth funds.
• Alternative investment groups, such as structured products and
infrastructure• Private equity
• Real assets
• Hedge funds including credit strategies and operational due diligence• Structured products – featuring two sections focused on fixed-income
derivatives and asset-backed securities, and insurance-linked products
and hybrid securities

Resources for Success – Curriculum & Study Tools

67% 66% 66%
59%61%
63% 64%66%
68% 67%70%
66%
59%57%
50%
70%
90%
Level I
Level II
Pass Rates

Academic Partnerships - Americas

A complete list of CAIA’s academic partners globally can be found at caia.org.
Academic Partnerships - EMEA

Academic Partnerships - APAC
A complete list of CAIA’s academic partners globally can be found at caia.org.

Association Partnerships
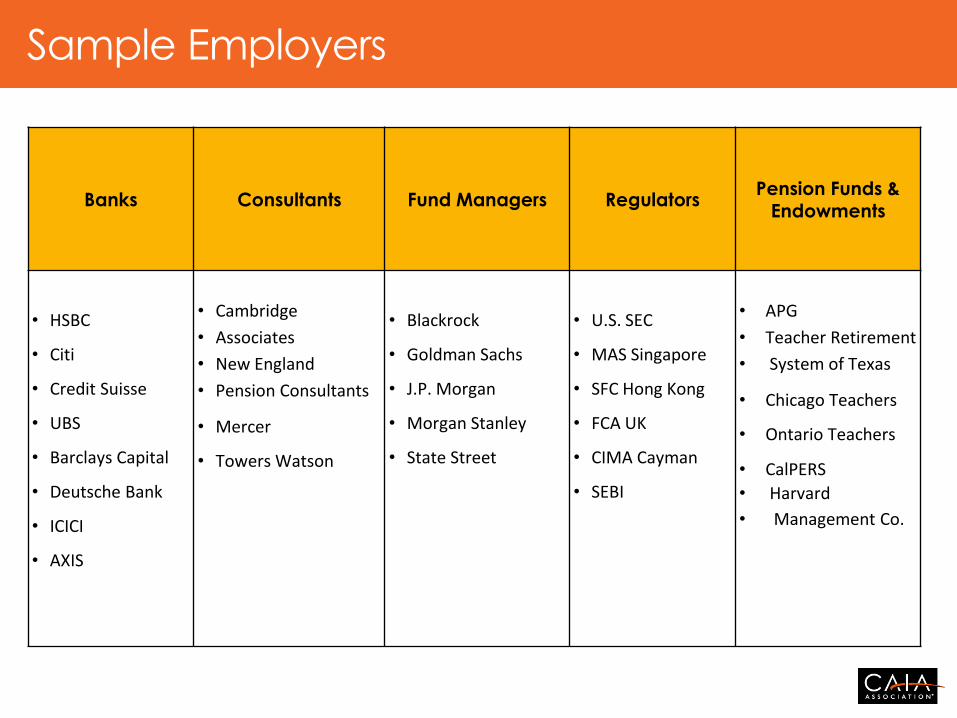
Banks Consultants Fund Managers RegulatorsPension Funds &
Endowments
• HSBC
• Citi
• Credit Suisse
• UBS
• Barclays Capital
• Deutsche Bank
• ICICI
• AXIS
• Cambridge
• Associates
• New England
• Pension Consultants
• Mercer
• Towers Watson
• Blackrock
• Goldman Sachs
• J.P. Morgan
• Morgan Stanley
• State Street
• U.S. SEC
• MAS Singapore
• SFC Hong Kong
• FCA UK
• CIMA Cayman
• SEBI
• APG
• Teacher Retirement
• System of Texas
• Chicago Teachers
• Ontario Teachers
• CalPERS
• Harvard
• Management Co.
Sample Employers

Top companies seek to hire CAIA Charterholders.Sample job postings from the CAIA Career Center
International Relationship Manager. CFA, CAIA or
working toward preferred.
Equity Investment Research -Manager. CIMA, CAIA, and/or CFA charter holders or candidates will be looked favorably upon.
International Trading ManagerMBA, CFA, CAIA or CMT preferred
CAIA is Preferred
Senior Quantitative Research Analyst. CFA, CAIA, CIMA
Senior Credit SpecialistCFA / CAIA / FRM / PRM is considered highly advantageous.
Risk Management - AssociateIndustry certifications, such as a CFA, CAIA, or FRM, are a plus.

Use of CAIA marks in professional documents
Chapter educational and networking events
Global network of more than 9,000 Members
Globally-recognized designation
Education and Research at CAIA.org
Self-evaluation Tool
Ongoing Education
CAIA Career Center
One Expiration Date – May 31st
Two-Year Membership Rate (April 2016)
New Member Outreach Initiatives
Member Benefits

REBALANCE YOUR EDUCATION PORTFOLIO
™

Fundamentals of Alternative Investments
The Fundamentals of Alternative Investments certificate program provides a foundation of core concepts in
alternative investments
Fundamentals fills a critical education gap for those who need to understand the evolving landscape of alternative investments.
Online, 20-hour, self-paced course Earns CE hours for the CIMA®, CIMC®, CPWA®, CPA ®, and CFP® designations Understand the core concepts in alternative investments Gain confidence in discussing and positioning alternatives
FAI Certificate

THE WORLD IS MULTI-ASSET
27

CONTENT
Professional Development
A Dive into the Global Hedge Fund Industry
Why Alternative Investments? …. Investor Appetite
Asia Pacific Investors …. Who are they?
What’s next?
Due Diligence

Why Alternatives? …. Investors are Increasing Allocations ….

INVESTOR PORTFOLIOS BECOMING EVER MORE DIVERSIFIED
AUM
• Global asset management industry about US$98tn
• Global AI about US$15tn
• Global ETF about US$3tn
Estimated revenue to managers
• Active management about $700bn
• AI about $200bn
• ETF about $13bn
Future Proofing : Does Your Skill Set Map Today’s Industry?

INSTITUTIONAL INVESTOR ALLOCATION
Source: Preqin Investor Outlook : Alternative Assets H2 2017

WHY INVEST IN ALTERNATIVES?
Source: Preqin Investor Outlook : Alternative Assets H2 2017

WHY INVEST IN ALTERNATIVES?
Source: Preqin Investor Outlook : Alternative Assets H2 2017

INSTO INVESTORS’ PLANS FOR THE COMING YEAR
Source: Preqin Investor Outlook : Alternative Assets H2 2017

INSTO INVESTORS’ PLANS FOR THE LONGER TERM
Source: Preqin Investor Outlook : Alternative Assets H2 2017
Asia Pacific Investors - who are they …. and, which assets classes are they interested in?

TOP 10 ASIA-PACIFIC-BASED P/E & VC INVESTORS
Investor Type CountryCurrent allocation
(USD bn)
GIC Sovereign Wealth Fund Singapore31,824
China Investment Corporation Sovereign Wealth Fund China20,000
National Pension Service Public Pension Fund South Korea19,365
Hong Kong Monetary Authority Sovereign Wealth Fund Hong Kong14,312
Future Fund Sovereign Wealth Fund Australia10,852
Gopher Asset ManagementPrivate Equity Fund of
Funds ManagerChina
9,261
Asia Alternatives ManagementPrivate Equity Fund of
Funds ManagerHong Kong
8,900
China Life Insurance Insurance Company China8,733
Export-Import Bank of China Bank China6,229
Oriza HoldingsPrivate Equity Fund of
Funds ManagerChina
6,124
Source: Preqin – July, 2017 / Market Info

PRIVATE EQUITY
Source: Preqin – Private Capital : Record Setting Pace in 2017

VENTURE CAPITAL
2%
2%
4%
8%
10%
10%
10%
14%
14%
29%
35%
45%
51%
73%
0% 10% 20% 30% 40% 50% 60% 70% 80%
Interest Rates
Commodity Pricing
Public Perception of Industry
Availability/Pricing of Debt Financing
Regulation
Portfolio Management
Transparency
Ongoing Uncertainty in…
Governance
Fees
Deal Flow
Performance
Exit Environment
Pricing/Valuations
Investor Views on the Key Issues - Next 12 Months
29%
56%
15% IncreaseAllocation
MaintainAllocation
DecreaseAllocation
Allocation Intentions over the
Longer Term
Source: Preqin Investor Outlook : Alternative Assets H2 2017

Source: Preqin – July, 2017 / Market Info
TOP 10 ASIA-PACIFIC-BASED REAL ESTATE INVESTORS
Investor Type CountryCurrent allocation
(USD bn)
GIC Sovereign Wealth Fund Singapore24,752
National Pension Service Public Pension Fund South Korea21,249
Cathay Life Insurance Insurance Company Taiwan18,576
QIC Asset Manager Australia13,057
Samsung Life Insurance Insurance Company South Korea8,667
Hong Kong Monetary Authority Sovereign Wealth Fund Hong Kong8,038
AustralianSuper Superannuation Scheme Australia7,935
Fubon Life Insurance Insurance Company Taiwan6,978
Daiwa Securities Group Investment Company Japan6,976
Great Eastern Life Assurance Insurance Company Singapore6,566
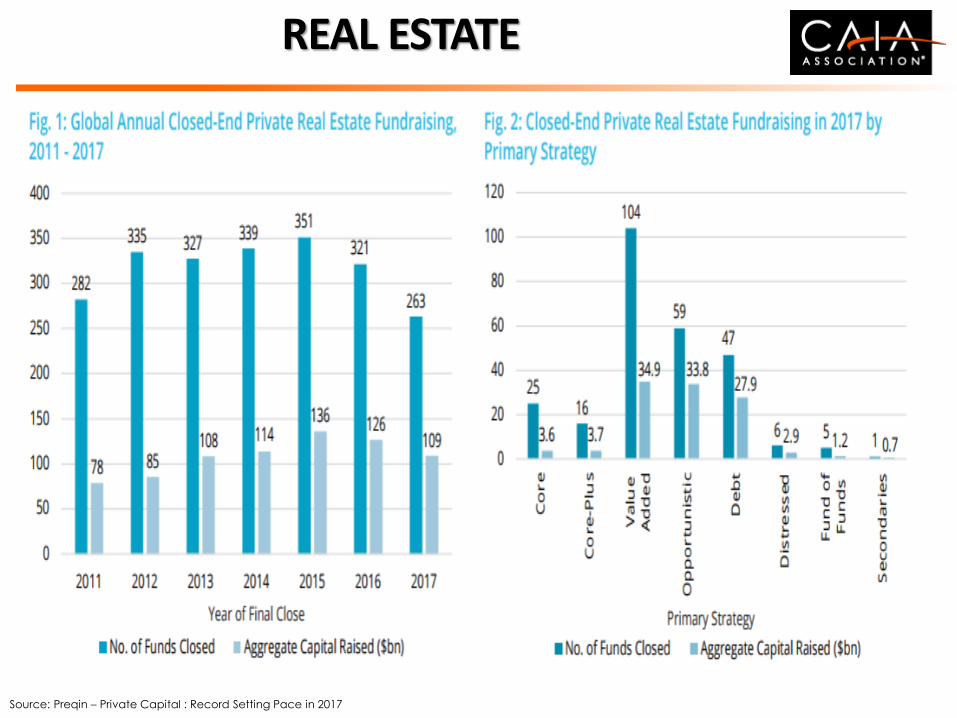
REAL ESTATE
Source: Preqin – Private Capital : Record Setting Pace in 2017

TOP 10 ASIA-PACIFIC-BASED INFRA INVESTORS
Investor Type CountryCurrent allocation
(USD bn)
National Pension Service Public Pension Fund South Korea16,434
Khazanah Nasional Sovereign Wealth Fund Malaysia8,660
AustralianSuperSuperannuation
SchemeAustralia
7,977
Future Fund Sovereign Wealth Fund Australia7,818
Fubon Life Insurance Insurance Company Taiwan5,644
QIC Asset Manager Australia5,539
Harris Fraser Wealth Manager Hong Kong5,250
Kyobo Life Insurance Insurance Company South Korea5,014
First State SuperSuperannuation
SchemeAustralia
4,558
QSuperSuperannuation
SchemeAustralia
4,371 Source: Preqin – July, 2017 / Market Info
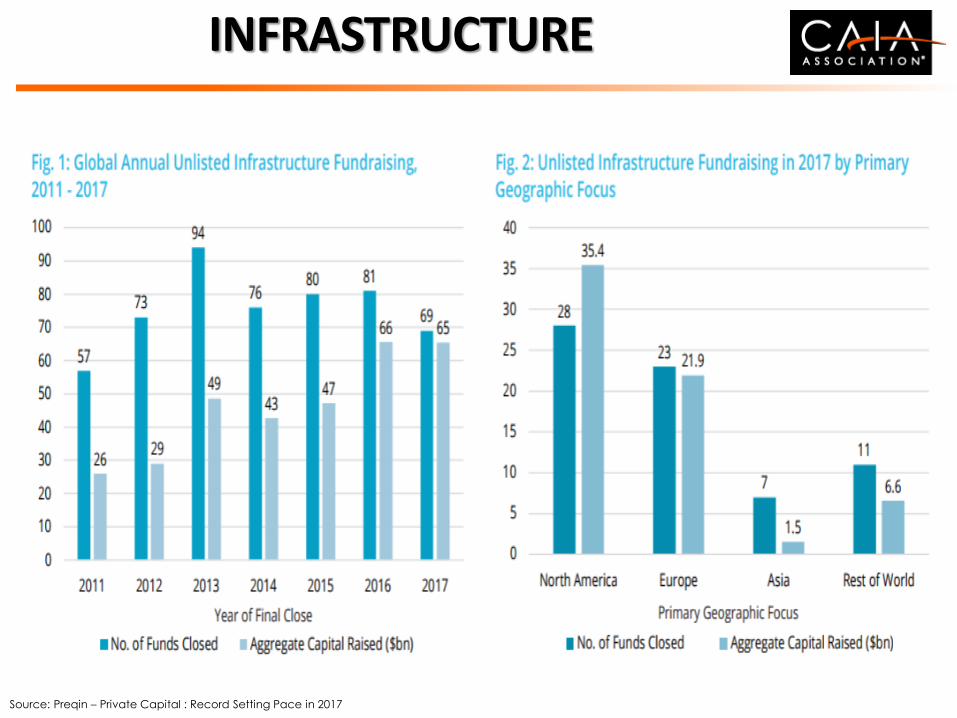
INFRASTRUCTURE
Source: Preqin – Private Capital : Record Setting Pace in 2017

TOP 10 ASIA-PACIFIC-BASED HF INVESTORS
Investor Type CountryCurrent allocation
(USD bn)
China Investment Corporation Sovereign Wealth Fund China 34.168
Future Fund Sovereign Wealth Fund Australia 15.534
GIC Sovereign Wealth Fund Singapore 10.608
Korea Investment Corporation Sovereign Wealth Fund South Korea 4.986
Pension Fund Association Asset Manager Japan 4.287
Japan Post Bank Bank Japan 4.270
Gopher Asset Management Family Office - Multi China 3.891
Dai-ichi Life Insurance Insurance Company Japan 3.042
CMBC Private Banking Wealth Manager China 2.250
Victorian Funds Management Corporation
Asset Manager Australia 2.196
Source: Preqin – July, 2017 / Market Info

HEDGE FUNDS
20%
31%
49%
Allocation Intentions over the Longer Term
IncreaseAllocation
MaintainAllocation
DecreaseAllocation
69%
56%
41%39%
31%
24%20%
19%
11% 11%
0%
10%
20%
30%
40%
50%
60%
70%
80%
Perf
orm
ance
Fees
Ongoin
g V
ola
tility
in G
lobal M
ark
ets
Public P
erc
epti
on
of
Indust
ry
Regula
tion
Nota
ble
Invest
ors
Exit
ing t
he A
sset
Cla
ss
Tra
nsp
are
ncy
Port
folio M
anagem
ent
Pri
cin
g/Valu
ati
ons
Govern
ance
Pro
port
ion o
f Resp
ondents
Investor Views on the Key Issues - Next 12 Months
Source: Preqin Investor Outlook : Alternative Assets H2 2017
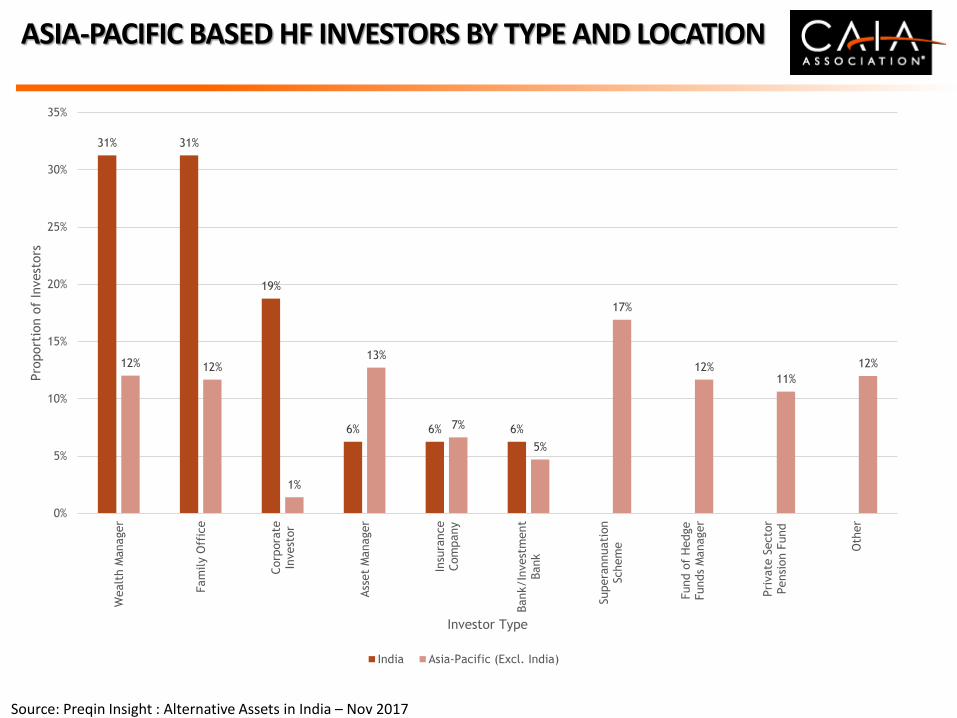
ASIA-PACIFIC BASED HF INVESTORS BY TYPE AND LOCATION
31% 31%
19%
6% 6% 6%
12% 12%
1%
13%
7%
5%
17%
12%11%
12%
0%
5%
10%
15%
20%
25%
30%
35%W
ealt
h M
anager
Fam
ily O
ffic
e
Corp
ora
teIn
vest
or
Ass
et
Manager
Insu
rance
Com
pany
Bank/In
vest
ment
Bank
Supera
nnuati
on
Schem
e
Fund o
f H
edge
Funds
Manager
Pri
vate
Secto
rPensi
on F
und
Oth
er
Pro
port
ion o
f In
vest
ors
Investor Type
India Asia-Pacific (Excl. India)
Source: Preqin Insight : Alternative Assets in India – Nov 2017

STRATEGY PREFERENCES OF AP BASED HF INVESTORS
88%
38%
13%
38%
68%
62%
40%
44%
48%
19%
67%
0%
10%
20%
30%
40%
50%
60%
70%
80%
90%
100%
Equity Strategies Macro Strategies Event DrivenStrategies
Credit Strategies Relative ValueStrategies
Niche Strategies Multi-Strategy
Pro
port
ion o
f In
vest
ors
Strategy Preference
India Asia-Pacific (Excl. India)
Source: Preqin Insight : Alternative Assets in India – Nov 2017

TOP 10 GLOBAL HEDGE FUNDS : BILLION DOLLAR CLUB
Fund Manager Location Year
EstablishedTotal AUM (USD mn)
AUM Date
Bridgewater Associates US 1975 $161,900 30-Jun-17
AQR Capital Management US 1998 $106,200 30-Jun-17
Man Group UK 1983 $57,900 30-Jun-17
J.P. Morgan Asset Management US 1974 $49,000 30-Jun-17
Renaissance Technologies US 1982 $47,900 30-Jun-17
Millennium Management US 1989 $34,300 1-Jul-17
Standard Life Investments (Part of Aberdeen Standard Investments)
UK 1998 $33,200 30-Jun-17
Och-Ziff Capital Management US 1994 $31,800 1-Jul-17
Elliott Management US 1977 $31,400 31-Dec-17
Two Sigma Investments US 2002 $30,400 1-Jan-17
Source: Preqin – October, 2017
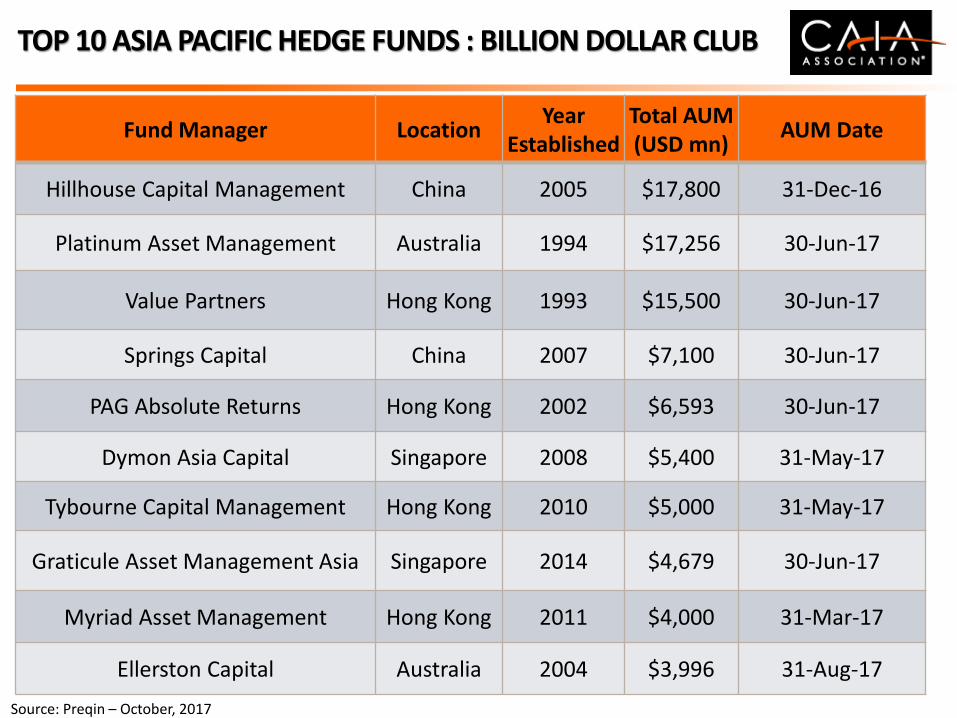
TOP 10 ASIA PACIFIC HEDGE FUNDS : BILLION DOLLAR CLUB
Fund Manager Location Year
EstablishedTotal AUM (USD mn)
AUM Date
Hillhouse Capital Management China 2005 $17,800 31-Dec-16
Platinum Asset Management Australia 1994 $17,256 30-Jun-17
Value Partners Hong Kong 1993 $15,500 30-Jun-17
Springs Capital China 2007 $7,100 30-Jun-17
PAG Absolute Returns Hong Kong 2002 $6,593 30-Jun-17
Dymon Asia Capital Singapore 2008 $5,400 31-May-17
Tybourne Capital Management Hong Kong 2010 $5,000 31-May-17
Graticule Asset Management Asia Singapore 2014 $4,679 30-Jun-17
Myriad Asset Management Hong Kong 2011 $4,000 31-Mar-17
Ellerston Capital Australia 2004 $3,996 31-Aug-17
Source: Preqin – October, 2017

TOP 10 GREATER CHINA BASED HEDGE FUNDS : BILLION DOLLAR CLUB
Fund Manager Location Year
EstablishedTotal AUM (USD mn)
AUM Date
Hillhouse Capital Management China 2005 $17,800 31-Dec-16
Value Partners Hong Kong 1993 $15,500 30-Jun-17
Springs Capital China 2007 $7,100 30-Jun-17
PAG Absolute Returns Hong Kong 2002 $6,593 30-Jun-17
Tybourne Capital Management Hong Kong 2010 $5,000 31-May-17
Myriad Asset Management Hong Kong 2011 $4,000 31-Mar-17
Symmetry Investments LP Hong Kong 2014 $3,600 1-Jul-17
Cephei Capital Management Hong Kong 2006 $3,331 30-Jun-17
Greenwoods Asset Management Hong Kong 2004 $2,688 31-Jul-17
BFAM Partners Hong Kong 2012 $2,611 31-Aug-17
Source: Preqin – October, 2017

HEDGE FUND CUMULATIVE RETURNS IN 2017
6.58%
8.36%
15.41%
0.00%
2.00%
4.00%
6.00%
8.00%
10.00%
12.00%
14.00%
16.00%
18.00%
Jan Feb Mar Apr May Jun Jul Aug Sep Oct
Cum
ula
tive N
et
Retu
rn
North America 0% Europe 0% Asia-Pacific 0%
Source: Preqin – October, 2017

GLOBAL BILLION DOLLAR CLUB - FOHF
Fund Manager Location Year EstTotal AUM (USD mn)
AUM Date
Blackstone Alternative Asset Management US 1990 $72,000 30-Jun-17
UBS Hedge Fund Solutions US 2000 $37,400 30-Jun-17
Goldman Sachs Asset Management US 1997 $29,200 30-Jun-17
Grosvenor Capital Management US 1971 $25,900 30-Jun-17
EnTrustPermal US 1971 $24,400 30-Jun-17
HSBC Alternative Investments UK 1994 $24,200 1-Jul-17
Morgan Stanley Alternative Investment Partners US 2000 $23,300 30-Jun-17
BlackRock Alternative Advisors US 1995 $22,900 1-Jul-17
PAAMCO Prisma* US 2000 $16,900 31-Dec-17
Man FRM UK 1991 $16,200 1-Jan-17
Source: Preqin – September, 2017

KEY CHALLENGES FOR FUND MANGERS
Private Equity
Venture Capital
Real Estate InfrastructureHedge Funds
Pricing Pricing Pricing Pricing Performance
Deal Flow Exit Deal Flow Deal FlowFees
Exit Performance Performance Performance Ongoing Vol

INDIA BASED ALTERNATIVE ASSETS AUM (AS AT DEC 2016)
23.6
1.4
10.2
4.4
3.3
0
5
10
15
20
25
Private Equity & VentureCapital
Hedge Funds(As at Jul-17)
Real Estate Infrastructure Private Debt
Ass
ets
under
Managem
ent
($bn)
Source: Preqin Insight : Alternative Assets in India – Nov 2017

INDIA BASED PRIVATE CAPITAL (2006 - 2016)
Source: Preqin Insight : Alternative Assets in India – Nov 2017
7.4
11.312.8 11.9
10.2 11.08.4
13.6
10.511.7
13.5
3.2
7.5
9.3 11.2 13.8
17.921.9
25.5
28.3
30.128.0
0
5
10
15
20
25
30
35
40
45
Dec-06 Dec-07 Dec-08 Dec-09 Dec-10 Dec-11 Dec-12 Dec-13 Dec-14 Dec-15 Dec-16
Ass
ets
under
Managem
ent
($bn)
Unrealized Value ($bn)
Dry Powder ($bn)

INDIA BASED PRIVATE CAPITAL FIRMS – 2000 – YTD SEPT 2017
Source: Preqin Insight : Alternative Assets in India – Nov 2017
205
16
0
50
100
150
200
250
2000 2001 2002 2003 2004 2005 2006 2007 2008 2009 2010 2011 2012 2013 2014 2015 2016 2017YTD
No
. of
Act
ive
Firm
s
Existing Firm New Firm
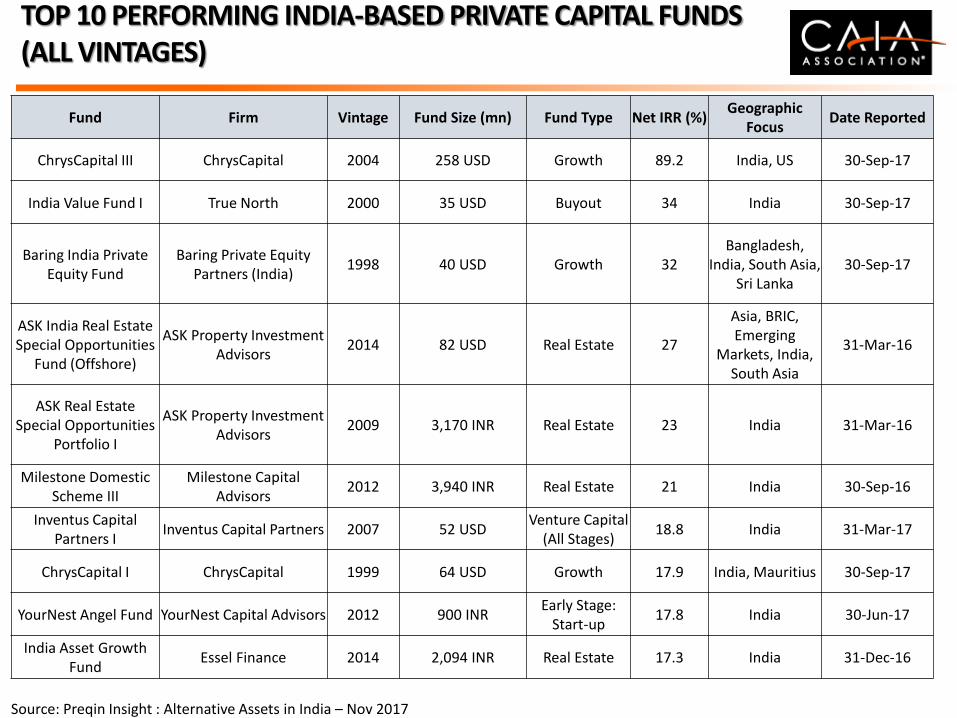
TOP 10 PERFORMING INDIA-BASED PRIVATE CAPITAL FUNDS (ALL VINTAGES)
Source: Preqin Insight : Alternative Assets in India – Nov 2017
Fund Firm Vintage Fund Size (mn) Fund Type Net IRR (%)Geographic
FocusDate Reported
ChrysCapital III ChrysCapital 2004 258 USD Growth 89.2 India, US 30-Sep-17
India Value Fund I True North 2000 35 USD Buyout 34 India 30-Sep-17
Baring India Private Equity Fund
Baring Private Equity Partners (India)
1998 40 USD Growth 32Bangladesh,
India, South Asia, Sri Lanka
30-Sep-17
ASK India Real Estate Special Opportunities
Fund (Offshore)
ASK Property Investment Advisors
2014 82 USD Real Estate 27
Asia, BRIC, Emerging
Markets, India, South Asia
31-Mar-16
ASK Real Estate Special Opportunities
Portfolio I
ASK Property Investment Advisors
2009 3,170 INR Real Estate 23 India 31-Mar-16
Milestone Domestic Scheme III
Milestone Capital Advisors
2012 3,940 INR Real Estate 21 India 30-Sep-16
Inventus Capital Partners I
Inventus Capital Partners 2007 52 USDVenture Capital
(All Stages)18.8 India 31-Mar-17
ChrysCapital I ChrysCapital 1999 64 USD Growth 17.9 India, Mauritius 30-Sep-17
YourNest Angel Fund YourNest Capital Advisors 2012 900 INREarly Stage:
Start-up17.8 India 30-Jun-17
India Asset Growth Fund
Essel Finance 2014 2,094 INR Real Estate 17.3 India 31-Dec-16

INDIA-BASED INSTITUTIONAL INVESTORS BY NUMBER OF ALTERNATIVE ASSET CLASSES INVESTED (AS AT AUG 2017)
Source: Preqin Insight : Alternative Assets in India – Nov 2017
40%
20%
13%
11%
11%
5%
None
One
Two
Three
Four
Five
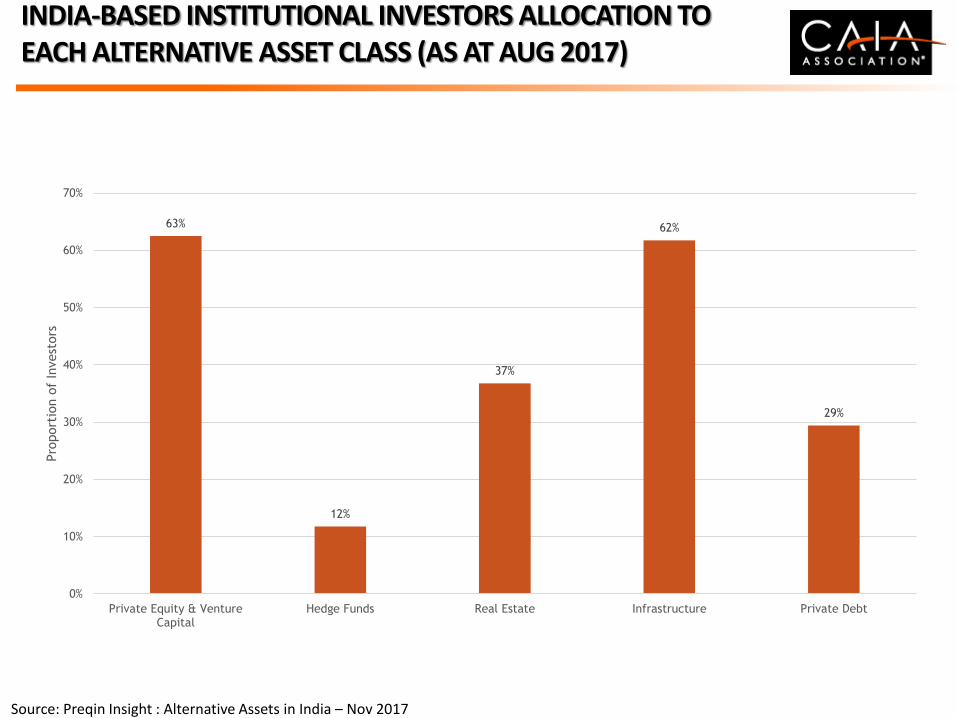
INDIA-BASED INSTITUTIONAL INVESTORS ALLOCATION TO EACH ALTERNATIVE ASSET CLASS (AS AT AUG 2017)
Source: Preqin Insight : Alternative Assets in India – Nov 2017
63%
12%
37%
62%
29%
0%
10%
20%
30%
40%
50%
60%
70%
Private Equity & VentureCapital
Hedge Funds Real Estate Infrastructure Private Debt
Pro
port
ion o
f In
vest
ors
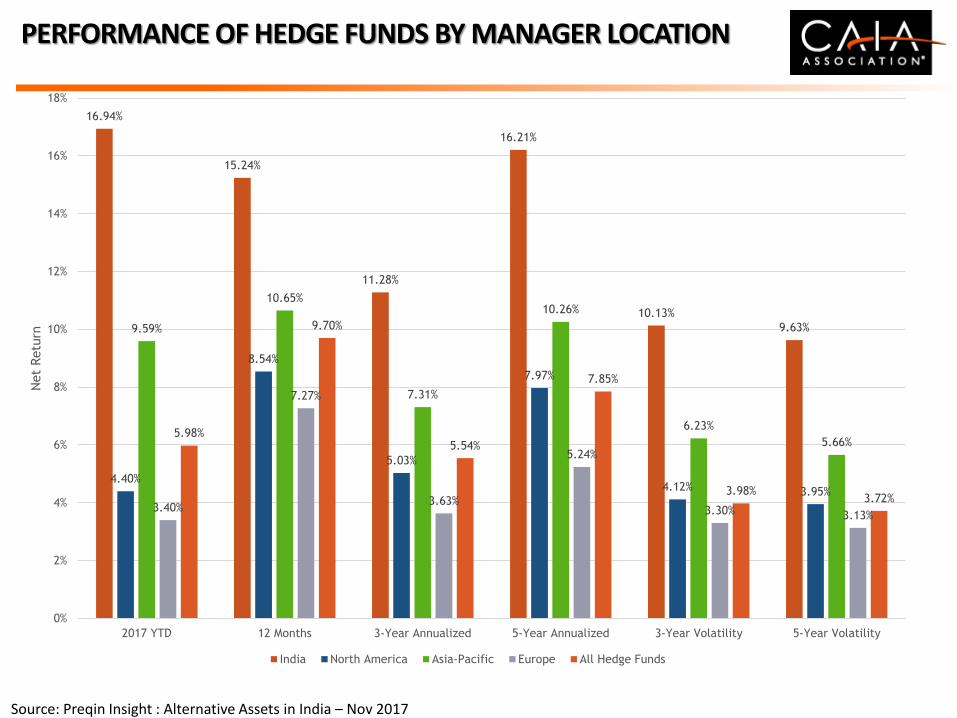
PERFORMANCE OF HEDGE FUNDS BY MANAGER LOCATION
Source: Preqin Insight : Alternative Assets in India – Nov 2017
16.94%
15.24%
11.28%
16.21%
10.13%
9.63%
4.40%
8.54%
5.03%
7.97%
4.12% 3.95%
9.59%
10.65%
7.31%
10.26%
6.23%
5.66%
3.40%
7.27%
3.63%
5.24%
3.30% 3.13%
5.98%
9.70%
5.54%
7.85%
3.98%3.72%
0%
2%
4%
6%
8%
10%
12%
14%
16%
18%
2017 YTD 12 Months 3-Year Annualized 5-Year Annualized 3-Year Volatility 5-Year Volatility
Net
Retu
rn
India North America Asia-Pacific Europe All Hedge Funds

THE WORLD IS MULTI-ASSET
61
CONTENT
Professional Development
A Dive into the Global Hedge Fund Industry
Why Alternative Investments? …. Investor Appetite
Asia Pacific Investors …. Who are they?
What’s next?
Due Diligence

A Dive into the Global Hedge Fund Industry

WHAT A HEDGE FUND IS NOT :
Numerous myths abound! : –
Hedge Funds were not the cause of the GFS in 2008, this was a banking crisis
Less than 1% of all hedge fund assets under management are from
pure/dedicated short selling
The Hedge Fund industry is regulated
The industry is NOT volatile and dangerous
Leverage levels employed by the Hedge Fund industry remains modest
The Industry is NOT shady and secretive!

The Global Financial Crisis …. How bad was it?

A RECAP : THE GREAT FINANCIAL CRISIS
Source: Altinvest

What Happened Performance Wise?
Hedge Funds ….
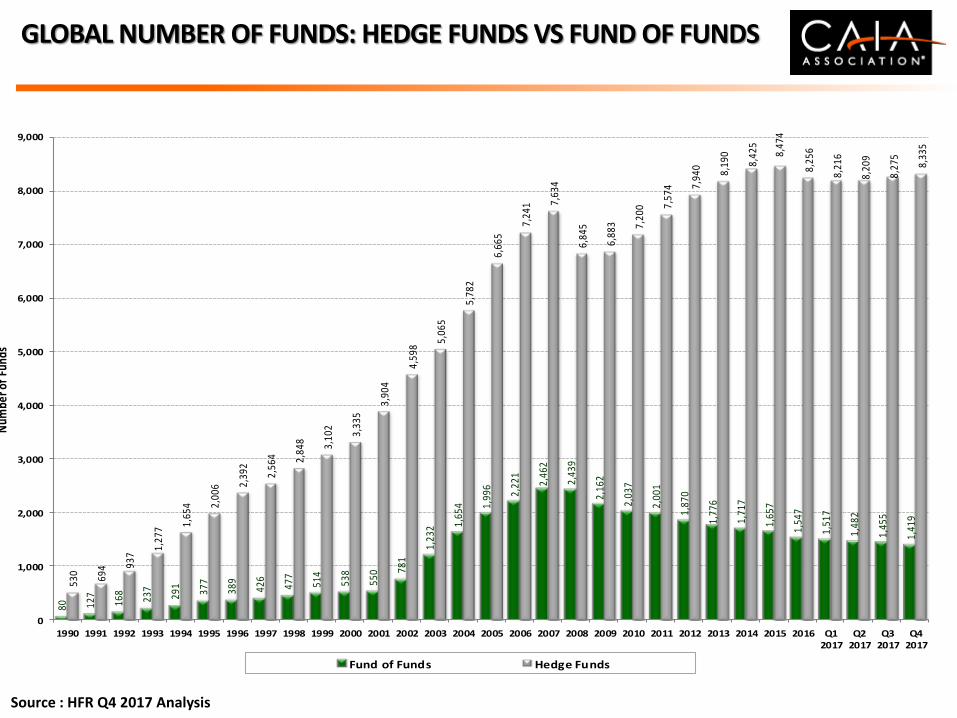
GLOBAL NUMBER OF FUNDS: HEDGE FUNDS VS FUND OF FUNDS
Source : HFR Q4 2017 Analysis
80 127
168
237
291
377
389
426
477
514
538
550 78
1
1,23
2 1,65
4 1,99
6
2,22
1
2,46
2
2,43
9
2,16
2
2,03
7
2,00
1
1,87
0
1,77
6
1,71
7
1,65
7
1,54
7
1,51
7
1,48
2
1,45
5
1,41
9
530 69
4 937
1,27
7 1,65
4 2,00
6 2,39
2
2,56
4 2,84
8 3,10
2
3,33
5
3,90
4
4,59
8
5,06
5
5,78
2
6,66
5
7,24
1 7,63
4
6,84
5
6,88
3 7,20
0 7,57
4 7,94
0 8,19
0
8,42
5
8,47
4
8,25
6
8,21
6
8,20
9
8,27
5
8,33
5
0
1,000
2,000
3,000
4,000
5,000
6,000
7,000
8,000
9,000
1990 1991 1992 1993 1994 1995 1996 1997 1998 1999 2000 2001 2002 2003 2004 2005 2006 2007 2008 2009 2010 2011 2012 2013 2014 2015 2016 Q12017
Q22017
Q32017
Q42017
Num
ber o
f Fu
nds
Fund of Funds Hedge Funds

GLOBAL HEDGE FUND - GROWTH OF ASSETS / NET ASSET FLOW
Source : HFR 4Q 2017 Analysis
$38.9 $58.4 $95.7
$167.8 $167.4
$185.8 $256.7
$367.6 $374.8
$456.4 $490.6
$539.1
$625.6
$820.0
$972.6
$1,105.4
$1,464.5
$1,868.4
$1,407.1
$1,600.2
$1,917.4
$2,008.1
$2,252.4
$2,628.3
$2,845.1 $2,896.8
$3,018.3
$3,210.7
$8.5 $27.9 $36.9
($1.1)
$14.7 $57.4
$91.4
$4.4 $55.3 $23.3 $46.5
$99.4 $70.6 $73.6 $46.9 $126.5
$194.5
($154.4)($131.2)
$55.5 $70.6
$34.4 $63.7
$76.4 $43.8
($70.1)
$9.8
($500)
$0
$500
$1,000
$1,500
$2,000
$2,500
$3,000
$3,500
1990 1991 1992 1993 1994 1995 1996 1997 1998 1999 2000 2001 2002 2003 2004 2005 2006 2007 2008 2009 2010 2011 2012 2013 2014 2015 2016 2017
Ass
ets
($BN
)
Estimated Assets Net Asset Flow

GLOBAL HF – DISTRIBUTION OF ASSETS BY FIRM AUM
By # Firms By Firm AUM Size
Source : HFR 4Q 2017 Analysis
1.01%1.76%
2.68%3.64%
22.05%
68.86%
46.11%
15.51%
10.77%
7.46%
13.70%
6.45%
< $100 Million $100 to $250 Million
$250 to $500 Million $500M to $1 Billion
$1 to $5 Billion > $5 Billion

GLOBAL HF - DISTRIBUTION OF ASSETS BY FUND AUM
By # Funds By Fund AUM Size
Source : HFR 4Q 2017 Analysis
0.08%
0.27% 0.58%1.22%
2.39%5.94%
6.80%
82.70%
56.01%
6.34%
6.26%
6.56%
6.45%
7.14%
3.73%
7.50%
< $10 Million $10 to $25 Million
$25 to $50 Million $50 to $100 Million
$100 to $200 Million $200 to $500 Million
$500M to $1 Billion > $1 Billion

GLOBAL HF – STRATEGY COMPOSITION BY AUM
Source : HFR 4Q2017 Analysis
Q4 1990 Q4 2017
Equity Hedge
37.07%
Event-Driven9.75%
Macro39.30%
Relative Value
13.88%
Equity Hedge29.26%
Event-Driven
25.90%
Macro
18.66%
Relative Value
26.18%

DISTRIBUTION OF INDUSTRY BY REGION INVESTMENT FOCUS
By # Funds By Assets
Source : HFR 4Q 2017 Analysis
Americas47.89%
Asia
13.93%
Europe10.69%
Other
27.49%
Americas
33.83%
Asia3.81%
Europe7.31%
Other55.05%
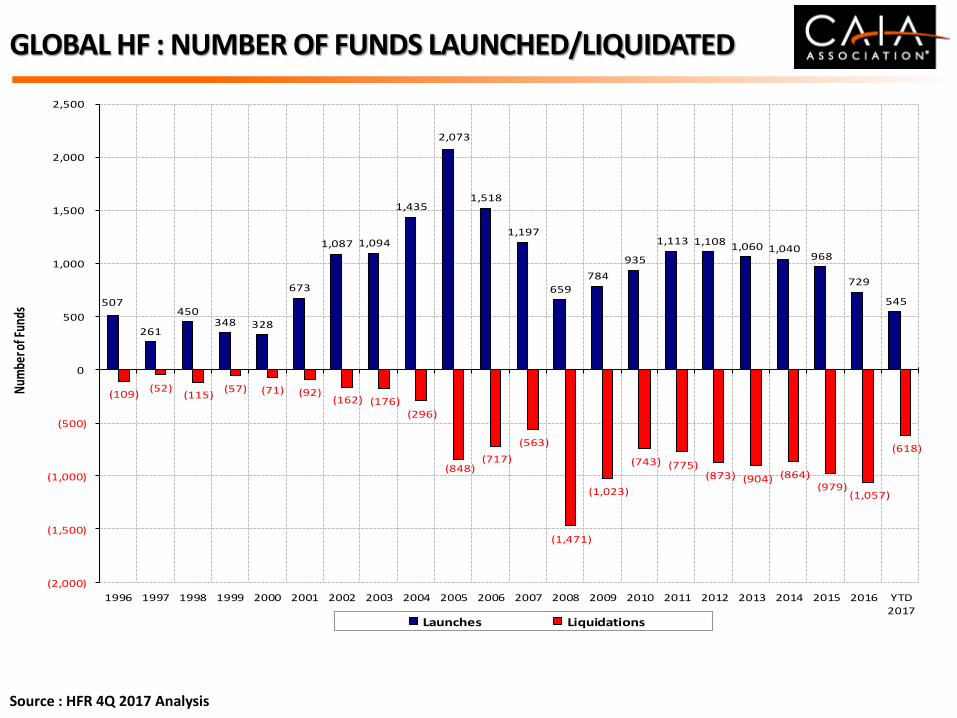
GLOBAL HF : NUMBER OF FUNDS LAUNCHED/LIQUIDATED
Source : HFR 4Q 2017 Analysis
507
261
450 348 328
673
1,087 1,094
1,435
2,073
1,518
1,197
659 784
935
1,113 1,108 1,060 1,040 968
729
545
(109)(52)
(115)(57) (71) (92)
(162) (176)(296)
(848)(717)
(563)
(1,471)
(1,023)
(743) (775)(873) (904) (864)
(979)(1,057)
(618)
(2,000)
(1,500)
(1,000)
(500)
0
500
1,000
1,500
2,000
2,500
1996 1997 1998 1999 2000 2001 2002 2003 2004 2005 2006 2007 2008 2009 2010 2011 2012 2013 2014 2015 2016 YTD2017
Num
ber o
f Fun
ds
Launches Liquidations

TOP 10 GLOBAL HEDGE FUNDS : BILLION DOLLAR CLUB
Fund Manager Location Year
EstablishedTotal AUM (USD mn)
AUM Date
Bridgewater Associates US 1975 $161,900 30-Jun-17
AQR Capital Management US 1998 $106,200 30-Jun-17
Man Group UK 1983 $57,900 30-Jun-17
J.P. Morgan Asset Management US 1974 $49,000 30-Jun-17
Renaissance Technologies US 1982 $47,900 30-Jun-17
Millennium Management US 1989 $34,300 1-Jul-17
Standard Life Investments (Part of Aberdeen Standard Investments)
UK 1998 $33,200 30-Jun-17
Och-Ziff Capital Management US 1994 $31,800 1-Jul-17
Elliott Management US 1977 $31,400 31-Dec-17
Two Sigma Investments US 2002 $30,400 1-Jan-17
Source: Preqin – October, 2017

TOP 10 ASIA PACIFIC HEDGE FUNDS : BILLION DOLLAR CLUB
Fund Manager Location Year
EstablishedTotal AUM (USD mn)
AUM Date
Hillhouse Capital Management China 2005 $17,800 31-Dec-16
Platinum Asset Management Australia 1994 $17,256 30-Jun-17
Value Partners Hong Kong 1993 $15,500 30-Jun-17
Springs Capital China 2007 $7,100 30-Jun-17
PAG Absolute Returns Hong Kong 2002 $6,593 30-Jun-17
Dymon Asia Capital Singapore 2008 $5,400 31-May-17
Tybourne Capital Management Hong Kong 2010 $5,000 31-May-17
Graticule Asset Management Asia Singapore 2014 $4,679 30-Jun-17
Myriad Asset Management Hong Kong 2011 $4,000 31-Mar-17
Ellerston Capital Australia 2004 $3,996 31-Aug-17
Source: Preqin – October, 2017

TOP 10 GREATER CHINA BASED HEDGE FUNDS : BILLION DOLLAR CLUB
Fund Manager Location Year
EstablishedTotal AUM (USD mn)
AUM Date
Hillhouse Capital Management China 2005 $17,800 31-Dec-16
Value Partners Hong Kong 1993 $15,500 30-Jun-17
Springs Capital China 2007 $7,100 30-Jun-17
PAG Absolute Returns Hong Kong 2002 $6,593 30-Jun-17
Tybourne Capital Management Hong Kong 2010 $5,000 31-May-17
Myriad Asset Management Hong Kong 2011 $4,000 31-Mar-17
Symmetry Investments LP Hong Kong 2014 $3,600 1-Jul-17
Cephei Capital Management Hong Kong 2006 $3,331 30-Jun-17
Greenwoods Asset Management Hong Kong 2004 $2,688 31-Jul-17
BFAM Partners Hong Kong 2012 $2,611 31-Aug-17
Source: Preqin – October, 2017

TOP 5 ASIA PACIFIC BASED HEDGE FUNDS
Source : Preqin – September, 2017
Fund Name Firm NameFirm
CountryInception Date
Core Strategies
RegionPrefs
CountryPrefs
Methodsof
Investment
2017 Year-to-
date Return
12-Month
3-YearAnnu
Rtn Since Incep
CSV China Opportunities
Fund
CSV Capital Partners
China 1/4/2010Long Bias,
Long/Short Equity
ChinaDebt,
Equities80.95 66.45 16.58 130.91
UG Hidden Dragon Special
Opportunity Fund - Class A
UG Investment
AdvisersTaiwan 9/28/2007
Event Driven, Long/Short
Equity, Value-Oriented
Asia ChinaEquity & Currency
Derivs57.39 50.99 35.26 232.2
TAL China Focus Fund -
Class C (Unrestricted)
Trivest Advisors
Hong Kong 7/2/2010Long/Short
EquityGlobal China
Derivs / Equities
50.57 44.41 21.21 193.99
Foundation China
Opportunity Fund
Foundation Asset
Management (HK)
Hong Kong 1/1/2007Long Bias,
Long/Short Equity
Greater China, Global
China, Hong Kong
Debt, Equities
47.14 39.3 11.68 209.88
Chinese Mainland
Focus FundValue Partners Hong Kong 11/27/2003
Long Bias, Long/Short
EquityChina
Derivs, Equities, Currency
46.52 41.25 14.24 400+

TOP 5 ASIA PACIFIC INVESTED HEDGE FUNDS
Source : Preqin – September, 2017
Fund Name Firm NameFirm
CountryInception Date
Core Strategies
RegionPrefs
CountryPrefs
Methodsof
Investment
2017 Year-to-
date Return
12-Month
3-YearAnnu
Rtn Since Incep
UG Hidden Dragon Special
Opportunity Fund - Class A
UG Investment
AdvisersTaiwan 9/28/2007
Event Driven, Long/Short
Equity, Value-Oriented
Asia ChinaDerivs & Equities
57.39 50.99 35.26 232.2
KS Asia Absolute
Return Fund ICGen2 Partners Hong Kong 1/3/2010
Long/Short Equity, Multi-
StrategyAsia
South Korea
Debt & Equities
42.22 43.5 18.26 190.78
Telligent Greater China Master Fund
Telligent Capital
ManagementHong Kong 8/1/2004
Long/Short Equity
Greater China
China, Hong Kong,
Taiwan
Derivs & Equities
40.94 23.99 7.68 341.92
Value Partners Classic Fund -C Units (RMB)
Hedged
Value Partners Hong Kong 10/28/2015Long Bias,
Long/Short Equity
Greater China, Asia
China, Hong Kong
Equities 39.22 30.4 33.77
SPQ Asia Opportunities Fund - Class B
SPQ Asia Capital
Hong Kong 12/2/2013Long/Short
EquityGreater China
Equities 37.33 36.86 13.64 76.83

TOP 5 INDIA BASED HEDGE FUNDS
Source : Preqin – December, 2017
Fund Name Firm Name Firm Country Inception Date Core StrategiesCountry
Preferences
Methods of Investment Employed
2017 Return
Since Inception
Three-Year Annualiised
Redart Focus Fund Redart Capital India Sep-09Long/Short Equity,
Value-OrientedIndia
Derivative Markets,, Options
73.51 291.03 19.96
Malabar India Fund, Ltd.
Malabar Investment
AdvisorsIndia Sep-08 Long Bias India Equities 50.03 - 18.38
Banyan India Portfolio
Banyan Capital Advisors
India May-12Long Bias, Value-
OrientedIndia Equities 48.82 131.41 14.06
Karma STAR FundKarma Capital Management
India Feb-04 Long/Short Equity India Equities 45.95 618.23 12.99
Right Horizons Minerva Funds -
India Undervalued
Right Horizons Financial Services
India Nov-10 Long Bias India Equities 41.61 205.81 13.91

TOP 5 INDIA INVESTED HEDGE FUNDS
Source : Preqin – December, 2017
Fund Name Firm Name Firm CountryInception
DateCore Strategies
Country Pref
Methods of Investment Employed
2017 Return
Since Inception
Three-Year Annualiised
Atyant Capital India Fund-I
Atyant Capital Mauritius Jul-06 Long Bias India Equities 79.87 468.05 39.41
Redart Focus Fund Redart Capital India Sep-09Long/Short Equity,
Value-OrientedIndia Derivative Markets 73.51 291.03 19.96
Tantallon India FundTantallon Capital
AdvisorsSingapore Sep-15 Long Bias India - 59.15 50.28 -
SageOne India Growth Master Fund
Lighthouse Canton
Singapore Sep-14 Long Bias India Equities 53.55 - 19.73
Alchemy India Long Term Fund
Alchemy Investment
ManagementSingapore Jun-08 Long/Short Equity India
Derivative Equities, Commodities and
Warrants50.35 239.29 18.72
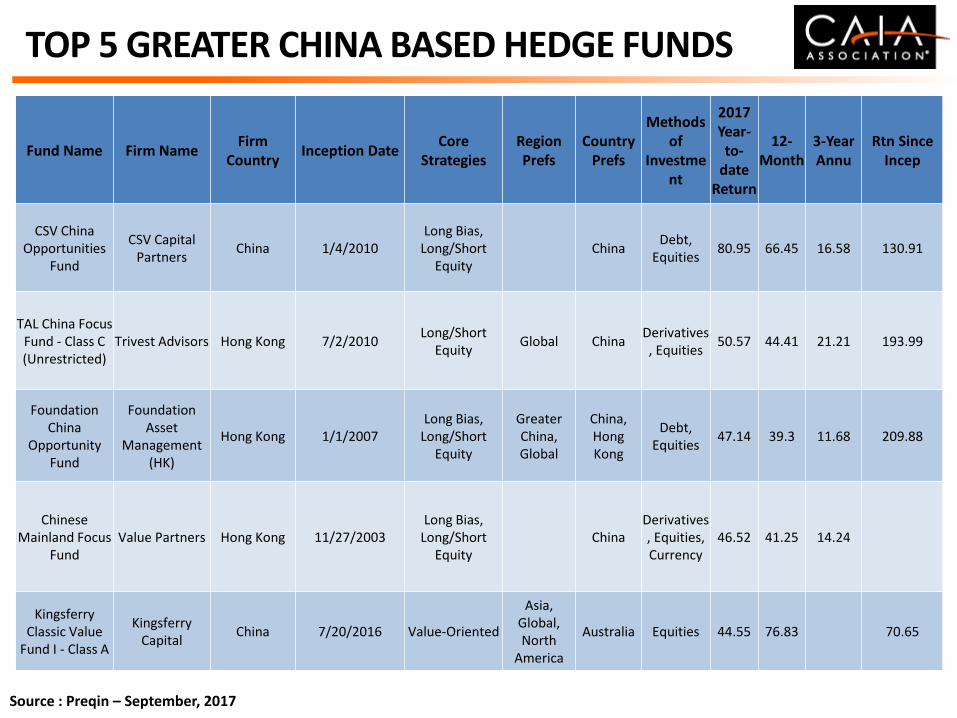
TOP 5 GREATER CHINA BASED HEDGE FUNDS
Source : Preqin – September, 2017
Fund Name Firm NameFirm
CountryInception Date
Core Strategies
RegionPrefs
CountryPrefs
Methodsof
Investment
2017 Year-to-
date Return
12-Month
3-YearAnnu
Rtn Since Incep
CSV China Opportunities
Fund
CSV Capital Partners
China 1/4/2010Long Bias,
Long/Short Equity
ChinaDebt,
Equities80.95 66.45 16.58 130.91
TAL China Focus Fund - Class C (Unrestricted)
Trivest Advisors Hong Kong 7/2/2010Long/Short
EquityGlobal China
Derivatives, Equities
50.57 44.41 21.21 193.99
Foundation China
Opportunity Fund
Foundation Asset
Management (HK)
Hong Kong 1/1/2007Long Bias,
Long/Short Equity
Greater China, Global
China, Hong Kong
Debt, Equities
47.14 39.3 11.68 209.88
Chinese Mainland Focus
FundValue Partners Hong Kong 11/27/2003
Long Bias, Long/Short
EquityChina
Derivatives, Equities, Currency
46.52 41.25 14.24
Kingsferry Classic Value
Fund I - Class A
Kingsferry Capital
China 7/20/2016 Value-Oriented
Asia, Global, North
America
Australia Equities 44.55 76.83 70.65

HFR FUND WEIGHTED COMPOSITE PERFORMANCE INDEX
0
1,000
2,000
3,000
4,000
5,000
6,000
7,000
8,000
9,000
10,000
11,000
12,000
13,000
14,000
15,000
06-1
990
12-1
990
06-1
991
12-1
991
06-1
992
12-1
992
06-1
993
12-1
993
06-1
994
12-1
994
06-1
995
12-1
995
06-1
996
12-1
996
06-1
997
12-1
997
06-1
998
12-1
998
06-1
999
12-1
999
06-2
000
12-2
000
06-2
001
12-2
001
06-2
002
12-2
002
06-2
003
12-2
003
06-2
004
12-2
004
06-2
005
12-2
005
06-2
006
12-2
006
06-2
007
12-2
007
06-2
008
12-2
008
06-2
009
12-2
009
06-2
010
12-2
010
06-2
011
12-2
011
06-2
012
12-2
012
06-2
013
12-2
013
06-2
014
12-2
014
06-2
015
12-2
015
06-2
016
12-2
016
06-2
017
12-2
017
VAM
I
HFRI Fund Weighted Composite Index S&P 500 w/ dividends Barclays Capital Government/Credit Bond Index 3-Month LIBOR USD
Index Net ROR StD Net ROR StD Net ROR StD Net ROR StD Net ROR StD
HFRI FWC 8.68 1.19 4.25 3.69 4.95 3.59 3.23 6.03 9.90 6.55
S&P 500 w/ dividends 21.80 3.93 11.39 10.06 15.77 9.49 8.49 15.06 9.80 14.20
Barclays Govt/Crdt Agg Bond 4.18 1.71 2.50 3.48 2.23 3.40 4.31 4.15 6.86 4.67
3-Month LIBOR 1.29 0.05 0.79 0.12 0.58 0.12 0.75 0.23 3.29 0.70
Since 19902017 3-Year Annualized 5-Year Annualized 10-Year Annualized
Source : HFR Q4 2017 Analysis

HFR MAIN STRATEGY INDICES PERFORMANCE ANALYSIS
Source : HFR Q4 2017 Analysis
0
1,000
2,000
3,000
4,000
5,000
6,000
7,000
8,000
9,000
10,000
11,000
12,000
13,000
14,000
15,000
16,000
17,000
18,000
19,000
20,000
21,000
22,000
23,000
06-1
990
12-1
990
06-1
991
12-1
991
06-1
992
12-1
992
06-1
993
12-1
993
06-1
994
12-1
994
06-1
995
12-1
995
06-1
996
12-1
996
06-1
997
12-1
997
06-1
998
12-1
998
06-1
999
12-1
999
06-2
000
12-2
000
06-2
001
12-2
001
06-2
002
12-2
002
06-2
003
12-2
003
06-2
004
12-2
004
06-2
005
12-2
005
06-2
006
12-2
006
06-2
007
12-2
007
06-2
008
12-2
008
06-2
009
12-2
009
06-2
010
12-2
010
06-2
011
12-2
011
06-2
012
12-2
012
06-2
013
12-2
013
06-2
014
12-2
014
06-2
015
12-2
015
06-2
016
12-2
016
06-2
017
12-2
017
VAM
I
HFRI Fund Weighted Composite Index HFRI Equity Hedge (Total) Index HFRI Event-Driven (Total) Index
HFRI Macro (Total) Index HFRI Relative Value (Total) Index
Index Net ROR StD Net ROR StD Net ROR StD Net ROR StD Net ROR StD
HFRI FWC 8.68 1.19 4.25 3.69 4.95 3.59 3.23 6.03 9.90 6.55
HFRI Equity Hedge Index 13.46 1.44 5.82 5.64 6.63 5.35 3.19 8.56 11.54 8.68
HFRI Event-Driven Index 7.73 1.68 4.73 4.73 5.49 4.31 4.17 6.44 10.45 6.51
HFRI Macro Index 2.21 2.88 0.65 3.88 1.40 3.67 1.95 4.49 10.15 7.12
HFRI Relative Value Index 5.11 1.26 4.11 2.80 4.68 2.61 4.81 4.98 9.23 4.17
Since 19902017 3-Year Annualized 5-Year Annualized 10-Year Annualized

Fund of Hedge Funds …. Dead …. Or …. Alive?
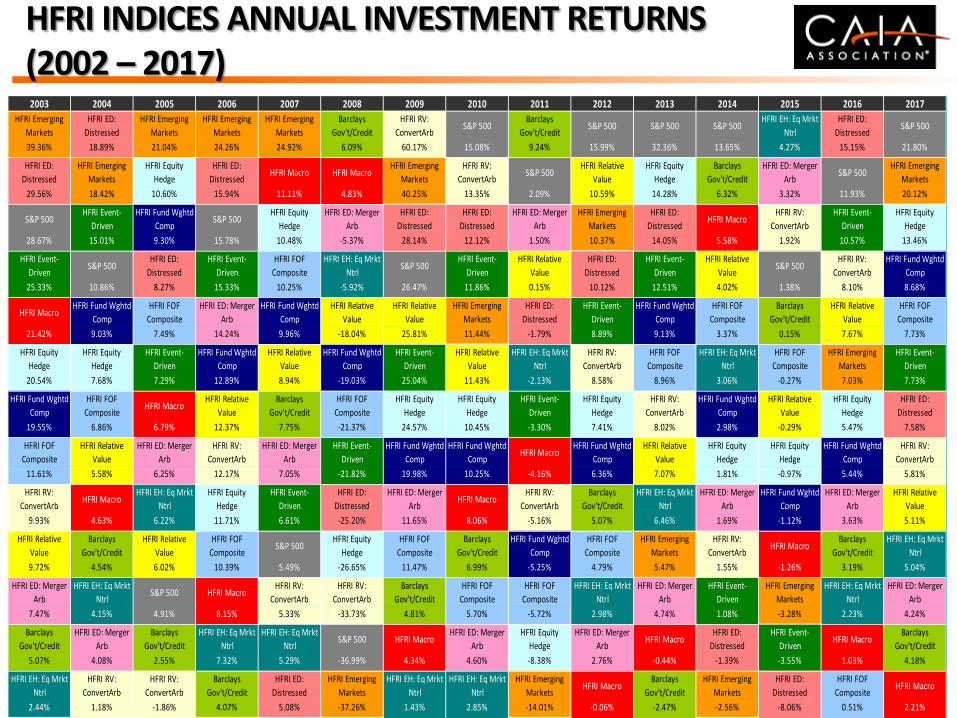
HFRI INDICES ANNUAL INVESTMENT RETURNS (2002 – 2017)
2003 2004 2005 2006 2007 2008 2009 2010 2011 2012 2013 2014 2015 2016 2017
HFRI Emerging
Markets
HFRI ED:
Distressed
HFRI Emerging
Markets
HFRI Emerging
Markets
HFRI Emerging
Markets
Barclays
Gov't/Credit
HFRI RV:
ConvertArbS&P 500
Barclays
Gov't/CreditS&P 500 S&P 500 S&P 500
HFRI EH: Eq Mrkt
Ntrl
HFRI ED:
DistressedS&P 500
39.36% 18.89% 21.04% 24.26% 24.92% 6.09% 60.17% 15.08% 9.24% 15.99% 32.36% 13.65% 4.27% 15.15% 21.80%
HFRI ED:
Distressed
HFRI Emerging
Markets
HFRI Equity
Hedge
HFRI ED:
DistressedHFRI Macro HFRI Macro
HFRI Emerging
Markets
HFRI RV:
ConvertArbS&P 500
HFRI Relative
Value
HFRI Equity
Hedge
Barclays
Gov't/Credit
HFRI ED: Merger
ArbS&P 500
HFRI Emerging
Markets
29.56% 18.42% 10.60% 15.94% 11.11% 4.83% 40.25% 13.35% 2.09% 10.59% 14.28% 6.32% 3.32% 11.93% 20.12%
S&P 500HFRI Event-
Driven
HFRI Fund Wghtd
CompS&P 500
HFRI Equity
Hedge
HFRI ED: Merger
Arb
HFRI ED:
Distressed
HFRI ED:
Distressed
HFRI ED: Merger
Arb
HFRI Emerging
Markets
HFRI ED:
DistressedHFRI Macro
HFRI RV:
ConvertArb
HFRI Event-
Driven
HFRI Equity
Hedge
28.67% 15.01% 9.30% 15.78% 10.48% -5.37% 28.14% 12.12% 1.50% 10.37% 14.05% 5.58% 1.92% 10.57% 13.46%
HFRI Event-
DrivenS&P 500
HFRI ED:
Distressed
HFRI Event-
Driven
HFRI FOF
Composite
HFRI EH: Eq Mrkt
NtrlS&P 500
HFRI Event-
Driven
HFRI Relative
Value
HFRI ED:
Distressed
HFRI Event-
Driven
HFRI Relative
ValueS&P 500
HFRI RV:
ConvertArb
HFRI Fund Wghtd
Comp
25.33% 10.86% 8.27% 15.33% 10.25% -5.92% 26.47% 11.86% 0.15% 10.12% 12.51% 4.02% 1.38% 8.10% 8.68%
HFRI MacroHFRI Fund Wghtd
Comp
HFRI FOF
Composite
HFRI ED: Merger
Arb
HFRI Fund Wghtd
Comp
HFRI Relative
Value
HFRI Relative
Value
HFRI Emerging
Markets
HFRI ED:
Distressed
HFRI Event-
Driven
HFRI Fund Wghtd
Comp
HFRI FOF
Composite
Barclays
Gov't/Credit
HFRI Relative
Value
HFRI FOF
Composite
21.42% 9.03% 7.49% 14.24% 9.96% -18.04% 25.81% 11.44% -1.79% 8.89% 9.13% 3.37% 0.15% 7.67% 7.73%
HFRI Equity
Hedge
HFRI Equity
Hedge
HFRI Event-
Driven
HFRI Fund Wghtd
Comp
HFRI Relative
Value
HFRI Fund Wghtd
Comp
HFRI Event-
Driven
HFRI Relative
Value
HFRI EH: Eq Mrkt
Ntrl
HFRI RV:
ConvertArb
HFRI FOF
Composite
HFRI EH: Eq Mrkt
Ntrl
HFRI FOF
Composite
HFRI Emerging
Markets
HFRI Event-
Driven
20.54% 7.68% 7.29% 12.89% 8.94% -19.03% 25.04% 11.43% -2.13% 8.58% 8.96% 3.06% -0.27% 7.03% 7.73%
HFRI Fund Wghtd
Comp
HFRI FOF
CompositeHFRI Macro
HFRI Relative
Value
Barclays
Gov't/Credit
HFRI FOF
Composite
HFRI Equity
Hedge
HFRI Equity
Hedge
HFRI Event-
Driven
HFRI Equity
Hedge
HFRI RV:
ConvertArb
HFRI Fund Wghtd
Comp
HFRI Relative
Value
HFRI Equity
Hedge
HFRI ED:
Distressed
19.55% 6.86% 6.79% 12.37% 7.75% -21.37% 24.57% 10.45% -3.30% 7.41% 8.02% 2.98% -0.29% 5.47% 7.58%
HFRI FOF
Composite
HFRI Relative
Value
HFRI ED: Merger
Arb
HFRI RV:
ConvertArb
HFRI ED: Merger
Arb
HFRI Event-
Driven
HFRI Fund Wghtd
Comp
HFRI Fund Wghtd
CompHFRI Macro
HFRI Fund Wghtd
Comp
HFRI Relative
Value
HFRI Equity
Hedge
HFRI Equity
Hedge
HFRI Fund Wghtd
Comp
HFRI RV:
ConvertArb
11.61% 5.58% 6.25% 12.17% 7.05% -21.82% 19.98% 10.25% -4.16% 6.36% 7.07% 1.81% -0.97% 5.44% 5.81%
HFRI RV:
ConvertArbHFRI Macro
HFRI EH: Eq Mrkt
Ntrl
HFRI Equity
Hedge
HFRI Event-
Driven
HFRI ED:
Distressed
HFRI ED: Merger
ArbHFRI Macro
HFRI RV:
ConvertArb
Barclays
Gov't/Credit
HFRI EH: Eq Mrkt
Ntrl
HFRI ED: Merger
Arb
HFRI Fund Wghtd
Comp
HFRI ED: Merger
Arb
HFRI Relative
Value
9.93% 4.63% 6.22% 11.71% 6.61% -25.20% 11.65% 8.06% -5.16% 5.07% 6.46% 1.69% -1.12% 3.63% 5.11%
HFRI Relative
Value
Barclays
Gov't/Credit
HFRI Relative
Value
HFRI FOF
CompositeS&P 500
HFRI Equity
Hedge
HFRI FOF
Composite
Barclays
Gov't/Credit
HFRI Fund Wghtd
Comp
HFRI FOF
Composite
HFRI Emerging
Markets
HFRI RV:
ConvertArbHFRI Macro
Barclays
Gov't/Credit
HFRI EH: Eq Mrkt
Ntrl
9.72% 4.54% 6.02% 10.39% 5.49% -26.65% 11.47% 6.99% -5.25% 4.79% 5.47% 1.55% -1.26% 3.19% 5.04%
HFRI ED: Merger
Arb
HFRI EH: Eq Mrkt
NtrlS&P 500 HFRI Macro
HFRI RV:
ConvertArb
HFRI RV:
ConvertArb
Barclays
Gov't/Credit
HFRI FOF
Composite
HFRI FOF
Composite
HFRI EH: Eq Mrkt
Ntrl
HFRI ED: Merger
Arb
HFRI Event-
Driven
HFRI Emerging
Markets
HFRI EH: Eq Mrkt
Ntrl
HFRI ED: Merger
Arb
7.47% 4.15% 4.91% 8.15% 5.33% -33.73% 4.81% 5.70% -5.72% 2.98% 4.74% 1.08% -3.28% 2.23% 4.24%
Barclays
Gov't/Credit
HFRI ED: Merger
Arb
Barclays
Gov't/Credit
HFRI EH: Eq Mrkt
Ntrl
HFRI EH: Eq Mrkt
NtrlS&P 500 HFRI Macro
HFRI ED: Merger
Arb
HFRI Equity
Hedge
HFRI ED: Merger
ArbHFRI Macro
HFRI ED:
Distressed
HFRI Event-
DrivenHFRI Macro
Barclays
Gov't/Credit
5.07% 4.08% 2.55% 7.32% 5.29% -36.99% 4.34% 4.60% -8.38% 2.76% -0.44% -1.39% -3.55% 1.03% 4.18%
HFRI EH: Eq Mrkt
Ntrl
HFRI RV:
ConvertArb
HFRI RV:
ConvertArb
Barclays
Gov't/Credit
HFRI ED:
Distressed
HFRI Emerging
Markets
HFRI EH: Eq Mrkt
Ntrl
HFRI EH: Eq Mrkt
Ntrl
HFRI Emerging
MarketsHFRI Macro
Barclays
Gov't/Credit
HFRI Emerging
Markets
HFRI ED:
Distressed
HFRI FOF
CompositeHFRI Macro
2.44% 1.18% -1.86% 4.07% 5.08% -37.26% 1.43% 2.85% -14.01% -0.06% -2.47% -2.56% -8.06% 0.51% 2.21%

HEDGE FUND STRATEGY CLASSIFICATION TREE
Single-Manager Hedge Funds
Special Situations
Activist
Credit Arbitrage
Distressed /Restructuring
Merger Arbitrage
Private Issue /Regulation D
Multi-Strategy
DiscretionaryThematic
Active Trading
Commodity
Agriculture
Energy
SystematicDiversified
Currency
Discretionary
Systematic
Multi-Strategy
Short Bias
Equity Market Neutral
FundamentalGrowth
FundamentalValue
QuantitativeDirectional
Sector
Energy / Basic Materials
Technology /Healthcare
Multi-Strategy
Equity Hedge MacroEvent-Driven
Metals
Multi
EnergyInfrastructure
Real Estate
Relative Value
Fixed Income –Asset Backed
Fixed Income –Convertible Arbitrage
Fixed Income –Corporate
Fixed Income –Sovereign
Volatility
Yield Alternatives
Multi-Strategy
Multi-Manager Funds
Fund of Funds
Conservative
Diversified
Market Defensive
Strategic
Equity Hedge MacroEvent-Driven Relative Value
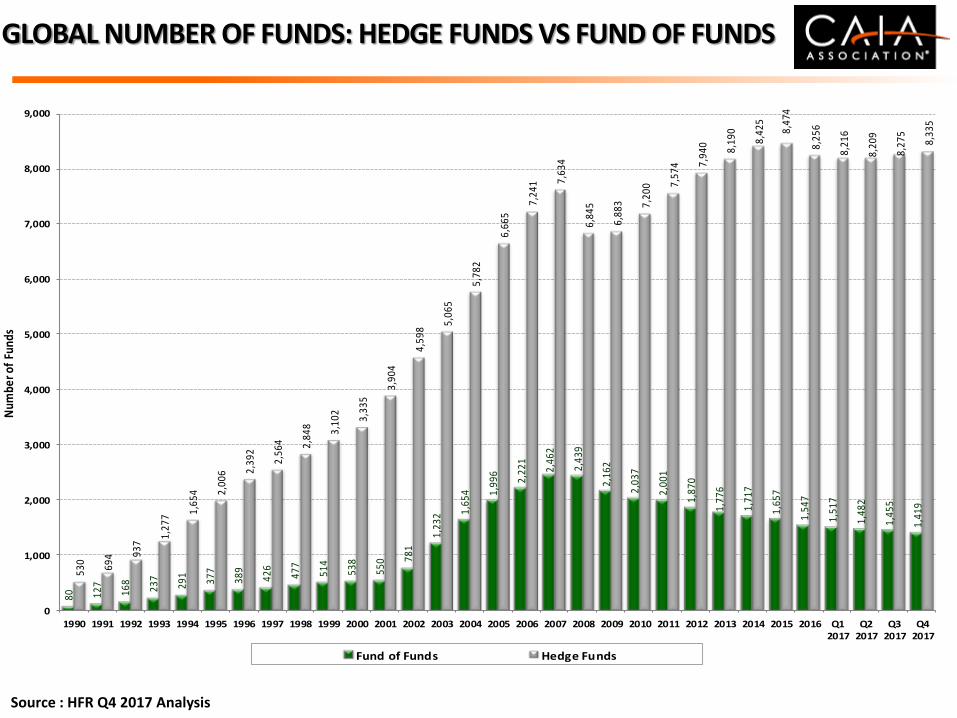
GLOBAL NUMBER OF FUNDS: HEDGE FUNDS VS FUND OF FUNDS
Source : HFR Q4 2017 Analysis
80 127
168
237
291
377
389
426
477
514
538
550 78
1
1,23
2 1,65
4 1,99
6
2,22
1
2,46
2
2,43
9
2,16
2
2,03
7
2,00
1
1,87
0
1,77
6
1,71
7
1,65
7
1,54
7
1,51
7
1,48
2
1,45
5
1,41
9
530
694 93
7
1,27
7 1,65
4 2,00
6 2,39
2
2,56
4 2,84
8 3,10
2
3,33
5
3,90
4
4,59
8
5,06
5
5,78
2
6,66
5
7,24
1 7,63
4
6,84
5
6,88
3 7,20
0 7,57
4 7,94
0 8,19
0
8,42
5
8,47
4
8,25
6
8,21
6
8,20
9
8,27
5
8,33
5
0
1,000
2,000
3,000
4,000
5,000
6,000
7,000
8,000
9,000
1990 1991 1992 1993 1994 1995 1996 1997 1998 1999 2000 2001 2002 2003 2004 2005 2006 2007 2008 2009 2010 2011 2012 2013 2014 2015 2016 Q12017
Q22017
Q32017
Q42017
Num
ber o
f Fu
nds
Fund of Funds Hedge Funds

GLOBAL FOHF - GROWTH OF ASSETS / NET ASSET FLOW
Source : HFR Q4 2017 Analysis
$1.9
$19.9 $36.8
$75.4 $74.6
$56.3 $52.5
$74.0 $75.8
$76.1 $83.5
$102.5
$206.9
$293.3
$358.6
$394.6
$655.9
$798.6
$593.2 $571.3
$646.3
$629.6 $638.2
$663.1 $673.3
$657.4
$632.8 $637.5
$631.5 $639.4 $645.6
$15.4 $14.8 $28.5
($0.8)
($16.2)($3.3)
$18.0 $1.8 $0.2 $7.1
$18.5
$103.4
$59.4
$33.2 $9.5
$49.7 $59.2
($40.9)
($118.4)
($11.8)($7.9)
($22.2)
($20.2)($4.1)
($14.8)($26.4)
($6.0) ($8.1) ($4.3) ($3.0)
($200)
$0
$200
$400
$600
$800
$1,000
1990 1991 1992 1993 1994 1995 1996 1997 1998 1999 2000 2001 2002 2003 2004 2005 2006 2007 2008 2009 2010 2011 2012 2013 2014 2015 2016 Q12017
Q22017
Q32017
Q42017
Ass
ets
($BN
)
Estimated Assets Net Asset Flow

GLOBAL FOHF – QUARTERLY PERFORMANCE
Source : HFR Q4 2017 Analysis
4.97
(0
.58)
(10.
02)
1.04
3.
29
7.08
0.
72
13.5
2 7.
08
(2.2
1)0.
60
(1.1
9)0.
73 1.54
(1
.83)
2.38
0.
98
0.20
(1
.45)
1.32
1.
15
4.01
2.
25
3.74
3.
16
(1.5
1)0.
29
4.86
0.
80
0.16
4.
18
2.20
5.
00
(0.7
8)0.
53
5.40
3.
16
4.53
0.
27
1.97
(4
.24)
1.90
(1
0.41
)(1
0.05
)0.
37
4.81
4.
43
1.47
1.
41
(2.5
9)3.
27
3.62
0.
88
(1.1
8)(4
.98)
(0.4
7)3.
37
(2.3
1)2.
42
1.32
3.
32
0.05
1.
67
3.67
0.
56 1.
54
0.28
0.
95
2.50
0.
21
(3.6
0)0.
73
(3.1
2)0.
56
2.29
0.
86
2.38
0.
81
2.32
2.
02
(15.00)
(10.00)
(5.00)
0.00
5.00
10.00
15.00
Q1-
1998
Q2-
1998
Q3-
1998
Q4-
1998
Q1-
1999
Q2-
1999
Q3-
1999
Q4-
1999
Q1-
2000
Q2-
2000
Q3-
2000
Q4-
2000
Q1-
2001
Q2-
2001
Q3-
2001
Q4-
2001
Q1-
2002
Q2-
2002
Q3-
2002
Q4-
2002
Q1-
2003
Q2-
2003
Q3-
2003
Q4-
2003
Q1-
2004
Q2-
2004
Q3-
2004
Q4-
2004
Q1-
2005
Q2-
2005
Q3-
2005
Q4-
2005
Q1-
2006
Q2-
2006
Q3-
2006
Q4-
2006
Q1-
2007
Q2-
2007
Q3
2007
Q4
2007
Q1-
2008
Q2-
2008
Q3-
2008
Q4-
2008
Q1-
2009
Q2-
2009
Q3-
2009
Q4-
2009
Q1-
2010
Q2-
2010
Q3-
2010
Q4-
2010
Q1-
2011
Q2-
2011
Q3-
2011
Q4-
2011
Q1-
2012
Q2-
2012
Q3-
2012
Q4-
2012
Q1-
2013
Q2-
2013
Q3-
2013
Q4-
2013
Q1-
2014
Q2-
2014
Q3-
2014
Q4-
2014
Q1-
2015
Q2-
2015
Q3-
2015
Q4-
2015
Q1-
2016
Q2-
2016
Q3-
2016
Q4-
2016
Q1-
2017
Q2-
2017
Q3-
2017
Q4-
2017
Retu
rn %

GLOBAL BILLION DOLLAR CLUB - FOHF
Fund Manager Location Year EstTotal AUM (USD mn)
AUM Date
Blackstone Alternative Asset Management US 1990 $72,000 30-Jun-17
UBS Hedge Fund Solutions US 2000 $37,400 30-Jun-17
Goldman Sachs Asset Management US 1997 $29,200 30-Jun-17
Grosvenor Capital Management US 1971 $25,900 30-Jun-17
EnTrustPermal US 1971 $24,400 30-Jun-17
HSBC Alternative Investments UK 1994 $24,200 1-Jul-17
Morgan Stanley Alternative Investment Partners US 2000 $23,300 30-Jun-17
BlackRock Alternative Advisors US 1995 $22,900 1-Jul-17
PAAMCO Prisma* US 2000 $16,900 31-Dec-17
Man FRM UK 1991 $16,200 1-Jan-17
Source: Preqin – September, 2017

CONTENT
Professional Development
A Dive into the Global Hedge Fund Industry
Why Alternative Investments? …. Investor Appetite
Asia Pacific Investors …. Who are they?
What’s next?
Due Diligence

Due Diligence

DUE DILIGENCE
Increased scrutinyIncreased fiduciary responsibility
Increased time and resource requirementsIncreased regulatory burdenIncreased potential liability
Increased accountabilityIncreased Cost
Leading to ….
How have due diligence requirements changed since 2008?

Operational Due Diligence Investment and Risk Due Diligence
Compliance Manual (including KYC checks, Money
Laundering procedures, trade errors, soft
commission policies etc.)
Prime Brokerage Agreement
Fund Administrator Agreement
Investment Management Agreement
Business Continuity documentation
Company accounts for last three years
Projected Budget for the next 5 years
Trading and Portfolio management system
verification
Authorisation, execution, confirmation,
settlement, reconciliation and accounting
policies. (Need for adequate segregation of
duties)
Detailed valuation policies or a pricing matrix
(maintaining transparency, consistency and
oversight)
Counterparty risk
Key person risk and insurance
DDQ
Prospectus
Fund Presentation
Risk Limits
Kroll reports and character references
Analysis of Market and product Liquidity,
volatility and credit risks
Modelling performance can be difficult:
Downside deviation, correlation, variance,
volatility, VAR, Sortino and Sharpe ratios
Back testing
Scenario analysis
Consistent approach to portfolio management
Definition and measurement of risk to the
portfolio
Investment in Non-listed Instruments
Best Execution
Conflicts of interest
Stock Borrowing
Personal Account Dealing
Investment Decision-making Process
Risk without return Risk with return
DUE DILIGENCE REQUIREMENTS WHEN INVESTING IN HEDGE FUNDS

CONTENT
Professional Development
A Dive into the Global Hedge Fund Industry
Why Alternative Investments? …. Investor Appetite
Asia Pacific Investors …. Who are they?
What’s next?
Due Diligence

Professional Business Education & Development

What’s needed to navigate and succeed in a complex workplace?
Our industry is shrinking – how does one stand out and survive?
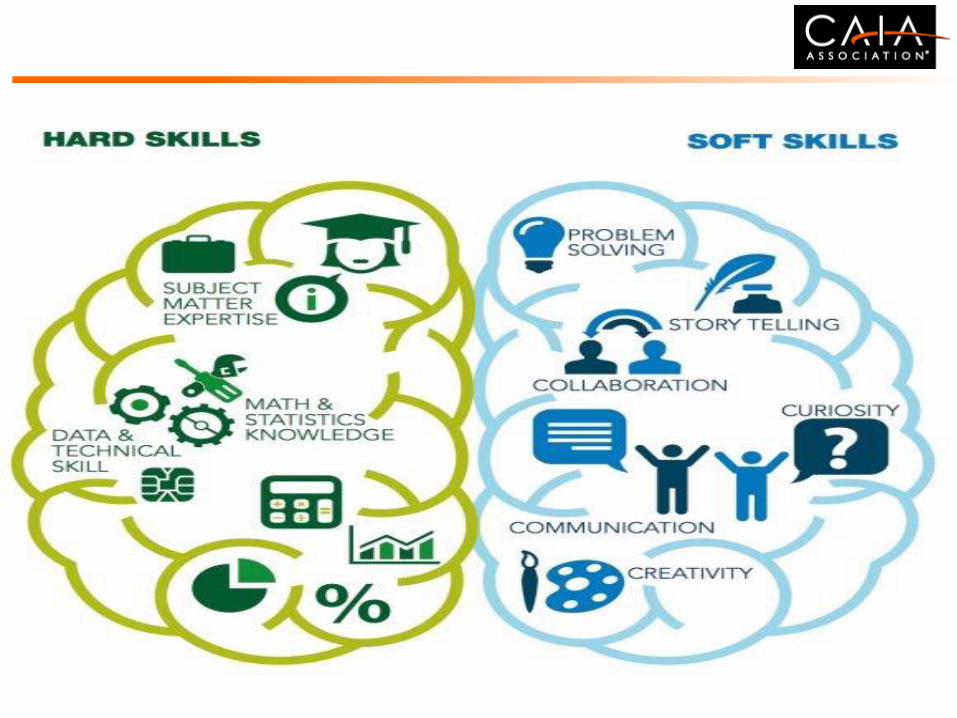
FINANCIAL SERVICES SKILLS

100


THE FINANCIAL SERVICE INDUSTRY IS SHRINKING
The number of Bloomberg terminals fell in 2016 for only the second time since the company was founded in 1981.
“A lot of the vendors [of financial information] are facing headwinds… The combination of machines replacing traders where they can and cutbacks overall in
financial institutions in terms of budgets has made it difficult for all vendors to maintain [terminal numbers].”
Financial Times – March, 2017
Stand Out To Survive!

THE FINANCIAL SERVICE INDUSTRY IS SHRINKING
Lawrence Wong: Minister for National Development, Singapore, 2016:
…. it’s very clear that the next decade will be a highly disruptive one for financial institutions worldwide …. will
have a significant bearing on the scale and nature of financial sector jobs in all financial centres …. FinTech alone will
impact one-third of employees at traditional banks over the next 10 years…we must all have a greater sense of urgency
towards reskilling, upskilling, and acquiring new skills.
The mindset must be:
“Train today, prepare for tomorrow”
CFA INSTITUTE – APRIL, 2017
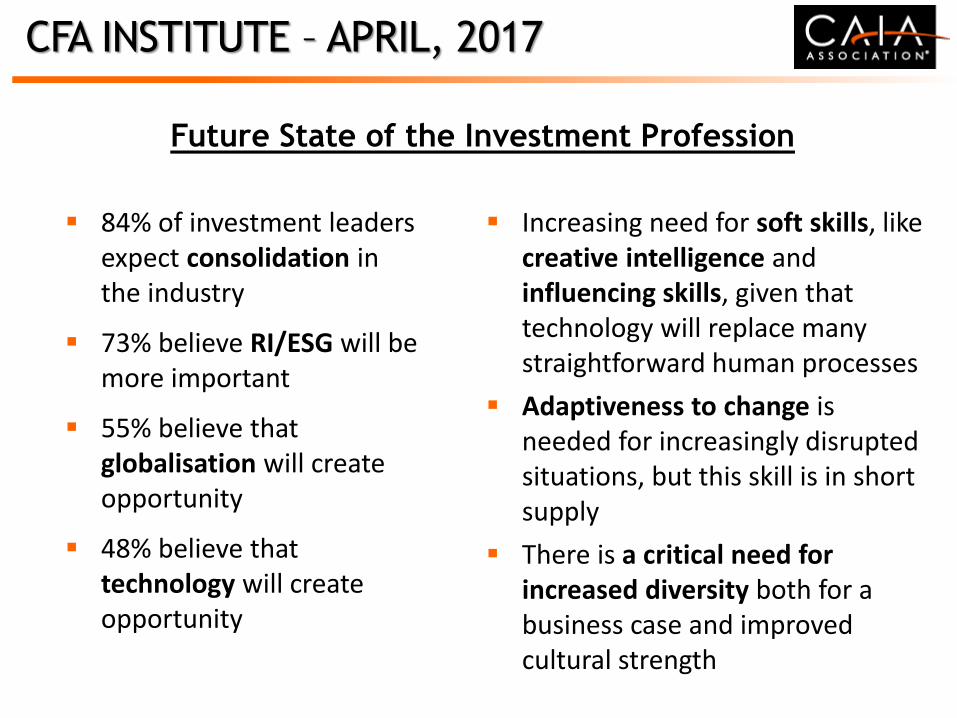
Future State of the Investment Profession
84% of investment leaders expect consolidation in the industry
73% believe RI/ESG will be more important
55% believe that globalisation will create opportunity
48% believe that technology will create opportunity
Increasing need for soft skills, like creative intelligence and influencing skills, given that technology will replace many straightforward human processes
Adaptiveness to change is needed for increasingly disrupted situations, but this skill is in short supply
There is a critical need for increased diversity both for a business case and improved cultural strength
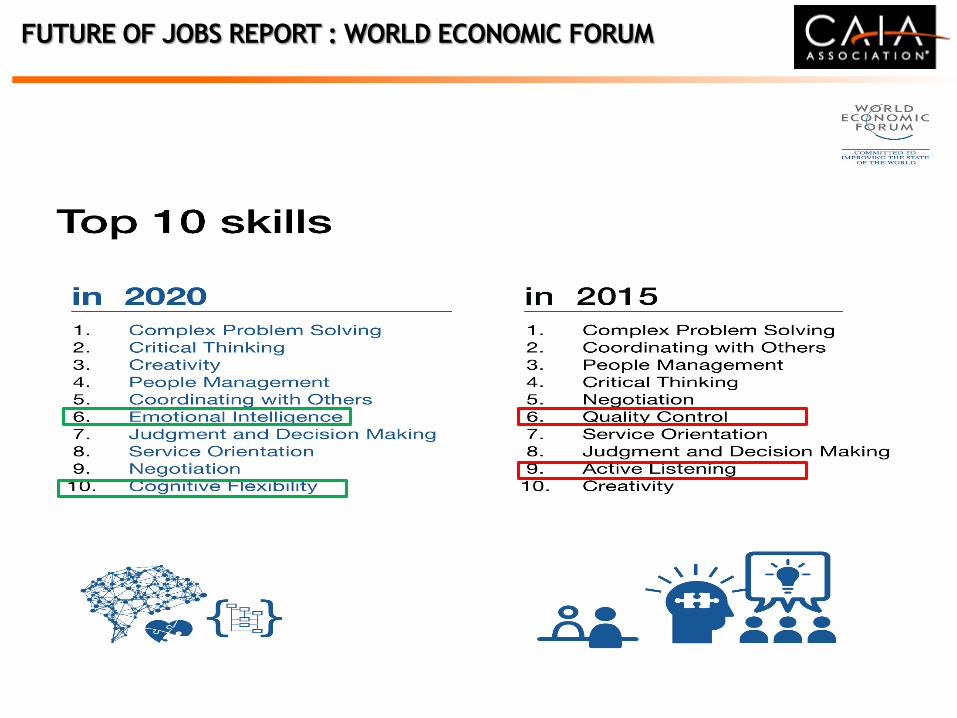
FUTURE OF JOBS REPORT : WORLD ECONOMIC FORUM

PROFESSIONAL DESIGNATIONS : THERE ARE A
LOT OF THEM!
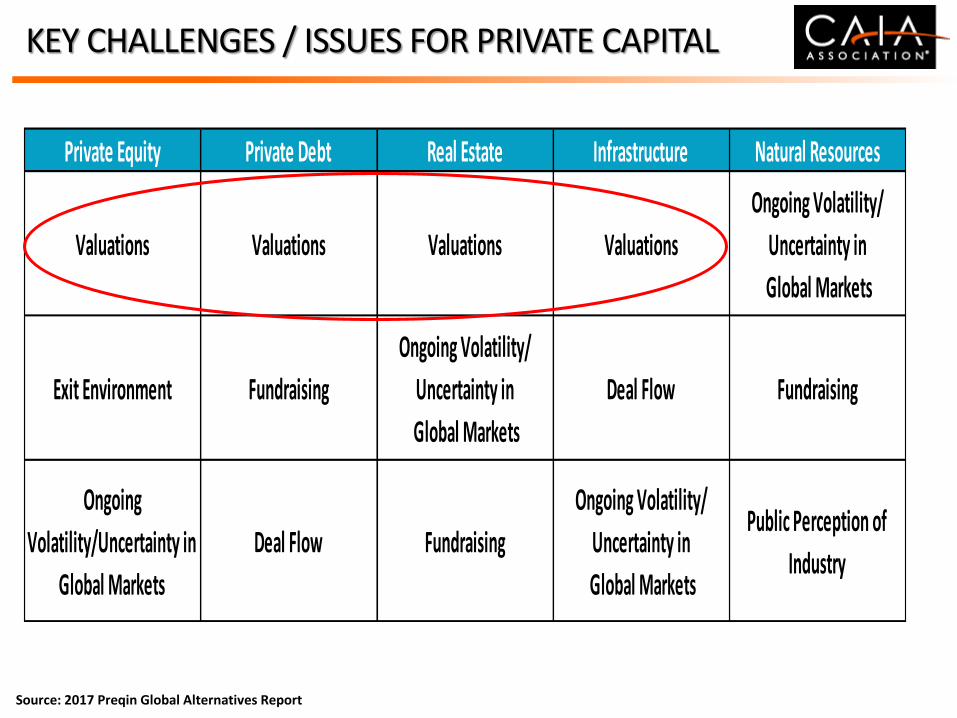
Source: 2017 Preqin Global Alternatives Report
Private Equity Private Debt Real Estate Infrastructure Natural Resources
Valuations Valuations Valuations Valuations
Ongoing Volatility/
Uncertainty in
Global Markets
Exit Environment Fundraising
Ongoing Volatility/
Uncertainty in
Global Markets
Deal Flow Fundraising
Ongoing
Volatility/Uncertainty in
Global Markets
Deal Flow Fundraising
Ongoing Volatility/
Uncertainty in
Global Markets
Public Perception of
Industry
KEY CHALLENGES / ISSUES FOR PRIVATE CAPITAL

CHINA ACCOUNTS FOR 21% OF ALL DEALS AND 36% OF AGGREGATE DEAL VALUE …. NOTE SIZE OF INDIA!
0
2,000
4,000
6,000
8,000
10,000
12,000
2007 2008 2009 2010 2011 2012 2013 2014 2015 2016
No
. o
f D
ea
ls
North America Europe Greater China India Israel Other
Source: Preqin Online Research Centre
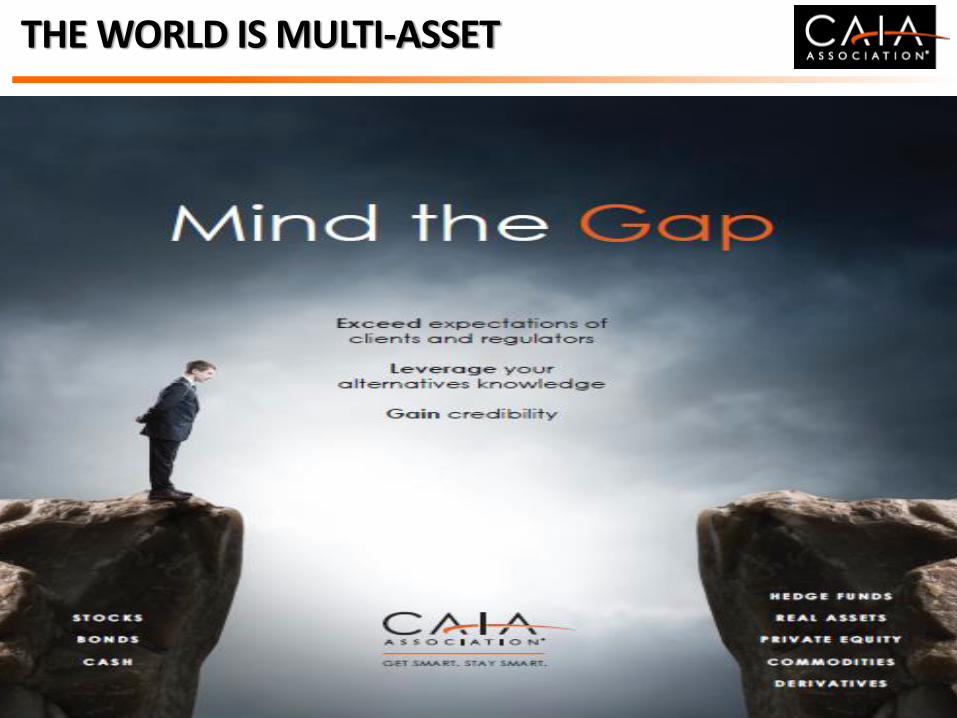
THE WORLD IS MULTI-ASSET
113

CONTENT
Professional Development
A Dive into the Global Hedge Fund Industry
Why Alternative Investments? …. Investor Appetite
Asia Pacific Investors …. Who are they?
What’s next?
Due Diligence

Key Takeaways …. Crystal Ball Time!
KEY TAKEAWAYS
The Alternative Investment industry is a major component of the institutional investment landscape both for asset owners, and the financial services industry ….
…. Think multi-asset competency
Excellent long-term returns have driven rapid AUM growth
Asset owners are moving to diversify more effectively through multi-asset investment, and collect more reliable returns through illiquidity premia
Asset owners are moving to diversify more effectively through multi-asset investment, and collect more reliable returns through illiquidity premia
Continuing rapid evolution of industry – strategies / structures / regions / investors / regulations etc.
Stand Out To Survive!

KEY TAKEAWAYS
Distinct investor motivations across different alternative asset classes
Excellent long-term returns have driven rapid AUM growth
PE mature, still growing strongly Infrastructure and private debt less mature, tremendous growth
prospects Natural Resources currently challenged
Current valuations high; investors and fund managers alike cautious about forward-looking prospects
But committed to further increasing allocations – risk/reward attractive as ever
Continuing rapid evolution of industry – strategies / structures / regions / investors / regulations etc.
Stand Out To Survive!
WHAT’S NEXT FOR ALTERNATIVE INVESTMENTS?
Alternatives assets industry is bigger than ever
Industry continues to bifurcate
Investors are – much! – smarter and wholly committed to AI
Asian Institutional and HNWI continue to evolve …. dominate?
Excellent long-term returns have driven rapid AUM growth
Multi-Asset competency …. a must!
Foresee a continuing – and rapid - evolution of the industry
Opportunity : Equip Oneself With Appropriate Knowledge and a Solid Skillset


Thank You!

THE WORLD IS MULTI-ASSET
121