Embed Size (px)
Citation preview


Contents
Corporate 02 Our History04 Vision and Mission06 Corporate Strategy07 Strategic Goals08 Code of Conduct10 Company Information11 Organogram12 Profile of the Board18 Financial Highlights22 Horizontal & Vertical Analysis25 Notice of Annual General Meeting26 Chairman’s Review28 A Word From the Chief Executive30 Directors’ Report
Financials 54 Statement of Compliance56 Review Report to the Members57 Auditors’ Report to the Members58 Balance Sheet60 Profit and Loss Account61 Statement of Comprehensive Income62 Cash Flow Statement63 Statement of Changes in Equity64 Notes to the Financial Statements96 Pattern of Shareholding Form of Proxy
Annual Report of Fauji Fertilizer Bin Qasim Limited for the year ended 2012
| 1

Our History
1993 Incorporation of the company
1996 Listed with Karachi, Lahore and Islamabad Stock Exchanges
2000 Commencement of commercial production
2003 Successful commissioning of Desulphurization Project
Agreement with Office Cherifien des Phosphates’ (OCP), Morocco for supply of raw material (P2O5)
2005 Joint venture with ‘Office Cherifien des Phosphates’ (OCP), Morocco to incorporate ‘Pakistan Maroc Phosphore S.A’(PMP) costing 2,030 million Moroccan Dirhams with equity participation of 25%
2006 Achieved ISO Certification in QMS(9001:2000),EMS(14001:2004) and OHSAS(18001:1999)
2007 Successful completion of Ammonia BMR resulting in increased production of Ammonia by 23% from 1,270 MT to 1,570 MT and Urea by 15% from1,670 MT to 1920 MT per day
2008 DAP Revamp resulting in increased production by 51% from 1,472 MT to 2,232 MT per day
Start of PMP’s commercial production and shipment to FFBL in April 2008 and May 2008 respectively
Investment in Fauji Cement Company Limited
2010 Investment in Wind Power Projects
Successful implementation of SAP- ERP system, evolving excellence through technological integration
2011 Rewarding year for FFBL, exhibiting highest standards of performance, surpassing all previous records
PMP achieved a landmark by producing 382 thousand tones of P2O5, surpassing the name plate capacity of 375 thousand tones in any year
2 |

Rs 11.4 Billion Rs 1.04 Billion
Production
Contribution to National Exchequer
SalesRevenue
Other Income
Earningsper Share
Dividendper Share
929 thousand tonnes Rs 47.91 Billion Rs 4.64
Rs 4.50
Year 2012
Staying true to our roots
Annual Report of Fauji Fertilizer Bin Qasim Limited for the year ended 2012
| 3
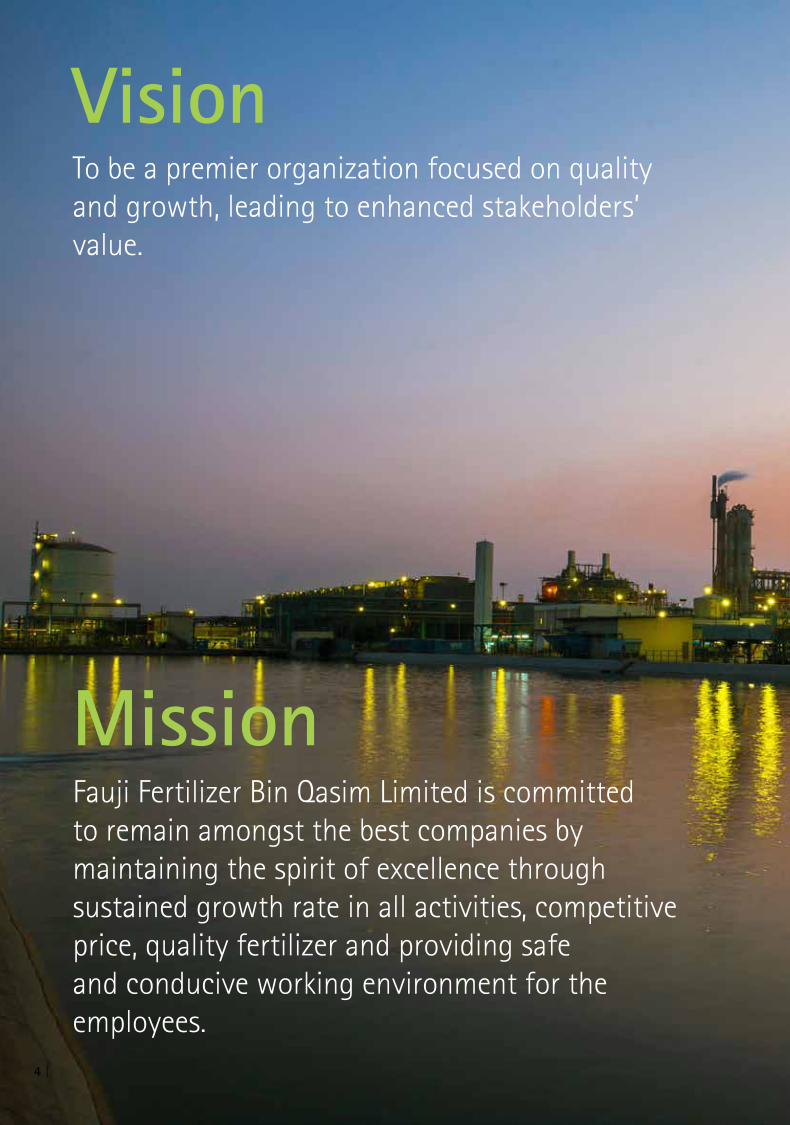
Vision
Mission
To be a premier organization focused on quality and growth, leading to enhanced stakeholders’ value.
Fauji Fertilizer Bin Qasim Limited is committed to remain amongst the best companies by maintaining the spirit of excellence through sustained growth rate in all activities, competitive price, quality fertilizer and providing safe and conducive working environment for the employees.
4 |

Annual Report of Fauji Fertilizer Bin Qasim Limited for the year ended 2012
| 5

Corporate StrategyThe dynamic corporate strategy
of FFBL is to enhance customer
satisfaction and earn their respect
by continuously providing the
highest quality of product by
adding value in the long run.
We are committed to create
value for stakeholders through
performance and growth
by appropriately utilizing
combination of resources and
skills with respect to changing
market conditions.
Our strategy is based on
profitable and sustainable growth,
building on an unrivalled market
position and a unique flexible
business model. We continue
to honour the confidence and
trust of our customers, suppliers
and the Government. We are
committed to contribute heavily
in the national economy and seize
opportunities for diversification
and growth to build upon our
strengths and competencies.
FFBL is focused on fostering
an inspiring and innovative
performance culture based on
our vision and mission, the code
of conduct, ethics, sustained
progress and our core values. We
demonstrate our commitment
to employees by promoting and
rewarding their efforts based
on performance and creating
an environment which builds
motivation and reflects our
values. We develop leaders at
all levels that achieve business
results, exhibit our values and
lead us to grow and win.
6 |

Strategic GoalsBoost agricultural yield of the country
Lead fertilizer business
Be environment friendly and socially responsible Company
Create new opportunities for business growth and diversification
Manufacture prime quality products
Maintain operational, technological and managerial excellence
Maximize productivity and expand sales
Eliminate duplication of resources to economize cost
Annual Report of Fauji Fertilizer Bin Qasim Limited for the year ended 2012
| 7

Corporate ImageCompany’s reputation and identity are among the Company’s most valuable assets.
Safety and HealthWe are all responsible for maintaining a safe workplace by following safety & health rules and practices.
ConfidentialityEvery employee is obligated to protect the Company’s confidential information, which is proprietary to the Company.
StakeholdersStakeholders are valuable equal partners for us with whom a long-term, fair and trustworthy relationship is built.
Respect for People & Team WorkWe are dedicated through dignity and respect, owe nothing less to each other. We know it well that none of us acting alone can achieve success.
Integrity and HonestyBy maintaining the highest level of corporate integrity through open, honest and fair dealings, we earn trust for ourselves from everyone.
Dedication to QualityOur quality policy is an integral part of our business philosophy and we are committed to provide total customer satisfaction.
Legal ComplianceThe Company’s activities and operations are carried out in strict compliance with all applicable laws and the highest ethical standards.
Unauthorized Use of Corporate AssetsEvery employee is obligated to protect the assets of the Company.
Conflict of InterestAll employees must avoid any personal or business influences that effect their ability to act in the best interests of the Company.
Corporate RecordsDocuments and records of the Company are part of the Company’s assets, and employees are charged with maintaining their accuracy and safety.
Code of Conduct
8 |

FFBL has established its development on the right balance in its governance; combining the economic performance of its activities, the specific nature of its shareholding structure and its commitment to the agricultural industry
Annual Report of Fauji Fertilizer Bin Qasim Limited for the year ended 2012
| 9
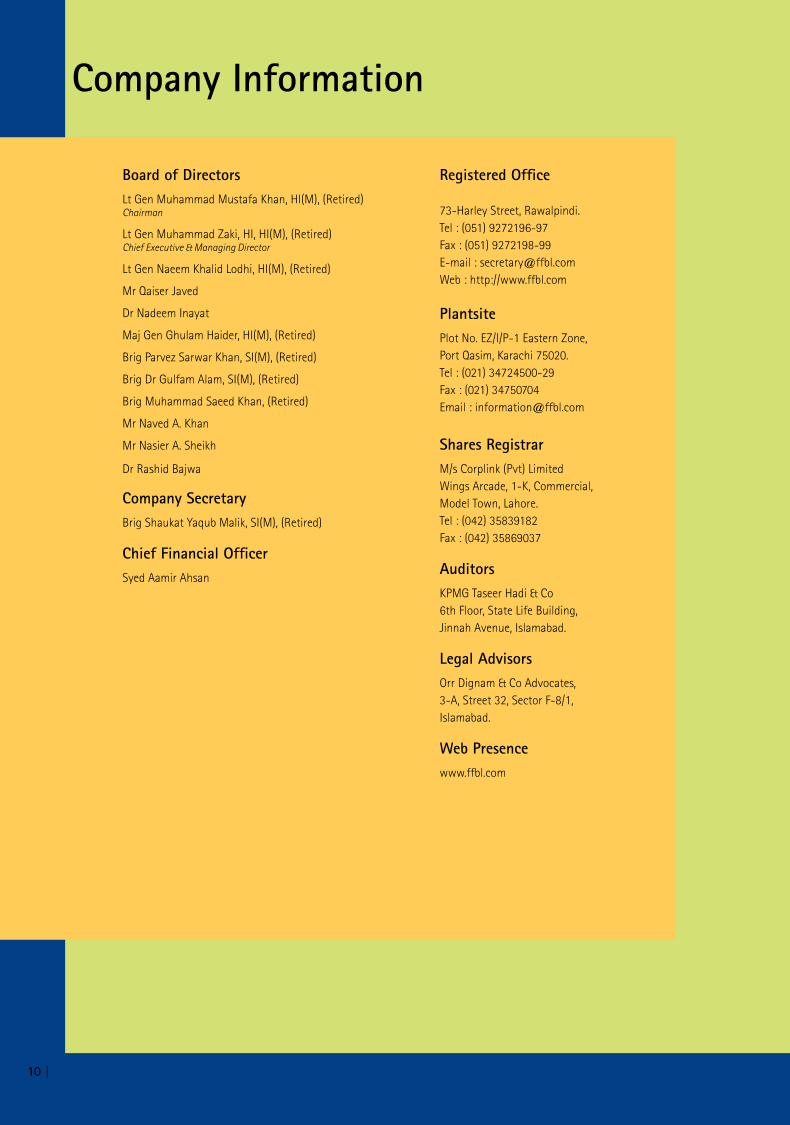
Board of DirectorsLt Gen Muhammad Mustafa Khan, HI(M), (Retired)Chairman
Lt Gen Muhammad Zaki, HI, HI(M), (Retired)Chief Executive & Managing Director
Lt Gen Naeem Khalid Lodhi, HI(M), (Retired)
Mr Qaiser Javed
Dr Nadeem Inayat
Maj Gen Ghulam Haider, HI(M), (Retired)
Brig Parvez Sarwar Khan, SI(M), (Retired)
Brig Dr Gulfam Alam, SI(M), (Retired)
Brig Muhammad Saeed Khan, (Retired)
Mr Naved A. Khan
Mr Nasier A. Sheikh
Dr Rashid Bajwa
Company SecretaryBrig Shaukat Yaqub Malik, SI(M), (Retired)
Chief Financial OfficerSyed Aamir Ahsan
Company Information
Registered Office
73-Harley Street, Rawalpindi.Tel : (051) 9272196-97Fax : (051) 9272198-99E-mail : [email protected] : http://www.ffbl.com
PlantsitePlot No. EZ/I/P-1 Eastern Zone,Port Qasim, Karachi 75020.Tel : (021) 34724500-29Fax : (021) 34750704Email : [email protected]
Shares RegistrarM/s Corplink (Pvt) LimitedWings Arcade, 1-K, Commercial,Model Town, Lahore.Tel : (042) 35839182Fax : (042) 35869037
AuditorsKPMG Taseer Hadi & Co6th Floor, State Life Building,Jinnah Avenue, Islamabad.
Legal AdvisorsOrr Dignam & Co Advocates,3-A, Street 32, Sector F-8/1,Islamabad.
Web Presencewww.ffbl.com
10 |

Organogram
Chief Executive &Managing Director
Finance Division
Supply Chain Management Division
Investment Division
Human CapitalManagement Division
Plant
Company Secretariat
Operations
Information Tehnology
Technology Department
Internal AuditDepartment
Technical Services
Administration Department
Maintenance
HSEQ
PMP Morocco
Administration
Annual Report of Fauji Fertilizer Bin Qasim Limited for the year ended 2012
| 11

Profile of the Board
Lt Gen Muhammad Mustafa Khan, HI(M),
(Retd), was commissioned in Pakistan Army
in April 1974. During his long meritorious
service in the Army, the General officer had
been employed on various command, staff
and instructional assignments including the
prestigious appointment as Chief of General
Staff and Corps Commander of a Strike Corps/
Commander Central Command. The General
is a Graduate of Command and Staff College,
Quetta and Command & Staff College, Fort
Leavenworth, USA. He is also a graduate of
Armed Forces War College, Islamabad (National
Defence University) and Senior Executive
Course from USA and holds Master Degrees in
War Studies and International Relations.
In recognition of his meritorious services, he
has been conferred the award of Hilal-e-
Imtiaz (Military). The General brings along a
vast and diversified experience in operational,
administration, management, assessment
and evaluation systems up to various level of
Command. An avid reader and keen golfer.
He is also on the Board of following entities:-
Fauji Fertilizer Company Limited (FFCL)
Mari Petroleum Company Limited (MPCL)
Fauji Cement Company Limited (FCCL)
Fauji Oil Terminal Company (FOTCO)
Fauji Kabirwala Power Company Limited
(FKPCL)
Foundation Power Company ( Daharki )
Limited (FPCDL)
Dharki Power Holdings Limited (DPHL)
FFC Energy Limited (FFCEL)
Foundation Wind Energy – I (FWE-I)
Foundation Wind Energy – II (FWE-II)
Fauji Akbar Portia Marine Terminals (FAP)
Lt Gen Muhammad Zaki, HI, HI(M), (Retd)
is the Chief Executive & Managing Director
of Fauji Fertilizer Bin Qasim Limited. He was
commissioned in the Army on 12 December
1971. He is a graduate of Command and
Staff College Quetta and National Defense
University, Islamabad. The General Officer
had eminent career in the Army, serving on
various command and staff assignments. In
recognition to his outstanding services, he was
awarded Hilal-e-Imtiaz, (HI) and Hillal-e-Imtiaz
Military, HI(M).
He is on the Board of following entities:-
Foundation Wind Energy – I (FWE-I)
Foundation Wind Energy – II (FWE-II)
Pakistan Maroc Phosphore, S.A., Morocco
(PMP)
Lt Gen Naeem Khalid Lodhi, HI(M), (Retd) is
the Chief Executive and Managing Director of
Fauji Fertilizer Co. Ltd & FFC Energy Limited. He
was commissioned in the Army on 27 October
1974. He is a Bachelor in Engineering (Civil). He
is a graduate of Command and Staff College,
Quetta and National Defence University,
Islamabad and Masters in International
Relations. He has served on various command,
staff and instructional assignments in his
career in the Army including the important
appointments of Director Staff at National
Defence College (now National Defence
University), Islamabad, Commander Corps
Engineers, Director General Engineering
Directorate, Director General Staff Duties
Directorate, General Officer Commanding
Bahawalpur, General Headquarters, Rawalpindi
and Corps Commander, Bahawalpur. He also
remained Secretary Defence for a short period.
He is also on the Board of following entities:-
Fauji Fertilizer Company Limited (FFCL)
FFC Energy Limited (FFCEL)
Pakistan Maroc Phosphore, S.A., Morocco
(PMP)
Lt Gen Muhammad Mustafa KhanHI(M), (Retd), Chairman
Lt Gen Muhammad ZakiHI, HI(M), (Retd), CE & MD
Lt Gen Naeem Khalid LodhiHI(M), (Retd), Director
12 |

Mr Qaiser Javed is a Fellow Member of
Institute of Chartered Accountants of Pakistan
and Institute of Taxation Management of
Pakistan. He joined Fauji Foundation in 1976.
Presently, he is holding the position of Director
Finance. He is also a member of Board of
Directors of all subsidiary and associated
companies of Fauji Foundation, the Hub Power
Company Ltd., Pakistan Maroc Phosphore S.A
(PMP). In addition to being a Director on the
FFBL Board, he is also the Chairman of Audit
Committee.
He is also on the Board of following entities:-
Fauji Fertilizer Company Limited (FFCL)
Mari Petroleum Company Limited (MPCL)
Fauji Cement Company Limited (FCCL)
Fauji Oil Terminal Company (FOTCO)
Fauji Kabirwala Power Company Limited
(FKPCL)
Foundation Power Company ( Daharki )
Limited (FPCDL)
Dharki Power Holdings Limited (DPHL)
FFC Energy Limited (FFCEL)
Foundation Wind Energy – I (FWE-I)
Foundation Wind Energy – II (FWE-II)
Fauji Akbar Portia Marine Terminals (FAP)
Dr Nadeem Inayat is an outstanding
professional, having rich experience in
managing, operating and advising investment
portfolio to top tier Banks and organizations
of the Country at senior level. Presently, he
is holding the position of Corporate Advisor
and Head of Investment Division in Fauji
Foundation. He is member of FFBL Board of
Directors since Jul 2006. He is also a member
of Board of Directors of all subsidiaries and
associated companies of Fauji Foundation.
He is also on the Board of following entities:-
Fauji Fertilizer Company Limited (FFCL)
Mari Petroleum Company Limited (MPCL)
Fauji Cement Company Limited (FCCL)
Fauji Oil Terminal Company (FOTCO)
Dharki Power Holdings Limited (DPHL)
Foundation Wind Energy – I (FWE-I)
Foundation Wind Energy – II (FWE-II)
Fauji Akbar Portia Marine Terminals (FAP)
Pakistan Maroc Phosphore, S.A., Morocco
(PMP)
Maj Gen Ghulam Haider, HI(M), (Retd) was
commissioned in the Army in April 1972. He
is a graduate of Command and Staff College
Quetta and National Defence University
Islamabad, Pakistan. Holds Master’s Degree in
War Studies from Quaid-e-Azam University,
Islamabad. Qualified in Ammunition and
Explosives both at home and abroad , he
has vast experience in inventory control,
Supply Chain Management and Defence
Procurements. During his distinguished
career spanning over 37 years, he had held
varied command, staff and instructional
appointments. He has been on the faculty of
Command & Staff College Quetta, Army School
of Logistics and Ordnance School. Besides
service in various Logistics Installations and
as Director General Ordnance Services and
Director General Procurement at General
Headquarters. The General has also served
in Kingdom of Saudi Arabia as adviser. In
recognition of his outstanding services, he was
awarded Hilal-i-Imtiaz (Military). At present,
he is working as Director Welfare (Health) Fauji
Foundation Head Office Rawalpindi with effect
from 23 January 2012.
He is also on the Board of following entities:-
Fauji Kabirwala Power Company Limited
(FKPCL)
FFC Energy Limited (FFCEL)
Mr Qaiser JavedDirector
Dr Nadeem InayatDirector
Maj Gen Ghulam HaiderHI(M), (Retd), Director
Annual Report of Fauji Fertilizer Bin Qasim Limited for the year ended 2012
| 13
Brig Parvez Sarwar Khan, SI(M), (Retd) is
Director Industries of Fauji Foundation. He
is graduate of Command and Staff College
Quetta and National Defence University
Islamabad. He served on varied command,
staff and instructional appointments. In
recognition of his outstanding services, he has
been awarded Sitara-e-Imitiaz (Military). He is
a member of Board of Directors of subsidiary
and associated companies of Fauji Foundation
including FFBL.
He is also on the Board of following entities:-
Fauji Fertilizer Company Limited (FFCL)
Fauji Cement Company Limited (FCCL)
Foundation Power Company (Dharki )
Limited (FPCDL)
Dharki Power Holdings Limited (DPHL)
FFC Energy Limited (FFCEL)
Brig Parvez Sarwar Khan SI(M), (Retd), Director
Brig Muhammad Saeed Khan, (Retd) is
Director Human Resources & Administration of
Fauji Foundation. He is graduate of Command
and Staff College Quetta. He served on varied
command and staff appointments in Army
and United Nations. He is a member of Board
of Directors Fauji Foundation including FFBL,
FCCL and FFCL.
Brig Muhammad Saeed Khan (Retd), Director
Brig Dr Gulfam Alam, SI(M), (Retd) was commissioned in the Pakistan Army Corps of Engineers on 14 April 1978. The Officer holds BSc (Civil Engineering) from Pakistan, MSc (Civil Engineering) and PhD (Structural engineering) from University of ILLINOIS, USA. The Officer retired from Pakistan Army on 10 July 2011. During tenure of Military service the officer was employed on varied assignments mostly related to civil engineering.
He is on the Board of following entities:-
Fauji Fertilizer Company Limited (FFCL)
Mari Petroleum Company Limited (MPCL)
Fauji Cement Company Limited (FCCL)
Foundation Power Company (Daharki )
Limited (FPCDL)
Dharki Power Holdings Limited (DPHL)
Foundation Wind Energy – I (FWE-I)
Foundation Wind Energy – II (FWE-II)
Fauji Akbar Portia Marine Terminals (FAP)
Brig Dr Gulfam Alam SI(M), (Retd), Director
Profile of the Board (Contd.)
14 |

Mr Naved A. Khan, is President & CEO at
Faysal Bank Ltd. He has over twenty four
years of work experience with twenty years
of broad-based and varied Corporate and
Investment banking experience. His last
assignment was as Chief Executive Officer-
ABN AMRO Bank Pakistan Ltd with the
primary responsibility of strategic managment
of the Bank’s local franchise and its key
businesses. Prior to joining ABN AMRO, he
has been associated in senior management
positions with Bank of America, Pakistan.
He holds an MBA from Butler University,
School of Business, Indianapolis, USA. He was
the President of Pakistan Banks Association
for 2006 & 2007. He is currently the Vice
President of Institute of Banker’s Pakistan
(IBP), Chairman of its Academic Board and
Member of IBP’s Council. He is also the
Chairman of ECH Task Force - State Bank
of Pakistan; Vice President of Management
Committee of Overseas Investor’s Chambers of
Commerce and Industry (OICCI) and Chairman
of OICCI’s Banking, Leasing and Insurance
Sub Committee; Member of the Board of
Karachi Shipyard and Engineering Works and
Board Member of Rotary Club of Karachi
Metropolitan.
Mr Nasier A. Sheikh is Law Graduate and has
over 38 years experience in Banking/ Financial
Sector in local as well as International Banks.
He has held various high profile positions
in Banks in Sri-Lanka, UAE and Pakistan and
rose to SEVP in Askari Bank Ltd., before taking
over another group Company of AWT, Askari
Leasing Limited as CEO. During his five years
tenure with the Company, he achieved a
complete turnaround of the Company from a
loss making entity to a highly profitable entity,
taking it to be the 2nd largest leasing Company
in Pakistan. He was also Director/ Chairman
of Audit Committee of Askari Insurance Ltd
another group Company of AWT. In Feb, 2008,
he was appointed as Administrator of Natover
Leasing Ltd by SECP, after superseding its
Board of Directors, and restrained the CEO of
the Company under Sec. 282 of Companies
Ordinance 1984, to run the affairs of the
Company, a task he performed successfully till
Feb, 2010.
Dr Rashid Bajwa is a MBBS, Gold Medalist and
College color holder of King Edward Medical
College as well as distinction with HM Queen’s
commendation in MPH Nuffield Institute for
Health, University of Leeds, UK.
He is also MD, ECFMG, USA. He has
professional experience of development
specialist with experience of nonprofit
corporate sector and Government. He is
founding member of the organization NRSP
Microfinance Bank. He is Chief Executive
Officer, National Rural Support Programme
(NRSP) 1996- to date. Worked as Senior
Advisor of Khushaali Bank Pakistan from
2000 to 2003. Also working as a Director
with different Non-Profit Organizations. He
is Ex Member of Civil Service of Pakistan
(DMG) 1986 -93, worked at all levels of the
Government viz Deputy Chief, Planning &
Development, Northern Areas and Assistant
Commissioner/Deputy Commissioner from
1988 to 1993. Joined FFBL as a Director with
effect from 26th Aug 2010.
Naved A. KhanDirector
Nasier A. SheikhDirector
Dr Rashid BajwaDirector
Annual Report of Fauji Fertilizer Bin Qasim Limited for the year ended 2012
| 15

Syed Aamir Ahsan, is currently serving as
Chief Financial Officer/General Manager
Finance in FFBL. He is a graduate from the
University of South Florida and Certified Public
Accountant (CPA) from the University of
Illinois, USA. He has a rich professional
experience of over 27 years with 20 years in
fertilizer business in Pakistan. After returning
from USA, he joined Engro Chemical Pakistan
Limited and served with them in various
capacities from 1993 to 2002.
He joined FFBL in 2002 and in his role as Chief
Financial Officer, he successfully managed
financial restructuring of FFBL with GoP in his
early days with the Company and all financial
feasibilities and project phase of Pakistan
Maroc Phosphore, S.A (PMP). He has extensive
experience of managing finances, budget, tax
planning, investor relations and audits. He
also plays a leading role in the information
technology (IT), operations, and HR teams.
Brig Shaukat Yaqub Malik SI(M), (Retd) was
commissioned on 19 Oct 1976. The Brigadier
held a distinguished career of 31 years in
Pak Army. Has served on varied command,
staff and instructional appointments. He
is a graduate of Command & Staff College
Quetta and College of Electrical & Mechanical
Engineering, Rawalpindi. He has also
commanded a Brigade. In recognition to
his outstanding services, has been awarded
Sitara-e-Imtiaz Military SI(M). After retirement,
he has served in private sector for two years.
He is also a Chartered Member of Institute of
Logistic and Transport (UK).
Syed Aamir AhsanChief Financial Officer/G.M. Finance
Brig Shaukat Yaqub Malik SI(M), (Retd) Company Secretary
Profile of the Board (Contd.)
16 |

We are up for
producing more
and sharing more
to improve lives all
around
Annual Report of Fauji Fertilizer Bin Qasim Limited for the year ended 2012
| 17

Financial Highlights
FINANCIAL PERFORMANCE 2012 2011 2010 2009 2008 2007
Profitability
Gross profit margin (%) 23.92 36.00 31.12 26.32 30.67 39.39
EBITDA margin to sales (%) 20.17 33.28 27.59 23.10 31.27 45.63
Pre tax margin (%) 13.50 28.94 22.39 15.82 16.42 31.85
Net profit margin (%) 9.05 19.27 15.06 10.30 10.81 20.75
Return on paid up share capital (%) 46.44 115.27 69.74 40.51 26.87 23.02
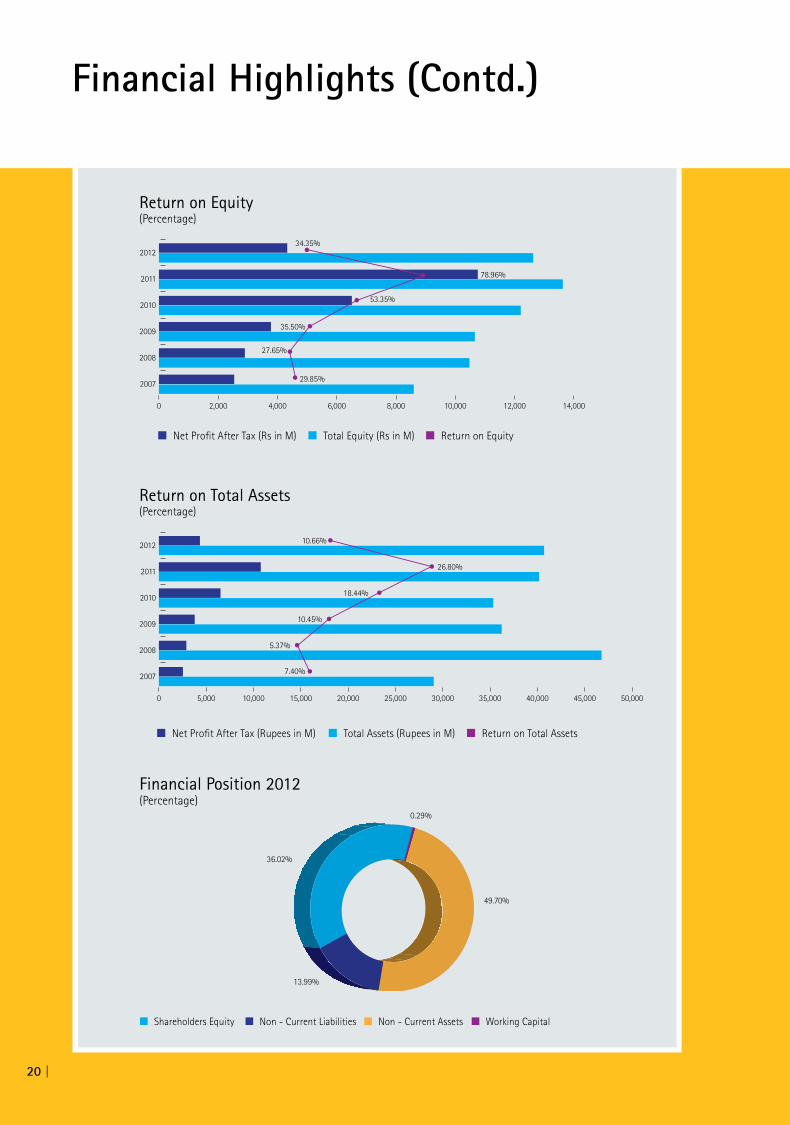
Return on equity (%) 34.35 78.96 53.35 35.50 27.65 29.85
Return on capital employed (%) 31.29 63.80 40.46 24.53 17.73 16.40
Operating Performance / Liquidity
Return on total assets (%) 10.66 26.80 18.44 10.45 5.37 7.40
Total assets turnover (Times) 1.18 1.39 1.22 1.01 0.57 0.42
Fixed assets turnover (Times) 3.46 3.86 2.94 2.36 1.69 0.74
Debtors turnover (Times) 11.67 31.03 58.87 54.97 53.13 26.68
Debtors turnover (Days) 31 12 6 7 7 14
Creditors turnover (Times) 5.12 6.53 8.58 7.20 6.41 5.83
Creditors turnover (Days) 72 56 43 51 57 63
Inventory turnover (Times) 8.80 15.29 23.86 7.77 5.94 10.69
Inventory turnover (Days) 42 24 15 47 61 34
Operating cycle (Days) 1 (20) (21) 3 11 (15)
Current ratio (Times) 1.00 1.17 1.19 1.10 1.09 1.17
Quick / Acid test ratio (Times) 0.71 0.90 0.98 0.92 0.82 0.97
Cash and cash equivalent to current liabilities (Times) 0.45 0.34 0.91 0.84 0.30 0.56
Cash flow from operations to sales (%) 3.01 14.95 17.08 56.48 (35.63) 29.84
Capital Market / Capital Structure Analysis Market price per share
- Year end (Rs) 38.59 42.43 35.73 26.13 12.90 42.05
- High during the year (Rs) 50.88 63.67 38.65 26.49 46.05 48.00
- Low during the year (Rs) 35.30 35.08 25.08 12.48 12.90 28.40
Earnings per share (pre-tax) (Rs) 6.93 17.31 10.37 6.22 4.72 4.18
Earnings per share (after-tax) (Rs) 4.64 11.53 6.97 4.05 3.10 2.72
Earning growth (%) (59.71) 65.42 72.20 30.51 14.16 3.82
Break up value (Rs) 13.52 14.60 13.07 11.41 11.23 9.11
Dividend yield ratio (%) 11.66 23.57 18.33 15.31 22.09 5.95
Price earning ratio (Times) 8.31 3.68 5.13 6.45 4.16 15.46
Debt : Equity 09:91 19:81 24:76 31:69 36:64 45:55
Interest cover ratio (Times) 4.55 15.86 11.37 4.98 2.58 7.19
Earning yield ratio (%) 12.03 27.17 19.51 15.50 24.06 6.47
Market capitalisation (Rs (M)) 36,047 39,634 33,376 24,408 12,050 39,279
Corporate Distribution
Dividend per share - Interim (Rs) 2.25 6.50 3.05 1.75 0.60 1.50
Dividend per share - Proposed Final (Rs) 2.25 3.50 3.50 2.25 2.25 1.00
Dividend payout ratio (%) 96.98 86.73 93.97 98.73 91.94 91.90
Dividend cover ratio (%) 103.20 115.27 106.41 101.25 108.92 108.77
18 |
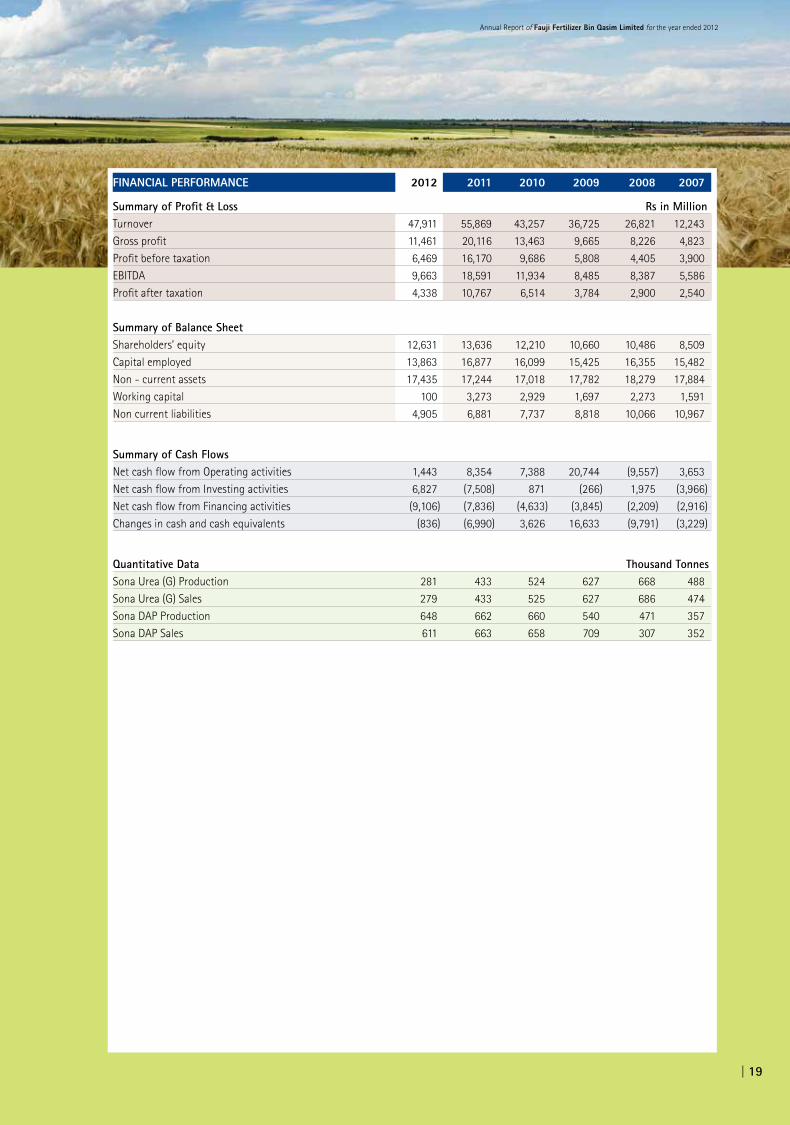
Summary of Profit & Loss Rs in MillionTurnover 47,911 55,869 43,257 36,725 26,821 12,243
Gross profit 11,461 20,116 13,463 9,665 8,226 4,823
Profit before taxation 6,469 16,170 9,686 5,808 4,405 3,900
EBITDA 9,663 18,591 11,934 8,485 8,387 5,586
Profit after taxation 4,338 10,767 6,514 3,784 2,900 2,540
Summary of Balance Sheet Shareholders’ equity 12,631 13,636 12,210 10,660 10,486 8,509
Capital employed 13,863 16,877 16,099 15,425 16,355 15,482
Non - current assets 17,435 17,244 17,018 17,782 18,279 17,884
Working capital 100 3,273 2,929 1,697 2,273 1,591
Non current liabilities 4,905 6,881 7,737 8,818 10,066 10,967
Summary of Cash Flows Net cash flow from Operating activities 1,443 8,354 7,388 20,744 (9,557) 3,653
Net cash flow from Investing activities 6,827 (7,508) 871 (266) 1,975 (3,966)
Net cash flow from Financing activities (9,106) (7,836) (4,633) (3,845) (2,209) (2,916)
Changes in cash and cash equivalents (836) (6,990) 3,626 16,633 (9,791) (3,229)
Quantitative Data Thousand TonnesSona Urea (G) Production 281 433 524 627 668 488
Sona Urea (G) Sales 279 433 525 627 686 474
Sona DAP Production 648 662 660 540 471 357
Sona DAP Sales 611 663 658 709 307 352
FINANCIAL PERFORMANCE 2012 2011 2010 2009 2008 2007
Annual Report of Fauji Fertilizer Bin Qasim Limited for the year ended 2012
| 19
Financial Highlights (Contd.)
2011
2010
2009
2008
0 2,000 4,000 6,000 8,000 10,000 12,000 14,000
2007
2012
Total Equity (Rs in M)Net Pro�t After Tax (Rs in M) Return on Equity
Return on Equity(Percentage)
34.35%
78.96%
53.35%
35.50%
27.65%
29.85%
2011
2010
2009
2008
0 5,000 10,000 15,000 20,000 25,000 30,000 35,000 40,000 45,000 50,000
2007
2012
Total Assets (Rupees in M)Net Pro�t After Tax (Rupees in M) Return on Total Assets
Return on Total Assets(Percentage)
10.66%
26.80%
18.44%
10.45%
5.37%
7.40%
Financial Position 2012(Percentage)
Non - Current Assets Working CapitalShareholders Equity Non - Current Liabilities
49.70%
13.99%
36.02%
0.29%
20 |

2011
2010
2009
2008
0 10 20 30 40 50 60 70 80 90 100
2007
201209:91
19:81
24:76
31:69
36:64
45:55
Debt Equity
Debt : Equity
2011
2010
2009
2008
0 2 4 6 8 10 12
2007
20124.64
4.50
11.53
6.55
4.054.00
3.102.85
2.722.50
6.97
10.00
Earnings Per Share Dividend Per Share
Earnings & Dividend Per Share(Rupees)
2011
2010
2009
2008
0 10 20 30 40 50
2007
2012
Market Price Per Share (Rs) Earnings Per Share (Rs) PE Ratio
Price Earning Ratio(Times)
8.31
3.68
5.13
6.45
4.16
15.46
Annual Report of Fauji Fertilizer Bin Qasim Limited for the year ended 2012
| 21

Horizontal AnalysisBalance Sheet
HORIZONTAL ANALYSIS Rs in million 2012 12 Vs. 11 2011 11 Vs. 10 2010 10 Vs. 09 2009 09 Vs. 08 2008 08 Vs. 07 2007 07 Vs. 06 BALANCE SHEET Rs % Rs % Rs % Rs % Rs % Rs %
EQUITY AND LIABILITIES
Equity
Share capital 9,341 - 9,341 - 9,341 - 9,341 - 9,341 - 9,341 - Reserves 947 3.05 919 - 919 (1.39) 932 16.50 800 250.88 228 - Accumulated gain / (loss) 2,343 (30.60) 3,376 73.13 1,950 403.88 387 12.17 345 (132.52) (1,061) 2.81 12,631 (7.37) 13,636 11.68 12,210 14.54 10,660 1.66 10,486 23.25 8,508 (0.34)Non - Current liabilities
Long term loan 1,232 (61.99) 3,241 (16.66) 3,889 (18.38) 4,765 (18.81) 5,869 (15.83) 6,973 (13.70)Deferred liabilities 3,673 0.91 3,640 (5.41) 3,848 (5.06) 4,053 (3.43) 4,197 5.08 3,994 51.63 4,905 (28.72) 6,881 (11.06) 7,737 (12.26) 8,818 (12.40) 10,066 (8.22) 10,967 2.36 Current liabilities
Trade creditors, other payables & taxation 11,662 2.92 11,331 30.17 8,705 11.56 7,803 24.54 6,265 154.27 2,464 (8.23)Mark - up accrued 281 37.75 204 30.77 156 41.82 110 (81.48) 594 379.03 124 18.10 Short term borrowings 9,217 23.29 7,476 32.25 5,653 (26.87) 7,730 (57.66) 18,257 210.76 5,875 29.63 Current portion of long term loan 2,008 209.88 648 (25.94) 875 (20.74) 1,104 - 1,104 (0.27) 1,107 - 23,168 17.85 19,659 27.75 15,389 (8.11) 16,747 (36.13) 26,220 173.98 9,570 13.54 40,704 1.31 40,176 13.70 35,336 (2.45) 36,225 (22.55) 46,772 61.03 29,045 4.93
ASSETS
Non - Current Assets
Fixed assets 13,832 (4.32) 14,456 (1.71) 14,707 (5.59) 15,577 (1.70) 15,847 (3.71) 16,458 10.23 Long term investments 3,527 30.10 2,711 21.30 2,235 5.03 2,128 (11.96) 2,417 71.30 1,411 - Long term deposits & prepayments 76 - 76 - 76 (1.30) 77 413.33 15 - 15 (11.76) 17,435 1.11 17,243 1.32 17,018 (4.30) 17,782 (2.72) 18,279 2.21 17,884 9.33 Current assets
Stores, spares and loose tools 2,011 5.51 1,906 0.21 1,902 2.81 1,850 30.01 1,423 12.31 1,267 58.97 Stock in trade 4,876 43.12 3,407 168.06 1,271 3.59 1,227 (78.39) 5,677 865.48 588 (26.59)Trade debts 2,469 281.61 647 (22.05) 830 74.00 477 67.37 285 16.80 244 5.63 Advances 487 (0.81) 491 330.70 114 2.70 111 70.77 65 (18.75) 80 31.15 Deposits and prepayments 24 84.62 13 (7.14) 14 180.00 5 - 5 (44.44) 9 80.00 Other receivables 3,063 36.38 2,246 935.02 217 (53.43) 466 (96.44) 13,096 925.53 1,277 (24.39)Short term investments 1,550 (82.46) 8,838 607.04 1,250 (73.17) 4,659 - - (100.00) 3,895 675.90 Cash and bank balances 8,789 63.21 5,385 (57.67) 12,720 31.84 9,648 21.48 7,942 108.95 3,801 (47.47) 23,269 1.47 22,933 25.19 18,318 (0.68) 18,443 (35.27) 28,493 155.29 11,161 (1.42)
40,704 1.31 40,176 13.70 35,336 (2.45) 36,225 (22.55) 46,772 61.03 29,045 4.93
2011
2010
2009
2008
0 3,000 6,000 9,000 12,000 15,000 18,000 21,000 24,000 27,000
2007
2012
Current LiabilitiesNon-Current LiabilitiesEquity
Balance Sheet Analysis - Equity and Liabilities(Rupees in million)
22 |
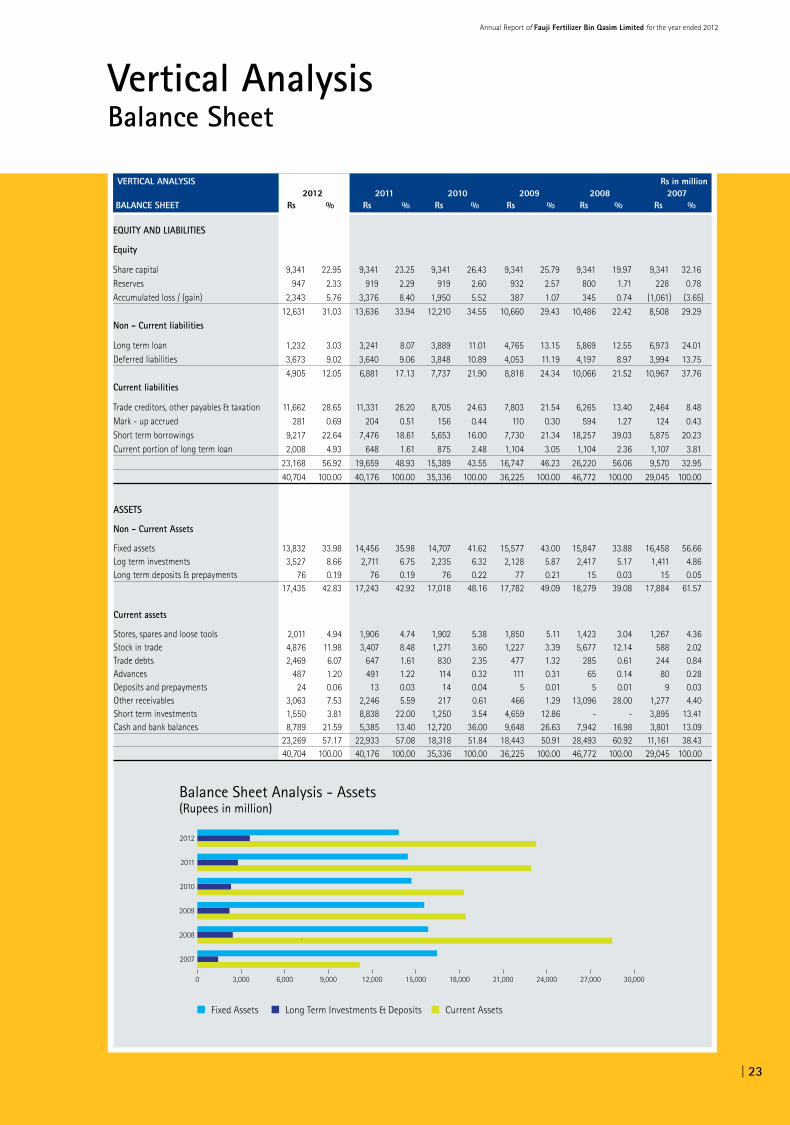
Vertical AnalysisBalance Sheet
VERTICAL ANALYSIS Rs in million 2012 2011 2010 2009 2008 2007 BALANCE SHEET Rs % Rs % Rs % Rs % Rs % Rs %
EQUITY AND LIABILITIES
Equity
Share capital 9,341 22.95 9,341 23.25 9,341 26.43 9,341 25.79 9,341 19.97 9,341 32.16 Reserves 947 2.33 919 2.29 919 2.60 932 2.57 800 1.71 228 0.78 Accumulated loss / (gain) 2,343 5.76 3,376 8.40 1,950 5.52 387 1.07 345 0.74 (1,061) (3.65) 12,631 31.03 13,636 33.94 12,210 34.55 10,660 29.43 10,486 22.42 8,508 29.29 Non - Current liabilities
Long term loan 1,232 3.03 3,241 8.07 3,889 11.01 4,765 13.15 5,869 12.55 6,973 24.01 Deferred liabilities 3,673 9.02 3,640 9.06 3,848 10.89 4,053 11.19 4,197 8.97 3,994 13.75 4,905 12.05 6,881 17.13 7,737 21.90 8,818 24.34 10,066 21.52 10,967 37.76 Current liabilities
Trade creditors, other payables & taxation 11,662 28.65 11,331 28.20 8,705 24.63 7,803 21.54 6,265 13.40 2,464 8.48 Mark - up accrued 281 0.69 204 0.51 156 0.44 110 0.30 594 1.27 124 0.43 Short term borrowings 9,217 22.64 7,476 18.61 5,653 16.00 7,730 21.34 18,257 39.03 5,875 20.23 Current portion of long term loan 2,008 4.93 648 1.61 875 2.48 1,104 3.05 1,104 2.36 1,107 3.81 23,168 56.92 19,659 48.93 15,389 43.55 16,747 46.23 26,220 56.06 9,570 32.95 40,704 100.00 40,176 100.00 35,336 100.00 36,225 100.00 46,772 100.00 29,045 100.00
ASSETS
Non - Current Assets
Fixed assets 13,832 33.98 14,456 35.98 14,707 41.62 15,577 43.00 15,847 33.88 16,458 56.66 Log term investments 3,527 8.66 2,711 6.75 2,235 6.32 2,128 5.87 2,417 5.17 1,411 4.86 Long term deposits & prepayments 76 0.19 76 0.19 76 0.22 77 0.21 15 0.03 15 0.05 17,435 42.83 17,243 42.92 17,018 48.16 17,782 49.09 18,279 39.08 17,884 61.57
Current assets
Stores, spares and loose tools 2,011 4.94 1,906 4.74 1,902 5.38 1,850 5.11 1,423 3.04 1,267 4.36 Stock in trade 4,876 11.98 3,407 8.48 1,271 3.60 1,227 3.39 5,677 12.14 588 2.02 Trade debts 2,469 6.07 647 1.61 830 2.35 477 1.32 285 0.61 244 0.84 Advances 487 1.20 491 1.22 114 0.32 111 0.31 65 0.14 80 0.28 Deposits and prepayments 24 0.06 13 0.03 14 0.04 5 0.01 5 0.01 9 0.03 Other receivables 3,063 7.53 2,246 5.59 217 0.61 466 1.29 13,096 28.00 1,277 4.40 Short term investments 1,550 3.81 8,838 22.00 1,250 3.54 4,659 12.86 - - 3,895 13.41 Cash and bank balances 8,789 21.59 5,385 13.40 12,720 36.00 9,648 26.63 7,942 16.98 3,801 13.09 23,269 57.17 22,933 57.08 18,318 51.84 18,443 50.91 28,493 60.92 11,161 38.43 40,704 100.00 40,176 100.00 35,336 100.00 36,225 100.00 46,772 100.00 29,045 100.00
2011
2010
2009
2008
0 3,000 6,000 9,000 12,000 15,000 18,000 21,000 24,000 27,000 30,000
2007
2012
Fixed Assets Current AssetsLong Term Investments & Deposits
Balance Sheet Analysis - Assets(Rupees in million)
Annual Report of Fauji Fertilizer Bin Qasim Limited for the year ended 2012
| 23

Horizontal & Vertical AnalysisProfit and Loss Account
HORIZONTAL ANALYSIS Rs. in Million 2012 12 Vs. 11 2011 11 Vs. 10 2010 10 Vs. 09 2009 09 Vs. 08 2008 08 Vs. 07 2007 07 Vs. 06 PROFIT & LOSS Rs % Rs % Rs % Rs % Rs % Rs %
Turnover 47,911 (14.24) 55,869 29.16 43,257 17.79 36,725 36.93 26,821 119.07 12,243 (16.75)
Cost of Sales 36,450 1.95 35,753 20.00 29,794 10.10 27,060 45.52 18,595 150.61 7,420 (25.97)
Gross profit 11,461 (43.03) 20,116 49.42 13,463 39.30 9,665 17.49 8,226 70.56 4,823 2.97
Selling & distribution expenses 2,666 4.39 2,554 (1.20) 2,585 15.61 2,236 25.83 1,777 66.23 1,069 (24.72)
Administrative expenses 984 26.64 777 11.00 700 74.56 401 93.72 207 58.02 131 27.18
7,811 (53.46) 16,785 64.91 10,178 44.82 7,028 12.59 6,242 72.29 3,623 14.62
Finance cost 1,822 67.46 1,088 16.49 934 (36.03) 1,460 (47.71) 2,792 342.47 631 52.78
Other operating expenses 565 (52.00) 1,177 65.08 713 60.95 443 (21.59) 565 64.24 344 41.56
5,424 (62.64) 14,520 70.20 8,531 66.46 5,125 77.64 2,885 8.95 2,648 5.71
Other operating income 1,045 (36.67) 1,650 42.98 1,154 68.96 683 (55.07) 1,520 21.41 1,252 -
Profit before taxation 6,469 (59.99) 16,170 66.96 9,685 66.75 5,808 31.85 4,405 12.95 3,900 3.81
Taxation 2,131 (60.56) 5,403 70.39 3,171 56.67 2,024 34.49 1,505 10.66 1,360 3.66
Profit after taxation 4,338 (59.71) 10,767 65.29 6,514 72.15 3,784 30.48 2,900 14.17 2,540 3.89
VERTICAL ANALYSIS Rs. in Million 2012 2011 2010 2009 2008 2007 PROFIT & LOSS Rs % Rs % Rs % Rs % Rs % Rs %
Turnover 47,911 100.00 55,869 100.00 43,257 100.00 36,725 100.00 26,821 100.00 12,243 100.00
Cost of Sales 36,450 76.08 35,753 63.99 29,794 68.88 27,060 73.68 18,595 69.33 7,420 60.61
Gross profit 11,461 23.92 20,116 36.01 13,463 31.12 9,665 26.32 8,226 30.67 4,823 39.39
Selling & distribution expenses 2,666 5.56 2,554 4.57 2,585 5.98 2,236 6.09 1,777 6.63 1,069 8.73
Administrative expenses 984 2.05 777 1.39 700 1.62 401 1.09 207 0.77 131 1.07
7,811 16.30 16,785 30.04 10,178 23.53 7,028 19.14 6,242 23.27 3,623 29.59
Finance cost 1,822 3.80 1,088 1.95 934 2.16 1,460 3.98 2,792 10.41 631 5.15
Other operating expenses 565 1.18 1,177 2.11 713 1.65 443 1.21 565 2.11 344 2.81
5,424 11.32 14,520 25.99 8,531 19.72 5,125 13.96 2,885 10.76 2,648 21.63
Other operating income 1,045 2.18 1,650 2.95 1,154 2.67 683 1.86 1,520 5.67 1,252 10.23
Profit before taxation 6,469 13.50 16,170 28.94 9,685 22.39 5,808 15.81 4,405 16.42 3,900 31.85
Taxation 2,131 4.45 5,403 9.67 3,171 7.33 2,024 5.51 1,505 5.61 1,360 11.11
Profit after taxation 4,338 9.05 10,767 19.27 6,514 15.06 3,784 10.30 2,900 10.81 2,540 20.75
2011
2010
2009
2008
0 20,000 40,000 60,000 80,000 100,000 120,000
2007
2012
Turnover Cost of Sales Finance & Other CostSelling & Admin Expenses
Other Operating Income Taxation Pro�t After Tax
Pro�t and Loss Analysis(Rupees in million)
24 |

Notice of Annual General Meeting
Notice is hereby given that the 19th Annual General Meeting of the shareholders of Fauji Fertilizer
Bin Qasim Limited will be held on 20 March 2013 at Pearl Continental Hotel, Rawalpindi, at 1100 hrs
to transact the following business:
Ordinary Business1. To confirm the minutes of Annual General Meeting held on 27 March 2012.
2. To receive, consider and adopt the Audited Accounts of the Company together with the Directors’ and the Auditors’ reports for the year ended 31 December 2012.
3. To appoint Auditor(s) of the Company for the year 2013 and fix their remuneration.
4. To approve payment of final dividend for the year ended 31 December 2012 as recommended by the Board of Directors.
5. Any other business with the permission of the Chairman.
Rawalpindi By Order of the Board25 February 2013 Fauji Fertilizer Bin Qasim Limited
Brig Shaukat Yaqub Malik, SI(M), (Retd)Company Secretary
Notes:
1. Share transfer books of the Company will remain closed from 14 to 20 March 2013 (both days inclusive).
2. A member of the Company entitled to attend and vote at AGM may appoint a person/representative as proxy to attend and vote in place of member at the meeting. Proxies in order to be effective must be received at Company’s registered office, 73-Harley Street, Rawalpindi, duly stamped and signed not later than 48 hours before the time of holding meeting. A member cannot appoint more than one proxy. Attested copy of shareholder’s CNIC must be attached with the proxy form.
3. The CDC/sub account holders are required to follow the under mentioned guidelines as laid down by Securities and Exchange Commission of Pakistan:-
(a) For attending the meetingi. In case of individuals, the
account holder or sub-account holder shall authenticate his/her identity by showing his / her original computerized national identity card or original passport at the time of attending the meeting.
ii. In case of corporate entity, the Board of Directors’ resolution / power of attorney with specimen signature of the nominee shall be produced at the time of meeting.
(b) For appointing proxies i. In case of individuals, the
account holder or sub-account holder shall submit the proxy form as per the above requirement.
ii. The proxy form shall be witnessed by the two persons whose names, addresses and CNIC numbers shall be mentioned on the form.
iii. Attested copies of CNIC or the passport of the beneficial owners and the proxy shall be furnished with the proxy form.
iv. The proxy shall produce his/her original CNIC or original passport at the time of the meeting.
v. In case of corporate entity, the Board of Directors’ resolution/power of attorney with specimen signature shall be submitted to the Company along with proxy form.
4. Members are requested to promptly notify any change in their addresses.
5. For any other information, please contact at:-
Ph. 051 9272196-7
Fax. 051 9272198-9
Annual Report of Fauji Fertilizer Bin Qasim Limited for the year ended 2012
| 25
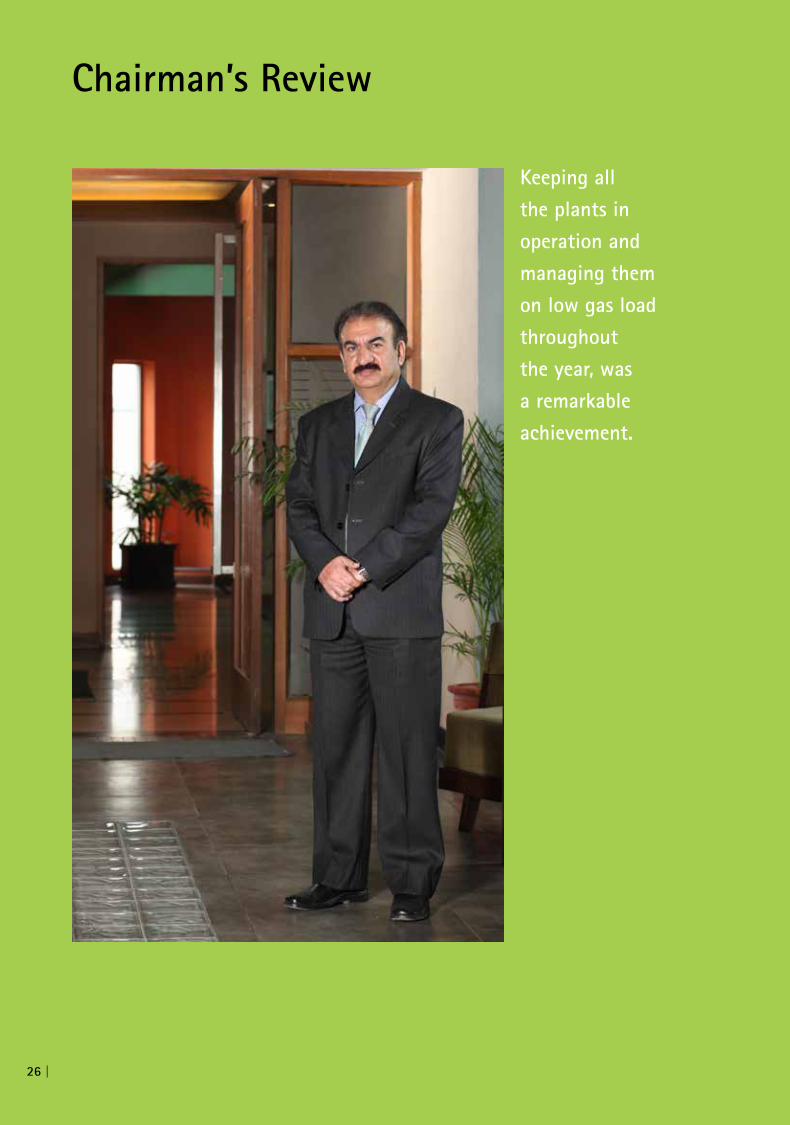
Chairman’s Review
Keeping all the plants in operation and managing them on low gas load throughout the year, was a remarkable achievement.
26 |

The year 2012, started off with a severe challenge for all the gas consumers
of Pakistan. Fertilizer Industry bore the brunt of gas curtailment especially the
plants on the Sui network. This was further impacted with the imposition of
Gas Infrastructure Development Cess (GIDC) for fertilizer companies except for
companies with fixed price contract. This was followed by floods and import of
Urea by Government which was sold well below market price. Thus ever highest
inventory of Urea in the country was observed during the year. Fertilizer Industry
as a whole, suffered low profitability during the year 2012.
Management and Employees of FFBL made tremendous efforts to ensure maximum
running of the plants despite deteriorating gas availability and downgrading of
Fertilizer Industry priority in supply of gas from two to three.
By the Grace of Almighty, overall performance of the plants remained satisfactory.
Keeping all the plants in operation and managing them on low gas load
throughout the year, was a remarkable achievement.
I wish to thank, all those individuals who have been part of the activity, during this
challenging year. I also wish to take this opportunity to thank my fellow Directors,
for making excellent contribution and sharing their invaluable experiences in
difficult times.
I must acknowledge the contribution of our customers, suppliers, bankers, SSGCL
and GoP in achieving company’s success and looking forward for their continued
assistance in the future as well. On behalf of the Board, I would like to express our
sincere thanks to our shareholders for evincing great confidence and trust in the
Company.
Lt Gen Muhammad Mustafa KhanHI(M), (Retd), Chairman
Annual Report of Fauji Fertilizer Bin Qasim Limited for the year ended 2012
| 27

A Word From The Chief Executive
FFBL has a
history of facing
challenges. From
our humble
beginning in year
2000, FFBL has
turned into a
very profitable
organization
and captured 3rd
position in top
25 companies of
KSE in 2011 and
has proved to be
a success story in
manufacturing
sector of Pakistan.
28 |

Year 2012 has been a very challenging year not only for FFBL but also for entire fertilizer
industry of Pakistan. This sector has faced its worst crisis this year and resulted in significant
reduction in profitability and in certain cases losses due to gas curtailment resulting in forced
shutdown of fertilizer plants including FFBL.
FFBL had to completely shut down its Urea plant for more than 127 days during the year due to
severe gas curtailment. Average gas received was 54 MSCF per day against the agreed 85 MSCF
per day by SSGC resulting in overall curtailment of 36%. Due to this gas curtailment production
of Ammonia, Urea and DAP was lower by 23%, 35% and 2% respectively, as compared with the
previous year. Further, imposition of Gas Infrastructure Development Cess (GIDC) by GoP has
adversely affected the profits of the Company.
FFBL’s financial results for the year 2012 have shown significant decline as compared with last
year which was an exceptional year in terms of profitability. The main reasons as stated above
are gas curtailment, increase in gas and other raw material prices, imposition of GIDC and low
demand due to floods which resulted in carrying of huge inventory especially in DAP. These
factors reduced our margin both in Urea and DAP.
FFBL is in close coordination with GoP for resolution of energy crisis in Pakistan and stands
with it for prioritizing the gas management load to avoid costly imports of fertilizers. FFBL
is also in close contact with Ministry of Petroleum and Gas Utility Company by supporting
in gas shortages/ high ingesting days and getting the reciprocated response in return. FFBL
is confident that with the continued support of GoP and our present status of pre-emptive
working we can ride out the tough gas crisis facing the country.
FFBL has always followed a proactive approach towards the sustainability and growth of the
Company. We are extensively working on the diversification of investment portfolio. Meat
project is the latest to be shared with shareholders which has great potential in terms of
returns and growth in the international market.
I wish to thank every employee of the company who has been part of the activity during this
challenging year. Their dedication and consistent hard work made it possible for FFBL to earn a
good name and be a premier organization for all stakeholders.
I also wish to acknowledge the contribution of our valued customers, GoP, respected
shareholders and other stakeholders in achieving company’s success and looking forward for
their continued assistance in the future as well.
Lt Gen Muhammad Zaki
HI, HI(M), (Retd), CE & MD
Annual Report of Fauji Fertilizer Bin Qasim Limited for the year ended 2012
| 29

Directors’ Report
The Directors are pleased to present 19th Annual Report along with
audited Financial Statements of the Company and the Auditors’ report
thereon for the year ended 31 December 2012.
Pakistan Economy and its OutlookWorsening economy coupled with deteriorating law and order situation in the country are still presenting a gloomy picture. The investors are shy of making investments due to uncertainty prevailing in the country. Flight of capital from the country continues depriving growth prospects. Fiscal deficit continues to rise depicting our incapability of managing our means and spending.
The last five years have seen economic growth slowing to an average of three percent per annum, industrial growth stagnating at near zero percent, investment rate declining to a 50-year low at 12.5% of GDP, budget deficit averaging seven percent of GDP and public debt doubling.
During this period, the country added $20 billion in external debt, foreign investment dried up and foreign exchange reserves came down. In the meantime, public sector enterprises (PSEs) continued to bleed and consume over Rs. 300 billion annually of taxpayers’ money. Inflation continued to persist at double-digit levels for more than 50 months in a row and the rupee lost 36% of its value. Country’s economy is still in the phase of recession with challenges like circular debt, energy crisis, decline in
investment and poor law and order. Other critical areas of distress for the economy are Government’s difficult financial position and dwindling foreign direct investment.
At this juncture, Pakistan must recognize the importance of deeper structural reforms, prepares its own reform agenda, secures broad political support for its reform program, including reforms in the tax system and measures to ensure fiscal discipline. A comprehensive reform in tax system and tax administration on the one hand and expenditure rationalization, reduction in size of Government and reduction in corruption on the other is the key to restore shattered economy. Broadening of tax base, strengthening of the income-tax regime, reduction of subsidies to public sector enterprises and bringing other productive sectors into the tax net can also supplement government’s revenues. Short-to-medium term economic agenda has to be devised on war-footings to put the economy back on track. Professional managements are immediately required to be installed in all the loss-making public sector enterprises to stop bleeding of over Rupee 300 billion a year. There is a dire need to put in place cost effective energy plan, encourage foreign direct investments & remittances through favorable economic policies, gradually reduce discount rate for enhancing industrial growth and promote export oriented industries to earn valuable foreign exchange for bridging the gap in balance of payments.
30 |
International Agriculture and Fertilizer SituationIn 2012, world demand responded to very attractive prices for most agricultural commodities. With prevailing strong agricultural market fundamentals, global fertilizer demand in 2013 is projected to increase by 2.5%. Fertilizer demand would increase in all the regions but North America, where declining crop prices compared to last year are expected to lead to lower application rates. Demand growth is seen as regaining momentum in South Asia after the disappointing 2012. The largest increases in volume are anticipated in South Asia and in East Asia.
Year 2012 has shown stronger performance in Urea prices on the back of continuing strong crop demand. South American purchasing was strong in 2012. China and India import demand continues to be a key driver with the effect of large scale sourcing from Iran likely to put downward pressure on prices. Meanwhile the impact of the growing shale gas industry in North America will continue to play an important role in the future
of the nitrogen industry and have impacts on key trading markets around the world. World’s demand for Urea is forecast to grow at a modest 2.9% per annum.
Phosphate rock and phosphate fertilizer production will also witness a number of changes in 2013. Morocco, which currently possesses about 80 percent of global phosphate reserves, is expected to continue to grow its importance in the industry. In particular, the closure of Agrium’s Kapuskasing phosphate rock mine in 2013 will result in more phosphate rock being imported from Morocco. Saudi Arabia’s Ma’aden will also develop its significant resources, and in doing so will help shift Middle Eastern and North African resources to the center of global agricultural markets. Growth in phosphoric acid capacity is expected in China, Morocco and Brazil. World phosphoric acid capacity is forecast to grow 4% per annum compared with 2011, to 61.3 MT P
2O5 in 2016. Global supply of phosphoric acid would be close to 49.8 MT P2O5 in 2016, representing an average growth rate of 3.7% per annum compared with 2011. The global phosphoric acid supply/demand balance shows a moderate surplus in 2012 and 2013, growing gradually to 3.6 MT P
2O5 in 2016. If a few projects were to be delayed, a marginal surplus of 2.0 to 2.5 MT per annum would prevail between 2012 and 2016.
Global EconomyThe global economy has yet to shake off the fallout from the crisis of 2008-2009. Global growth dropped to almost 3 percent in 2012, which indicates that about a half a percentage point has been shaved off the long-term trend since the crisis emerged. This slowing trend will likely continue. Mature economies are still healing the scars of the 2008-2009 crisis. But unlike in 2010 and 2011, emerging markets did not pick up the slack in 2012. Uncertainty across the regions –from the post-election ‘fiscal cliff’ question in the U.S. to the Chinese leadership transition and reforms in the Euro Area – will continue to have global impacts in sluggish trade and tepid foreign direct investment. Across the advanced economies, the outlook predicts 1.3 percent growth in 2013, compared to 1.2 percent in 2012. The slight uptick is largely due to the Euro Area, which is expected to return to very slow growth of 0.2 percent after the -0.6 percent contraction in 2012. U.S. growth is expected to fall from 2.1 percent in 2012 to 1.8 percent in 2013. A more significant slowdown is expected for less mature economies over the next year – and beyond. Overall, growth in developing and emerging economies is projected to drop from 5.5 percent in 2012 to 4.7 percent in 2013, with growth falling in China from 7.8 to 6.9 percent and in India from 5.5 to 4.7 percent. As China, India, Brazil, and others mature from rapid, investment-intensive ‘catch-up’ growth to a more balanced model, the structural ‘speed limits’ of their economies are likely to decline, bringing down global growth despite the recovery we expect in advanced economies after 2013.
Annual Report of Fauji Fertilizer Bin Qasim Limited for the year ended 2012
| 31

Operational HighlightsBy the grace of Almighty, the overall performance of the plants remained satisfactory and safe during the year except for the severe gas curtailment enforced in the first quarter of the year. This gas curtailment affected overall production for the year in comparison with the year 2011. Production of Ammonia at 307 thousand tonnes, Urea at 281 thousand tonnes and DAP at 648 thousand tonnes was lower by 23%, 35% and 2% respectively, comparing with the corresponding year.
Despite consistent gas curtailment, DAP plant achieved overall production of 648 thousand tonnes. Ever highest production of 70,522 MT in a month was achieved in August 2012. Ever highest production of 2,429 MT in a day was achieved on December 12, 2012.
Gas CurtailmentYear 2012 has been a very challenging year not only for FFBL but also for entire fertilizer industry of Pakistan. This sector has faced its worst crisis this year and resulted in significant reduction in profitability and forced shutdown of fertilizer plants including FFBL.
FFBL had to completely shutdown all its plants for more than 60 days in first quarter due to non availability of gas. Further, Urea plant remained closed for 127 days during the year due to gas curtailment which resulted in a sharp decline in its production. Average gas received was 54 MSCF per day against the agreed 85 MSCF per day by SSGC resulting in overall curtailment of 36%.
During the year GoP has changed priority for gas allocation and load management. Fertilizer sector which was on second priority after domestic and commercial sector has now been placed at third priority with power sector moving to second priority. Gas consumption by domestic sector has increased with highest growth rate of about 7%. Situation is worse on Northern Gas utility network resulting in almost complete closure of fertilizer plants.
As a result of this significant gas curtailment the industry could only produce 4.1 million MT of Urea against annual production capacity of 6.9 million MT, a reduction of more than 40%. In order to meet the local demand the GoP then had to import the significant quantity of Urea utilizing precious foreign exchange and then further spending billions of rupees to subsidize it and sell it at local price.
Turnaround 2012 The Company successfully completed annual turnaround during first quarter with the satisfactory inspection and maintenance of all equipments in a safe manner. Regular maintenance of plant and equipment is the key for efficient utilization of production resources. All activities were successfully completed within the stipulated time to improve plant efficiency and reliance. Foreign consultants from different countries also participated in turnaround for various jobs.Major jobs undertaken during the turnaround are summarized below:• Replacementofthermalblockfor
Synthesis Gas Turbine • OverhaulingofPowerGasTurbine• EmergencyShutdownSystem
up-gradation for Urea & Utilities plants
• EmergencyLoadSheddingSystemup-gradation
Directors’ Report (Contd.)
2011
2010
2009
2008
0 100 200 300 400 500 600 700 800
2007
2012
Sona Urea (G) Production Sona Urea (G) Sales
Urea Production and Sales(Thousand Tonnes)
2011
2010
2009
2008
0 100 200 300 400 500 600 700 800
2007
2012
Sona DAP Production Sona DAP Sales
DAP Production and Sales(Thousand Tonnes)
32 |

12-12-12 was the day in FFBL’s history when we achieved highest production of 2,429 MT of DAP in a day
Annual Report of Fauji Fertilizer Bin Qasim Limited for the year ended 2012
| 33

Marketing Highlights Domestic Fertilizer Market Situation
UREADomestic Urea fertilizer market entered into the year 2012 with large Urea inventory of 368 thousand tonnes which is the highest level in last 10 years and 122% higher than 166 thousand tonnes opening inventory of 2011. Indigenous Urea production continued to suffer as only 4,156 thousand tonnes Urea production is estimated for year 2012 which is 15% lower than production of 2011 while industry is capable to produce around 6.9 million tonnes of Urea. Government of Pakistan (GoP) imposed Gas Infrastructure Development Cess (GIDC) on gas supplies to some fertilizer plants from January 01, 2012. Consequently the dealer transfer price of Urea was increased in January 2012 by Rs. 215 per bag on account of gas price increase and the imposition of
GIDC. GoP decision of importing Urea as a substitute of production loss due to gas curtailment kept on adding to Urea inventories. This created an oversupplied Urea market in the country resulting in downward slide of market prices that drastically brought down the dealer profit margins and in some areas the retail prices were below the company transfer prices. This led to an inventory build up estimated to be around 1 million tonnes at November end 2012, which is the highest ever month end inventory in the history of fertilizer industry.
The news of imposition of GIDC and advance income tax on fertilizer sales from July 1, 2012 along with reduction in Urea prices by Rs. 145/- per bag by the local manufacturers boosted the Urea sales which crossed million tonnes mark in June 2012, the highest ever sales in a month in the history of Urea industry. The net increase of Urea price during the period Jan-Dec
Directors’ Report (Contd.)
0 500 1,000 1,500 2,000
2011
2010
2009
2008
2007
2012
Output Off Take
Industry Data - DAP(Thousand Tonnes)
2011
2010
2009
2008
0 1,000 2,000 3,000 4,000 5,000 6,000 7,000
2007
2012
Output Off Take
Industry Data - Urea(Thousand Tonnes)
2012 was Rs. 70 per bag. GoP imposed withholding tax @ 0.5% of the selling price for fertilizer sales w.e.f. July 01, 2012 which was later suspended on December 24, 2012.
Urea sales were low in the third quarter (Jul-Sep) due to ongoing post monsoon rains and flash floods in southern Punjab, upper Sindh and some parts of Balochistan. Inventory started to pile up again due to regular imports of Urea by GoP, although all plants operating on gas from national grid were closed down due to gas outages and added limited production.
Industry Urea sales for 2012 are estimated at 5,276 thousand tonnes showing a decline of 11% against 5,926 thousand tonnes sales of 2011. GoP imports for the year 2012 are estimated to be 1,168 thousand tonnes 6% lower than the imports of 1,241 thousand tonnes in the year 2011. Urea inventory at year end 2012 is estimated
34 |

at around 376 thousand tonnes almost same as closing inventory of 368 thousand tonnes at year end 2011.
DAPDAP market entered year 2012 with opening inventory of 92 thousand tonnes, significantly higher than 19 thousand tonnes opening inventory of year 2011. The domestic market is estimated at 1,174 thousand tonnes; an increase of 3% during 2012 over 2011.
Bearish trend in domestic DAP market was observed during Jan-Sep 2012 as international DAP prices which were high towards the end of 2011 started going down this year and remained low vis-à-vis the prices of 2011. In view of the depressed market, the fertilizer marketing companies reduced their DAP prices by Rs. 525 per bag during the first three quarters of 2012. The low demand of DAP at farmers end in
the first three quarters is attributed to high input costs, weak commodity prices and availability of cheap alternatives such as NP and SSP. The use of these substitutes will lead to imbalanced use of fertilizers. However market conditions changed in the last quarter of 2012 due to DAP application and seasonal demand. DAP prices were revised upwards by Rs. 260 per bag in the last quarter of 2012 bringing the net reduction during the year to Rs. 265 per bag against the year ending price of 2011.
On the supply side, DAP production for year 2012 is 648 thousand tonnes which is 2% lower than 662 thousand tonnes production in 2011, while DAP imports for the year 2012 are estimated to be 611 thousand tonnes 4% higher than the imports of 589 thousand tonnes in the year 2011. Closing inventory of DAP at year end 2012 is estimated around 165
thousand tonnes which is considerably higher by 79% vis-a-vis closing inventory of 92 thousand tonnes at year end 2011.
FFBL Sales Performance Sona Urea (G) sales for the year 2012 are 279 thousand tonnes with an achievement of 82% against the targets due to lower production because of the gas curtailment. These sales are 36% lower as compared to 433 thousand tonnes sales during the same period of 2011.
Sona DAP sales during the year 2012 are 611 thousand tonnes with an achievement of 98% against the targets. These sales are 8% lower as compared to 662 thousand tonnes sales of year 2011.
Share of FFBL in the domestic market of Urea and DAP is estimated to be 5% and 52% respectively for year 2012.
Annual Report of Fauji Fertilizer Bin Qasim Limited for the year ended 2012
| 35
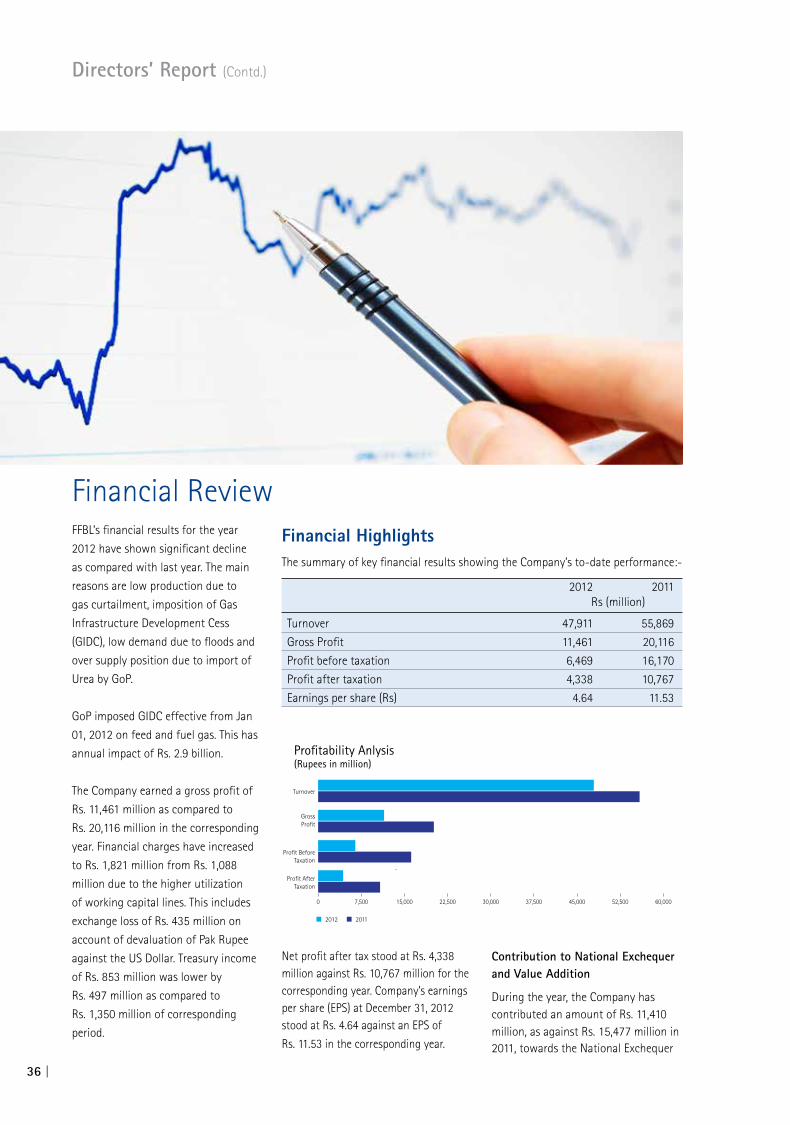
Financial Review Financial HighlightsThe summary of key financial results showing the Company’s to-date performance:-
2012 2011 Rs (million)
Turnover 47,911 55,869
Gross Profit 11,461 20,116
Profit before taxation 6,469 16,170
Profit after taxation 4,338 10,767
Earnings per share (Rs) 4.64 11.53
Contribution to National Exchequer and Value Addition
During the year, the Company has contributed an amount of Rs. 11,410 million, as against Rs. 15,477 million in 2011, towards the National Exchequer
Directors’ Report (Contd.)
GrossPro�t
Pro�t BeforeTaxation
Pro�t AfterTaxation
0 7,500 15,000 22,500 30,000 37,500 45,000 52,500 60,000
Turnover
2012 2011
Pro�tability Anlysis(Rupees in million)
FFBL’s financial results for the year
2012 have shown significant decline
as compared with last year. The main
reasons are low production due to
gas curtailment, imposition of Gas
Infrastructure Development Cess
(GIDC), low demand due to floods and
over supply position due to import of
Urea by GoP.
GoP imposed GIDC effective from Jan
01, 2012 on feed and fuel gas. This has
annual impact of Rs. 2.9 billion.
The Company earned a gross profit of
Rs. 11,461 million as compared to
Rs. 20,116 million in the corresponding
year. Financial charges have increased
to Rs. 1,821 million from Rs. 1,088
million due to the higher utilization
of working capital lines. This includes
exchange loss of Rs. 435 million on
account of devaluation of Pak Rupee
against the US Dollar. Treasury income
of Rs. 853 million was lower by
Rs. 497 million as compared to
Rs. 1,350 million of corresponding
period.
Net profit after tax stood at Rs. 4,338 million against Rs. 10,767 million for the corresponding year. Company’s earnings per share (EPS) at December 31, 2012 stood at Rs. 4.64 against an EPS of
Rs. 11.53 in the corresponding year.
36 |

FFBL Performance at a Glance The summary of the FFBL performance for the last 6 years given below:
1st Quarter 2nd Quarter 3rd Quarter 4th Quarter Annual
Year EPS DPS EPS DPS EPS DPS EPS DPS EPS DPS
2012 (0.41) - 1.10 - 1.59 2.25 2.36 2.25 4.64 4.50
2011 1.67 1.25 2.09 2.25 3.91 3.00 3.86 3.50 11.53 10.00
2010 0.87 0.50 0.98 1.30 1.29 1.25 3.83 3.50 6.97 6.55
2009 0.01 0.50 0.52 1.25 1.40 - 2.12 2.25 4.05 4.00
2008 0.17 0.60 0.60 - (0.19) - 2.52 2.25 3.10 2.85
2007 0.40 0.50 0.17 1.00 1.08 - 1.07 1.00 2.72 2.50
us the financial flexibility to achieve our portfolio optimization goals. An effective Cash Flow Management System is in place whereby cash inflows and outflows are projected on regular basis, repayments of all long term and short term loans have been duly accounted for. Working capital requirements have been planned to be financed through internal cash generations and short term borrowings from external sources where necessary.
Capital Management
There were no changes to the Company’s approach to capital management during the year and the Company is not subject to externally imposed capital requirements. In order to achieve our goals for the betterment
of the Company and to the overall economy of Pakistan, we shall continue to explore and tap opportunities, face challenges wherever required. Government policies, global & domestic economic forces and the money market would play a vital role in our decisions and ability to meet business objectives.
Financial Reporting
The Chief Executive & Managing Director and CFO declared in writing to the Board that the Company’s financial statements for the year under review present a true and fair view, in all material respects of the Company’s financial condition and operational results and are in accordance with the relevant accounting standards.
on account of Government levies, taxes and import duties etc. Value addition in terms of net foreign exchange savings worked out to US $ 517 million through import substitution by manufacturing 281 thousand tonnes of Urea and 648 thousand tonnes of DAP during 2012. Contribution to the economy included Rs. 5,657 million in the form of Shareholders’ returns through cash dividends, Rs. 1,309 million on account of payments to providers of capital in the form of mark-up and interest, while employees’ remuneration & benefits stood at Rs. 2,004 million.
Cash flow Management
The Company is committed to a strong financial profile, which gives
2012 % 2011 % Rs (million) Rs (million)
WEALTH GENERATED
Total revenue inclusive of sales tax and other income 56,873 276.00 65,205 226.13 Purchases - material and services (36,267) (176.00) (36,370) (126.13)
20,606 100.00 28,835 100.00
WEALTH DISTRIBUTION
To Employees Salaries, wages and other benefits 2,004 9.73 2,013 6.98 To Government Income tax, sales tax, custom and excise duty 11,062 53.69 14,556 50.48 WPPF 348 1.69 921 3.19 To Society Donations and welfare activities 95 0.46 7 0.02 To Providers of Capital Dividend to shareholders 5,657 27.45 9,129 31.66 Finance cost of borrowed funds 1,309 6.35 780 2.71 Retained in the Company 131 0.63 1,429 4.96
20,606 100.00 28,835 100.00
Wealth Distribution - 2012(Percentage)
To Government To Employees To Society
To Providers of Capital Retained in the Company
55.38%
9.73%
0.63%33.80%
0.46%
Annual Report of Fauji Fertilizer Bin Qasim Limited for the year ended 2012
| 37
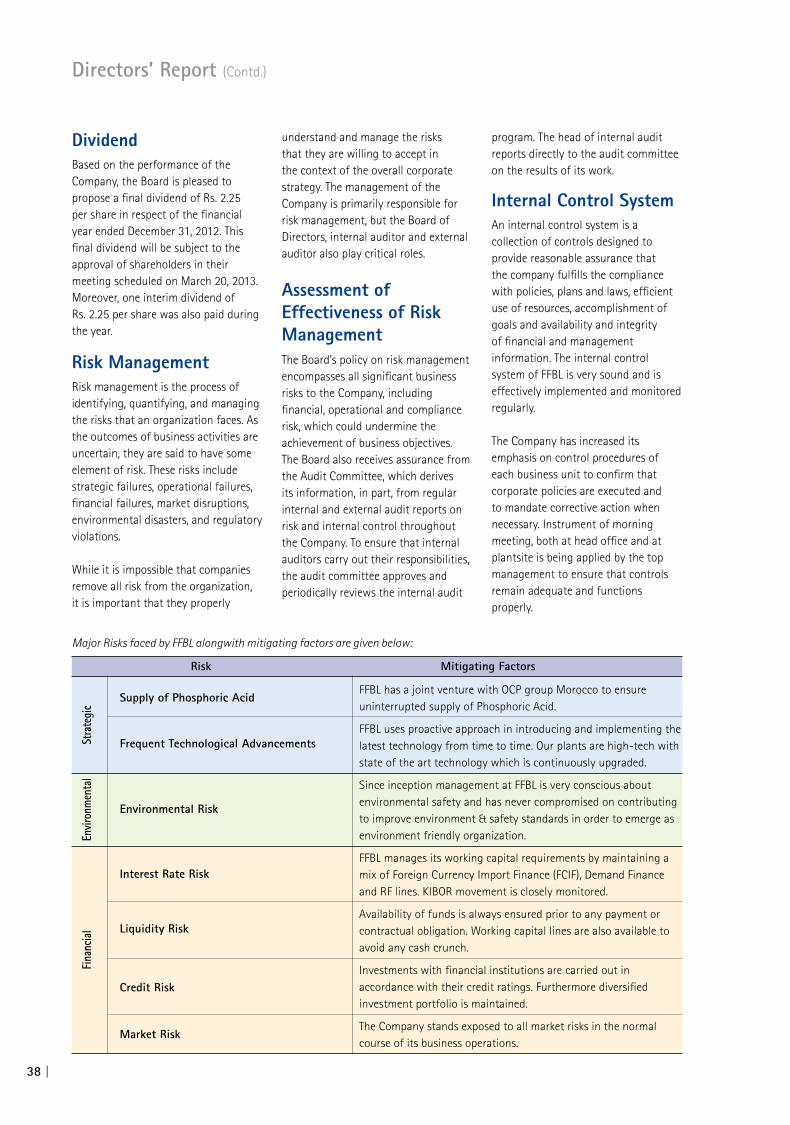
Major Risks faced by FFBL alongwith mitigating factors are given below:
Risk Mitigating Factors
Supply of Phosphoric Acid
FFBL has a joint venture with OCP group Morocco to ensure uninterrupted supply of Phosphoric Acid.
Frequent Technological Advancements
FFBL uses proactive approach in introducing and implementing the latest technology from time to time. Our plants are high-tech with state of the art technology which is continuously upgraded.
Environmental Risk
Since inception management at FFBL is very conscious about environmental safety and has never compromised on contributing to improve environment & safety standards in order to emerge as environment friendly organization.
Interest Rate Risk
FFBL manages its working capital requirements by maintaining a mix of Foreign Currency Import Finance (FCIF), Demand Finance and RF lines. KIBOR movement is closely monitored.
Liquidity Risk
Availability of funds is always ensured prior to any payment or contractual obligation. Working capital lines are also available to avoid any cash crunch.
Credit Risk Investments with financial institutions are carried out in
accordance with their credit ratings. Furthermore diversified investment portfolio is maintained.
Market Risk
The Company stands exposed to all market risks in the normal course of its business operations.
Stra
tegi
cEn
viron
men
tal
Finan
cial
Dividend Based on the performance of the Company, the Board is pleased to propose a final dividend of Rs. 2.25 per share in respect of the financial year ended December 31, 2012. This final dividend will be subject to the approval of shareholders in their meeting scheduled on March 20, 2013. Moreover, one interim dividend of Rs. 2.25 per share was also paid during the year.
Risk Management Risk management is the process of identifying, quantifying, and managing the risks that an organization faces. As the outcomes of business activities are uncertain, they are said to have some element of risk. These risks include strategic failures, operational failures, financial failures, market disruptions, environmental disasters, and regulatory violations.
While it is impossible that companies remove all risk from the organization, it is important that they properly
Directors’ Report (Contd.)
understand and manage the risks that they are willing to accept in the context of the overall corporate strategy. The management of the Company is primarily responsible for risk management, but the Board of Directors, internal auditor and external auditor also play critical roles.
Assessment of Effectiveness of Risk Management The Board’s policy on risk management encompasses all significant business risks to the Company, including financial, operational and compliance risk, which could undermine the achievement of business objectives. The Board also receives assurance from the Audit Committee, which derives its information, in part, from regular internal and external audit reports on risk and internal control throughout the Company. To ensure that internal auditors carry out their responsibilities, the audit committee approves and periodically reviews the internal audit
program. The head of internal audit reports directly to the audit committee on the results of its work.
Internal Control System An internal control system is a collection of controls designed to provide reasonable assurance that the company fulfills the compliance with policies, plans and laws, efficient use of resources, accomplishment of goals and availability and integrity of financial and management information. The internal control system of FFBL is very sound and is effectively implemented and monitored regularly.
The Company has increased its emphasis on control procedures of each business unit to confirm that corporate policies are executed and to mandate corrective action when necessary. Instrument of morning meeting, both at head office and at plantsite is being applied by the top management to ensure that controls remain adequate and functions properly.
38 |
Best Corporate Practices The Board is fully aware of the
importance in adhering to the
international and local principles of
best corporate governance. All periodic
financial statements of the Company
were circulated to the Directors duly
endorsed by the Chief Executive Officer
and the Chief Financial Officer for
approval before publication. Quarterly
un-audited financial statements along
with Directors’ Reviews were published
and circulated to the shareholders
and regulators within one month. Half
yearly financial statements reviewed
by the Auditors were circulated within
two months of the end of the period.
Annual financial statements have been
audited by the external auditors and
approved by the Board within one
month after the closing date and will
be presented to the shareholders in the
Annual General Meeting for approval
on March 20, 2013.
These statements have also been
made available on the Company
website and all important information
including distributions to shareholders,
considered sensitive for share
price fluctuation, were transmitted
to stakeholders and regulators
immediately. Regular Analysts’
Briefings were also held during the
year after end of every quarter to
up-date the existing as well as
potential investors about Company’s
state of affairs and its prospects.
Corporate Governance The Company complies with the Code
of Corporate Governance as contained
in the listing regulations of the Stock
Exchanges. The Board’s primary role
is to protect and enhance long term
shareholders’ value. To fulfill the
same it is responsible for the overall
corporate governance of the Company
including approving and monitoring
the capital expenditure, giving strategic
direction, appointing, removing
and creating succession policies for
directors and senior management,
defining and monitoring the
achievement of management’s goals
and ensuring the integrity of internal
control and management information
systems. It is also responsible for
approving and monitoring financial
and other reporting. The Board has
formally delegated responsibility
for administration and operation of
the Company to the Chief Executive
& Managing Director. Following
committees have also been constituted
which work under the guidance of the
Board of Directors:-
• AuditCommittee
• HumanResource&Remuneration
Committee
• TechnicalCommittee
Code of Conduct FFBL adheres to the best ethical
standards in the conduct of business.
Accordingly, Code of Conduct of the
Company has been approved by the
Board of Directors and placed on the
website of the Company.
Auditors Present auditors, Messrs KPMG
Taseer Hadi & Company, Chartered
Accountants, have retired and offered
themselves for re-appointment. The
Audit Committee recommended their
re-appointment for the year 2013 on
mutually agreed terms and conditions.
Annual Report of Fauji Fertilizer Bin Qasim Limited for the year ended 2012
| 39
SAP – ERP System & Paperless Environment With the successful implementation
of SAP-ERP Project in 2010, the vision
was upheld to leverage the benefits of
automation by adding more value in
the business processes, having a close
eye on the operations, and building
blocks on the ERP (SAP) solution
meeting the requirements of the
corporate strategy.
In year 2012, streamlining the
implemented system, in-house audit,
gap analysis, controls enforcement
and emphasis on analytical reports
development were the key tasks in
achieving the post implementation
objectives.
Key benefits realized in following areas:
• Changesinorganizational
structure were aligned with the
automated business processes
work flow and organizational
empowerment matrix ensuring
that the business transactions are
governed by in-placed policies,
procedures & controls.
• Introductionofbarcodesystem
integrated with SAP Ware House
Management ensures real time
stock status, reduced efforts in
reconciliation of physical and
system stock levels, accuracy in
inventory and expense values
resulted in efficient and effective
Ware House operations with
optimum resources.
• SAPBusinessIntelligence(BI)
implementation enabled the
performance management
through departmental Key
Performance Indictors (KPIs),
trend analysis on historical
data, forecasting scenarios
and analytical reporting based
dashboards for Executives.
Inventory Management System further enhanced by covering Tools and Civil satellite stores. Applications developed in house in SAP enabled both Stores online with better controlled issuance, returns, damage handling and prompt availability of information access to all concerned.
The enhanced deployment of a central document repository and integration of new processes in functional areas further increased the efficiency and resulted in cost savings.
Integrated business process enabled with electronic workflow has resulted in significant reduction of paper / stationary consumption, increased efficiency with minimal follow-up, reduced processing time and reduced data entry tasks.
FFBL ERP is committed to operational excellence and enables upcoming business opportunities and challenges
making good use of technology.
Directors’ Report (Contd.)
40 |

Changing the way we used to frame possibilities with technology
Annual Report of Fauji Fertilizer Bin Qasim Limited for the year ended 2012
| 41
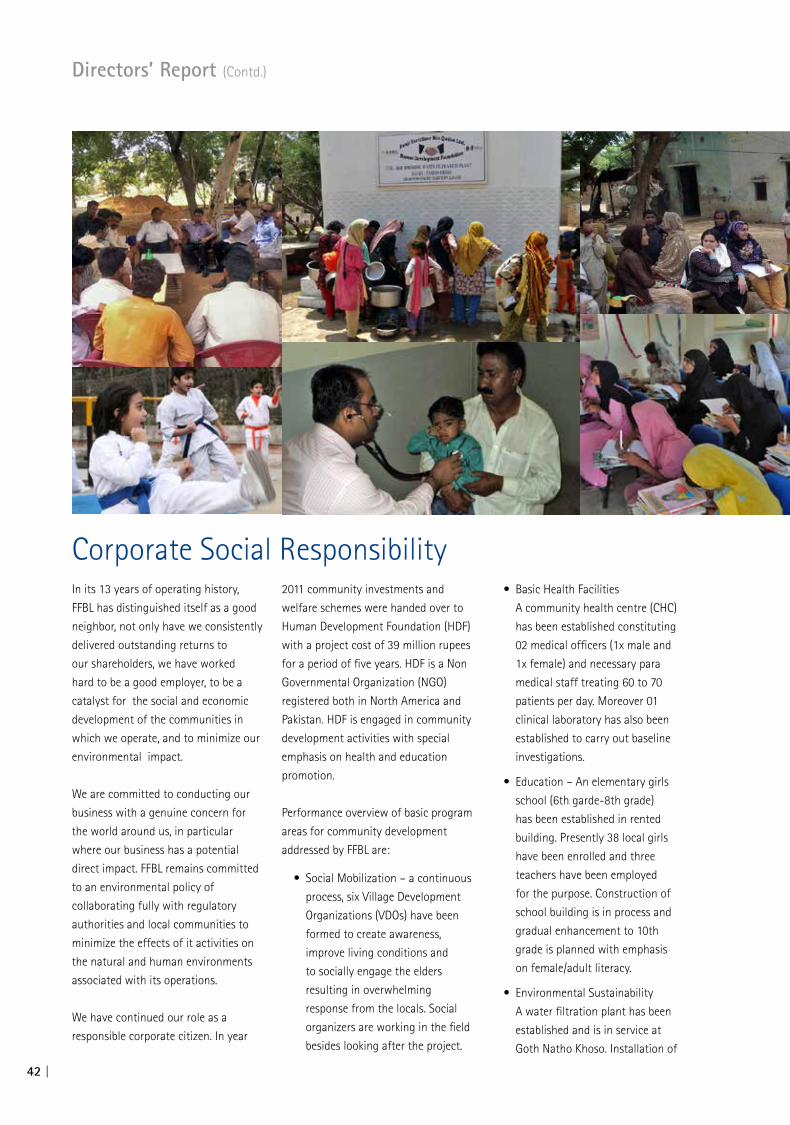
Corporate Social Responsibility In its 13 years of operating history,
FFBL has distinguished itself as a good
neighbor, not only have we consistently
delivered outstanding returns to
our shareholders, we have worked
hard to be a good employer, to be a
catalyst for the social and economic
development of the communities in
which we operate, and to minimize our
environmental impact.
We are committed to conducting our
business with a genuine concern for
the world around us, in particular
where our business has a potential
direct impact. FFBL remains committed
to an environmental policy of
collaborating fully with regulatory
authorities and local communities to
minimize the effects of it activities on
the natural and human environments
associated with its operations.
We have continued our role as a
responsible corporate citizen. In year
2011 community investments and
welfare schemes were handed over to
Human Development Foundation (HDF)
with a project cost of 39 million rupees
for a period of five years. HDF is a Non
Governmental Organization (NGO)
registered both in North America and
Pakistan. HDF is engaged in community
development activities with special
emphasis on health and education
promotion.
Performance overview of basic program
areas for community development
addressed by FFBL are:
• SocialMobilization–acontinuous
process, six Village Development
Organizations (VDOs) have been
formed to create awareness,
improve living conditions and
to socially engage the elders
resulting in overwhelming
response from the locals. Social
organizers are working in the field
besides looking after the project.
• BasicHealthFacilities
A community health centre (CHC)
has been established constituting
02 medical officers (1x male and
1x female) and necessary para
medical staff treating 60 to 70
patients per day. Moreover 01
clinical laboratory has also been
established to carry out baseline
investigations.
• Education–Anelementarygirls
school (6th garde-8th grade)
has been established in rented
building. Presently 38 local girls
have been enrolled and three
teachers have been employed
for the purpose. Construction of
school building is in process and
gradual enhancement to 10th
grade is planned with emphasis
on female/adult literacy.
• EnvironmentalSustainability
A water filtration plant has been
established and is in service at
Goth Natho Khoso. Installation of
Directors’ Report (Contd.)
42 |

further three water purification
plants have also been planned in
vicinity of Ghaggar Union Council
during next three years.
• EconomicDevelopment–Young
members of the community have
been enrolled for various diplomas
and short courses through FFBL
in technical/vocational training
institutes, namely Vocational
Training Centre, Steel Town,
Karachi, Hunar Foundation,
Karachi and Sind Madrasa Board
Institute of Technology, Gadap,
Karachi. FFBL in collaboration
with other organizations is also
providing financial assistance to
the enrollees.
In recognition of our vision and its
implementation through contributions
in the field of Corporate Social
Responsibility, the National Forum for
Environment and Health has awarded
CSR Business Excellence Award
2012 in the category of community
development program in 2012.
Sponsorship to IBA
Institute of Business administration
(IBA), Karachi, is most reputable
institution of Pakistan. This institution
is serving the nation since 1955
and every year a large number of
IBA graduates both in the field of
Management and Computer Sciences
are contributing to the economy in
terms of financial and intellectual
capacity.
FFBL is committed to support higher
education in Pakistan in order
to contribute in the economic &
socio development of the nation.
Contributing to this cause grant of
Rs. 100 million was approved for
sponsoring infrastructure development
projects and refurbishment of IBA
Administration Block at Main Campus.
Rs. 40 million from the approved grant
has been disbursed to IBA during 2012.
Financial Assistance to Shaukat Omar Memorial Hospital
FFBL’s core values emphasize on active
participation in improving basic health
amenities. Shaukat Omar Memorial
Hospital (SOMH), Karachi, is a welfare
project of Fauji Foundation having
both inpatient and outpatient facilities.
SOMH also provides free of charge
medical facilities to the deserving
patients. In order to contribute in
serving humanity, FFBL has provided
financial assistance of Rs. 50 million
to SOMH for up gradation of Patient
Support Facilities during 2012.
We are determined towards enhancing lives - by contributing to the community more than ever before
Annual Report of Fauji Fertilizer Bin Qasim Limited for the year ended 2012
| 43

Energy ConservationNatural gas is the main feed and
energy source of fertilizer for
production and power generation.
Therefore energy conservation is a key
strategic driver for plant modernization
and revamps projects, which translates
into reduction in specific energy
consumption and increase in the
production capacities.
As a part of our continual improvement
program, we consistently improve the
specific consumption of gas that we
use to produce Urea & DAP.
In view of Natural Gas crisis in the
country, we have carried out
in-house modifications and developed
strategies / procedures so that our
plants could be operated at very low
capacities. These changes also helped
in significant reduction of gas losses by
avoiding frequent start-ups and
shut-downs of our production
facilities. FFBL has undertaken
following projects to increase over
all plant capacity through efficient
utilization of energy.
• AmmoniaBMR.
• DAPRevamp.
• CommissioningofHydrogen
Recovery Unit.
• UtilizationofTotalPurgeGasesin
Boilers.
Environmental Protection MeasuresFFBL has recognized its responsibility
towards protecting, preserving and
improving the environment since
commissioning of its Ammonia, Urea &
DAP plants. FFBL management believes
that protecting the environment is not
only an ethical and legal obligation but
also a mechanism for success.
FFBL certified for Environmental
Management System (ISO 14001:2004)
in 2006 to strengthen its dedicated
efforts towards the prevention of
pollution in air, water and soil. FFBL
is pioneer fertilizer industry in the
country which opted environment
friendly Phosphate Based cooling water
treatment program.
FFBL has since come a long way in
its efforts to conserve and preserve
the environment, whether it is by
maintaining the National Environment
Quality Standards (NEQS) legal
compliances in our emissions and
discharges or by deploying new
equipments / instruments to enhance
environmental monitoring, growing
trees and plants inside and outside
plant premises and by providing
awareness program for our young
engineers, operators, neighboring
industries and general community.
Few highlights regarding environment
protection measures by FFBL are as
follows:
• Effectivemonitoringandcontrol
of emissions and discharges.
• Thirdpartyanalysisof
environmental samples.
• Investmentinnewtechnologies
to improve environmental
monitoring.
The Company is very much concerned
Directors’ Report (Contd.)
44 |

about its environmental performance
with respect to gaseous and liquid
effluents as part of moral and legal
obligation. Being a member of “Self
Monitoring and Reporting Tool”
(SMART) program launched by federal
“Environmental Protection Agency”
(EPA), monthly report of all analysis
of gaseous and liquid effluents is
submitted to “Sindh Environmental
Protection Agency” (SEPA) on regular
basis. All of these parameters remained
well within the limits of NEQS.
To add value to this reporting, the
Company arranged a third party
analysis from M/s SGS Lab (a certified
laboratory by SEPA) for all gaseous and
liquid effluents. All of these third party
reports were in line with FFBL reporting
and under NEQS limits.
FFBL actively strives to mitigate all
adverse environmental impact arising
out of our operations and strictly
adheres to all legal regulations. We care
deeply about how our operations and
products affect our stakeholders. We
bring awareness to all our employees
for the improvement of environment,
health and safety at work place.
Company facilitates its officials to visit
abroad for Company attending meeting
/ conferences on environment, health
and safety to enhance their abilities
and awareness. There is no doubt to
say that FFBL’s commitments in these
areas are at par with productivity,
quality and profitability.
Occupational Safety & Health FFBL is committed for maintaining a
safe workplace by following safety
and health rules and practices. FFBL is
striving to make a safe and incident-
free workplace. In their “Safety First”
policy, the company put forth all
its efforts to incorporate safety &
health in all its programs, awareness
campaigns and implementations.
Safety activities are conducted that
could enhance active participation
by all employees such as Safety Talk,
Safety Slogan Competition, and Safety
Trainings.
Plant completed 7.24 million
man-hours and 46 months of safe
operations on December 31, 2012 since
last Loss Time Injury in February 2009.
FFBL is member of National Safety
Council, USA, since 2001. The
membership for the year 2012-13 was
renewed in March 2012.
Fire Protection Association of
Pakistan (FPAP) and National Forum
for Environment & Health (NFEH)
have jointly bestowed FFBL with an
Excellence Award and a Certificate
in recognition of its performance in
compliance to safe work practices,
comprehensive fire fighting
facilities and safety culture among
contemporary industries.
Annual Report of Fauji Fertilizer Bin Qasim Limited for the year ended 2012
| 45

There were 16,749 shareholders of the Company’s equity at the close of 2012. About 82.40 % of total shares outstanding were closely held by the sponsors, investment companies, financial institutions and other corporate bodies. About 2.42 % shares
were kept by the foreign shareholders.
Top 25 Companies AwardFFBL again joins the elitist club at the Karachi Stock Exchange (KSE) for the third consecutive year and secured 3rd position for the year 2011, among the top twenty five companies registered at this premier stock exchange of the Country. This is a matter of pride for the Company as the membership of the exchange stands close to 654 companies.
The KSE holds this competition to acknowledge best performer companies listed on the KSE. All companies are judged on the basis of a stringent criterion, set to focus on service to the shareholders and maximization of
shareholders wealth.
Best CEO & CIO AwardsFFBL is honoured to have received Best CEO Award for the “Chemical Sector” and Best CIO Award during 2nd Annual CEO/CFO/CIO Award Ceremony organized by Mass Human Resource Services in collaboration with Karachi Stock Exchange and Pakistan Standard and Quality Authority.
Human Capital Development At FFBL, we believe there must be more proactive, result oriented and visible Human Capital initiatives through delivery of innovative and quality human resource programs, services and
systems. Our underlying HR philosophy is to perceive people as assets (human capital) whose current value can be measured and whose future value can be enhanced through investment. Human Capital Management (HCM) Division, at FFBL, is focused on interventions that link commitment from the employees towards organizational goals and at the same time build organizational loyalty.
HCM is focused on providing employees with clearly defined and consistently communicated performance expectations, aligned with the overall company strategy. The Division is striving towards implementing an effective performance management system, employing efficient compensation and benefits system, fostering innovation and continuous improvement.
Some of the major initiatives in the Human Capital domain in 2012 include the following:
• FormulationofEmpowermentMatrix to ensure an efficient and effective decision making system across the Company.
• Alignmentofhumanresourcepolicies and procedures with best practices.
• Developmentofcompetencyframework.
• Positionrationalizationandclarification.
• HRBusinessIntelligencereportsto assist managers in accessing and using data to make faster and better informed decisions.
• Focusedtraininganddevelopmentprograms across the board for enhancing technical and managerial expertise of the Human Capital. In 2012, the Company achieved approximately
24 hours of training per employee.
Directors’ Report (Contd.)
Shareholders’ Information To update shareholders about the operations, growth and state of affairs of the Company, the management promptly disseminates all material information including announcement of interim and final results to the Stock Exchanges. Quarterly, half yearly and annual financial statements are accordingly circulated within stipulated time frame to all concerned. Similarly, notices and announcements of dividend are transmitted to all stakeholders and regulators within the time, laid down in the Code of Corporate Governance, Companies Ordinance 1984 and listing regulations of Stock Exchanges. The same are also uploaded immediately on Company’s website (http://www.ffbl.com).
Shareholding Pattern Company shares are quoted on all three Stock Exchanges i.e, Karachi, Lahore and Islamabad. A total of 566.70 million Company shares were traded on the Karachi Stock Exchange during the year and the free float stood at 31.36%. The market capitalization of the Company stock was recorded at Rs. 36.05 billion at the close of 2012. FFBL shares were subject to a wide range of trading from a high of Rs. 50.88 per share to a low of Rs 35.30 per share, closing the year at Rs. 38.59 per share.
46 |

Picking the right people and giving them the opportunity to spread their wings...
Annual Report of Fauji Fertilizer Bin Qasim Limited for the year ended 2012
| 47

Employees Retirement BenefitsFFBL offers retirement benefits plans to
its employees which include Provident
and Gratuity Funds. The value of
investments of these funds as on 31
December 2012 is as under:-
Un-audited Audited 2012 2011 Rs (millions)
Provident Fund 834 642
Employees Gratuity Fund 305 225
Relations with Personnel & Community
FFBL is committed to provide an environment that encourages cordial relations within and across teams, based on mutual respect and confidence, which in turn contributes to the optimum efficiency.
At community level, FFBL in association with HDF is involved in improvement of living conditions of five Union Councils of Gaggar Town nearby the plant site. The initiative includes provision of better health and environment, improved literacy, safe drinking water, improved sanitation, technical and vocational training etc.
Stakeholder Engagement FFBL stakeholders include the investment community, employees, contractors, national, regional and local governments, regulators, communities associated with our operations, business and joint venture partners, non-governmental and development organizations, suppliers, customers and media.
Engagement takes many forms. At the corporate level, our stakeholder engagement is focused on shareholders, capital market participants, government (usually at the national level) and civil society (principally national and international
NGOs).
Pakistan Maroc Phosphore, SA (PMP)By the Grace of Almighty, overall performance of the plants at PMP remained satisfactory during the year 2012. PMP achieved the production of 354 thousand tonnes of Phos acid against the budget of 352 thousand tonnes. 80% of the total production was exported to FFBL. Also PMP completed 2 million safe man hours on July 06, 2012.
On fiscal front, however, year 2012 remained a challenging year owing to imbalance between input and output prices, as was expected and indicated in the last year Directors’ Report. Throughout the year 2012, there had been less improvement in output prices i.e. of phos acid as compared to increase in the input prices mainly of phos rock and sulphur; thereby impacting margins adversely. With recent fall of prices in the international fertilizer market and indications going forward, Year 2013 again looks a quite challenging year in terms of PMP financial results. However, all out efforts are committed by PMP Management to bring the best possible results under the
circumstances.
Wind Power ProjectsFollowing shareholders approval in the 16th Annual General Meeting the Company paid Rs. 1,017 million towards two wind power projects, Foundation Energy- I Limited (formerly Beacon Energy Limited) and Foundation Wind Energy- II (Private) Limited (formerly Green Power (Private) Limited) 49.5 MW each. Total estimated cost of each plant is US Dollar 130 million. The projects have a “Debt to Equity” ratio of 75:25. The Company will eventually hold 35% shareholding in each project. The projects are expected to commence commercial production in 2013. EPC contracts have been signed. The payments against EPC are subject to tariff determination by Alternative Energy Development Board (AEDB).
Meat Processing & Export BusinessFFBL Management envisaged the importance of company’s growth through business expansion & diversification, and decided to get into Food Business in general and Meat Business in specific. Our feasibility study for meat is almost complete and soon we will move into the project erection/execution phase.
Directors’ Report (Contd.)
48 |
Pakistan has the 4th largest herd for goat in the world with 60 million heads, 8th largest cattle herd with 34 million heads at steady growth rate of 4.5% and 9th largest herd of sheep with 28 million heads. The sector is barely touched by the corporate sector and has huge potential for growth with nearby markets like GCC. The domestic consumption of meat is also growing
at a healthy rate of 2.8%.
Board’s PerformanceTo evaluate the effectiveness of the Company, the Board has a clear idea of its ultimate goals, and the means being used to achieve those goals. By law, Board carry responsibilities for policy, ethos and directions of the organization, the obligations which the Company undertake and the contracts into which they enter. The Board has defined system and controls to cater for professional standards and corporate values, which promoted integrity of the Board as well as the Company. The performance of the Company is as a result of precise, reckonable, feasible and pragmatic decisions and policies set out by the Board of Directors of the Company.
Following are the major functions of the Company, which evaluate the Board’s performance:-
• Enhancementinshareholders’value
• ImplementationofCorporateGovernance
• FinancialperformanceoftheCompany
• Fulfillmentofregulatoryrequirements
• Balancing,ModernizationandRevamping of existing facilities
• Diversification• Employeeturnoverandretention
It is, therefore, of critical importance for the Board to undertake regular reviews, to assess its strengths and weaknesses and to develop strategies to address any limitations that are
identified.
CEO’s Performance ReviewThe Chief Executive Officer is appointed by the Board of Directors for a period of three years. The Board establishes each year a list of goals, performance objectives and priorities that are the strategies deemed necessary in achieving overall milestone of the Company. The primary purpose of CEO’s evaluation is to bring the CEO and Board together to discuss how their performance and priorities contribute towards the growth of the Company. CEO’s performance based on the following checklist:
• Abilitytoachievemissionandspecific Board objectives
• Achievingmedium-longtermgoals and key strategies
• Developmentandmanagementofresources, policies and systems
• Statutoryreportingandcompliance
• Ensurelongtermprofitandcommercial viability
• Acquisitionandutilizationofmarket intelligence
• ActivecommunicationwithallBoard members
• AttendancetoBoardmeetingsand activities
• Affectivemanagementofkeyresponsibilities
• Delegationandauthority• Excellenceincustomerfulfillment• Demonstrationofpersonal
qualities
The emphasis, in reviewing CEO’s performance is on ‘indentifying what works well’, and ‘what needs improvement’. The Board presents itself as a monitor by giving free hand to CEO in managing and implementing the predetermined key indicators of success. On the basis of CEO performance, the Board provides constructive and honest feed back in a supportive manner to protect and strengthen the integrity of the role of CEO.
In recognition of CEO’s performance, contributions and successfully operating the organization, Mass Human Resource Services (MHRS), Karachi Stock Exchange (KSE) and Pakistan Standard Quality Control Authority (PHQCA) awarded 2nd best CEO award for the year 2011-12 to the Lt Gen Muhammad Zaki, HI, HI(M), (Retd), Chief Executive and Managing Director, Fauji Fertilizer Bin Qasim
Limited.
Business Challenges & Future OutlookFFBL looks forward to a bright future with ever increasing demand for food and fertilizer and shall continue to contribute towards self sufficiency of country’s agriculture.
Although Company has managed to achieve the good profits in the year 2012, however year 2013 would be another challenging year due to persistent gas curtailment, implementation of various investment and diversification projects. Despite all challenges FFBL is committed to perform and deliver best possible results under very challenging business and political environment. We shall continue to meet our strategic objectives, long term goals and contribute towards country’s betterment.
Board of DirectorsThe Board exercises the powers conferred to it by the Code of Corporate Governance, the Companies Ordinance, 1984 and the Memorandum and Articles of Association of the Company, through Board meetings, which are held in every quarter for reviewing and approving the adoption of Company’s financial statements, coupled with review and adoption of business plan.
Annual Report of Fauji Fertilizer Bin Qasim Limited for the year ended 2012
| 49
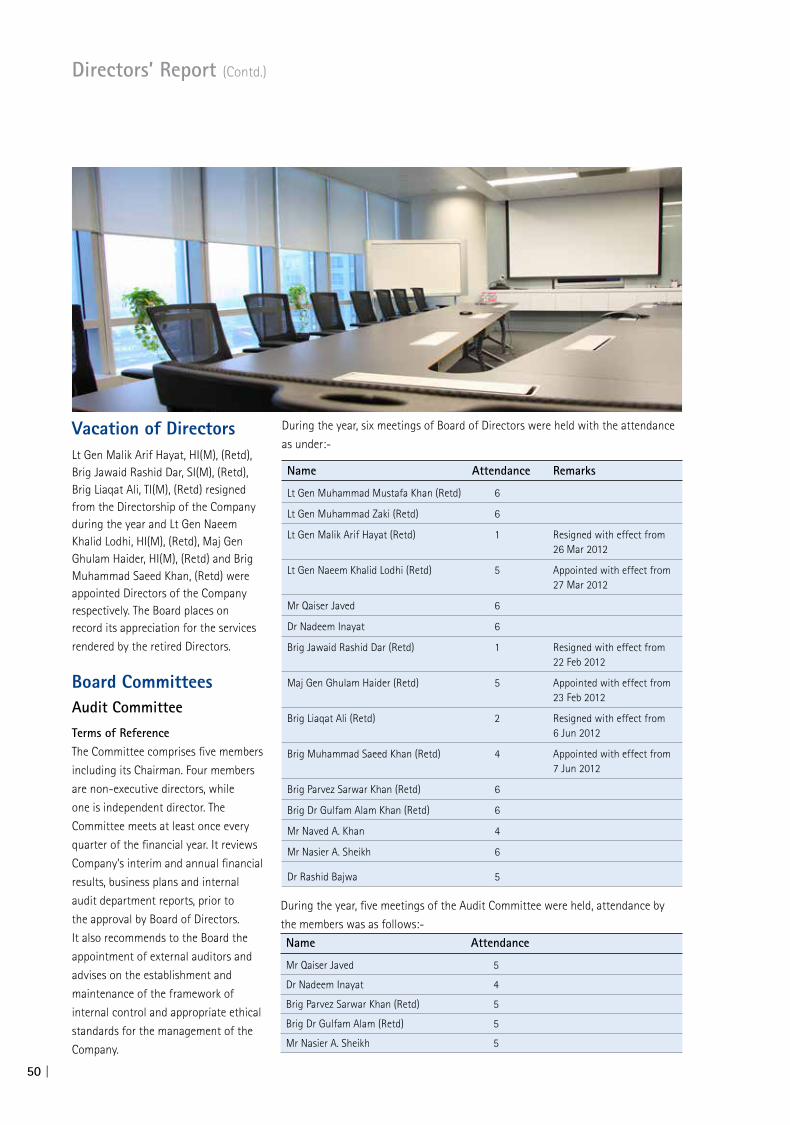
During the year, six meetings of Board of Directors were held with the attendance
as under:-
Name Attendance Remarks
Lt Gen Muhammad Mustafa Khan (Retd) 6
Lt Gen Muhammad Zaki (Retd) 6
Lt Gen Malik Arif Hayat (Retd) 1 Resigned with effect from 26 Mar 2012
Lt Gen Naeem Khalid Lodhi (Retd) 5 Appointed with effect from 27 Mar 2012
Mr Qaiser Javed 6
Dr Nadeem Inayat 6
Brig Jawaid Rashid Dar (Retd) 1 Resigned with effect from 22 Feb 2012
Maj Gen Ghulam Haider (Retd) 5 Appointed with effect from 23 Feb 2012
Brig Liaqat Ali (Retd) 2 Resigned with effect from 6 Jun 2012
Brig Muhammad Saeed Khan (Retd) 4 Appointed with effect from 7 Jun 2012
Brig Parvez Sarwar Khan (Retd) 6
Brig Dr Gulfam Alam Khan (Retd) 6
Mr Naved A. Khan 4
Mr Nasier A. Sheikh 6
Dr Rashid Bajwa 5
Vacation of DirectorsLt Gen Malik Arif Hayat, HI(M), (Retd), Brig Jawaid Rashid Dar, SI(M), (Retd), Brig Liaqat Ali, TI(M), (Retd) resigned from the Directorship of the Company during the year and Lt Gen Naeem Khalid Lodhi, HI(M), (Retd), Maj Gen Ghulam Haider, HI(M), (Retd) and Brig Muhammad Saeed Khan, (Retd) were appointed Directors of the Company respectively. The Board places on record its appreciation for the services
rendered by the retired Directors.
Board CommitteesAudit Committee
Terms of ReferenceThe Committee comprises five members
including its Chairman. Four members
are non-executive directors, while
one is independent director. The
Committee meets at least once every
quarter of the financial year. It reviews
Company’s interim and annual financial
results, business plans and internal
audit department reports, prior to
the approval by Board of Directors.
It also recommends to the Board the
appointment of external auditors and
advises on the establishment and
maintenance of the framework of
internal control and appropriate ethical
standards for the management of the
Company.
Directors’ Report (Contd.)
During the year, five meetings of the Audit Committee were held, attendance by
the members was as follows:-
Name Attendance
Mr Qaiser Javed 5
Dr Nadeem Inayat 4
Brig Parvez Sarwar Khan (Retd) 5
Brig Dr Gulfam Alam (Retd) 5
Mr Nasier A. Sheikh 5
50 |

Technical CommitteeTerms of ReferenceThe Committee comprises five members including its Chairman. Four members are non-executive directors, while one is independent director. It reviews all technical matters pertaining to the plant operations and capital expenditure of the Company.During the year, four meetings of the Technical Committee were held, attendance
by the members was as follows:-
Name Attendance Remarks
Brig Liaqat Ali (Retd) 1 Resigned with effect from 6 Jun 2012
Maj Gen Ghulam Haider (Retd) 3 Appointed with effect from 23 Feb 2012
Dr Nadeem Inayat 1
Brig Parvez Sarwar Khan (Retd) 4
Brig Dr Gulfam Alam (Retd) 2
Dr Rashid Bajwa 3
Human Resource & Remuneration (HR&R) Committee Terms of ReferenceHR Committee was renamed as HR&R Committee as per Code of Corporate Governance 2012. The Committee comprises five members including its Chairman. Four members are non-executive directors, while one is independent director. It reviews all HR related matters of the Company. During the year, one meeting of the
HR&R Committee was held, attendance by the members was as follows:-
Name Attendance
Dr Nadeem Inayat 1Brig Parvez Sarwar Khan (Retd) 1Brig Dr Gulfam Alam (Retd) 1Brig Muhammad Saeed Khan (Retd) 1Mr Naved A. Khan -
Training of the BoardAs per requirements of the regulatory framework, each member of the Board shall be subject to orientation and training for enhancing their management skills. During the year Directors of FFBL were sent for training to enhance their management skills and keep them abreast with the best management practices and policies adopted by developed nations across the globe.
Directors’ StatementDirectors are pleased to state that:
• Thefinancialstatements,preparedby the Management of the Company,
present fairly its state of affairs, the result of its operations, cash flows and changes in equity;
• ProperbooksofaccountoftheCompany have been maintained;
• Appropriateaccountingpolicieshave been consistently applied in preparation of the financial statements and accounting estimates are based on reasonable and prudent judgment;
• InternationalFinancialReportingStandards, as applicable in Pakistan, have been followed in preparation of the financial statements and any departure there from has been adequately disclosed;
• Thesystemofinternalcontrolis sound in design and has been effectively implemented and monitored;
• Therearenosignificantdoubtsregarding the Company’s ability to continue as a going concern;
• Therehasbeennomaterialdeparture from the best practices of corporate governance, as detailed in the listing regulations;
• Informationregardingoutstandingtaxes and levies, as required by listing regulations, is disclosed in the notes to the financial statements; and
• Statementofvalueofinvestmentsin respect of employees’ retirement plan has been given in note 11 of the financial statements.
AcknowledgmentThe Board of Directors would like to express its appreciation for the efforts and dedication of all employees of FFBL which enabled the management to run the Company efficiently during the year resulting attainment of good performance. The Board also wish to recognize the extraordinary contribution of our customers, suppliers, bankers, SSGCL and Government of Pakistan in achieving Company’s success and looking forward for their continued assistance in the future as well.
Last-and most importantly-on behalf of the Board, I would like to express our sincere thanks to our shareholders for having confidence and trust in the Company.
For and on behalf of the Board
Lt Gen Muhammad Mustafa Khan HI(M), (Retd)Chairman11 Jan 2013
Annual Report of Fauji Fertilizer Bin Qasim Limited for the year ended 2012
| 51

Our people, our core business’s performance and our prowess in fertilizing puts us on a yielding path, every year
52 |

Financial Statementsfor the year ended December 31, 2012
| 53

Statement of Compliance with Code of Corporate Governance
This statement is being presented to comply with the Code
of Corporate Governance contained in regulations no 35 (XI)
of listing regulations of Karachi, Lahore and Islamabad Stock
Exchanges for the purpose of establishing a framework of
good governance, whereby a listed Company is managed in
compliance with the best practices of Corporate Governance.
The Company has applied the principles contained in the CCG
in the following manner:
1. The Company encourages representation of independent
non-executive directors and directors representing
minority interests on its Board of Directors. At present
the Board includes:
Category Names
Non-Executive Directors Lt Gen Muhammad Mustafa Khan, HI(M), (Retd)
Lt Gen Naeem Khalid Lodhi, HI(M), (Retd)
Mr Qaiser Javed
Dr Nadeem Inayat
Maj Gen Ghulam Haider, HI(M), (Retd)
Brig Parvez Sarwar Khan, SI(M), (Retd)
Brig Dr Gulfam Alam, SI(M), (Retd)
Brig Muhammad Saeed Khan (Retd)
Executive Director Lt Gen Muhammad Zaki, HI, HI(M), (Retd)
Independent Directors Mr Naved A. Khan
Mr Nasier A. Sheikh
Dr Rashid Bajwa
2. The directors have confirmed that none of them is serving as a director in more than seven listed companies, including this Company (excluding the listed subsidiaries of listed holding companies where applicable).
3. All the resident directors of the Company are registered as taxpayers and none of them has defaulted in payment of any loan to a banking company, a DFI or an NBFI or, being a member of a stock exchange, has been declared
as a defaulter by that stock exchange.
4. Four casual vacancies occurring on the Board on 1 Jan
2012, 22 Feb 2012, 26 Mar 2012 and 6 Jun 2012 were
filled up by the Directors within stipulated period.
5. The Company has prepared a “Code of Conduct” and
has ensured that appropriate steps have been taken to
disseminate it throughout the Company along with its
supporting policies and procedures.
6. The Board has developed a vision/mission statement,
overall corporate strategy and significant policies of
the Company. A complete record of particulars of
significant policies along with the dates on which they
were approved or amended has been maintained.
7. All the powers of the Board have been duly exercised
and decisions on material transactions, including
appointment and determination of remuneration and
terms and conditions of employment of the CEO and
non-executive directors have been taken by the Board /
shareholders.
8. The meetings of the Board were presided over by the
Chairman and the Board met at least once in every
quarter. Written notices of the Board meetings, along
with agenda and working papers, were circulated at
least seven days before the meetings. The minutes of the
meetings were appropriately recorded and circulated.
9. The Board arranged five training programs for its
directors during the year.
10. The Board has approved appointment of CFO, Company
Secretary and Head of Internal Audit, including their
remuneration and terms and conditions of employment.
11. The Directors’ Report for this year has been prepared in
compliance with the requirements of the CCG and fully
describes the salient matters required to be disclosed.
12. The financial statements of the Company were duly
endorsed by CEO and CFO before approval of the Board.
13. The Directors, CEO and executives do not hold any
interest in the shares of the Company other than that
disclosed in the pattern of shareholding.
54 |

14. The Company has complied with all the corporate and
financial reporting requirements of the CCG.
15. The Board has formed an Audit Committee. It comprises
five members, of whom four are non executive directors
including the chairman of the committee and one
independent director.
16. The meetings of the Audit Committee were held at least
once every quarter prior to approval of interim and final
results of the Company and as required by the CCG. The
terms of reference of the committee have been formed
and advised to the committee for compliance.
17. The Board has formed an HR and Remuneration
Committee. It comprises five members, of whom four
are non executive directors including the chairman of
the committee and one independent director.
18. The Board has set up an effective internal audit function
who are considered suitably qualified and experienced
for the purpose and are conversant with the policies
and procedures of the Company.
19. The statutory auditors of the Company have confirmed
that they have been given a satisfactory rating under
the quality control review program of the ICAP, that
they or any of the partners of the firm, their spouses
and minor children do not hold shares of the Company
and that the firm and all its partners are in compliance
with International Federation of Accountants (IFAC)
guidelines on code of ethics as adopted by the ICAP.
20. The statutory auditors or the persons associated with
them have not been appointed to provide other services
except in accordance with the listing regulations and
the auditors have confirmed that they have observed
IFAC guidelines in this regard.
21. The ‘closed period’, prior to the announcement of
interim/final results, and business decisions, which
may materially affect the market price of Company’s
securities, was determined and intimated to directors,
employees and stock exchanges.
22. Material / price sensitive information has been
disseminated among all market participants at once
through stock exchanges.
23. We confirm that all other material principles enshrined
in the CCG have been complied with.
Lt Gen Muhammad Zaki HI,HI(M) (Retd) Chief Executive & Managing Director
Rawalpindi
January 11, 2013
Annual Report of Fauji Fertilizer Bin Qasim Limited for the year ended 2012
| 55

Review Report to the Members on Directors’ Statement of Compliance with Best Practices of Code of Corporate Governance
We have reviewed the Directors’ Statement of Compliance
with the best practices (“the Statement”) contained in the
Code of Corporate Governance prepared by the Board
of Directors of Fauji Fertilizer Bin Qasim Limited, (“the
Company”) to comply with the Listing Regulation No. 35 of
Karachi Stock Exchange Limited, Listing Regulation No. 35 of
Lahore Stock Exchange Limited and Chapter XI of the Listing
Regulation of Islamabad Stock Exchange Limited, where the
Company is listed.
The responsibility for compliance with the Code of
Corporate Governance is that of the Board of Directors of
the Company. Our responsibility is to review, to the extent
where such compliance can be objectively verified, whether
the Statement of Compliance reflects the status of the
Company’s compliance with the provisions of the Code of
Corporate Governance and report if it does not. A review is
limited primarily to inquiries of the Company personnel and
review of various documents prepared by the Company to
comply with the Code.
As part of our audit of financial statements we are required
to obtain an understanding of the accounting and internal
control systems sufficient to plan the audit and develop an
effective audit approach. We are not required to consider
whether the Board’s statement covers all risks or controls,
or to form an opinion on the effectiveness of such internal
control, the Company’s Corporate Governance procedures
and risks.
Further, Sub-Regulation (xiii a) of Listing Regulation 35
notified by the Karachi Stock Exchange (Guarantee) Limited
vide circular KSE/N-269 dated 19 January 2009 requires
the Company to place before the Board of Directors for
their consideration and approval related party transactions,
distinguishing between transactions carried out on terms
equivalent to those that prevail in arm’s length transactions
and transaction which are not executed at arm’s length price
recording proper justification for using such alternative
pricing mechanism. Further, all such transactions are also
required to be separately placed before the Audit Committee.
We are only required and have ensured compliance of
requirement to the extent of approval of related party
transactions by the Board of Directors and placement of
such transactions before the Audit Committee. We have not
carried out any procedure to determine whether the related
party transactions were undertaken at arm’s length price or
not.
Based on our review, nothing has come to our attention,
which causes us to believe that the Statement does not
appropriately reflect the Company’s compliance, in all
material respects, with the best practices contained in the
Code of Corporate Governance as applicable to the Company
for the year ended 31 December 2012.
KPMG TASEER HADI & CO.
CHARTERED ACCOUNTANTS
Islamabad Engagement Partner
11 Jan 2013 Muhammad Rehan Chughtai
56 |
Auditors’ Report to the Members
We have audited the annexed balance sheet of Fauji Fertilizer
Bin Qasim Limited (“the Company”) as at December 31,
2012 and the related profit and loss account, statement of
comprehensive income, cash flow statement and statement
of changes in equity together with the notes forming part
thereof, for the year then ended and we state that we have
obtained all the information and explanations which, to the
best of our knowledge and belief, were necessary for the
purposes of our audit.
It is the responsibility of the Company’s management
to establish and maintain a system of internal control,
and prepare and present the above said statements in
conformity with the approved accounting standards and
the requirements of the Companies Ordinance, 1984. Our
responsibility is to express an opinion on these statements
based on our audit.
We conducted our audit in accordance with the auditing
standards as applicable in Pakistan. These standards require
that we plan and perform the audit to obtain reasonable
assurance about whether the above said statements are free
of any material misstatement. An audit includes examining, on
a test basis, evidence supporting the amounts and disclosures
in the above said statements. An audit also includes assessing
the accounting policies and significant estimates made by
made by management, as well as, evaluating the overall
presentation of the financial statements. We believe that our
audit provides a reasonable basis for our opinion and, after
due verification, we report that:
(a) in our opinion, proper books of account have been
kept by the Company as required by the Companies
Ordinance, 1984;
(b) in our opinion-
(i) the balance sheet and profit and loss account
together with the notes thereon have been
drawn up in conformity with the Companies
Ordinance, 1984 and are in agreement
with the books of account and are further
in accordance with accounting policies
consistently applied;
(ii) the expenditure incurred during the year was
for the purpose of the Company’s business;
and
(iii) the business conducted, investments made
and the expenditure incurred during the year
were in accordance with the objects of the
Company.
(c) in our opinion and to the best of our information
and according to the explanations given to us, the
balance sheet, profit and loss account, statement
of comprehensive income, cash flow statement
and statement of changes in equity together with
the notes forming part thereof conform with the
approved accounting standards as applicable in
Pakistan, and give the information required by
the Companies Ordinance, 1984, in the manner
so required and respectively give a true and fair
view of the state of the Company’s affairs as at
December 31, 2012 and of the profit, its cash flows
and changes in equity for the year then ended; and
(d) in our opinion Zakat deductible at source under
the Zakat and Ushr Ordinance, 1980 (XVIII of 1980)
was deducted by the Company and deposited in
Central Zakat Fund established under section 7 of
that Ordinance.
KPMG TASEER HADI & CO.
CHARTERED ACCOUNTANTS
Islamabad Engagement Partner
11 Jan 2013 Muhammad Rehan Chughtai
Annual Report of Fauji Fertilizer Bin Qasim Limited for the year ended 2012
| 57
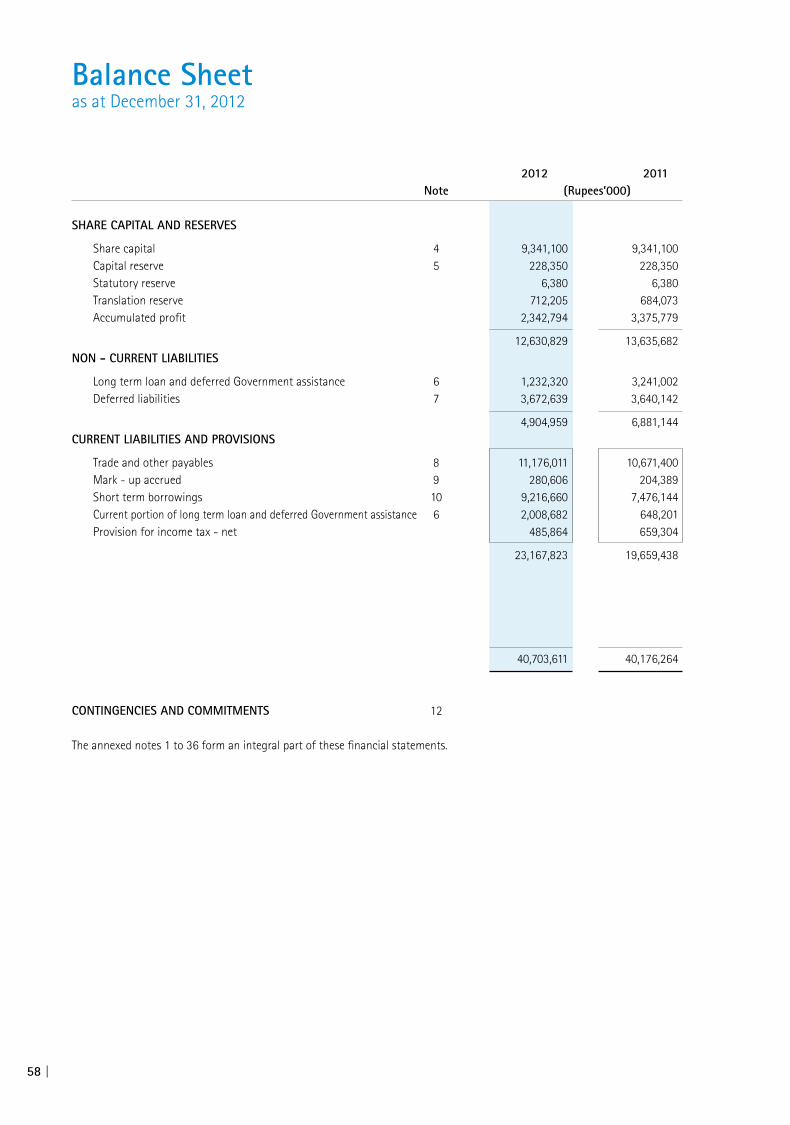
2012 2011 Note (Rupees’000) SHARE CAPITAL AND RESERVES
Share capital 4 9,341,100 9,341,100 Capital reserve 5 228,350 228,350 Statutory reserve 6,380 6,380 Translation reserve 712,205 684,073 Accumulated profit 2,342,794 3,375,779
12,630,829 13,635,682 NON - CURRENT LIABILITIES
Long term loan and deferred Government assistance 6 1,232,320 3,241,002 Deferred liabilities 7 3,672,639 3,640,142
4,904,959 6,881,144 CURRENT LIABILITIES AND PROVISIONS
Trade and other payables 8 11,176,011 10,671,400 Mark - up accrued 9 280,606 204,389 Short term borrowings 10 9,216,660 7,476,144 Current portion of long term loan and deferred Government assistance 6 2,008,682 648,201 Provision for income tax - net 485,864 659,304
23,167,823 19,659,438
40,703,611 40,176,264
CONTINGENCIES AND COMMITMENTS 12 The annexed notes 1 to 36 form an integral part of these financial statements.
Balance Sheetas at December 31, 2012
58 |

2012 2011 Note (Rupees’000) NON - CURRENT ASSETS
Property, plant and equipment 13 13,822,842 14,410,169 Intangible assets 13 9,280 46,399 Long term investments 14 3,527,062 2,710,837 Long term deposits 76,312 76,312
17,435,496 17,243,717 CURRENT ASSETS
Stores and spares 15 2,011,482 1,905,738 Stock in trade 16 4,876,305 3,406,993 Trade debts 17 2,469,075 646,516 Advances 18 448,063 440,050 Trade deposits and short term prepayments 19 23,641 12,920 Interest accrued 39,317 51,041 Other receivables 20 2,994,808 2,180,232 Sales tax refundable 66,457 66,457 Short term investments 21 1,550,000 8,838,237 Cash and bank balances 22 8,788,967 5,384,363
23,268,115 22,932,547
40,703,611 40,176,264
CHAIRMAN CHIEF EXECUTIVE DIRECTOR
Annual Report of Fauji Fertilizer Bin Qasim Limited for the year ended 2012
| 59
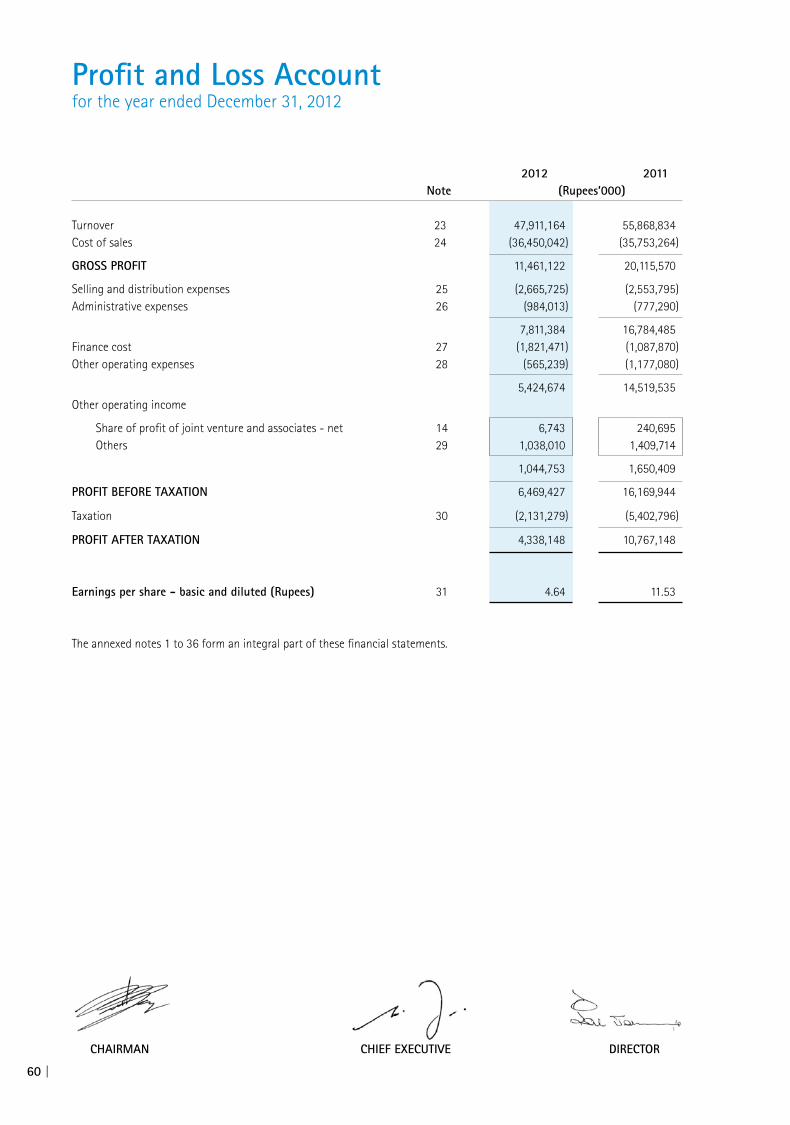
Profit and Loss Accountfor the year ended December 31, 2012
CHAIRMAN CHIEF EXECUTIVE DIRECTOR
2012 2011 Note (Rupees’000) Turnover 23 47,911,164 55,868,834 Cost of sales 24 (36,450,042) (35,753,264)
GROSS PROFIT 11,461,122 20,115,570
Selling and distribution expenses 25 (2,665,725) (2,553,795)Administrative expenses 26 (984,013) (777,290)
7,811,384 16,784,485 Finance cost 27 (1,821,471) (1,087,870)Other operating expenses 28 (565,239) (1,177,080)
5,424,674 14,519,535 Other operating income
Share of profit of joint venture and associates - net 14 6,743 240,695 Others 29 1,038,010 1,409,714
1,044,753 1,650,409
PROFIT BEFORE TAXATION 6,469,427 16,169,944
Taxation 30 (2,131,279) (5,402,796)
PROFIT AFTER TAXATION 4,338,148 10,767,148
Earnings per share - basic and diluted (Rupees) 31 4.64 11.53
The annexed notes 1 to 36 form an integral part of these financial statements.
60 |

Statement of Comprehensive Incomefor the year ended December 31, 2012
2012 2011 (Rupees’000) Profit after taxation 4,338,148 10,767,148
Other comprehensive income
Exchange difference on translating a joint venture 28,132 (398)
Total comprehensive income 4,366,280 10,766,750
The annexed notes 1 to 36 form an integral part of these financial statements.
CHAIRMAN CHIEF EXECUTIVE DIRECTOR
Annual Report of Fauji Fertilizer Bin Qasim Limited for the year ended 2012
| 61

Cash Flow Statementfor the year ended December 31, 2012
2012 2011 Note (Rupees’000) CASH FLOWS FROM OPERATING ACTIVITIES
Cash generated from operations 32 5,414,055 15,354,788 Finance cost paid (1,309,119) (780,319) Taxes paid (2,266,323) (5,244,030) Payment to Gratuity Fund (34,417) (46,282) Compensated absences paid (13,180) (9,483) Payment to Workers’ (Profit) Participation Fund (348,162) (921,005)
Net cash generated from operating activities 1,442,854 8,353,669 CASH FLOWS FROM INVESTING ACTIVITIES
Fixed capital expenditure (851,076) (1,089,895) Long term investment (781,350) (235,285) Proceeds from sale of property, plant and equipment 10,757 6,046 Short term investments 8,078,520 (6,625,219) Profit received on bank balances and term deposits 369,683 436,234
Net cash generated from / (used in) investing activities 6,826,534 (7,508,119)
CASH FLOWS FROM FINANCING ACTIVITIES
Long term financing - repayments - (208,472) Long term murabaha - repayments - (19,338) Long term loan - repayments (648,201) (648,201) Short term borrowing - net (2,800,000) 2,168,762 Dividend paid (5,657,099) (9,128,647)
Net cash used in financing activities (9,105,300) (7,835,896)
Net decrease in cash and cash equivalents (835,912) (6,990,346) Cash and cash equivalents at beginning of the year 5,553,219 12,543,565
Cash and cash equivalents at end of the year 4,717,307 5,553,219 CASH AND CASH EQUIVALENTS
Cash and cash equivalents included in the cash flow statement comprise the following balance sheet amounts: - Cash and bank balances 22 8,788,967 5,384,363 - Short term highly liquid investments 21 1,550,000 1,250,000 - Short term running finance (5,621,660) (1,081,144)
4,717,307 5,553,219
The annexed notes 1 to 36 form an integral part of these financial statements.
CHAIRMAN CHIEF EXECUTIVE DIRECTOR
62 |

Statement of Changes in Equityfor the year ended December 31, 2012
Reserves
Share Capital Statutory Translation Accumulated Total capital reserve reserve reserve profit
(Rupees ‘000)
Balance as at January 01, 2011 9,341,100 228,350 6,380 684,471 1,949,731 12,210,032
Total comprehensive income
Profit for the year after taxation - - - - 10,767,148 10,767,148
Other comprehensive income for the year - - - (398) - (398)
Total comprehensive income for the year - - - (398) 10,767,148 10,766,750
Transactions with owners, recorded directly in equity
Distributions to owners
Final dividend 2010 (Rs. 3.50 per ordinary share) - - - - (3,269,384) (3,269,384)
Ist interim dividend 2011 (Rs. 1.25 per ordinary share) - - - - (1,167,638) (1,167,638)
2nd interim dividend 2011 (Rs. 2.25 per ordinary share) - - - - (2,101,748) (2,101,748)
3rd interim dividend 2011 (Rs. 3.0 per ordinary share) - - - - (2,802,330) (2,802,330)
Total transactions with owners - - - - (9,341,100) (9,341,100)
Balance as at December 31, 2011 9,341,100 228,350 6,380 684,073 3,375,779 13,635,682
Balance as at January 01, 2012 9,341,100 228,350 6,380 684,073 3,375,779 13,635,682
Total comprehensive income
Profit for the year after taxation - - - - 4,338,148 4,338,148
Other comprehensive income for the year - - - 28,132 - 28,132
Total comprehensive income for the year - - - 28,132 4,338,148 4,366,280
Transactions with owners, recorded directly in equity
Distributions to owners
Final dividend 2011 (Rs. 3.50 per ordinary share) - - - - (3,269,385) (3,269,385)
Interim dividend 2012 (Rs. 2.25 per ordinary share) - - - - (2,101,748) (2,101,748)
Total transactions with owners - - - - (5,371,133) (5,371,133)
Balance as at December 31, 2012 9,341,100 228,350 6,380 712,205 2,342,794 12,630,829
The annexed notes 1 to 36 form an integral part of these financial statements.
CHAIRMAN CHIEF EXECUTIVE DIRECTOR
Annual Report of Fauji Fertilizer Bin Qasim Limited for the year ended 2012
| 63
Notes to the Financial Statementsfor the year ended December 31, 2012
1. STATUS AND NATURE OF BUSINESS
Fauji Fertilizer Bin Qasim Limited (“the Company”) is a public limited company incorporated in Pakistan under the Companies Ordinance,1984, and its shares are quoted on the Karachi, Lahore and Islamabad stock exchanges in Pakistan. The registered office of the Company is situated at Rawalpindi, Pakistan. The Company is domiciled in Rawalpindi, Pakistan. The principal objective of the Company is manufacturing, purchasing and marketing of fertilizers. The Company commenced its commercial production effective January 1, 2000. The Company is a subsidiary of Fauji Fertilizer Company Limited (the holding company) with shareholding of 50.88%.
2. BASIS OF PREPARATION
2.1 Statement of compliance
These financial statements have been prepared in accordance with the approved accounting standards as applicable in Pakistan. Approved accounting standards comprise of such International Financial Reporting Standards (IFRS) issued by the International Accounting Standards Board as are notified under the Companies Ordinance, 1984, provisions of and directives issued under the Companies Ordinance, 1984. In case requirements differ, the provisions or directives of the Companies Ordinance, 1984 shall prevail.
2.2 Basis of measurement
These financial statements have been prepared under the historical cost convention except for certain financial instruments, which are carried at their fair values and staff retirement gratuity which is carried at present value of defined benefit obligation net of fair value of plan assets and unrecognized actuarial losses.
2.3 Functional and presentation currency
These financial statements are presented in Pak Rupees, which is the Company’s functional currency. All financial information presented in Pak Rupee has been rounded to the nearest thousand.
2.4 Use of estimates and judgments
The preparation of financial statements in conformity with the approved accounting standards requires management to make judgments, estimates and assumptions that affect the application of accounting policies and the reported amounts of assets, liabilities, income and expenses. Actual results may differ from these estimates.
Estimates and underlying assumptions are reviewed on an ongoing basis. Revisions to accounting estimates are
recognized in the period in which the estimates are revised and in any future periods affected. Information about significant areas of estimation, uncertainty and critical judgments in applying accounting policies
that have the most significant effect on the amounts recognized in the financial statements are discussed in the ensuing paragraphs.
2.4.1 Staff retirement gratuity
Defined benefit plan is provided for permanent employees of the Company. The plan is typically structured as a separate legal entity managed by trustees. Calculations in this respect require assumptions to be made of future outcomes, the principal ones being in respect of increase in remuneration, the expected long-term return on plan assets and the discount rate used to convert future cash flows to current values. Calculations are sensitive to changes in the underlying assumptions.
2.4.2 Property, plant and equipment
The Company reviews the useful lives and residual value of property, plant and equipment on a regular basis. Any change in estimates in future years might affect the carrying amounts of the respective items of property, plant and equipments with a corresponding effect on the depreciation charge and the impairment.
64 |
2.4.3 Provision for inventory obsolescence and doubtful receivables
The Company reviews the carrying amount of stock, stores and spares on a regular basis and as appropriate inventory is written down to its net realizable value or provision is made for obsolescence if there is any change in usage pattern and physical form of related inventory. Net realizable value signifies the estimated selling price in the ordinary course of business less the estimated costs of completion and the estimated costs necessary to make the sale. Further the carrying amounts of trade and other receivables are assessed on a regular basis and if there is any doubt about the realisability of these receivables, appropriate amount of provision is made.
2.4.4 Taxation
The Company takes into account the current income tax law and decisions taken by the taxation authorities. Instances where the Company’s views differ from the views taken by the income tax department at the assessment stage and where the Company considers that its view on items of material nature is in accordance with law, the amounts are shown as contingent liabilities.
2.4.5 Contingencies
The Company reviews the status of all the legal cases on a regular basis. Based on the expected outcome and lawyers’ judgments, appropriate disclosure or provision is made.
2.4.6 Impairment
The carrying amount of the Company’s assets are reviewed at each balance sheet date to determine whether there is any indication of impairment loss. If any such indication exists, recoverable amount is estimated in order to determine the extent of impairment loss, if any.
3. SIGNIFICANT ACCOUNTING POLICIES
The accounting policies set out below have been applied consistently to all periods presented in these financial statements.
3.1 Employees’ retirement benefits
The Company has the following plans for its employees: Provident Fund - Defined Contribution Scheme
The Company operates a defined contributory provident fund for all its permanent employees. The fund is administered by trustees. Monthly contributions are made to the fund both by the Company and employees at the rate of 10% of basic pay. The Company’s contribution is charged to income for the year.
Gratuity Fund - Defined Benefit Scheme
The Company operates a defined benefit funded gratuity for all employees who complete qualifying period of service and age. The Fund is administered by trustees. Contribution to the fund is made on the basis of actuarial valuation using Projected Unit Credit Method, related details of which are given in note 11. Amount determined by the actuary as charge for the year is included in profit and loss account for the year.
Actuarial gains/losses exceeding 10 percent of the higher of projected benefit obligation and fair value of plan assets
are amortized over average future service of the employees. Compensated absences
The Company also provides for compensated absences for all employees in accordance with the rules of the Company. Charge during the year is included in profit and loss account for the year.
Annual Report of Fauji Fertilizer Bin Qasim Limited for the year ended 2012
| 65

3.2 Taxation
Income tax expense comprises current and deferred tax. Income tax expense is recognized in profit or loss except to the extent that it relates to items recognized directly in other comprehensive income in which case it is recognized in other comprehensive income.
Current
Current tax is the expected tax payable on the taxable income for the year, using tax rates enacted or substantively enacted at the reporting date, and any adjustment to tax payable in respect of previous years.
Deferred
Deferred tax is recognized using the balance sheet method, providing for temporary differences between the carrying amounts of assets and liabilities for financial reporting purposes and the amounts used for taxation purposes. Deferred tax is not recognized for the following temporary differences: the initial recognition of assets or liabilities in a transaction that is not a business combination and that affects neither accounting nor taxable profit or loss, and differences relating to investments in jointly controlled entities to the extent that it is probable that they will not reverse in the foreseeable future. In addition, deferred tax is not recognized for taxable temporary differences arising on the initial recognition of goodwill.
Deferred tax is measured at the tax rates that are expected to be applied to temporary differences when they reverse,
based on the laws that have been enacted or substantively enacted by the reporting date. Deferred tax assets and liabilities are offset if there is a legally enforceable right to offset current tax liabilities and assets, and they relate to income taxes levied by the same tax authority on the same taxable entity, or on different tax entities, but they intend to settle current tax liabilities and assets on a net basis or their tax assets and liabilities will be realized simultaneously.
A deferred tax asset is recognized to the extent that it is probable that future taxable profits will be available against
which the temporary difference can be utilized. Deferred tax assets are reviewed at each reporting date and are reduced to the extent that it is no longer probable that the related tax benefit will be realized.
3.3 Fixed assets
3.3.1 Property, plant and equipment and capital work in progress
Property, plant and equipment except for freehold land and capital work in progress are stated at cost less accumulated depreciation and impairment losses, if any. Freehold land and capital work in progress are stated at cost less allowance for impairment, if any. Cost includes expenditure that is directly attributable to the acquisition of the asset. The cost of self-constructed assets includes the cost of materials and direct labour, any other costs directly attributable to bring the assets to a working condition for their intended use, and the costs of dismantling and removing the items and restoring the site on which they are located.
When parts of an item of property, plant and equipment have different useful lives, they are accounted for as separate
items (major components) of property, plant and equipment. Gains and losses on disposal of an item of property, plant and equipment are determined by comparing the proceeds
from disposal with the carrying amount of property, plant and equipment, and are recognized net within “other income” in profit or loss.
The cost of replacing part of an item of property, plant and equipment is recognized in the carrying amount of the item
if it is probable that the future economic benefits embodied within the part will flow to the Company and its cost can be measured reliably. The carrying amount of the replaced part is derecognized. The costs of the day-to-day servicing of property, plant and equipment are recognized in profit or loss as incurred.
Notes to the Financial Statementsfor the year ended December 31, 2012
66 |
Depreciation is calculated on the straight line method and charged to profit and loss account to write off the depreciable amount of each asset over its estimated useful life at the rates specified in note 13. Depreciation on addition in property, plant and equipment is charged from the month of addition while no depreciation is charged in the month of disposal. Freehold land is not depreciated.
3.3.2 Intangibles
Intangibles are stated at the cash price equivalent of the consideration given, i.e., cash and cash equivalent paid less accumulated amortization and impairment loss, if any. Intangibles with finite useful life are amortized over the period of their useful life. Amortization is charged on a straight line basis over the estimated useful life and is included in the profit and loss account.
3.4 Borrowing costs
Borrowing costs which are directly attributable to the acquisition, construction or production of a qualifying asset are capitalized as part of the cost of that asset. Borrowing cost includes exchange differences arising from foreign currency borrowings to the extent these are regarded as an adjustment to borrowing costs. All other borrowing costs are charged to profit or loss.
3.5 Investments
3.5.1 Associates and jointly controlled entities (equity accounted investees)
Associates and jointly controlled entities are accounted for using the equity method (equity accounted investees) and are recognized initially at cost. The Company’s investment includes goodwill identified on acquisition, net of any accumulated impairment losses. Subsequent to initial recognition, the financial statements include the Company’s share of the profit or loss and other comprehensive income of equity accounted investees, after adjustments to align the accounting policies with those of the Company, from the date that significant influence or joint control commences until the date that significant influence or joint control ceases. When the Company’s share of losses exceeds its interest in an equity accounted investee, the carrying amount of that interest including any long-term interest is reduced to zero and the recognition of further losses is discontinued except to the extent that the Company has an obligation or has made payments on behalf of the investee.
Unrealized gains or losses arising from transactions with equity accounted investees are eliminated to the extent of
the Company’s interest in the investee. Unrealized losses are eliminated in the same way as unrealized gains, but only to the extent that there is no evidence of impairment. Investment in equity accounted investee is carried using equity method of accounting less impairment loss, if any.
3.5.2 Investments at fair value through profit or loss - held for trading
Investments which are acquired principally for the purpose of selling in the near term or the investments that are part of a portfolio of financial instruments exhibiting short term profit taking, are classified as investments at fair value through profit or loss-held for trading and designated as such upon initial recognition. These are stated at fair values with any resulting gains or losses recognized directly in the profit and loss account.
3.5.3 Loans and receivables
Investments are classified as loans and receivables which have fixed or determinable payments and are not quoted in an active market. These investments are measured at amortized cost using the effective interest method, less any impairment losses.
3.5.4 Investment available for sale
Available-for-sale financial assets are non-derivative financial assets that are designated as available-for-sale and that are not classified in any of the other categories. Subsequent to initial recognition, they are measured at fair value and changes therein, other than impairment losses and foreign currency differences on available-for-sale equity instruments, are recognized in other comprehensive income and presented within equity as reserve. When an
Annual Report of Fauji Fertilizer Bin Qasim Limited for the year ended 2012
| 67

investment is derecognized, the cumulative gain or loss in other comprehensive income is transferred to profit or loss. Unquoted equity investments are carried at cost less provision for impairment, if any.
The Company recognizes the regular way purchase or sale of financial assets using settlement date accounting. 3.5.5 Acquisition under common control
Acquisition under common control of the shareholder are initially recognized using a fair value accounting basis applying the requirements of IFRS 3 “Business Combinations”. All the acquisitions under common control are accounted for from the year in which the acquisition takes place without restating the Company’s (acquirer) comparative financial statements.
3.6 Goodwill
Goodwill represents the excess of the cost of the acquisition over the Company’s interest in the net fair value of the identifiable assets, liabilities and contingent liabilities of the acquiree. When the excess is negative (negative goodwill), it is recognized immediately in profit or loss. Subsequent to initial recognition, goodwill is measured at cost less accumulated impairment losses, if any. In respect of equity accounted investees, the carrying amount of goodwill is included in the carrying amount of the investment.
3.7 Impairment
Impairment losses are recognized as expense in the profit and loss account. An impairment loss is reversed if there has been a change in the estimates used to determine the recoverable amount. An impairment loss is reversed only to the extent that the asset’s carrying amount does not exceed the carrying amount that would have been determined, net of depreciation or amortization, if no impairment loss had been recognized. For non-financial assets, financial assets measured at amortized cost, available-for-sale financial assets that are debt securities, the reversal is recognized in profit and loss account. For available-for-sale financial assets that are equity securities, the reversal is recognized through other comprehensive income.
3.8 Stores and spares
These are valued at lower of weighted average cost and net realizable value less impairment. For items which are slow moving and/or identified as surplus to the Company’s requirement, an impairment is made.
3.9 Stock in trade
These are valued at the lower of weighted average cost and net realizable value except for stock in transit which is valued at cost comprising invoice value and related expenses incurred thereon up to the balance sheet date less impairment, if any.
Cost is determined as follows:
- Raw materials at weighted average purchase cost and directly attributable expenses
- Work-in-process and finished goods at weighted average cost of raw materials and related manufacturing expenses
Net realizable value signifies the estimated selling price in the ordinary course of business less the estimated costs of
completion and the estimated costs necessary to make the sale. 3.10 Financial instruments
Financial assets and financial liabilities are recognized when the Company becomes a party to the contractual provisions of the instrument and assets and liabilities are stated at fair value and amortized cost respectively. The Company de-recognizes the financial assets and liabilities when it ceases to be a party to such contractual provision of the instruments.
Notes to the Financial Statementsfor the year ended December 31, 2012
68 |

Trade and other payables
Liabilities for trade and other amounts payable are carried at amortized cost, which approximates the fair value of consideration to be paid in future for goods and services received, whether or not billed to the Company.
Trade debts and other receivables
Trade debts and other receivables are due on normal trade terms. These are stated at amortized cost as reduced by appropriate provision for impairment, if any. Bad debts are written off when identified.
Off-setting of financial assets and liabilities
A financial asset and a financial liability is offset and the net amount is reported in the balance sheet if the Company has a legally enforceable right to set-off the recognized amounts and intends either to settle on a net basis or to realize the asset and settle the liability simultaneously.
3.11 Cash and cash equivalents
For the purpose of cash flow statement, cash and cash equivalents comprise cash and bank balances, short term highly liquid investments and short term running finance.
3.12 Mark-up bearing borrowings
Mark-up bearing borrowings are recognized initially at cost, less attributable transaction costs. Subsequent to initial recognition, mark up bearing borrowings are stated at originally recognized amount less subsequent repayments, while the difference between the original recognized amounts (as reduced by periodic payments) and redemption value is recognized in the profit and loss account over the period of borrowings on an effective rate basis. The borrowing cost on qualifying asset is included in the cost of related asset as explained in note 3.4.
3.13 Provisions
A provision is recognized if, as a result of a past event, the Company has a present legal or constructive obligation that can be estimated reliably, and it is probable that an outflow of economic benefits will be required to settle the obligation. Provisions are determined by discounting the expected future cash flows at a pre-tax rate that reflects current market assessments of the time value of money and the risks specific to the liability.
3.14 Dividends
Dividend is recognized as a liability in the period in which it is declared. 3.15 Foreign currency
Foreign currency transactions
Transactions in foreign currency are accounted for at the exchange rates prevailing on the date of transactions. All monetary assets and liabilities denominated in foreign currencies at the year end are translated at exchange rates prevailing at the balance sheet date. Non monetary items that are measured in terms of historical cost in a foreign currency are translated using the exchange rate at the date of transaction. Exchange differences are included in profit and loss account for the year.
Investment in foreign joint venture
The results and financial position of joint venture that have a functional currency different from Pak Rupees are translated into Pak Rupees as follows:
- assets and liabilities for each balance sheet presented are translated at the closing rate at the date of the balance sheet. - income and expense items are translated at the average exchange rates for the period. - equity components are translated at the historical exchange rates.
Annual Report of Fauji Fertilizer Bin Qasim Limited for the year ended 2012
| 69

All resulting exchange differences are recognized in other comprehensive income within statement of comprehensive income. The Company has been recognizing such differences in translation reserve over the years. When a foreign investment is sold, in part or in full, the relevant amount in the translation reserve is transferred to profit and loss account as part of the profit or loss on sale.
3.16 Revenue recognition
Sale
Sales revenue is recognized when the goods are dispatched and significant risks and rewards of ownership are transferred to the customer. Revenue from sale of goods is measured at the fair value of consideration received or receivable, net of returns, commission and trade discounts.
Scrap sales and miscellaneous receipts
Scrap sales and miscellaneous receipts are recognized on realized amounts on accrual basis. 3.17 Basis of allocation of common expenses
The holding company under an agreement, allocates on a proportionate basis common selling and distribution expenses being the cost incurred and services rendered on behalf of the Company under an inter company services agreement.
3.18 Earnings per share
The Company presents basic and diluted earnings per share (EPS) data for its ordinary shares. Basic EPS is calculated by dividing the profit or loss attributable to ordinary shareholders of the Company by the weighted average number of ordinary shares outstanding during the period. Diluted EPS is determined by adjusting the profit or loss attributable to ordinary shareholders and the weighted average number of ordinary shares outstanding for the effects of all dilutive potential ordinary shares.
3.19 Finance income and finance costs
Finance income comprises interest income on funds invested, dividend income, gain on disposal of available-for-sale financial assets and changes in the fair value of investments held for trading. Interest income is recognized as it accrues in profit or loss, using the effective interest method. Dividend income is recognized in profit or loss on the date when the Company’s right to receive the payment is established.
Finance costs comprise interest expense on borrowings, changes in the fair value of held for trading investments
and impairment losses recognized on financial assets. Borrowing costs that are not directly attributable to the acquisition, construction or production of a qualifying asset are recognized in profit or loss using the effective interest method.
Foreign currency gains and losses are reported on a net basis. 3.20 New accounting standards and IFRIC interpretations
The following standards, amendments and interpretations of approved accounting standards, effective for accounting periods beginning as mentioned there against are either not relevant to the Company’s current operations or are not expected to have significant impact on the Company’s financial statements other than certain additional disclosures:
- IAS 27 Separate Financial Statements (2011) - (effective for annual periods beginning on or after 1 January 2013).
IAS 27 (2011) supersedes IAS 27 (2008). Three new standards IFRS 10 - Consolidated Financial Statements, IFRS 11- Joint Arrangements and IFRS 12- Disclosure of Interest in Other Entities dealing with IAS 27 would be applicable effective 1 January 2013. IAS 27 (2011) carries forward the existing accounting and disclosure requirements for separate financial statements, with some minor clarifications. The amendments have no impact on financial statements of the Company.
Notes to the Financial Statementsfor the year ended December 31, 2012
70 |

- IAS 28 Investments in Associates and Joint Ventures (2011) - (effective for annual periods beginning on or after 1 January 2013). IAS 28 (2011) supersedes IAS 28 (2008). IAS 28 (2011) makes the amendments to apply IFRS 5 to an investment, or a portion of an investment, in an associate or a joint venture that meets the criteria to be classified as held for sale; and on cessation of significant influence or joint control, even if an investment in an associate becomes an investment in a joint venture. The amendments have no impact on financial statements of the Company.
- IAS 19 Employee Benefits (amended 2011) - (effective for annual periods beginning on or after 1 January 2013). The
amended IAS 19 includes the amendments that require actuarial gains and losses to be recognized immediately in other comprehensive income; this change will remove the corridor method and eliminate the ability for entities to recognize all changes in the defined benefit obligation and in plan assets in profit or loss, which currently is allowed under IAS 19; and that the expected return on plan assets recognized in profit or loss is calculated based on the rate used to discount the defined benefit obligation. Following this change, unrecognized actuarial gains / losses will be recorded immediately in other comprehensive income.
-Presentation of Items of Other Comprehensive Income (Amendments to IAS 1) - (effective for annual periods beginning on or after 1 July 2012). The amendments require that an entity present separately the items of other comprehensive income that would be reclassified to profit or loss in the future if certain conditions are met from those that would never be reclassified to profit or loss. The amendments do not address which items are presented in other comprehensive income or which items need to be reclassified. The requirements of other IFRSs continue to apply in this regard. The amendments have no impact on financial statements of the Company.
-Offsetting Financial Assets and Financial Liabilities (Amendments to IAS 32) – (effective for annual periods beginning on or after 1 January 2014). The amendments address inconsistencies in current practice when applying the offsetting criteria in IAS 32 Financial Instruments: Presentation. The amendments clarify the meaning of ‘currently has a legally enforceable right of set-off’; and that some gross settlement systems may be considered equivalent to net settlement. This amendment may result in certain additional disclosures and presentational changes without any impact on the results of operations.
-Offsetting Financial Assets and Financial Liabilities (Amendments to IFRS 7) – (effective for annual periods beginning on or after 1 January 2013). The amendments to IFRS 7 contain new disclosure requirements for financial assets and liabilities that are offset in the statement of financial position or subject to master netting agreement or similar arrangement. This amendment may result in certain additional disclosures and presentational changes without any impact on the results of operations.
-Annual Improvements 2009–2011 (effective for annual periods beginning on or after 1 January 2013). The new cycle of improvements contains amendments to the following standards, with consequential amendments to other standards and interpretations:
- IAS 1 Presentation of Financial Statements is amended to clarify that only one comparative period – which is the preceding period – is required for a complete set of financial statements. If an entity presents additional comparative information, then that additional information need not be in the form of a complete set of financial statements. However, such information should be accompanied by related notes and should be in accordance with IFRS. Furthermore, it clarifies that the ‘third statement of financial position’, when required, is only required if the effect of restatement is material to statement of financial position.
- IAS 16 Property, Plant and Equipment is amended to clarify the accounting of spare parts, stand-by equipment and
servicing equipment. The definition of ‘property, plant and equipment’ in IAS 16 is now considered in determining whether these items should be accounted for under that standard. If these items do not meet the definition, then they are accounted for using IAS 2 Inventories. The amendments have no impact on financial statements of the Company.
- IAS 32 Financial Instruments: Presentation - is amended to clarify that IAS 12 Income Taxes applies to the accounting for income taxes relating to distributions to holders of an equity instrument and transaction costs of an equity transaction. The amendment removes a perceived inconsistency between IAS 32 and IAS 12.
Annual Report of Fauji Fertilizer Bin Qasim Limited for the year ended 2012
| 71
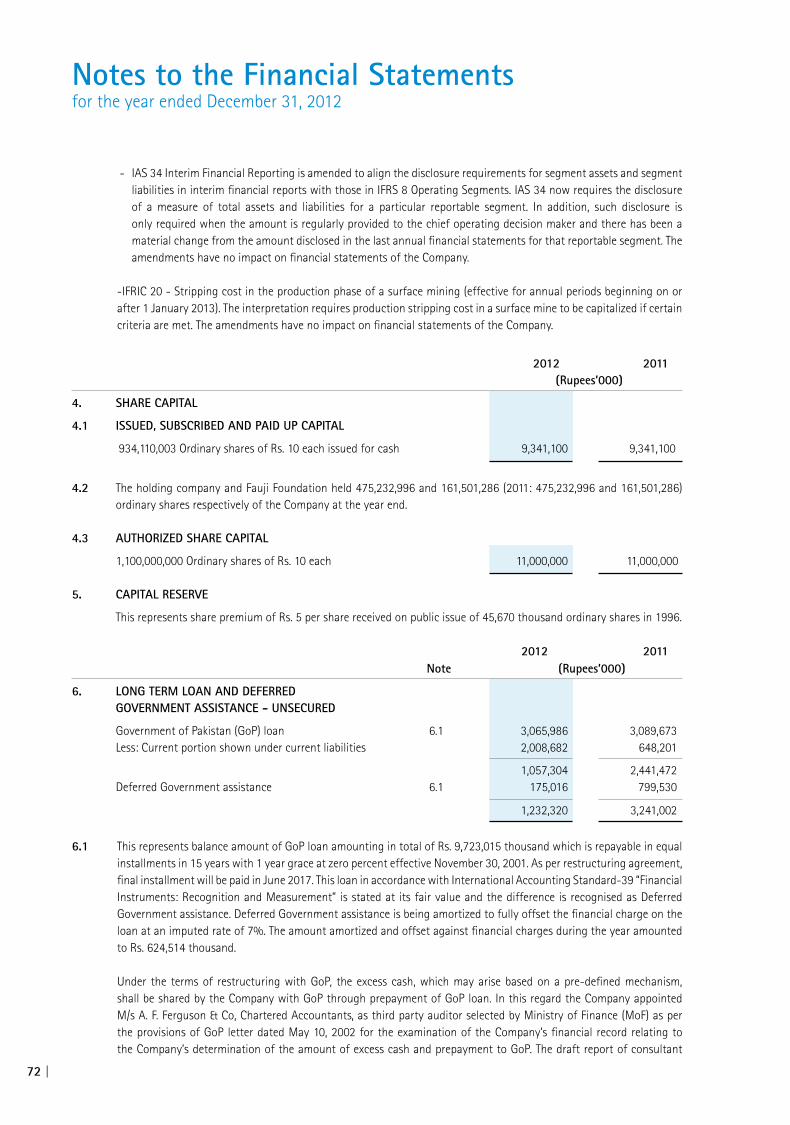
2012 2011 (Rupees’000)
4. SHARE CAPITAL
4.1 ISSUED, SUBSCRIBED AND PAID UP CAPITAL
934,110,003 Ordinary shares of Rs. 10 each issued for cash 9,341,100 9,341,100
4.2 The holding company and Fauji Foundation held 475,232,996 and 161,501,286 (2011: 475,232,996 and 161,501,286)
ordinary shares respectively of the Company at the year end. 4.3 AUTHORIZED SHARE CAPITAL
1,100,000,000 Ordinary shares of Rs. 10 each 11,000,000 11,000,000 5. CAPITAL RESERVE
This represents share premium of Rs. 5 per share received on public issue of 45,670 thousand ordinary shares in 1996.
2012 2011 Note (Rupees’000)
6. LONG TERM LOAN AND DEFERRED GOVERNMENT ASSISTANCE - UNSECURED
Government of Pakistan (GoP) loan 6.1 3,065,986 3,089,673 Less: Current portion shown under current liabilities 2,008,682 648,201
1,057,304 2,441,472 Deferred Government assistance 6.1 175,016 799,530
1,232,320 3,241,002
6.1 This represents balance amount of GoP loan amounting in total of Rs. 9,723,015 thousand which is repayable in equal installments in 15 years with 1 year grace at zero percent effective November 30, 2001. As per restructuring agreement, final installment will be paid in June 2017. This loan in accordance with International Accounting Standard-39 “Financial Instruments: Recognition and Measurement” is stated at its fair value and the difference is recognised as Deferred Government assistance. Deferred Government assistance is being amortized to fully offset the financial charge on the loan at an imputed rate of 7%. The amount amortized and offset against financial charges during the year amounted to Rs. 624,514 thousand.
Under the terms of restructuring with GoP, the excess cash, which may arise based on a pre-defined mechanism,
shall be shared by the Company with GoP through prepayment of GoP loan. In this regard the Company appointed M/s A. F. Ferguson & Co, Chartered Accountants, as third party auditor selected by Ministry of Finance (MoF) as per the provisions of GoP letter dated May 10, 2002 for the examination of the Company’s financial record relating to the Company’s determination of the amount of excess cash and prepayment to GoP. The draft report of consultant
- IAS 34 Interim Financial Reporting is amended to align the disclosure requirements for segment assets and segment liabilities in interim financial reports with those in IFRS 8 Operating Segments. IAS 34 now requires the disclosure of a measure of total assets and liabilities for a particular reportable segment. In addition, such disclosure is only required when the amount is regularly provided to the chief operating decision maker and there has been a material change from the amount disclosed in the last annual financial statements for that reportable segment. The amendments have no impact on financial statements of the Company.
-IFRIC 20 - Stripping cost in the production phase of a surface mining (effective for annual periods beginning on or after 1 January 2013). The interpretation requires production stripping cost in a surface mine to be capitalized if certain criteria are met. The amendments have no impact on financial statements of the Company.
Notes to the Financial Statementsfor the year ended December 31, 2012
72 |

2012 2011 Note (Rupees’000)
7. DEFERRED LIABILITIES Compensated leave absences 7.1 227,369 233,267 Deferred tax 7.2 3,445,270 3,406,875
3,672,639 3,640,142
7.1 Actuarial valuation has not been carried out as the impact is considered to be immaterial. 7.2 The balance of deferred tax is in respect of the following major taxable temporary differences:
Accelerated depreciation 3,523,482 3,489,403 Provision against doubtful receivables (18,734) (18,734) Share of (loss) / profit of associates (1,536) 2,034 Provision for inventory obsolescence (57,942) (65,828)
7.2.1 3,445,270 3,406,875
7.2.1 The movement of deferred tax during the current year is as follows:
Opening balance 3,406,875 3,672,289 Charge / (reversal) for the year 38,395 (265,414)
Closing balance 3,445,270 3,406,875 7.2.2 At December 31, 2012, a deferred tax liability of Rs. 285,125 thousand (2011: Rs. 260,423 thousand) on temporary
difference of Rs. 814,644 thousand (2011: Rs. 744,066 thousand) related to investment in the joint venture was not recognized as the Company controls the timing of reversal of temporary differences.
is under consideration and has been submitted to MoF for review and concurrence. Notwithstanding, a provisional amount of Rs. 1,360,481 thousand has been transferred to current portion as prepayment of GoP loan on the basis of excess cash determination mechanism as per GoP letter. The Company is in the process of finalizing the determination with GoP.
Loans from Export Credit Agencies (ECA), which were assumed by GoP, were initially secured by a guarantee issued by Habib Bank Limited (HBL) on behalf of a local syndicate of banks and financial institutions, which guarantee is secured by first equitable mortgage created on all immovable properties of the Company and by way of hypothecation of movable properties of the Company. The charge ranks pari passu with the charges to be created in favour of other foreign and local lenders. The local syndicate had requested the Company to obtain an indemnity from GoP confirming that it is GoP’s absolute obligation to indemnify and keep related banks and financial institutions harmless from any possible exposure on this account. Accordingly, on December 16, 2002, GoP had conveyed its agreement by assuming ECA loan liabilities by absolving related banks and financial institutions of their liabilities for which they earlier issued guarantees to ECA. As a result, two ECA have released the guarantee of HBL and have returned the original documents.
Since two ECA have yet to release HBL from its responsibility as guarantor therefore, the above referred guarantee and related charge on assets of the Company have not been vacated up to December 31, 2012. The Company is making efforts in getting this guarantee released.
Annual Report of Fauji Fertilizer Bin Qasim Limited for the year ended 2012
| 73

2012 2011 Note (Rupees’000)
8. TRADE AND OTHER PAYABLES
Creditors 7,282,685 6,959,609 Accrued liabilities 1,683,135 1,450,216 Advances from customers 736,766 726,978 Workers’ (Profit) Participation Fund - unsecured 8.1 16,824 17,241 Payable to Gratuity Fund - unsecured 11 51,301 26,747 Workers’ Welfare Fund 770,975 650,744 Unclaimed dividend 108,541 394,507 Withholding tax payable 3,095 2,786 Sales tax payable - net 229,428 280,242 Other payables 293,261 162,330
11,176,011 10,671,400 8.1 Workers’ (Profit) Participation Fund (WPPF)
Balance at beginning of the year 17,241 69,866 Interest on funds utilised in the Company’s business 921 1,139 Allocation for the year 28 346,824 867,241
364,986 938,246 Payment to WPPF during the year (348,162) (921,005)
16,824 17,241 9. MARK - UP ACCRUED
On short term borrowings 280,606 204,389
280,606 204,389 10. SHORT TERM BORROWINGS - SECURED
From banking companies and financial institutions 10.1 9,216,660 7,476,144
9,216,660 7,476,144 10.1 The Company has arranged short term facilities from various banks on mark-up basis with limits aggregating
Rs. 23,205,000 thousand (2011: Rs. 19,735,000 thousand). These facilities carry mark-up ranging from 9.43% to 10.67% per annum (2011: 12.04% to 14.23% per annum) and are secured by hypothecation of charge on current and fixed assets of the Company. The purchase prices are repayable on various dates by the Company.
Notes to the Financial Statementsfor the year ended December 31, 2012
74 |

2012 2011 (Rupees’000)
11. GRATUITY FUND
a) Reconciliation of amounts recognised in the balance sheet is as follow:
Present value of defined benefit obligation 373,646 287,097 Fair value of plan assets (249,770) (196,583)
Deficit 123,876 90,514 Net actuarial losses not recognised (72,575) (63,767)
51,301 26,747
b) The movement in the present value of defined benefit obligation is as follows:
Present value of defined benefit obligation at beginning of the year 287,097 227,243 Current service cost 43,762 36,200 Interest cost 34,870 31,097 Benefits paid during the year (16,276) (10,242) Actuarial loss 24,193 2,799
Present value of defined benefit obligation at end of the year 373,646 287,097 c) The movement in fair value of plan assets is as follows:
Fair value of plan assets at beginning of the year 196,583 143,278 Expected return on plan assets 23,556 20,355 Contributions 34,417 46,282 Benefits paid during the year (16,276) (10,242) Actuarial gain / (loss) 11,490 (3,090)
Fair value of plan assets at end of the year 249,770 196,583 d) Plan assets comprise of:
Investment in listed securities 43,446 60,121 Investment in bonds 27,308 27,798 Cash and bank balances 179,016 108,664
249,770 196,583 e) Actual return on plan assets 35,046 17,265
Contributions expected to be paid to the plan during the next financial year 59,171 52,408 f) The expected return on plan assets is based on the market expectations and depend upon the asset portfolio of the
Company, at the beginning of the year, for returns over the entire life of the related obligations.
g) Movement in liability recognised in the balance sheet:
Opening liability 26,747 20,757 Expense for the year 58,971 52,272 Payments to the fund during the year (34,417) (46,282)
Closing liability 51,301 26,747
Annual Report of Fauji Fertilizer Bin Qasim Limited for the year ended 2012
| 75
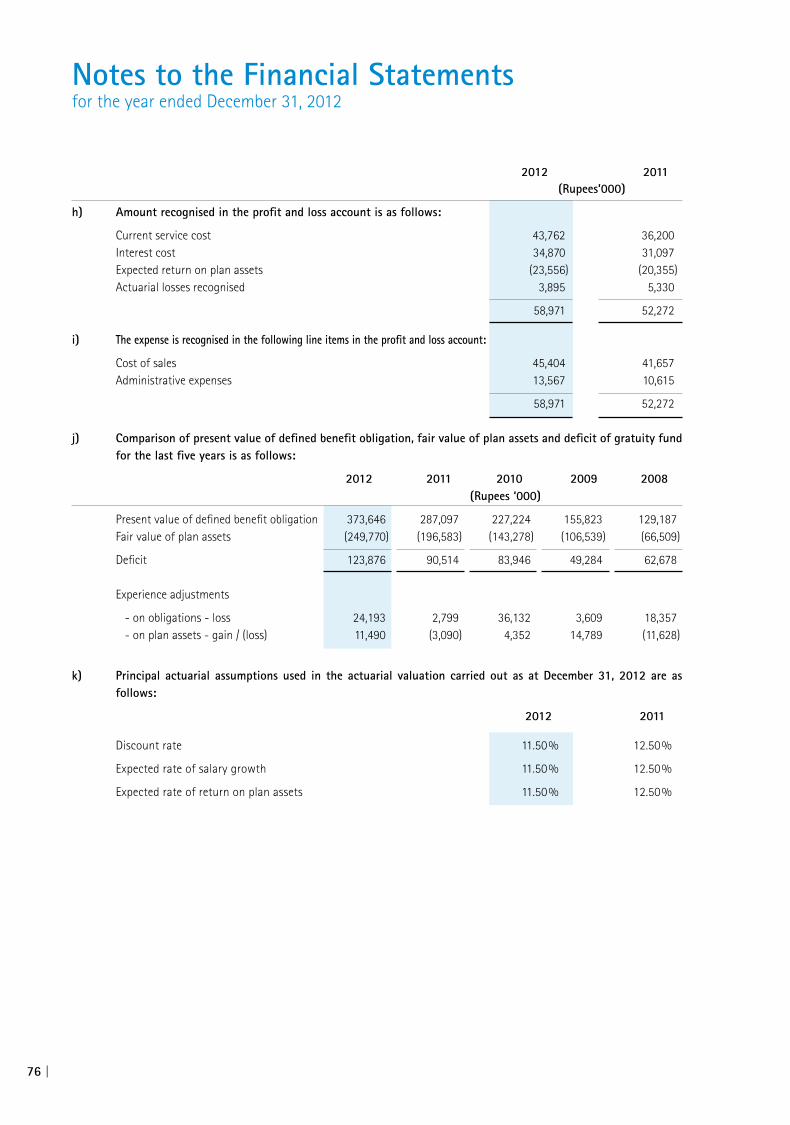
2012 2011 (Rupees’000)
h) Amount recognised in the profit and loss account is as follows:
Current service cost 43,762 36,200 Interest cost 34,870 31,097 Expected return on plan assets (23,556) (20,355) Actuarial losses recognised 3,895 5,330
58,971 52,272
i) The expense is recognised in the following line items in the profit and loss account:
Cost of sales 45,404 41,657 Administrative expenses 13,567 10,615
58,971 52,272 j) Comparison of present value of defined benefit obligation, fair value of plan assets and deficit of gratuity fund
for the last five years is as follows:
2012 2011 2010 2009 2008 (Rupees ‘000)
Present value of defined benefit obligation 373,646 287,097 227,224 155,823 129,187 Fair value of plan assets (249,770) (196,583) (143,278) (106,539) (66,509)
Deficit 123,876 90,514 83,946 49,284 62,678 Experience adjustments
- on obligations - loss 24,193 2,799 36,132 3,609 18,357 - on plan assets - gain / (loss) 11,490 (3,090) 4,352 14,789 (11,628)
k) Principal actuarial assumptions used in the actuarial valuation carried out as at December 31, 2012 are as follows:
2012 2011
Discount rate 11.50% 12.50%
Expected rate of salary growth 11.50% 12.50%
Expected rate of return on plan assets 11.50% 12.50%
Notes to the Financial Statementsfor the year ended December 31, 2012
76 |
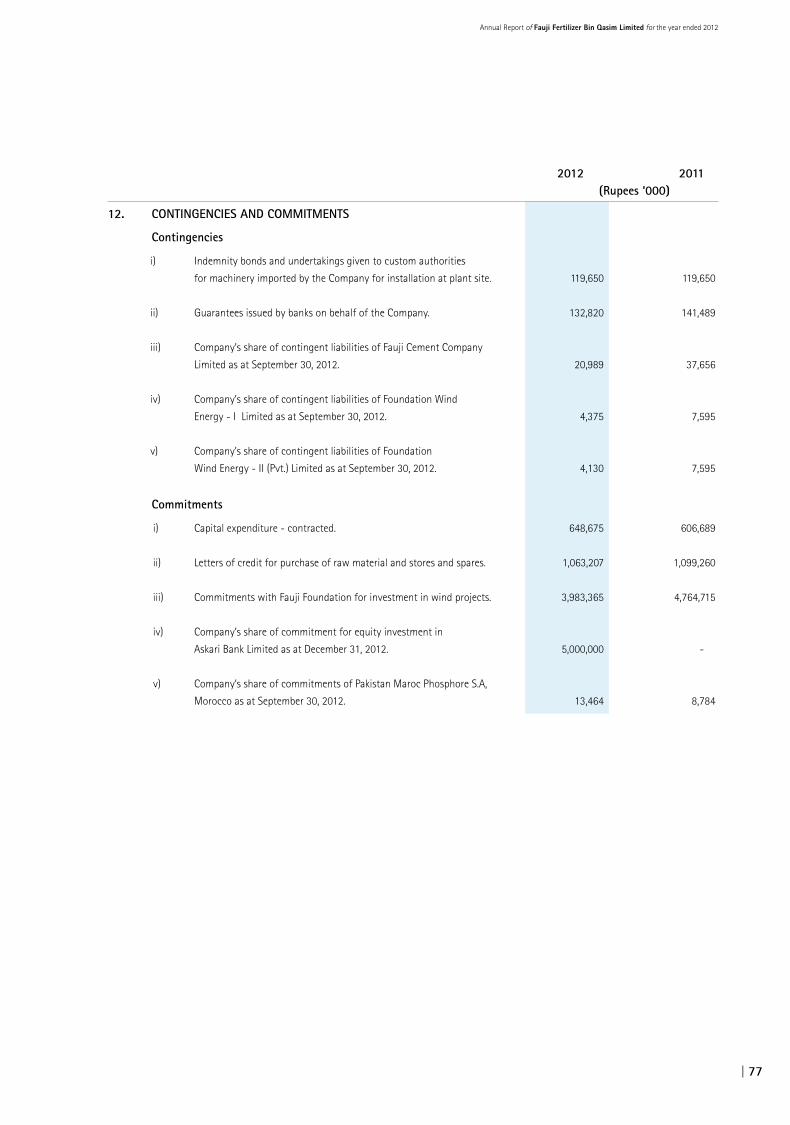
2012 2011 (Rupees ‘000)
12. CONTINGENCIES AND COMMITMENTS
Contingencies
i) Indemnity bonds and undertakings given to custom authorities
for machinery imported by the Company for installation at plant site. 119,650 119,650
ii) Guarantees issued by banks on behalf of the Company. 132,820 141,489
iii) Company’s share of contingent liabilities of Fauji Cement Company
Limited as at September 30, 2012. 20,989 37,656
iv) Company’s share of contingent liabilities of Foundation Wind
Energy - I Limited as at September 30, 2012. 4,375 7,595
v) Company’s share of contingent liabilities of Foundation
Wind Energy - II (Pvt.) Limited as at September 30, 2012. 4,130 7,595
Commitments
i) Capital expenditure - contracted. 648,675 606,689
ii) Letters of credit for purchase of raw material and stores and spares. 1,063,207 1,099,260
iii) Commitments with Fauji Foundation for investment in wind projects. 3,983,365 4,764,715
iv) Company’s share of commitment for equity investment in
Askari Bank Limited as at December 31, 2012. 5,000,000 -
v) Company’s share of commitments of Pakistan Maroc Phosphore S.A,
Morocco as at September 30, 2012. 13,464 8,784
Annual Report of Fauji Fertilizer Bin Qasim Limited for the year ended 2012
| 77

13.
FIXE
D AS
SETS
PRO
PERT
Y, P
LAN
T AN
D EQ
UIPM
ENT
IN
TANG
IBLE
S
Leas
ehol
d Fr
eeho
ld
Build
ings
Pl
ant a
nd
Furn
iture
Offic
e an
d Co
mpu
ter
Libra
ry
Ca
pita
l wor
k
lan
d lan
d on
leas
e
mac
hine
ry
and
fittin
gs
Vehi
cles
othe
r an
d an
cillar
y
book
s Ca
talys
t in
pro
gres
s To
tal
hold
land
equi
pmen
t eq
uipm
ent
(not
e 13
.1)
(Rup
ees
‘000
) (R
upee
s ‘00
0)
CO
ST
Ba
lanc
e as
at J
anua
ry 0
1, 2
011
213
,350
1
20,0
00
1,5
70,4
56
22,
221,
293
6
,378
2
25,0
77
53,
621
1
35,7
58
1,9
74
174
,597
7
48,5
09 2
5,47
1,01
3
98,
747
Ad
ditio
ns d
urin
g th
e ye
ar
-
-
84,
464
-
978
4
6,10
7
7,3
84
13,
393
1
12
-
9
27,9
99
1,0
80,4
37
9,4
58
Di
spos
als
-
-
(90)
(2
,000
) -
(23,
140)
(3
4)
(331
) -
-
-
(25,
595)
-
Tr
ansf
ers
-
-
-
1
20,8
85
-
-
-
-
-
-
(120
,885
) -
-
Ba
lanc
e as
at D
ecem
ber 3
1, 2
011
213
,350
1
20,0
00
1,6
54,8
30
22,
340,
178
7
,356
2
48,0
44
60,
971
1
48,8
20
2,0
86
174
,597
1
,555
,623
26,
525,
855
1
08,2
05
Ba
lanc
e as
at J
anua
ry 0
1, 2
012
213
,350
1
20,0
00
1,6
54,8
30
22,
340,
178
7
,356
2
48,0
44
60,
971
1
48,8
20
2,0
86
174
,597
1
,555
,623
26,
525,
855
1
08,2
05
Ad
ditio
ns d
urin
g th
e ye
ar
-
-
-
-
788
5
9,35
5
13,
219
7
,495
-
152
,129
6
18,0
90
851
,076
-
Di
spos
als
-
-
-
-
-
(3
6,89
1)
-
(4
52)
-
-
-
(3
7,34
3)
-
Ad
just
men
ts
-
-
-
(2
69,8
72)
-
3
3
341
1
55
-
-
(509
) (2
69,8
52)
-
Tr
ansf
ers
-
-
440
,560
1
,409
,535
-
-
-
-
-
-
(1
,850
,095
) -
-
Ba
lanc
e as
at
Dece
mbe
r 31,
201
2 2
13,3
50
120
,000
2
,095
,390
2
3,47
9,84
1
8,1
44
270
,541
7
4,53
1
156
,018
2
,086
3
26,7
26
323
,109
27,
069,
736
1
08,2
05
DE
PREC
IATI
ON
Ba
lanc
e as
at J
anua
ry 0
1, 2
011
73,
835
-
483
,360
1
0,02
8,20
5
1,4
09
89,
253
1
3,83
5
48,
180
1
,449
9
8,78
7
-
10,
838,
313
2
4,68
7
Ad
ditio
ns d
urin
g th
e ye
ar
4,6
39
-
4
7,71
3
1,1
05,8
82
728
5
9,17
5
8,3
74
41,
470
2
27
27,
772
-
1,2
95,9
80
37,
119
Di
spos
als
-
-
(12)
(1
,150
) -
(17,
299)
(1
7)
(129
) -
-
-
(18,
607)
-
Ba
lanc
e as
at D
ecem
ber 3
1, 2
011
78,
474
-
531
,061
1
1,13
2,93
7
2,1
37
131
,129
2
2,19
2
89,
521
1
,676
1
26,5
59
-
12,
115,
686
6
1,80
6
Ba
lanc
e as
at J
anua
ry 0
1, 2
012
78,
474
-
531
,061
1
1,13
2,93
7
2,1
37
131
,129
2
2,19
2
89,
521
1
,676
1
26,5
59
-
12,
115,
686
6
1,80
6
Ad
ditio
ns d
urin
g th
e ye
ar
4,6
39
-
5
1,89
7
1,1
49,0
04
743
5
7,35
0
9,0
50
41,
773
2
58
19,
836
-
1,3
34,5
50
37,
119
Di
spos
als
-
-
-
-
-
(2
9,88
3)
-
(3
12)
-
-
-
(3
0,19
5)
-
Ad
just
men
ts
-
-
-
(1
73,1
68)
-
-
-
2
1
-
-
-
(1
73,1
47)
-
Ba
lanc
e as
at
Dece
mbe
r 31,
201
2 8
3,11
3
-
5
82,9
58
12,
108,
773
2
,880
1
58,5
96
31,
242
1
31,0
03
1,9
34
146
,395
-
1
3,24
6,89
4
98,
925
W
ritte
n do
wn
valu
e -
2011
1
34,8
76
120
,000
1
,123
,769
1
1,20
7,24
1
5,2
19
116
,915
3
8,77
9
59,
299
4
10
48,
038
1
,555
,623
14,
410,
169
4
6,39
9
W
ritte
n do
wn
valu
e -
2012
1
30,2
37
120
,000
1
,512
,432
1
1,37
1,06
8
5,2
64
111
,945
4
3,28
9
25,
015
1
52
180
,331
3
23,1
09 1
3,82
2,84
2
9,2
80
Ra
te o
f de
prec
iatio
n 2
to 4
%
-
3%
5%
10
%
20 to
33%
15
%
33 to
50%
30
%
17
to 5
0%
-
33%
Notes to the Financial Statementsfor the year ended December 31, 2012
78 |
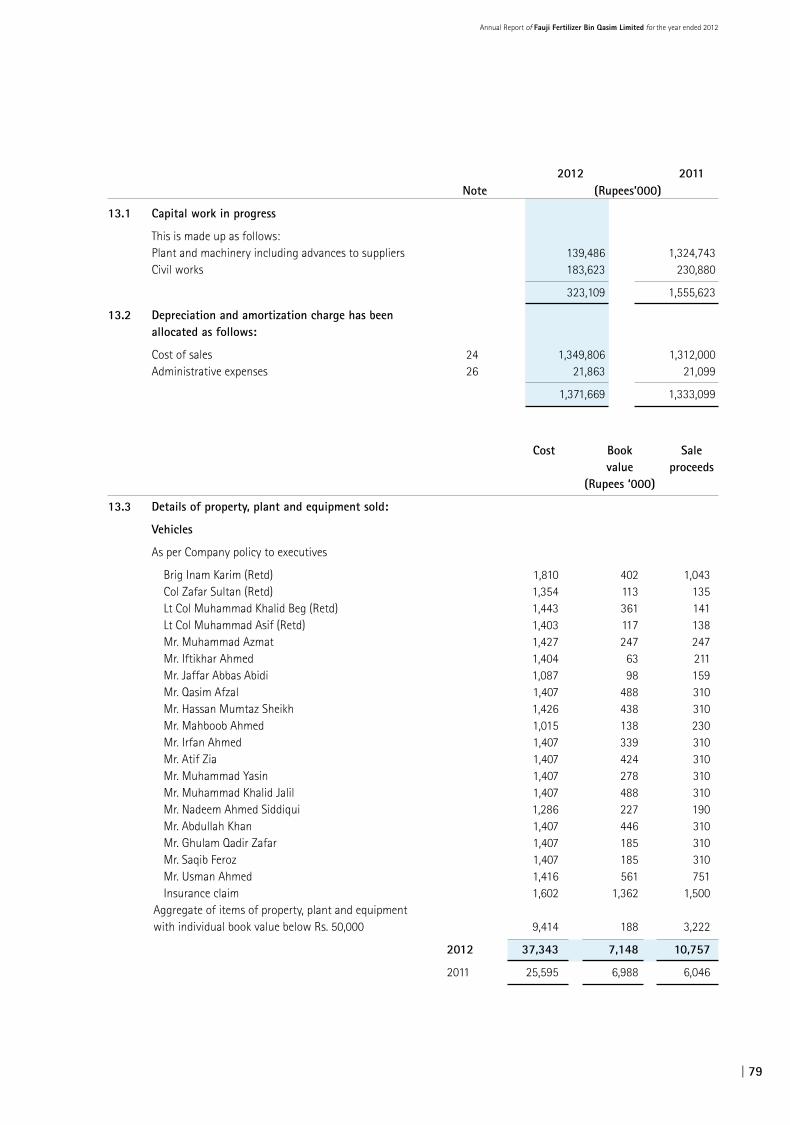
2012 2011 Note (Rupees’000)
13.1 Capital work in progress
This is made up as follows: Plant and machinery including advances to suppliers 139,486 1,324,743 Civil works 183,623 230,880
323,109 1,555,623
13.2 Depreciation and amortization charge has been allocated as follows:
Cost of sales 24 1,349,806 1,312,000 Administrative expenses 26 21,863 21,099
1,371,669 1,333,099
Cost Book Sale value proceeds (Rupees ‘000)
13.3 Details of property, plant and equipment sold:
Vehicles
As per Company policy to executives
Brig Inam Karim (Retd) 1,810 402 1,043 Col Zafar Sultan (Retd) 1,354 113 135 Lt Col Muhammad Khalid Beg (Retd) 1,443 361 141 Lt Col Muhammad Asif (Retd) 1,403 117 138 Mr. Muhammad Azmat 1,427 247 247 Mr. Iftikhar Ahmed 1,404 63 211 Mr. Jaffar Abbas Abidi 1,087 98 159 Mr. Qasim Afzal 1,407 488 310 Mr. Hassan Mumtaz Sheikh 1,426 438 310 Mr. Mahboob Ahmed 1,015 138 230 Mr. Irfan Ahmed 1,407 339 310 Mr. Atif Zia 1,407 424 310 Mr. Muhammad Yasin 1,407 278 310 Mr. Muhammad Khalid Jalil 1,407 488 310 Mr. Nadeem Ahmed Siddiqui 1,286 227 190 Mr. Abdullah Khan 1,407 446 310 Mr. Ghulam Qadir Zafar 1,407 185 310 Mr. Saqib Feroz 1,407 185 310 Mr. Usman Ahmed 1,416 561 751 Insurance claim 1,602 1,362 1,500 Aggregate of items of property, plant and equipment with individual book value below Rs. 50,000 9,414 188 3,222
2012 37,343 7,148 10,757
2011 25,595 6,988 6,046
Annual Report of Fauji Fertilizer Bin Qasim Limited for the year ended 2012
| 79

2012 2011 Note (Rupees’000)
14. LONG TERM INVESTMENTS
Investment in joint venture - equity method Pakistan Maroc Phosphore S.A, Morocco 14.1 Balance brought forward 2,155,216 1,900,560 Share of profit 42,446 255,054 Gain / (loss) during the year on translation of net assets 14.1.2 28,132 (398)
Closing balance 2,225,794 2,155,216 Investment in associates - equity method Fauji Cement Company Limited (FCCL) 14.2 Balance brought forward 342,866 334,695 Share of profit 8,722 8,171
Closing balance 351,588 342,866 Foundation Wind Energy - I Limited 14.3 Opening balance 119,409 - Advance paid during the year against issue of shares 233,664 131,160 Share of loss (23,683) (11,751)
Closing balance 329,390 119,409 Foundation Wind Energy - II (Pvt) Limited 14.3 Opening balance 93,346 - Advance paid during the year against issue of shares 547,686 104,125 Share of loss (20,742) (10,779)
Closing balance 620,290 93,346 Investment - available for sale - unquoted Arabian Sea Country Club Limited (ASCCL) 14.4 300,000 ordinary shares of Rs. 10 each 3,000 3,000 Less: Impairment in value of investment 3,000 3,000
- -
3,527,062 2,710,837 14.1 Cost of this investment is Moroccan Dirhams 200,000 thousand which represents 25% interest in Pakistan Maroc
Phosphore S.A. Morocco (PMP), a joint venture between the Company, Fauji Foundation, Fauji Fertilizer Company Limited and Officie Cherifien Des Phosphates, Morocco. The principal activity of PMP is to manufacture and market phosphoric acid, fertilizer and other related products in Morocco and abroad.
According to the shareholders’ agreement, if any legal restriction are laid on dividends by Pakistan Maroc Phosphor S.A.,
the Company’s equity will be converted to interest bearing loan. The Company has also committed not to pledge shares of PMP without prior consent of PMPs’ lenders.
Notes to the Financial Statementsfor the year ended December 31, 2012
80 |

14.1.1 Summary of financial information for equity accounted investees as per their financial statements, not adjusted for the percentage ownership of the Company.
September September September September September September September September 2012 2011 2012 2011 2012 2011 2012 2011
PMP (Joint venture) FCCL (Associate) Foundation Wind Energy-l Foundation Wind Energy-ll (Associate) (Associate)
(Rupees in ‘000)
Non - current assets 12,646,128 13,819,766 26,223,163 27,808,729 392,051 14,406 407,093 31,946
Non - current liabilities (5,293,068) (7,335,342) (11,007,862) (12,246,697) - - - (100,090)
Current assets 13,813,705 14,646,899 4,525,607 4,575,385 159,556 131,837 482,671 136,844
Current liabilities (12,263,599) (12,510,466) (5,435,643) (6,648,437) (8,771) (6,184) (11,234) (7,345)
Revenue for the period 20,881,282 24,215,172 10,757,610 4,119,151 11,390 1,040 20,804 1,579
Expenses for the period (21,555,366) (23,949,274) (9,741,587) (3,840,804) (57,490) (34,617) (56,532) (32,376)
(Loss) / profit for the period (674,084) 265,898 1,016,023 278,347 (46,100) (33,577) (35,728) (30,797)
Financial statements for the period ended September 30, 2012 have been used for accounting under equity method as
these were the latest approved financial statements. Further, results of operations of last quarter of 2011 have also been considered for equity accounting.
14.1.2 This represents Company’s share of translation reserve of PMP. This has arisen due to movement in exchange rate parity
between the Moroccan Dirhams and Pak Rupees. 14.2 Fair value of investment in FCCL as at December 31, 2012 was Rs. 122,625 thousand (2011: Rs. 61,875 thousand).
The management, however believes that the recoverable amount of this investment is higher than the fair value as at December 31, 2012. The Company holds 1.36% interest in FCCL which is less than 20%, however it is concluded that the Company has significant influence due to its representation on the Board of Directors of FCCL.
The recoverable amount of the investment in Fauji Cement Company Limited was tested for impairment based on value
in use, in accordance with IAS - 36. The value in use calculations are based on cash flow projections based on the budget approved by management for 2012. These are then extrapolated for a period of 5 years using a steady long term expected growth of 3% p.a. and terminal value determined based on long term earning multiples. The cash flows are discounted using a post-tax discount rate of 13.07% p.a. Based on this calculation, no impairment has been accounted for.
The Company is committed not to dispose off its investment in FCCL so long as the loan extended to FCCL by the Royal
Bank of Scotland remains outstanding or without prior consent of FCCL. 14.3 Foundation Wind Energy-I Limited and Foundation Wind Energy-II (Private) Limited are in a process of setting up
49.5 MW wind power plant each. Total estimated cost for each plant is US$ 130 million. Pursuant to Share Holders Agreement dated 08 March 2011 the Company will eventually hold 35% shareholding each in Foundation Wind Energy-I and Foundation Wind Energy-II (Pvt) Limited. The projects are expected to commence commercial production in 2013.
14.4 As per audited accounts of ASCCL for the year ended June 30, 2012, the break-up value of an ordinary share was
Rs. 8.72 (June 30, 2011: Rs. 7.90).
Annual Report of Fauji Fertilizer Bin Qasim Limited for the year ended 2012
| 81
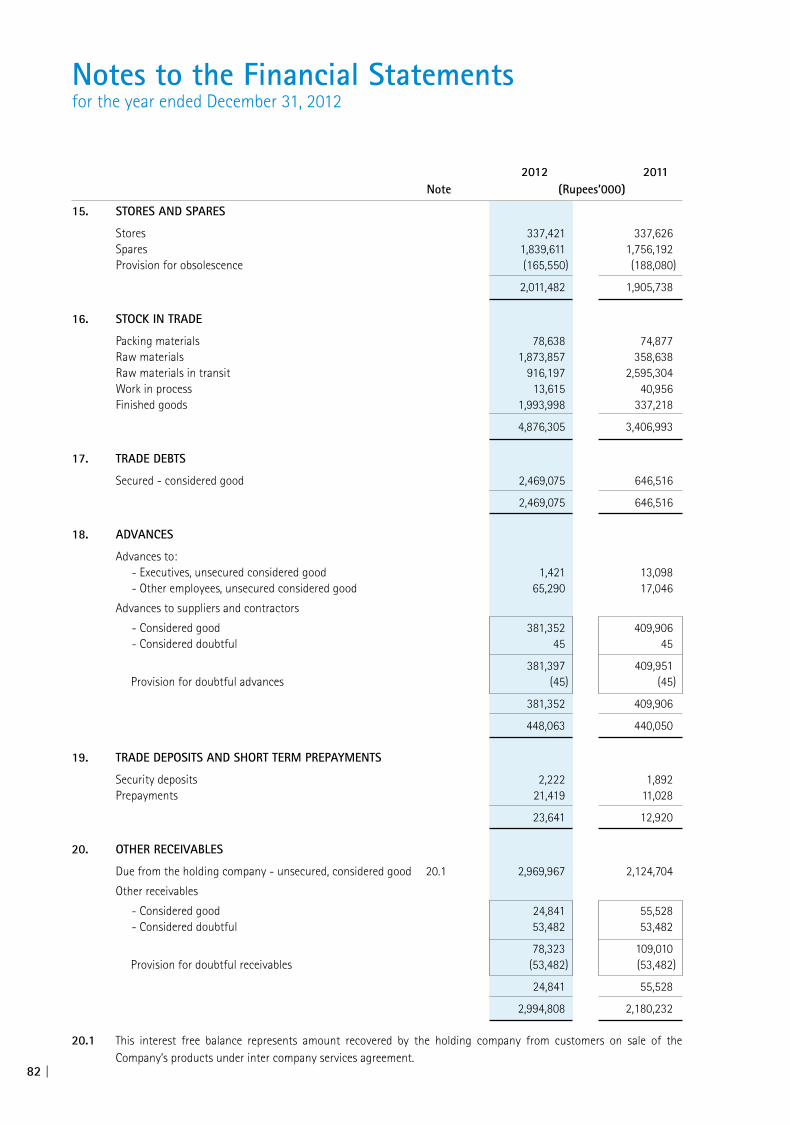
2012 2011 Note (Rupees’000)
15. STORES AND SPARES
Stores 337,421 337,626 Spares 1,839,611 1,756,192 Provision for obsolescence (165,550) (188,080)
2,011,482 1,905,738 16. STOCK IN TRADE
Packing materials 78,638 74,877 Raw materials 1,873,857 358,638 Raw materials in transit 916,197 2,595,304 Work in process 13,615 40,956 Finished goods 1,993,998 337,218
4,876,305 3,406,993 17. TRADE DEBTS
Secured - considered good 2,469,075 646,516
2,469,075 646,516
18. ADVANCES
Advances to: - Executives, unsecured considered good 1,421 13,098 - Other employees, unsecured considered good 65,290 17,046
Advances to suppliers and contractors
- Considered good 381,352 409,906 - Considered doubtful 45 45
381,397 409,951 Provision for doubtful advances (45) (45)
381,352 409,906
448,063 440,050 19. TRADE DEPOSITS AND SHORT TERM PREPAYMENTS
Security deposits 2,222 1,892 Prepayments 21,419 11,028
23,641 12,920 20. OTHER RECEIVABLES
Due from the holding company - unsecured, considered good 20.1 2,969,967 2,124,704
Other receivables
- Considered good 24,841 55,528 - Considered doubtful 53,482 53,482
78,323 109,010 Provision for doubtful receivables (53,482) (53,482)
24,841 55,528
2,994,808 2,180,232
20.1 This interest free balance represents amount recovered by the holding company from customers on sale of the Company’s products under inter company services agreement.
Notes to the Financial Statementsfor the year ended December 31, 2012
82 |

2012 2011 Note (Rupees’000)
21. SHORT TERM INVESTMENTS
Loans and receivables
Term deposits with banks and financial institutions 1,550,000 1,250,000 Investments at fair value through profit or loss - held for trading
Money market funds - 7,588,237
1,550,000 8,838,237 22. CASH AND BANK BALANCES
Deposit accounts - in local currency 22.1 8,652,271 4,978,875 - in foreign currency 1,888 1,607
8,654,159 4,980,482 Current accounts 134,278 403,406 Cash in hand 530 475
8,788,967 5,384,363 22.1 This includes Rs. 210,560 thousand (2011: Rs. 126,541 thousand) held under lien by the commercial banks against
credit facilities.
2012 2011 Note (Rupees’000)
23. TURNOVER
Gross Sales 55,835,454 63,795,916 Less: Sales tax 7,701,485 7,893,824 Trade discounts 205,000 11,347 Commission to the holding company 23.1 17,805 21,911
7,924,290 7,927,082
47,911,164 55,868,834
23.1 Commission is paid @ Re. 1 per bag sold by the holding company, based on inter company services agreement.
Annual Report of Fauji Fertilizer Bin Qasim Limited for the year ended 2012
| 83

2012 2011 Note (Rupees’000)
24. COST OF SALES
Raw materials consumed 30,949,410 28,950,284 Packing materials consumed 513,720 597,044 Fuel and power 2,273,585 2,048,095 Chemicals and supplies consumed 159,522 193,920 Salaries, wages and benefits 24.1 1,504,639 1,512,249 Rent, rates and taxes 16,672 26,781 Insurance 101,265 103,747 Travel and conveyance 158,969 138,848 Repairs and maintenance 944,606 852,555 Communication, establishment and other expenses 107,287 117,826 Depreciation 13.2 1,349,806 1,312,000 Opening stock - work in process 40,956 29,493 Closing stock - work in process (13,615) (40,956)
Cost of goods manufactured 38,106,822 35,841,886 Opening stock - finished goods 337,218 248,596 Closing stock - finished goods (1,993,998) (337,218)
Cost of sales 36,450,042 35,753,264 24.1 This includes charge on account of employees’ retirement benefits in respect of gratuity, provident fund and
compensated absences amounting to Rs. 45,404 thousand, Rs. 31,249 thousand and Rs. 4,354 thousand respectively. (2011: Rs. 41,657 thousand, Rs. 28,822 thousand and Rs. 49,289 thousand respectively).
2012 2011 Note (Rupees’000)
25. SELLING AND DISTRIBUTION EXPENSES
Product transportation 2,063,609 1,908,204
Expenses charged by the holding company 25.1
Salaries, wages and benefits 408,843 435,032 Rent, rates and taxes 45,971 31,957 Technical services 3,565 3,927 Travel and conveyance 59,611 41,901 Sales promotion and advertising 20,091 19,191 Communication, establishment and other expenses 44,900 73,013 Warehousing expenses 13,165 29,529 Depreciation 5,970 11,041
602,116 645,591
2,665,725 2,553,795 25.1 This represents common expenses charged by the holding company on account of marketing of the Company’s products
based on an inter company services agreement.
Notes to the Financial Statementsfor the year ended December 31, 2012
84 |

2012 2011 Note (Rupees’000)
26. ADMINISTRATIVE EXPENSES
Salaries, wages and benefits 26.1 499,667 501,232 Travel and conveyance 164,167 128,400 Utilities 6,271 5,061 Printing and stationery 7,650 8,804 Repairs and maintenance 12,933 11,589 Communication, advertisement and other expenses 31,520 42,005 Rent, rates and taxes 10,419 8,489 Listing fee 1,133 738 Donations 26.2 95,213 6,499 Legal and professional 86,981 12,293 Depreciation 13.2 21,863 21,099 Miscellaneous 46,196 31,081
984,013 777,290 26.1 This includes charge on account of employees’ retirement benefits in respect of gratuity, provident fund and
compensated absences amounting to Rs. 13,567 thousand, Rs. 10,825 thousand and Rs. 2,928 thousand respectively (2011: Rs. 10,615 thousand, Rs. 9,040 thousand and Rs. 18,020 thousand respectively).
26.2 During the year, the Company has paid donation of Rs. 95,213 thousand out of which following donation was paid to
the project of Fauji Foundation (FF). Last year the Company has not paid donation to any organization in which any director or his spouse has interest.
Particulars of project Address (Rupees ‘000)
Shaukat Omer Memorial Hospital Shah Faisal Colony, Karachi 50,000 - The interest of the following Directors of the Company constitutes by way of being management staff of FF:
Lt Gen Muhammad Mustafa Khan, HI(M), (Retd)
Maj Gen Ghulam Haider, HI(M), (Retd)
Brig Parvez Sarwar Khan, SI(M), (Retd)
Brig Dr Gulfam Alam, SI(M), (Retd)
Brig Muhammad Saeed Khan, (Retd)
Dr Nadeem Inayat
Mr Qaiser Javed
2012 2011 (Rupees’000)
27. FINANCE COST
Mark-up on long term financing - Banking companies and financial institutions - 3,541 Mark-up on long term murabaha - 328 Mark-up on short term borrowings 1,369,457 811,478 Interest on Workers’ (Profit) Participation Fund 921 1,139 Bank charges 15,878 13,266 Exchange loss 435,215 258,118
1,821,471 1,087,870
Annual Report of Fauji Fertilizer Bin Qasim Limited for the year ended 2012
| 85

2012 2011 Note (Rupees’000)
28. OTHER OPERATING EXPENSES
Workers’ (Profit) Participation Fund 8.1 346,824 867,241 Workers’ Welfare Fund 120,231 307,630 Property, plant and equipment written off 96,704 942
Auditor’s remuneration
Fees - annual audit 1,000 1,000 Fees - half yearly review 100 100 Other certification & services 195 117 Out of pocket expenses 185 50
1,480 1,267
565,239 1,177,080
29. OTHER INCOME
Income from financial assets
Profit on bank balances and term deposits 357,959 436,361 Dividend on investment in money market funds 495,280 913,955 Unrealised gain on investment at fair value through profit or loss - 16,015 (Loss) / gain on sale of investments (4,997) 33,049
848,242 1,399,380 Income from assets other than financial assets
Scrap sales and miscellaneous receipts 186,159 10,334 Gain on sale of property, plant and equipment 3,609 -
1,038,010 1,409,714 30. TAXATION
Current 2,092,884 5,668,210 Deferred 38,395 (265,414)
2,131,279 5,402,796
2012 2011
(Rupees ‘000) % (Rupees ‘000) %
30.1 Reconciliation of tax charge for the year:
Profit before tax 6,469,427 16,169,944
Tax on profit 2,264,299 35.00 5,659,480 35.00 Tax effect of lower rate on certain income / expenses 8,926 0.14 (6,342) (0.04) Tax effect of exempt income / permanent differences (141,946) (2.19) (250,342) (1.55)
2,131,279 32.95 5,402,796 33.41 30.2 The Company has revised its income tax returns relating to tax years 2007, 2008 and 2009 under the provisions of the
Income Tax Ordinance 2001.
Notes to the Financial Statementsfor the year ended December 31, 2012
86 |

2012 2011
31. EARNINGS PER SHARE - BASIC AND DILUTED
Profit after taxation (Rupees ‘000) 4,338,148 10,767,148
Weighted average number of ordinary shares in issue during the year (thousands) 934,110 934,110
Earnings per share - basic and diluted (Rupees) 4.64 11.53
There is no dilutive effect on the basic earnings per share of the Company for the year 2012.
2012 2011 Note (Rupees’000)
32. CASH GENERATED FROM OPERATIONS
Profit before taxation 6,469,427 16,169,944
Adjustments for:
Provision for gratuity 58,971 52,272 Exchange losses 435,215 258,118 Provision for compensated absences 7,282 67,309 Provision for Workers’ (Profit) Participation Fund 8.1 346,824 867,241 Provision for Workers’ Welfare Fund 120,231 307,630 Property, plant and equipment written off 96,704 - Depreciation 13.2 1,371,669 1,333,099 Finance cost 1,386,256 829,752 Gain on investments including dividend received (490,283) (963,019) Share of profits of joint venture and associates (6,743) (240,695) Profit on bank balances and term deposits (357,959) (436,361) (Gain) / loss on sale of property, plant and equipment (3,609) 942
Operating profit before working capital changes 9,433,985 18,246,232
Changes in working capital
Stores and spares (105,744) (110,444) Stock in trade (1,469,312) (2,136,326) Trade debts (1,822,559) 183,469 Advances (8,013) (218,744) Trade deposits and short term prepayments (10,721) 1,062 Other receivables (814,576) (2,081,223) Trade and other payables 210,995 1,470,762
(4,019,930) (2,891,444)
5,414,055 15,354,788
Annual Report of Fauji Fertilizer Bin Qasim Limited for the year ended 2012
| 87
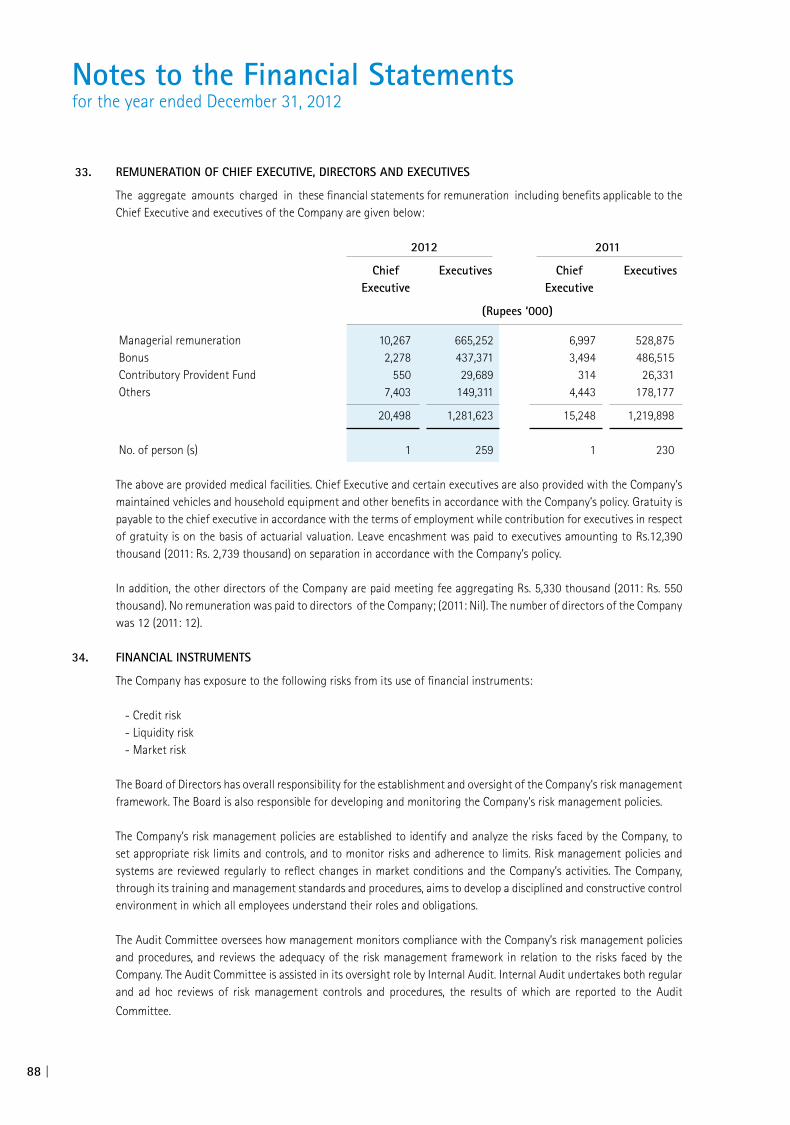
33. REMUNERATION OF CHIEF EXECUTIVE, DIRECTORS AND EXECUTIVES
The aggregate amounts charged in these financial statements for remuneration including benefits applicable to the Chief Executive and executives of the Company are given below:
2012 2011
Chief Executives Chief Executives Executive Executive
(Rupees ‘000)
Managerial remuneration 10,267 665,252 6,997 528,875 Bonus 2,278 437,371 3,494 486,515 Contributory Provident Fund 550 29,689 314 26,331 Others 7,403 149,311 4,443 178,177
20,498 1,281,623 15,248 1,219,898 No. of person (s) 1 259 1 230 The above are provided medical facilities. Chief Executive and certain executives are also provided with the Company’s
maintained vehicles and household equipment and other benefits in accordance with the Company’s policy. Gratuity is payable to the chief executive in accordance with the terms of employment while contribution for executives in respect of gratuity is on the basis of actuarial valuation. Leave encashment was paid to executives amounting to Rs.12,390 thousand (2011: Rs. 2,739 thousand) on separation in accordance with the Company’s policy.
In addition, the other directors of the Company are paid meeting fee aggregating Rs. 5,330 thousand (2011: Rs. 550
thousand). No remuneration was paid to directors of the Company; (2011: Nil). The number of directors of the Company was 12 (2011: 12).
34. FINANCIAL INSTRUMENTS
The Company has exposure to the following risks from its use of financial instruments: - Credit risk - Liquidity risk - Market risk The Board of Directors has overall responsibility for the establishment and oversight of the Company’s risk management
framework. The Board is also responsible for developing and monitoring the Company’s risk management policies. The Company’s risk management policies are established to identify and analyze the risks faced by the Company, to
set appropriate risk limits and controls, and to monitor risks and adherence to limits. Risk management policies and systems are reviewed regularly to reflect changes in market conditions and the Company’s activities. The Company, through its training and management standards and procedures, aims to develop a disciplined and constructive control environment in which all employees understand their roles and obligations.
The Audit Committee oversees how management monitors compliance with the Company’s risk management policies
and procedures, and reviews the adequacy of the risk management framework in relation to the risks faced by the Company. The Audit Committee is assisted in its oversight role by Internal Audit. Internal Audit undertakes both regular and ad hoc reviews of risk management controls and procedures, the results of which are reported to the Audit
Committee.
Notes to the Financial Statementsfor the year ended December 31, 2012
88 |

34.1 Credit risk
Credit risk is the risk of financial loss to the Company if a customer or counterparty to a financial instrument fails to meet its contractual obligations, and arises principally from trade debts, deposits, advances, interest accrued, short term investments, other receivables and bank balances. The carrying amount of financial assets represents the maximum credit exposure. The maximum exposure to credit risk at the reporting date was:
2012 2011 (Rupees’000)
Trade debts 2,469,075 646,516 Deposits 78,534 78,204 Interest accrued 39,317 51,041 Other receivables - net of provision 2,994,808 2,180,232 Short term investments 1,550,000 8,838,237 Bank balances 8,788,437 5,383,888
15,920,171 17,178,118 Geographically there is no concentration of credit risk. The maximum exposure to credit risk for trade debts at the reporting date are with dealers within the country. The Company’s most significant amount receivable is from holding company which amounts to Rs. 2,969,967 thousand
(2011: Rs. 2,124,704 thousands) and which is included in total carrying amount of other receivables as at reporting date. At the balance sheet date this receivable is not overdue or impaired.
Trade debts are secured against letter of guarantee. The Company has placed funds in financial institutions with high
credit ratings. The Company assesses the credit quality of the counter parties as satisfactory. The Company does not hold any collateral as security against any of its financial assets other than trade debts.
The Company limits its exposure to credit risk by investing only in liquid securities and placing funds with banks
that have high credit rating. Management actively monitors credit ratings and given that the Company only has placed funds in the banks with high credit ratings, management does not expect any counterparty to fail to meet its obligations.
Impairment losses
As at the reporting date trade receivables of Rs. Nil (2011: Rs Nil) were over-due. Based on past experience, the management believes that no impairment allowance is necessary in respect of trade debts.
The Company has recorded an impairment loss of Rs. 3,000 thousand (2011 : Rs. 3,000 thousand) in respect of its
investment in available-for-sale investments. 34.2 Liquidity risk
Liquidity risk is the risk that the Company will not be able to meet its financial obligations as they fall due. The Company’s approach to managing liquidity is to ensure, as far as possible, that it will always have sufficient liquidity to meet its liabilities when due, under both normal and stressed conditions, without incurring unacceptable losses or risking damage to the Company’s reputation. The management uses different methods which assists it in monitoring cash flow requirements and optimizing the return on investments. Typically the Company ensures that it has sufficient cash on demand to meet expected operational expenses for a reasonable period, including the servicing of financial obligation; this excludes the potential impact of extreme circumstances that cannot reasonably be predicted, such as natural disasters. In addition, the Company maintains lines of credit as mentioned in note 10 to the financial statements.
Annual Report of Fauji Fertilizer Bin Qasim Limited for the year ended 2012
| 89
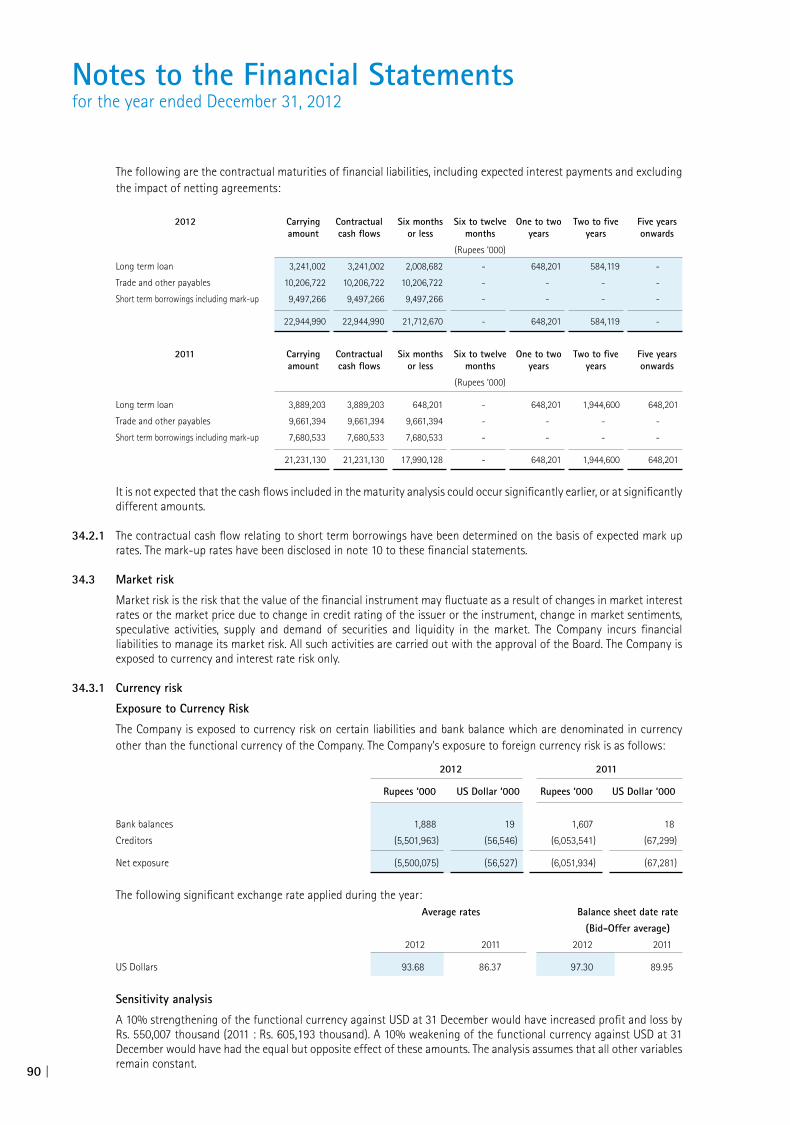
The following are the contractual maturities of financial liabilities, including expected interest payments and excluding the impact of netting agreements:
2012 Carrying Contractual Six months Six to twelve One to two Two to five Five years amount cash flows or less months years years onwards
(Rupees ‘000)
Long term loan 3,241,002 3,241,002 2,008,682 - 648,201 584,119 -
Trade and other payables 10,206,722 10,206,722 10,206,722 - - - -
Short term borrowings including mark-up 9,497,266 9,497,266 9,497,266 - - - -
22,944,990 22,944,990 21,712,670 - 648,201 584,119 -
2011 Carrying Contractual Six months Six to twelve One to two Two to five Five years amount cash flows or less months years years onwards
(Rupees ‘000)
Long term loan 3,889,203 3,889,203 648,201 - 648,201 1,944,600 648,201
Trade and other payables 9,661,394 9,661,394 9,661,394 - - - -
Short term borrowings including mark-up 7,680,533 7,680,533 7,680,533 - - - -
21,231,130 21,231,130 17,990,128 - 648,201 1,944,600 648,201
It is not expected that the cash flows included in the maturity analysis could occur significantly earlier, or at significantly different amounts.
34.2.1 The contractual cash flow relating to short term borrowings have been determined on the basis of expected mark up rates. The mark-up rates have been disclosed in note 10 to these financial statements.
34.3 Market risk
Market risk is the risk that the value of the financial instrument may fluctuate as a result of changes in market interest rates or the market price due to change in credit rating of the issuer or the instrument, change in market sentiments, speculative activities, supply and demand of securities and liquidity in the market. The Company incurs financial liabilities to manage its market risk. All such activities are carried out with the approval of the Board. The Company is exposed to currency and interest rate risk only.
34.3.1 Currency risk
Exposure to Currency Risk
The Company is exposed to currency risk on certain liabilities and bank balance which are denominated in currency other than the functional currency of the Company. The Company’s exposure to foreign currency risk is as follows:
2012 2011
Rupees ‘000 US Dollar ‘000 Rupees ‘000 US Dollar ‘000
Bank balances 1,888 19 1,607 18
Creditors (5,501,963) (56,546) (6,053,541) (67,299)
Net exposure (5,500,075) (56,527) (6,051,934) (67,281)
The following significant exchange rate applied during the year: Average rates Balance sheet date rate
(Bid-Offer average)
2012 2011 2012 2011
US Dollars 93.68 86.37 97.30 89.95
Sensitivity analysis
A 10% strengthening of the functional currency against USD at 31 December would have increased profit and loss by Rs. 550,007 thousand (2011 : Rs. 605,193 thousand). A 10% weakening of the functional currency against USD at 31 December would have had the equal but opposite effect of these amounts. The analysis assumes that all other variables remain constant.
Notes to the Financial Statementsfor the year ended December 31, 2012
90 |

34.3.2 Interest rate risk
The interest rate risk is the risk that the fair value or the future cash flows of a financial instrument will fluctuate because of changes in market interest rates. Majority of the interest rate exposure arises from short term borrowings from banks and short term deposits with banks. At the balance sheet date the interest rate risk profile of the Company’s interest bearing financial instruments is:
Carrying Amount 2012 2011 (Rupees’000)
Fixed rate instruments
Financial assets 1,550,000 1,250,000
Financial liabilities 3,595,000 6,395,000 Variable rate instruments
Financial assets 8,654,159 4,980,482
Financial liabilities 5,621,660 1,081,144
Fair value sensitivity analysis for fixed rate instruments
The Company is not exposed to interest rate risk on its fixed rate instruments. Cash flow sensitivity analysis for variable rate instruments
A change of 100 basis points in interest rates would have increased / (decreased) profit or loss by the amounts shown below. This analysis assumes that all other variables, in particular foreign currency rates, remain constant. The analysis is performed on the same basis for 2011.
Profit or loss 100 basis points 100 basis points increase decrease (Rupees’000)
December 31, 2012
Cash flow sensitivity-Variable rate instruments 16,886 16,886
16,886 16,886
December 31, 2011
Cash flow sensitivity-Variable rate instruments 1,052 1,052
1,052 1,052
Market price risk
For investments at fair value through profit or loss, a 1 % increase / (decrease) in market price at reporting date would have increased / (decreased) profit for the year by Rs. nil (2011: Rs. 75,882 thousand).
Annual Report of Fauji Fertilizer Bin Qasim Limited for the year ended 2012
| 91

34.4 Fair values
Fair value versus carrying amounts
The fair values of financial assets and liabilities, together with the carrying amounts shown in the balance sheet, are as follows:
December 31, 2012 December 31, 2011 Carrying Fair value Carrying Fair value amount amount
Note (Rupees ‘000)
Assets carried at amortized cost
Trade debts 17 2,469,075 2,469,075 646,516 646,516
Deposits 78,534 78,534 78,204 78,204
Interest accrued 39,317 39,317 51,041 51,041
Other receivables - net of provision 20 2,994,808 2,994,808 2,180,232 2,180,232
Short term investments - loans and receivables 21 1,550,000 1,550,000 1,250,000 1,250,000
Cash and bank balances 22 8,788,967 8,788,967 5,384,363 5,384,363
15,920,701 15,920,701 9,590,356 9,590,356
Assets carried at fair value
Short term investments - Investments at 21 - - 7,588,237 7,588,237
fair value through profit or loss
Liabilities carried at amortized cost
Long term loan 6 3,241,002 3,241,002 3,889,203 3,889,203
Trade and other payables 8 10,206,722 10,206,722 9,661,394 9,661,394
Short term borrowings including mark-up 10 9,497,266 9,497,266 7,680,533 7,680,533
22,944,990 22,944,990 21,231,130 21,231,130
The basis for determining fair values is as follows:
Interest rates used for determining fair value
The interest rates used to discount estimated cash flows, when applicable, are based on the Government yield curve at the reporting date plus an adequate credit spread. The interest rate used to determine fair value of GoP loan is 13.07% (2011:15%). Since deferred Government assistance is included with long term loan, there is no difference in the carrying amount of the loan and its fair value.
Fair value hierarchy
The table below analyses financial instruments carried at fair value, by valuation method. The different levels have been defined as follows:
Level 1: quoted prices (unadjusted) in active markets for identical assets or liabilities.
Level 2: inputs other than quoted prices included within Level 1 that are observable for the asset or liability, either directly (i.e., as prices) or indirectly (i.e., derived from prices).
Level 3: inputs for the asset or liability that are not based on observable market data (unobservable inputs).
Notes to the Financial Statementsfor the year ended December 31, 2012
92 |
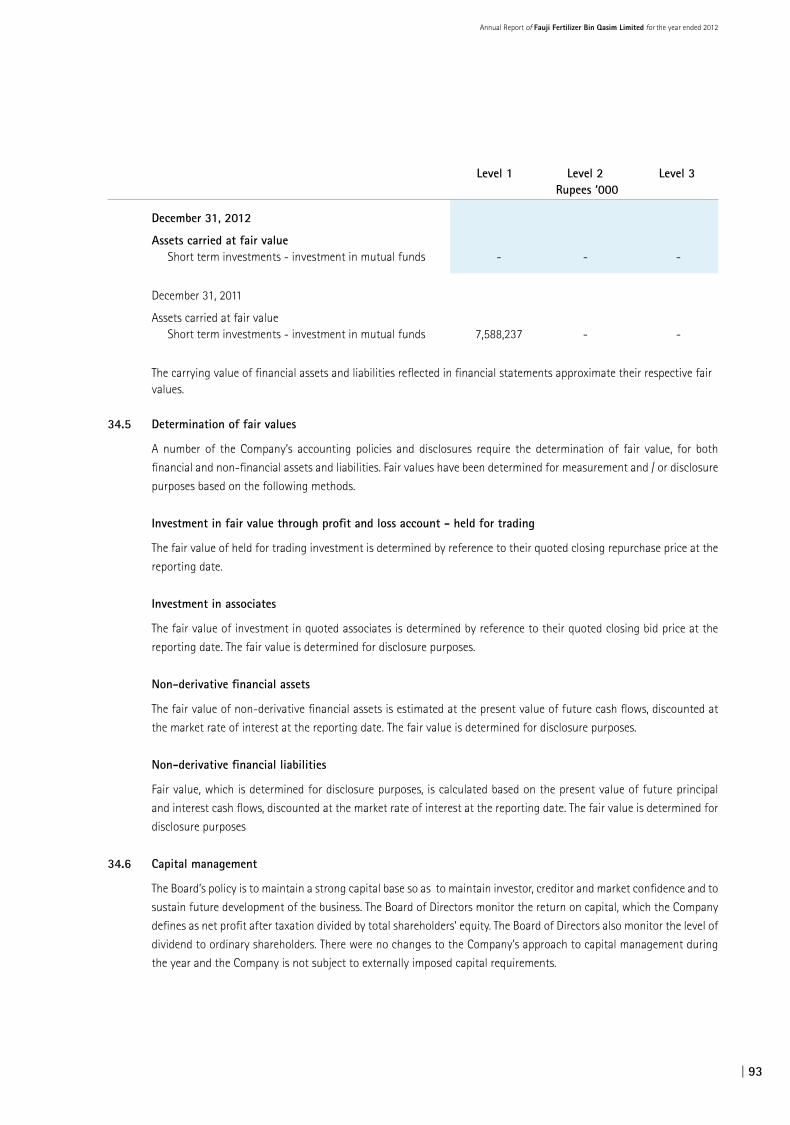
Level 1 Level 2 Level 3 Rupees ‘000
December 31, 2012
Assets carried at fair value Short term investments - investment in mutual funds - - -
December 31, 2011
Assets carried at fair value Short term investments - investment in mutual funds 7,588,237 - -
The carrying value of financial assets and liabilities reflected in financial statements approximate their respective fair
values.
34.5 Determination of fair values
A number of the Company’s accounting policies and disclosures require the determination of fair value, for both
financial and non-financial assets and liabilities. Fair values have been determined for measurement and / or disclosure
purposes based on the following methods.
Investment in fair value through profit and loss account - held for trading
The fair value of held for trading investment is determined by reference to their quoted closing repurchase price at the
reporting date.
Investment in associates
The fair value of investment in quoted associates is determined by reference to their quoted closing bid price at the
reporting date. The fair value is determined for disclosure purposes.
Non-derivative financial assets
The fair value of non-derivative financial assets is estimated at the present value of future cash flows, discounted at
the market rate of interest at the reporting date. The fair value is determined for disclosure purposes.
Non-derivative financial liabilities
Fair value, which is determined for disclosure purposes, is calculated based on the present value of future principal
and interest cash flows, discounted at the market rate of interest at the reporting date. The fair value is determined for
disclosure purposes
34.6 Capital management
The Board’s policy is to maintain a strong capital base so as to maintain investor, creditor and market confidence and to
sustain future development of the business. The Board of Directors monitor the return on capital, which the Company
defines as net profit after taxation divided by total shareholders’ equity. The Board of Directors also monitor the level of
dividend to ordinary shareholders. There were no changes to the Company’s approach to capital management during
the year and the Company is not subject to externally imposed capital requirements.
Annual Report of Fauji Fertilizer Bin Qasim Limited for the year ended 2012
| 93
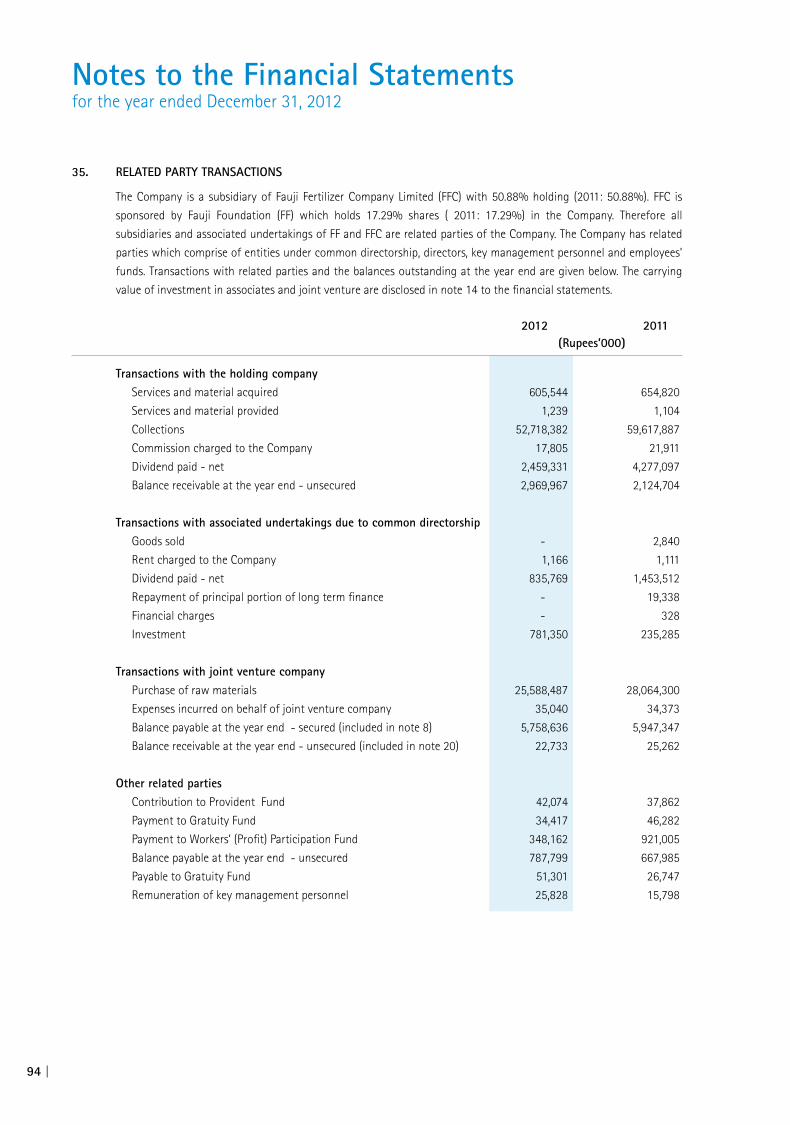
35. RELATED PARTY TRANSACTIONS
The Company is a subsidiary of Fauji Fertilizer Company Limited (FFC) with 50.88% holding (2011: 50.88%). FFC is
sponsored by Fauji Foundation (FF) which holds 17.29% shares ( 2011: 17.29%) in the Company. Therefore all
subsidiaries and associated undertakings of FF and FFC are related parties of the Company. The Company has related
parties which comprise of entities under common directorship, directors, key management personnel and employees’
funds. Transactions with related parties and the balances outstanding at the year end are given below. The carrying
value of investment in associates and joint venture are disclosed in note 14 to the financial statements.
2012 2011 (Rupees’000)
Transactions with the holding company Services and material acquired 605,544 654,820
Services and material provided 1,239 1,104
Collections 52,718,382 59,617,887
Commission charged to the Company 17,805 21,911
Dividend paid - net 2,459,331 4,277,097
Balance receivable at the year end - unsecured 2,969,967 2,124,704
Transactions with associated undertakings due to common directorship
Goods sold - 2,840
Rent charged to the Company 1,166 1,111
Dividend paid - net 835,769 1,453,512
Repayment of principal portion of long term finance - 19,338
Financial charges - 328
Investment 781,350 235,285
Transactions with joint venture company
Purchase of raw materials 25,588,487 28,064,300
Expenses incurred on behalf of joint venture company 35,040 34,373
Balance payable at the year end - secured (included in note 8) 5,758,636 5,947,347
Balance receivable at the year end - unsecured (included in note 20) 22,733 25,262
Other related parties Contribution to Provident Fund 42,074 37,862
Payment to Gratuity Fund 34,417 46,282
Payment to Workers’ (Profit) Participation Fund 348,162 921,005
Balance payable at the year end - unsecured 787,799 667,985
Payable to Gratuity Fund 51,301 26,747
Remuneration of key management personnel 25,828 15,798
Notes to the Financial Statementsfor the year ended December 31, 2012
94 |

2012 2011 (Tonnes)
36. GENERAL
36.1 Production capacity
Design capacity
Urea 551,100 551,100 DAP 650,000 650,000
Actual production
Urea 281,068 433,053 DAP 648,038 662,304 The shortfall in production was mainly due to non-availability of gas during the year. 36.2 The Board of Directors in their meeting held on January 11, 2013 have proposed a final dividend of Rs. 2.25 per ordinary
share. 36.3 These financial statements were authorized for issue by the Board of Directors of the Company in their meeting held
on January 11, 2013.
CHAIRMAN CHIEF EXECUTIVE DIRECTOR
Annual Report of Fauji Fertilizer Bin Qasim Limited for the year ended 2012
| 95

Pattern of Shareholdingas at December 31, 2012
Pattern of shareholding Number of shares
1. Associated Companies, Undertaking and Related Parties Fauji Fertilizer Company Ltd 475,232,996 Fauji Foundation 161,501,286 No other associated undertaking held any investment in FFBL except as mentioned above 2. NIT and ICP National Bank of Pakistan Trustee Deptt 1,055,261 IDBP (ICP UNIT) 500 CDC - Trustee NIT-Equity Market Opportunity Fund 730,689 3. Directors, CEO and their spouse and minor children Lt Gen Muhammad Mustafa Khan, HI(M), (Retd) 1 Lt Gen Muhammad Zaki, HI, HI(M), (Retd) 10,001 Lt Gen Naeem Khalid Lodhi, HI(M), (Retd) 1 Mr Qaiser Javed 1 Dr Nadeem Inayat 1 Maj Gen Ghualm Haider, HI(M), (Retd) 1 Brig Parvez Sarwar Khan, SI(M), (Retd) 1 Brig Dr Gulfam Alam, SI(M), (Retd) 1 Brig Muhammad Saeed Khan, (Retd) 1 Mr Naved A. Khan 500 Mr Nasier A. Sheikh 3,500 Dr Rashid Bajwa 500 4. Company Executives 362,898 5. Public Sector Companies and Corporations NIL 6. Banks, Development Financial Institutions, Non-Banking Financial Institutions, Insurance Companies, Modarabas and Mutual Funds 58,294,988 7. Shareholders holding ten percent or more voting interest Fauji Fertilizer Company Ltd 475,232,996 Fauji Foundation 161,501,286
8. Trade in shares of the Company by Directors, CEO, CFO, Company Secretary and their spouses and minor children
Name Designation Date Previous Purchase Rate Holding as at Holding Rs/share 31 Dec 2012
Lt Gen Muhammad Zaki, CE & MD 10-Jan-12 1 10,000 42.90 10,001
HI, HI(M), (Retd)
27-Mar-12 500 1,000 39.89
28-Mar-12 1,500 1,000 40.29
Mr Nasier A. Sheikh Director
28-Mar-12 2,500 500 40.04 3,500
28-Mar-12 3,000 500 40.64
Brig Shaukat Yaqub Malik, Company 19-Mar-12 0 10,000 47.10 20,000
SI(M), (Retd) Secretary 28-Mar-12 10,000 10,000 39.95
96 |

Pattern of Shareholdingas at December 31, 2012
1,073 1 - 100 59,280 4,197 101 - 500 1,864,662 3,010 501 - 1,000 2,495,623 4,573 1,001 - 5,000 12,842,042 1,466 5,001 - 10,000 11,547,217 619 10,001 - 15,000 7,966,307 356 15,001 - 20,000 6,491,896 254 20,001 - 25,000 5,935,520 153 25,001 - 30,000 4,352,084 103 30,001 - 35,000 3,435,086 125 35,001 - 40,000 4,837,271 63 40,001 - 45,000 2,680,114 124 45,001 - 50,000 6,073,963 46 50,001 - 55,000 2,435,624 54 55,001 - 60,000 3,173,994 34 60,001 - 65,000 2,157,729 35 65,001 - 70,000 2,399,442 31 70,001 - 75,000 2,283,216 29 75,001 - 80,000 2,270,282 16 80,001 - 85,000 1,328,126 15 85,001 - 90,000 1,334,057 13 90,001 - 95,000 1,199,020 48 95,001 - 100,000 4,772,407 14 100,001 - 105,000 1,440,018 14 105,001 - 110,000 1,518,688 11 110,001 - 115,000 1,243,674 9 115,001 - 120,000 1,064,437 11 120,001 - 125,000 1,362,227 12 125,001 - 130,000 1,528,669 5 130,001 - 135,000 673,758 4 135,001 - 140,000 556,500 9 140,001 - 145,000 1,285,870 14 145,001 - 150,000 2,087,648 5 150,001 - 155,000 767,540 4 155,001 - 160,000 639,500 6 160,001 - 165,000 973,330 3 165,001 - 170,000 498,000 5 170,001 - 175,000 872,500 4 175,001 - 180,000 718,309 2 180,001 - 185,000 367,700 2 185,001 - 190,000 376,000 3 190,001 - 195,000 576,652 14 195,001 - 200,000 2,794,518 3 200,001 - 205,000 610,673 1 205,001 - 210,000 210,000 2 210,001 - 215,000 425,450 4 215,001 - 220,000 874,500 2 220,001 - 225,000 446,000 3 225,001 - 230,000 687,660 2 235,001 - 240,000 476,038
Number of Shareholdings Number of Shareholders From To Shares Held
Annual Report of Fauji Fertilizer Bin Qasim Limited for the year ended 2012
| 97

Pattern of Shareholdingas at December 31, 2012
2 240,001 - 245,000 489,209 3 245,001 - 250,000 744,640 3 250,001 - 255,000 758,176 3 255,001 - 260,000 767,361 3 260,001 - 265,000 795,000 1 265,001 - 270,000 268,000 2 270,001 - 275,000 548,000 1 275,001 - 280,000 276,500 2 280,001 - 285,000 566,570 1 285,001 - 290,000 289,500 5 295,001 - 300,000 1,495,360 1 300,001 - 305,000 301,080 1 305,001 - 310,000 310,000 1 310,001 - 315,000 312,500 1 315,001 - 320,000 315,100 2 320,001 - 325,000 649,000 1 325,001 - 330,000 330,000 3 330,001 - 335,000 1,002,120 6 335,001 - 340,000 2,026,255 1 340,001 - 345,000 341,000 5 345,001 - 350,000 1,750,000 2 350,001 - 355,000 705,377 1 355,001 - 360,000 356,559 1 370,001 - 375,000 375,000 1 380,001 - 385,000 385,000 1 385,001 - 390,000 390,000 8 395,001 - 400,000 3,189,420 1 400,001 - 405,000 405,000 2 405,001 - 410,000 815,873 1 410,001 - 415,000 410,200 1 415,001 - 420,000 419,000 1 425,001 - 430,000 429,000 2 445,001 - 450,000 898,500 1 455,001 - 460,000 460,000 1 465,001 - 470,000 465,419 1 475,001 - 480,000 479,800 1 485,001 - 490,000 489,500 3 495,001 - 500,000 1,500,000 1 500,001 - 505,000 503,000 1 520,001 - 525,000 525,000 2 545,001 - 550,000 1,095,510 2 595,001 - 600,000 1,200,000 1 610,001 - 615,000 613,500 1 640,001 - 645,000 645,000 1 665,001 - 670,000 670,000 1 685,001 - 690,000 687,810 2 695,001 - 700,000 1,400,000 1 720,001 - 725,000 720,615 1 725,001 - 730,000 727,000 1 730,001 - 735,000 730,689
Number of Shareholdings Number of Shareholders From To Shares Held
98 |

Pattern of Shareholdingas at December 31, 2012
1 755,001 - 760,000 756,994 1 795,001 - 800,000 800,000 1 815,001 - 820,000 816,000 1 825,001 - 830,000 829,400 1 830,001 - 835,000 830,100 1 840,001 - 845,000 841,000 1 870,001 - 875,000 875,000 1 910,001 - 915,000 913,685 2 995,001 - 1,000,000 2,000,000 1 1,020,001 - 1,025,000 1,022,500 1 1,030,001 - 1,035,000 1,033,435 1 1,055,001 - 1,060,000 1,060,000 1 1,070,001 - 1,075,000 1,074,919 1 1,095,001 - 1,100,000 1,100,000 1 1,115,001 - 1,120,000 1,116,500 1 1,140,001 - 1,145,000 1,142,174 1 1,155,001 - 1,160,000 1,156,500 1 1,165,001 - 1,170,000 1,170,000 1 1,180,001 - 1,185,000 1,184,000 1 1,185,001 - 1,190,000 1,190,000 2 1,195,001 - 1,200,000 2,398,275 1 1,210,001 - 1,215,000 1,210,635 1 1,395,001 - 1,400,000 1,400,000 2 1,495,001 - 1,500,000 3,000,000 1 1,500,001 - 1,505,000 1,500,500 1 1,655,001 - 1,660,000 1,657,640 1 1,745,001 - 1,750,000 1,750,000 1 1,765,001 - 1,770,000 1,769,474 1 1,920,001 - 1,925,000 1,922,396 1 1,935,001 - 1,940,000 1,936,906 1 2,070,001 - 2,075,000 2,073,500 1 2,140,001 - 2,145,000 2,141,450 1 2,260,001 - 2,265,000 2,260,053 1 2,565,001 - 2,570,000 2,567,369 1 2,645,001 - 2,650,000 2,650,000 1 2,795,001 - 2,800,000 2,798,173 1 2,910,001 - 2,915,000 2,912,000 1 3,375,001 - 3,380,000 3,378,527 1 3,595,001 - 3,600,000 3,599,249 1 3,830,001 - 3,835,000 3,835,000 1 5,305,001 - 5,310,000 5,305,080 1 7,240,001 - 7,245,000 7,242,078 1 7,280,001 - 7,285,000 7,283,487 1 7,455,001 - 7,460,000 7,455,500 1 11,435,001 - 11,440,000 11,436,764 1 12,880,001 - 12,885,000 12,882,706 1 23,055,001 - 23,060,000 23,058,785 1 161,500,001 - 161,505,000 161,501,286 1 475,230,001 - 475,235,000 475,232,996
16,749 934,110,000
Number of Shareholdings Number of Shareholders From To Shares Held
Annual Report of Fauji Fertilizer Bin Qasim Limited for the year ended 2012
| 99

Category wise Shareholdingas at December 31, 2012
Sr No Shareholder’s Category Number of Shareholders Number of Shares Held Percentage
01 Charitable Trusts 25 171,036,137 18.31
02 Cooperative Societies 2 13,304 0.00
03 Financial Institutions 25 34,405,196 3.68
04 Individuals 16,364 141,785,620 15.18
05 Insurance Companies 11 9,869,269 1.06
06 Others 56 45,392,717 4.86
07 Joint Stock Companies 164 494,992,155 52.99
08 Modarabas 8 770,500 0.08
09 Mutual Fund 39 12,952,417 1.39
10 Investment Companies 9 297,606 0.03
11 Foreigners 46 22,595,079 2.42
Total: 16,749 934,110,000 100.00
Financial CalendarThe Company follows the period of January 01 to December 31 as the financial year.
Financial results will be announced as per the following tentative schedule:
Annual General Meeting March 20, 2013
First Quarter ending March 31, 2013 Third week of April 2013
Second Quarter ending June 30, 2013 Last week of July 2013
Third Quarter ending September 30, 2013 Last week of October 2013
Year ending December 31, 2013 Last week of January 2014
100 |

Form of Proxy19th Annual General Meeting
The Company SecretaryFauji Fertilizer Bin Qasim Limited
73-Harley Street, Rawalpindi
I/We of
being a member(s) of
Fauji Fertilizer Bin Qasim Limited hold ordinary shares hereby appoint
Mr. / Mrs./Miss of
or failing him/her of as my/our proxy in my /
our absence to attend and vote for me / us on my /our behalf at the 19th Annual General Meeting of the Company
to be held on 20 March 2013 and / or any adjournment thereof.
In witness thereof I / We have signed and set my / our hands seal thereon this
day of 2013 in the presence
of
Folio CDC Account No.
Participant ID Sub Account Number
Signature on
Five Rupees
Revenue Stamp
This signature should agree with the
specimen registered with the Company
Important
1. This Proxy Form, duly completed and signed, must be deposited at the registered office of the Company, 73-Harley Street, Rawalpindi not less than 48 hours before the time of holding the meeting.
2. If a member appoints more than one proxies and more than one instruments of proxies are deposited by a member with the Company, all such instruments of proxy shall be rendered invalid.
3. For CDC account holders/Corporate Entities
In addition to the above, following requirements have to be met:
i. Attested copies of CNIC or the passport of the beneficial owners and the proxy shall be furnished with the proxy form.
ii. The proxy shall produce his/her original CNIC or original passport at the time of the meeting.
iii. In case of corporate entity, the Board of Directors’ resolution/power of attorney with specimen signature shall be submitted to the Company along with proxy form.
Annual Report of Fauji Fertilizer Bin Qasim Limited for the year ended 2012
| 101
The Company Secretary
Fauji Fertilizer Bin Qasim Limited73-Harley Street, Rawalpindi
AFFIXCORRECTPOSTAGE
102 |

Conc
ept,
Desi
gn &
Prin
ting
byw
ww.
vant
agep
rinte
rs.c
om


![Fauji Fertilizer Co[1]. Ltd Aruba Khan](https://img.pdfslide.net/doc/110x75/5571fe8d49795991699ba255/fauji-fertilizer-co1-ltd-aruba-khan.jpg)