Embed Size (px)
Citation preview

THE YOKOHAMA RUBBER CO., LTD. 36-11, Sh imbashi 5-chome, Minato-ku, Tokyo 105-8685, Japan Phone: 03-5400-4531
The Yokohama Rubber Co., Ltd. Year ended March 31, 1999
A N N UA L R E P O RT
1 9 9 9
An
nu
al
R
ep
or
t
19
99
Th
e Y
ok
oh
am
a R
ub
be
r C
o., L
td
.
Printed in Japan

P R O F I L E
C O N T E N T S
The Yokohama Rubber Co., Ltd. (Yokohama), is one of
the world’s leading manufacturers of rubber products,
including vehicle tires, other rubber products and
adhesive products. The Company was established
in 1917 and today has expanded its business on a
global scale. We have achieved an excellent reputation
worldwide for technologically advanced products that
meet customer needs in the fields of automobiles, civil
engineering, construction, marine engineering, aircraft
components and golf products. In recent years, we have
reinforced our global manufacturing and marketing
structure through plants in Japan, the United States and
Asia, and through sales operations in these regions, as
well as Europe. Our objective is to build on the loyalty
of customers around the world.
Financial Highlights
To Our Shareholders
Group at a Glance
Review of Operations
Tire Group
Multiple Business Group
Innovative Research and Development
Environmental Protection
Financial Section
Financial Review
Six-Year Summary
Consolidated Balance Sheets
Consolidated Statements of Income
Consolidated Statements of Shareholders’ Equity
Consolidated Statements of Cash Flows
Notes to Consolidated Financial Statements
Report of Independent Certified Public Accountants
Principal Consolidated Subsidiaries and Affiliates
Board of Directors and Corporate Auditors
Corporate Data
151619202223242531323435
12466
101314

1
Financial Highlights
For the Years Ended March 31, 1999 and 1998
Net Sales
Operating Income
Income before Income Taxes
Net Income
Total Assets
Shareholders’ Equity
Per Share:
Net Income (Basic)
Cash Dividends
1999
¥401,183
15,809
7,731
3,233
¥432,457
105,984
1999
¥ 9.44
6.00
1998
¥415,397
11,668
5,685
873
¥440,420
105,478
1998
¥ 2.55
8.00
Percentage change(1999/1998)
(3.4)
35.5
36.0
270.3
(7,963)
506
1999
$3,327,938
131,141
64,131
26,819
$3,587,366
879,170
1999
0.08
0.05
Note: Throughout this report, the United States dollar amounts have been translated from Japanese yen solely for the convenience of readers at the rate of
¥120.55=US$1, the mean of the telegraphic transfer selling exchange rate and the telegraphic transfer buying exchange rate prevailing on the Tokyo
foreign exchange market on March 31, 1999.
Millions of YenThousands of
U.S. Dollars
Yen U.S. Dollars
500
’99’98’97’96
400389 403
415401
300
200
100
0
(Billions of Yen)
Japan North America
Other Regions
15.1
12.711.7
15.8
20
’99’98’97’96
16
12
8
4
0
0
1
2
3
4(Billions of Yen) (Percentage)
1.77
11.14
2.55
9.44
15
’99’98’97’96
12
9
6
3
0
(Yen)
Sales by Region Operating Income and Ratio of Operating Income to Sales
Net Income per Share
Results for Other Regions include NorthAmerica until 1997.
Increase (Decrease)(1999-1998)

2
● THE YEAR IN REVIEW
In fiscal 1999, ended March 31, 1999, the economies
of Asia, including Japan, were beset by financial
difficulties, but conditions in Europe and the United
States were generally robust. Japan—the core market
for Yokohama—suffered from ongoing instability
of its financial system, and consumer spending and
private-sector capital investment remained sluggish.
The rubber products industry also endured falling
demand. Although the weak yen boosted exports
from Japan in the first half of the year, the currency
environment underwent a rapid reversal in the fall
of 1998.
In this situation, Yokohama endeavored to
improve its results by introducing products with
superior functions, strengthening its network of
dealers, enhancing management efficiency at sales
subsidiaries and undertaking aggressive marketing
efforts. At the same time, we implemented a variety
of cost-cutting measures and related activities to
improve our management foundations. However,
these steps were insufficient to counter the effects
of slow demand in Japan, and as a result our
consolidated net sales fell 3.4%, to ¥401,183
million. On the other hand, successful responses
to strengthen our U.S. tire company and sales
subsidiaries in Japan sustained a 270.3% rise in net
income, to ¥3,233 million.
● THE DIRECTION OF BUSINESS REFORM
Amid continuing rapid changes in the market for
automobiles, Yokohama is actively meeting the
challenge of becoming a truly global company with
the potential of expanding both sales and earnings.
These efforts are encapsulated in the Action 21
Business Reform plan.
The Action 21 Business Reform plan comprises
activities to comprehensively restructure our
To Our Shareholders
Seiji Hagiwara (right), Chairman, and Yasuo Tominaga, President

3
organization in seven key action areas: businesses,
financing, cash position, human resources, operating
structure, administration and Group management.
Simultaneously, we are working on a series of
Urgent Measures for cost reduction to help
guarantee a healthy income into the future.
An integral part of the Action 21 Business
Reform plan is revamping our business activities.
In the Tire Group, our operations are focusing on
the three product areas of passenger car radials,
radials for light trucks and steel radials for trucks
and buses, while our marketing emphasis is on
the four markets of Japan, the rest of Asia, North
America and exports. In these product areas
and markets, we will introduce world-leading
technologies, launch new manufacturing methods
and establish an integrated logistics system based
on an information network. The theme of these
activities is to become a more distinctive corporate
group by improving our technological capabilities
and shortening lead times. In this fashion, through
the strengthening our production and marketing
structures in individual regions we will improve our
market presence, raise efficiency throughout our
operations and enhance our cost competitiveness.
In the Multiple Business (MB) Group, our goal
is to achieve higher market shares for our adhesives,
sealants, hoses, aircraft components and golf
products. We will also work to turn high-potential
businesses such as antiseismic rubber bearings for
bridges and buildings into major profit centers.
Further, we currently boast a variety of products
that are competitive in the global market, including
hydraulic hoses and sealants, which we intend to
market even more vigorously. In addition, we will
strive to pioneer new business fields while seeking
significant cost reductions and higher profitability.
● IMPLEMENTING THE ACTION 21 BUSINESS REFORM PLAN
It is difficult to predict a rapid recovery in consumer
spending or capital investment in Japan in fiscal
2000, and concerns have arisen over trends in
currency markets and the future direction of the U.S.
and European economies, making for a continuing
harsh operating environment for the Yokohama
Group. To ensure our prosperity in these
circumstances, we are working on the two-year
Action 21 Business Reform plan launched in
April 1999. All of us in the Yokohama Group are
committed to realizing the aims of this plan through
such measures as reducing our total assets by ¥30.0
billion, our interest-bearing debt by ¥20.0 billion
and our personnel by 1,000 employees.
Furthermore, in accordance with the
Environmental Action Plan, which is concerned with
environmental preservation and was revised in June
1998, we are working not only to reduce carbon
dioxide emissions, but also to achieve certification
under the ISO 14001 international environmental
management standard at all six of our domestic plants
by mid-1999. The Mishima, Mie, Shinshiro and
Ibaraki plants have already earned this accreditation.
We hope that our shareholders around the world
will understand our management stance and extend
their continued support into the future.
June 15, 1999
Seiji Hagiwara, Chairman
Yasuo Tominaga, President

4
Group at a Glance
T I R E G R O U P :
M B G R O U P :
69.8%(+1.0)
30.2%(-1.0)
350
276 284 286 280
’99’98’97’96
280
210
140
70
0
(Billions of Yen)
15
’99’98’97’96
1210.7
8.0
5.2
11.5
9
6
3
0
(Billions of Yen)
Fiscal 1999 Sales by the Tire Group Percentage of net sales (change from fiscal 1998)
Sales by the Tire Group
Operating Income by the Tire Group
150
’99’98’97’96
120113 119
129 121
90
60
30
0
(Billions of Yen)
7.5
’99’98’97’96
6.0
4.5
3.0
3.4
4.2
5.5
4.4
1.5
0
(Billions of Yen)
Sales by the MB Group
Operating Income by the MB Group
Fiscal 1999 Sales by the MB GroupPercentage of net sales (change from fiscal 1998)

5
Manufacturing and Sales Organization
Yokohama manufactures and markets tires in
Japan through 26 sales subsidiaries, including
Shin Tokyo Yokohama Tire Co., Ltd., and 209
dealerships that also sell our products. Overseas,
our tires are produced and sold by Yokohama
Tire Corporation (YTC) in the United States, and
Yokohama Tire Philippines, Inc., and Yokohama
Tyre Vietnam Company in Asia. In addition,
GTY Tire Company, a joint venture with General
Tire, Inc., and Toyo Tire & Rubber Co., Ltd.,
handles a portion of our U.S. manufacturing.
In Europe, our organization of eight sales
subsidiaries includes Yokohama Reifen GmbH in
Germany and Yokohama HPT Ltd. in the United
Kingdom.
Main Products
Tires for passenger cars, trucks, buses, small trucks, mining and construction equipment, industrial
vehicles and aircraft, and tubes and aluminum alloy wheels
Main Products
Hoses, marine hoses, conveyor belts, sealants, adhesives, waterproofing materials, antiseismic rubber
bearings for bridges and buildings, golf products, aircraft components and other products
Manufacturing and Sales Organization
In the field of products for industrial use,
Yokohama and Yokohama Hydex Co., Ltd., are
responsible for manufacturing in Japan, while
SAS Rubber Company and YH America, Inc.
handle U.S. production and sales. Sales in Japan
are handled by Yokohamagomu Industrial
Products Tokyo Sales Co., Ltd., and seven other
sales subsidiaries, and by Yokohama Hydex and
Tokyo Hydex Sales Co., Ltd.
Our golf products are manufactured by
Yokohama and marketed in Japan by PRGR
Co., Ltd., and in North America by PRGR
USA Corporation. Aircraft components are
manufactured in Japan and marketed around the
world by Yokohama.
6
Review of Operations
T I R E G R O U PThe Year at a Glance
In fiscal 1999, sales increased in North
America, Europe and Oceania, but were
down in Japan and other Asian countries, as
well as in the Middle East. In this environment,
exports of tires from Japan fell slightly from the
previous year, and sales by the Tire Group
dipped 2.1%, to ¥280,007 million.
Results in Japan
Figures Down in all Categories
Continuing sluggishness in the Japanese economy
resulted in a decrease in sales of tires. To increase
tire sales on an original equipment (OE) basis and
improve our market share, we applied value analysis
and value engineering proposals to promote our
products to automakers. However, despite a
slight rise in sales of automobiles following the
implementation of new standards for low-
displacement cars, domestic automobile production
declined 7.0%, to 9.97 million units in fiscal 1999.
Our marketing efforts were negatively influenced
by this slow demand, and domestic sales were down
for the year.
In the replacement tires market, we worked to
stimulate demand by introducing products featuring
distinctive technologies and
functions. These offerings
included the PARADA
radial tire—with a novel
tread pattern to add the
precocious touch of a first-
rate look to automobiles—
the GEOLANDAR I/T
studless tire for four-wheel
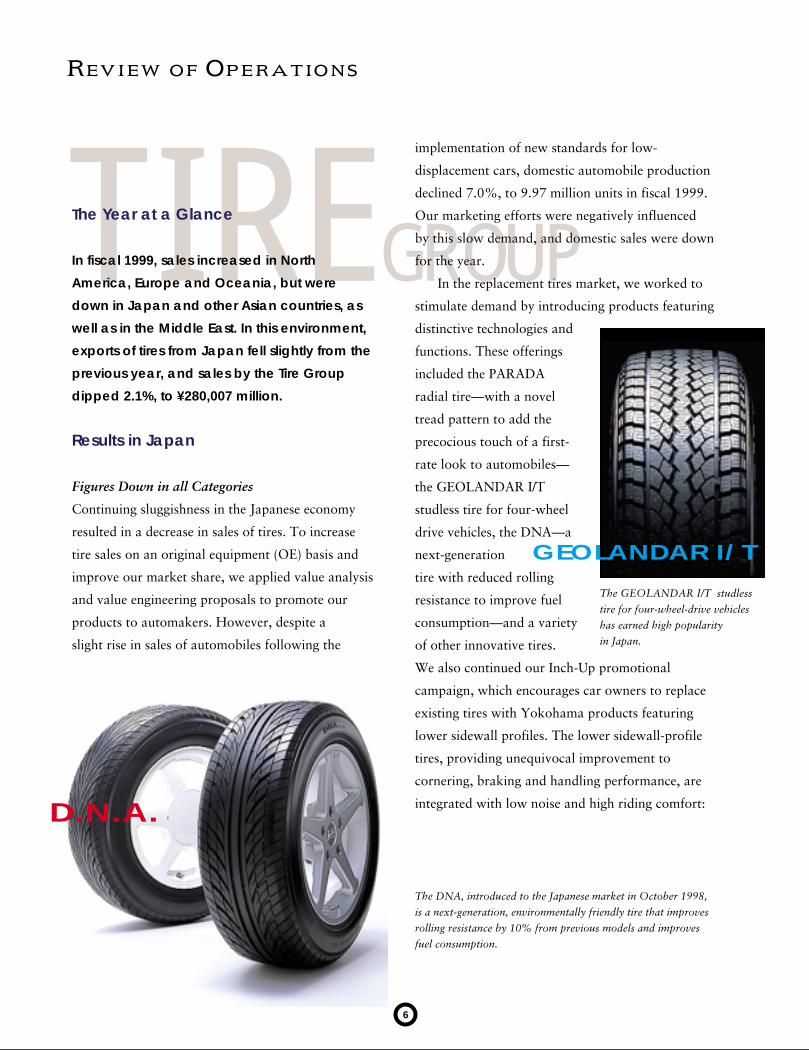
drive vehicles, the DNA—a
next-generation
tire with reduced rolling
resistance to improve fuel
consumption—and a variety
of other innovative tires.
We also continued our Inch-Up promotional
campaign, which encourages car owners to replace
existing tires with Yokohama products featuring
lower sidewall profiles. The lower sidewall-profile
tires, providing unequivocal improvement to
cornering, braking and handling performance, are
integrated with low noise and high riding comfort:D.N.A.
GEOLANDAR I/T
The DNA, introduced to the Japanese market in October 1998,
is a next-generation, environmentally friendly tire that improves
rolling resistance by 10% from previous models and improves
fuel consumption.
The GEOLANDAR I/T studless
tire for four-wheel-drive vehicles
has earned high popularity
in Japan.

7
the requirements of modern
vehicles. Through this
campaign, we have promoted
a range of products, centered
on those with high-value-added
features. We also strengthened
our marketing and brand
management during the year under
review by expanding the network of our capitalized
sales outlets to take the prime move in the
marketplace. Our subsidiaries and affiliates increased
to 254 as of March 31, 1999, compared with 195
a year earlier. Activities in the Yokohama Group
included the integration of wholesale-function
subsidiaries—reduced to 26, from 32 at the close
of fiscal 1998—the rationalization of distribution
and the strengthening of management foundations.
Harsh as this situation may be, these endeavors were
insufficient to counteract the influence of depressed
demand and severe market conditions. Although our
unit sales increased slightly in fiscal 1999, a decrease
was reported for sales in terms of value.
Startup of Integrated Logistics System
In the fall of 1999 at the Shinshiro Plant we will
begin full-scale operations of a new logistics system
based on a digital information network that will
integrate our product development, production,
distribution and sales activities. Using this system,
we will be able to significantly shorten the lead time
from receipt of orders to delivery. As a result, we
can, for example, achieve a cycle of completion
of production plans in about a week.
In addition to enabling us to meet customer
needs more effectively, we expect that these
efforts will help us cut costs through productivity
enhancement and inventory reductions. Furthermore,
we intend to introduce these systems in other
facilities in the near future.
Results in North America
YTC Sales Increase
Yokohama’s sales in North America are handled
by localized production facilities in tandem with
exports from Japan. In fiscal 1999, reflecting the
health of the U.S. economy, sales in this region
increased favorably.
TY517
RY237
The PARADA, the ideal tire for dressing up cars such as station
wagons and minivans, has been particularly popular with young
consumers in Japan.
Yokohama’s steel radials for trucks and
buses have earned high acclaim in the
United States. Pictured are the RY237
and TY517, two representative products
in this area.
PARADA
8
T I R E G R O U PIn this environment, sales of U.S. subsidiary YTC
advanced 8.0%, to US$420 million. Passenger car
radials and steel radials for trucks and buses were
particularly strong sellers. In October 1998, YTC
launched a new production line for radial tires for
sport utility vehicles (SUVs), bolstering both capacity
and efficiency, and bringing its output to 23,000
tires per day. Meanwhile, YTC expanded sales to
independent dealers during the year. Moreover, the
company reduced its loss to US$9.0 million, an
improvement of US$20.0 million from the previous
year’s loss, thanks to successful
efforts to improve its financial
position. YTC’s new goal has
been set to become profitable in
fiscal 2000.
Results in Asia andOceania
Full-Scale Production in the
Philippines and Vietnam
Yokohama’s sales in Asia, centered on passenger car
radials, are sustained primarily through exports from
Japan. In fiscal 1999, these exports decreased under
the effects of lingering economic slowdown in
the region. However, there are still signs of high
potential for future growth in Asia, which is why
Yokohama reinforced its business in the Philippines
and Vietnam during the year.
Yokohama Tire Philippines, an export hub
for passenger car radials that began operations in
January 1998, commenced exports to Europe, the
Middle East, and other countries in Asia. In addition,
the company began selling replacement tires in
the Philippine market and OE tires to Japanese
automakers with facilities in the country. As a result,
output reached one million tires for the year.
In other activities in this region, Yokohama Tyre
Vietnam commenced production of SPEEDLINE tires
for motorcycles in July 1998. In Oceania, sales of our
major passenger car radials and tires for SUVs were
strong, while exports of these tires from Japan
increased considerably.
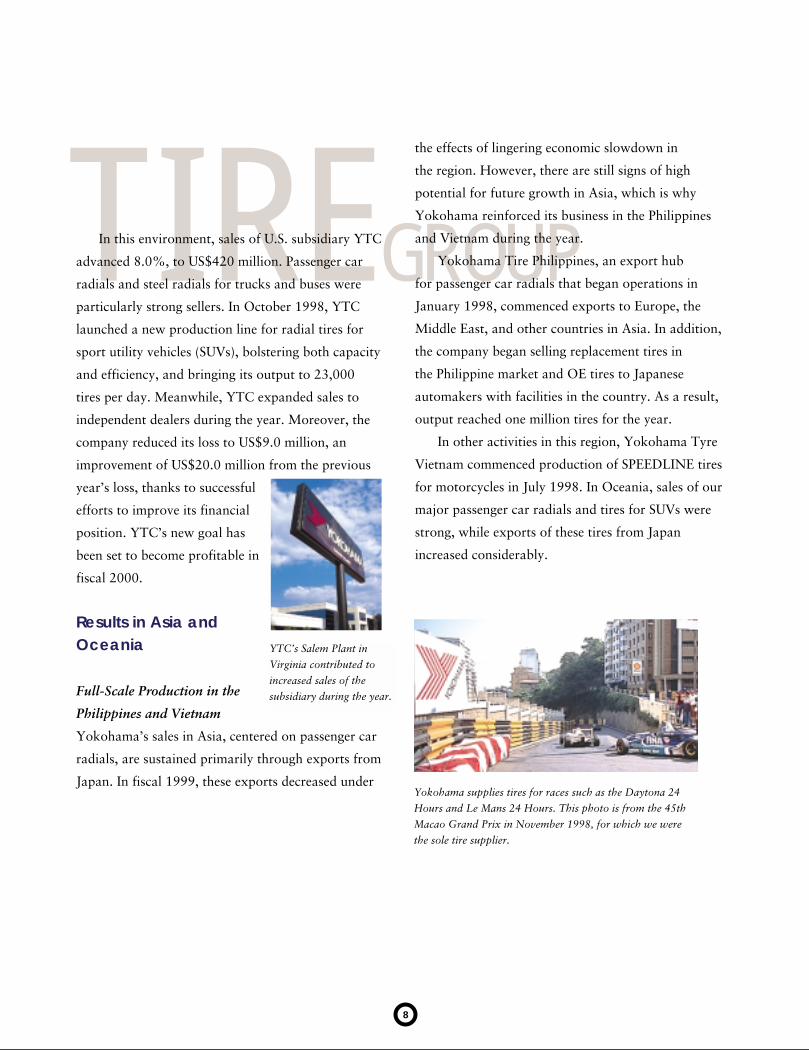
Yokohama supplies tires for races such as the Daytona 24
Hours and Le Mans 24 Hours. This photo is from the 45th
Macao Grand Prix in November 1998, for which we were
the sole tire supplier.
YTC’s Salem Plant in
Virginia contributed to
increased sales of the
subsidiary during the year.

9
Targeting Further Growth
In March 1999, Yokohama Tire Philippines was
certified under the ISO 9002 series of international
quality management standards. This company is
now working to achieve output of 1.6 million tires
in fiscal 2000. Yokohama Tyre Vietnam plans to
introduce tires for scooters and expand its sales
channels with the objective of annual tire production
of 320,000. This subsidiary is also planning to enter
the market for light truck tires.
Results in Europe and Other Regions
In Europe, where our operations center on the sale
of passenger car radials, our high-performance tires
have earned an excellent reputation for quality. Sales
of these tires increased in fiscal 1999 against the
backdrop of the generally strong regional economy.
As full-scale exports from Yokohama Tire
Philippines began during the year, we were able
to enhance our product lineup in Europe. In fiscal
2000, we plan to begin sales of our AVS SPORT
ultrahigh-performance tires, further expand our sales
efforts and raise brand awareness in an effort to
increase sales.
In the Middle East, we mainly export passenger
car radials and steel radials for trucks and buses.
In the year under review, falling crude oil prices
restricted purchasing power, and our exports
decreased on a fiscal basis. In the first half of fiscal
2000, steady increases in the price of oil are expected
to help turn our results around, while we also plan
further introductions of new tires to the market.
The GEOLANDAR A/T, a high-performance tire for
four-wheel-drive vehicles, performed well in Oceania.
Yokohama plans to introduce the AVS SPORT as its global
flagship product for ultrahigh-performance tires.
GEOLANDAR A/T
AVS SPORT
M B GROUPM ULTIPLE B USINESS
10
The Year at a Glance
Sales of antiseismic rubber bearings, marine
hoses and aircraft components increased
in fiscal 1999, but slack consumer spending
and capital investment and a drop in housing
starts led to decreases in demand for our
sealant products, conveyor belts, hoses
and golf products. As a result, sales by the
Multiple Business (MB) Group shrunk 6.4%, to
¥121,176 million.
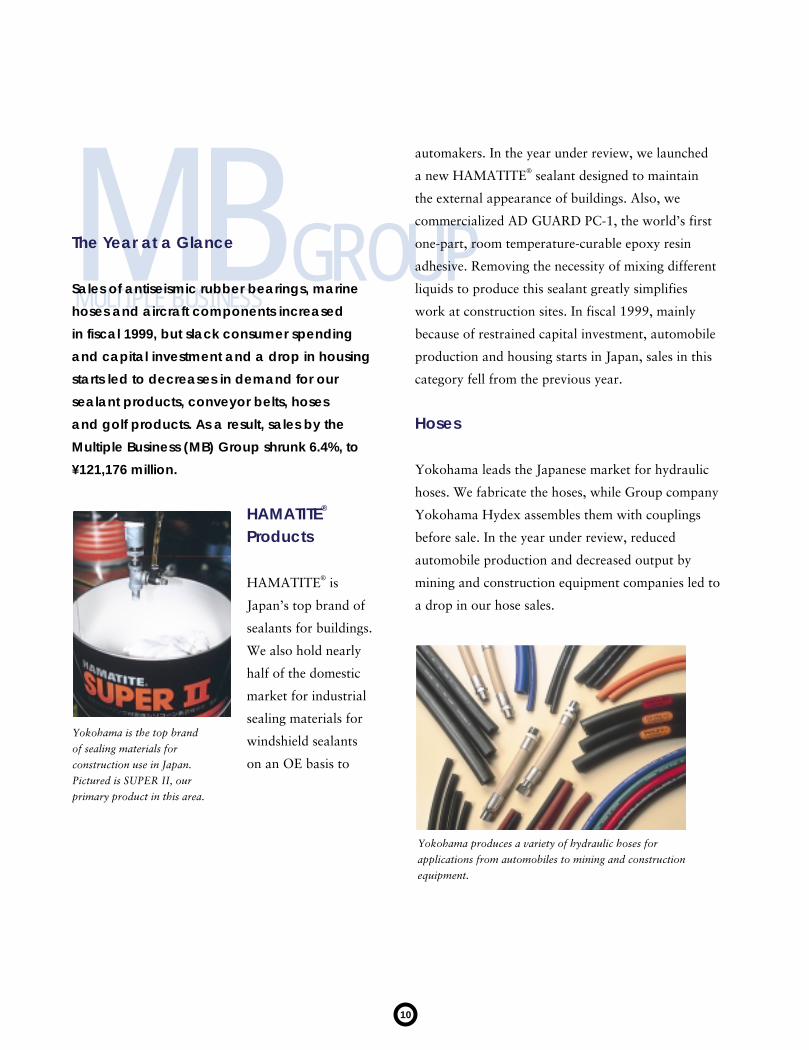
HAMATITE®
Products
HAMATITE® is
Japan’s top brand of
sealants for buildings.
We also hold nearly
half of the domestic
market for industrial
sealing materials for
windshield sealants
on an OE basis to
automakers. In the year under review, we launched
a new HAMATITE® sealant designed to maintain
the external appearance of buildings. Also, we
commercialized AD GUARD PC-1, the world’s first
one-part, room temperature-curable epoxy resin
adhesive. Removing the necessity of mixing different
liquids to produce this sealant greatly simplifies
work at construction sites. In fiscal 1999, mainly
because of restrained capital investment, automobile
production and housing starts in Japan, sales in this
category fell from the previous year.
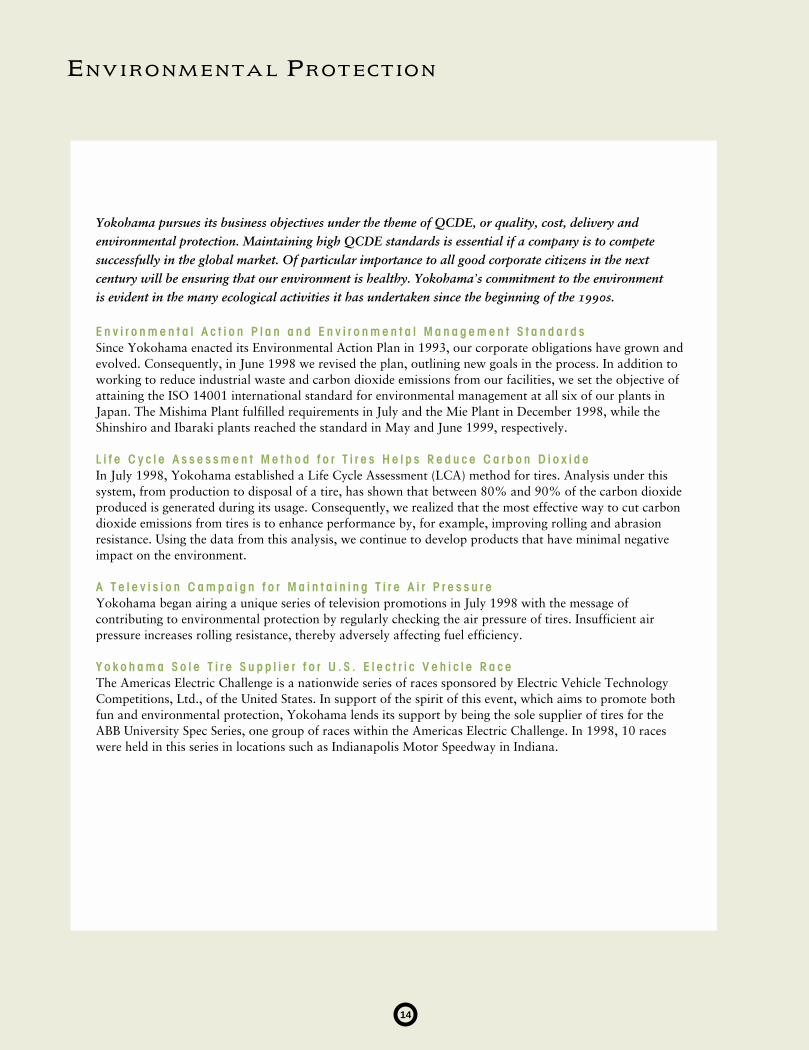
Hoses
Yokohama leads the Japanese market for hydraulic
hoses. We fabricate the hoses, while Group company
Yokohama Hydex assembles them with couplings
before sale. In the year under review, reduced
automobile production and decreased output by
mining and construction equipment companies led to
a drop in our hose sales.
Yokohama is the top brand
of sealing materials for
construction use in Japan.
Pictured is SUPER II, our
primary product in this area.
Yokohama produces a variety of hydraulic hoses for
applications from automobiles to mining and construction
equipment.

Fenders and Marine Hoses
Most of our fenders and marine hoses are exported
outside Japan. In fiscal 1999, active promotion
efforts allowed us to significantly increase sales of
marine hoses.
Anitseismic Rubber Bearings
Yokohama entered the market for antiseismic rubber
bearings with its introduction of bearings for bridges
in fiscal 1995. We first launched bearings for
buildings in fiscal 1997. Our renowned high-
attenuation rubber, which is used in these bearings,
quickly alleviates vibrations from earthquakes. Sales
were strong in the year under review, doubling from
figures recorded two years ago.
Golf Products
In the PRGR brand, which enjoys an excellent
reputation in the high-end golf products market,
Yokohama markets drivers, irons, caddy bags and
highly permeable shirts. In fiscal 1999, we released
three new drivers in the PRGR H/S series, and the
overall market share of PRGR expanded. However,
the drop in personal spending in Japan caused the
golf products market to contract approximately
20%, and our sales edged down as a result.
Sales expanded for our marine hoses in fiscal 1999.
In fiscal 1999, these three drivers
in our PRGR H/S series helped us
improve our market share despite the
sluggish domestic golf market.
We anticipate a bright
future for our antiseismic
rubber bearings for
buildings.

M B GROUPM ULTIPLE B USINESS
Aircraft Components
In this category, sales of lavatory modules and
drinking water tanks to The Boeing Company of
the United States were favorable, and orders for
components made from composite materials
increased from aircraft manufacturers in Japan.
Thus, overall sales in this category were up from a
year earlier.
Overseas Production
To meet the needs of automakers and construction
companies with operations outside Japan,
Yokohama is strengthening its overseas
manufacturing of hoses and sealants. In the
United States, SAS Rubber, which produces
automobile hoses for the North American market,
began supplying products to Ford Motor Company.
YH America, our other base for automobile hoses
in the North American market, handles hose and
coupling assembly. In June 1998, YH America began
full-scale production of windshield sealants for
supply to U.S. affiliates of Japanese automakers.
Yokohama Rubber (Thailand) Co., Ltd., is
responsible for producing windshield sealants and
assembling hoses and couplings for our customers
in Asia. Although the Thai economy continued to
contract in fiscal 1999, we are working to maintain
our operations in the country by promoting exports
and reducing costs by, for example, purchasing more
materials locally.
YH America in Kentucky began manufacturing windshield
sealant in the period under review.
Yokohama also manufactures
components for rockets.
Pictured is a coil tube for
rocket heat exchanges.
Lavatory modules for The
Boeing Company are produced
with advanced composite
materials.

13
Innovative Research and Development
Yokohama’s R&D organization is equipped to respond effectively to changes in the marketplace, owing to its active promotion ofinformation exchange between product design, manufacturing and sales divisions throughout the Yokohama Group. In this area, weconcentrate on technologies to ensure high product performance,minimal costs, low energy consumption and environmentalpreservation. We place particular emphasis on developing new and composite materials.
T e c h n o l o g i e s f o r S i l i c a C o m p o s i t e T i r e sSilica composite tires are attracting attention throughout the industry as environmentally friendly next-generation tires. These tires offersuperior grip and minimized fuel consumption by reducing rolling resistance, while ensuring excellentperformance. However, the difficulty of effectively forming composites of silica and rubber has meant costlyand complex processing. As research and product development are pursued around the world to resolvethese issues, Yokohama is ahead of the competition with its development of two unique technologies.
Z e r u m a • Developed by Yokohama in 1996, Zeruma is a new processing auxiliary that improves theperformance of silica composite tires while reducing production costs. This additive, a liquid compound,possesses a molecular structure that acts as an intermediary between silica and rubber. Zeruma evenlydistributes silica components through rubber, enabling the resulting composite to fully achieve itsperformance potential. Also, Zeruma reduces compounding and vulcanizing times, simplifying processingand enhancing productivity.
S i l i c a S u r f a c e - T r e a t e d C a r b o n B l a c k • In October 1998, Yokohama announced a newtechnology to chemically combine silica with carbon surfaces before compounding with rubber. We namedthe technology based on this material Silica Surface-Treated Carbon Black. Compared with conventionalcompounding technologies, Yokohama’s new technique makes it possible to distribute small amounts ofsilica evenly, thereby reducing production costs. In addition, rubber processed in this manner not only lowers fuel consumption while increasing tire grip, it also raises tire abrasion resistance by strengthening thecompounding capability of rubber.
N e w M a t e r i a l sV e l a r e n • In 1997, we successfully developed a dynamic vulcanization and continuous kneadingtechnology that unifies the curing and kneading processes, thus enabling the blending of plastics withdifferent kinds of rubber. Velaren, the rubber-plastic compound resulting from this technology, is employedin a series of new materials that are light and easy to recycle, and which contribute to resource conservationand energy efficiency by enabling manufacturers to downsize products. Currently, we are using Velarenmaterials in water-shielding sheets for civil engineering use, but we also foresee applications in such fields as tires and sports products.
1513.9 13.8 13.3
12
9
6
3
’99’98’970
4
3
2
1
0
(Billions of Yen) (Percentage)
R&D and R&D as aPercentage of Net Sales
14
Environmental Protection
Yokohama pursues its business objectives under the theme of QCDE, or quality, cost, delivery andenvironmental protection. Maintaining high QCDE standards is essential if a company is to competesuccessfully in the global market. Of particular importance to all good corporate citizens in the nextcentury will be ensuring that our environment is healthy. Yokohama’s commitment to the environment is evident in the many ecological activities it has undertaken since the beginning of the 1990s.
E n v i r o n m e n t a l A c t i o n P l a n a n d E n v i r o n m e n t a l M a n a g e m e n t S t a n d a r d sSince Yokohama enacted its Environmental Action Plan in 1993, our corporate obligations have grown andevolved. Consequently, in June 1998 we revised the plan, outlining new goals in the process. In addition toworking to reduce industrial waste and carbon dioxide emissions from our facilities, we set the objective ofattaining the ISO 14001 international standard for environmental management at all six of our plants inJapan. The Mishima Plant fulfilled requirements in July and the Mie Plant in December 1998, while theShinshiro and Ibaraki plants reached the standard in May and June 1999, respectively.
L i f e C y c l e A s s e s s m e n t M e t h o d f o r T i r e s H e l p s R e d u c e C a r b o n D i o x i d eIn July 1998, Yokohama established a Life Cycle Assessment (LCA) method for tires. Analysis under thissystem, from production to disposal of a tire, has shown that between 80% and 90% of the carbon dioxideproduced is generated during its usage. Consequently, we realized that the most effective way to cut carbondioxide emissions from tires is to enhance performance by, for example, improving rolling and abrasionresistance. Using the data from this analysis, we continue to develop products that have minimal negativeimpact on the environment.
A T e l e v i s i o n C a m p a i g n f o r M a i n t a i n i n g T i r e A i r P r e s s u r eYokohama began airing a unique series of television promotions in July 1998 with the message ofcontributing to environmental protection by regularly checking the air pressure of tires. Insufficient airpressure increases rolling resistance, thereby adversely affecting fuel efficiency.
Y o k o h a m a S o l e T i r e S u p p l i e r f o r U . S . E l e c t r i c V e h i c l e R a c eThe Americas Electric Challenge is a nationwide series of races sponsored by Electric Vehicle TechnologyCompetitions, Ltd., of the United States. In support of the spirit of this event, which aims to promote bothfun and environmental protection, Yokohama lends its support by being the sole supplier of tires for theABB University Spec Series, one group of races within the Americas Electric Challenge. In 1998, 10 raceswere held in this series in locations such as Indianapolis Motor Speedway in Indiana.

15
Financial Section
Financial Review • 16
Six-Year Summary • 19
Consolidated Balance Sheets • 20
Consolidated Statements of Income • 22
Consolidated Statements of Shareholders’ Equity • 23
Consolidated Statements of Cash Flows • 24
Notes to Consolidated Financial Statements • 25
Report of Independent Certified Public Accountants • 31

16
Financial Review
Operating Results
SalesIn fiscal 1999, consolidated net sales of The Yokohama Rubber Co., Ltd., and its consolidated subsidiariesshrank 3.4% from the previous fiscal year, to ¥401,183 million. Although sales of YTC and other overseassubsidiaries expanded, the severe operating environment in Japan led to reduced sales of Yokohama and itsdomestic sales subsidiaries.
Cost of Sales and Selling, General and Administrative ExpensesEfforts such as cost reduction by YTC in North America and sales subsidiaries in Japan helped decrease cost of sales 5.8% from the previous year, to ¥281,245 million. Selling, general and administrative expenses fell1.0% from a year earlier, to ¥104,129 million, mainly because of a reduction in personnel expenses throughoutthe Yokohama Group.
Operating IncomeReduced cost of sales and selling, general and administrative expenses more than offset the decline in net sales,resulting in a rise in operating income to ¥15,809 million, or an increase of 35.5% over the previous fiscal year.
Net IncomeThe Yokohama Group’s net income soared 270.3%, to ¥3,233 million. Basic net income per share amounted to¥9.44, up from ¥2.55 in fiscal 1998.
Capital Expenditures and DepreciationCapital expenditures by the Group amounted to ¥28,216 million, up 3.6%, and depreciation edged down2.0%, to ¥21,141 million. A total of ¥22,601 million was invested in the Tire Group, mainly to introduce newpassenger car radials and to rationalize and expand production facilities for steel radials for trucks and buses.Investment in the Multiple Business Group totaled ¥4,555 million, which was applied mainly to reinforce and
500
’99’98’97’96
400
300
200
100
0
(Billions of Yen)
Tire Group MB Group
389 403415
401
20
’99’98’97’96
16
15.1
12.7
11.7
15.8
12
8
4
0
(Billions of Yen)
Tire Group MB Group
5
’99’98’97’96
4
0
3
6
9
12
3
2
10.6
3.8
0.9
3.2
0
(Billions of Yen) (Yen)
Net IncomeNet Income per Share
Sales by Group Operating Income by Group Net Income and Net Income per Share

17
rationalize production equipment for sealants, rubber bearings for bridges and civil aircraft components. Other capital expenditures came to ¥1,060 million. In fiscal 2000, the Group forecasts capital expenditures of¥22,800 million and depreciation of ¥20,800 million.
Financial Position and Cash Flows
AssetsThe Yokohama Group’s total assets stood at ¥432,457 million at March 31, 1999, up ¥7,963 from a yearearlier. Current assets declined ¥20,165 million, to ¥224,637 million, chiefly attributable to a drop in tradereceivables resulting from lower sales by the parent company and reduced inventories by Yokohama, YTC and domestic tire sales subsidiaries. On the other hand, active capital expenditures in YTC and domesticmanufacturing facilities increased property, plant and equipment ¥9,768 million, to ¥163,740 million.
Liabilities and Shareholders’ EquityCurrent liabilities dropped ¥23,183 million, to ¥241,002 million, owing primarily to a decrease in trade notesand accounts payable and the maturity of convertible bonds. Long-term liabilities expanded ¥14,109 million, to ¥83,785 million, as new straight bonds were issued, and long-term debt increased. In this environment, totalliabilities fell ¥9,074 million, to ¥324,787 million. Total shareholders’ equity amounted to ¥105,984 million, up ¥506 million from a year earlier.
Cash FlowsNet cash provided by operating activities came to ¥22,563 million in fiscal 1999, leading to a 5.6% ratio of net cash provided by operating activities to net sales. Net cash used in investing activities was ¥22,925million, and net cash used in financing activities was ¥1,258 million. In this situation, cash and time deposits at the fiscal year-end totaled ¥21,842 million, a drop of ¥1,620 million from a year earlier.
35
’99’98’97’96
28
21-120
2728
22
2021 21 21
14
7
0
(Billions of Yen)
Capital Expenditures Depreciation
-1
+5 +7
500
’99’98’97’96
400
300
322
98
312
108
334 325
105 106
200
100
0
(Billions of Yen)
Financial DebtRatio of Financial Debt to Shareholders’ Equity
Shareholders’ Equity
0
1
2
3
4(Times)
50
’99’98’97’96
40
0
2
4
6
8
30
20
10
16.8
32.0
14.6
22.6
0
(Billions of Yen) (Percentage)
Net Cash Provided by Operating Activites Percentage of Net Sales
Capital Expendituresand Depreciation
Financial Debt, Shareholders’ Equity and Ratioof Financial Debt to Shareholders’ Equity
Net Cash Provided by OperatingActivities and Percentage of Net Sales

18
Segment Information
Business GroupsInfluenced by the drop in sales of tires by the parent company, sales by the Tire Group shrank 2.1%, to¥280,007 million. However, the Tire Group’s operating income climbed 120.2%, to ¥11,526 million, mainlybecause of successful cost-reduction efforts at YTC and domestic tire sales subsidiaries. Sales by the MultipleBusiness Group were down 6.4%, to ¥121,l76 million, and operating income slumped 21.0%, to ¥4,375million.
RegionsSales by the Yokohama Group in Japan amounted to ¥371,115 million, a 6.7% contraction, negatively affectedby the depressed market. However, cost cutting by the parent company and domestic tire sales subsidiariessustained a 14.9% rise in operating income, to ¥13,643 million. In North America, a strong performance byYTC contributed to a 12.9% advance in regional sales, to ¥73,322 million, and operating income jumped to¥1,278 million, from a loss of ¥405 million a year earlier. Sales in other regions expanded 1.9%, to ¥10,746million, and operating income was propelled 241.4%, to ¥454 million.
Forecast for Fiscal 2000The Yokohama Group anticipates increased sales by consolidated subsidiaries, generating a 2% rise inconsolidated net sales, to ¥410,000 million. The Group also forecasts that profitability improvements by the parent company will contribute to a 14% growth in operating income, to ¥18,000 million. Net income is forecast at ¥4,500 million, up 39% from the fiscal 1999 figure.
Y2K CountermeasuresThe Year 2000, or Y2K computer bug is recognized by the Yokohama Group as an important managementissue. The Group is currently implementing comprehensive countermeasures throughout its information,production, logistics and materials procurement systems. These countermeasures, including the production ofrisk management manuals, are expected to be completed by September 30, 1999.
200
’99’98’97’96’95’94’93’92
160
120
80
40
0
(Billions of Yen)
Cumulative Cash Flows from Operating Activities Cumulative Dividends Paid
Cumulative Cash Flows and Dividends Paid Since 1992

19
Six-Year Summary
Fiscal Years Ended March 31, 1999, 1998, 1997, 1996 and 1995, and December 31, 1994
Net Sales
Operating Income
Income before Income Taxes
Net Income (Loss)
Depreciation
Capital Expenditures
R&D Expenditures
Interest-Bearing Debt
Shareholders’ Equity
Total Assets
Per Share (Yen):
Net Income (Loss) (Basic)
Cash Dividends
Share Price (Yen):
High
Low
Fiscal Year-End
Common Stock Issued
Number of Employees
1 9 9 9
¥401,183
15,809
7,731
3,233
21,141
28,216
13,300
215,245
105,984
432,457
¥ 9.44
6.00
¥ 351
255
314
342,598,162
12,107
1 9 9 4
¥379,363
15,210
7,605
2,091
22,262
—
—
201,555
96,664
416,351
¥ 7.18
8.00
¥ 745
688*
528
647*
647
301,570,565
13,254
1 9 9 5
¥ 80,145
1,934
121
(601)
5,066
—
—
201,131
96,012
407,997
¥ (1.93)
2.00
¥ 687
488
489
316,655,465
—
1 9 9 6
¥389,304
15,136
6,054
563
21,146
20,038
—
203,120
97,907
423,749
¥ 1.77
8.00
¥ 678
439
665
323,642,673
12,743
1 9 9 7
¥402,652
12,681
13,808
3,753
21,167
20,316
13,900
188,428
108,306
420,939
¥ 11.44
8.00
¥ 707
475
504
342,598,162
12,267
1 9 9 8
¥415,397
11,668
5,685
873
21,566
27,229
13,800
209,132
105,478
440,420
¥ 2.55
8.00
¥ 563
290
319
342,598,162
12,325
Millions of Yen
Notes:
1. The fiscal period ended March 31, 1995, was a special three-month fiscal period resulting from a change in Yokohama’s fiscal year.
2. An asterisk (*) denotes stock prices adjusted following stock splits.

20
A S S E T S
Current Assets:
Cash and time deposits (Note 4)
Marketable securities (Note 4)
Trade receivables:
Notes and accounts (Notes 4 and 6)
Allowance for doubtful receivables
Inventories (Note 3)
Deferred income taxes
Other current assets
Total current assets
Property, Plant and Equipment, at Cost (Notes 4 and 5):
Land
Buildings and structures
Machinery and equipment
Construction in progress
Less accumulated depreciation
Total property, plant and equipment, net
Investments and Other Assets:
Investment securities
Long-term loans receivable
Deferred income taxes
Other investments and other assets
Allowance for doubtful receivables
Total investments and other assets
Foreign currency translation adjustments
Total
1 9 9 9
$ 181,186
256,574
882,837
(45,458)
485,135
33,256
69,904
1,863,434
252,169
878,714
2,622,638
69,507
3,823,028
(2,464,753)
1,358,275
57,959
30,004
780
221,377
(4,272)
305,848
59,809
$ 3,587,366
1 9 9 8
¥ 23,462
29,213
113,128
(4,096)
63,913
4,899
14,283
244,802
29,694
100,331
297,700
10,930
438,655
(284,683)
153,972
8,081
4,884
—
25,820
(536)
38,249
3,397
¥ 440,420
1 9 9 9
¥ 21,842
30,930
106,426
(5,480)
58,483
4,009
8,427
224,637
30,399
105,929
316,159
8,379
460,866
(297,126)
163,740
6,987
3,617
94
26,687
(515)
36,870
7,210
¥ 432,457
See accompanying Notes to Consolidated Financial Statements.
Consolidated Balance Sheets
The Yokohama Rubber Co., Ltd. and Consolidated SubsidiariesAs of March 31, 1999 and 1998
Millions of Yen
Thousands of U.S. Dollars
(Note 1)

21
1 9 9 9
$ 960,050
63,915
190,792
515,570
13,107
146,877
108,876
1,999,187
570,784
40,199
84,040
—
695,023
13,986
322,762
264,562
291,846
879,170
$3,587,366
1 9 9 8
¥122,460
23,021
10,500
71,730
2,665
19,431
14,378
264,185
53,151
4,573
11,718
234
69,676
1,081
38,909
31,893
34,676
105,478
¥440,420
1 9 9 9
¥115,734
7,705
23,000
62,152
1,580
17,706
13,125
241,002
68,808
4,846
10,131
—
83,785
1,686
38,909
31,893
35,182
105,984
¥432,457
Millions of Yen
Thousands of U.S. Dollars
(Note 1)
L I A B I L I T I E S A N D S H A R E H O L D E R S ’ E Q U I T Y
Current Liabilities:
Bank loans
Current maturities of long-term debt (Note 4)
Commercial paper
Trade notes and accounts payable
Accrued income taxes
Accrued expenses
Other current liabilities
Total current liabilities
Long-Term Liabilities:
Long-term debt (Note 4)
Other long-term liabilities
Liabilities for severance benefits
Deferred income taxes
Total long-term liabilities
Minority interests
Contingent liabilities (Note 6)
Shareholders’ Equity:
Common stock:
Authorized: 480,000,000 shares
Issued: 342,598,162 shares
Capital surplus
Retained earnings (Note 8)
Total shareholders’ equity
Total

22
Net sales
Cost of sales
Selling, general and administrative expenses
Operating income
Other income (expenses)
Interest income and dividends received
Interest expense
Other—net
Income before income taxes
Income taxes (Note 2):
Current
Deferred
Minority interests in net income of
consolidated subsidiaries
Net income
Per share amounts:
Net income: Basic
Net income: Diluted
Cash dividends
1 9 9 9
$3,327,938
2,333,015
994,923
863,782
131,141
9,589
(51,929)
(24,670)
(67,010)
64,131
32,800
4,180
36,980
(332)
$ 26,819
$ 0.08
—
$ 0.05
1 9 9 8
¥415,397
298,551
116,846
105,178
11,668
1,145
(5,533)
(1,595)
(5,983)
5,685
5,945
(1,111)
4,834
22
¥ 873
¥ 2.55
—
¥ 8.00
1 9 9 7
¥ 402,652
288,800
113,852
101,171
12,681
1,454
(5,790)
5,463
1,127
13,808
10,229
(221)
10,008
(47)
¥ 3,753
¥ 11.14
¥ 11.10
¥ 8.00
1 9 9 9
¥ 401,183
281,245
119,938
104,129
15,809
1,156
(6,260)
(2,974)
(8,078)
7,731
3,954
504
4,458
(40)
¥ 3,233
¥ 9.44
—
¥ 6.00
Consolidated Statements of Income
The Yokohama Rubber Co., Ltd. and Consolidated SubsidiariesFor the Years Ended March 31, 1999, 19998 and 1997
Millions of Yen
Thousands of U.S. Dollars
(Note 1)
YenU.S. Dollars
(Note 1)
See accompanying Notes to Consolidated Financial Statements.

23
Balance at March 31, 1996
Increase resulting from changes in
equity in consolidated subsidiaries
Net income
Cash dividends paid
Directors’ and statutory auditors’ bonuses
Common stock issued upon exercise of warrants
Balance at March 31, 1997
Decrease resulting from changes in
equity in consolidated subsidiaries
Net income
Cash dividends paid
Directors’ and statutory auditors’ bonuses
Balance at March 31, 1998
Increase in retained earnings due to
addition of consolidated subsidiaries
Net income
Cash dividends paid
Directors’ and statutory auditors’ bonuses
Balance at March 31, 1999
Balance at March 31, 1998
Increase in retained earnings due to
addition of consolidated subsidiaries
Net income
Cash dividends paid
Directors’ and statutory auditors’ bonuses
Balance at March 31, 1999
¥36,457
5
3,753
(2,636)
(75)
—
37,504
(885)
873
(2,741)
(75)
34,676
73
3,233
(2,740)
(60)
¥35,182
$287,648
606
26,819
(22,729)
(498)
$291,846
¥34,233
—
—
—
—
4,676
38,909
—
—
—
—
38,909
—
—
—
—
¥38,909
$322,762
—
—
—
—
$322,762
¥27,217
—
—
—
—
4,676
31,893
—
—
—
—
31,893
—
—
—
—
¥31,893
$264,562
—
—
—
—
$264,562
323,642,673
—
—
—
—
18,955,489
342,598,162
—
—
—
—
342,598,162
—
—
—
—
342,598,162
Consolidated Statements of Shareholders’ Equity
The Yokohama Rubber Co., Ltd. and Consolidated SubsidiariesFor the Years Ended March 31, 1999, 19998 and 1997
Millions of Yen
See accompanying Notes to Consolidated Financial Statements.
Shares ofCommon Stock
Common Stock
CapitalSurplus
RetainedEarnings
Thousands of U.S. Dollars (Note 1)
Common Stock
CapitalSurplus
RetainedEarnings

24
Operating Activities:
Net income
Adjustments to reconcile net income
to net cash provided by operating activities:
Depreciation
Provision for severance benefits, less payments
Equity in earnings of unconsolidated subsidiaries
and affiliates, net
Deferred income taxes—non-current
Changes in operating assets and liabilities:
Trade notes and accounts receivable
Inventories
Other current assets
Notes and accounts payable
Other current liabilities
Net cash provided by operating activities
Investing Activities:
Additions to property, plant and equipment
Increase in investments
Proceeds from sales of investment securities
and properties
Other, net
Net cash used in investing activities
Financing Activities:
Decrease in short-term bank loans and current
maturities of long-term debt
Increase (decrease) in commercial paper
Proceeds from long-term debt
Decrease in long-term debt
Common stock issued upon exercise of warrants
Payment of cash dividends
Net cash provided by (used in) financing activities
Increase (decrease) in cash and time deposits
Cash and time deposits at beginning of year
Cash and time deposits at end of year
1 9 9 9
$ 26,819
175,371
(13,164)
531
41
55,595
45,043
10,087
(79,452)
(33,704)
187,167
(233,920)
(11,539)
36,707
18,582
(190,170)
(182,845)
103,691
166,910
(75,462)
—
(22,729)
(10,435)
(13,438)
194,624
$ 181,186
1 9 9 8
¥ 873
21,566
(328)
99
(70)
2,507
(3,898)
(7,410)
3,491
(2,205)
14,625
(27,060)
(553)
2,052
(4,294)
(29,855)
(10,893)
7,500
33,644
(10,205)
—
(2,741)
17,305
2,075
21,387
¥ 23,462
1 9 9 7
¥ 3,753
21,167
141
(114)
(111)
(2,021)
556
5,008
(2,460)
6,080
31,999
(20,323)
(2,763)
7,542
(6,626)
(22,170)
(15,212)
3,000
8,420
(10,900)
9,351
(2,635)
(7,976)
1,853
19,534
¥21,387
1 9 9 9
¥ 3,233
21,141
(1,587)
64
5
6,702
5,430
1,216
(9,578)
(4,063)
22,563
(28,199)
(1,391)
4,425
2,240
(22,925)
(22,042)
12,500
20,121
(9,097)
—
(2,740)
(1,258)
(1,620)
23,462
¥ 21,842
Consolidated Statements of Cash Flows
The Yokohama Rubber Co., Ltd. and Consolidated SubsidiariesFor the Years Ended March 31, 1999, 19998 and 1997
Millions of Yen
Thousands of U.S. Dollars
(Note 1)
See accompanying Notes to Consolidated Financial Statements.

25
Notes to Consolidated Financial Statements
The Yokohama Rubber Co., Ltd. and Consolidated Subsidiaries
1. Basis of Presenting Financial StatementsThe accompanying consolidated financial statements of The Yokohama Rubber Co., Ltd. (the “Company”)have been prepared in accordance with accounting principles and practices generally accepted in Japan andhave been compiled from the consolidated financial statements filed under the Securities and Exchange Law ofJapan.
In preparing these statements, certain reclassifications and rearrangements have been made to theconsolidated financial statements prepared domestically in order to present these statements in a form which ismore familiar to readers outside Japan. In addition, the accompanying notes include additional informationwhich is not required under accounting principles and practices generally accepted in Japan.
Certain reclassifications have been made in 1998 and 1997 consolidated financial statements to conform tothe classifications used in 1999.
The U.S. dollar amounts included herein are solely for the convenience of the reader and have beentranslated from the Japanese yen amounts at the rate of ¥120.55=U.S.$1.00, the approximate exchange rateprevailing on March 31,1999.
2. Summary of Significant Accounting Policies(1) Principles of ConsolidationThe accompanying consolidated financial statements include the accounts of the Company and its significantmajority-owned domestic and foreign subsidiaries (together, the “Companies”). Investments in unconsolidatedsubsidiaries and associated companies (companies owned 20% to 50%) are accounted for by the equity methodof accounting.
All significant intercompany transactions and balances have been eliminated. The excess of the cost of theCompanies’ investments in subsidiaries and associated companies over their equity in the net assets at the datesof acquisition was not material and has been fully written off as incurred.(2) Foreign Currency TranslationCurrent foreign currency receivables and payables are translated at the year-end rates, and non-currentreceivables and payables at historical rates.(3) Marketable Securities and Investment SecuritiesMarketable securities are carried at the lower of cost or market and investment securities are carried at cost.Costs are determined by the moving average method.(4) InventoriesInventories are stated at cost determined by the moving average method, except that the finished products ofcertain subsidiaries are valued by the most recent purchase price method.(5) Allowance for Doubtful ReceivablesThe allowance for doubtful receivables is provided at an estimated amount of probable bad debt plus themaximum amount which is deductible under the Japanese income tax law.(6) DepreciationDepreciation of property, plant and equipment is computed principally by the declining-balance method basedon the estimated useful lives of the respective assets.(7) Liabilities for Severance Payments and Employee Benefit PlansEmployees who terminate their service with the Companies are, under most circumstances, entitled to lump-sum severance payments determined by reference to their current basic rate of pay and length of service. TheCompanies generally provide for this liability at 40% of the amount which would be required to be paid if allemployees voluntarily terminated their service at the balance sheet date.
The Company and certain consolidated subsidiaries have non-contributory pension plans for theirtermination caused by age limit. Contributions to the pension fund are charged to income when made.
The liabilities also include provisions for retirement payments for directors and statutory auditorsdetermined according to the Company’s internal rules.
In addition to providing pension and severance plan benefits, certain foreign subsidiaries sponsor severalunfunded defined benefit postretirement plans which provide certain health care and life insurance benefits toeligible employees and, in 1993, adopted Statement of Financial Accounting Standard No. 106, “Employers’Accounting for Postretirement Benefits Other Than Pensions.”

26
(8) Income TaxesIncome taxes in Japan comprise a corporation tax, enterprise tax and prefectural and municipal inhabitants’taxes.
The income tax effect of timing differences resulting from the elimination of intercompany profits and otherconsolidation entries is recognized as deferred income taxes.(9) Revenue RecognitionSales of products are recognized in the accounts upon shipments to customers.(10) Research and Development CostsResearch and development costs are charged to income as incurred.(11) Net income per ShareThe computation of basic net income per share is based on the weighted average number of shares outstandingduring the period.(12) LeasesFinance leases, other than those lease agreements which stipulate the transfer of ownership of the leasedproperty, are accounted for as operating leases.
3. InventoriesInventories at March 31, 1999 and 1998 consisted of the following:
Finished products
Work in process
Raw materials and supplies
1 9 9 9
$ 359,610
61,825
63,700
$ 485,135
1 9 9 8
¥ 48,035
7,930
7,948
¥ 63,913
1 9 9 9
¥ 43,351
7,453
7,679
¥ 58,483
Millions of YenThousands of U.S. Dollars
1.7% convertible bonds due 1998
2.65% straight bonds due 2004
2.175% straight bonds due 2002
2.2% straight bonds due 2003
Loans, principally from banks and
insurance companies
Less current maturities
1 9 9 9
—
$ 82,953
82,953
82,953
385,840
634,699
63,915
$570,784
1 9 9 8
¥ 14,800
10,000
10,000
—
41,372
76,172
23,021
¥ 53,151
1 9 9 9
—
¥ 10,000
10,000
10,000
46,513
76,513
7,705
¥ 68,808
Millions of YenThousands of U.S. Dollars
4. Long-Term DebtLong-term debt at March 31, 1999 and 1998 consisted of the following:
Time deposits
Marketable securities
Notes receivable
Property, plant and equipment
1 9 9 9
—
$ 56,541
3,799
768,461
$ 828,801
1 9 9 8
¥ 18
331
1,119
86,283
¥ 87,751
1 9 9 9
—
¥ 6,816
458
92,638
¥ 99,912
Millions of YenThousands of U.S. Dollars
Assets pledged to secure bank loans and long-term debt at March 31, 1999 and 1998 were as follows:

27
Selling, general and administrative expenses
Manufacturing costs
1 9 9 9
$ 16,134
$159,237
1 9 9 7
¥ 2,202
¥ 18,965
1 9 9 8
¥ 2,342
¥ 19,224
1 9 9 9
¥ 1,945
¥19,196
Millions of YenThousands of U.S. Dollars
5. DepreciationDepreciation charges were as follows:
Notes discounted and endorsed
Guarantees
1 9 9 9
$17,412
$14,044
1 9 9 8
¥3,196
¥5,625
1 9 9 9
¥2,099
¥1,693
Millions of YenThousands of U.S. Dollars
6. Contingent LiabilitiesContingent liabilities at March 31, 1999 and 1998 were as follows:
Acquisition costs
Accumulated depreciation
Net book value
1 9 9 9
$49,788
24,869
$24,919
1 9 9 9
¥6,002
2,998
¥3,004
Millions of YenThousands of U.S. Dollars
7. LeasesAn analysis of leased property under finance leases was as follows:
Within one year
After one year
1 9 9 9
$ 9,996
14,923
$ 24,919
1 9 9 8
¥1,101
1,966
¥3,067
1 9 9 9
¥1,205
1,799
¥3,004
Millions of YenThousands of U.S. Dollars
The Companies have commitments payable under finance leases as follows:
Within one year
After one year
1 9 9 9
$10,626
53,646
$64,272
1 9 9 8
¥1,482
6,526
¥8,008
1 9 9 9
¥1,281
6,467
¥7,748
Millions of YenThousands of U.S. Dollars
Rental payments under non-cancellable operating leases were as follows:
Lease expenses under finance leases for the years ended March 31, 1999 and 1998 aggregated approximately¥1,263 million ($10,477 thousand) and ¥1,113 million, respectively.
28
Sales to third parties
Intergroup sales and transfers
Total sales
Operating expenses
Operating income
Total assets
Depreciation
Capital expenditures
¥401,183
—
401,183
385,374
¥ 15,809
¥432,457
¥ 21,141
¥ 28,216
¥401,183
8,033
409,216
393,315
¥ 15,901
¥394,335
¥ 20,913
¥ 27,156
—
¥ (8,033)
(8,033)
(7,941)
¥ (92)
¥38,122
¥ 228
¥ 1,060
¥121,176
7,916
129,092
124,717
¥ 4,375
¥107,383
¥ 4,046
¥ 4,555
Year ended March 31, 1999
MultipleBusiness
¥ 280,007
117
280,124
268,598
¥ 11,526
¥ 286,952
¥ 16,867
¥ 22,601
Tires TotalEliminations
and Corporate Consolidated
Millions of Yen
Sales to third parties
Intergroup sales and transfers
Total sales
Operating expenses
Operating income
Total assets
Depreciation
Capital expenditures
¥ 415,397
—
415,397
403,729
¥ 11,668
¥ 440,420
¥ 21,566
¥ 27,229
¥415,397
9,026
424,423
413,649
¥ 10,774
¥407,171
¥ 21,323
¥ 26,034
—
¥ (9,026)
(9,026)
(9,920)
¥ 894
¥33,249
¥ 243
¥ 1,195
¥ 129,397
8,900
138,297
132,757
¥ 5,540
¥ 114,428
¥ 4,009
¥ 6,465
¥ 286,000
126
286,126
280,892
¥ 5,234
¥ 292,743
¥ 17,314
¥ 19,569
Year ended March 31, 1998
Sales to third parties
Intergroup sales and transfers
Total sales
Operating expenses
Operating income
Total assets
Depreciation
Capital expenditures
¥ 402,652
—
402,652
389,971
¥ 12,681
¥ 420,939
¥ 21,167
¥ 20,316
¥ 402,652
8,077
410,729
398,512
¥ 12,217
¥ 387,677
¥ 20,938
¥ 20,104
—
¥ (8,077)
(8,077)
(8,541)
¥ 464
¥ 33,262
¥ 229
¥ 212
¥ 118,768
7,949
126,717
122,502
¥ 4,215
¥ 108,070
¥ 3,453
¥ 3,717
¥ 283,884
128
284,012
276,010
¥ 8,002
¥ 279,607
¥ 17,485
¥ 16,387
Year ended March 31, 1997
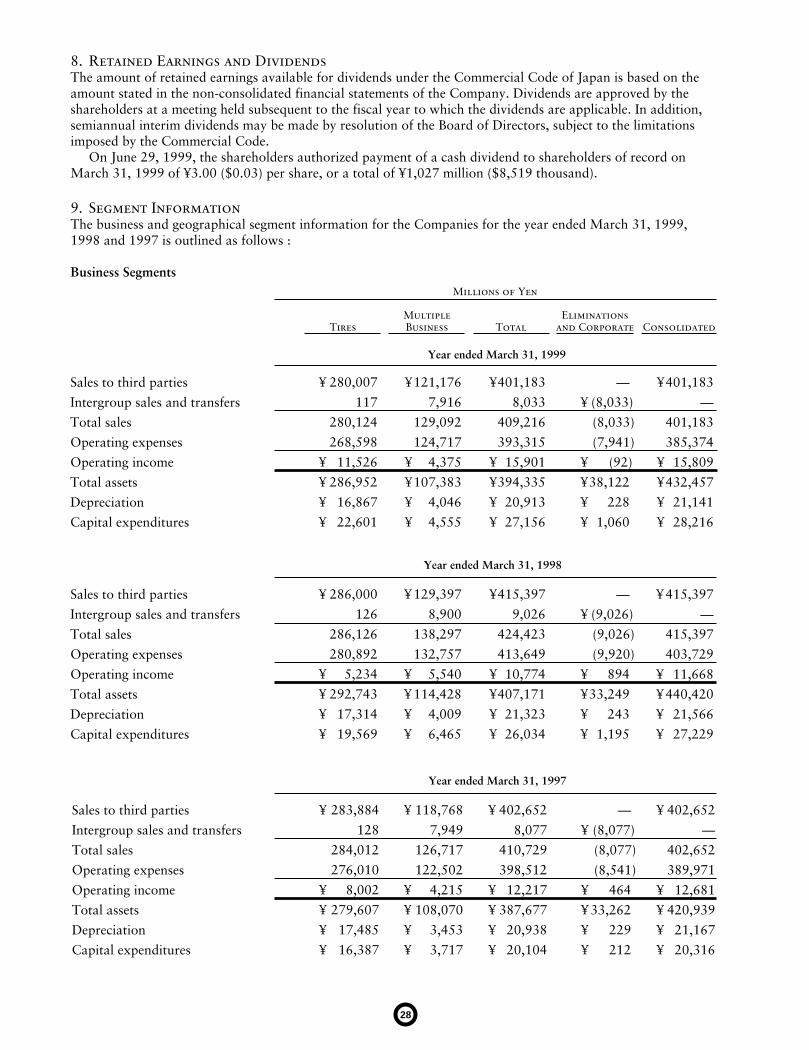
8. Retained Earnings and DividendsThe amount of retained earnings available for dividends under the Commercial Code of Japan is based on theamount stated in the non-consolidated financial statements of the Company. Dividends are approved by theshareholders at a meeting held subsequent to the fiscal year to which the dividends are applicable. In addition,semiannual interim dividends may be made by resolution of the Board of Directors, subject to the limitationsimposed by the Commercial Code.
On June 29, 1999, the shareholders authorized payment of a cash dividend to shareholders of record onMarch 31, 1999 of ¥3.00 ($0.03) per share, or a total of ¥1,027 million ($8,519 thousand).
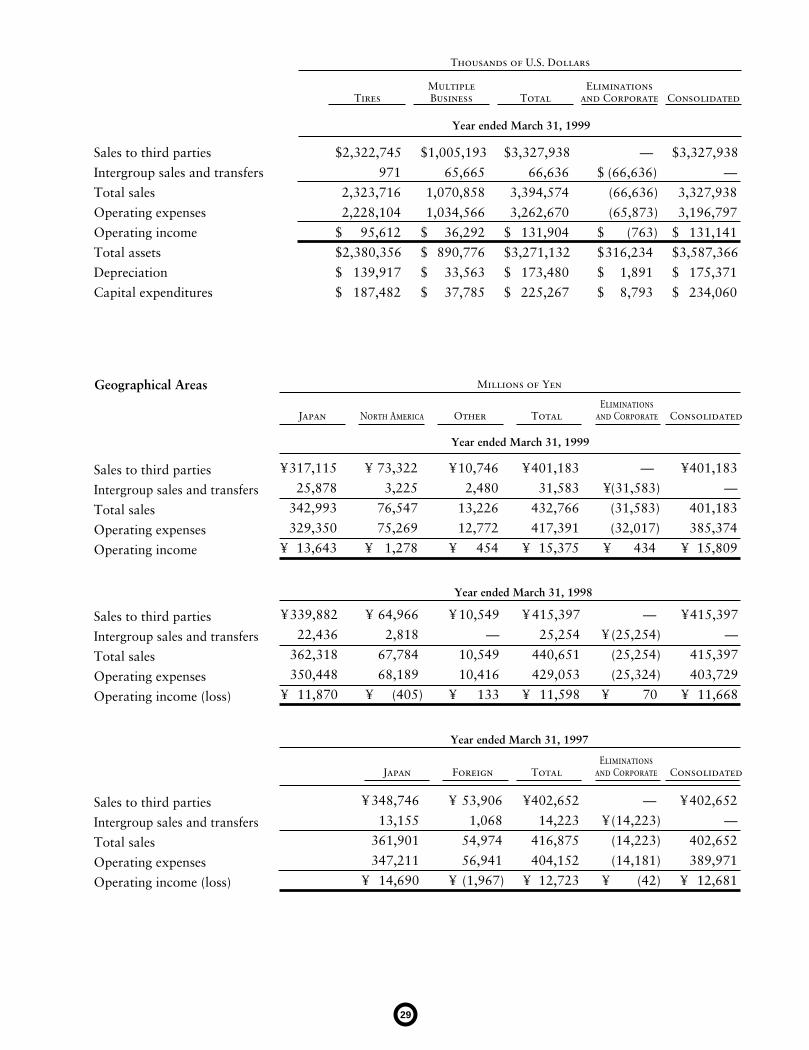
9. Segment InformationThe business and geographical segment information for the Companies for the year ended March 31, 1999,1998 and 1997 is outlined as follows :
Business Segments
29
Geographical Areas
Sales to third parties
Intergroup sales and transfers
Total sales
Operating expenses
Operating income
¥401,183
—
401,183
385,374
¥ 15,809
¥401,183
31,583
432,766
417,391
¥ 15,375
—
¥(31,583)
(31,583)
(32,017)
¥ 434
¥10,746
2,480
13,226
12,772
¥ 454
Year ended March 31, 1999
¥ 73,322
3,225
76,547
75,269
¥ 1,278
¥317,115
25,878
342,993
329,350
¥ 13,643
Japan Other Total ConsolidatedEliminations
and CorporateNorth America
Millions of Yen
Sales to third parties
Intergroup sales and transfers
Total sales
Operating expenses
Operating income
Total assets
Depreciation
Capital expenditures
$3,327,938
—
3,327,938
3,196,797
$ 131,141
$3,587,366
$ 175,371
$ 234,060
$3,327,938
66,636
3,394,574
3,262,670
$ 131,904
$3,271,132
$ 173,480
$ 225,267
—
$ (66,636)
(66,636)
(65,873)
$ (763)
$316,234
$ 1,891
$ 8,793
$1,005,193
65,665
1,070,858
1,034,566
$ 36,292
$ 890,776
$ 33,563
$ 37,785
$2,322,745
971
2,323,716
2,228,104
$ 95,612
$2,380,356
$ 139,917
$ 187,482
Sales to third parties
Intergroup sales and transfers
Total sales
Operating expenses
Operating income (loss)
¥402,652
—
402,652
389,971
¥ 12,681
¥402,652
14,223
416,875
404,152
¥ 12,723
—
¥(14,223)
(14,223)
(14,181)
¥ (42)
¥ 53,906
1,068
54,974
56,941
¥ (1,967)
¥ 348,746
13,155
361,901
347,211
¥ 14,690
Japan Total ConsolidatedEliminations
and CorporateForeign
Year ended March 31, 1997
Sales to third parties
Intergroup sales and transfers
Total sales
Operating expenses
Operating income (loss)
¥415,397
—
415,397
403,729
¥ 11,668
¥ 415,397
25,254
440,651
429,053
¥ 11,598
—
¥ (25,254)
(25,254)
(25,324)
¥ 70
¥ 10,549
—
10,549
10,416
¥ 133
¥ 64,966
2,818
67,784
68,189
¥ (405)
¥339,882
22,436
362,318
350,448
¥ 11,870
Year ended March 31, 1998
Year ended March 31, 1999
MultipleBusinessTires Total
Eliminationsand Corporate Consolidated
Thousands of U.S. Dollars

30
Sales to third parties
Intergroup sales and transfers
Total sales
Operating expenses
Operating income
$3,327,938
—
3,327,938
3,196,797
$ 131,141
$3,327,938
261,991
3,589,929
3,462,388
$ 127,541
—
$(261,991)
(261,991)
(265,591)
$ 3,600
$ 89,141
20,573
109,714
105,948
$ 3,766
Year ended March 31, 1999
$608,229
26,752
634,981
624,379
$ 10,602
$2,630,568
214,666
2,845,234
2,732,061
$ 113,173
Japan Other Total ConsolidatedEliminations
and CorporateNorth America
Thousands of U.S. Dollars
Overseas Sales
(A) Overseas sales
(B) Net sales
(C) (A)/(B) ✕ 100
¥119,354
¥415,397
28.7%
¥68,101
16.4%
¥51,253
12.3%
¥124,261
($1,030,784)
¥401,183
($3,327,938)
31.0%
Year ended March 31, 1999 Year ended March 31, 1998
¥45,657
($378,740)
11.4%
¥78,604
($652,044)
19.6%
Other TotalNorth America Other TotalNorth America
Millions of Yen(Thousands of U.S. Dollars) Millions of Yen
Overseas sales, which include export sales of the Company and its domestic consolidated subsidiaries and sales(other than exports to Japan) of its foreign consolidated subsidiaries, totaled ¥100,141 million, or 24.9% ofconsolidated net sales for the year ended March 31, 1997.

31
Report of Independent Certified Public Accountants
HIBIYA KOKUSAI BUILDING
2-3, UCHISAIWAI-CHO 2-CHOME,CHIYODA-KU, TOKYO
100-0011, JAPAN,PHONE: 03-3503-1100
TELEX: 02224127 SACTOK J
The Board of Directors
The Yokohama Rubber Co., Ltd.
We have examined the consolidated balance sheets of The Yokohama Rubber Co., Ltd. and consolidated
subsidiaries as of March 31, 1999 and 1998, and the related consolidated statements of income, shareholders’
equity and cash flows for each of the three years in the period ended March 31, 1999 expressed in Japanese
yen. Our examinations were made in accordance with auditing standards, procedures and practices generally
accepted and applied in Japan and, accordingly included such tests of the accounting records and such other
auditing procedures as we considered necessary in the circumstances.
In our opinion, the financial statements referred to above, expressed in Japanese yen, present fairly the
financial position of The Yokohama Rubber Co., Ltd. and consolidated subsidiaries at March 31 ,1999 and
1998 and the results of their operations and their cash flows for each of the three years in the period ended
March 31, 1999, in conformity with accounting principles and practices generally accepted in Japan applied
on a consistent basis.
The U.S. dollar amounts in the accompanying consolidated financial statements with respect to the year
ended March 31, 1999 are presented solely for convenience. Our examination also included the translation of
Japanese yen amounts into U.S. dollar amounts and, in our opinion, such translation has been made on the
basis described in Note 1 to the consolidated financial statements.
Tokyo, Japan
June 29, 1999
32
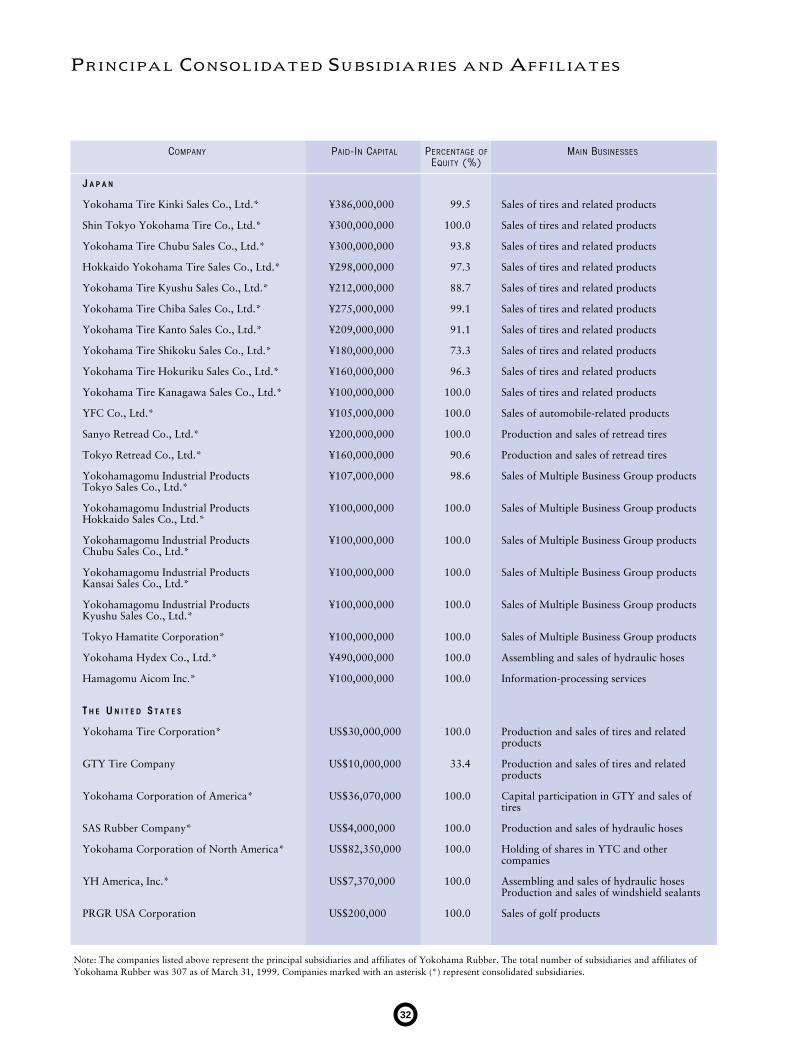
Principal Consolidated Subsidiaries and Affiliates
Note: The companies listed above represent the principal subsidiaries and affiliates of Yokohama Rubber. The total number of subsidiaries and affiliates ofYokohama Rubber was 307 as of March 31, 1999. Companies marked with an asterisk (*) represent consolidated subsidiaries.
COMPANY PAID-IN CAPITAL PERCENTAGE OF MAIN BUSINESSESEQUITY (%)
J A P A N
Yokohama Tire Kinki Sales Co., Ltd.* ¥386,000,000 99.5 Sales of tires and related products
Shin Tokyo Yokohama Tire Co., Ltd.* ¥300,000,000 100.0 Sales of tires and related products
Yokohama Tire Chubu Sales Co., Ltd.* ¥300,000,000 93.8 Sales of tires and related products
Hokkaido Yokohama Tire Sales Co., Ltd.* ¥298,000,000 97.3 Sales of tires and related products
Yokohama Tire Kyushu Sales Co., Ltd.* ¥212,000,000 88.7 Sales of tires and related products
Yokohama Tire Chiba Sales Co., Ltd.* ¥275,000,000 99.1 Sales of tires and related products
Yokohama Tire Kanto Sales Co., Ltd.* ¥209,000,000 91.1 Sales of tires and related products
Yokohama Tire Shikoku Sales Co., Ltd.* ¥180,000,000 73.3 Sales of tires and related products
Yokohama Tire Hokuriku Sales Co., Ltd.* ¥160,000,000 96.3 Sales of tires and related products
Yokohama Tire Kanagawa Sales Co., Ltd.* ¥100,000,000 100.0 Sales of tires and related products
YFC Co., Ltd.* ¥105,000,000 100.0 Sales of automobile-related products
Sanyo Retread Co., Ltd.* ¥200,000,000 100.0 Production and sales of retread tires
Tokyo Retread Co., Ltd.* ¥160,000,000 90.6 Production and sales of retread tires
Yokohamagomu Industrial Products ¥107,000,000 98.6 Sales of Multiple Business Group productsTokyo Sales Co., Ltd.*
Yokohamagomu Industrial Products ¥100,000,000 100.0 Sales of Multiple Business Group productsHokkaido Sales Co., Ltd.*
Yokohamagomu Industrial Products ¥100,000,000 100.0 Sales of Multiple Business Group productsChubu Sales Co., Ltd.*
Yokohamagomu Industrial Products ¥100,000,000 100.0 Sales of Multiple Business Group productsKansai Sales Co., Ltd.*
Yokohamagomu Industrial Products ¥100,000,000 100.0 Sales of Multiple Business Group productsKyushu Sales Co., Ltd.*
Tokyo Hamatite Corporation* ¥100,000,000 100.0 Sales of Multiple Business Group products
Yokohama Hydex Co., Ltd.* ¥490,000,000 100.0 Assembling and sales of hydraulic hoses
Hamagomu Aicom Inc.* ¥100,000,000 100.0 Information-processing services
T H E U N I T E D S T A T E S
Yokohama Tire Corporation* US$30,000,000 100.0 Production and sales of tires and relatedproducts
GTY Tire Company US$10,000,000 33.4 Production and sales of tires and relatedproducts
Yokohama Corporation of America* US$36,070,000 100.0 Capital participation in GTY and sales of tires
SAS Rubber Company* US$4,000,000 100.0 Production and sales of hydraulic hoses
Yokohama Corporation of North America* US$82,350,000 100.0 Holding of shares in YTC and other companies
YH America, Inc.* US$7,370,000 100.0 Assembling and sales of hydraulic hosesProduction and sales of windshield sealants
PRGR USA Corporation US$200,000 100.0 Sales of golf products

33
COMPANY PAID-IN CAPITAL PERCENTAGE OF MAIN BUSINESSESEQUITY (%)
C A N A D A
Yokohama Tire (Canada) Inc.* C$2,500,000 80.0 Sales of tires and related products
T H E P H I L I P P I N E S
Yokohama Tire Philippines, Inc.* P625,000,000 80.0 Production and sales of tires and relatedproducts
V I E T N A M
Yokohama Tyre Vietnam Company US$2,100,000 56.0 Production and sales of tires and relatedproducts
T H A I L A N D
Yokohama Rubber (Thailand) Co., Ltd. B90,000,000 70.0 Assembling and sales of hydraulic hosesProduction and sales of windshield sealants
T A I W A N
Shieh Chi Industrial Co., Ltd. NT$244,145,000 49.0 Production and sales of hydraulic hoses
A U S T R A L I A
Yokohama Tyre Australia Pty., Ltd.* A$4,000,000 60.0 Sales of tires and related products
T H E U N I T E D K I N G D O M
Yokohama HPT Ltd. £417,000 33.4 Sales of tires and related products
I T A L Y
Yokohama Italia S.P.A. L2,500,000,000 15.0 Sales of tires and related products
S W I T Z E R L A N D
Yokohama (Suisse) SA SFr400,000 20.0 Sales of tires and related products
S W E D E N
Yokohama Scandinavia AB SKr2,000,000 56.0 Sales of tires and related products
G E R M A N Y
Yokohama Reifen GmbH* DM2,100,000 75.0 Sales of tires and related products
A U S T R I A
Yokohama Austria GmbH S2,500,000 51.0 Sales of tires and related products
D E N M A R K
Yokohama Danmark A/S DKr1,000,000 71.3 Sales of tires and related products
T H E N E T H E R L A N D S
Yokohama Rubber Finance Europe B.V.* DGL300,000 100.0 Financing, borrowing and fund managementactivities

34
Board of Directors and Corporate Auditors
(as of June 29, 1999)
Chairman Seiji Hagiwara
President Yasuo Tominaga
Executive Directors Ryohei Tsunokuma
Hiroshi Hirakawa
Managing Directors Kenzo Nakanishi
Toshihiko Hiyama
Yoshiro Naitoh
Hisao Suzuki
Kohji Ikawa
Directors Kazuhisa Akutagawa
Masaaki Kushida
Keimei Kiyoura
Kazuo Okamoto
Noriaki Tateno
Koji Amano
Seiji Miyashita
Takashi Yamashita
Takeshi Takao
Hiroyuki Narukawa
Tadanobu Nagumo
Corporate Auditors Eika Yamagata
Hajime Iioka
Yasuyuki Wakahara
Kengo Tomomatsu

Corporate Data
(as of March 31, 1999)
Company Name: The Yokohama Rubber Co., Ltd.
Established: October 13, 1917
Paid-In Capital: ¥38,909 million
Head Office: 36-11, Shimbashi 5-chome, Minato-ku,Tokyo 105-8685, Japan
Production Facilities: Hiratsuka Factory and Mie, Mishima,Shinshiro, Ibaraki and Onomichi plants
Internet Address: http://www.yrc.co.jp/
STOCK INFORMATION
Authorized Number of Shares: 480,000,000
Issued Number of Shares: 342,598,162 (unchanged from fiscal1998 year-end)
Number of Shareholders: 20,448 (up 2,952 from fiscal 1998 year-end)
Average Shares per Shareholder: 16,755
INVESTOR INFORMATION
Settlement Date: March 31
General Meeting of Shareholders: June
Transfer Agent: The Chuo Trust & Banking Co., Ltd.7-1, Kyobashi 1-chome, Chuo-ku,Tokyo, Japan
Date of Record: March 31
Stock Exchange Listings: Tokyo, Osaka, Nagoya
35


![[Άτιτλο] - ShipSafe Marineshipsafemarine.com/.../2020/04/yokohama-fenders-1.pdf · 2020. 4. 27. · All Yokohama Pneumatic Rubber Fenders fully comply with all requirements](https://img.pdfslide.net/doc/110x75/60fe82c339a4456f642a0175/-shipsafe-2020-4-27-all-yokohama-pneumatic-rubber-fenders-fully.jpg)