Embed Size (px)
Citation preview
THE ZENDESK BENCHMARKYour Prescription for Optimizing
Customer Service
www.zendesk.com | [email protected] | 1.888.670.4887 The Zendesk Benchmark: Your Rx for Optimizing Customer Service | 2
Table of Contents
Intro
Introducing the Zendesk Benchmark
What matters most: the key metrics Zendesk Benchmark: the global results
Digging deeper into the data: the benchmark metrics Ticket metrics - direct one-to-one customer support Forum metrics - customer self service Comparing metrics by industry, by use case, by company size
Your prescription Conclusion
Coda: a bit about the science
www.zendesk.com | [email protected] | 1.888.670.4887 The Zendesk Benchmark: Your Rx for Optimizing Customer Service | 3
Intro
As Zendesk has grown - over 20,000 companies now use Zendesk to engage their customers - we started thinking how cool and helpful it would be if our customers could compare their customer service performance against their peers. After all, customer interactions produce a lot of results - support tickets, forum page views, comments, tweets, customer satisfaction ratings, etc.; what better way to understand these metrics than in the context of companies similar to your own?
These metrics have always been available on an individual company basis. Zendesk users have these critical metrics front-and-center everywhere. Agents can view the company’s satisfaction score; it’s easy to view web analytics for Zendesk forums; team leads and admins can slice and dice key support metrics to their hearts’ desire.
But as helpful as this data is to your individual company, it becomes even more valuable when you compare it with the 20,000+ other companies that use Zendesk as well. That’s a big reason we’re all using these cloud-based software tools - to benefit from the wisdom of crowds; to share best practices; to optimize how we run our businesses.
That’s what our new initiative, the Zendesk Benchmark, is all about.
Introducing the Zendesk Benchmark
Over the past year, Zendesk has gathered key demographic and product usage data to produce our first Zendesk Benchmark. The benchmark is based on data collected from Q2 (April-June) 2012: over 20,000 help desks, 80 million tickets, 50 million forum page views, supporting over 65 million end customers.
This isn’t your typical “expert” survey. We’re talking metrics based on real product usage and customer engagement. The benchmark provides you and your company:
• Insights based on actual help desk usage: metrics you need to measure your Support Volume, Support Efficiency and Quality of Engagement • Loads of comparisons: compare yourself to the overall population of Zendesk-powered support teams; to your industry peers; to companies of similar size; or to companies supporting similar end-users.
In this paper, we are going to look at the metrics and industry segments that make up the Zendesk Benchmark. We will then provide some strategies for how to improve your own metrics if you find yourself performing below that of your peers. If you are already familiar with the benchmark and customer support metrics, feel free to skip ahead to the section about improving your own metrics.
www.zendesk.com | [email protected] | 1.888.670.4887 The Zendesk Benchmark: Your Rx for Optimizing Customer Service | 4
What matters most: the key metrics
The Zendesk Benchmark includes ten individual metrics, but with just three of them, you can measure your overall support performance. In geeky terms: Customer Satisfaction = F(x) (Scale * Efficiency * Quality). In other words, if you efficiently deliver high-quality support at a large scale, you can bet on having satisfied customers.
Zendesk Benchmark: the global results
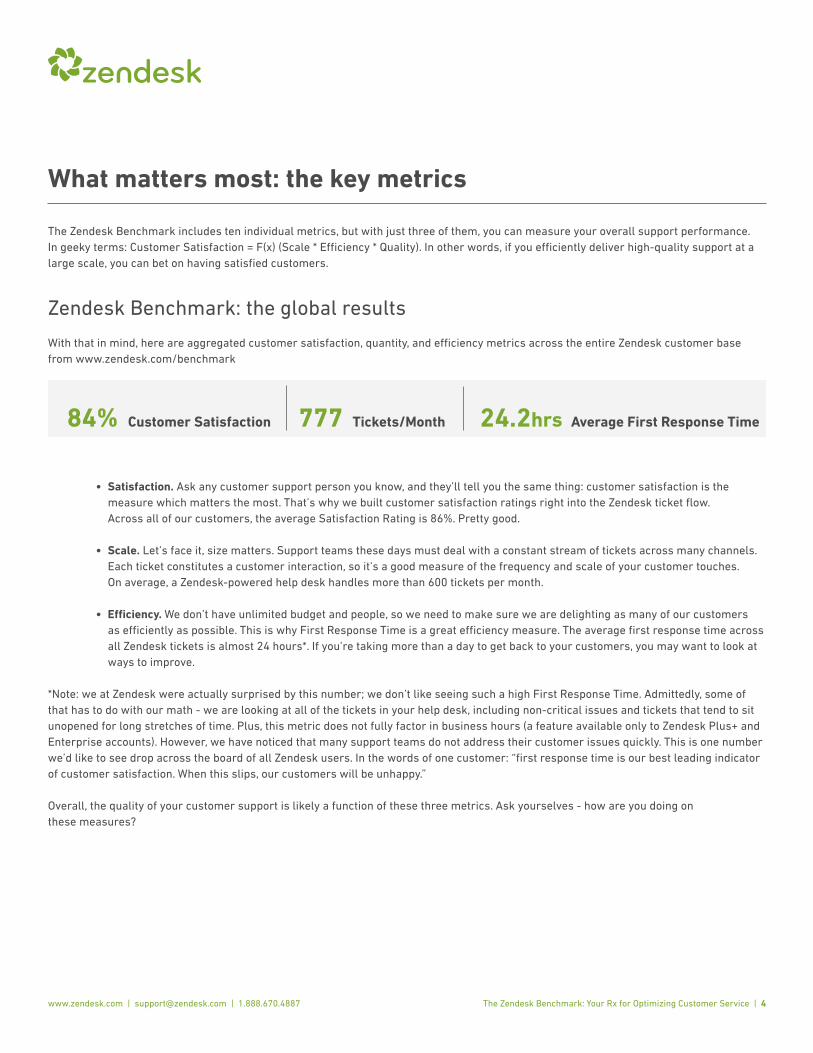
With that in mind, here are aggregated customer satisfaction, quantity, and efficiency metrics across the entire Zendesk customer base from www.zendesk.com/benchmark
84% Customer Satisfaction 777 Tickets/Month 24.2hrs Average First Response Time
• Satisfaction. Ask any customer support person you know, and they’ll tell you the same thing: customer satisfaction is the measure which matters the most. That’s why we built customer satisfaction ratings right into the Zendesk ticket flow. Across all of our customers, the average Satisfaction Rating is 86%. Pretty good.
• Scale. Let’s face it, size matters. Support teams these days must deal with a constant stream of tickets across many channels. Each ticket constitutes a customer interaction, so it’s a good measure of the frequency and scale of your customer touches. On average, a Zendesk-powered help desk handles more than 600 tickets per month.
• Efficiency. We don’t have unlimited budget and people, so we need to make sure we are delighting as many of our customers as efficiently as possible. This is why First Response Time is a great efficiency measure. The average first response time across all Zendesk tickets is almost 24 hours*. If you’re taking more than a day to get back to your customers, you may want to look at ways to improve.
*Note: we at Zendesk were actually surprised by this number; we don’t like seeing such a high First Response Time. Admittedly, some of that has to do with our math - we are looking at all of the tickets in your help desk, including non-critical issues and tickets that tend to sit unopened for long stretches of time. Plus, this metric does not fully factor in business hours (a feature available only to Zendesk Plus+ and Enterprise accounts). However, we have noticed that many support teams do not address their customer issues quickly. This is one number we’d like to see drop across the board of all Zendesk users. In the words of one customer: “first response time is our best leading indicator of customer satisfaction. When this slips, our customers will be unhappy.”
Overall, the quality of your customer support is likely a function of these three metrics. Ask yourselves - how are you doing on these measures?
www.zendesk.com | [email protected] | 1.888.670.4887 The Zendesk Benchmark: Your Rx for Optimizing Customer Service | 5
Digging deeper into the data: the benchmark metrics
Beyond the three main metrics, we are tracking additional ones that can give you a more complete picture of how you compare with your peers.
We’ve broken these metrics down into two categories -- ticket metrics: measuring how well a company delivers direct one-to-one customer support; and forum metrics, which measure the level and success of a company’s customer self-service.
Our goal is not to overwhelm you, but to provide a bit more context in case you want to see the contributing factors to customer satisfaction, support efficiency, and/or volume of customer engagement.
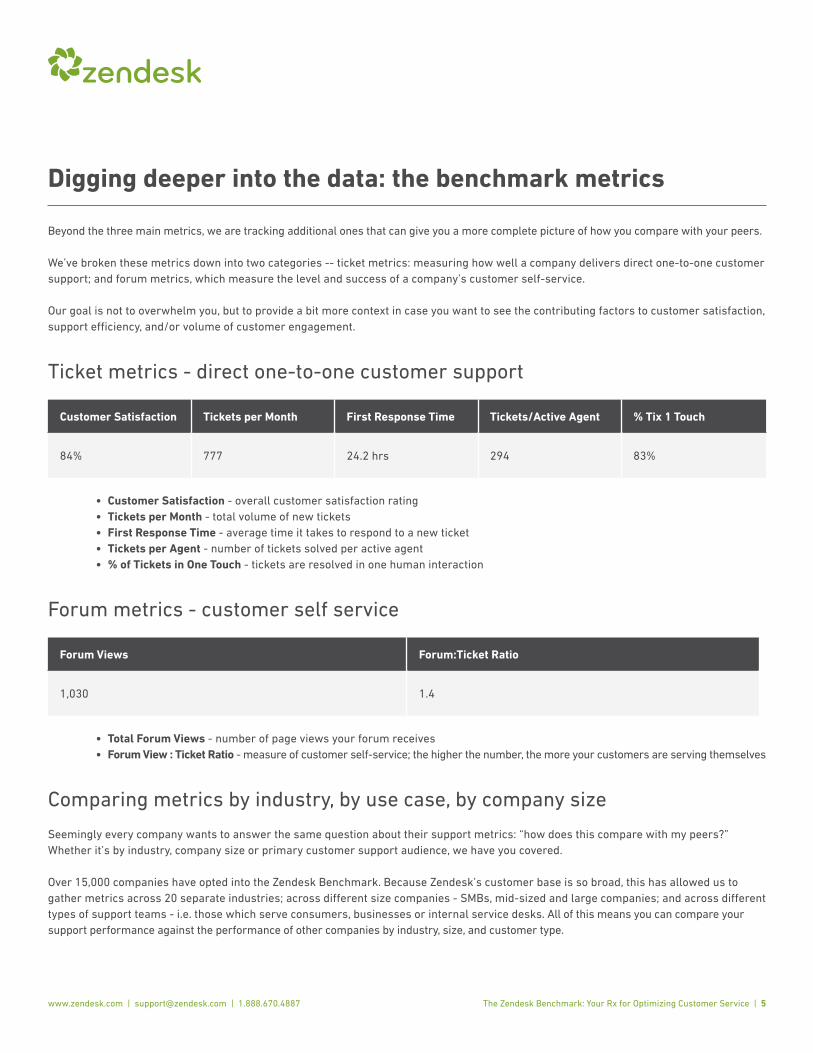
Ticket metrics - direct one-to-one customer support
Customer Satisfaction Tickets per Month First Response Time Tickets/Active Agent % Tix 1 Touch
84% 777 24.2 hrs 294 83%
• CustomerSatisfaction - overall customer satisfaction rating • TicketsperMonth - total volume of new tickets • FirstResponseTime - average time it takes to respond to a new ticket • TicketsperAgent - number of tickets solved per active agent • %ofTicketsinOneTouch - tickets are resolved in one human interaction
Forum metrics - customer self service
Forum Views Forum:Ticket Ratio
1,030 1.4
• TotalForumViews - number of page views your forum receives • ForumView:TicketRatio - measure of customer self-service; the higher the number, the more your customers are serving themselves
Comparing metrics by industry, by use case, by company size
Seemingly every company wants to answer the same question about their support metrics: “how does this compare with my peers?” Whether it’s by industry, company size or primary customer support audience, we have you covered.
Over 15,000 companies have opted into the Zendesk Benchmark. Because Zendesk’s customer base is so broad, this has allowed us to gather metrics across 20 separate industries; across different size companies - SMBs, mid-sized and large companies; and across different types of support teams - i.e. those which serve consumers, businesses or internal service desks. All of this means you can compare your support performance against the performance of other companies by industry, size, and customer type.
www.zendesk.com | [email protected] | 1.888.670.4887 The Zendesk Benchmark: Your Rx for Optimizing Customer Service | 6
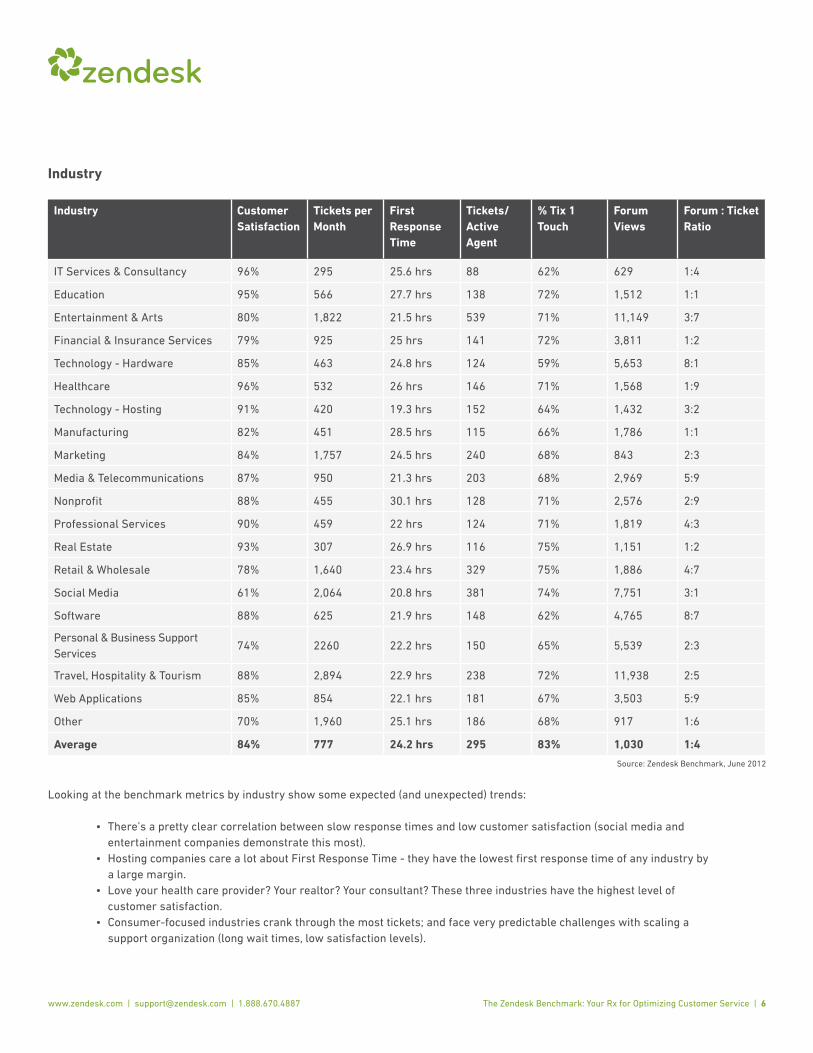
Industry
Industry Customer Satisfaction
Tickets per Month
First Response Time
Tickets/Active Agent
% Tix 1 Touch
Forum Views
Forum : Ticket Ratio
IT Services & Consultancy 96% 295 25.6 hrs 88 62% 629 1:4
Education 95% 566 27.7 hrs 138 72% 1,512 1:1
Entertainment & Arts 80% 1,822 21.5 hrs 539 71% 11,149 3:7
Financial & Insurance Services 79% 925 25 hrs 141 72% 3,811 1:2
Technology - Hardware 85% 463 24.8 hrs 124 59% 5,653 8:1
Healthcare 96% 532 26 hrs 146 71% 1,568 1:9
Technology - Hosting 91% 420 19.3 hrs 152 64% 1,432 3:2
Manufacturing 82% 451 28.5 hrs 115 66% 1,786 1:1
Marketing 84% 1,757 24.5 hrs 240 68% 843 2:3
Media & Telecommunications 87% 950 21.3 hrs 203 68% 2,969 5:9
Nonprofit 88% 455 30.1 hrs 128 71% 2,576 2:9
Professional Services 90% 459 22 hrs 124 71% 1,819 4:3
Real Estate 93% 307 26.9 hrs 116 75% 1,151 1:2
Retail & Wholesale 78% 1,640 23.4 hrs 329 75% 1,886 4:7
Social Media 61% 2,064 20.8 hrs 381 74% 7,751 3:1
Software 88% 625 21.9 hrs 148 62% 4,765 8:7
Personal & Business Support Services
74% 2260 22.2 hrs 150 65% 5,539 2:3
Travel, Hospitality & Tourism 88% 2,894 22.9 hrs 238 72% 11,938 2:5
Web Applications 85% 854 22.1 hrs 181 67% 3,503 5:9
Other 70% 1,960 25.1 hrs 186 68% 917 1:6
Average 84% 777 24.2 hrs 295 83% 1,030 1:4
Source: Zendesk Benchmark, June 2012
Looking at the benchmark metrics by industry show some expected (and unexpected) trends:
• There’saprettyclearcorrelationbetweenslowresponsetimesandlowcustomersatisfaction(socialmediaand entertainment companies demonstrate this most). • HostingcompaniescarealotaboutFirstResponseTime-theyhavethelowestfirstresponsetimeofanyindustryby a large margin. • Loveyourhealthcareprovider?Yourrealtor?Yourconsultant?Thesethreeindustrieshavethehighestlevelof customer satisfaction. • Consumer-focusedindustriescrankthroughthemosttickets;andfaceverypredictablechallengeswithscalinga support organization (long wait times, low satisfaction levels).
www.zendesk.com | [email protected] | 1.888.670.4887 The Zendesk Benchmark: Your Rx for Optimizing Customer Service | 7
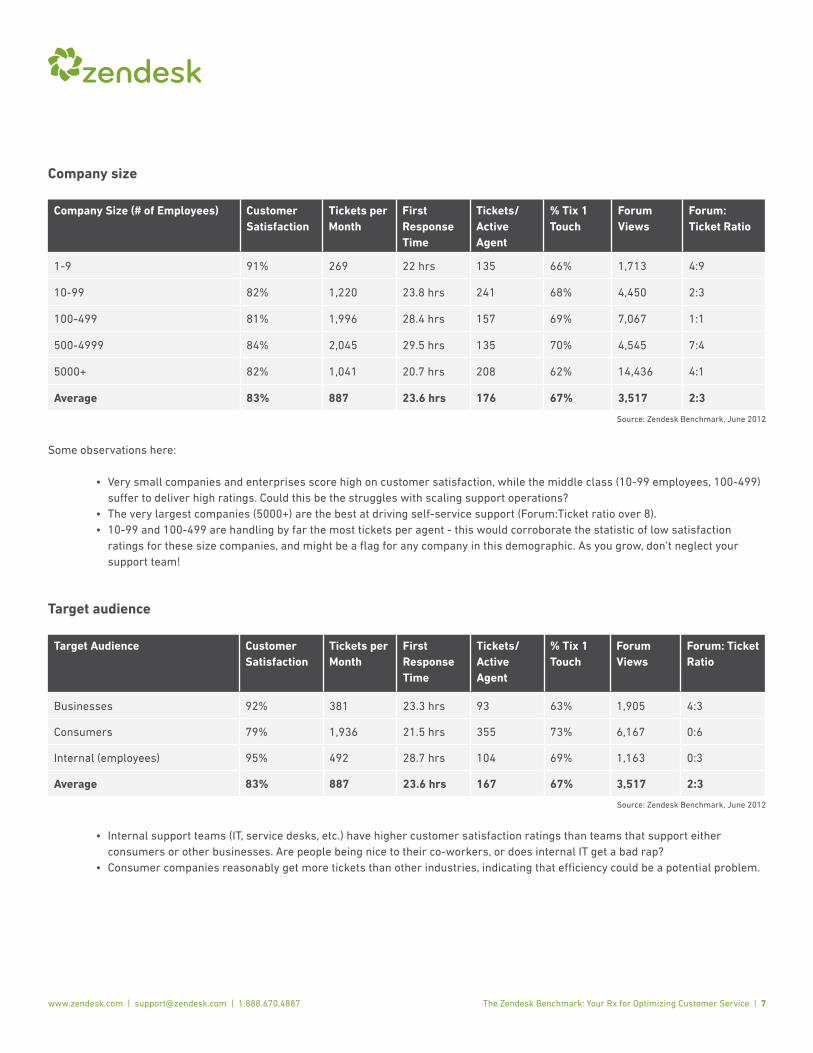
Company size
Company Size (# of Employees) Customer Satisfaction
Tickets per Month
First Response Time
Tickets/Active Agent
% Tix 1 Touch
Forum Views
Forum: Ticket Ratio
1-9 91% 269 22 hrs 135 66% 1,713 4:9
10-99 82% 1,220 23.8 hrs 241 68% 4,450 2:3
100-499 81% 1,996 28.4 hrs 157 69% 7,067 1:1
500-4999 84% 2,045 29.5 hrs 135 70% 4,545 7:4
5000+ 82% 1,041 20.7 hrs 208 62% 14,436 4:1
Average 83% 887 23.6 hrs 176 67% 3,517 2:3
Source: Zendesk Benchmark, June 2012
Some observations here:
• Verysmallcompaniesandenterprisesscorehighoncustomersatisfaction,whilethemiddleclass(10-99employees,100-499) suffer to deliver high ratings. Could this be the struggles with scaling support operations? • Theverylargestcompanies(5000+)arethebestatdrivingself-servicesupport(Forum:Ticketratioover8). • 10-99and100-499arehandlingbyfarthemostticketsperagent-thiswouldcorroboratethestatisticoflowsatisfaction ratings for these size companies, and might be a flag for any company in this demographic. As you grow, don’t neglect your support team!
Target audience
Target Audience Customer Satisfaction
Tickets per Month
First Response Time
Tickets/Active Agent
% Tix 1 Touch
Forum Views
Forum: Ticket Ratio
Businesses 92% 381 23.3 hrs 93 63% 1,905 4:3
Consumers 79% 1,936 21.5 hrs 355 73% 6,167 0:6
Internal (employees) 95% 492 28.7 hrs 104 69% 1,163 0:3
Average 83% 887 23.6 hrs 167 67% 3,517 2:3
Source: Zendesk Benchmark, June 2012
• Internalsupportteams(IT,servicedesks,etc.)havehighercustomersatisfactionratingsthanteamsthatsupporteither consumers or other businesses. Are people being nice to their co-workers, or does internal IT get a bad rap? • Consumercompaniesreasonablygetmoreticketsthanotherindustries,indicatingthatefficiencycouldbeapotentialproblem.
www.zendesk.com | [email protected] | 1.888.670.4887 The Zendesk Benchmark: Your Rx for Optimizing Customer Service | 8
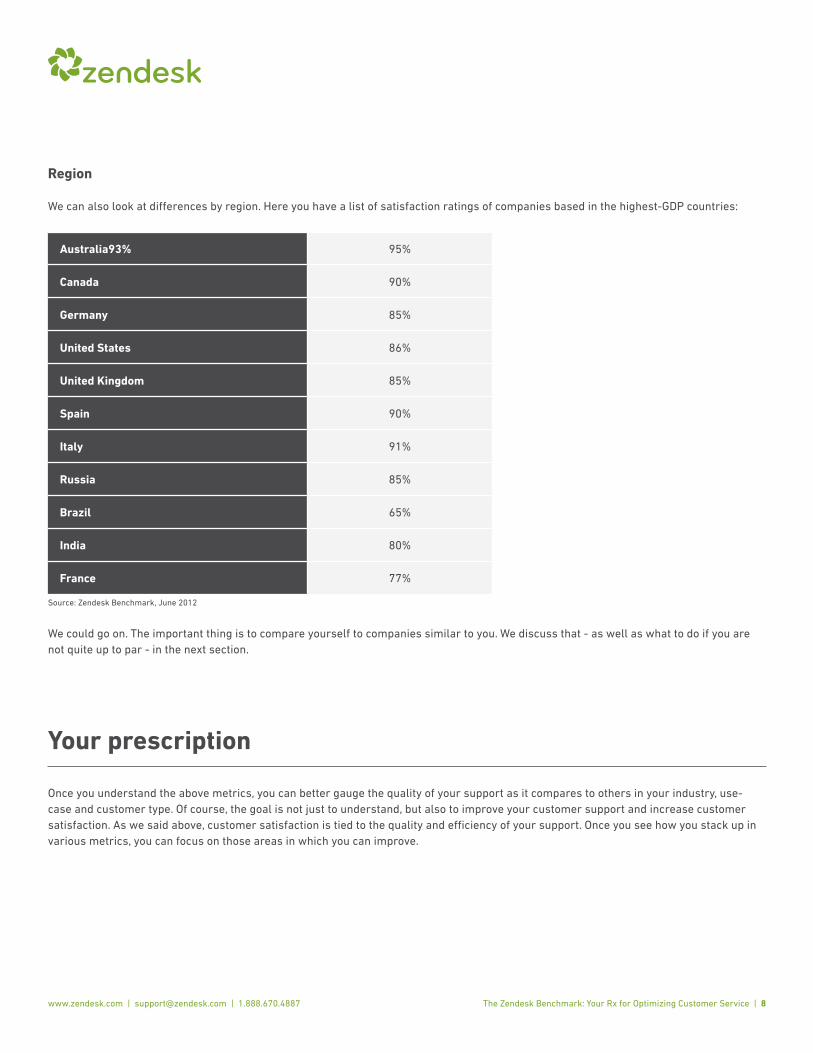
Region
We can also look at differences by region. Here you have a list of satisfaction ratings of companies based in the highest-GDP countries:
Australia93% 95%
Canada 90%
Germany 85%
United States 86%
United Kingdom 85%
Spain 90%
Italy 91%
Russia 85%
Brazil 65%
India 80%
France 77%
Source: Zendesk Benchmark, June 2012
We could go on. The important thing is to compare yourself to companies similar to you. We discuss that - as well as what to do if you are not quite up to par - in the next section.
Your prescription
Once you understand the above metrics, you can better gauge the quality of your support as it compares to others in your industry, use-case and customer type. Of course, the goal is not just to understand, but also to improve your customer support and increase customer satisfaction. As we said above, customer satisfaction is tied to the quality and efficiency of your support. Once you see how you stack up in various metrics, you can focus on those areas in which you can improve.
www.zendesk.com | [email protected] | 1.888.670.4887 The Zendesk Benchmark: Your Rx for Optimizing Customer Service | 9
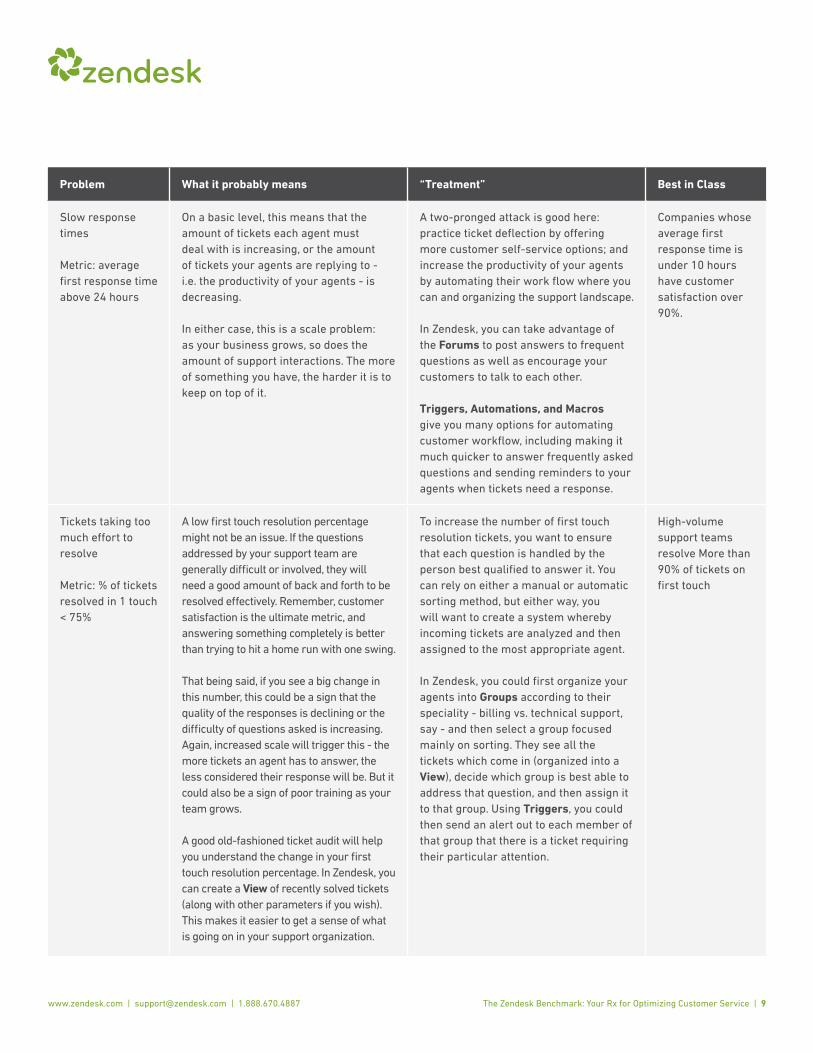
Problem What it probably means “Treatment” Best in Class
Slow response times
Metric: average first response time above 24 hours
On a basic level, this means that the amount of tickets each agent must deal with is increasing, or the amount of tickets your agents are replying to - i.e. the productivity of your agents - is decreasing.
In either case, this is a scale problem: as your business grows, so does the amount of support interactions. The more of something you have, the harder it is to keep on top of it.
A two-pronged attack is good here: practice ticket deflection by offering more customer self-service options; and increase the productivity of your agents by automating their work flow where you can and organizing the support landscape.
In Zendesk, you can take advantage of the Forums to post answers to frequent questions as well as encourage your customers to talk to each other.
Triggers, Automations, and Macros give you many options for automating customer workflow, including making it much quicker to answer frequently asked questions and sending reminders to your agents when tickets need a response.
Companies whose average first response time is under 10 hours have customer satisfaction over 90%.
Tickets taking too much effort to resolve
Metric: % of tickets resolved in 1 touch < 75%
A low first touch resolution percentage might not be an issue. If the questions addressed by your support team are generally difficult or involved, they will need a good amount of back and forth to be resolved effectively. Remember, customer satisfaction is the ultimate metric, and answering something completely is better than trying to hit a home run with one swing.
That being said, if you see a big change in this number, this could be a sign that the quality of the responses is declining or the difficulty of questions asked is increasing. Again, increased scale will trigger this - the more tickets an agent has to answer, the less considered their response will be. But it could also be a sign of poor training as your team grows.
A good old-fashioned ticket audit will help you understand the change in your first touch resolution percentage. In Zendesk, you can create a View of recently solved tickets (along with other parameters if you wish). This makes it easier to get a sense of what is going on in your support organization.
To increase the number of first touch resolution tickets, you want to ensure that each question is handled by the person best qualified to answer it. You can rely on either a manual or automatic sorting method, but either way, you will want to create a system whereby incoming tickets are analyzed and then assigned to the most appropriate agent.
In Zendesk, you could first organize your agents into Groups according to their speciality - billing vs. technical support, say - and then select a group focused mainly on sorting. They see all the tickets which come in (organized into a View), decide which group is best able to address that question, and then assign it to that group. Using Triggers, you could then send an alert out to each member of that group that there is a ticket requiring their particular attention.
High-volume support teams resolve More than 90% of tickets on first touch
www.zendesk.com | [email protected] | 1.888.670.4887 The Zendesk Benchmark: Your Rx for Optimizing Customer Service | 10
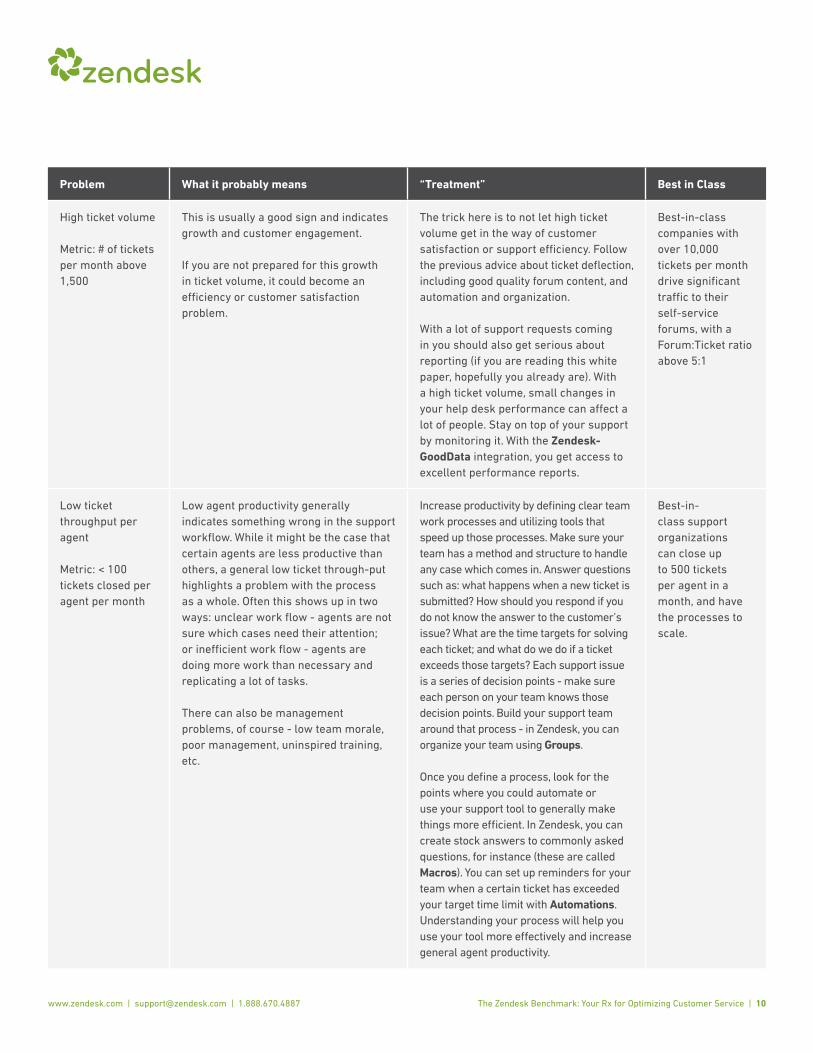
Problem What it probably means “Treatment” Best in Class
High ticket volume
Metric: # of tickets per month above 1,500
This is usually a good sign and indicates growth and customer engagement.
If you are not prepared for this growth in ticket volume, it could become an efficiency or customer satisfaction problem.
The trick here is to not let high ticket volume get in the way of customer satisfaction or support efficiency. Follow the previous advice about ticket deflection, including good quality forum content, and automation and organization.
With a lot of support requests coming in you should also get serious about reporting (if you are reading this white paper, hopefully you already are). With a high ticket volume, small changes in your help desk performance can affect a lot of people. Stay on top of your support by monitoring it. With the Zendesk-GoodData integration, you get access to excellent performance reports.
Best-in-class companies with over 10,000 tickets per month drive significant traffic to their self-service forums, with a Forum:Ticket ratio above 5:1
Low ticket throughput per agent
Metric: < 100 tickets closed per agent per month
Low agent productivity generally indicates something wrong in the support workflow. While it might be the case that certain agents are less productive than others, a general low ticket through-put highlights a problem with the process as a whole. Often this shows up in two ways: unclear work flow - agents are not sure which cases need their attention; or inefficient work flow - agents are doing more work than necessary and replicating a lot of tasks.
There can also be management problems, of course - low team morale, poor management, uninspired training, etc.
Increase productivity by defining clear team work processes and utilizing tools that speed up those processes. Make sure your team has a method and structure to handle any case which comes in. Answer questions such as: what happens when a new ticket is submitted? How should you respond if you do not know the answer to the customer’s issue? What are the time targets for solving each ticket; and what do we do if a ticket exceeds those targets? Each support issue is a series of decision points - make sure each person on your team knows those decision points. Build your support team around that process - in Zendesk, you can organize your team using Groups.
Once you define a process, look for the points where you could automate or use your support tool to generally make things more efficient. In Zendesk, you can create stock answers to commonly asked questions, for instance (these are called Macros). You can set up reminders for your team when a certain ticket has exceeded your target time limit with Automations. Understanding your process will help you use your tool more effectively and increase general agent productivity.
Best-in-class support organizations can close up to 500 tickets per agent in a month, and have the processes to scale.

www.zendesk.com | [email protected] | 1.888.670.4887 The Zendesk Benchmark: Your Rx for Optimizing Customer Service | 11
Problem What it probably means “Treatment” Best in Class
Low forum activity
Metric: Forum traffic below 1,000 views/month
or
< 1:1 ratio of Forum Views : Tickets
Offering customer forums are like throwing a party - you want people to show up and be in a good mood. If that’s not happening, it could be for a number of reasons. First, do you have a forum set up? Is it populated with good, up-to-date content? Is that content organized in a way meaningful to your users? Can your users find it from your Web site? If the answer to any of those questions is no, it will lead to lower than normal forum activity.
Luckily, the fix here is simple, if not without effort. Forums are a “if you build it (and show people the way), they will come” scenario.
Discovery is #1 - can your customers find your forums? Is it listed on your website? Are you directing traffic there through all channels (website, feedback tab, in-product, etc.)
Content is #2 -- make sure you understand what customers want.
Forum Analytics provide an amazing way to get that information.
Self-serve content is one of the best ways to increase the efficiency of your support organization, so it pays to invest in it. Assuming you have the resources to produce good content which will answer many of your users questions, the next step is making it findable and searchable. Link to your forums directly from the top navigation of your Web site, put links to it in all your marketing material. Make your users aware they exist.
In Zendesk, you can actually serve up forum content before a user submits the question to your support agents. Install the Feedback Tab on your Web site. It gives customers the chance to ask questions straight from your Web site, but will also feed them relevant content from the forum based on their questions. Often, their questions will be answered without ever needing an agent. By placing forum content at strategic moments in the support interaction and making it easy for your customers to find, you will increase your forum activity.
Best-in-class companies can drive 50,000+ views each month to their Forums, and can achieve a Forum:Ticket ratio above 10:1, all leading to customer satisfactiion well above 90%.
www.zendesk.com | [email protected] | 1.888.670.4887 The Zendesk Benchmark: Your Rx for Optimizing Customer Service | 12
Conclusion
Your data is only as good as what you do with it. By capturing metrics on your support performance and comparing it regularly to your peers, you can learn more about where you need to improve. Tools like Zendesk, combined with the type of thinking from the above table, will help you make the improvements.
Coda: a bit about the science
Zendesk has been collecting survey data from our customers and trial users since November 2010, asking six basic demographic questions (industry, employee count, primary support segment). Over 15,000 companies have completed this survey. In addition, we collected usage data across our entire customer base for all accounts that were active during the period of October-December 2011. From these two lists, we crated a benchmark data set based on the following criteria
• companiesthatoptedintothebenchmarkserviceandfilledoutthesurvey • activeZendeskaccountswithticketsinbothOctober2011andJanuary-April2012
This criteria led to a benchmark set of over 4,400 unique companies a subset of the 20,000 total companies using Zendesk.
We made some adjustments to deliver accurate and meaningful metrics.
• heavy-userbias:weeliminatedthehighest-ticket-volumeaccountsfromthebenchmarkmetrics,astheywereoverlybiasing some of the averages • zero-usagebias:weeliminatedaccountswithnext-to-zeroticketvolume;wealsoadjustedForummetrics(averageForum views, and Searches) to account for help desks that do not active use Zendesk forums • Wecomparedaccountsthatoptedintothebenchmarkservice,totheoverallpopulationofZendeskaccounts,andfoundthe metrics to be extremely similar, which indicates a lack of participant-bias • Weusedweightedaveragesandmedianvalueswherepossibletoensureaccuracy.
Some of the metrics are tough to measure, but we chose to include them in any case.
• AverageFirstResponsetimeisadifficultmetrictoeffectivelymeasureacrossalargenumberofaccounts,especiallygiven the dynamic of business hours. Only Plus and Enterprise customers can use our business hours feature, plus business rules for closing a ticket. Full Resolution Time (which is tracked in Zendesk) was all over the map, and was not included in the benchmark. • ResponseRatesforsatisfactionratingsaveragesaround25-30%acrossmostaccounts.However,customersatisfaction ratings are used only by a portion of Zendesk’s customer base.
Zendesk plans to update the Zendesk Benchmark every quarter.