Embed Size (px)
Citation preview

The Zero-Span test-What are we measuring?
Warren BatchelorAustralian Pulp and Paper
InstituteMonash University

Topics to be covered• Fibre property measurements• Zero-span introduction• Experimental research
– Zero span strength• Effect of test variables• Intrinsic strength/testing recommendations
– Subtraction technique• Effect of test variables• Recommendations for testing
• What are we measuring?– Comparison between zero-span and single fibre data
• Other issues

Measurement of key basic fibre properties- the state of the art
• Fibre length ☺☺– Optical analysers
• Fibre wall, lumen area, width, thickness☺– Confocal microscopy– Embedding
• Fibre coarseness and fibre width☺– Optical fibre analysers
• Fibre mechanical properties– Strength, stiffness, stretch– Fibril angle variation– Cross-section dimension
variation– Fibre defects
Taken from “Paper Physics”

Fig 1. Attachment for single fibre tensile tests.
Single fibre strength measurements
• Fibre separation, drying and hornification
• Fibre damage during mounting?• Uniaxial load?• Cross-section, fibril angle measurement• Small loads and displacements• Representative? Need MANY
measurements • Tedious and difficult
Taken from Groom (1995)- leftConn (1999)- top
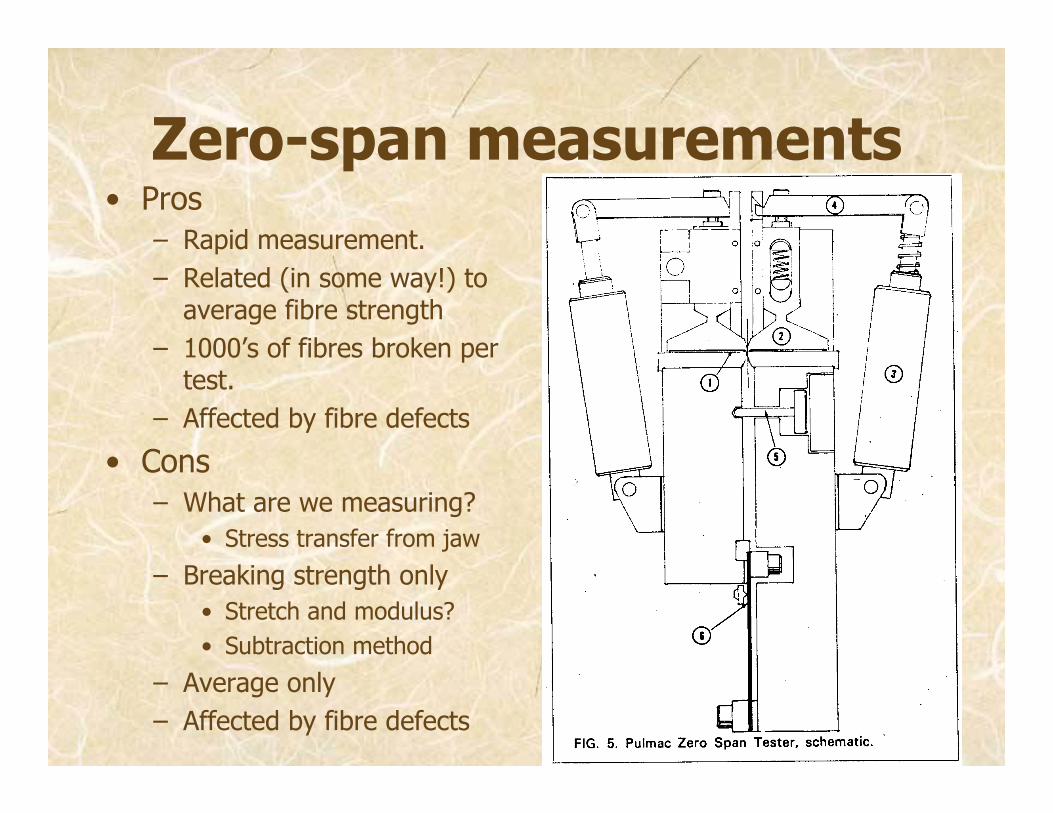
Zero-span measurements• Pros
– Rapid measurement.– Related (in some way!) to
average fibre strength– 1000’s of fibres broken per
test.– Affected by fibre defects
• Cons– What are we measuring?
• Stress transfer from jaw
– Breaking strength only• Stretch and modulus?• Subtraction method
– Average only – Affected by fibre defects

Recent research-what are we measuring?
• Two instruments measure force and displacement. – At SCA Graphic Research
• Pulmac Z span 2000– 24 tests at once- automatic feeder– Load controlled– Limited span, sample grammage– Displacement: Kaman contactless displacement
transducer– Force: from pressure transducer in instrument.
• MTS 4/ML– Special grips+ conventional tensile tester– One test at a time- much slower– Large span, grammage range

Effect of Pressure- zero span test- Pulmac tests
0
20
40
60
80
100
120
140
160
0 20 40 60 80 100 120D isp lace m en t, µm
Spec
ific
stre
ss, k
Nm
/kg
80 ps i70 ps i60 ps i50 ps i40 ps i
• Fall in zero-span strength at low pressure due to slippage under jaws
K40: SCA standard bleached kraft handsheet

Effect of grammage: zero-span load-displacement- Pulmac tests
0
50
100
150
200
0 20 40 60Displacement, µm
Spec
ific
stre
ss, k
Nm
/kg
30 gsm45 gsm60 gsm100 gsm
• Increasing grammage: large increase in displacement+ some reduction in zero-span strength
K40: SCA standard bleached kraft handsheet

0
20
40
60
80
100
120
140
160
180
200
0 100 200 300 400 500Grammage (gsm)
Z-sp
an te
nsile
inde
x (k
Nm
/kg)
K40 PulmacK40 MTSGreaseproof MDGreaseproof Ave.Greaseproof CDAluminium
Intrinsic zero-span strengthY-axis intercept= intrinsic zero-span strength

Stress transfer under jaws
Shear stressNormal stress in the loading direction

0
20
40
60
80
100
120
140
160
180
200
0 100 200 300 400 500Grammage (gsm)
Z-sp
an te
nsile
inde
x (k
Nm
/kg)
K40 PulmacK40 MTSGreaseproof MDGreaseproof Ave.Greaseproof CDAluminium
Intrinsic zero-span strengthY-axis intercept= intrinsic zero-span strength

Recommendations for zero-span testing
• High enough pressure• Y-axis intercept of strength v.
grammage= intrinsic zero-span strength• Paper: measured zero-span strength
always less than intrinsic strength– Cause: non-uniform stress field under
jaw, fibre-fibre stress transfer effects– Least accurate: high grammage, testing
in MD direction.– Most accurate: low grammage, geometric
mean of MD and CD

Recommendations for zero-span testing
• Test dry not wet– Fibre strength reduced, fibre stretch increases
with moisture- fibres pull out when wet– State of dry fibres same as sheet in use
• Fibres pull-out in test? – Wrong result- fibres haven’t broken– Can check fracture line– Bonding better– Longer fibres better
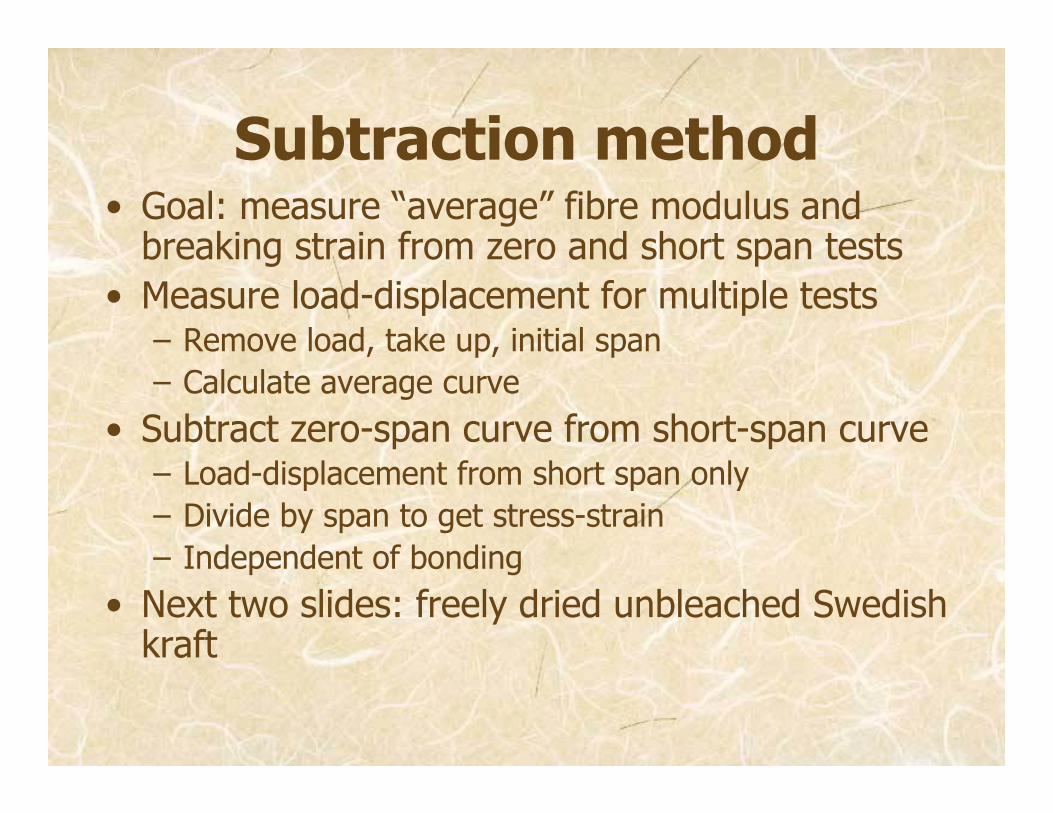
Subtraction method• Goal: measure “average” fibre modulus and
breaking strain from zero and short span tests• Measure load-displacement for multiple tests
– Remove load, take up, initial span– Calculate average curve
• Subtract zero-span curve from short-span curve– Load-displacement from short span only– Divide by span to get stress-strain– Independent of bonding
• Next two slides: freely dried unbleached Swedish kraft

Load-displacement data
020406080
100120140160180
0 20 40 60 80 100 120Displacement (mm)
Tens
ile in
dex
(kN
m/k
g)
Zero span 50 micron span101 micron span159 micron span300 micron span

Subtracted curves
020406080
100120140160180
0 10 20 30 40 50Strain (%)
Tens
ile in
dex
(kN
m/k
g)
50 micron span101 micron span159 micron span300 micron span
Subtraction most accurate: longer spans.
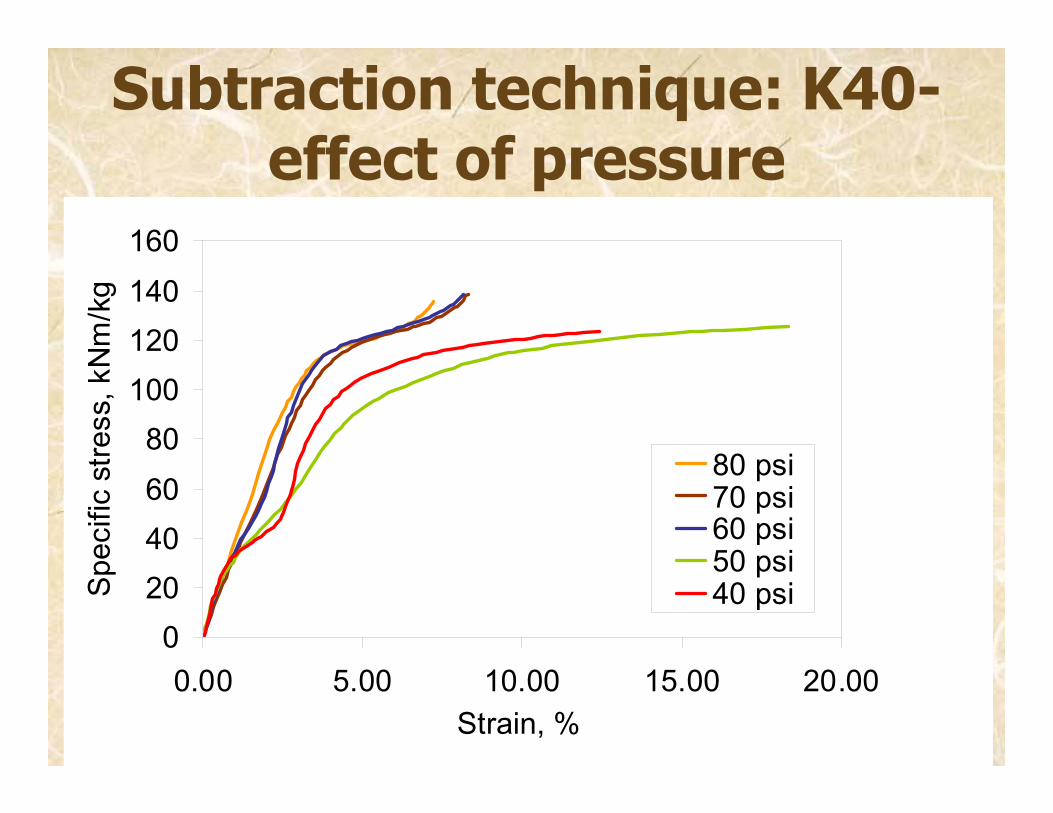
Subtraction technique: K40-effect of pressure
0204060
80100120140
160
0.00 5.00 10.00 15.00 20.00Strain, %
Spe
cific
stre
ss, k
Nm
/kg
80 psi70 psi60 psi50 psi40 psi
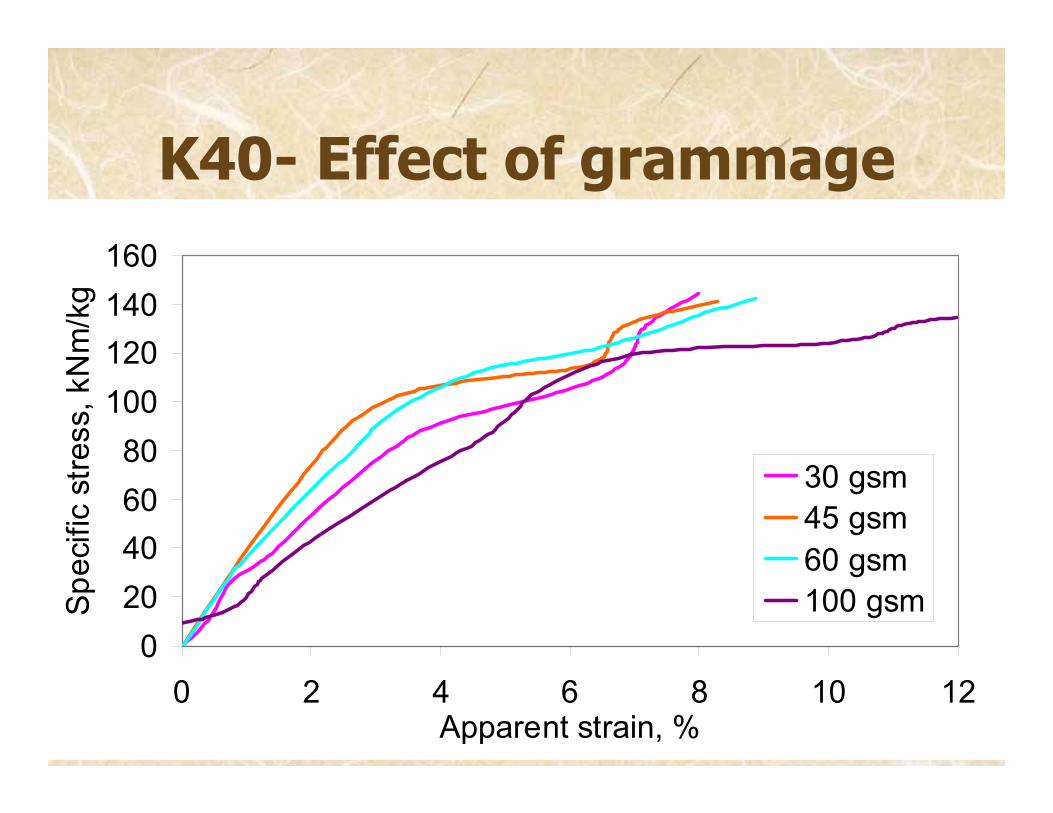
K40- Effect of grammage
020406080
100120140160
0 2 4 6 8 10 12Apparent strain, %
Spe
cific
stre
ss, k
Nm
/kg
30 gsm45 gsm60 gsm100 gsm

K40- effect of span
0
20
40
60
80
100
120
140
160
0 2 4 6 8 10 12Strain, %
Spe
cific
stre
ss, k
Nm
/kg
400100020003000200 Pulmac400 Pulmac

Comparison of zero-span with single fibre data
• Van den Akker: Z-span strength: 3/8 of strength all fibres in test direction.– Isotropic sheet
• Assume fibre density=1500 kg/m3 then
• Next slides• K40 handsheets• Compared with literature
data– Experiments by Page and
co-workers from 1970s.
4σσ
=
: Fibre breaking
stress (MPa): Zero span tensile
index (kNm/kg)
f
f
Z
Z

The data
•Zero-span tensile index: 142 kNm/kg
•Apparent elastic modulus: 3600 kNm/kg
0
20
40
60
80
100
120
140
160
0 2 4 6 8 10Strain (%)
Stre
ss (k
Nm
/kg)
K40 Isotropic 60 gsmApparent elastic modulus

Comparison of zero span strength with single fibre strength
Taken from Page et al (1972)
Measured value
Intrinsic value
True strength?

Breaking strain
• Breaking strain range quite large for same material. – Uncertainties in
subtraction technique.
– Can’t directly compare same sample for subtraction
Graph from Niskanen, editor, “Paper Physics”
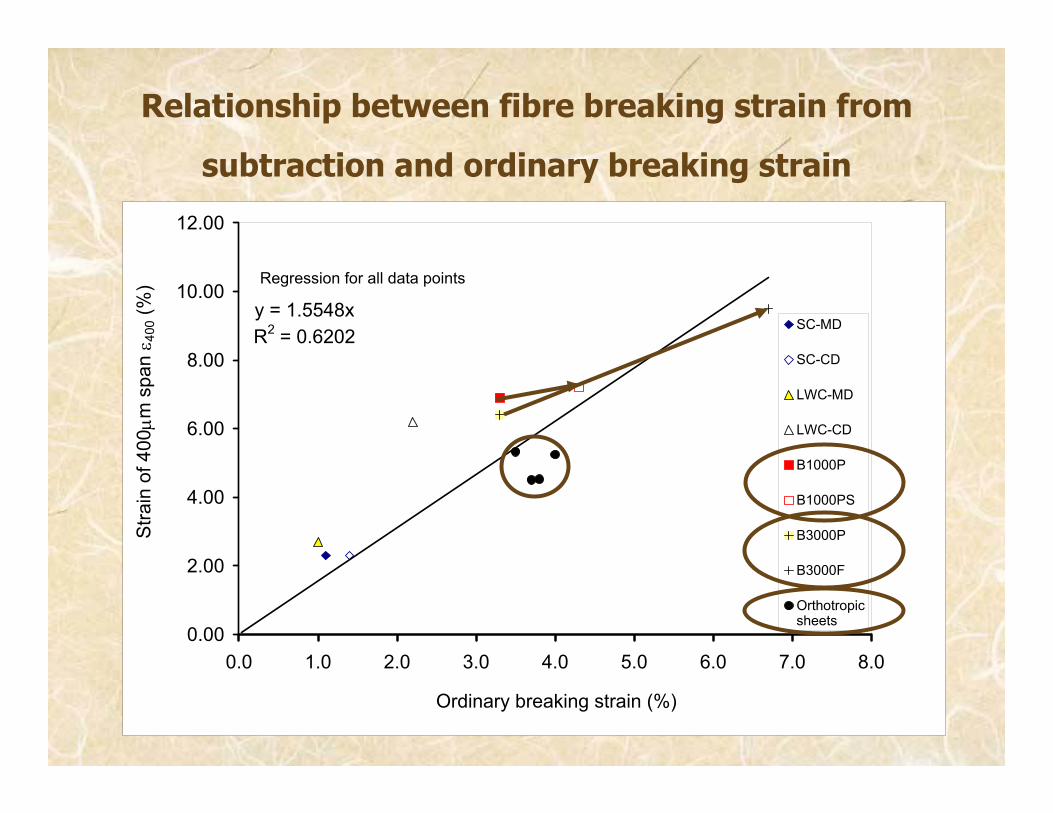
Relationship between fibre breaking strain from
subtraction and ordinary breaking strain
y = 1.5548xR2 = 0.6202
0.00
2.00
4.00
6.00
8.00
10.00
12.00
0.0 1.0 2.0 3.0 4.0 5.0 6.0 7.0 8.0
Ordinary breaking strain (%)
Stra
in o
f 400
µm s
pan ε 4
00 (%
)
SC-MD
SC-CD
LWC-MD
LWC-CD
B1000P
B1000PS
B3000P
B3000F
Orthotropicsheets
Regression for all data points

Comparison with Single fibre elastic modulus data.
• Calculated elastic modulus too low.
• Probably due to uneven stress distribution under jaws.
Taken from Niskanen, Paper Physics (1998)

Conclusions: subtraction technique and single fibre comparison
• Curve from subtraction independent of test conditions IF– High clamping pressure– Standard handsheet grammage or less– Span greater than 400µm or more is used for
subtraction• Comparisons with single fibre data
– Remember the factor of 4!– Single fibre strength: Comparable ☺– Single fibre breaking stretch: Comparable ☺– Elastic modulus: Far too low

Other issues: zero span strength distributions
0
0.02
0.04
0.06
0.08
0.1
0.12
0.14
0.16
0.18
68 72 76 80 84 88 92 96 100 104 108 112 116 120 124 128 132 136 140 144 148 152 156 160 164 168 172
Zero Span Tensile Index (kN.m/kg)
Freq
uenc
y
H1 (Avg = 117.4)U12 (Avg = 115.3)
What is the Z-strength where paper fractures?

Acknowledgements• Financial Support
– Monash University– Australian Research Council– SCA Graphic Research, Sundsvall– Bo Rydin’s Foundation for Scientific Research
• Co-workers– Bo Westerlind– Rickard Hägglund– Per Gradin– Ms. Joan Gatari– Richard Markowski– Rolf Wathen