Embed Size (px)
Citation preview
1. Introduction
Nowadays the most popular reinforcement in poly-mer composites is glass fiber, which combines highstrength and relatively good interfacial adhesion tothe polymer matrix with a low price. Recentlyincreasing attention has been paid to fibers of natu-ral origin, among them to basalt fibers [1, 2], pro-duced from volcanic basalt rock by melting. Due toits excellent reinforcing properties – both alone andin combination with other reinforcements – itspread rapidly, together with other natural fibers [3,4]. Cheap, non-continuous basalt fibers producedby the Junkers technology are brittle, which has tobe considered when producing composites formthem. Simple adaptation of processes used for ther-
moplastic or thermosetting matrix composites mayresult in a significant decrease of the average fiberlength and in the deterioration of mechanical prop-erties [5–7]. The essence of the Junkers technologyis that the basalt melt flows from the gas fired tankfurnace into a fiber-forming device with horizontalaxis, consisting of an accelerator cylinder and twofiber-forming cylinders. The fibers formed by cen-trifugal force are blown away by high pressure air.This way of fiber spinning is especially productiveand cheap, but its disadvantage is that smaller orlarger ‘heads’ remain at the end of the fibers.The aim of this publication is to analyze the influ-ence of these fiber heads formed on basalt fibersproduced by the Junkers technology, gaining popu-
109
*Corresponding author, e-mail: [email protected]© BME-PT and GTE
Theoretical and experimental study of the effect of fiberheads on the mechanical properties of non-continuous basaltfiber reinforced composites
L. M. Vas1, K. Pölöskei1, D. Felhõs2, T. Deák1, T. Czigány1,3*
1Department of Polymer Engineering, Faculty of Mechanical Engineering, Budapest University of Technology andEconomics, H-1111 Budapest, Mûegyetem rkp. 3., Hungary
2Institute of Machine Design, Faculty of Mechanical Engineering, Budapest University of Technology and Economics, H-1111 Budapest, Mûegyetem rkp. 3., Hungary
3Research Group for Metals Technology, Hungarian Academy of Sciences, H-1111 Budapest, Goldmann tér 3., Hungary
Received 27 November 2006; accepted in revised form 26 January 2007
Abstract. The effect of basalt fibers, produced by the Junkers technology and used as reinforcement in polymer compos-ites, was modeled on the properties of composites, adapting the statistical fiber mat model of Poisson type. The random dis-tribution was approximated by so-called effective spheres that act as defect sites in composites, reducing their strength. Therole of fiber heads in strength reduction and the corresponding failure modes were analyzed theoretically using a model andby experiments performed on specimens containing a single fiber head located at different distances from the crack initia-tion. The applicability of the model was proven both experimentally and by finite element analysis. Based on all theseinvestigations, the effective cross section reduction, and hence the strength reduction (predicted by the model) caused bythe presence of fiber heads was proven.
Keywords: polymer composites, basalt fiber, modeling and simulation, fiber head, finite element model
eXPRESS Polymer Letters Vol.1, No.2 (2007) 109–121Available online at www.expresspolymlett.comDOI: 10.3144/expresspolymlett.2007.19
larity as a reinforcement in polymer composites, onthe mechanical properties of composites [8, 9].
2. Materials used
For the experimental tests basalt fibers produced bythe TOPLAN Ltd. (Hungary) were used. Thematrix material used for polymer/basalt fiber com-posites (with or without fiber heads), was H 384 Fpolypropylene produced by TVK Co. (Hungary),while for the single fiber head composites R 359 PPgrade was used. The former composite sampleswere produced by melt mixing and hot pressing at200°C, while the latter ones by extrusion at 205°Cmold temperature followed by cold pressing.
3. Finite element and analytical modeling,measurement methods
The presence of fiber heads may affect the mechan-ical properties of composites in various ways. Onthe one hand they may improve toughness byanchoring the fiber, and on the other hand theyserve as defect sites and reduce the strength proper-ties. Based on our experience, the latter aspectseems to be dominant. First finite element model-ing was used to determine the characteristics of thestress zones around the fiber head, and then theconsequences of this phenomenon on the strengthproperties of composites were described by an ana-lytical model. DEN-T specimens manufacturedfrom PP and single fiber head PP sheets were usedto determine the model parameters, while the realstrength reduction caused by the fiber heads wasdetermined by tensile tests on conventional dumb-bell shape specimens. Afterwards the results calcu-lated by the model were compared to the measuredones.
3.1. Basic experiments needed for the analytical model
Tensile specimens were manufactured from thepressed composite sheets according to standardISO 527-1:1993 (E), and tensile strength was calcu-lated from the test carried out on these pieces with auniversal tensile tester of Zwick Z020 type, at atensile rate of v = 2 mm/min, as suggested by thestandard.The tensile tests of single fiber head compositeswere carried out on 20×50 mm size DEN-T speci-
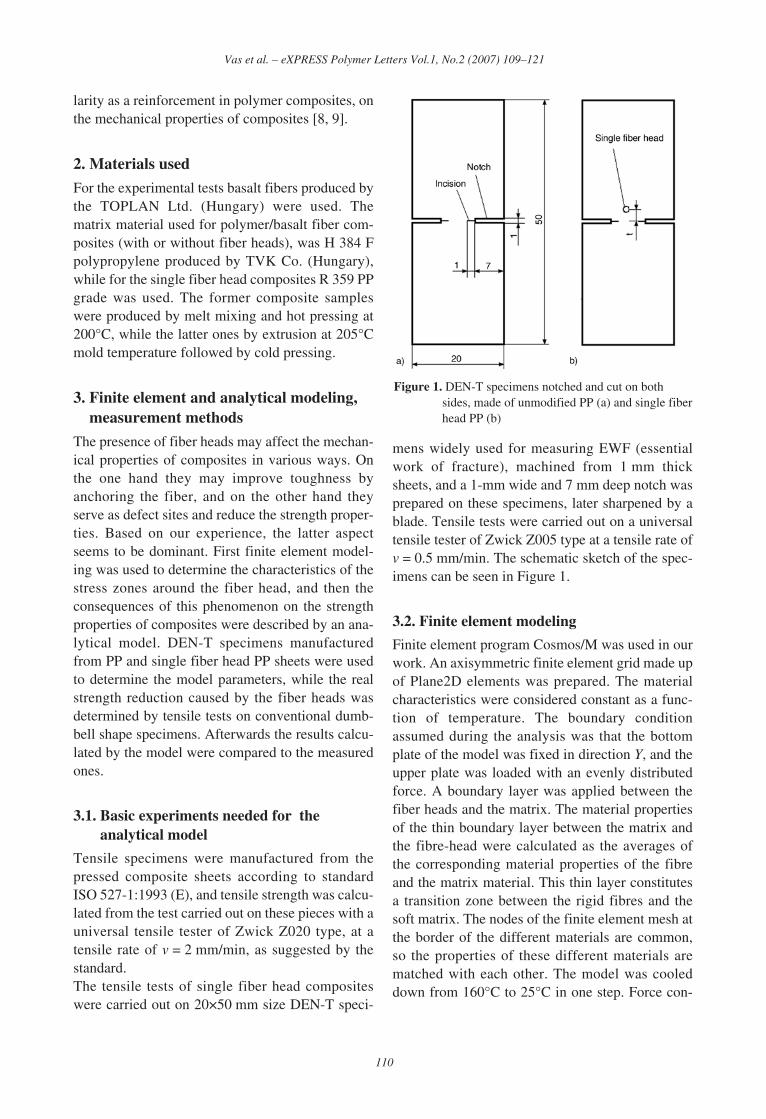
mens widely used for measuring EWF (essentialwork of fracture), machined from 1 mm thicksheets, and a 1-mm wide and 7 mm deep notch wasprepared on these specimens, later sharpened by ablade. Tensile tests were carried out on a universaltensile tester of Zwick Z005 type at a tensile rate ofv = 0.5 mm/min. The schematic sketch of the spec-imens can be seen in Figure 1.
3.2. Finite element modeling
Finite element program Cosmos/M was used in ourwork. An axisymmetric finite element grid made upof Plane2D elements was prepared. The materialcharacteristics were considered constant as a func-tion of temperature. The boundary conditionassumed during the analysis was that the bottomplate of the model was fixed in direction Y, and theupper plate was loaded with an evenly distributedforce. A boundary layer was applied between thefiber heads and the matrix. The material propertiesof the thin boundary layer between the matrix andthe fibre-head were calculated as the averages ofthe corresponding material properties of the fibreand the matrix material. This thin layer constitutesa transition zone between the rigid fibres and thesoft matrix. The nodes of the finite element mesh atthe border of the different materials are common,so the properties of these different materials arematched with each other. The model was cooleddown from 160°C to 25°C in one step. Force con-
110
Vas et al. – eXPRESS Polymer Letters Vol.1, No.2 (2007) 109–121
Figure 1. DEN-T specimens notched and cut on bothsides, made of unmodified PP (a) and single fiberhead PP (b)
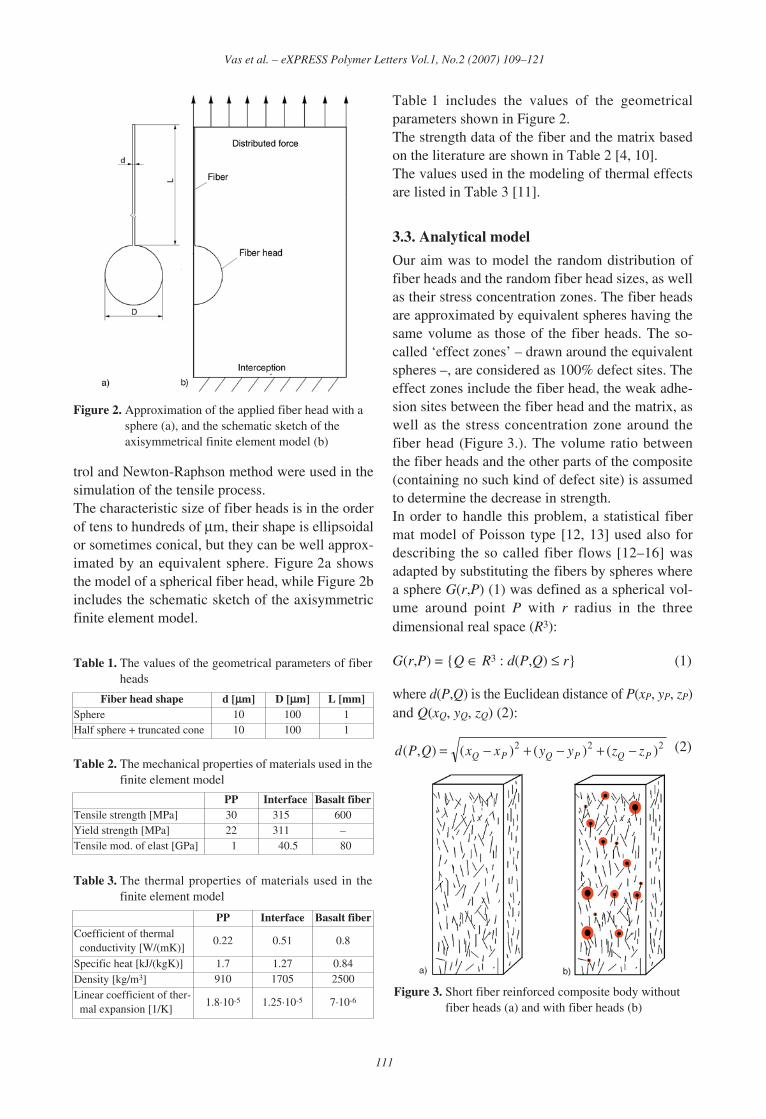
trol and Newton-Raphson method were used in thesimulation of the tensile process.The characteristic size of fiber heads is in the orderof tens to hundreds of μm, their shape is ellipsoidalor sometimes conical, but they can be well approx-imated by an equivalent sphere. Figure 2a showsthe model of a spherical fiber head, while Figure 2bincludes the schematic sketch of the axisymmetricfinite element model.
Table 1 includes the values of the geometricalparameters shown in Figure 2.The strength data of the fiber and the matrix basedon the literature are shown in Table 2 [4, 10].The values used in the modeling of thermal effectsare listed in Table 3 [11].
3.3. Analytical model
Our aim was to model the random distribution offiber heads and the random fiber head sizes, as wellas their stress concentration zones. The fiber headsare approximated by equivalent spheres having thesame volume as those of the fiber heads. The so-called ‘effect zones’ – drawn around the equivalentspheres –, are considered as 100% defect sites. Theeffect zones include the fiber head, the weak adhe-sion sites between the fiber head and the matrix, aswell as the stress concentration zone around thefiber head (Figure 3.). The volume ratio betweenthe fiber heads and the other parts of the composite(containing no such kind of defect site) is assumedto determine the decrease in strength.In order to handle this problem, a statistical fibermat model of Poisson type [12, 13] used also fordescribing the so called fiber flows [12–16] wasadapted by substituting the fibers by spheres wherea sphere G(r,P) (1) was defined as a spherical vol-ume around point P with r radius in the threedimensional real space (R3):
G(r,P) = {Q ∈ R3 : d(P,Q) ≤ r} (1)
where d(P,Q) is the Euclidean distance of P(xP, yP, zP)and Q(xQ, yQ, zQ) (2):
(2)
111
Vas et al. – eXPRESS Polymer Letters Vol.1, No.2 (2007) 109–121
Figure 2. Approximation of the applied fiber head with asphere (a), and the schematic sketch of theaxisymmetrical finite element model (b)
Table 1. The values of the geometrical parameters of fiberheads
Table 2. The mechanical properties of materials used in thefinite element model
Table 3. The thermal properties of materials used in thefinite element model
PP Interface Basalt fiberTensile strength [MPa] 30 315.0 600Yield strength [MPa] 22 311.0 –Tensile mod. of elast [GPa] 01 040.5 080
Fiber head shape d [μμm] D [μμm] L [mm]Sphere 10 100 1Half sphere + truncated cone 10 100 1
PP Interface Basalt fiberCoefficient of thermal
conductivity [W/(mK)]0.22 0.51 0.8
Specific heat [kJ/(kgK)] 1.7 1.27 0.84Density [kg/m3] 910 1705 2500
Linear coefficient of ther-mal expansion [1/K]
1.8·10-5 1.25·10-5 7·10-6Figure 3. Short fiber reinforced composite body without
fiber heads (a) and with fiber heads (b)
222 )()()(),( PQPQPQ zzyyxxQPd −+−+−=
Accordingly, the fiber heads of different shapes andV0 volume can be substituted by equivalent spheresof identical volume. The radius of this sphere, ρ0
(3) is the following:
(3)
ρ0 is a stochastic variable, the distribution functionof which is Qρ0(r), with finite expected value andstandard deviation (Eρ0 = –ρ0, Dρ0 = σρ0). The cen-tre of the equivalent sphere is point C, it can bedescribed by G0 = G(ρ0,C).The so called ‘effect zone’ around the equivalentsphere can be described by G(ρ,C) (4) (radius:ρ>ρ0), and is defined as a volume, wherein thestress is significantly larger than in the other partsof the composite. This spherical shell of thicknessre around the equivalent sphere can be expressed bya sphere of radius ρ (Figure 4).
(4)
In general the radius of the effect zone around theeffective sphere depends on the radius of the equiv-alent sphere (5):
ρ = ρ0 + re(ρ0) (5)
If simple special cases are considered, re may beconstant and independent of ρ0 or may be propor-tional to it. In the latter case their ratio can be char-acterized by a constant (αe) (6):
re = αeρ0 (6)
the resultant radius (7):
ρ = (1 + αe)ρ0 = aeρ0 (7)
where ae (8) is a constant and based on Equation (7):
ae = 1 + αe (8)
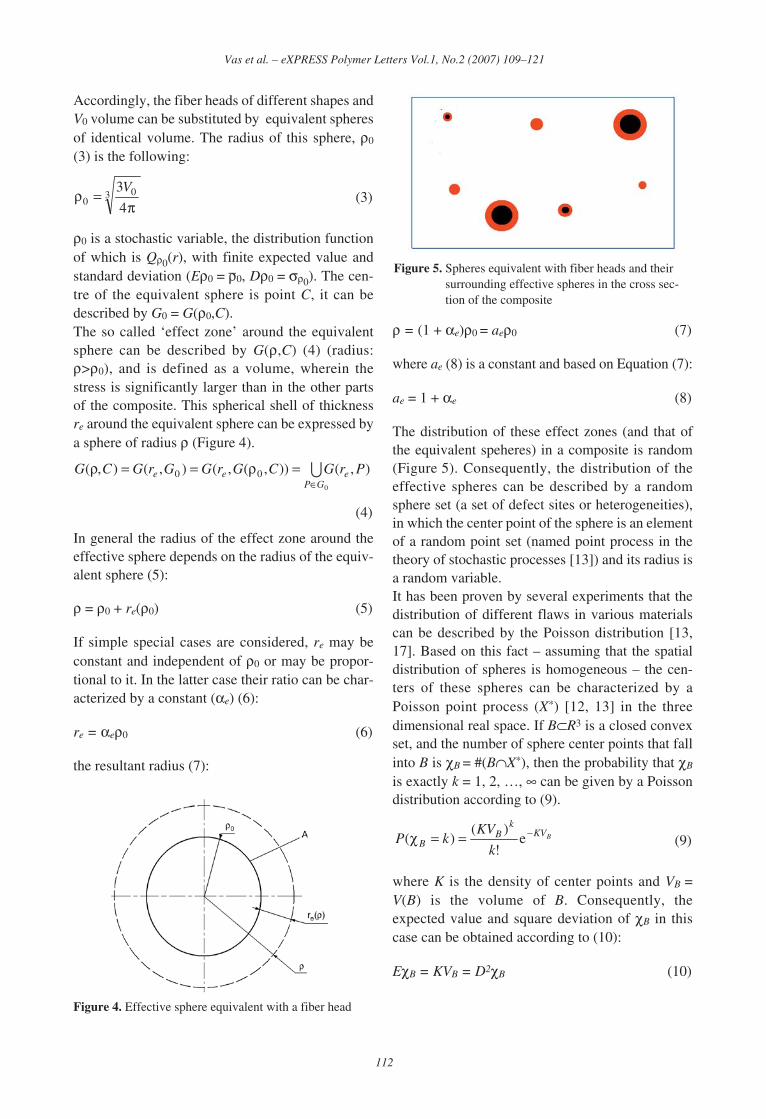
The distribution of these effect zones (and that ofthe equivalent speheres) in a composite is random(Figure 5). Consequently, the distribution of theeffective spheres can be described by a randomsphere set (a set of defect sites or heterogeneities),in which the center point of the sphere is an elementof a random point set (named point process in thetheory of stochastic processes [13]) and its radius isa random variable.It has been proven by several experiments that thedistribution of different flaws in various materialscan be described by the Poisson distribution [13,17]. Based on this fact – assuming that the spatialdistribution of spheres is homogeneous – the cen-ters of these spheres can be characterized by aPoisson point process (X*) [12, 13] in the threedimensional real space. If B⊂R3 is a closed convexset, and the number of sphere center points that fallinto B is χB = #(B∩X*), then the probability that χB
is exactly k = 1, 2, …, ∞ can be given by a Poissondistribution according to (9).
(9)
where K is the density of center points and VB =V(B) is the volume of B. Consequently, theexpected value and square deviation of χB in thiscase can be obtained according to (10):
EχB = KVB = D2χB (10)
112
Vas et al. – eXPRESS Polymer Letters Vol.1, No.2 (2007) 109–121
Figure 4. Effective sphere equivalent with a fiber head
Figure 5. Spheres equivalent with fiber heads and theirsurrounding effective spheres in the cross sec-tion of the composite
3 00 4
3
π=ρ V
U0
),()),(,(),(),( 00GP
eee PrGCGrGGrGCG∈
=ρ==ρ
BKVk
BB k
KVkP −==χ e
!
)()(
Since the size of the fiber heads is independent oftheir position, (o is a variable independent from X*
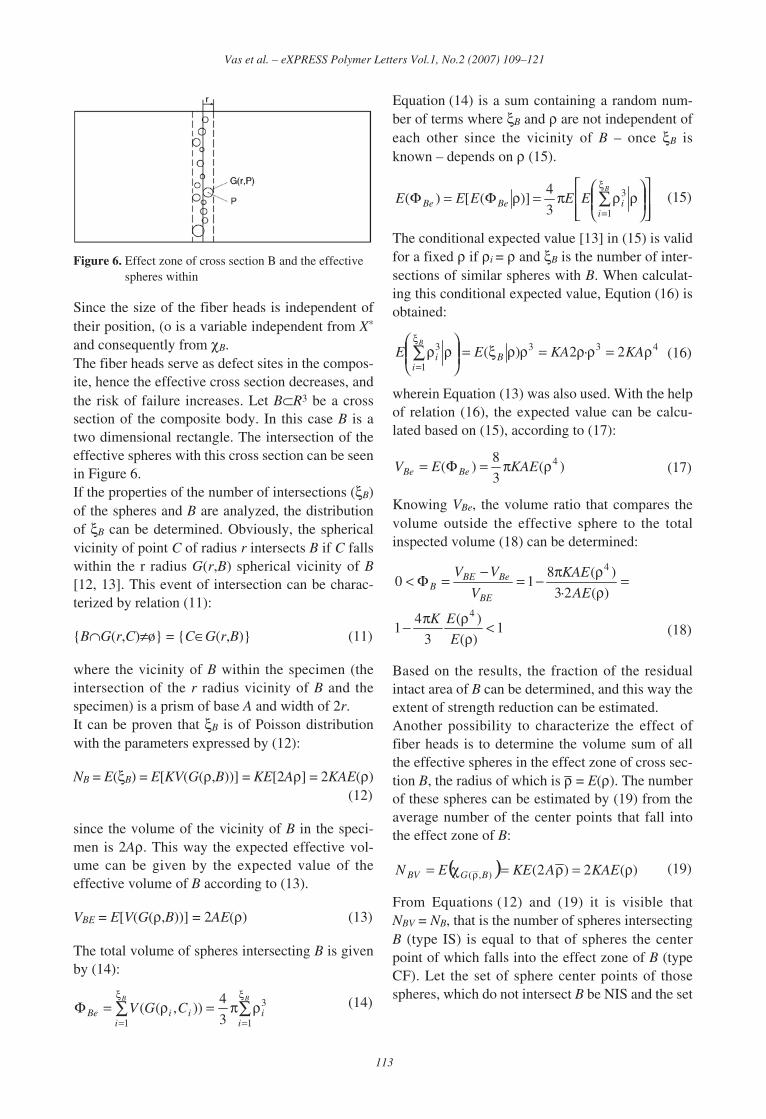
and consequently from χB.The fiber heads serve as defect sites in the compos-ite, hence the effective cross section decreases, andthe risk of failure increases. Let B⊂R3 be a crosssection of the composite body. In this case B is atwo dimensional rectangle. The intersection of theeffective spheres with this cross section can be seenin Figure 6.If the properties of the number of intersections (ξB)of the spheres and B are analyzed, the distributionof ξB can be determined. Obviously, the sphericalvicinity of point C of radius r intersects B if C fallswithin the r radius G(r,B) spherical vicinity of B[12, 13]. This event of intersection can be charac-terized by relation (11):
{B∩G(r,C)≠ø} = {C∈G(r,B)} (11)
where the vicinity of B within the specimen (theintersection of the r radius vicinity of B and thespecimen) is a prism of base A and width of 2r.It can be proven that ξB is of Poisson distributionwith the parameters expressed by (12):
NB = E(ξB) = E[KV(G(ρ,B))] = KE[2Aρ] = 2KAE(ρ)(12)
since the volume of the vicinity of B in the speci-men is 2Aρ. This way the expected effective vol-ume can be given by the expected value of theeffective volume of B according to (13).
VBE = E[V(G(ρ,B))] = 2AE(ρ) (13)
The total volume of spheres intersecting B is givenby (14):
(14)
Equation (14) is a sum containing a random num-ber of terms where ξB and ρ are not independent ofeach other since the vicinity of B – once ξB isknown – depends on ρ (15).
(15)
The conditional expected value [13] in (15) is validfor a fixed ρ if ρi = ρ and ξB is the number of inter-sections of similar spheres with B. When calculat-ing this conditional expected value, Eqution (16) isobtained:
(16)
wherein Equation (13) was also used. With the helpof relation (16), the expected value can be calcu-lated based on (15), according to (17):
(17)
Knowing VBe, the volume ratio that compares thevolume outside the effective sphere to the totalinspected volume (18) can be determined:
(18)
Based on the results, the fraction of the residualintact area of B can be determined, and this way theextent of strength reduction can be estimated.Another possibility to characterize the effect offiber heads is to determine the volume sum of allthe effective spheres in the effect zone of cross sec-tion B, the radius of which is –ρ = E(ρ). The numberof these spheres can be estimated by (19) from theaverage number of the center points that fall intothe effect zone of B:
(19)
From Equations (12) and (19) it is visible thatNBV = NB, that is the number of spheres intersectingB (type IS) is equal to that of spheres the centerpoint of which falls into the effect zone of B (typeCF). Let the set of sphere center points of thosespheres, which do not intersect B be NIS and the set
113
Vas et al. – eXPRESS Polymer Letters Vol.1, No.2 (2007) 109–121
Figure 6. Effect zone of cross section B and the effectivespheres within
∑ ∑ξ
=
ξ
=ρπ=ρ=Φ
B B
i iiiiBe CGV
1 1
3
3
4)),((
⎥⎥⎦
⎤
⎢⎢⎣
⎡⎟⎟⎠
⎞⎜⎜⎝
⎛ρρπ=ρΦ=Φ ∑
ξ
=
B
iiBeBe EEEEE
1
3
3
4)]([)(
433
1
3 2·2)( ρ=ρρ=ρρξ=⎟⎟⎠
⎞⎜⎜⎝
⎛ρρ∑
ξ
=KAKAEE B
ii
B
)(3
8)( 4ρπ=Φ= KAEEV BeBe
1)(
)(
3
41
)(2·3
)(810
4
4
<ρ
ρπ−
=ρρπ−=
−=Φ<
E
EK
AE
KAE
V
VV
BE
BeBEB
( ) )(2)2(),( ρ=ρ=χ= ρ KAEAKEEN BGBV
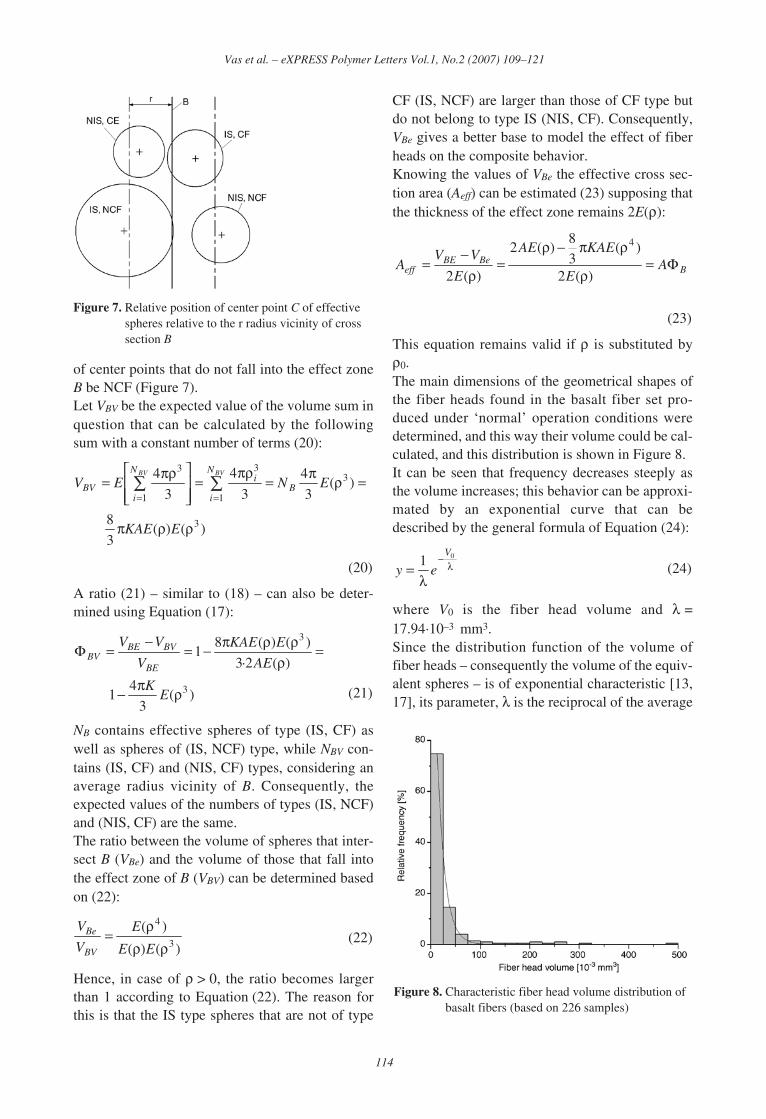
of center points that do not fall into the effect zoneB be NCF (Figure 7).Let VBV be the expected value of the volume sum inquestion that can be calculated by the followingsum with a constant number of terms (20):
(20)
A ratio (21) – similar to (18) – can also be deter-mined using Equation (17):
(21)
NB contains effective spheres of type (IS, CF) aswell as spheres of (IS, NCF) type, while NBV con-tains (IS, CF) and (NIS, CF) types, considering anaverage radius vicinity of B. Consequently, theexpected values of the numbers of types (IS, NCF)and (NIS, CF) are the same.The ratio between the volume of spheres that inter-sect B (VBe) and the volume of those that fall intothe effect zone of B (VBV) can be determined basedon (22):
(22)
Hence, in case of ρ > 0, the ratio becomes largerthan 1 according to Equation (22). The reason forthis is that the IS type spheres that are not of type
CF (IS, NCF) are larger than those of CF type butdo not belong to type IS (NIS, CF). Consequently,VBe gives a better base to model the effect of fiberheads on the composite behavior.Knowing the values of VBe the effective cross sec-tion area (Aeff) can be estimated (23) supposing thatthe thickness of the effect zone remains 2E(ρ):
(23)
This equation remains valid if ρ is substituted byρ0.The main dimensions of the geometrical shapes ofthe fiber heads found in the basalt fiber set pro-duced under ‘normal’ operation conditions weredetermined, and this way their volume could be cal-culated, and this distribution is shown in Figure 8.It can be seen that frequency decreases steeply asthe volume increases; this behavior can be approxi-mated by an exponential curve that can bedescribed by the general formula of Equation (24):
(24)
where V0 is the fiber head volume and λ =17.94·10–3 mm3.Since the distribution function of the volume offiber heads – consequently the volume of the equiv-alent spheres – is of exponential characteristic [13,17], its parameter, λ is the reciprocal of the average
114
Vas et al. – eXPRESS Polymer Letters Vol.1, No.2 (2007) 109–121
Figure 7. Relative position of center point C of effectivespheres relative to the r radius vicinity of crosssection B
Figure 8. Characteristic fiber head volume distribution ofbasalt fibers (based on 226 samples)
)()(3
8
)(3
4
3
4
3
4
3
3
1
3
1
3
ρρπ
=ρπ=πρ
=⎥⎥⎦
⎤
⎢⎢⎣
⎡ πρ= ∑∑==
EKAE
ENEV B
N
i
iN
iBV
BVBV
)(3
41
)(2·3
)()(81
3
3
ρπ−
=ρ
ρρπ−=−
=Φ
EK
AE
EKAE
V
VV
BE
BVBEBV
)()(
)(3
4
ρρρ=EE
E
V
V
BV
Be
BBeBE
eff AE
KAEAE
E
VVA Φ=
ρ
ρπ−ρ=
ρ−
=)(2
)(3
8)(2
)(2
4
λ−
λ=
01V
ey
volume of the fiber heads. Accordingly, usingEquations (3), (12) and (17) the volume of equiva-lent spheres can be calculated easily. With the helpof Equation (3), the equivalent radius (ρ0) (25) canbe calculated using the fiber head distributionfound to be exponential:
(25)
where Γ(p) is the gamma function [13, 17] (p > 0real value), the values of which in case n = 1, 3 and4 are Γ(4/3) = 0.89298, Γ(2) = 1 and Γ(7/3) =1.19069, respectively. On the basis of these results,the quantities according to Equations (17) and (21)can be rewritten in the following way ((26), (27)and (28)):
(26)
(27)
(28)
Consequently, the volume of spheres intersecting Bis 1.33 times larger than that of spheres with centersfalling within the effect zone of B. The formermethod was used in our calculations. Since ΦB0 < 1,the relation is valid if K < 3λ/4. This way the fourthmoment of the radius (ρ) of the effective spheres(29) corresponding to (25) can be calculated byEquation (5) or (7). Using Equation (5) leads to acomplicated expression:
(29)
In case of Equation (7) the result differs fromEquation (25) only in a constant factor according to(30):
(30)
Using these formulae, the volume ratios accordingto (18), (21) and (22) as well as the effective crosssection (23) can be calculated.
4. Results and discussion
4.1. Finite element results
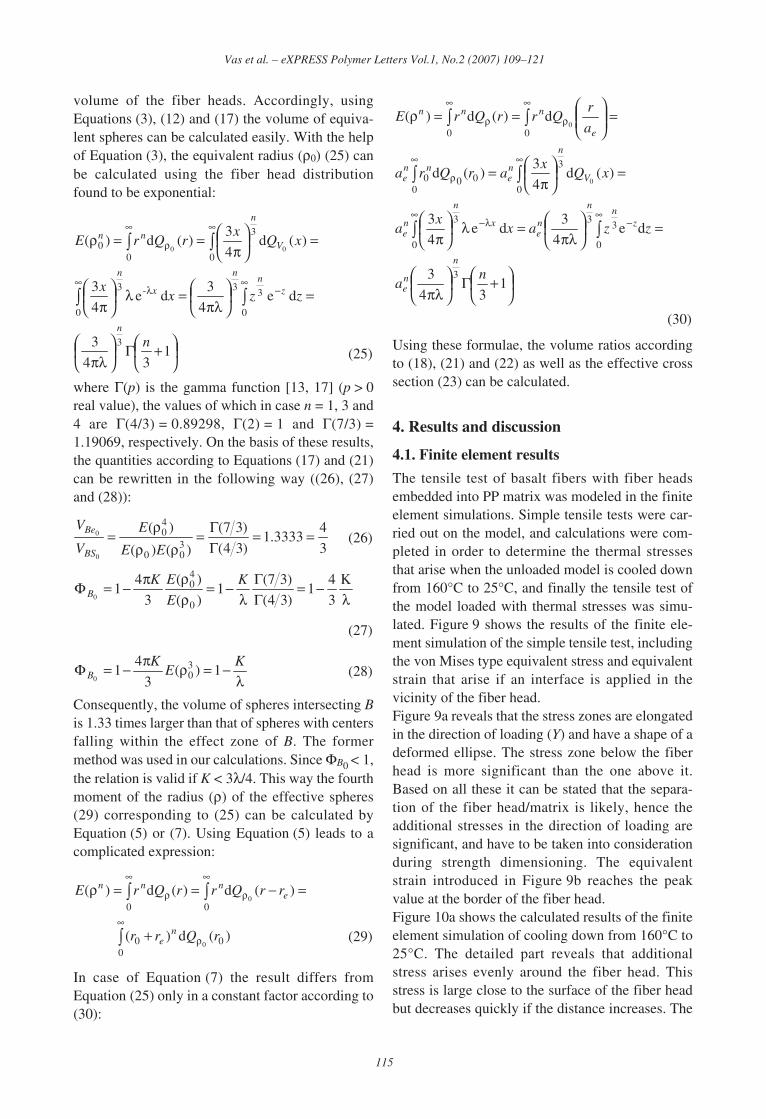
The tensile test of basalt fibers with fiber headsembedded into PP matrix was modeled in the finiteelement simulations. Simple tensile tests were car-ried out on the model, and calculations were com-pleted in order to determine the thermal stressesthat arise when the unloaded model is cooled downfrom 160°C to 25°C, and finally the tensile test ofthe model loaded with thermal stresses was simu-lated. Figure 9 shows the results of the finite ele-ment simulation of the simple tensile test, includingthe von Mises type equivalent stress and equivalentstrain that arise if an interface is applied in thevicinity of the fiber head.Figure 9a reveals that the stress zones are elongatedin the direction of loading (Y) and have a shape of adeformed ellipse. The stress zone below the fiberhead is more significant than the one above it.Based on all these it can be stated that the separa-tion of the fiber head/matrix is likely, hence theadditional stresses in the direction of loading aresignificant, and have to be taken into considerationduring strength dimensioning. The equivalentstrain introduced in Figure 9b reaches the peakvalue at the border of the fiber head.Figure 10a shows the calculated results of the finiteelement simulation of cooling down from 160°C to25°C. The detailed part reveals that additionalstress arises evenly around the fiber head. Thisstress is large close to the surface of the fiber headbut decreases quickly if the distance increases. The
115
Vas et al. – eXPRESS Polymer Letters Vol.1, No.2 (2007) 109–121
⎟⎠⎞⎜
⎝⎛ +Γ⎟
⎠⎞⎜
⎝⎛
πλ
=⎟⎠⎞⎜
⎝⎛
πλ=λ⎟
⎠⎞⎜
⎝⎛
π
=⎟⎠⎞⎜
⎝⎛
π==ρ
∫∫
∫∫
∞−
∞λ
∞∞
ρ
134
3
de4
3de
4
3
)(d4
3)(d)(
3
0
33
0
-3
0
3
00 00
n
zzxx
xQx
rQrE
n
zn
n
x
n
V
n
nn
3
43333.1
)34(
)37(
)()(
)(300
40
0
0 ==ΓΓ=
ρρρ=EE
E
V
V
BS
Be
λΚ−=
ΓΓ
λ−=
ρρπ−=Φ
3
41
)34(
)37(1
)(
)(
3
41
0
40
0
K
E
EKB
λ−=ρπ−=Φ K
EK
B 1)(3
41 3
00
∫
∫∫∞
ρ
∞
ρ
∞
ρ
+
=−==ρ
000
00
)(d)(
)(d)(d)(
0
0
rQrr
rrQrrQrE
ne
ennn
⎟⎠⎞⎜
⎝⎛ +Γ⎟
⎠⎞⎜
⎝⎛
πλ
=⎟⎠⎞⎜
⎝⎛
πλ=λ⎟
⎠⎞⎜
⎝⎛
π
=⎟⎠⎞⎜
⎝⎛
π=
=⎟⎟⎠
⎞⎜⎜⎝
⎛==ρ
∫∫
∫∫
∫∫
∞−
∞λ−
∞∞
ρ
∞
ρ
∞
ρ
134
3
de4
3de
4
3
)(d4
3)(d
d)(d)(
3
0
33
0
3
0
3
0000
00
0
0
na
zzaxx
a
xQx
arQra
a
rQrrQrE
n
ne
zn
n
ne
x
n
ne
V
n
ne
nne
e
nnn
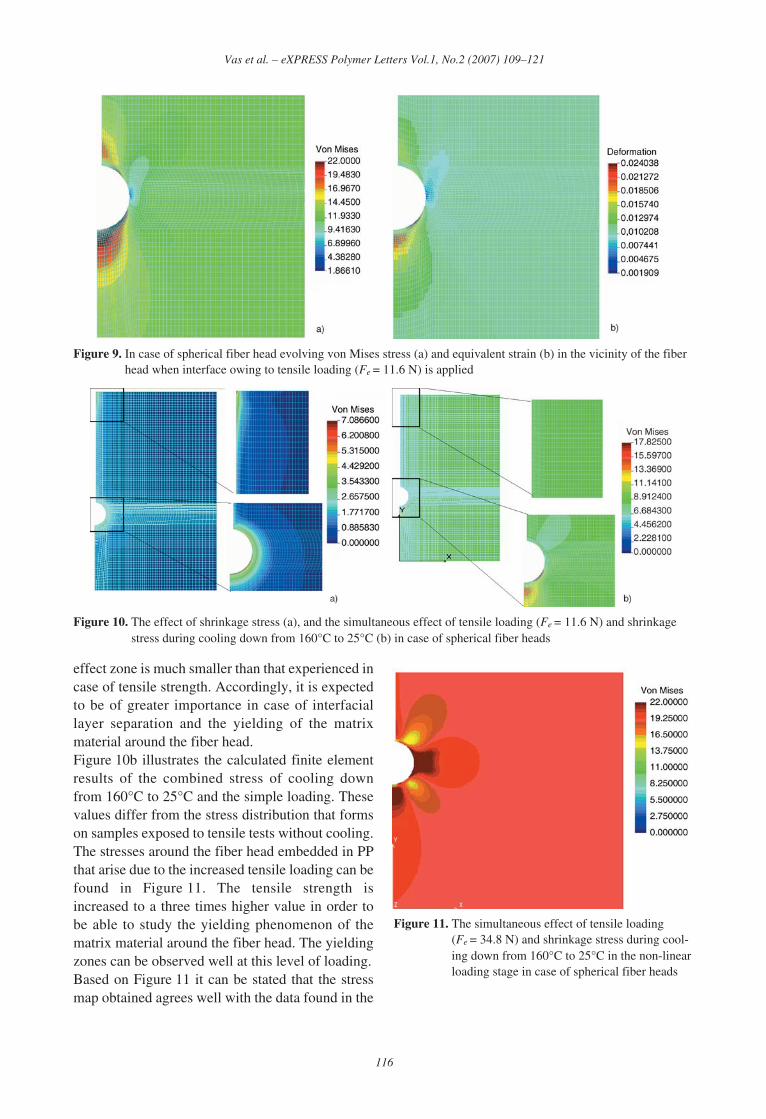
effect zone is much smaller than that experienced incase of tensile strength. Accordingly, it is expectedto be of greater importance in case of interfaciallayer separation and the yielding of the matrixmaterial around the fiber head.Figure 10b illustrates the calculated finite elementresults of the combined stress of cooling downfrom 160°C to 25°C and the simple loading. Thesevalues differ from the stress distribution that formson samples exposed to tensile tests without cooling.The stresses around the fiber head embedded in PPthat arise due to the increased tensile loading can befound in Figure 11. The tensile strength isincreased to a three times higher value in order tobe able to study the yielding phenomenon of thematrix material around the fiber head. The yieldingzones can be observed well at this level of loading.Based on Figure 11 it can be stated that the stressmap obtained agrees well with the data found in the
116
Vas et al. – eXPRESS Polymer Letters Vol.1, No.2 (2007) 109–121
Figure 10. The effect of shrinkage stress (a), and the simultaneous effect of tensile loading (Fe = 11.6 N) and shrinkagestress during cooling down from 160°C to 25°C (b) in case of spherical fiber heads
Figure 9. In case of spherical fiber head evolving von Mises stress (a) and equivalent strain (b) in the vicinity of the fiberhead when interface owing to tensile loading (Fe = 11.6 N) is applied
Figure 11. The simultaneous effect of tensile loading(Fe = 34.8 N) and shrinkage stress during cool-ing down from 160°C to 25°C in the non-linearloading stage in case of spherical fiber heads
literature [18]. Since the yield point of the matrix is22 MPa, the von Mises stress does not exceed thisvalue if loading is increased. However, the size ofyielded areas increases if loading is increased. Thislarger area characterizes the yielding zones. Thelargest yielding occurred at the meridian of thefiber head due to the changed interfacial relations,and this differs from that Figure 9 shows. The sizeof the stress concentration zone, oriented in thedirection of the fiber, decreased significantly.
4.2. Experimental determination of theparameters of the analytical model
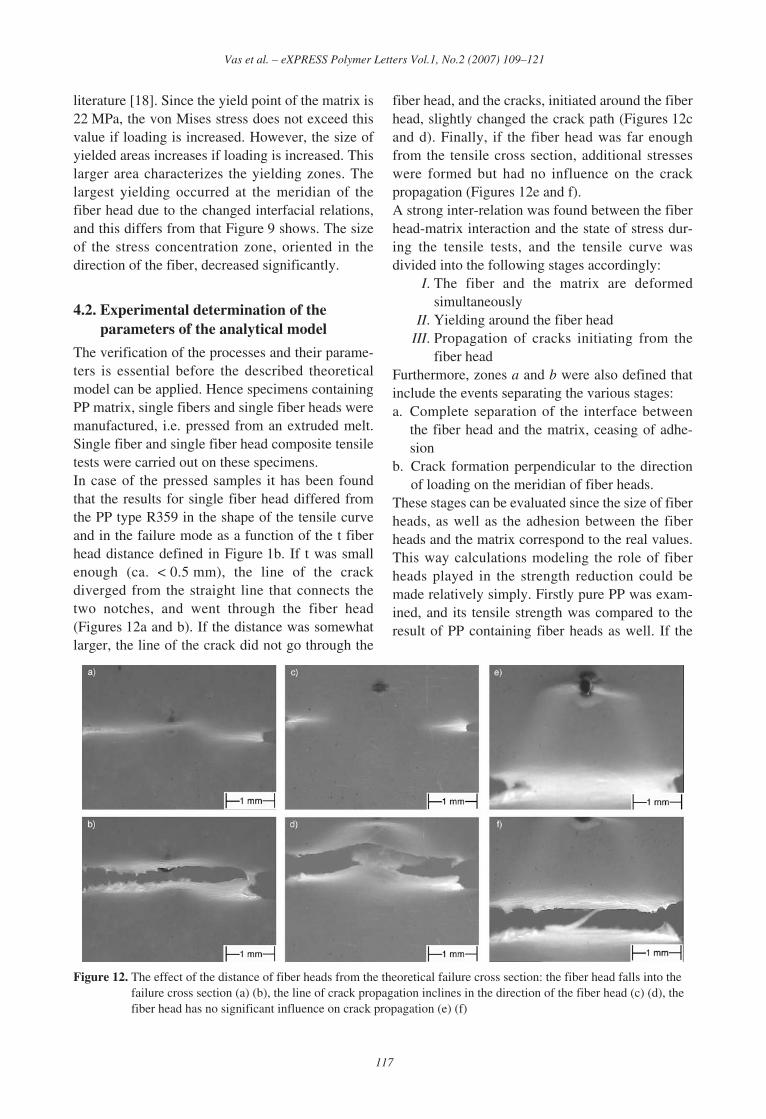
The verification of the processes and their parame-ters is essential before the described theoreticalmodel can be applied. Hence specimens containingPP matrix, single fibers and single fiber heads weremanufactured, i.e. pressed from an extruded melt.Single fiber and single fiber head composite tensiletests were carried out on these specimens.In case of the pressed samples it has been foundthat the results for single fiber head differed fromthe PP type R359 in the shape of the tensile curveand in the failure mode as a function of the t fiberhead distance defined in Figure 1b. If t was smallenough (ca. < 0.5 mm), the line of the crackdiverged from the straight line that connects thetwo notches, and went through the fiber head(Figures 12a and b). If the distance was somewhatlarger, the line of the crack did not go through the
fiber head, and the cracks, initiated around the fiberhead, slightly changed the crack path (Figures 12cand d). Finally, if the fiber head was far enoughfrom the tensile cross section, additional stresseswere formed but had no influence on the crackpropagation (Figures 12e and f).A strong inter-relation was found between the fiberhead-matrix interaction and the state of stress dur-ing the tensile tests, and the tensile curve wasdivided into the following stages accordingly:
I. The fiber and the matrix are deformedsimultaneously
II. Yielding around the fiber headIII. Propagation of cracks initiating from the
fiber headFurthermore, zones a and b were also defined thatinclude the events separating the various stages:a. Complete separation of the interface between
the fiber head and the matrix, ceasing of adhe-sion
b. Crack formation perpendicular to the directionof loading on the meridian of fiber heads.
These stages can be evaluated since the size of fiberheads, as well as the adhesion between the fiberheads and the matrix correspond to the real values.This way calculations modeling the role of fiberheads played in the strength reduction could bemade relatively simply. Firstly pure PP was exam-ined, and its tensile strength was compared to theresult of PP containing fiber heads as well. If the
117
Vas et al. – eXPRESS Polymer Letters Vol.1, No.2 (2007) 109–121
Figure 12. The effect of the distance of fiber heads from the theoretical failure cross section: the fiber head falls into thefailure cross section (a) (b), the line of crack propagation inclines in the direction of the fiber head (c) (d), thefiber head has no significant influence on crack propagation (e) (f)
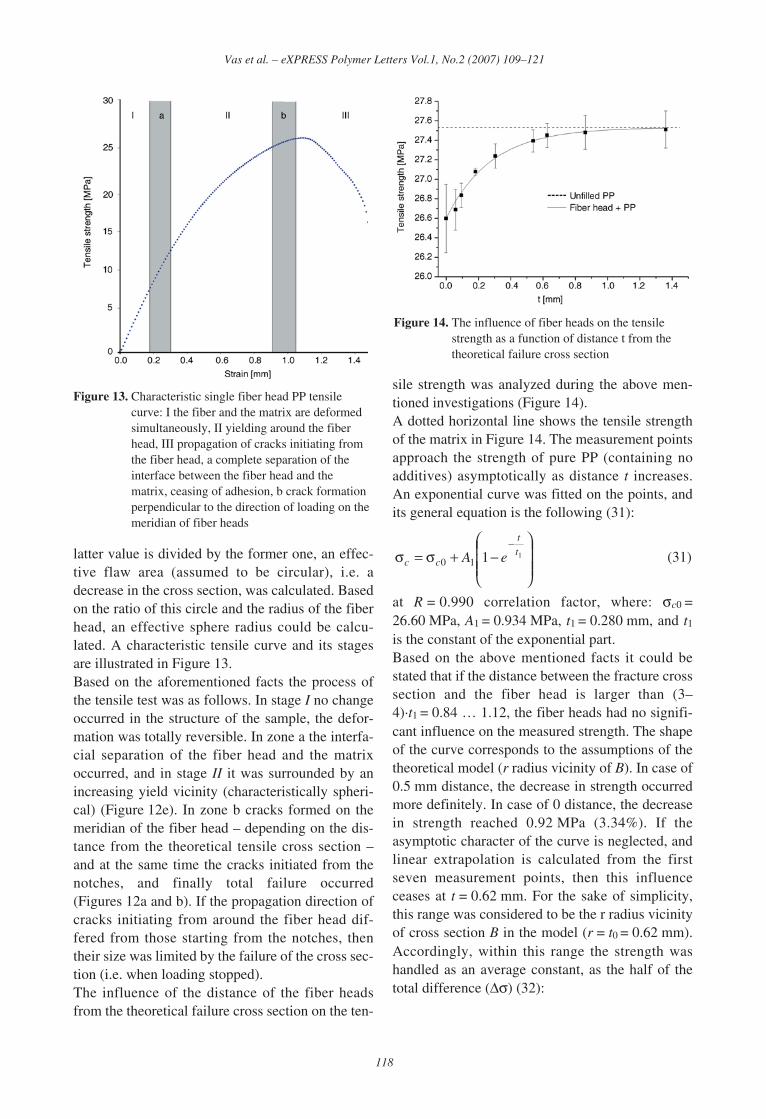
latter value is divided by the former one, an effec-tive flaw area (assumed to be circular), i.e. adecrease in the cross section, was calculated. Basedon the ratio of this circle and the radius of the fiberhead, an effective sphere radius could be calcu-lated. A characteristic tensile curve and its stagesare illustrated in Figure 13.Based on the aforementioned facts the process ofthe tensile test was as follows. In stage I no changeoccurred in the structure of the sample, the defor-mation was totally reversible. In zone a the interfa-cial separation of the fiber head and the matrixoccurred, and in stage II it was surrounded by anincreasing yield vicinity (characteristically spheri-cal) (Figure 12e). In zone b cracks formed on themeridian of the fiber head – depending on the dis-tance from the theoretical tensile cross section –and at the same time the cracks initiated from thenotches, and finally total failure occurred(Figures 12a and b). If the propagation direction ofcracks initiating from around the fiber head dif-fered from those starting from the notches, thentheir size was limited by the failure of the cross sec-tion (i.e. when loading stopped).The influence of the distance of the fiber headsfrom the theoretical failure cross section on the ten-
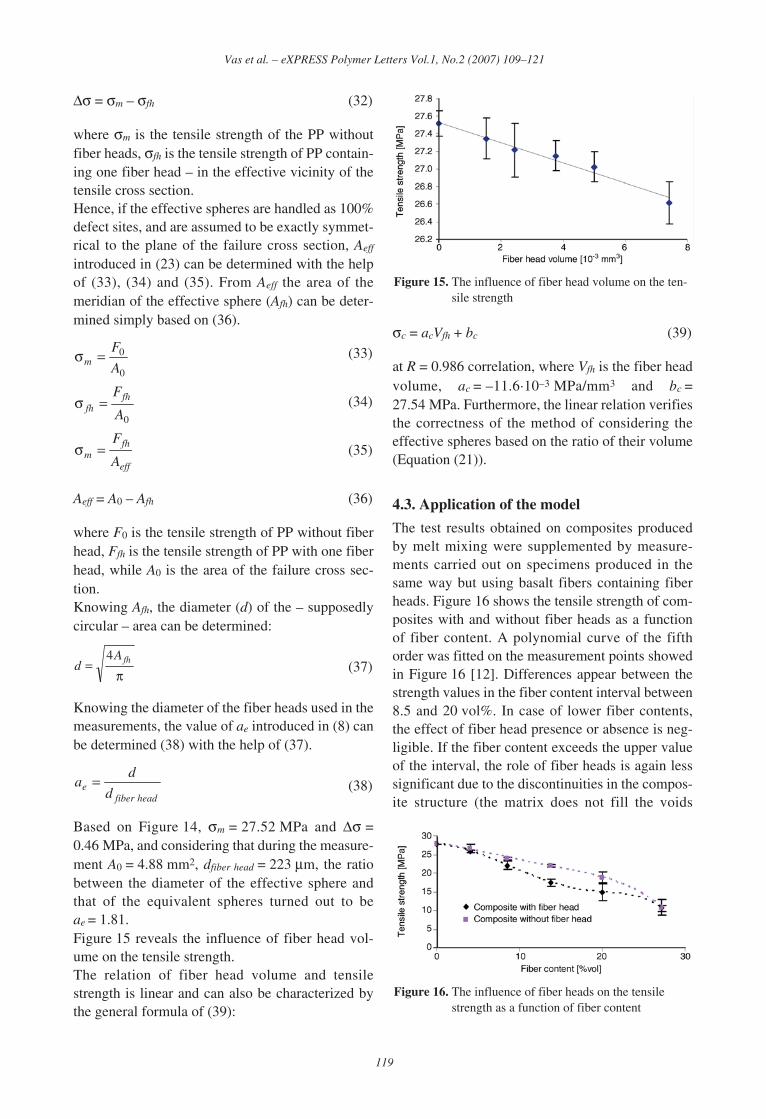
sile strength was analyzed during the above men-tioned investigations (Figure 14).A dotted horizontal line shows the tensile strengthof the matrix in Figure 14. The measurement pointsapproach the strength of pure PP (containing noadditives) asymptotically as distance t increases.An exponential curve was fitted on the points, andits general equation is the following (31):
(31)
at R = 0.990 correlation factor, where: σc0 =26.60 MPa, A1 = 0.934 MPa, t1 = 0.280 mm, and t1is the constant of the exponential part.Based on the above mentioned facts it could bestated that if the distance between the fracture crosssection and the fiber head is larger than (3–4)·t1 = 0.84 … 1.12, the fiber heads had no signifi-cant influence on the measured strength. The shapeof the curve corresponds to the assumptions of thetheoretical model (r radius vicinity of B). In case of0.5 mm distance, the decrease in strength occurredmore definitely. In case of 0 distance, the decreasein strength reached 0.92 MPa (3.34%). If theasymptotic character of the curve is neglected, andlinear extrapolation is calculated from the firstseven measurement points, then this influenceceases at t = 0.62 mm. For the sake of simplicity,this range was considered to be the r radius vicinityof cross section B in the model (r = t0 = 0.62 mm).Accordingly, within this range the strength washandled as an average constant, as the half of thetotal difference (Δσ) (32):
118
Vas et al. – eXPRESS Polymer Letters Vol.1, No.2 (2007) 109–121
Figure 14. The influence of fiber heads on the tensilestrength as a function of distance t from thetheoretical failure cross section
Figure 13. Characteristic single fiber head PP tensilecurve: I the fiber and the matrix are deformedsimultaneously, II yielding around the fiberhead, III propagation of cracks initiating fromthe fiber head, a complete separation of theinterface between the fiber head and thematrix, ceasing of adhesion, b crack formationperpendicular to the direction of loading on themeridian of fiber heads
⎟⎟⎟
⎠
⎞
⎜⎜⎜
⎝
⎛−+σ=σ
−1110
t
t
cc eA
Δσ = σm – σfh (32)
where σm is the tensile strength of the PP withoutfiber heads, σfh is the tensile strength of PP contain-ing one fiber head – in the effective vicinity of thetensile cross section.Hence, if the effective spheres are handled as 100%defect sites, and are assumed to be exactly symmet-rical to the plane of the failure cross section, Aeff
introduced in (23) can be determined with the helpof (33), (34) and (35). From Aeff the area of themeridian of the effective sphere (Afh) can be deter-mined simply based on (36).
(33)
(34)
(35)
Aeff = A0 – Afh (36)
where F0 is the tensile strength of PP without fiberhead, Ffh is the tensile strength of PP with one fiberhead, while A0 is the area of the failure cross sec-tion.Knowing Afh, the diameter (d) of the – supposedlycircular – area can be determined:
(37)
Knowing the diameter of the fiber heads used in themeasurements, the value of ae introduced in (8) canbe determined (38) with the help of (37).
(38)
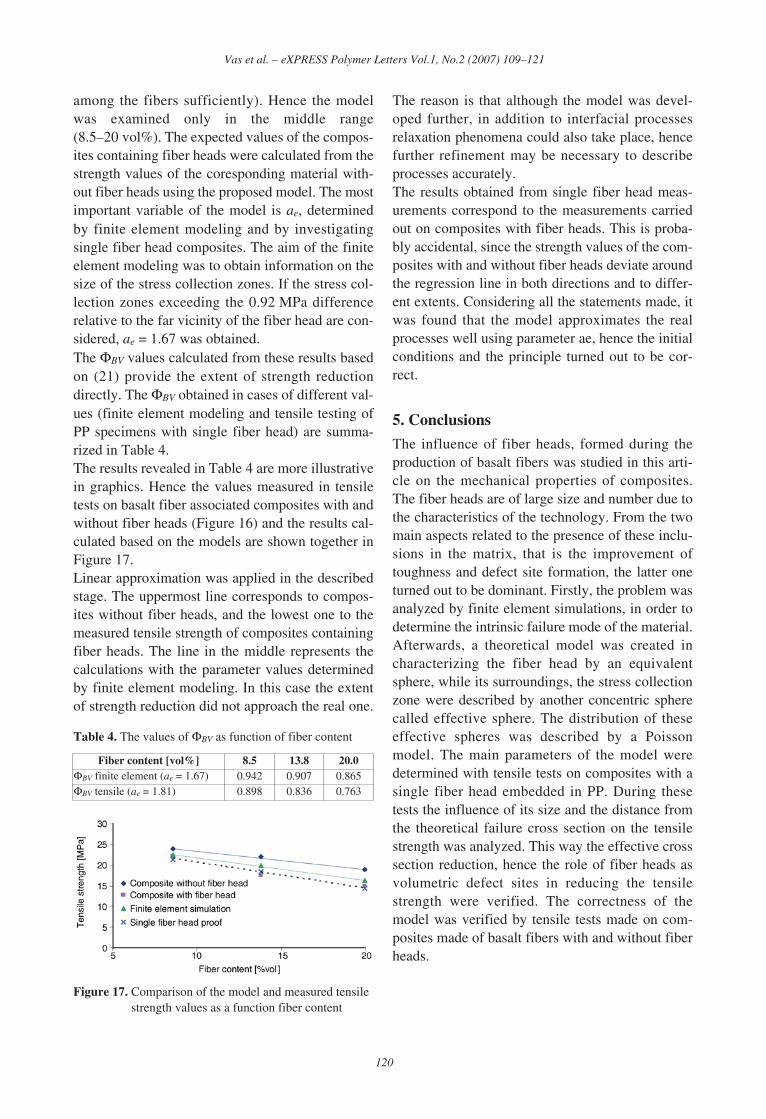
Based on Figure 14, σm = 27.52 MPa and Δσ =0.46 MPa, and considering that during the measure-ment A0 = 4.88 mm2, dfiber head = 223 μm, the ratiobetween the diameter of the effective sphere andthat of the equivalent spheres turned out to beae = 1.81.Figure 15 reveals the influence of fiber head vol-ume on the tensile strength.The relation of fiber head volume and tensilestrength is linear and can also be characterized bythe general formula of (39):
σc = acVfh + bc (39)
at R = 0.986 correlation, where Vfh is the fiber headvolume, ac = –11.6·10–3 MPa/mm3 and bc =27.54 MPa. Furthermore, the linear relation verifiesthe correctness of the method of considering theeffective spheres based on the ratio of their volume(Equation (21)).
4.3. Application of the model
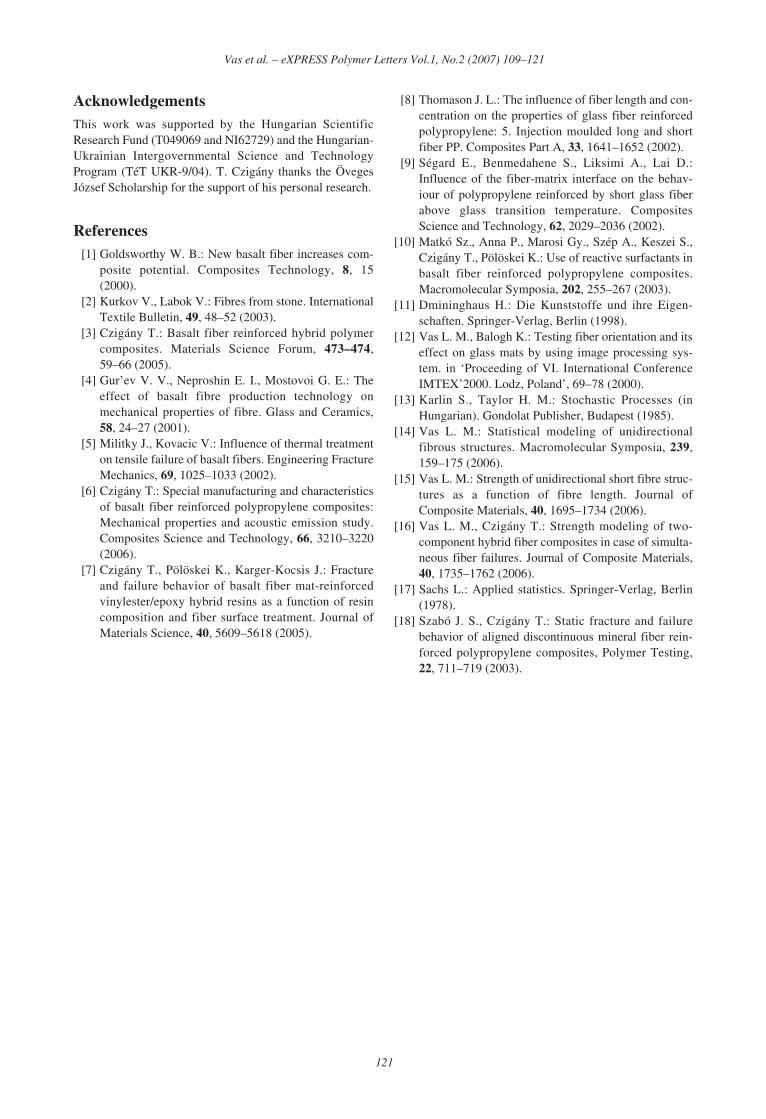
The test results obtained on composites producedby melt mixing were supplemented by measure-ments carried out on specimens produced in thesame way but using basalt fibers containing fiberheads. Figure 16 shows the tensile strength of com-posites with and without fiber heads as a functionof fiber content. A polynomial curve of the fifthorder was fitted on the measurement points showedin Figure 16 [12]. Differences appear between thestrength values in the fiber content interval between8.5 and 20 vol%. In case of lower fiber contents,the effect of fiber head presence or absence is neg-ligible. If the fiber content exceeds the upper valueof the interval, the role of fiber heads is again lesssignificant due to the discontinuities in the compos-ite structure (the matrix does not fill the voids
119
Vas et al. – eXPRESS Polymer Letters Vol.1, No.2 (2007) 109–121
Figure 15. The influence of fiber head volume on the ten-sile strength
Figure 16. The influence of fiber heads on the tensilestrength as a function of fiber content
0
0
A
Fm =σ
0A
Ffhfh =σ
eff
fhm A
F=σ
π= fhA
d4
headfibere d
da =
among the fibers sufficiently). Hence the modelwas examined only in the middle range(8.5–20 vol%). The expected values of the compos-ites containing fiber heads were calculated from thestrength values of the coresponding material with-out fiber heads using the proposed model. The mostimportant variable of the model is ae, determinedby finite element modeling and by investigatingsingle fiber head composites. The aim of the finiteelement modeling was to obtain information on thesize of the stress collection zones. If the stress col-lection zones exceeding the 0.92 MPa differencerelative to the far vicinity of the fiber head are con-sidered, ae = 1.67 was obtained.The ΦBV values calculated from these results basedon (21) provide the extent of strength reductiondirectly. The ΦBV obtained in cases of different val-ues (finite element modeling and tensile testing ofPP specimens with single fiber head) are summa-rized in Table 4.The results revealed in Table 4 are more illustrativein graphics. Hence the values measured in tensiletests on basalt fiber associated composites with andwithout fiber heads (Figure 16) and the results cal-culated based on the models are shown together inFigure 17.Linear approximation was applied in the describedstage. The uppermost line corresponds to compos-ites without fiber heads, and the lowest one to themeasured tensile strength of composites containingfiber heads. The line in the middle represents thecalculations with the parameter values determinedby finite element modeling. In this case the extentof strength reduction did not approach the real one.
The reason is that although the model was devel-oped further, in addition to interfacial processesrelaxation phenomena could also take place, hencefurther refinement may be necessary to describeprocesses accurately.The results obtained from single fiber head meas-urements correspond to the measurements carriedout on composites with fiber heads. This is proba-bly accidental, since the strength values of the com-posites with and without fiber heads deviate aroundthe regression line in both directions and to differ-ent extents. Considering all the statements made, itwas found that the model approximates the realprocesses well using parameter ae, hence the initialconditions and the principle turned out to be cor-rect.
5. Conclusions
The influence of fiber heads, formed during theproduction of basalt fibers was studied in this arti-cle on the mechanical properties of composites.The fiber heads are of large size and number due tothe characteristics of the technology. From the twomain aspects related to the presence of these inclu-sions in the matrix, that is the improvement oftoughness and defect site formation, the latter oneturned out to be dominant. Firstly, the problem wasanalyzed by finite element simulations, in order todetermine the intrinsic failure mode of the material.Afterwards, a theoretical model was created incharacterizing the fiber head by an equivalentsphere, while its surroundings, the stress collectionzone were described by another concentric spherecalled effective sphere. The distribution of theseeffective spheres was described by a Poissonmodel. The main parameters of the model weredetermined with tensile tests on composites with asingle fiber head embedded in PP. During thesetests the influence of its size and the distance fromthe theoretical failure cross section on the tensilestrength was analyzed. This way the effective crosssection reduction, hence the role of fiber heads asvolumetric defect sites in reducing the tensilestrength were verified. The correctness of themodel was verified by tensile tests made on com-posites made of basalt fibers with and without fiberheads.
120
Vas et al. – eXPRESS Polymer Letters Vol.1, No.2 (2007) 109–121
Figure 17. Comparison of the model and measured tensilestrength values as a function fiber content
Table 4. The values of ΦBV as function of fiber content
Fiber content [vol%] 8.5 13.8 20.0ΦBV finite element (ae = 1.67) 0.942 0.907 0.865ΦBV tensile (ae = 1.81) 0.898 0.836 0.763
AcknowledgementsThis work was supported by the Hungarian ScientificResearch Fund (T049069 and NI62729) and the Hungarian-Ukrainian Intergovernmental Science and TechnologyProgram (TéT UKR-9/04). T. Czigány thanks the ÖvegesJózsef Scholarship for the support of his personal research.
References[1] Goldsworthy W. B.: New basalt fiber increases com-
posite potential. Composites Technology, 8, 15(2000).
[2] Kurkov V., Labok V.: Fibres from stone. InternationalTextile Bulletin, 49, 48–52 (2003).
[3] Czigány T.: Basalt fiber reinforced hybrid polymercomposites. Materials Science Forum, 473–474,59–66 (2005).
[4] Gur’ev V. V., Neproshin E. I., Mostovoi G. E.: Theeffect of basalt fibre production technology onmechanical properties of fibre. Glass and Ceramics,58, 24–27 (2001).
[5] Militky J., Kovacic V.: Influence of thermal treatmenton tensile failure of basalt fibers. Engineering FractureMechanics, 69, 1025–1033 (2002).
[6] Czigány T.: Special manufacturing and characteristicsof basalt fiber reinforced polypropylene composites:Mechanical properties and acoustic emission study.Composites Science and Technology, 66, 3210–3220(2006).
[7] Czigány T., Pölöskei K., Karger-Kocsis J.: Fractureand failure behavior of basalt fiber mat-reinforcedvinylester/epoxy hybrid resins as a function of resincomposition and fiber surface treatment. Journal ofMaterials Science, 40, 5609–5618 (2005).
[8] Thomason J. L.: The influence of fiber length and con-centration on the properties of glass fiber reinforcedpolypropylene: 5. Injection moulded long and shortfiber PP. Composites Part A, 33, 1641–1652 (2002).
[9] Ségard E., Benmedahene S., Liksimi A., Lai D.:Influence of the fiber-matrix interface on the behav-iour of polypropylene reinforced by short glass fiberabove glass transition temperature. CompositesScience and Technology, 62, 2029–2036 (2002).
[10] Matkó Sz., Anna P., Marosi Gy., Szép A., Keszei S.,Czigány T., Pölöskei K.: Use of reactive surfactants inbasalt fiber reinforced polypropylene composites.Macromolecular Symposia, 202, 255–267 (2003).
[11] Dmininghaus H.: Die Kunststoffe und ihre Eigen-schaften. Springer-Verlag, Berlin (1998).
[12] Vas L. M., Balogh K.: Testing fiber orientation and itseffect on glass mats by using image processing sys-tem. in ‘Proceeding of VI. International ConferenceIMTEX’2000. Lodz, Poland’, 69–78 (2000).
[13] Karlin S., Taylor H. M.: Stochastic Processes (inHungarian). Gondolat Publisher, Budapest (1985).
[14] Vas L. M.: Statistical modeling of unidirectionalfibrous structures. Macromolecular Symposia, 239,159–175 (2006).
[15] Vas L. M.: Strength of unidirectional short fibre struc-tures as a function of fibre length. Journal ofComposite Materials, 40, 1695–1734 (2006).
[16] Vas L. M., Czigány T.: Strength modeling of two-component hybrid fiber composites in case of simulta-neous fiber failures. Journal of Composite Materials,40, 1735–1762 (2006).
[17] Sachs L.: Applied statistics. Springer-Verlag, Berlin(1978).
[18] Szabó J. S., Czigány T.: Static fracture and failurebehavior of aligned discontinuous mineral fiber rein-forced polypropylene composites, Polymer Testing,22, 711–719 (2003).
121
Vas et al. – eXPRESS Polymer Letters Vol.1, No.2 (2007) 109–121