Embed Size (px)
Citation preview
Theoretical Determination of Forming Limit Diagram for Steel ,Brass andAluminum alloy sheets
Waleed J. Ali Anas O. EdreesMechanical Engineering Department, University of Mosul
Abstract :
Sheet metal forming is defined as the ability of metal to deformplastically (deformation by Stretching or drawing) or changing the shapeof the sheet into a new desirable shape with out necking or crack . Tocontrol the operation of sheet metal forming with out failure. A diagramis used in which the range accepted , failure and critical deformationrange are shown . This diagram is known as the Forming limit diagram. Itis considered as one of the important tool to determine the formability ofsheet metals. Every sheet metal has its own forming limit diagram whichdetermines its formability, strain limit and the forming regions. Thesediagrams can be assessed using theoretical and experimental approaches,In this paper, the FLD is determined using different yield criteriaHill1948, Hosford1979 and modified Hosford 1985. It is shown that thedetermination of forming limit curve using the modified Hosford 1985criterion with the (M-K) analysis , gave the best results compared withthe other used criteria .Using this criterion gave the closest forming limitcurve to that obtained experimentally, but with different criterion indexfor different alloy . The value of the index (a=6) gave the best results forbrass, while (a=8) gave the best results for aluminum alloy and mild steel.
لمنیومالتعیین النظري لمنحني حد التشكیل لصفائح الصلب والبراص والأ
ولید جلال علي انس عبید إدریس.دجامعة الموصل -قسم الھندسة المیكانیكیة
الخلاصة
) التشكیل بالمط أو السحب(ولكي نسیطر على عملیة تشكیل الصفائح دون حدوث فشل یتم استخدام مخطط یبین فیھ ، أو كسر
،
لكل . مخطط حد التشكیل من الأدوات والوسائل المھمة في تحدید قابلیة تشكیل الصفائح الم
.و) Hill1948 (،)Hosford1979 (،)Hosford1985(للخضوع
.عملیا
)Hosford 1985 ()M-K (
لمعادن الم من ا لكل لخضوع ) a=6(، ستخدمة ا. كان الأفضل بالنسبة للألمنیوم والصلب ) a=8(للبراص ، بینما عند استخدام الأس
Notation1,2,3
Principle stresses
ε1 ε2 ε3 Principle strains
m Strain rate sensitivity
n Strain hardening exponent
effective stress
έ effective strain
ε˙ strain rate
effective strain rate
ratio of minor strain to major strain
ta thickness of the sheet
tb Thickness of groove
α Principle stress ratio
ƒ Imperfection factor
a Yield criterion index
K Strength coefficient
R΄ Normal plastic anisotropic ratio
R1,R0 Plastic anisotropic ratio with rolling direction
Received ١ July. 2005 Accepted 7 June 2006
R2,R90 Plastic anisotropic ratio transverse to rollingdirection
φ ratio of principle stress to effective stress
β Ratio of effective strain to principle strain
M-K Marciniak-Kuczynski analysis
1.IntroductionForming processes are among the most important metal working
operations. The industrial process of sheet-metal forming is stronglydependent on numerous interactive variables such as material behavior,lubrication, forming equipment, etc.
Forming limit Diagram is a representation of the criticalcombination of the two principal surface strains major and minor abovewhich localized necking instability is observed. Forming limit curve(FLC) provides excellent guidelines for adjusting material, tooling andlubrication conditions. Also it is strongly dependent on materialparameters, The idea of forming limit diagrams was first introduced byKeeler [1], when he observed that the maximum local elongation was notenough to determine the possible straining rate of a sheet .He establishedthat the plotting of the principal strains at fracture ε1, and ε2 on two axesof a same diagram gave a curve : the forming limit curve. This curve, firstrestricted on the area ε2>0, was made complete for ε2< 0 by Goodwin'sworks [2].This curve is interesting because it divides the plane into twozones .The success area under the forming limit curve and the fail areaabove it, for a deep drawing operation .The criteria to reject the drawnparts is now the onset of localized necking.
Hill [3] was the first who proposed a general criterion for localizednecking in thin sheets under plane stress states. His analysis predictslocalized plastic deformation in the negative minor strain region.Marciniak and Kuckzinsky (M–K) [4] have proposed the first realisticmathematical model for theoretical determination of FLDs that supposean infinite sheet metal containing a region of local imperfection whereheterogeneous plastic flow develops and localizes. Hutchinson and Neale
[5] extended M–K theory using a J2 deformation theory. Therefore, theleft and right hand sides of the forming limit diagram can be calculatedby M–K analysis.
Sheet metals exhibit a highly anisotropic material behavior by coldrolling. It is therefore of major importance to extend the plastic instabilityanalysis to anisotropic materials. Constitutive relations for the plasticyielding and deformation of anisotropic metals at a macroscopic levelwere proposed long ago by Hill 1948[6] This theory was the simplestconceivable one for anisotropic materials, however, inevitable limitationsof its range of validity have eventually became apparent. The original M-K analysis [4] was based on Hill's 1948 yield criterion [6]. However , itcan be seen from the comparison with experiments and predicted resultsof Painter and Pearce 1974[7] that this analysis overestimates the limitstrains towards the equibiaxial strain region, and underestimates the limitstrains towards the plane strain region, particularly for materials with Rvalues less than unity such as aluminum or brass . In addition, thecalculated limit strains for the right hand side of the FLDs are verysensitive to the material anisotropy, a phenomenon that has not beenobserved in experiment .Sowerby and Duncan 1971[8] argued that thedifference between these two stress states depends on the yield criterionand the shape of the corresponding yield locus. The effect of R on theFLDs depends on how the R-value affects the yield locus shape. Using(Hill's 1948) yield criterion, the stress ratios for positive strain ratiosdepend strongly on the value of R.
Hill's 1979 [9] yield criterion, taken with the assumption of theprinciple of equivalence of plastic work, was proposed to account for theso-called "anomalous behavior" of aluminum. This yield criterion hasundergone application. One line of attack is represented by the work ofParmar and Mellor 1978[10].
Hosford 1979 [11] developed an extension of Hill's 1948 yieldcriterion , which is also found to be a special case of Hill's 1979 yieldcriterion. This criterion has been used by Graf and Hosford 1990[12] forsheet metals with normal anisotropy. Later, Padwal and Chaturvedi1992[13] also used Hosford's 1985[14] planar anisotropy yield criterionto analyze the insatiable behavior of strain localization. They found thatthe effect of planar anisotropy is negligible while the predictions are
strongly dependent on exponent "a" an exponent in yield criterion .Predictions with a=5,6 or 8 match the experimental results much betterthan the predictions that were obtained from Hill's yield criterion.
Friedman and Pan 2000 [15] studied the effect of different yieldcriteria of (Hill1948),(Hill1979)and(Hosford 1979) on the right hand sideof the forming limit diagram .
Dariani and Azodi 2003[16] showed the agreement betweentheoretical and experimental results by changing the index of Hill1979yield criterion for right and left hand of FLD.
Banabic2004 [17] determined the FLD of Aluminum alloy (Al-2008)using new yield criterion (BBC2000)[18] , showed the best agreementbetween theoretical and experiment result of right hand side of FLD.
In this paper the FLDs of different sheet metals: Steel, Brass andAluminum alloy are obtained theoretically using, the Marciniak-Kuczynski Theory, the following yield criteria :Hill1948 , Hosford 1979and modified Hosford 1985 [14] , These FLDs were compared with theexperimentally obtained FLDs of the same sheets metals to obtain thebest agreement between the calculated FLDs and the experimental FLDs.2.Theoretical Analysis
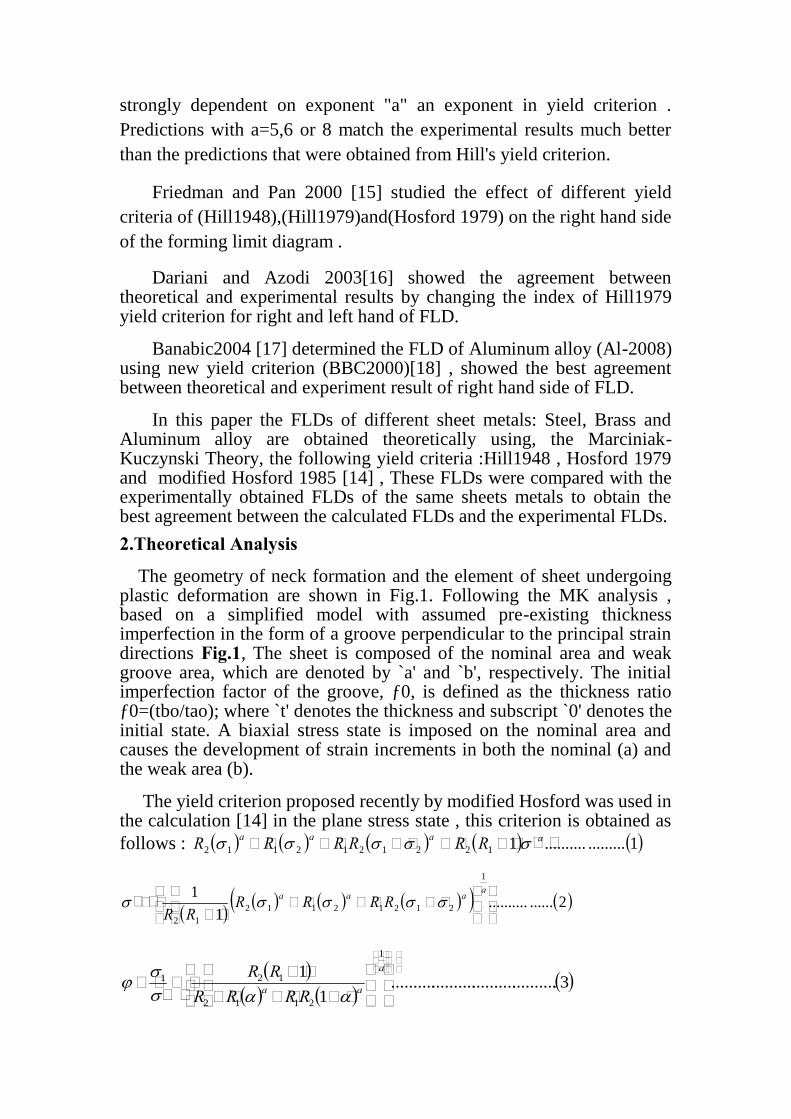
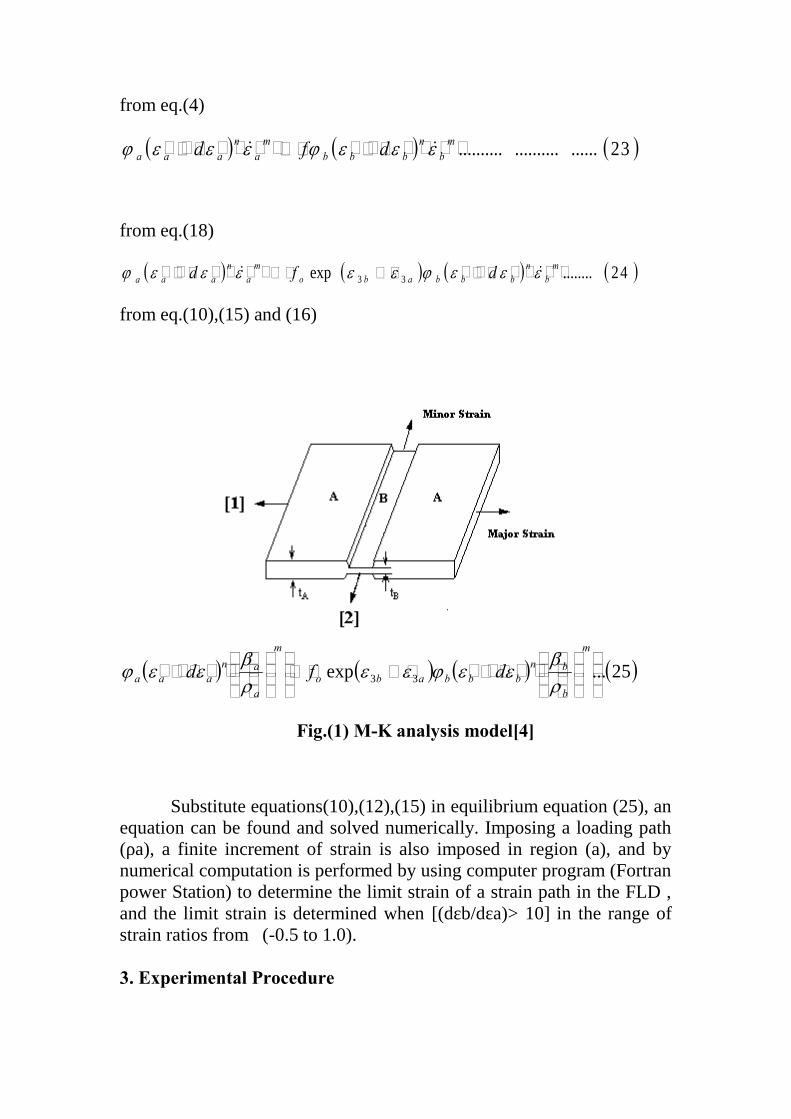
The geometry of neck formation and the element of sheet undergoingplastic deformation are shown in Fig.1. Following the MK analysis ,based on a simplified model with assumed pre-existing thicknessimperfection in the form of a groove perpendicular to the principal straindirections Fig.1, The sheet is composed of the nominal area and weakgroove area, which are denoted by `a' and `b', respectively. The initialimperfection factor of the groove, ƒ0, is defined as the thickness ratioƒ0=(tbo/tao); where `t' denotes the thickness and subscript `0' denotes theinitial state. A biaxial stress state is imposed on the nominal area andcauses the development of strain increments in both the nominal (a) andthe weak area (b).
The yield criterion proposed recently by modified Hosford was used inthe calculation [14] in the plane stress state , this criterion is obtained asfollows : 1...................11221212112
aaaa RRRRRR
2................1
11
2121211212
aaaa RRRRRR
3.........................................1
11
2112
121
a
aa RRRRRR

The behavior of material can be represented in the form of Power law
4..............................................................................mnK
The ratio of the principal stress and strain are define as follows:
5...........................................................,1
2
1
2
1
2
dd
The associated flow rule is expressed by
6.................................................................................ij
ij dd
Thus, the yield criterion can be written as follows:
7...................................
1 112
121
112
31
21211
21
21
21211
12
1
a
aaaaaa
RRd
RRd
RRRd
RRRd
and
8.....................................................11
1212
12
1
1
a
a
RRRRR
dd
9.......................................11
121
11
12
1
2
aa
a
RRRRR
dd
from eq.(5)and(7)
10.........................................................1
11
212
121
11
1
2
a
aa
RRRRRR
dd
using condition of constant volume in plastic deformation
11................................................................................................0321 ddd
from eq.(8)and(9),(11)
12.........................................................1
112
12
1
3
a
a
RRRR
dd
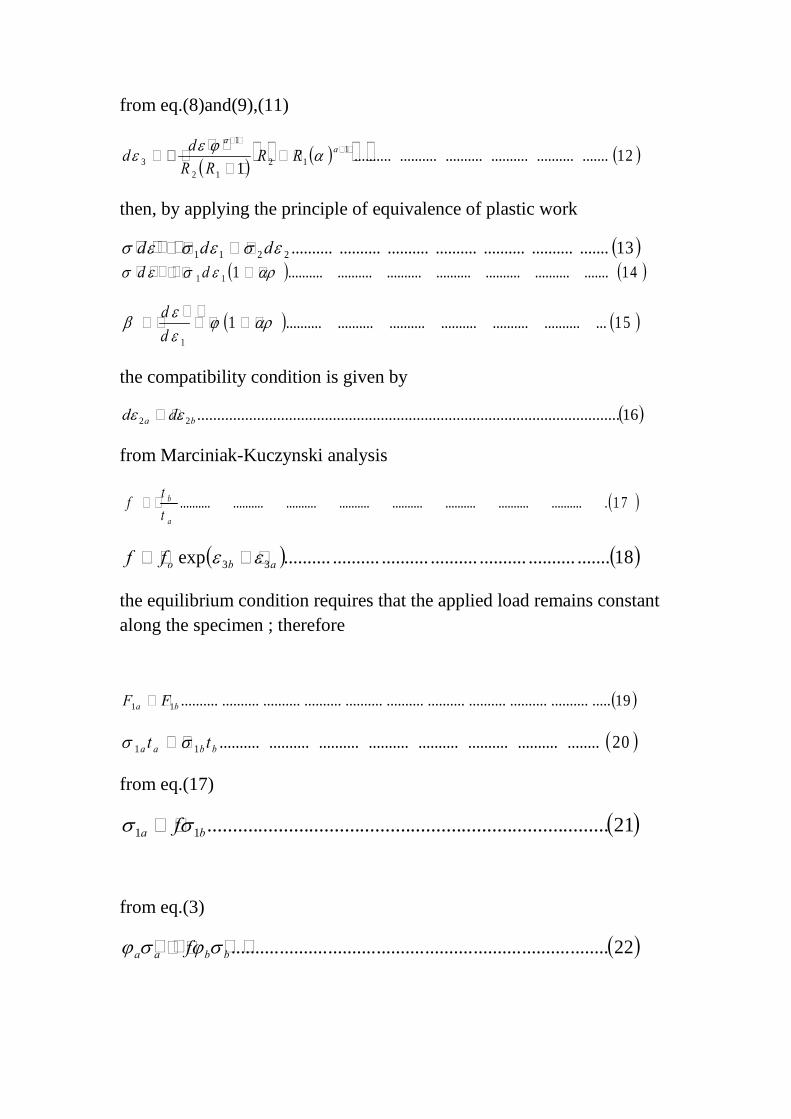
then, by applying the principle of equivalence of plastic work
13...................................................................2211 ddd 14...................................................................111 dd
15...............................................................11
dd
the compatibility condition is given by
16..........................................................................................................22 ba dd
from Marciniak-Kuczynski analysis
1 7.................................................................................a
b
ttf
18...................................................................exp 33 aboff
the equilibrium condition requires that the applied load remains constantalong the specimen ; therefore
19.........................................................................................................11 ba FF
20..............................................................................11 bbaa tt
from eq.(17)
21...............................................................................11 ba f
from eq.(3)
22..............................................................................bbaa f
from eq.(4)
23..........................mb
nbbb
ma
naaa dfd
from eq.(18)
24........exp 33m
bn
bbbabom
an
aaa dfd
from eq.(10),(15) and (16)
25...exp 33
m
b
bnbbbabo
m
a
anaaa dfd
Fig.(1) M-K analysis model[4]
Substitute equations(10),(12),(15) in equilibrium equation (25), anequation can be found and solved numerically. Imposing a loading path(ρa), a finite increment of strain is also imposed in region (a), and bynumerical computation is performed by using computer program (Fortranpower Station) to determine the limit strain of a strain path in the FLD ,and the limit strain is determined when [(dεb/dεa)> 10] in the range ofstrain ratios from (-0.5 to 1.0).
3. Experimental Procedure
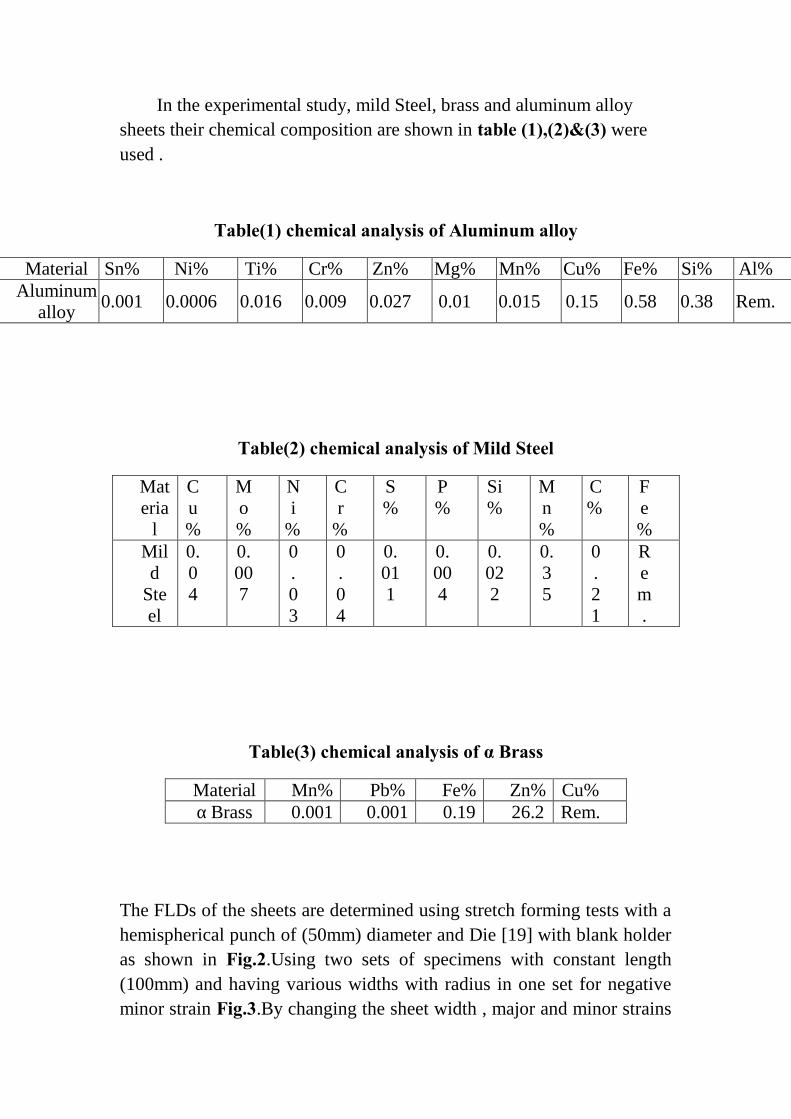
In the experimental study, mild Steel, brass and aluminum alloysheets their chemical composition are shown in table (1),(2)&(3) wereused .
Table(1) chemical analysis of Aluminum alloy
Al%Si%Fe%Cu%Mn%Mg%Zn%Cr%Ti%Ni%Sn%Material
Rem.0.380.580.150.0150.010.0270.0090.0160.00060.001Aluminumalloy
Table(2) chemical analysis of Mild Steel
Fe%
C%
Mn%
Si%
P%
S%
Cr
%
Ni
%
Mo%
Cu%
Materia
lRem.
0.21
0.35
0.022
0.004
0.011
0.04
0.03
0.007
0.04
Mild
Steel
Table(3) chemical analysis of α Brass
Cu%Zn%Fe%Pb%Mn%MaterialRem.26.20.190.0010.001α Brass
The FLDs of the sheets are determined using stretch forming tests with ahemispherical punch of (50mm) diameter and Die [19] with blank holderas shown in Fig.2.Using two sets of specimens with constant length(100mm) and having various widths with radius in one set for negativeminor strain Fig.3.By changing the sheet width , major and minor strains
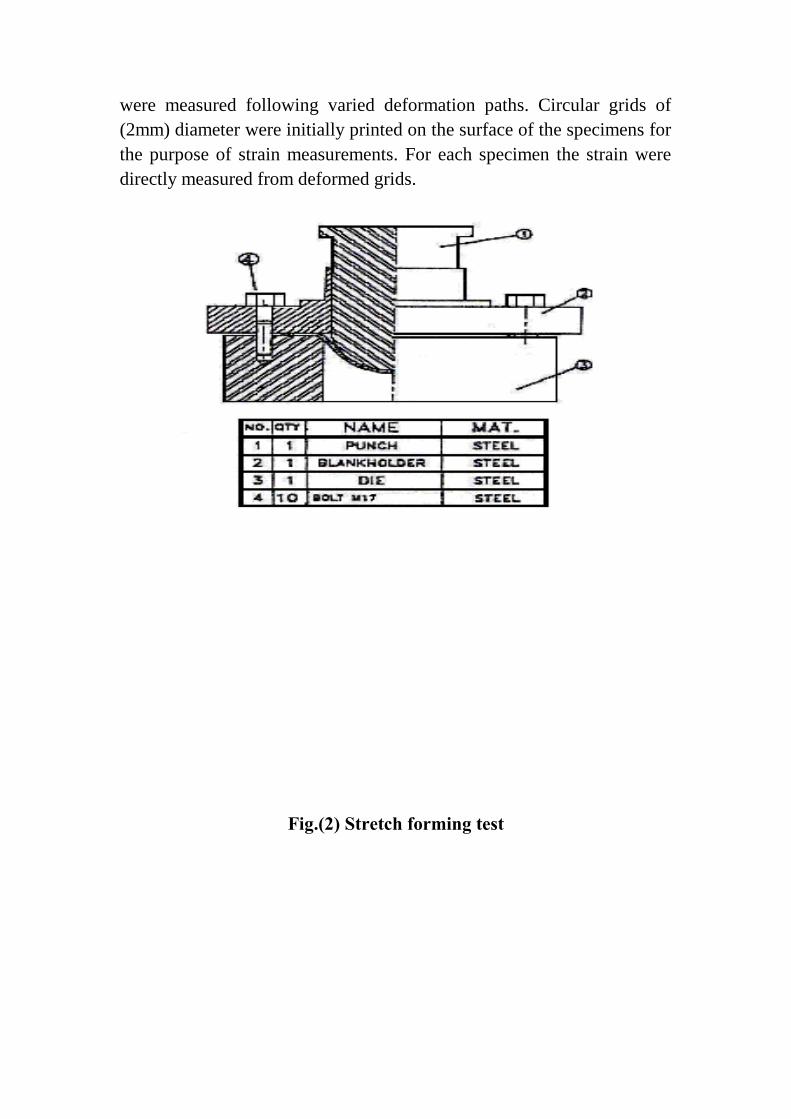
were measured following varied deformation paths. Circular grids of(2mm) diameter were initially printed on the surface of the specimens forthe purpose of strain measurements. For each specimen the strain weredirectly measured from deformed grids.
Fig.(2) Stretch forming test
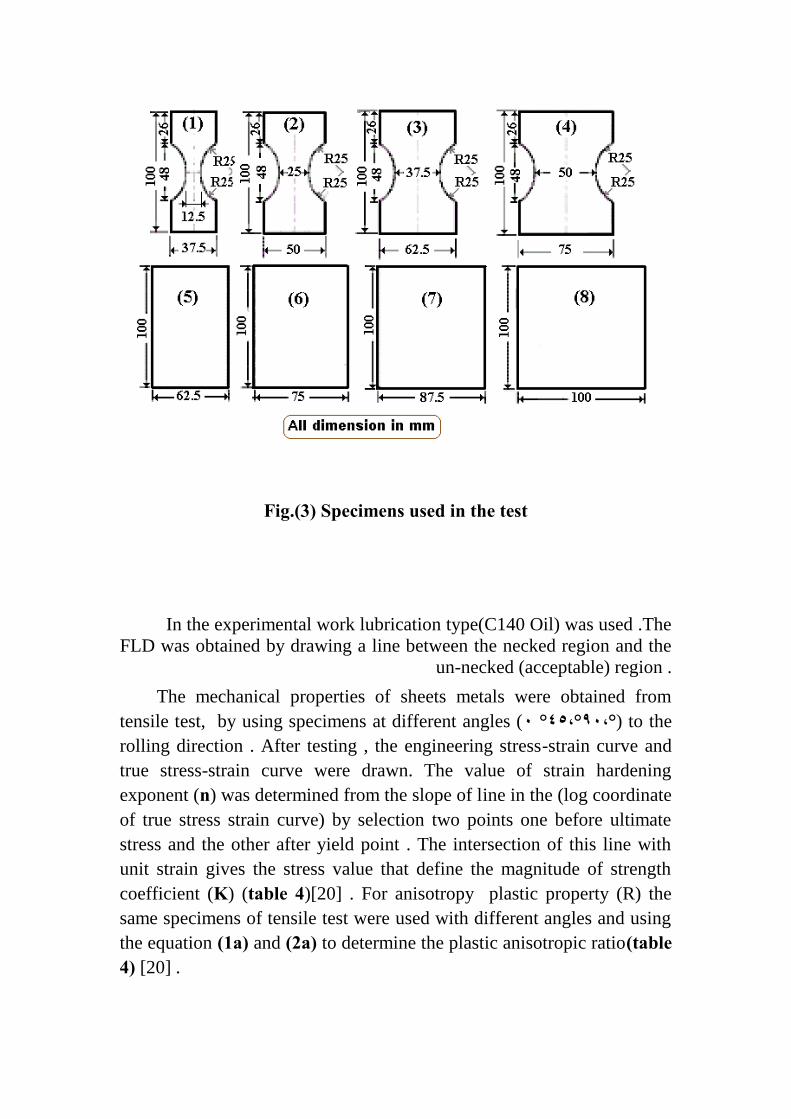
Fig.(3) Specimens used in the test
In the experimental work lubrication type(C140 Oil) was used .TheFLD was obtained by drawing a line between the necked region and the
un-necked (acceptable) region .The mechanical properties of sheets metals were obtained from
tensile test, by using specimens at different angles ( ،٠ ° ،٤٥ ° ،٩٠ °) to therolling direction . After testing , the engineering stress-strain curve andtrue stress-strain curve were drawn. The value of strain hardeningexponent (n) was determined from the slope of line in the (log coordinateof true stress strain curve) by selection two points one before ultimatestress and the other after yield point . The intersection of this line withunit strain gives the stress value that define the magnitude of strengthcoefficient (K) (table 4)[20] . For anisotropy plastic property (R) thesame specimens of tensile test were used with different angles and usingthe equation (1a) and (2a) to determine the plastic anisotropic ratio(table4) [20] .
aRt
w 1...............................................................................................
Where εw: strain in the width of specimen , εt: strain in the thickness ofspecimen
aRRRR 2..............................................................................4
2 90450
The strain rate sensitivity (m) was determined by using the sametensile test specimens , the cross-head speed is suddenly changed duringthe uniform deformation region of a tensile test and a small jump in theload may be observed , the exponent (m) is then calculated (eq.3a) fromload and cross-head speed before and after the speed change , which isdenoted by suffixes 1 and 2 in (table 4) [20].
a
VVPP
m 3.............................................................................................log
log
2
1
2
1
where P1: load before change , P2:load after change.
V1: cross head speed before change , V2: cross head speed afterchange
4.Results and Discussion
The values of n,m,R′,R0,R90 and K ,which were used in thetheoretical determination of FLD, determined experimentally are shownin table (4).
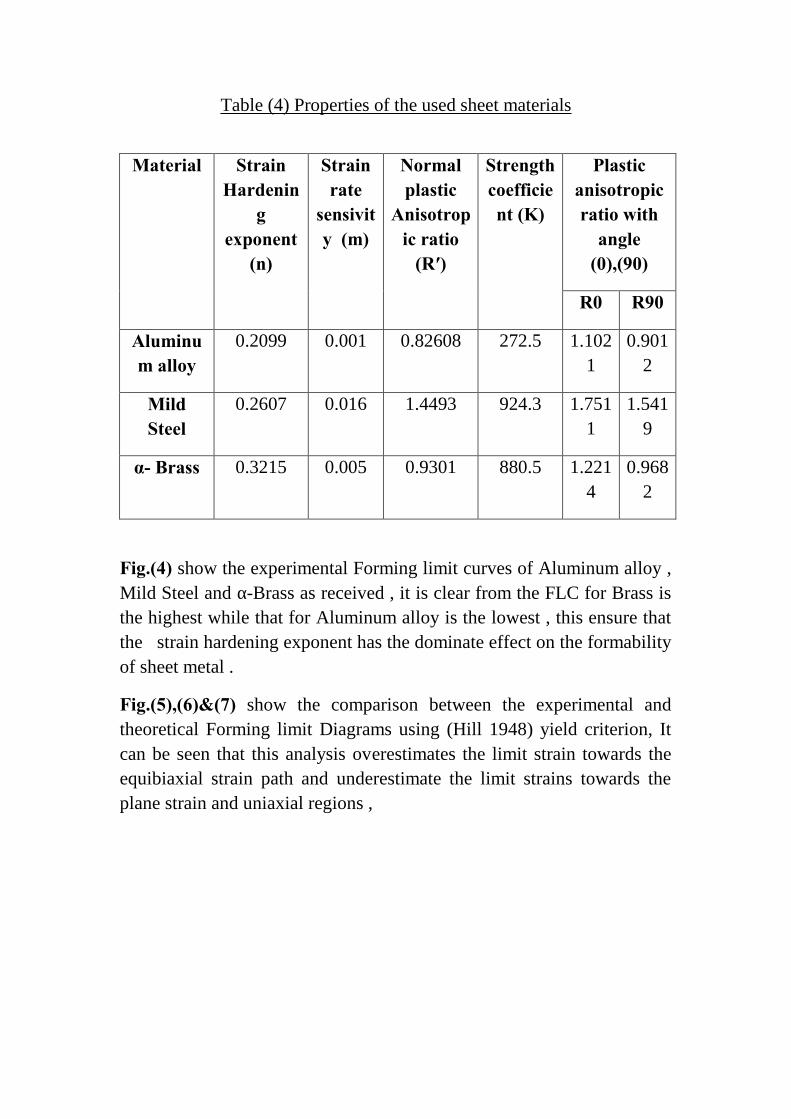
Table (4) Properties of the used sheet materials
Material StrainHardenin
gexponent
(n)
Strainrate
sensivity (m)
Normalplastic
Anisotropic ratio
(R′)
Strengthcoefficient (K)
Plasticanisotropicratio with
angle(0),(90)
R0 R90
Aluminum alloy
0.2099 0.001 0.82608 272.5 1.1021
0.9012
MildSteel
0.2607 0.016 1.4493 924.3 1.7511
1.5419
α- Brass 0.3215 0.005 0.9301 880.5 1.2214
0.9682
Fig.(4) show the experimental Forming limit curves of Aluminum alloy ,Mild Steel and α-Brass as received , it is clear from the FLC for Brass isthe highest while that for Aluminum alloy is the lowest , this ensure thatthe strain hardening exponent has the dominate effect on the formabilityof sheet metal .
Fig.(5),(6)&(7) show the comparison between the experimental andtheoretical Forming limit Diagrams using (Hill 1948) yield criterion, Itcan be seen that this analysis overestimates the limit strain towards theequibiaxial strain path and underestimate the limit strains towards theplane strain and uniaxial regions ,
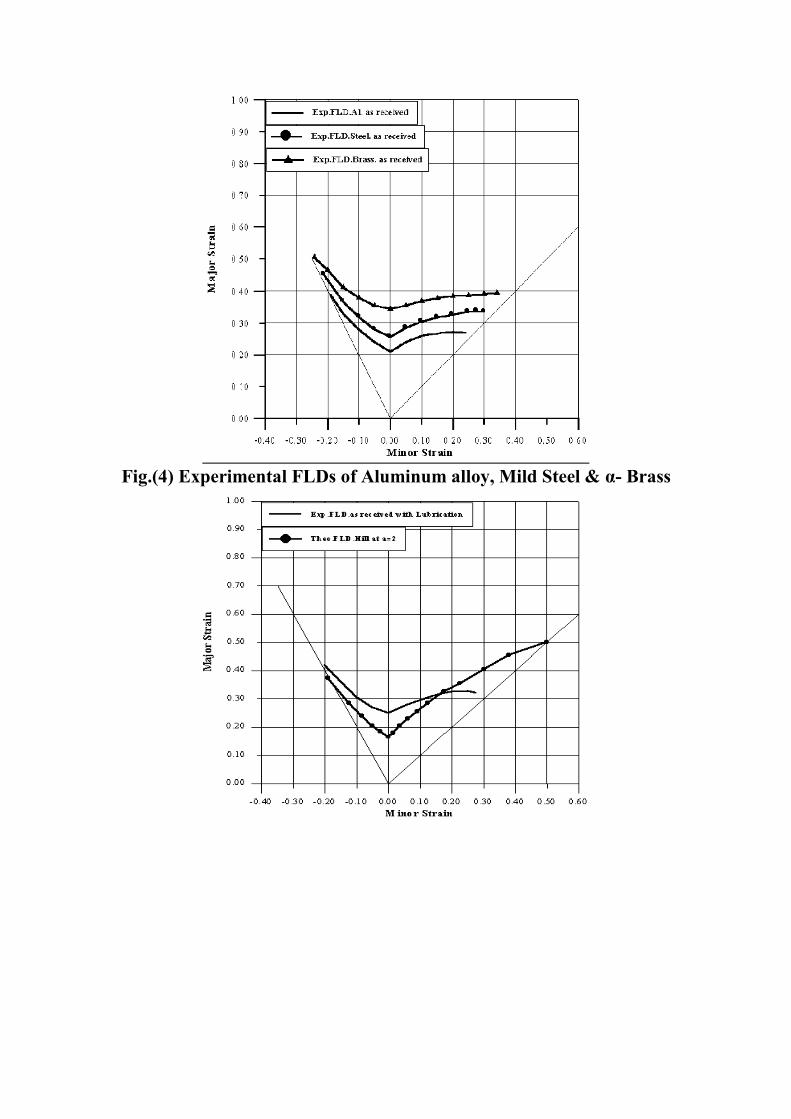
Fig.(4) Experimental FLDs of Aluminum alloy, Mild Steel & α- Brass
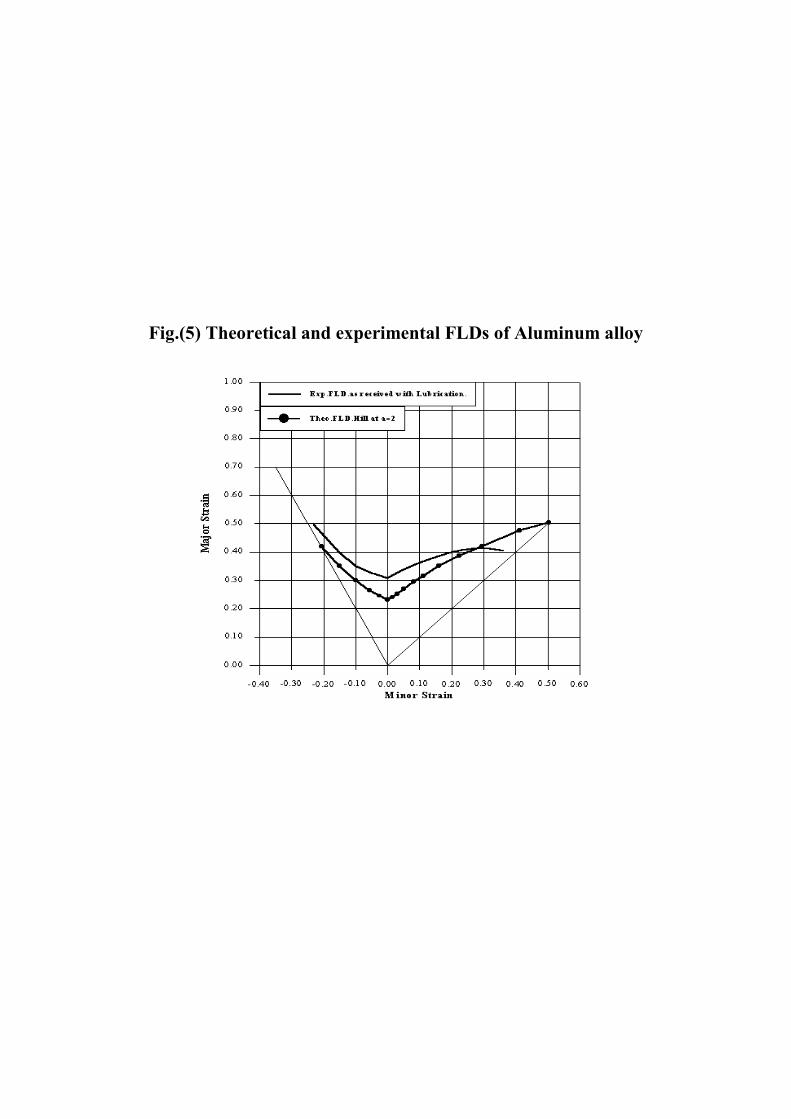
Fig.(5) Theoretical and experimental FLDs of Aluminum alloy
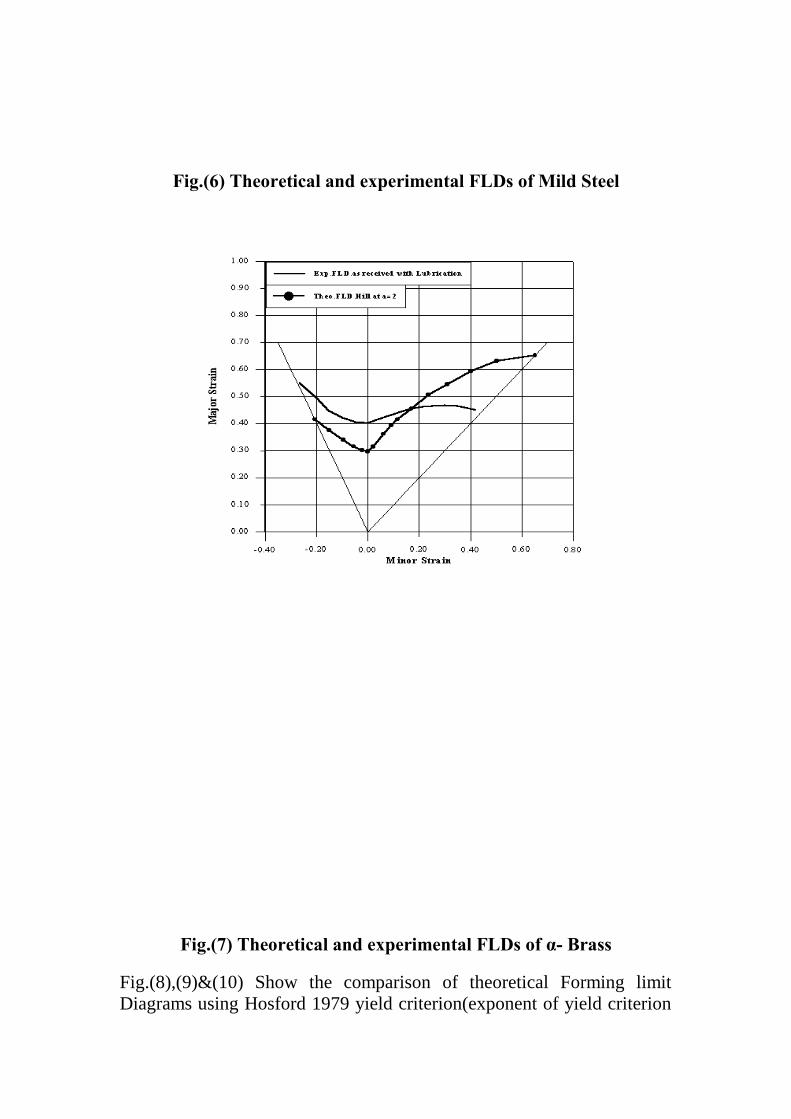
Fig.(6) Theoretical and experimental FLDs of Mild Steel
Fig.(7) Theoretical and experimental FLDs of α- Brass
Fig.(8),(9)&(10) Show the comparison of theoretical Forming limitDiagrams using Hosford 1979 yield criterion(exponent of yield criterion
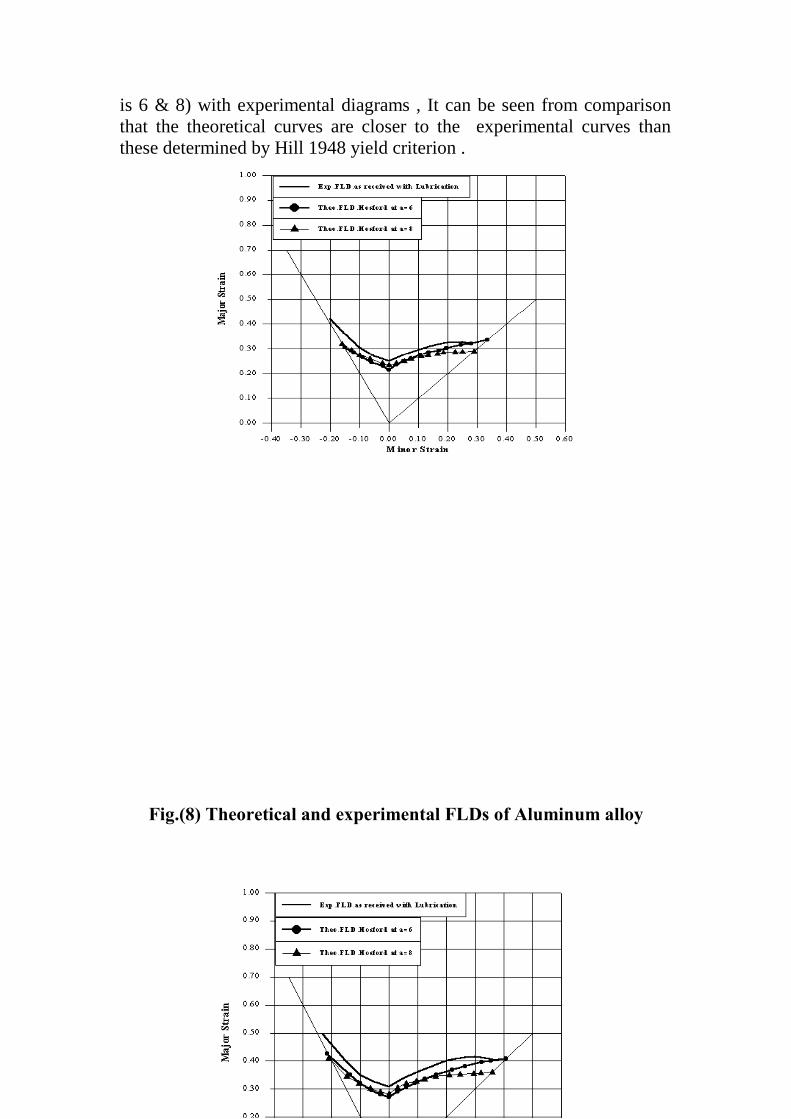
is 6 & 8) with experimental diagrams , It can be seen from comparisonthat the theoretical curves are closer to the experimental curves thanthese determined by Hill 1948 yield criterion .
Fig.(8) Theoretical and experimental FLDs of Aluminum alloy
Fig.(9) Theoretical and experimental FLDs of Mild Steel
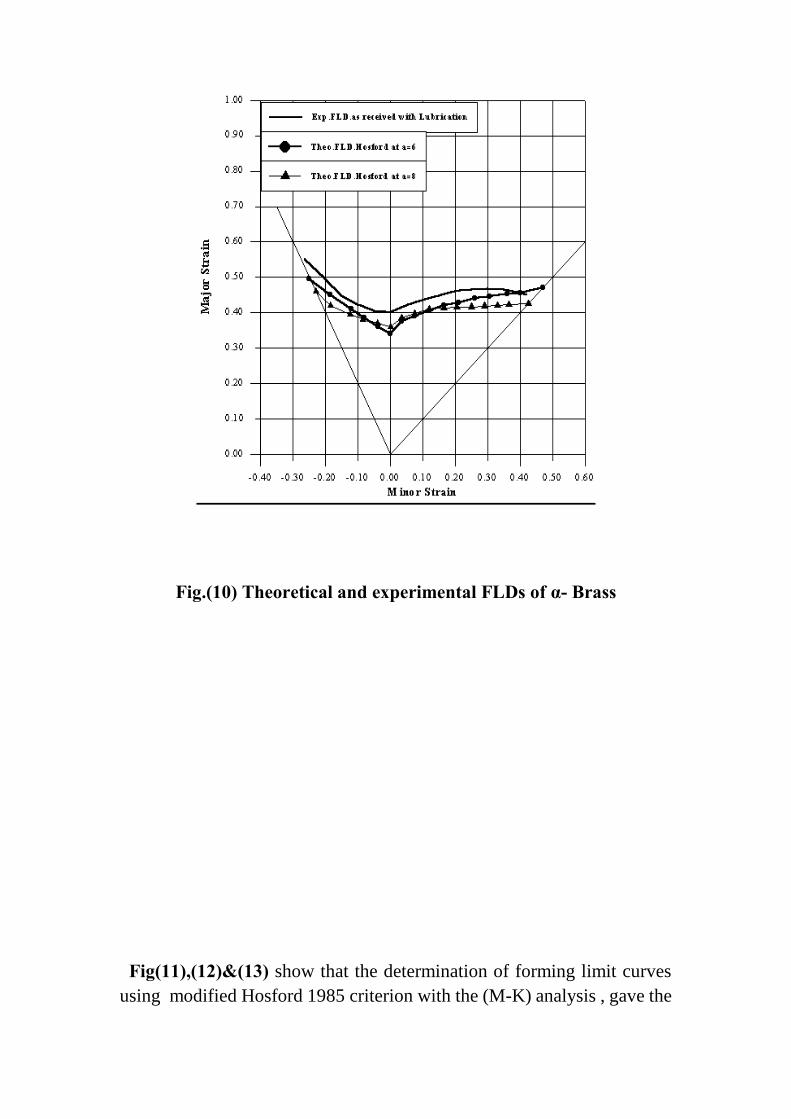
Fig.(10) Theoretical and experimental FLDs of α- Brass
Fig(11),(12)&(13) show that the determination of forming limit curvesusing modified Hosford 1985 criterion with the (M-K) analysis , gave the
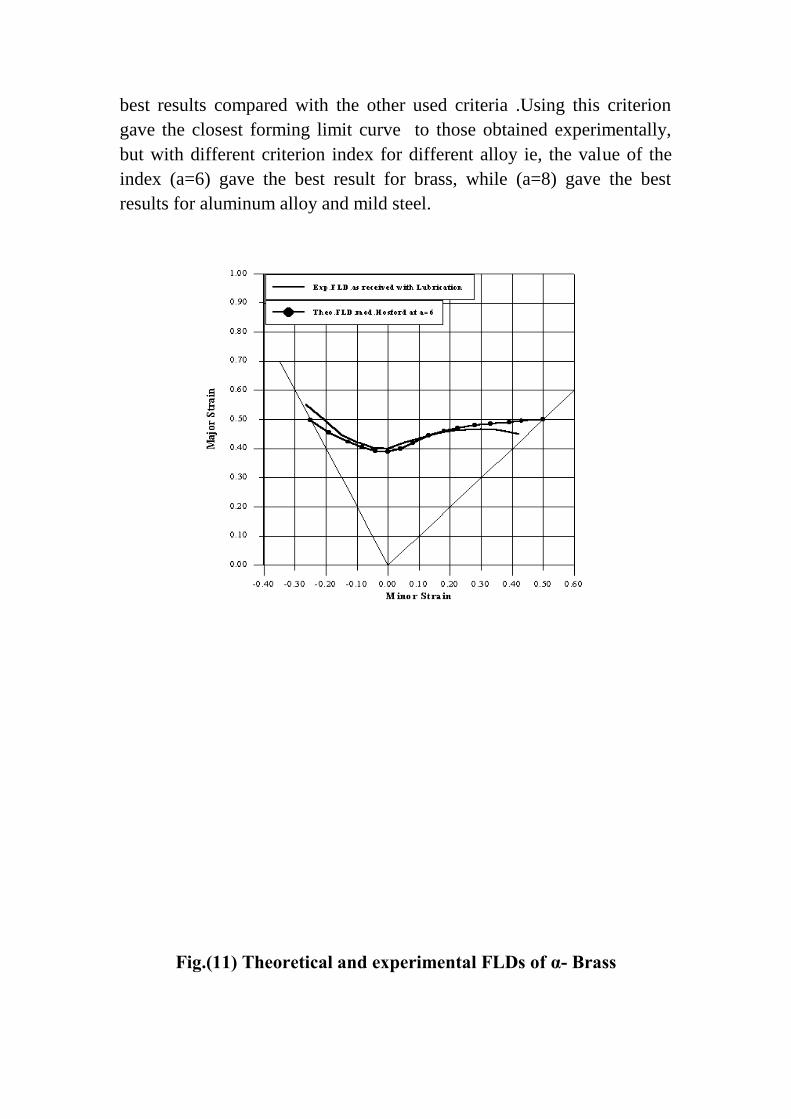
best results compared with the other used criteria .Using this criteriongave the closest forming limit curve to those obtained experimentally,but with different criterion index for different alloy ie, the value of theindex (a=6) gave the best result for brass, while (a=8) gave the bestresults for aluminum alloy and mild steel.
Fig.(11) Theoretical and experimental FLDs of α- Brass
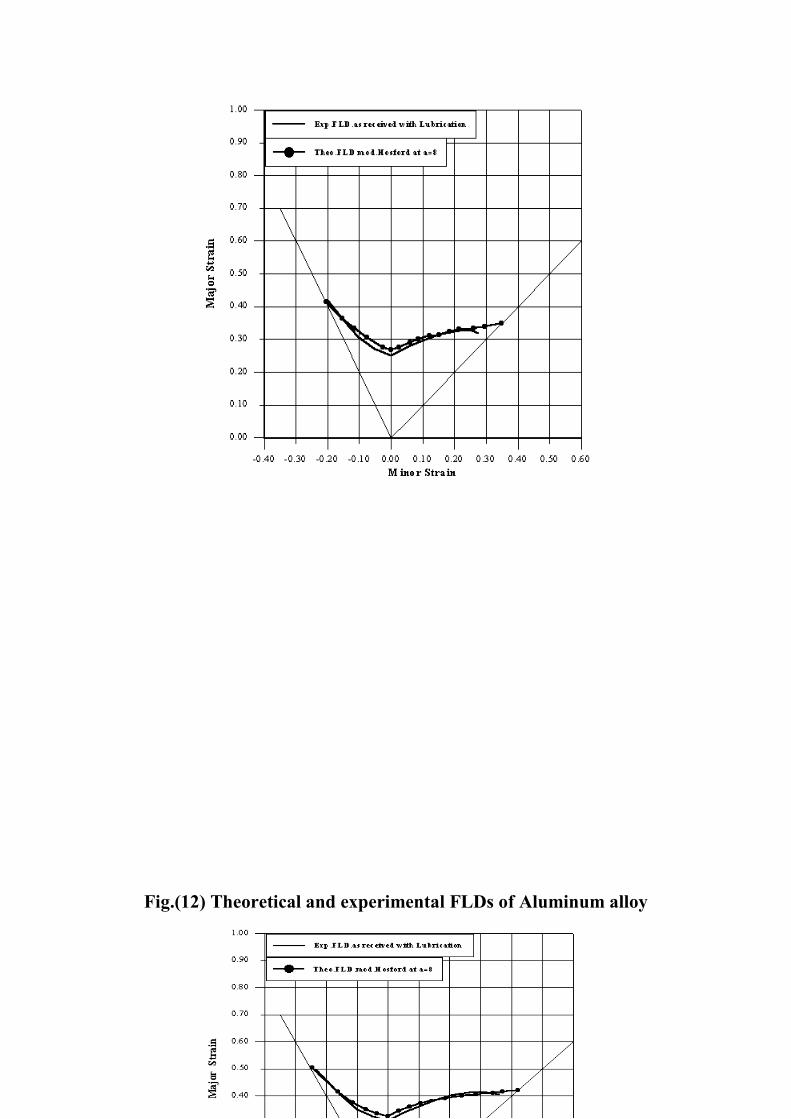
Fig.(12) Theoretical and experimental FLDs of Aluminum alloy
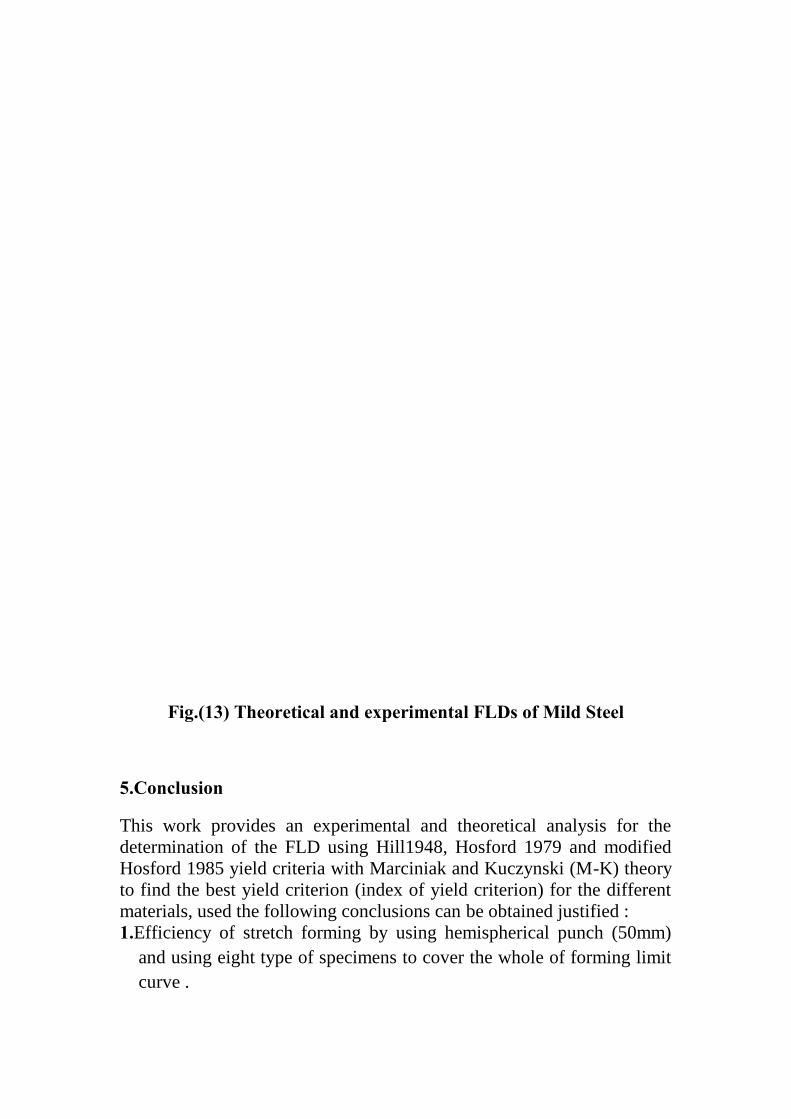
Fig.(13) Theoretical and experimental FLDs of Mild Steel
5.Conclusion
This work provides an experimental and theoretical analysis for thedetermination of the FLD using Hill1948, Hosford 1979 and modifiedHosford 1985 yield criteria with Marciniak and Kuczynski (M-K) theoryto find the best yield criterion (index of yield criterion) for the differentmaterials, used the following conclusions can be obtained justified :1.Efficiency of stretch forming by using hemispherical punch (50mm)
and using eight type of specimens to cover the whole of forming limitcurve .
2.Strain hardening exponent (n) has higher effect compared with otherparameters this makes Brass has highest FLD while Aluminum alloyhas the lowest.
3.In the theoretical results , it is shown that the determination offorming limit curve using modified Hosford 1985 criterion , gave thebest results compared with the other used criteria , but with differentindex to different sheet metal.4.The index (a=6)gave best result for Brass while the index (a=8)gave
best result for Aluminum and mild Steel.
References:
1.Keeler S.P. and Backofen W.A., (1963) Plastic Instability andFracture in Sheets Stretched Over Rigid Punches,Transactions of The ASM ,Vol. 56, 25-48.
2.Goodwin, G.M. (1968), Application of Strain Analysis to Sheet MetalForming Problems in the Press Shop, Society of AutomotiveEngineers, technical paper no. 680093 .
3.Hill, R., (1952), On Discontinuous Plastic States, With SpecialReference to Localized Necking in Thin sheets, Journal of theMechanics and Physics of Solids, Vol. 1, pp. 19-30.
4.Marciniak, Z. and Kuczynski, K. (1967), Limits Strains in TheProcesses of Stretch-Forming Sheet Metal, Int. J. Mech. Sci .Vol. 9,pp. 609-620 .
5.Hutchinson, J.W. and Neale, K.W. (1978b) Sheet Necking-III. Strain-Rate Effects, in Mechanics of Sheet Metal Forming, eds. D.P.Koistinen and N.M. Wang ،Plenum. New York, pp. 269-283 .
6. Hill,R.A theory of the yielding and plastic flow of anisotropicmaterials. Proceedings of Royal society of London 1948 :A193:281-97.
7. . Painter M.J. and Pearce R., (1974) Instability and Fracture in SheetMetal, J. Phys. D: Appl. Phys., Vol. 7, pp. 992-1002.
8. Sowerby R. and Duncan, D.L. (1971), Failure in Sheet Metal in BiaxialTension, Int. J. Mech. Sci. Vol. 13, pp. 217-229.
9. Hill, R. (1979) , Theoretical Plasticity of Textured Aggregates,Math. Proc. Camb. Phil.Soc. Vol. 55, pp.179-191.
10.Parmar, A. and Mellor, P.B. (1978), Predictions of Limit Strains inSheet Metal Using A More General Yield Criterion, Int. J. Mech. Sci.,Vol. 20, pp. 385-391.
11. Hosford.W.F.(1979), On yield loci of anisotropic cubic metals. Proc.7th North American Metalworking Conference , S.M.E., Dearborn, MI,USA, p. 191.
12. Graf, A. and Hosford, W.F. (1990), Calculations of forming limitdiagrams. Metall. Trans. Vol. 21A, pp. 87-96 .
13. Padwal, S.B. and Chaturvedi, R.C. (1992), Prediction of FormingLimits Using Hosford's Modified Yield Criterion, Int. J. Mech. Sci.Vol. 34, No. 7, pp. 541-547 .
14. Hosford W.F. (1985),” Comments on Anisotropic Yield Criteria”, Int.J. Mech. Sci., Vol. 27, No. 7/8, pp. 423-427
15. Friedman.P.A., Pan.J.(2000),” Effect of plastic anisotropic andyield criteria on prediction of forming limit curves ”,InternationalJournal of Mechanical Sciences 42,29-48.
16. Dariani.B.M. and Azodi.H.D.(2003) ,”Finding the optimum Hillindex in the determination of the forming limit diagram”, Journalof Engineering Manufacture .Vol.217.pp.1677-1683.
17. Banabic.D, Sorin Comsa, Paul Jurco(2004) “FLD theoretical modelusing a new anisotropic yield criterion”, Technical University of Cluj-Napoca, Romania .
18. Banabic.D, Comsa.S and Balan.T ،Proc.(2000) "Cold Metal Forming2000 Conference, Cluj Napoca 217.
19. Kim,K.J;Choi,S.H.(2003), Formability ofAA5182/polypropylene/AA5182 Sandwich sheets , Journal ofMaterials Processing Technology 139, P.1-7.
20. Marciniak, Z. ; Duncan, J.L.(2002).Mechanics of Sheet MetalForming. Butter worth-Heinemann.