Embed Size (px)
Citation preview

Théorie Financière
4. Evaluation d’actions et d’entreprises
Professeur André Farber
Tfin 04 Stock valuation |2September 1, 2005
Stock Valuation
• Objectives for this session :
1. Introduce the dividend discount model (DDM)
2. Understand the sources of dividend growth
3. Analyse growth opportunities
4. Examine why Price-Earnings ratios vary across firms
5. Introduce free cash flow model (FCFM)
Tfin 04 Stock valuation |3September 1, 2005
DDM: one-year holding period
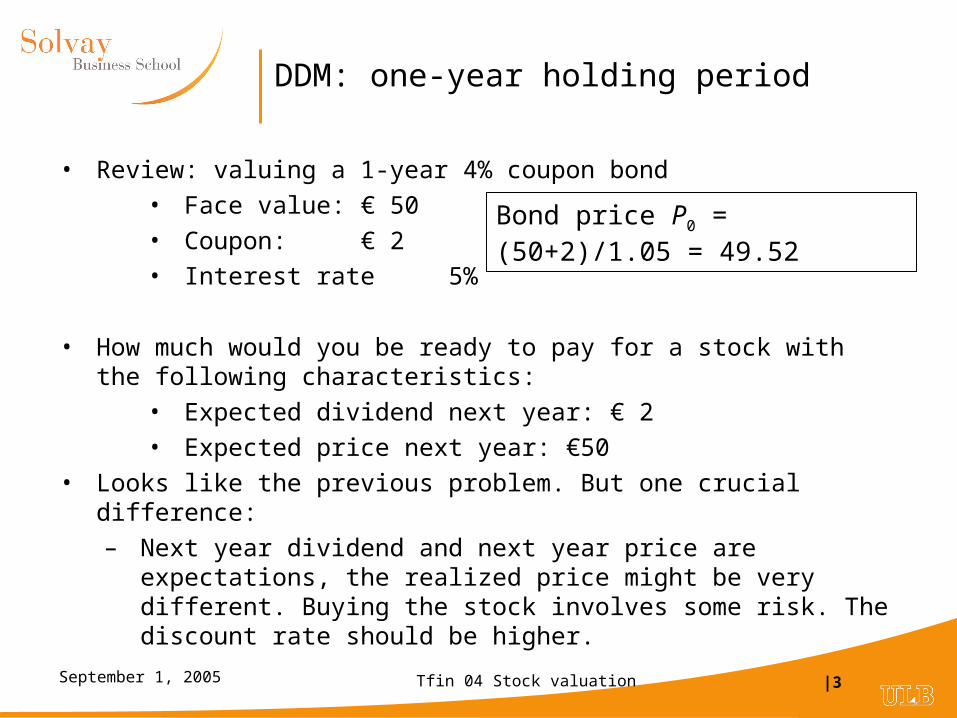
• Review: valuing a 1-year 4% coupon bond
• Face value: € 50
• Coupon: € 2
• Interest rate 5%
• How much would you be ready to pay for a stock with the following characteristics:
• Expected dividend next year: € 2
• Expected price next year: €50
• Looks like the previous problem. But one crucial difference:
– Next year dividend and next year price are expectations, the realized price might be very different. Buying the stock involves some risk. The discount rate should be higher.
Bond price P0 = (50+2)/1.05 = 49.52
Tfin 04 Stock valuation |4September 1, 2005
Dividend Discount Model (DDM): 1-year horizon
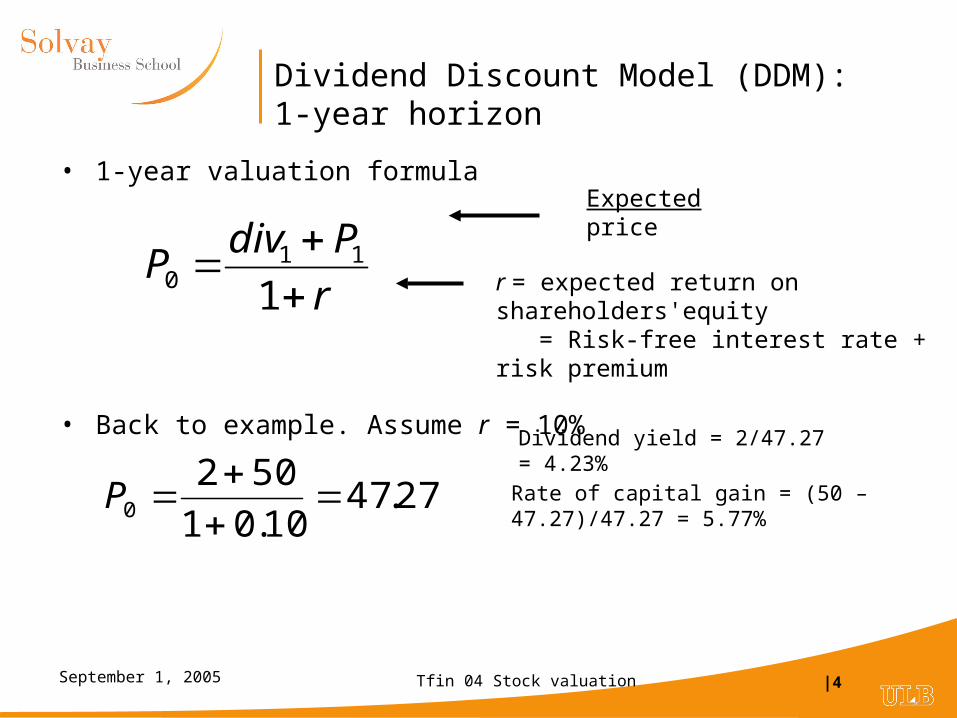
• 1-year valuation formula
• Back to example. Assume r = 10%
r
PdivP
1
110
27.4710.01
5020
P
Expected price
r = expected return on shareholders'equity = Risk-free interest rate + risk premium
Dividend yield = 2/47.27 = 4.23%
Rate of capital gain = (50 – 47.27)/47.27 = 5.77%
Tfin 04 Stock valuation |5September 1, 2005
DDM: where does the expected stock price come from?
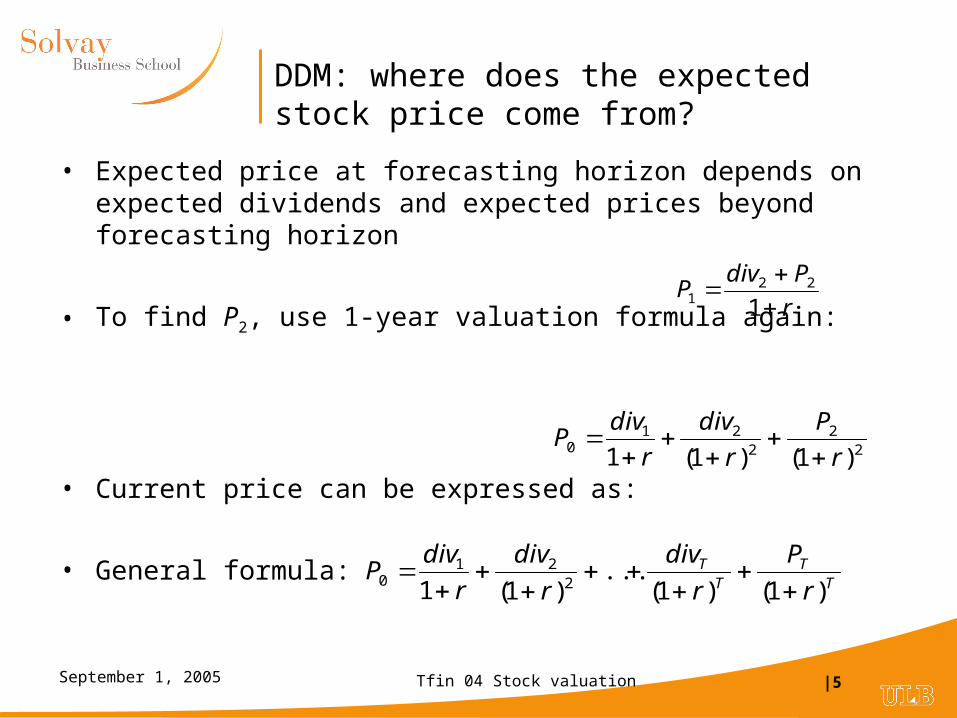
• Expected price at forecasting horizon depends on expected dividends and expected prices beyond forecasting horizon
• To find P2, use 1-year valuation formula again:
• Current price can be expressed as:
• General formula:
r
PdivP
1
221
22
221
0 )1()1(1 r
P
r
div
r
divP
TT
TT
r
P
r
div
r
div
r
divP
)1()1(...
)1(1 221
0
Tfin 04 Stock valuation |6September 1, 2005
DDM - general formula
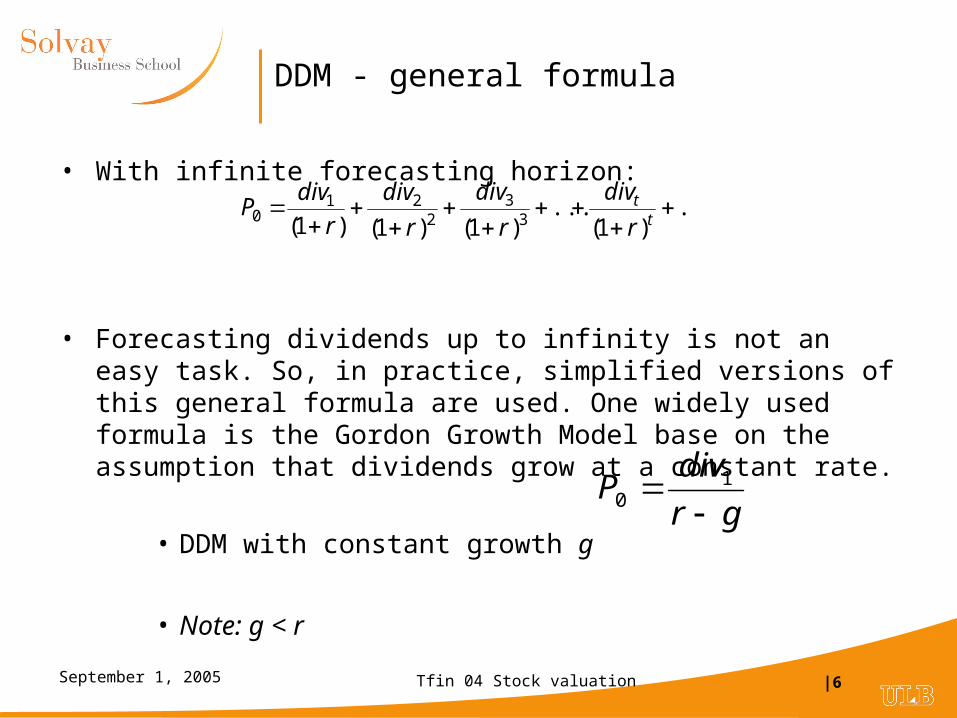
• With infinite forecasting horizon:
• Forecasting dividends up to infinity is not an easy task. So, in practice, simplified versions of this general formula are used. One widely used formula is the Gordon Growth Model base on the assumption that dividends grow at a constant rate.
• DDM with constant growth g
• Note: g < r
...)1(
...)1()1()1( 3
32
210
tt
r
div
r
div
r
div
r
divP
gr
divP
1
0
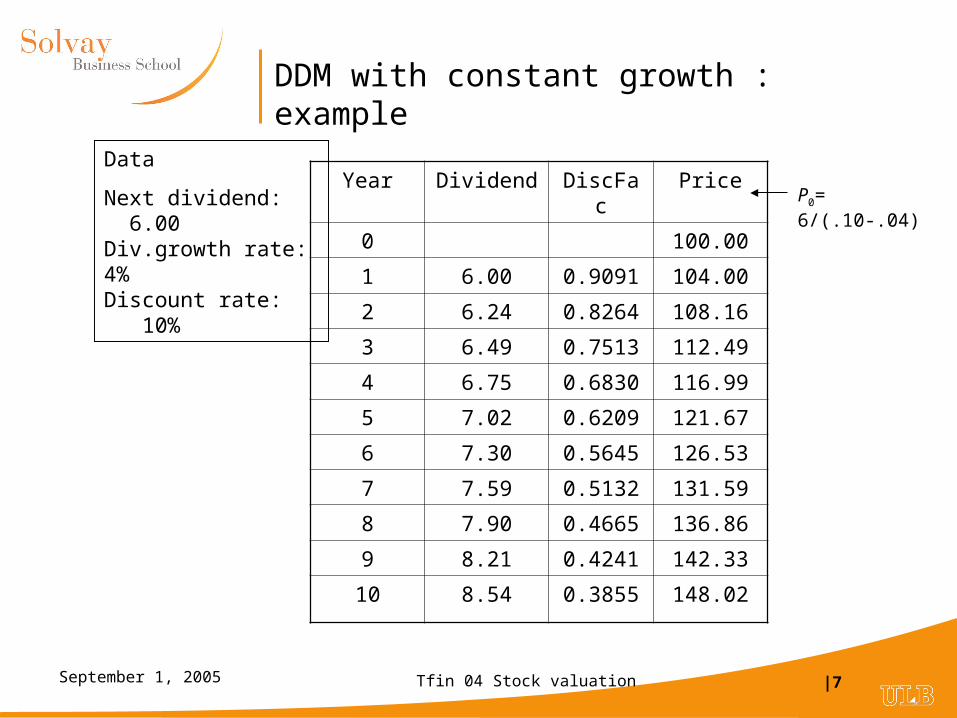
Tfin 04 Stock valuation |7September 1, 2005
DDM with constant growth : example
Year Dividend DiscFac Price
0 100.00
1 6.00 0.9091 104.00
2 6.24 0.8264 108.16
3 6.49 0.7513 112.49
4 6.75 0.6830 116.99
5 7.02 0.6209 121.67
6 7.30 0.5645 126.53
7 7.59 0.5132 131.59
8 7.90 0.4665 136.86
9 8.21 0.4241 142.33
10 8.54 0.3855 148.02
Data
Next dividend: 6.00Div.growth rate: 4%Discount rate: 10%
P0= 6/(.10-.04)
Tfin 04 Stock valuation |8September 1, 2005
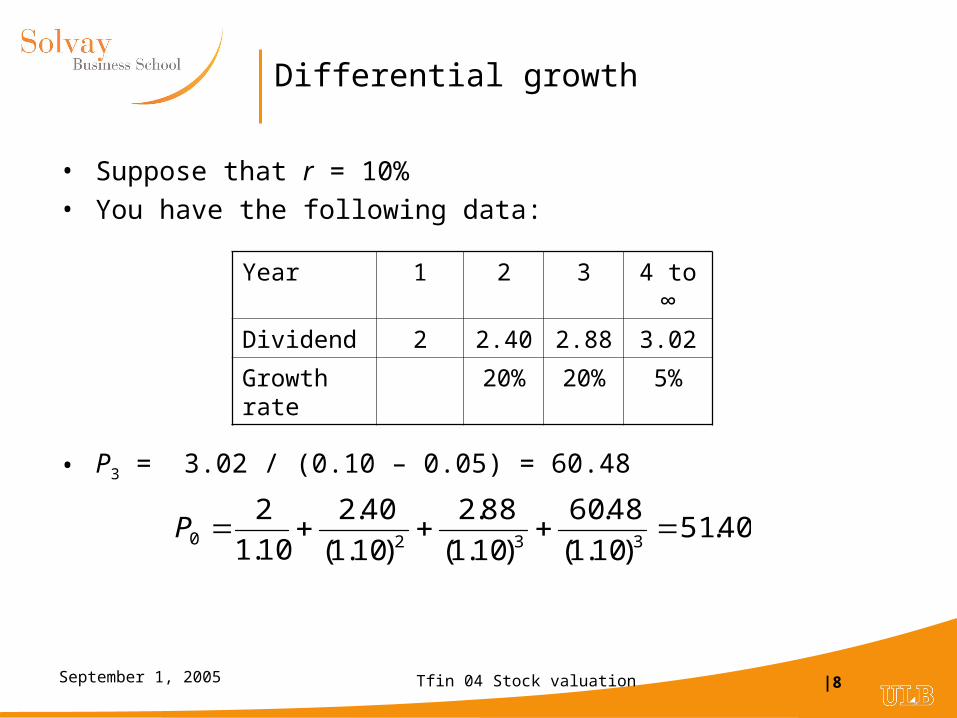
Differential growth
• Suppose that r = 10%
• You have the following data:
• P3 = 3.02 / (0.10 – 0.05) = 60.48
Year 1 2 3 4 to ∞
Dividend 2 2.40 2.88 3.02
Growth rate 20% 20% 5%
40.51)10.1(
48.60
)10.1(
88.2
)10.1(
40.2
10.1
23320 P
Tfin 04 Stock valuation |9September 1, 2005
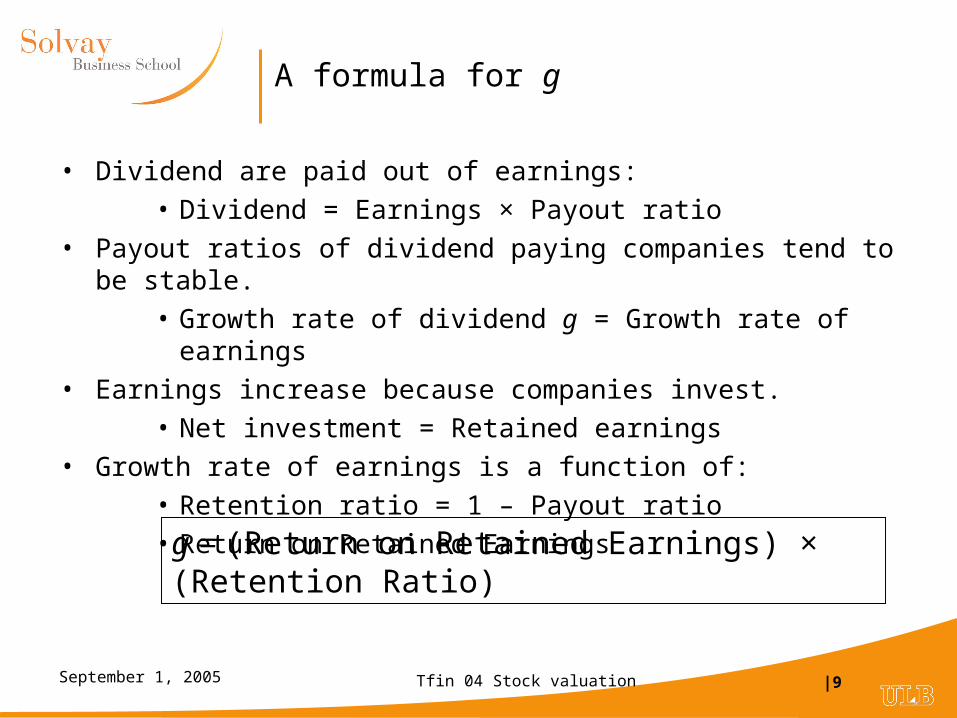
A formula for g
• Dividend are paid out of earnings:
• Dividend = Earnings × Payout ratio
• Payout ratios of dividend paying companies tend to be stable.
• Growth rate of dividend g = Growth rate of earnings
• Earnings increase because companies invest.
• Net investment = Retained earnings
• Growth rate of earnings is a function of:
• Retention ratio = 1 – Payout ratio
• Return on Retained Earnings
g = (Return on Retained Earnings) × (Retention Ratio)
Tfin 04 Stock valuation |10September 1, 2005
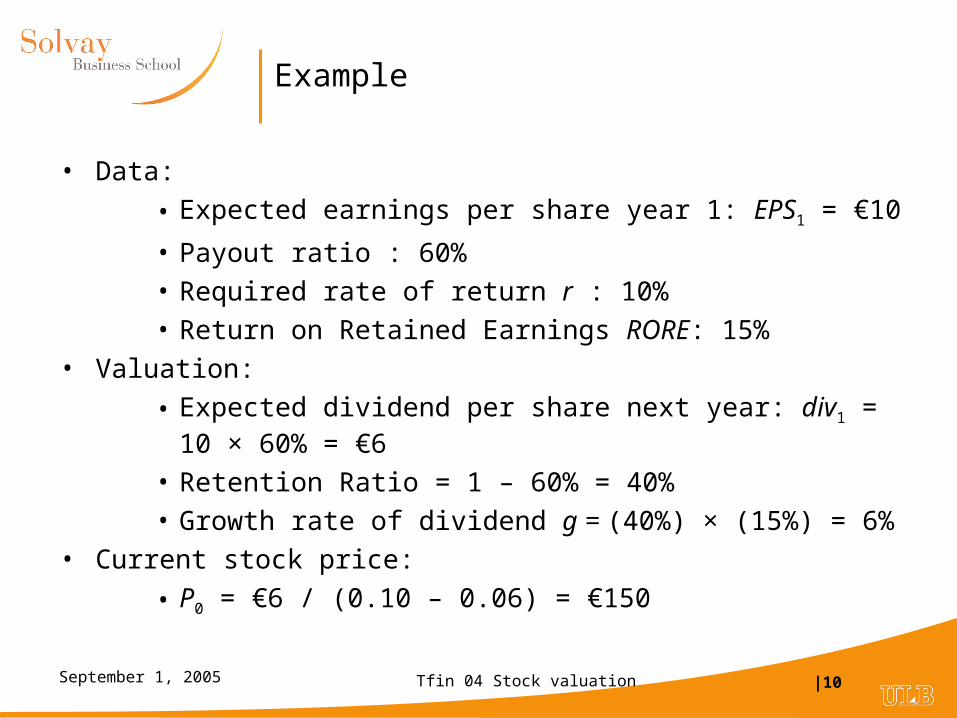
Example
• Data:
• Expected earnings per share year 1: EPS1 = €10
• Payout ratio : 60%
• Required rate of return r : 10%
• Return on Retained Earnings RORE: 15%
• Valuation:
• Expected dividend per share next year: div1 = 10 × 60% = €6
• Retention Ratio = 1 – 60% = 40%
• Growth rate of dividend g = (40%) × (15%) = 6%
• Current stock price:
• P0 = €6 / (0.10 – 0.06) = €150
Tfin 04 Stock valuation |11September 1, 2005
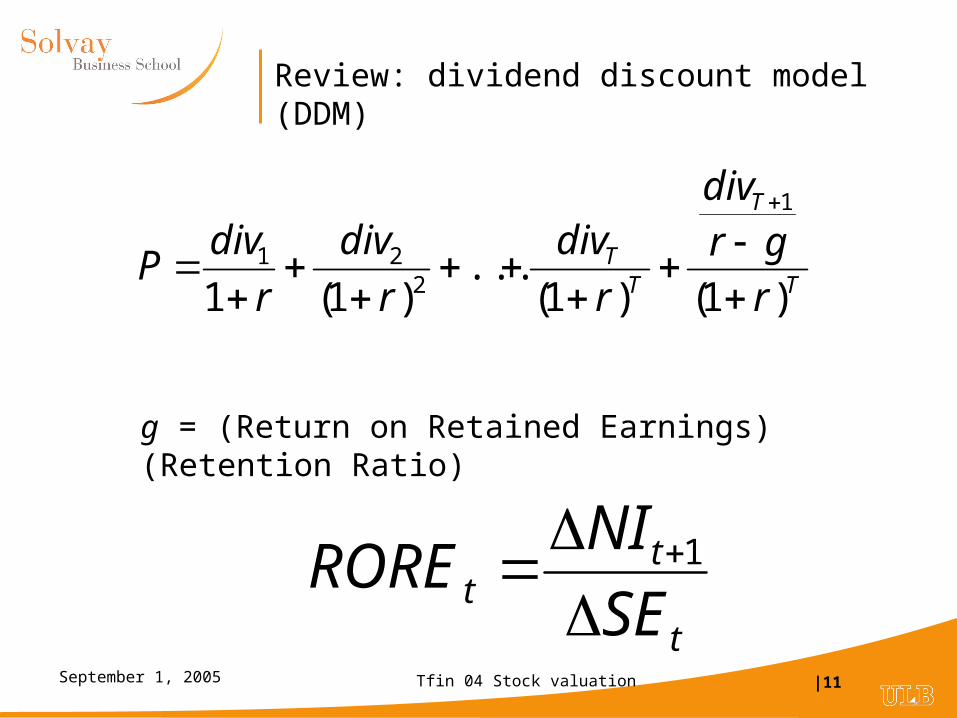
Review: dividend discount model (DDM)
T
T
TT
rgr
div
r
div
r
div
r
divP
)1()1(...
)1(1
1
221
g = (Return on Retained Earnings) (Retention Ratio)
t
tt SE
NIRORE
1
Tfin 04 Stock valuation |12September 1, 2005
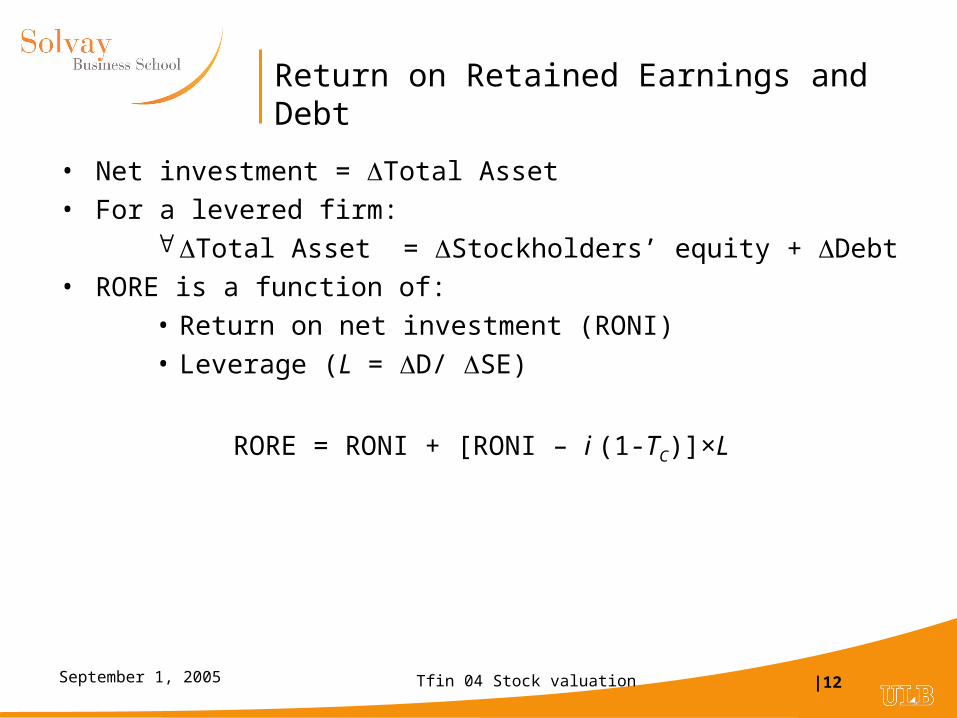
Return on Retained Earnings and Debt
• Net investment = Total Asset
• For a levered firm: Total Asset = Stockholders’ equity + Debt
• RORE is a function of:
• Return on net investment (RONI)
• Leverage (L = D/ SE)
RORE = RONI + [RONI – i (1-TC)]×L
Tfin 04 Stock valuation |13September 1, 2005
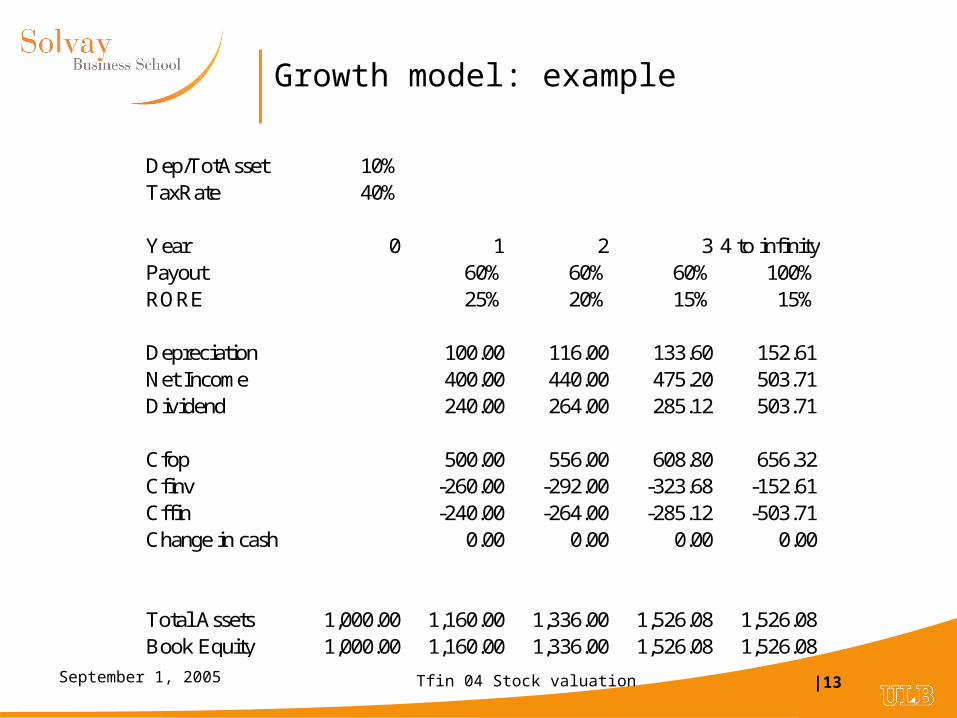
Growth model: example
Dep/TotAsset 10%TaxRate 40%
Year 0 1 2 3 4 to infinityPayout 60% 60% 60% 100%RORE 25% 20% 15% 15%
Depreciation 100.00 116.00 133.60 152.61Net Income 400.00 440.00 475.20 503.71Dividend 240.00 264.00 285.12 503.71
Cfop 500.00 556.00 608.80 656.32Cfinv -260.00 -292.00 -323.68 -152.61Cffin -240.00 -264.00 -285.12 -503.71Change in cash 0.00 0.00 0.00 0.00
Total Assets 1,000.00 1,160.00 1,336.00 1,526.08 1,526.08Book Equity 1,000.00 1,160.00 1,336.00 1,526.08 1,526.08
Tfin 04 Stock valuation |14September 1, 2005
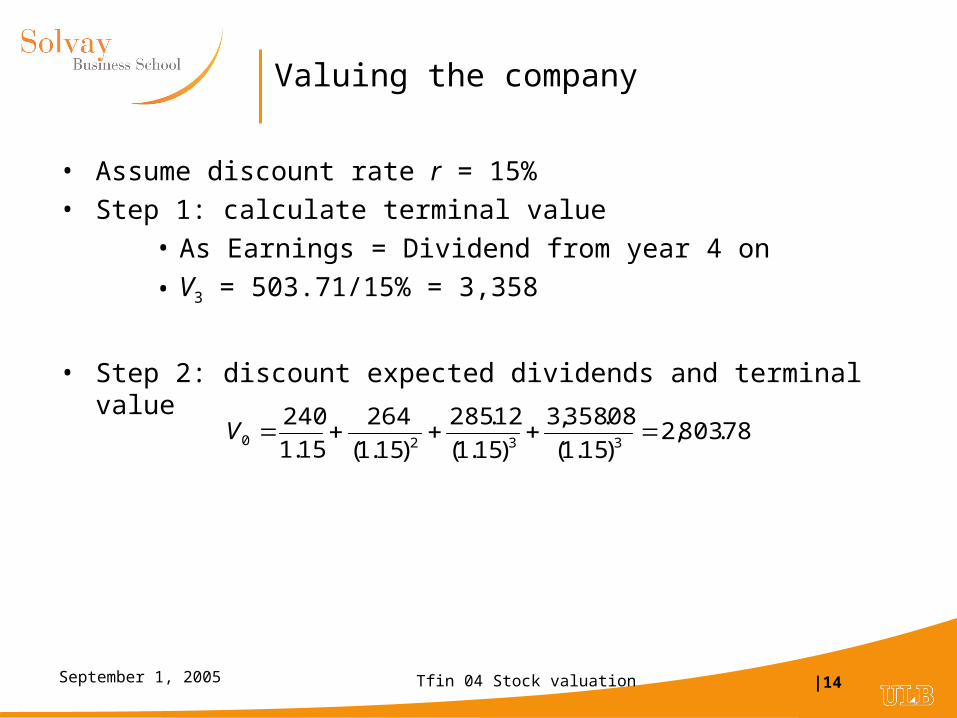
Valuing the company
• Assume discount rate r = 15%
• Step 1: calculate terminal value
• As Earnings = Dividend from year 4 on
• V3 = 503.71/15% = 3,358
• Step 2: discount expected dividends and terminal value
78.803,2)15.1(
08.358,3
)15.1(
12.285
)15.1(
264
15.1
2403320 V
Tfin 04 Stock valuation |15September 1, 2005
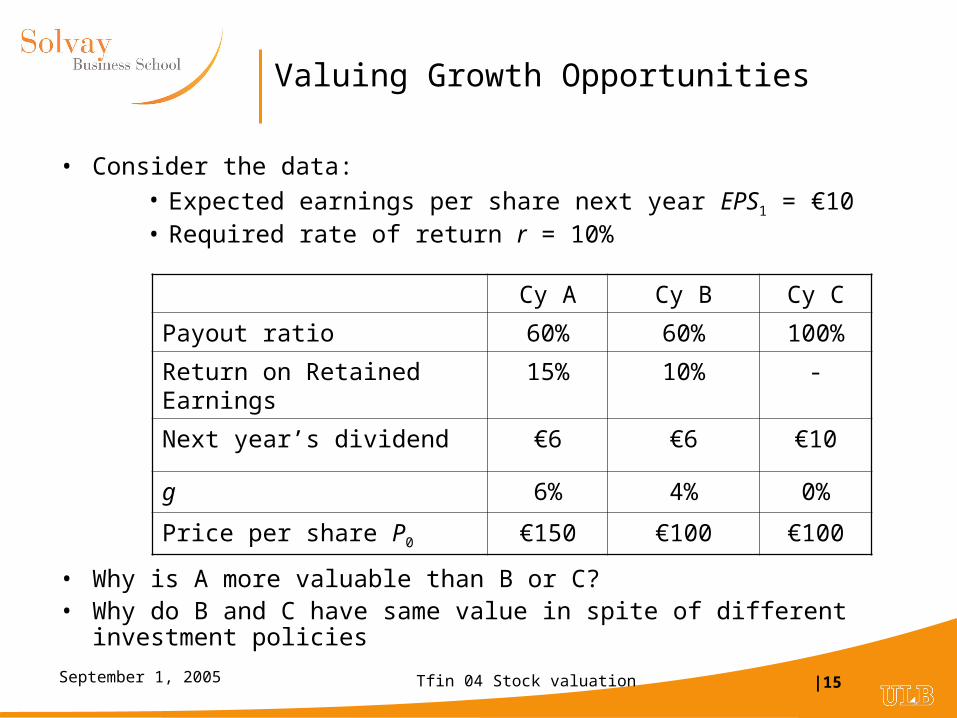
Valuing Growth Opportunities
• Consider the data:• Expected earnings per share next year EPS1 = €10• Required rate of return r = 10%
• Why is A more valuable than B or C?• Why do B and C have same value in spite of different investment policies
Cy A Cy B Cy C
Payout ratio 60% 60% 100%
Return on Retained Earnings 15% 10% -
Next year’s dividend €6 €6 €10
g 6% 4% 0%
Price per share P0 €150 €100 €100
Tfin 04 Stock valuation |16September 1, 2005
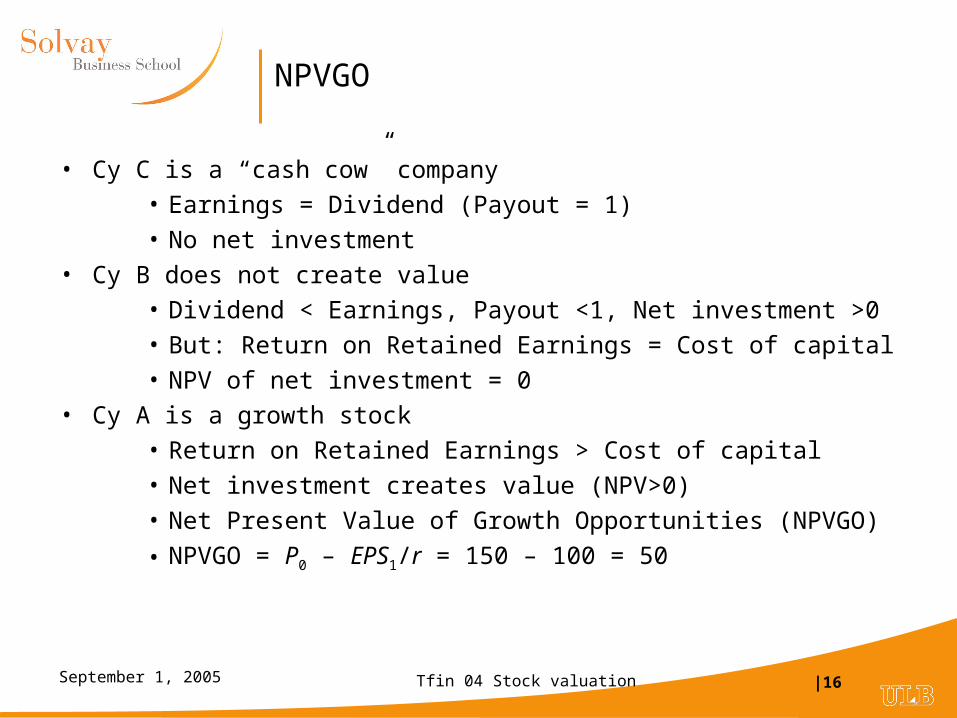
NPVGO
• Cy C is a “cash cow” company
• Earnings = Dividend (Payout = 1)
• No net investment
• Cy B does not create value
• Dividend < Earnings, Payout <1, Net investment >0
• But: Return on Retained Earnings = Cost of capital
• NPV of net investment = 0
• Cy A is a growth stock
• Return on Retained Earnings > Cost of capital
• Net investment creates value (NPV>0)
• Net Present Value of Growth Opportunities (NPVGO)
• NPVGO = P0 – EPS1/r = 150 – 100 = 50
Tfin 04 Stock valuation |17September 1, 2005
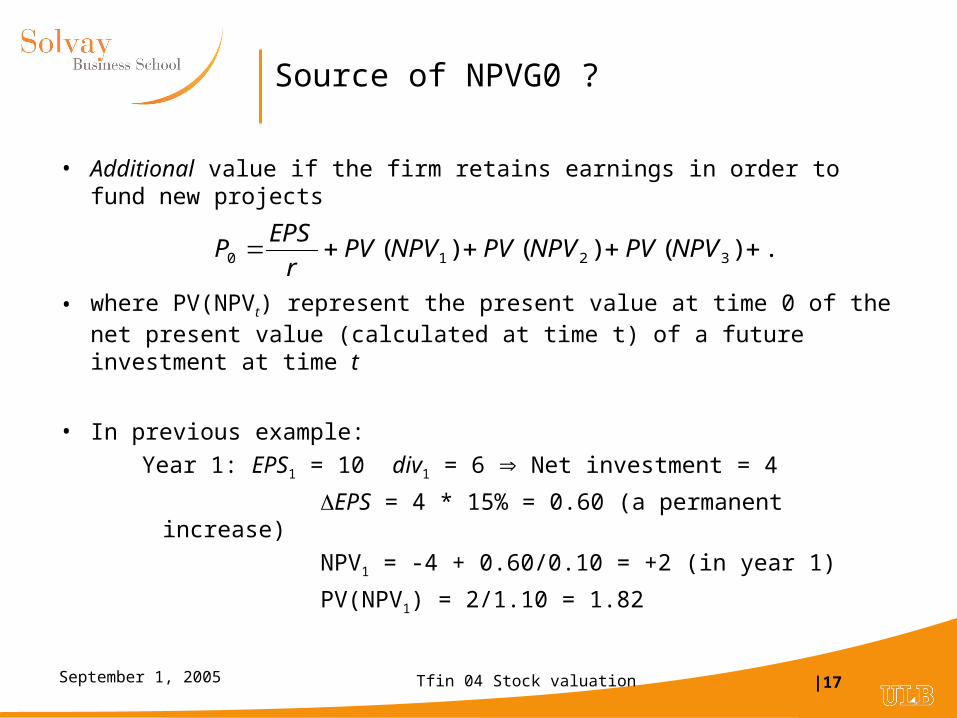
Source of NPVG0 ?
• Additional value if the firm retains earnings in order to fund new projects
• where PV(NPVt) represent the present value at time 0 of the net present value (calculated at time t) of a future investment at time t
• In previous example:
Year 1: EPS1 = 10 div1 = 6 Net investment = 4
EPS = 4 * 15% = 0.60 (a permanent increase)
NPV1 = -4 + 0.60/0.10 = +2 (in year 1)
PV(NPV1) = 2/1.10 = 1.82
...)()()( 3210 NPVPVNPVPVNPVPVr
EPSP
Tfin 04 Stock valuation |18September 1, 2005
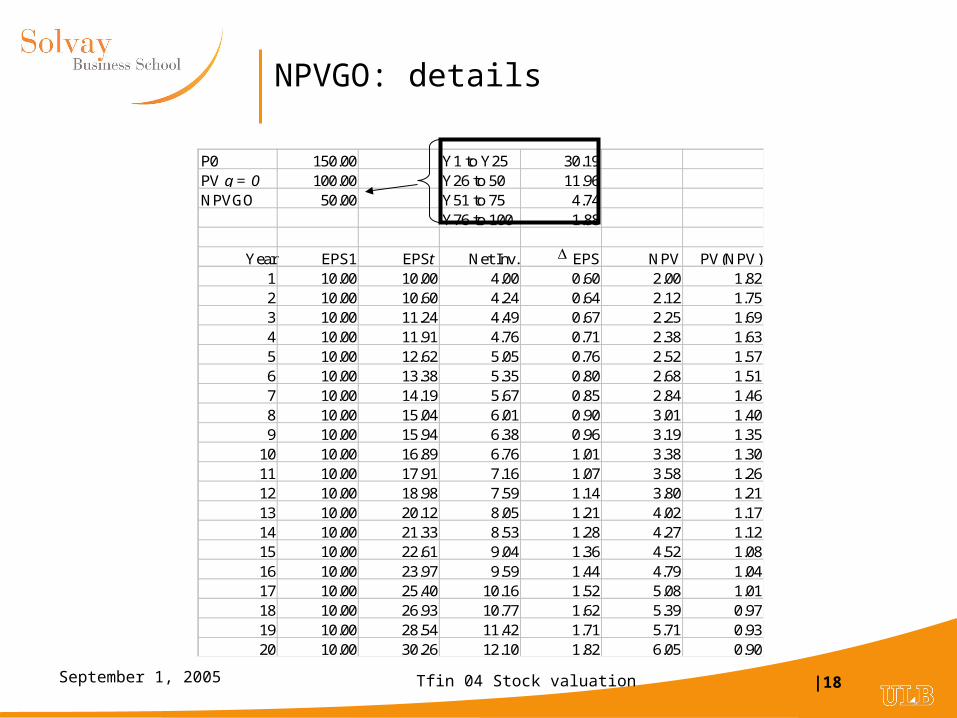
NPVGO: details
P0 150.00 Y1 to Y25 30.19PV g = 0 100.00 Y26 to 50 11.96NPVGO 50.00 Y51 to 75 4.74
Y76 to 100 1.88
Year EPS1 EPSt Net Inv. EPS NPV PV(NPV)1 10.00 10.00 4.00 0.60 2.00 1.822 10.00 10.60 4.24 0.64 2.12 1.753 10.00 11.24 4.49 0.67 2.25 1.694 10.00 11.91 4.76 0.71 2.38 1.635 10.00 12.62 5.05 0.76 2.52 1.576 10.00 13.38 5.35 0.80 2.68 1.517 10.00 14.19 5.67 0.85 2.84 1.468 10.00 15.04 6.01 0.90 3.01 1.409 10.00 15.94 6.38 0.96 3.19 1.35
10 10.00 16.89 6.76 1.01 3.38 1.3011 10.00 17.91 7.16 1.07 3.58 1.2612 10.00 18.98 7.59 1.14 3.80 1.2113 10.00 20.12 8.05 1.21 4.02 1.1714 10.00 21.33 8.53 1.28 4.27 1.1215 10.00 22.61 9.04 1.36 4.52 1.0816 10.00 23.97 9.59 1.44 4.79 1.0417 10.00 25.40 10.16 1.52 5.08 1.0118 10.00 26.93 10.77 1.62 5.39 0.9719 10.00 28.54 11.42 1.71 5.71 0.9320 10.00 30.26 12.10 1.82 6.05 0.90
Tfin 04 Stock valuation |19September 1, 2005
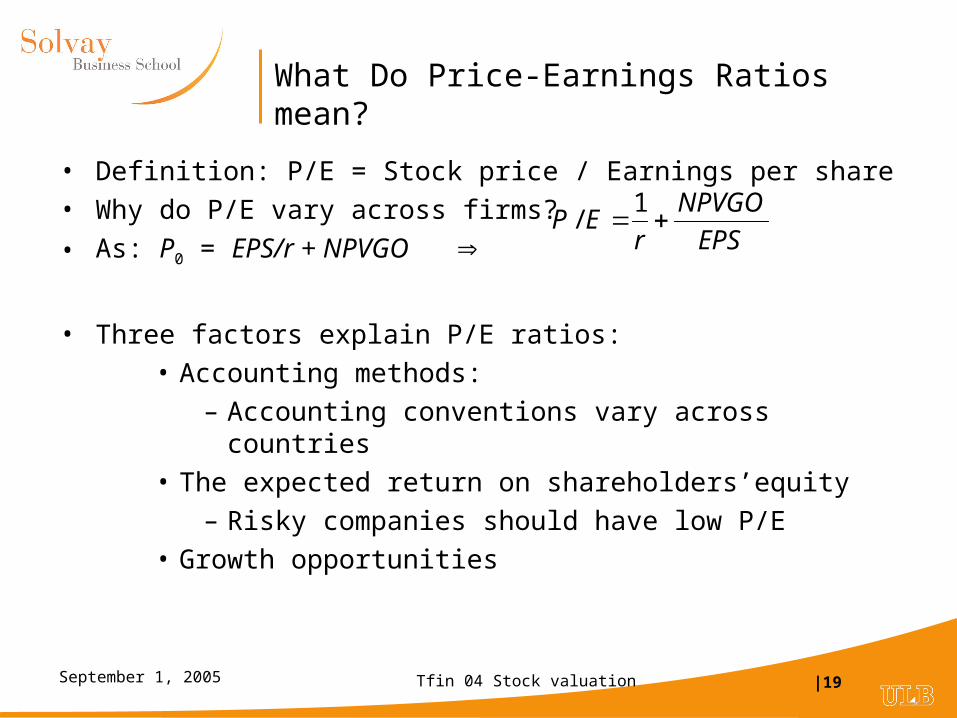
What Do Price-Earnings Ratios mean?
• Definition: P/E = Stock price / Earnings per share
• Why do P/E vary across firms?
• As: P0 = EPS/r + NPVGO
• Three factors explain P/E ratios:
• Accounting methods:
– Accounting conventions vary across countries
• The expected return on shareholders’equity
– Risky companies should have low P/E
• Growth opportunities
EPS
NPVGO
rEP
1/
Tfin 04 Stock valuation |20September 1, 2005
Beyond DDM: The Free Cash Flow Model
• Consider an all equity firm.
• If the company:
– Does not use external financing (not stock issue, # shares constant)
– Does not accumulate cash (no change in cash)
• Then, from the cash flow statement:
• Free cash flow = Dividend
• CF from operation – Investment = Dividend
• Company financially constrained by CF from operation
Tfin 04 Stock valuation |21September 1, 2005
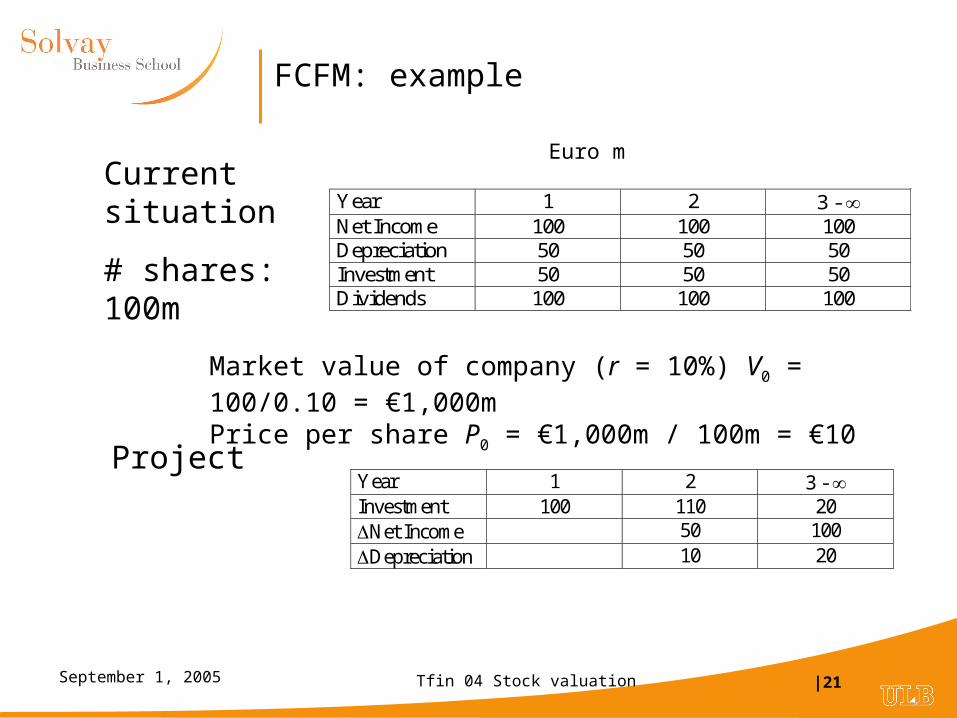
FCFM: example
Year 1 2 3 - Net Income 100 100 100 Depreciation 50 50 50 Investment 50 50 50 Dividends 100 100 100
Current situation
# shares: 100m
Year 1 2 3 - Investment 100 110 20 Net Income 50 100 Depreciation 10 20
Project
Euro m
Market value of company (r = 10%) V0 = 100/0.10 = €1,000mPrice per share P0 = €1,000m / 100m = €10
Tfin 04 Stock valuation |22September 1, 2005
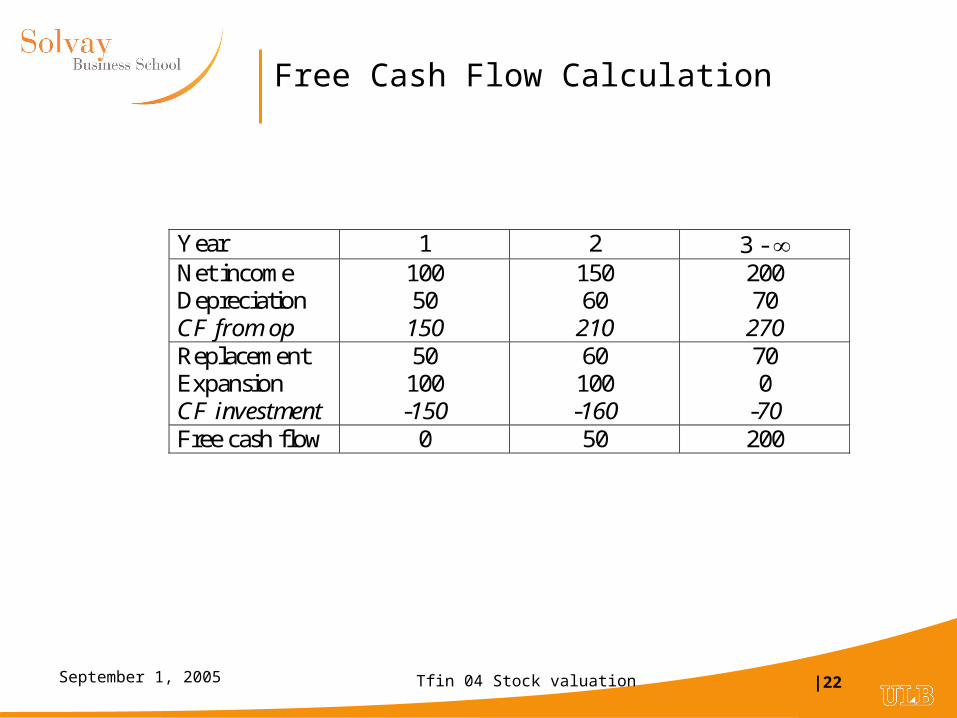
Free Cash Flow Calculation
Year 1 2 3 - Net income Depreciation CF from op
100 50
150
150 60
210
200 70
270 Replacement Expansion CF investment
50 100 -150
60 100 -160
70 0
-70 Free cash flow 0 50 200
Tfin 04 Stock valuation |23September 1, 2005
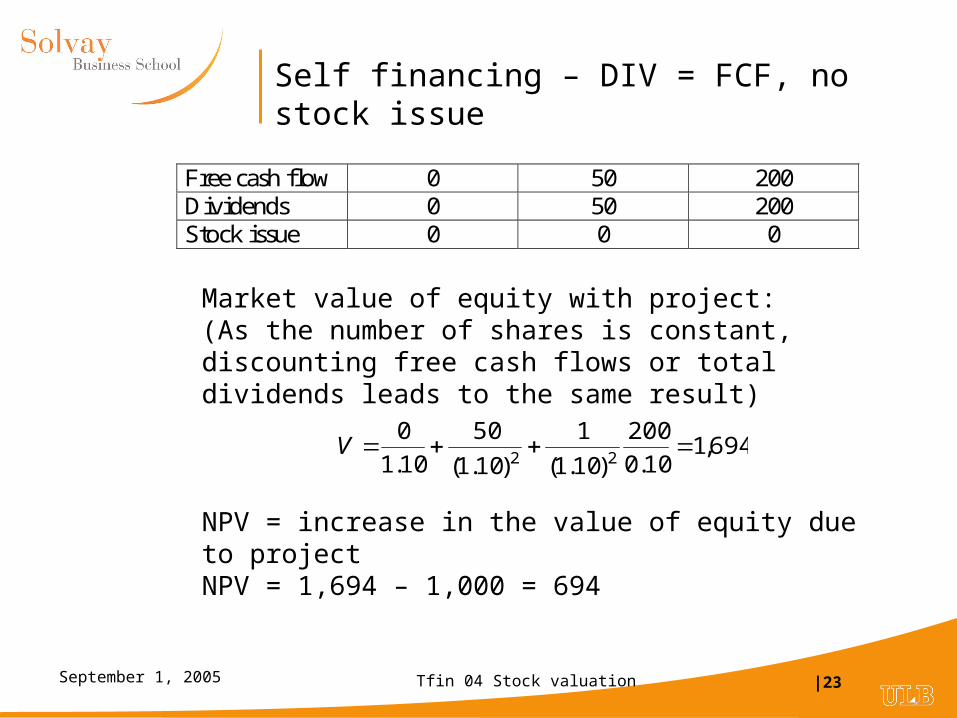
Self financing – DIV = FCF, no stock issue
Free cash flow 0 50 200 Dividends 0 50 200 Stock issue 0 0 0
Market value of equity with project:(As the number of shares is constant, discounting free cash flows or total dividends leads to the same result)
NPV = increase in the value of equity due to projectNPV = 1,694 – 1,000 = 694
694,110.0
200
)10.1(
1
)10.1(
50
10.1
022
V
Tfin 04 Stock valuation |24September 1, 2005
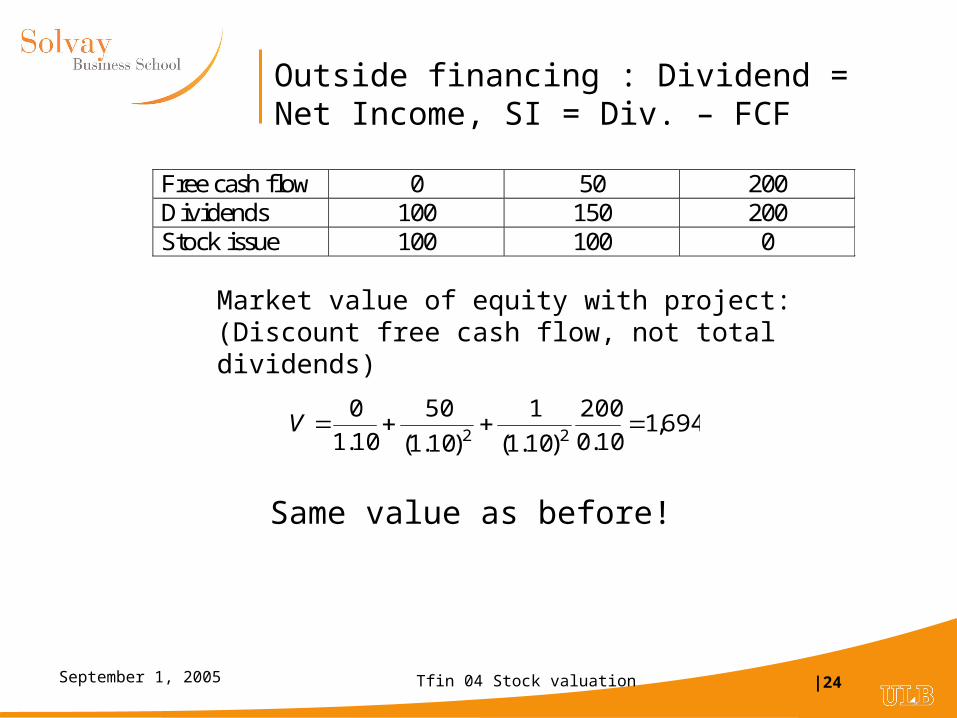
Outside financing : Dividend = Net Income, SI = Div. – FCF
Free cash flow 0 50 200 Dividends 100 150 200 Stock issue 100 100 0
Market value of equity with project:(Discount free cash flow, not total dividends)
694,110.0
200
)10.1(
1
)10.1(
50
10.1
022
V
Same value as before!
Tfin 04 Stock valuation |25September 1, 2005
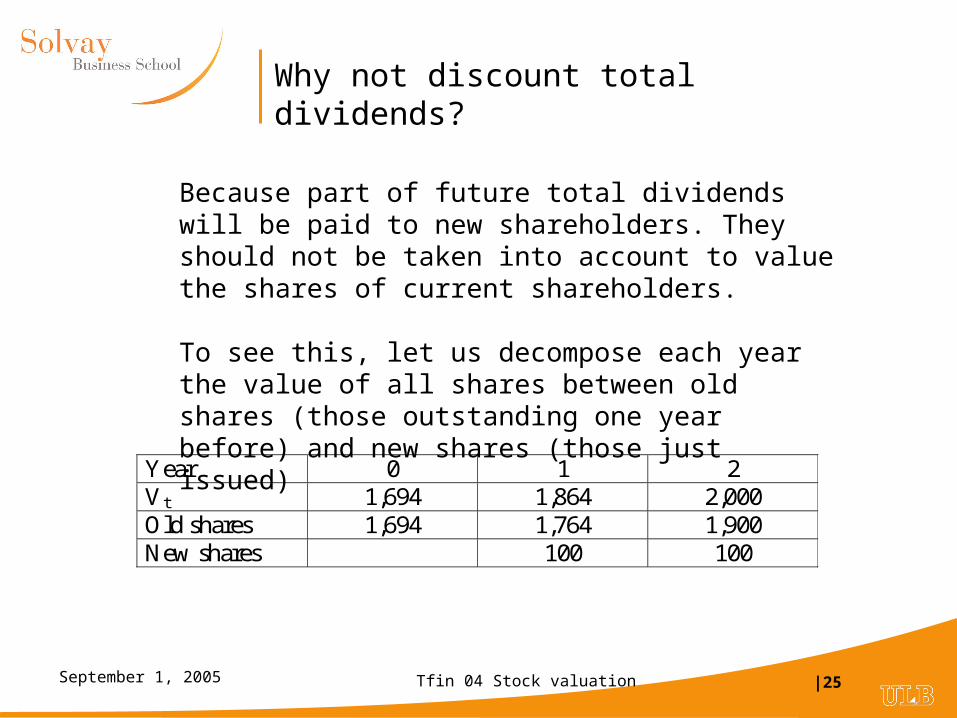
Why not discount total dividends?
Year 0 1 2 Vt 1,694 1,864 2,000 Old shares 1,694 1,764 1,900 New shares 100 100
Because part of future total dividends will be paid to new shareholders. They should not be taken into account to value the shares of current shareholders.
To see this, let us decompose each year the value of all shares between old shares (those outstanding one year before) and new shares (those just issued)
Tfin 04 Stock valuation |26September 1, 2005
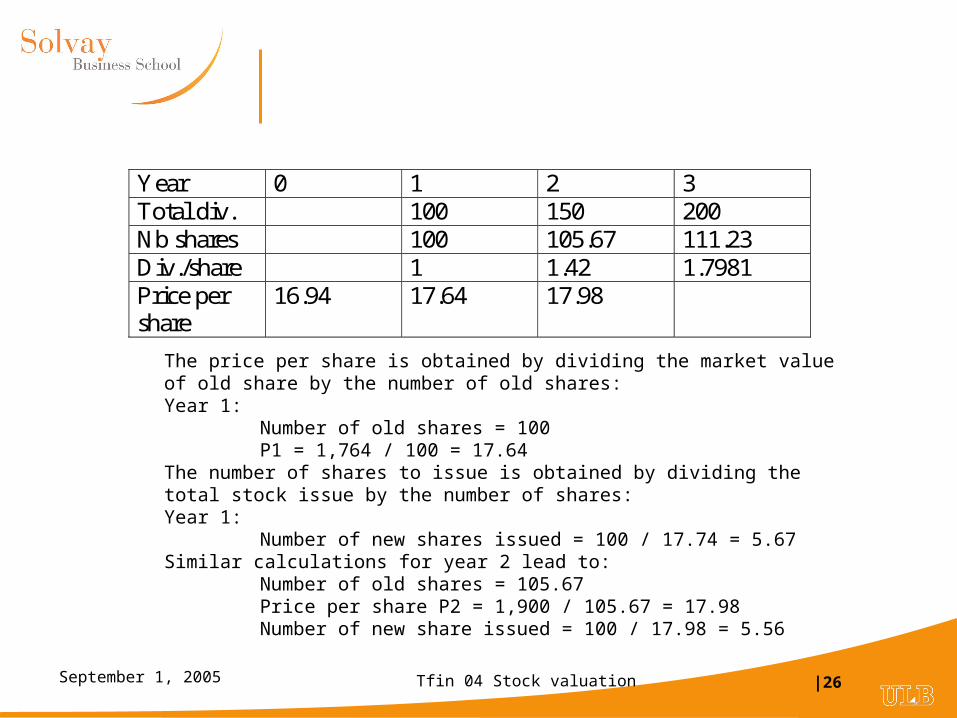
Year 0 1 2 3 Total div. 100 150 200 Nb shares 100 105.67 111.23 Div./share 1 1.42 1.7981 Price per share
16.94 17.64 17.98
The price per share is obtained by dividing the market value of old share by the number of old shares:Year 1:
Number of old shares = 100P1 = 1,764 / 100 = 17.64
The number of shares to issue is obtained by dividing the total stock issue by the number of shares:Year 1:
Number of new shares issued = 100 / 17.74 = 5.67Similar calculations for year 2 lead to:
Number of old shares = 105.67Price per share P2 = 1,900 / 105.67 = 17.98Number of new share issued = 100 / 17.98 = 5.56
Tfin 04 Stock valuation |27September 1, 2005
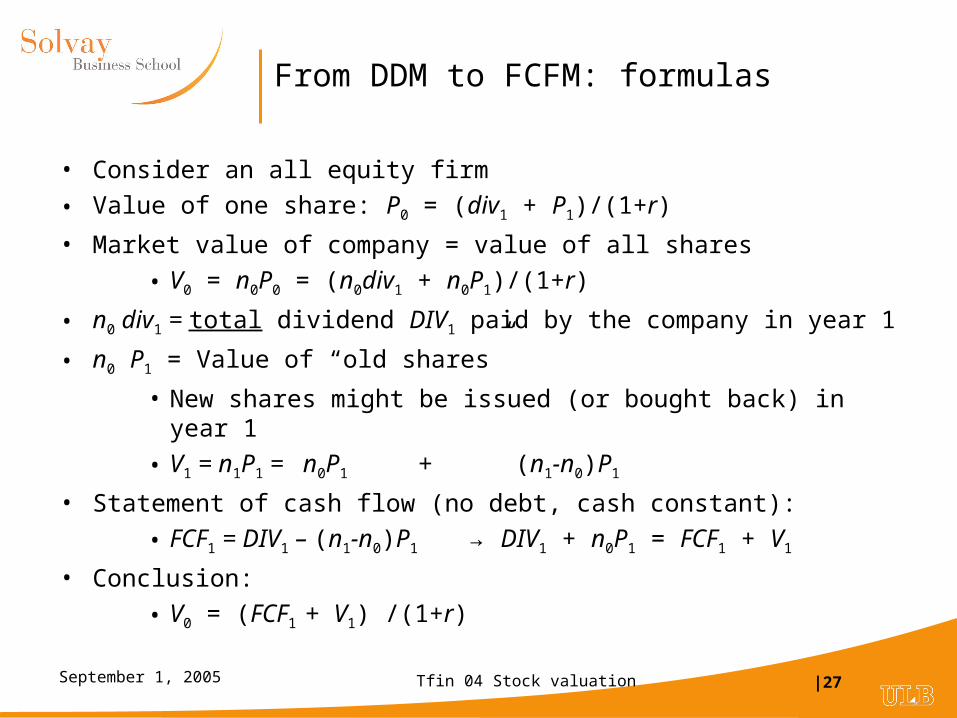
From DDM to FCFM: formulas
• Consider an all equity firm
• Value of one share: P0 = (div1 + P1)/(1+r)
• Market value of company = value of all shares
• V0 = n0P0 = (n0div1 + n0P1)/(1+r)
• n0 div1 = total dividend DIV1 paid by the company in year 1
• n0 P1 = Value of “old shares”
• New shares might be issued (or bought back) in year 1
• V1 = n1P1 = n0P1 + (n1-n0)P1
• Statement of cash flow (no debt, cash constant):
• FCF1 = DIV1 – (n1-n0)P1 → DIV1 + n0P1 = FCF1 + V1
• Conclusion:
• V0 = (FCF1 + V1) /(1+r)